the Creative Commons Attribution 4.0 License.
the Creative Commons Attribution 4.0 License.
 | 28 Jun 2018
Long-term trends in total inorganic nitrogen and sulfur deposition in the US from 1990 to 2010
Jesse O. Bash
Christian Hogrefe
Jia Xing
Shawn J. Roselle
Excess deposition (including both wet and dry deposition) of nitrogen and sulfur is detrimental to ecosystems. Recent studies have investigated the spatial patterns and temporal trends of nitrogen and sulfur wet deposition, but few studies have focused on dry deposition due to the scarcity of dry deposition measurements. Here, we use long-term model simulations from the coupled Weather Research and Forecasting and the Community Multiscale Air Quality (WRF-CMAQ) model covering the period from 1990 to 2010 to study changes in spatial distribution as well as temporal trends in total (TDEP), wet (WDEP), and dry deposition (DDEP) of total inorganic nitrogen (TIN) and sulfur (TS) in the United States (US). We first evaluate the model's performance in simulating WDEP over the US by comparing the model results with observational data from the US National Atmospheric Deposition Program. The coupled model generally underestimates the WDEP of both TIN (including both the oxidized nitrogen deposition, TNO3, and the reduced nitrogen deposition, NHx) and TS, with better performance in the eastern US than the western US. The underestimation of the wet deposition by the model is mainly caused by the coarse model grid resolution, missing lightning NOx emissions, and the poor temporal and spatial representation of NH3 emissions. TDEP of both TIN and TS shows significant decreases over the US, especially in the east, due to the large emission reductions that occurred in that region. The decreasing trends of TIN TDEP are caused by decreases in TNO3, and the increasing trends of TIN deposition over the Great Plains and Tropical Wet Forests (Southern Florida Coastal Plain) regions are caused by increases in NH3 emissions, although it should be noted that these increasing trends are not significant. TIN WDEP shows decreasing trends throughout the US, except for the Marine West Coast Forest region. TIN DDEP shows significant decreasing trends in the Eastern Temperate Forests, Northern Forests, Mediterranean California, and Marine West Coast Forest and significant increasing trends in the Tropical Wet Forests, Great Plains and Southern Semi-arid Highlands. For the other three regions (North American Deserts, Temperate Sierras, and Northwestern Forested Mountains), the decreasing or increasing trends are not significant. Both the WDEP and DDEP of TS have decreases across the US, with a larger decreasing trend in the DDEP than that in the WDEP. Across the US during the 1990–2010 period, DDEP of TIN accounts for 58–65 % of TDEP of TIN. TDEP of TIN over the US is dominated by deposition of TNO3 during the first decade, which then shifts to reduced nitrogen (NHx) dominance after 2003, resulting from a combination of NOx emission reductions and NH3 emission increases. The sulfur DDEP is usually higher than the sulfur WDEP until recent years, as the sulfur DDEP has a larger decreasing trend than WDEP.
- Article
(9042 KB) -
Supplement
(1710 KB) - BibTeX
- EndNote


Increased nitrogen and sulfur deposition is detrimental to ecosystems, since it leads to decreased biological diversity (Clark and Tilman, 2008; Clark et al., 2013; Stevens et al., 2004), increased terrestrial and aquatic eutrophication (Bouwman et al., 2002; Bowman et al., 2008; Fisher et al., 2011), and acidification (Greaver et al., 2012; Savva and Berninger, 2010). The primary sources for nitrogen deposition are nitrogen oxides (NOx ≡ NO + NO2) and ammonia (NH3), both of which have anthropogenic and natural sources. The major source for NOx is from the combustion of fossil fuels in industry and energy use (Elliott et al., 2007; Lamarque et al., 2010). For NH3, 80 % of the total emissions are from livestock manure management and chemical fertilizer in 2005 as estimated from the US National Emission Inventory (Reis et al., 2009), which are not regulated under current legislation and underwent significant increases over the past decades (Xing et al., 2013; Warner et al., 2017). Another possible source of NH3 emissions are vehicles, which may be twice as high as the emission estimates in the current National Emissions Inventory (K. Sun et al., 2016). The primary emission source for sulfur deposition is sulfur dioxide (SO2), which also mainly originates from fossil-fuel combustion (Smith et al., 2011).
The ultimate fate for NOx, NH3, and SO2 is removal by wet scavenging and uptake by terrestrial and aquatic ecosystems (Greaver et al., 2012). Wet deposition (WDEP), in the form of rain or snow, is relatively easy to measure. Several observation networks were established to provide reliable long-term records of WDEP, such as the European Monitoring and Evaluation Programme (EMEP) in Europe, the National Acid Deposition Monitoring Network (NADMN) in China, the Canadian Air and Precipitation Monitoring Network (CAPMoN) in Canada, and the National Atmospheric Deposition Program's National Trends Network (NADP/NTN) in the US (Xu et al., 2015). These data have been extensively used to quantity the sources, patterns, and temporal trends of WDEP of major species worldwide (e.g., EEA, 2011; Jia et al., 2014; Cheng and Zhang, 2017; Lajtha and Jones, 2013; Du et al., 2014; Sickles II and Shadwick, 2015, 2007a, b). However, the majority of these studies discussed WDEP based on the measurements only and neglected the discussion of the spatial distribution and trends of dry deposition (DDEP), as no direct DDEP measurements are available at these networks. The calculated values at some sites, such as for the Clean Air Status and Trends Network (CASTNET) and CAPMoN, cannot be easily spatially interpolated due to limited availability of sufficient number of sites in a region as well as the representativeness of the derived fields due to assumptions in the spatial interpolation method (Schwede and Lear, 2014). DDEP can contribute up to two-thirds of total deposition (TDEP) of nitrogen, and neglecting it can lead to substantial underestimation of the total flux (Flechard et al., 2011; Vet et al., 2014). Also, accurate estimates of TDEP are usually required to assess the impacts of excess nitrogen and sulfur deposition on ecosystem health, such as critical load exceedances and species loss (Simkin et al., 2016).
To address these challenges, global and regional chemical transport models (CTMs) have been extensively used in recent years to quantify the sources and distribution of both WDEP and DDEP (Mathur and Dennis, 2003; Galloway et al., 2008; Paulot et al., 2013; Sanderson et al., 2008; Zhang et al., 2012; Y. Zhao et al., 2009; Y. H. Zhao et al., 2015, 2017), to study the projected deposition changes in the future (Dentener et al., 2006; Larmarque et al., 2013; Ellis et al., 2013; Kanakidou et al., 2016; J. Sun et al., 2017), and also their effect on ecosystems (Simkin et al., 2016). CTMs can link the sources to the deposition through atmospheric chemistry and transport processes and can provide insights on the trends of TDEP and its components. In this study we quantify the long-term geographical patterns and temporal trends of TDEP, WDEP, and DDEP of total inorganic nitrogen (TIN) and sulfur over the continental US (CONUS) based on a 21-year model simulation from 1990 to 2010 at 36 km × 36 km. The paper is organized as follows. Section 2 describes the model configuration and observation datasets as used for model evaluation. The model evaluation results and the patterns and trends of inorganic nitrogen and sulfur deposition are presented in Sect. 3, followed by the conclusions in Sect. 4.
2.1 Model setup
The long-term simulations were previously performed using the coupled Weather Research and Forecasting and the Community Multiscale Air Quality (WRF-CMAQ model; Wong et al., 2012) with WRFv3.4 coupled with CMAQv5.02 driven by internally consistent US emission inventories (Xing et al., 2013) covering the CONUS domain discretized with a grid of 36 km horizontal resolution. Spatial and time-varying chemical lateral boundary conditions were provided by the hemispheric WRF-CMAQ (Mathur et al., 2017) running over the same period (Xing et al., 2015a, b). Interested readers are referred to Gan et al. (2015, 2016) for a detailed description of the settings of the CMAQ model and physical configurations of the WRF model (Table S1 in the Supplement). The performance of the coupled WRF-CMAQ model for major trace gases, aerosol species, and meteorological variables such as ozone (O3), fine particular matter (PM2.5), and aerosol optical depth at both the hemispheric and regional scale has been extensively evaluated in previous studies (Xing et al., 2015a, b; Mathur et al., 2017; Gan et al., 2015, 2016; Astitha et al., 2017; Porter et al., 2017) and has shown skill in simulating the magnitudes and long-term trends of these variables. The dry deposition of each species in the CMAQ model is calculated by multiplying the concentration in the lowest model layer by the dry deposition velocity (Vd). The Vd is calculated as the reciprocal of the sum of the atmospheric aerodynamic resistance (Ra, the resistance to transport through the atmosphere above the surface receptors), quasi-laminar boundary layer (Rb, the resistance to transport across the thin layer of air that is in contact with the surface and varies with the diffusion of the pollutant transported), and surface resistances (Rs, the resistance to the uptake of the pollutant by the surface receptor, typically vegetation or soil).
2.2 Deposition observations in the US
A previous study using the offline CMAQ model has demonstrated moderate skill simulating WDEP from 2002 to 2006 (Appel et al., 2011). Here we evaluate the coupled WRF-CMAQ model's ability to simulate WDEP of nitrate (TNO3), ammonium (NHx), and sulfate (TS) during 1990–2010 over the US, including both the interannual variability and long-term trends. This is accomplished by comparing the model results with observations from the US NADP (http://nadp.sws.uiuc.edu/ntn/, last access: 21 June 2018), which measures total weekly wet deposition of these species. The deposition is measured by wet-only samples, which are triggered by precipitation. The deposition of sulfate and nitrate are analyzed by ion chromatography and ammonium by flow injection analysis (http://nadp.slh.wisc.edu/educ/sample.aspx, last access: 4 May 2018). We first pair the wet deposition data between the observation and the model results in time and space, and then extract the annual deposition for the sites matching our criteria (at least 18 available years with 75 % annual coverage for each year). Model data during periods of missing observations are not considered in either the statistical evaluation or the trends analysis. By applying the criteria, we use information at 170 of 359 sites, with 141 sites in the eastern US (east of 110∘ W longitude) and 29 sites in the western US (west of 110∘ W longitude). The detailed site information and the number of years of observational data used for the model evaluation can be found in Table S2 and Fig. S1 in the Supplement. In pairing the observed and modeled TNO3 WDEP values (which combines WDEP of and HNO3), we multiply the model estimated HNO3 WDEP by 0.984 to account for the transformation of HNO3 to in solution in the measurements. In pairing the observed and modeled NHx WDEP values (which combines WDEP of and NH3), we multiply the model estimated NH3 WDEP by 1.06 to account for the transformation of NH3 to in the rainwater in the measurements. In pairing the observed and modeled TS WDEP values (which combines WDEP of and SO2), we multiply the model estimated SO2 WDEP by 1.50 to account for the fact that SO2 will be fully oxidized into during sampling (Appel et al., 2011).
For the model evaluation, we examine the correlation coefficients (R), mean bias (MB), and the normalized mean bias (NMB):
When discussing the model evaluation and deposition trends, we divide the US into 10 ecological regions, following the North America Level I ecoregion definition (https://www.epa.gov/eco-research/ecoregions-north-america, last access: 21 June 2018), including Northern Forests, Northwestern Forested Mountains, Marine West Coast Forest, Eastern Temperate Forests, Great Plains, North American Deserts, Mediterranean California, Southern Semi-arid Highlands, Temperate Sierras, and Tropical Wet Forests (Fig. S1 in the Supplement). For the trend analysis, we focus on the linear trends (Colette et al., 2011; Xing et al., 2015a), in which the linear least square fit method is employed, and significance of trends is examined with a Student t test at the 95 % confidence level (p = 0.05).
Errors in the simulated meteorology and precipitation in particular, can lead to errors in estimating WDEP in the CMAQ model. We follow the previous approach of Appel et al. (2011) to account for biases in modeled precipitation by adjusting the modeled WDEP as
In Eq. (2), WDmod represents the WDEP from the model, Precipobs represents annual or monthly accumulated observed precipitation, and Precipmod represents the corresponding annual or monthly accumulated precipitation from the model.
The US CASTNET provides long-term observations of atmospheric concentrations as well as the dry deposition (https://www.epa.gov/castnet, last access: 7 May 2018). However, the dry deposition values reported are not directly measured, but estimated using the inferential method, pairing the measured air pollutant concentration with a modeled deposition velocity from the MLM model (Meyers et al., 1998). So rather than comparing dry deposition estimates from two models, we choose to evaluate the model's performance in simulating the ambient air concentrations (sulfur dioxide (SO2), sulfate (), total nitrate (TNO3 = + HNO3), and ammonium (NH4)). We apply the same criteria in selecting valid observation sites as the NADP/NTN. By doing this, we have chosen 39 valid sites out of total 145 sites. The detailed site information and the number of years of observational data used for the model evaluation can be found in Table S3 in the Supplement.
3.1 Model evaluation for WDEP and DDEP
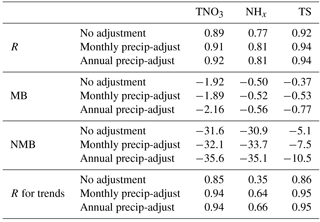
The coupled WRF-CMAQ model generally overestimates the precipitation throughout US (Fig. 2d, Fig. S2 in the Supplement), consistent with previous findings (Ran et al., 2015). After performing the annual precipitation adjustment for model simulated WDEP, we see that the correlation coefficients (R) are slightly improved relative to using the unadjusted WDEP values (Table 1), increasing from 0.89 to 0.92 for TNO3, from 0.77 to 0.81 for NHx, and from 0.92 to 0.94 for TS (Fig. S3 in the Supplement). There are no significant changes for R when we use the monthly precipitation adjustment compared with the annual precipitation adjustment (Table 1). The model generally underestimates WDEP for both the eastern and western US, except for TS where the model tends to overestimate WDEP in the western US (Figs. 1 and 2). After performing the precipitation adjustment, the NMB values increase for all three species (Table 1). The model exhibited better performance for WDEP in the east than the west, considering both the R and the NMB, largely because of the complex terrain in the western US (Appel et al., 2011).
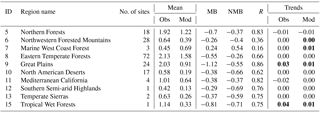
Table 1Correlation coefficient (R), mean bias (MB, kg ha−1), and normalized mean bias (NMB, %) for the sum of the annual accumulated wet deposition (WDEP) between the model and NADP sites from 1990 to 2010, including both the model values with and without applying monthly and annual precipitation adjustment (precip-adjust). The R for trends are the correlation coefficient for the 21-year changes of the wet deposition (TNO3, NHx, and TS) between the model and the observations.
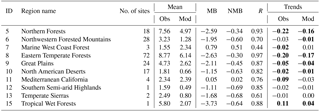
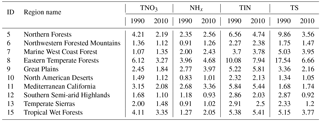
The 21-year average TNO3 WDEP is highest in the Eastern Temperate Forest region and lowest in the Southern Semi-arid Highlands, as seen from both the observations and model results (Table 2). The model generally underestimates the TNO3 deposition for all the regions with MB values ranging from −1.11 kg ha−1 in the Southern Semi-arid Highlands to −3.73 kg ha−1 in the Tropical Wet Forests, except for the Marine West Coast Forest region where the model overestimates the TNO3 WDEP, with MB values of 0.79 kg ha−1. The correlation coefficients between the model and observations are generally much higher in the eastern US (R larger than 0.80) than in the western US (R less than 0.70). The 21-year average NHx WDEP is also highest in the Eastern Temperate Forest region and lowest in the Southern Semi-arid Highlands (Table 3). The model generally underestimates the NHx WDEP, with MB values ranging from −0.26 kg ha−1 yr−1 in the Northwestern Forested Mountains to −0.81 kg ha−1 in Tropical Wet Forests, and overestimates in the Marine West Coast Forest, with MB of 0.24 kg ha−1. The correlation coefficients between model and observations for NHx WDEP share similar spatial patterns with TNO3 WDEP but have lower R values. The 21-year average TS deposition is highest in the Eastern Temperate Forests region and lowest in the North American Desserts. Similar to TNO3 and NHx, the model underestimates the TS WDEP over most of the regions, but overestimates observed values in the Marine West Coast Forest and Mediterranean California. The R between the model and the observations is generally larger than 0.9 in the eastern US but ranges from 0.46 to 0.79 in the western US.
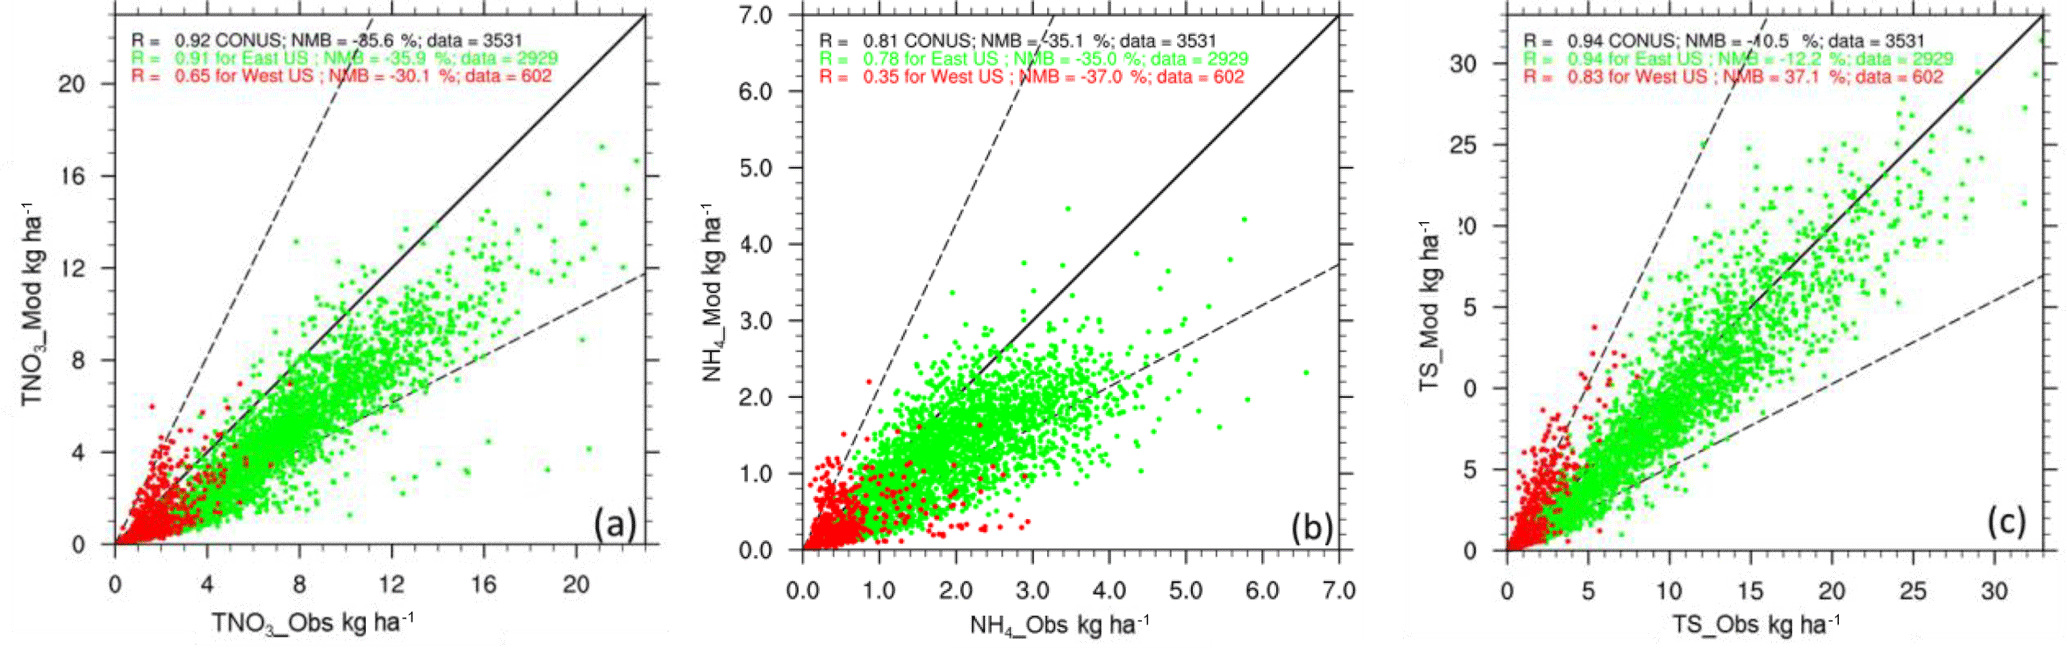
Figure 1Scatter plots for the annual accumulated WDEP (total oxidized nitrogen (TNO3, a), reduced nitrogen (NHx, b), and total sulfate (TS, c)) between precipitation-adjusted model results and observations from 1990 to 2010 for 170 valid sites with 3531 valid data points. The data at each NADP are assumed to be valid for our analysis only if at least 18 years of observation data are available at that site and the data coverage is at least 75 % for each year. Each point in the plots represents the annual accumulated WDEP for a given site and year. Note that the annual accumulated WDEP values used in this analysis may not be the actual annual totals due to missing data in the observations. The green color is for the eastern US, and the red color is for the western US, with the dashed line for the 1 : 2 and 2 : 1 ratio and the solid line for the 1 : 1 ratio.
Table 2Evaluation results for the 10 ecoregions for TNO3 WDEP. The units are kg ha−1 for the means and MB and kg ha−1 yr−1 for the trends. The bolded values indicate trends that are statistically significant, with the p value less than 0.05 for the standard Student's t test.
Clear downward trends are seen for TNO3 and TS WDEP from both the observations and model in Fig. 2a, c, while NHx deposition exhibits much larger interannual fluctuations (Fig. 2b). In Fig. 3 we see much larger decreasing trends for TNO3 and TS WDEP in the eastern US than those in the western US. This is due to the fact that the emission reductions mostly occurred in the eastern US (Xing et al., 2013; Simon et al., 2015), and the model captures this trend very well especially for TNO3 and TS WDEP with R values of 0.94 and 0.95, respectively. A stronger decreasing trend over the Northern Forests and Eastern Temperate Forests regions compared to other regions is observed for both TNO3 and TS WDEP, and the model is also able to capture these very well but a slightly distinctions in the trends for each ecoregion (Tables 2 and 4). We see that the model generally underestimates the magnitude of the decreasing WDEP trends at many sites for TNO3 and TS (Tables 2 and 4), which may be caused by the coarse model resolution (36 km) and uncertainties in the emission inventories. For NHx, we see increasing WDEP trends for most of the sites but the trends are not statistically significant (Table 3).
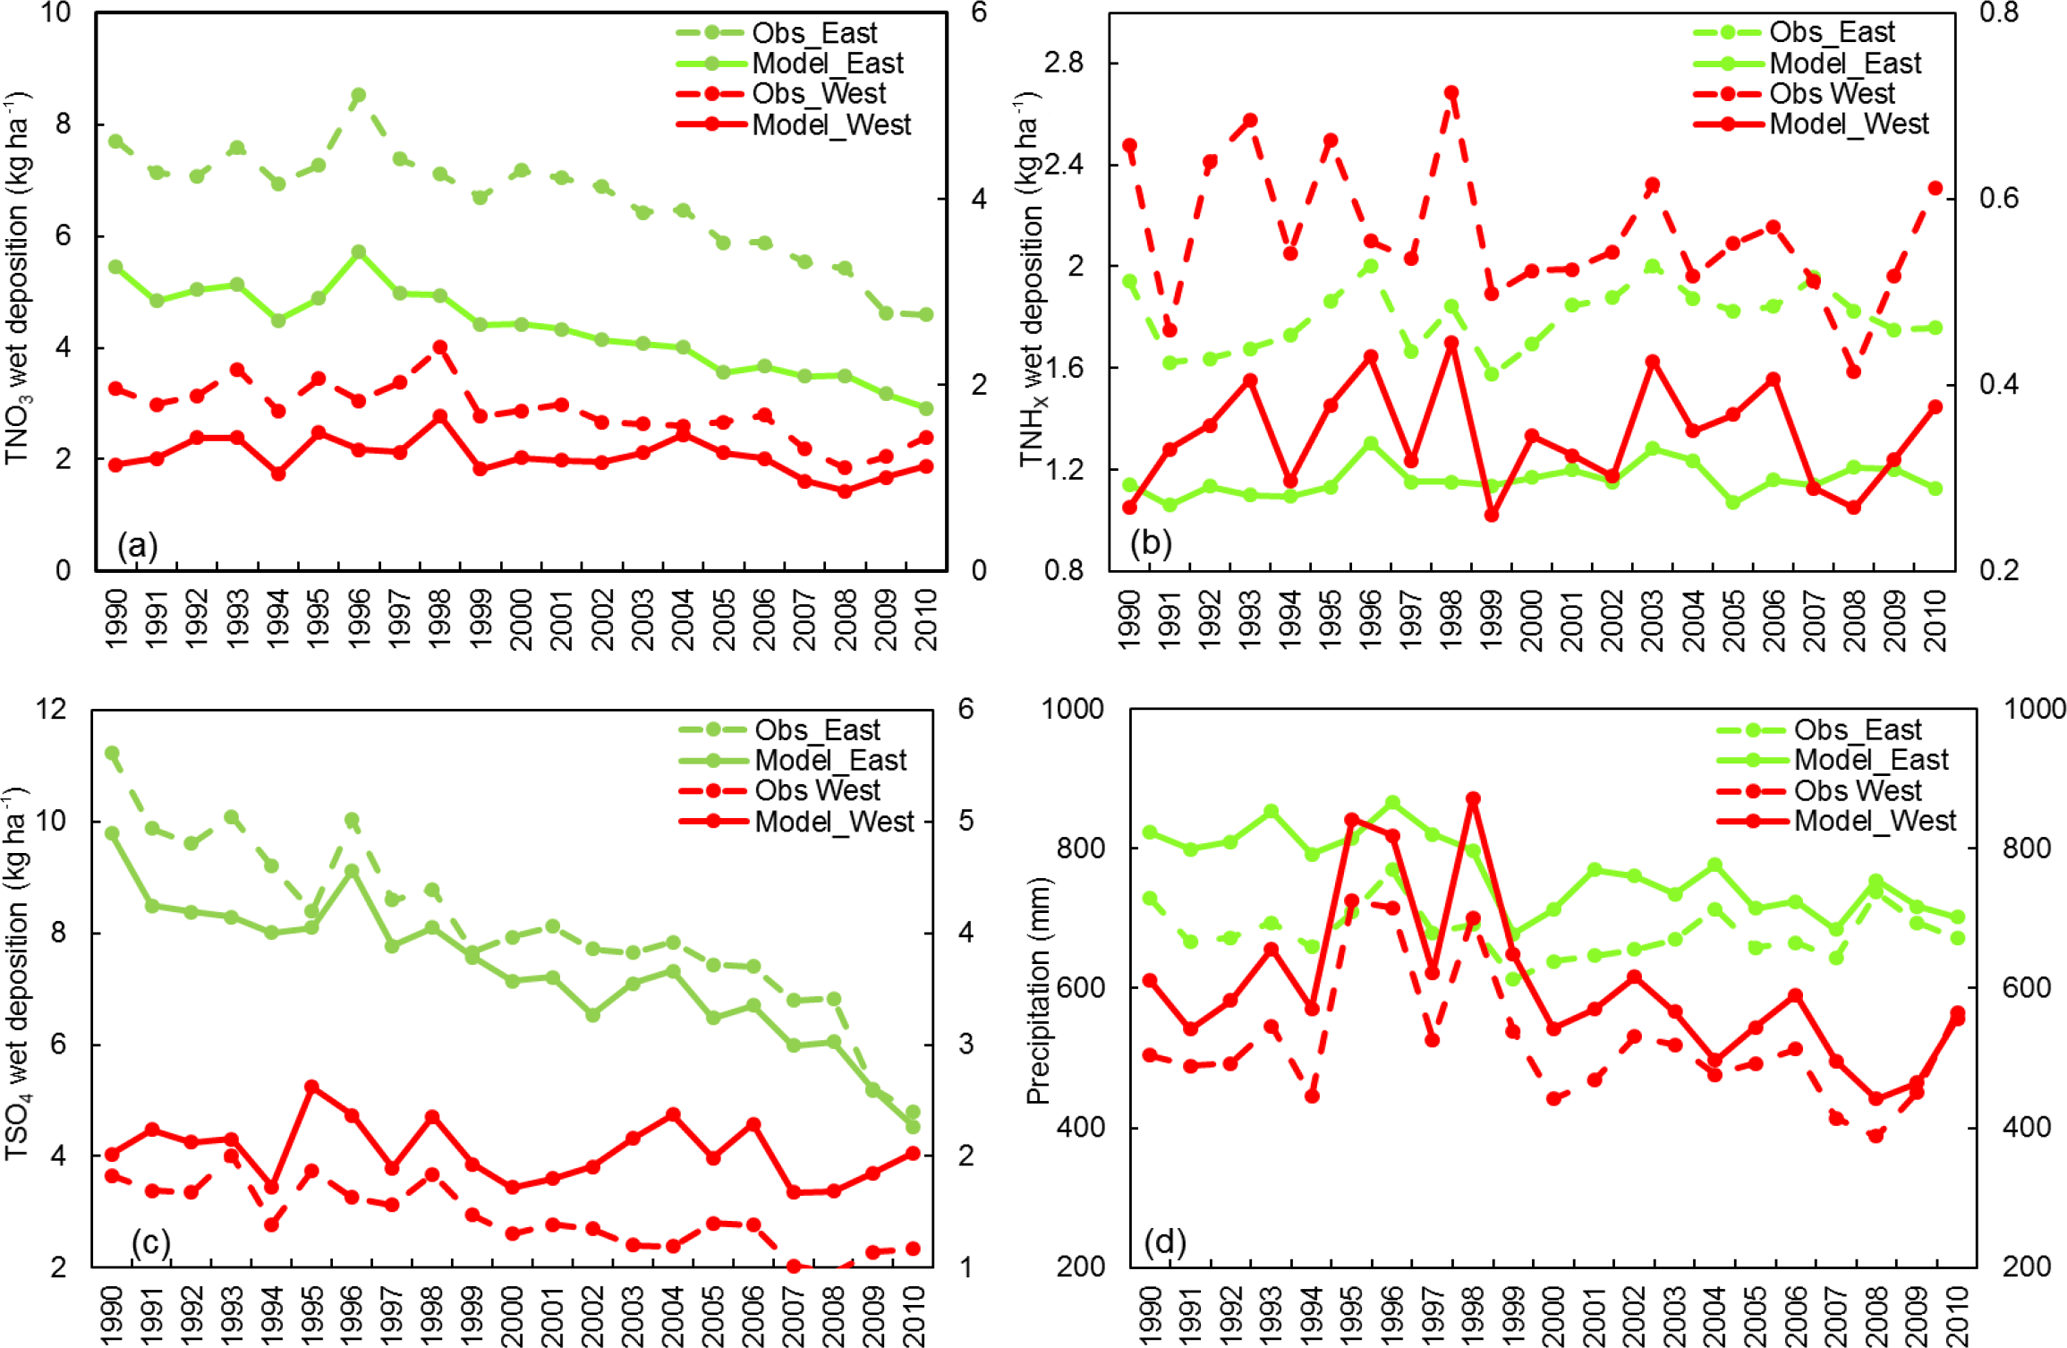
Figure 2Comparison of the temporal trends for the annual accumulated WDEP (across all the 170 valid sites) for (a) TNO3, (b) TNHx, (c) TS, and (d) precipitation, for the eastern US (green, averaged over 141 sites) and western US (red, average over 29 sites) between observations (dashed lines) and annual precipitation-adjusted model values (solid lines). The scale shown on the left is for the eastern US and on the right for the western US.
Compared with Appel et al. (2011), our model results indicate larger bias for WDEP for both the eastern and western US (Table S4 in the Supplement). The NMB increases for all three species in our results from 2002 to 2006 after applying the precipitation adjustment, which was also seen in Appel et al. (2011), except for TS, which Appel et al. (2011) reported decreased bias after the precipitation adjustment. The discrepancies for the model performances between our study and Appel et al. (2011) could be caused by the grid resolutions, in which coarse-resolution models (e.g. 36 km in our study) have more challenges to simulate various chemical and physical processes compared with fine resolution (e.g. 12 km used in Appel et al., 2011). There are numerous differences between the model configuration and versions used in this analysis and those previously used by Appel et al. (2011). Specific model process representation differences between CMAQv5.0 used here and CMAQv4.7 used in Appel et al. (2011) can be found at https://www.epa.gov/cmaq/cmaq-models-0 (last access: 21 June 2018).
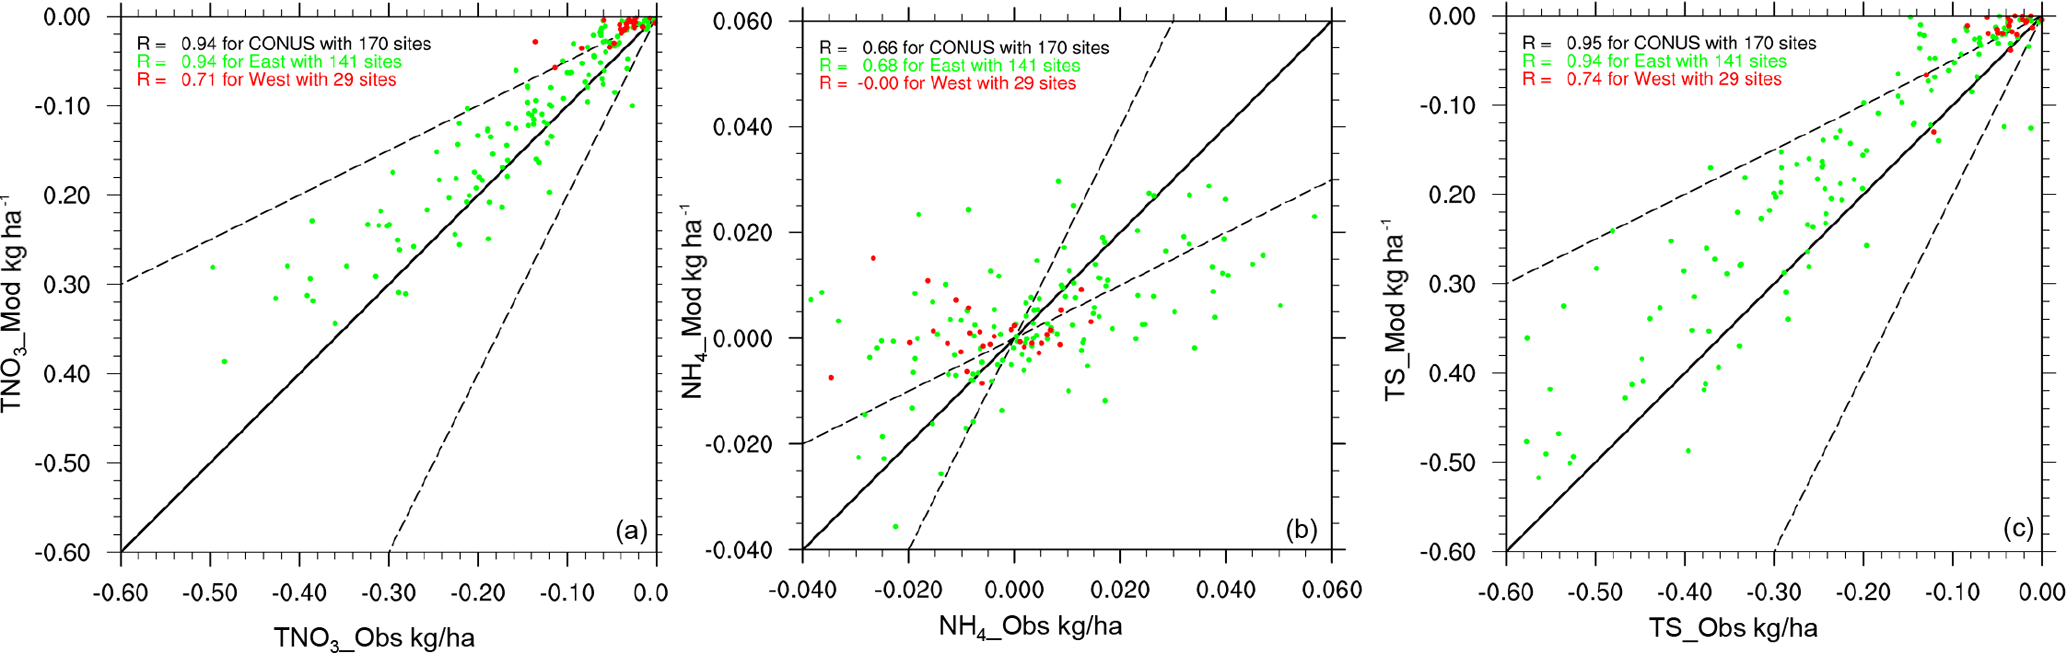
Figure 3Comparison of the WDEP trend for each valid site between the precipitation-adjusted model values and observations for total oxidized nitrogen (TNO3, a), reduced nitrogen (NHx, b), and total sulfate (TS, c). Each NADP site is assumed to be valid for our analysis only if at least 18 years of observation data are available at that site and the data coverage is at least 75 % for each year. The green color is for the eastern US, and the red color is for the western US, with the dashed line for the 1 : 2 and 2 : 1 ratio and the solid line for the 1 : 1 ratio.
To evaluate the model's performance in simulating the DDEP, we compare the model simulated concentration with the observations from CASTNET. Comparisons of annual average simulated concentrations with corresponding measurements at the CASTNET sites show strong correlation for SO2 (R of 0.88), SO4 (0.95), TNO3 (0.94), and NH4 (0.94). Some underestimation for SO4 and overestimation in other species ambient concentrations is noted (Fig. S4 in the Supplement). The model also captures the trends for these species with very high R, but the magnitude of the decreasing trends is underestimated by the model (Fig. S5 in the Supplement).
3.2 Spatial patterns of modeled total deposition of nitrogen and sulfur
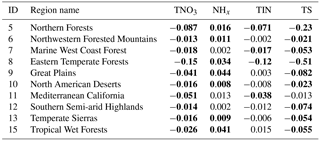
Table 5 shows that modeled TDEP of TIN, i.e., the sum of TNO3 and NHx, is much higher in the Eastern Temperate Forests than any other ecoregion (regional average of 10.08 and 7.95 kg N ha−1 in 1990 and 2010, respectively), followed by the Northern Forests and Mediterranean California regions. The hotspot for TIN TDEP has shifted from the eastern US in 1990 to the northern central US in 2010, with relative higher values in North Carolina (NC) and Pennsylvania (PA) (Fig. 4). During the period from 1990 to 2010, TIN TDEP has significantly decreased (with p < 0.05 for the standard two-tailed Student's t test) over several ecoregions, including Eastern Temperate Forests, Northern Forests, Mediterranean California, and Marine West Coast Forest (decreasing trend of 0.12, 0.071, 0.038, and 0.017 kg N ha−1 yr−1, respectively) as a result of significant reductions in anthropogenic NOx emissions (Xing et al., 2013). Slightly increasing but not statistically significant trends are estimated in TIN TDEP for the Great Plains and the Tropical Wet Forests while the remaining regions show statistically insignificant decreasing trends (Table 6). We see statistically significant increasing trends of TIN TDEP in eastern NC (larger than 0.2 kg N ha−1 yr−1), which is mainly caused by the increase in NHx TDEP (Fig. 5) arising from increased NH3 emission from hog farming (Xing et al., 2013; Paulot et al., 2014). There are also significant increasing trends of TIN TDEP over Iowa, Minnesota, and South Dakota (larger than 0.04 kg N ha−1 yr−1) because of the increased NHx TDEP related to animal foster and corn plantation (Figs. 4 and 5). In Fig. 5 we see that the TIN TDEP decreasing trends predominantly result from the TNO3 TDEP decreases across the US, with larger decreasing rates in the east than the west. The increasing TIN TDEP trends over the east and central states (such as NC, PA, and Virginia) were caused by the NHx TDEP increases, which in turn arise from increases in NH3 emissions (Paulot et al., 2013).
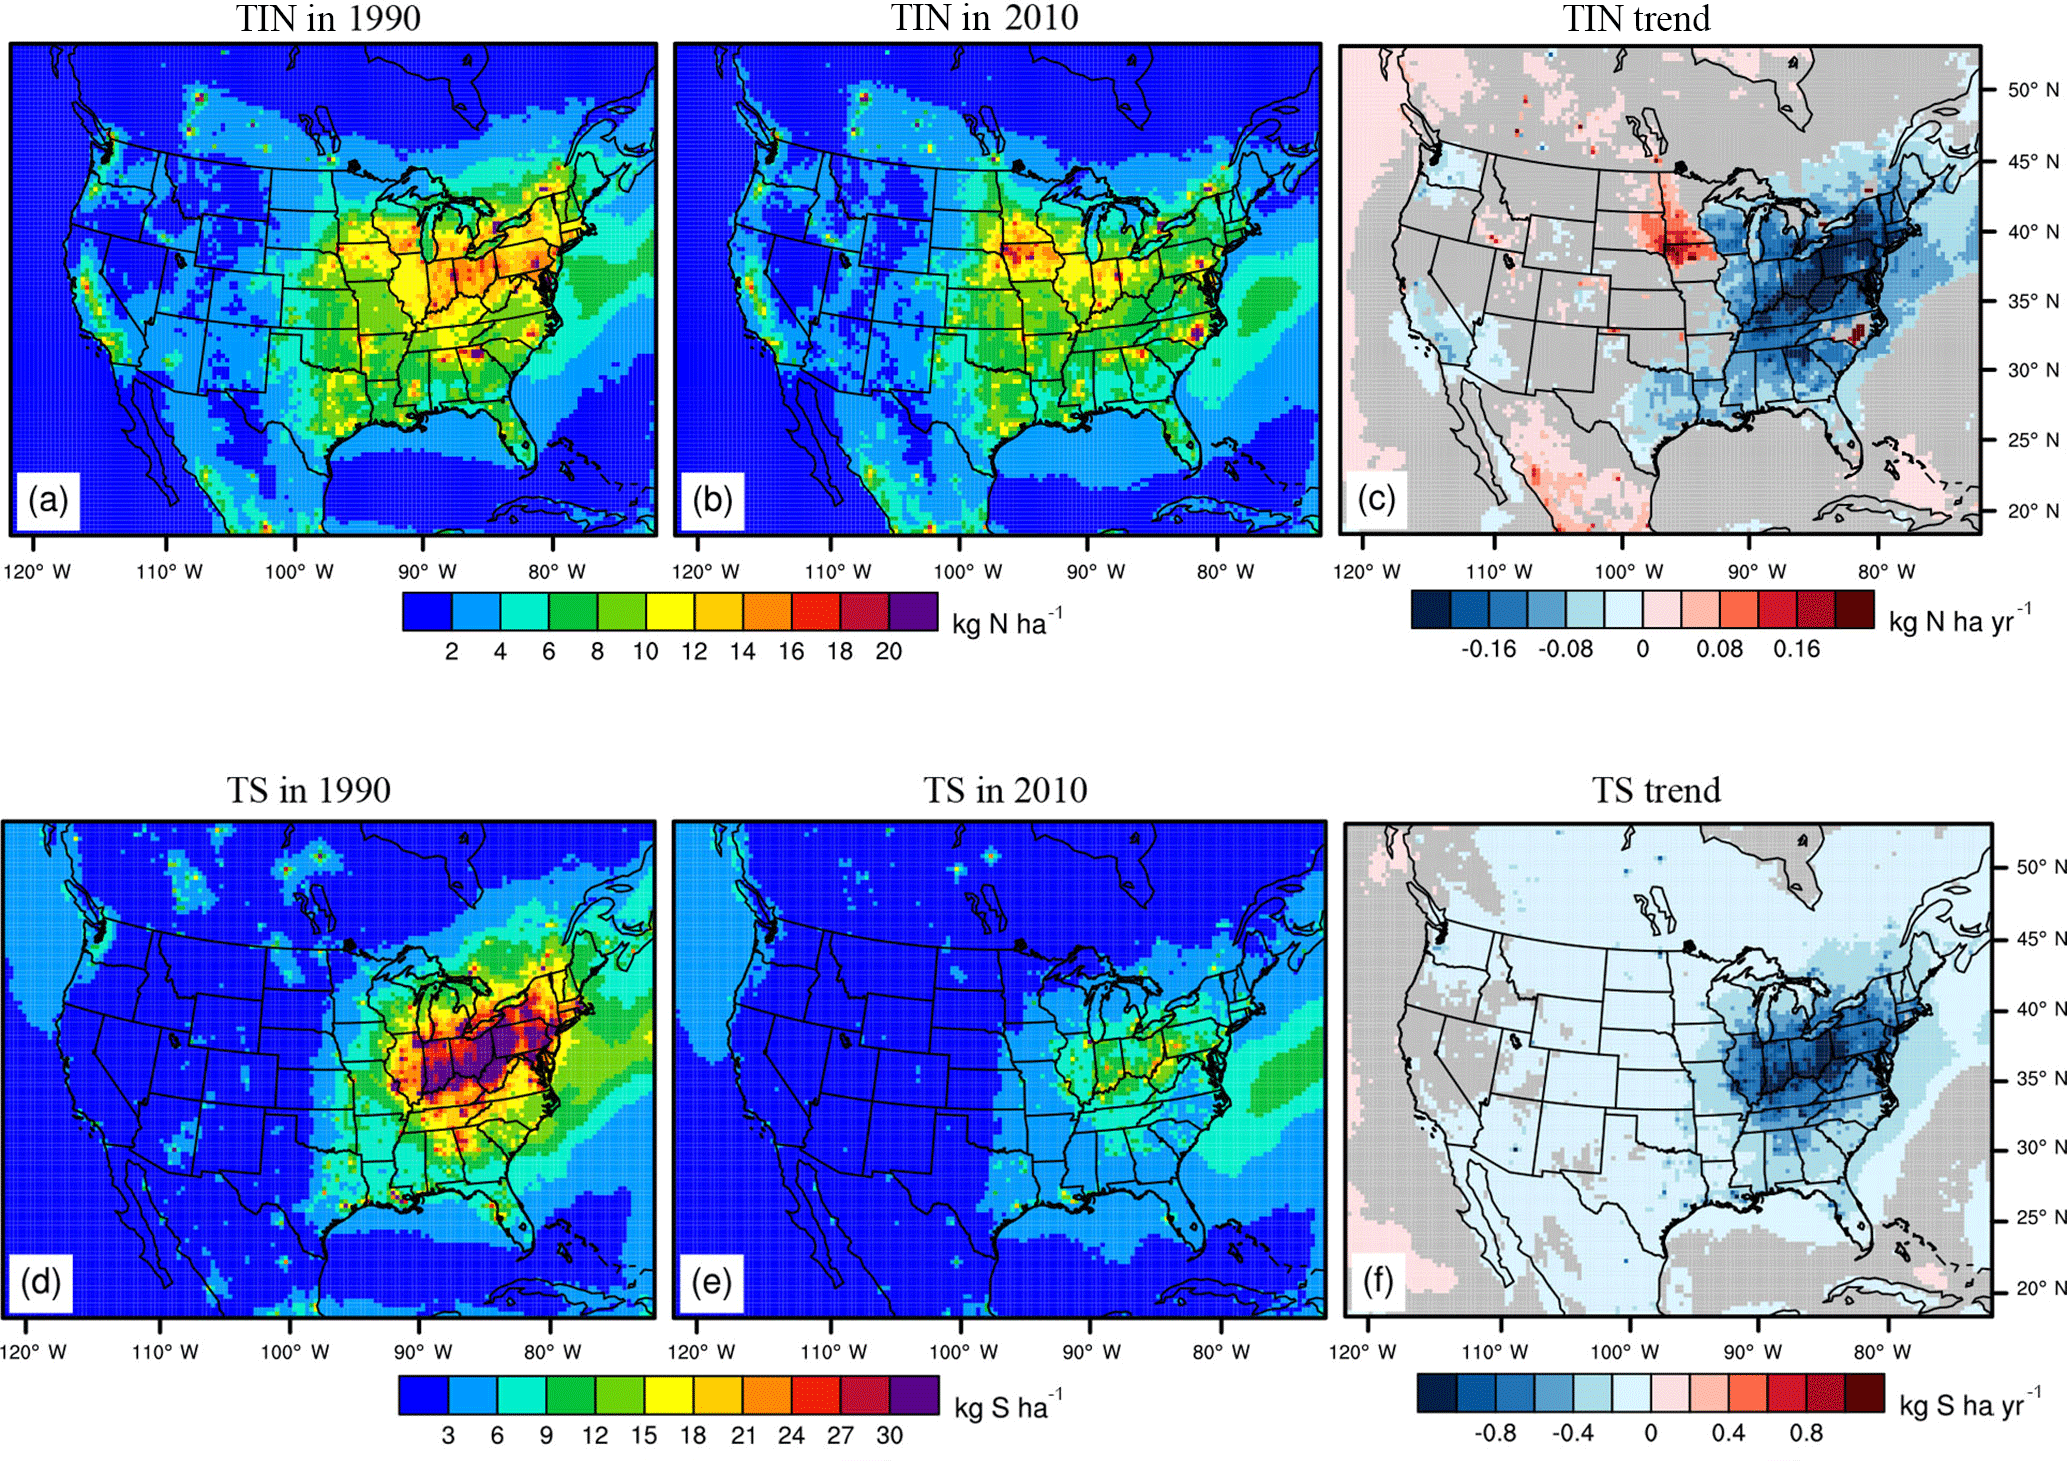
Figure 4Spatial distribution of annual TDEP of total inorganic nitrogen (TIN, kg N ha−1, a–c) and sulfur (kg S ha−1, d–f) in 1990 (a, d), 2010 (b, e), and the simulated trends of the TIN (c, kg N ha−1 yr−1) and total sulfur (f, kg S ha−1 yr−1) TDEP changes over the 2 decades. Grey areas on the right plots show p value for the standard two-tailed Student t test greater than 0.05 (i.e., areas where trend estimates were not significant at the 95 % confidence level).
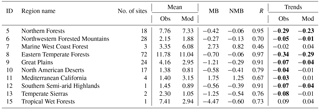
Table 5TDEP (WDEP + DDEP; units of kg N ha−1 for nitrogen deposition including TNO3, NHx, and TIN and kg S ha−1 for TS) in 1990 and 2010 for the 10 ecoregions.
Similar to TIN TDEP, TDEP of total sulfur (TS), i.e., the sum of SO2 and , shows a distinct spatial gradient from the east (usually larger than 9 kg S ha−1) compared to the west (lower than 3 kg S ha−1) (Fig. 4). In 1990, the TS was even higher than 30 kg S ha−1 in some states of the central US, such as Indiana, Ohio, PA, and West Virginia. In 2010, TS TDEP is still higher in the east than the west, but TS TDEP in the east has decreased by half (to lower than 15 kg S ha−1) for most regions. From 1990 to 2010, the estimated TS TDEP exhibits significant trends across the US, with decreasing trends generally larger in the east (larger than 0.4 kg S ha−1 yr−1) and lower in the west (less than 0.2 kg S ha−1 yr−1) as a result of SO2 decreases from the passage of the Clean Air Act Amendments of 1990. All the ecoregions experienced statistically significant decreases of TS TDEP over the past 2 decades, which were dominated by the decreases in , except for the Mediterranean California ecoregion, which showed an insignificant decreasing trend (Table 6). The largest decreasing trend was seen in the Eastern Temperate Forests region (−0.51 kg S ha−1 yr−1), followed by the Northern Forests (−0.23 kg S ha−1 yr−1) and the Great Plains (−0.082 kg S ha−1 yr−1).
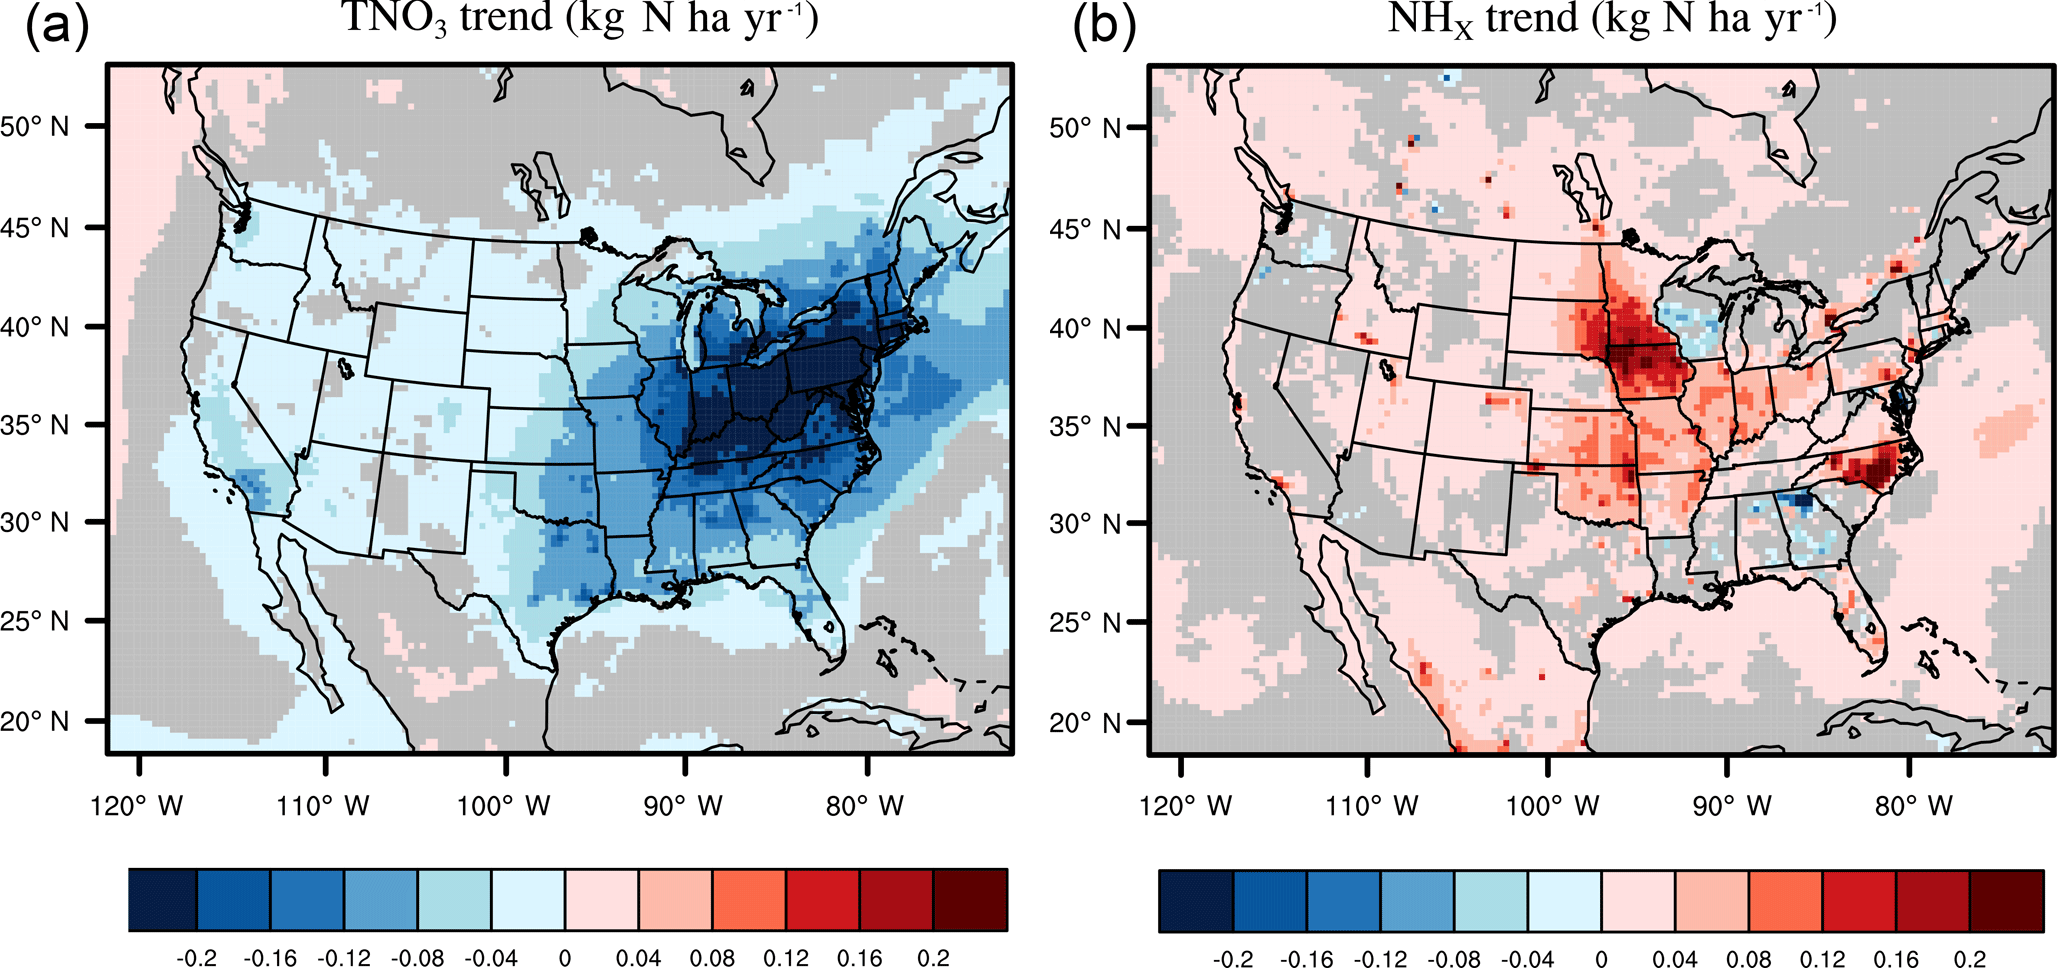
Figure 5Spatial distribution of the trends for the TDEP of total oxidized nitrogen deposition (TNO3, a), and reduced nitrogen (NHX, b) from 1990 to 2010. Grey areas on the both plots show p value great than 0.05 for the standard two-tailed Student t test (i.e., areas where trend estimates were not significant at the 95 % confidence level).
Table 6Trends for total deposition (WDEP + DDEP, units of kg N ha−1 yr−1 for nitrogen deposition including TNO3, NHx and TIN, and kg S ha−1 yr−1 for TS) over the 10 ecoregions. The bolded values indicate trends that are statistically significant with the P value less than 0.05 for the Student's t test.
3.3 Wet versus dry nitrogen and sulfur deposition trends in the US
Figure 6 shows that the TIN WDEP is higher in the east than the west due to both greater precipitation (Fig. 2d) and higher atmospheric burden of airborne reactive nitrogen in the east (Xing et al., 2013). In addition, estimated TIN WDEP shows widespread significant decreasing trends in the eastern US while trends in the western US generally have smaller magnitudes and often are not statistically significant. The most significant decreasing region is the Eastern Temperate Forests, with an annual decrease of −0.070 kg N ha−1 yr−1, followed by the Northern Forests (−0.037 kg N ha−1 yr−1) and the Great Plains (−0.023 kg N ha−1 yr−1) (Table S5 in the Supplement). The decreasing trends of TIN WDEP are mainly caused by the WDEP of TNO3 (Fig. S6a and Table S5 in the Supplement). There are no significant changes for WDEP of NHx in the majority of the US except for the region Tropical Wet Forests (Fig. S6b), consistent with previous findings (Lajtha and Jones, 2013). TIN DDEP is higher in the eastern US and lower in the northwestern and central US. Significant decreasing trends for the TIN DDEP are seen over the Eastern Temperate Forests (−0.049 kg N ha−1 yr−1), Northern Forests (−0.033 kg N ha−1 yr−1), Mediterranean California (−0.032 kg N ha−1 yr−1), and Marine West Coast Forest regions (−0.022 kg N ha−1 yr−1) (Table S6 in the Supplement). The decreases of TIN DDEP over these regions are dominated by the DDEP of TNO3 (Fig. S6c and Table S6 in the Supplement). In contrast, there are significant increasing trends of TIN DDEP over the Tropical Wet Forests (0.027 kg N ha−1 yr−1), Great Plains (0.026 kg N ha−1 yr−1), and Southern Semi-arid Highlands (0.009 kg N ha−1 yr−1). These increases are caused by the DDEP of NHx (Fig. S6d and Table S6 in the Supplement).
Figure 7 shows a distinct spatial distribution for both the WDEP and DDEP of sulfur, with much higher values in the eastern US in the vicinity and downwind of major sources. Significant decreasing trends are noted for both the wet and dry TS deposition for all the ecoregions except the Marine West Coast Forest and Mediterranean California, where TS WDEP are estimated to increase, though the trend is not statistically significant (Tables S5 and S6 in the Supplement). TS DDEP trends are larger or comparable to TS WDEP trends for the majority of the regions, except for Southern Semi-arid Highlands, Temperate Sierras, and Tropical Wet Forests, where the magnitude of the decreasing trends for DDEP are lower than those for WDEP.
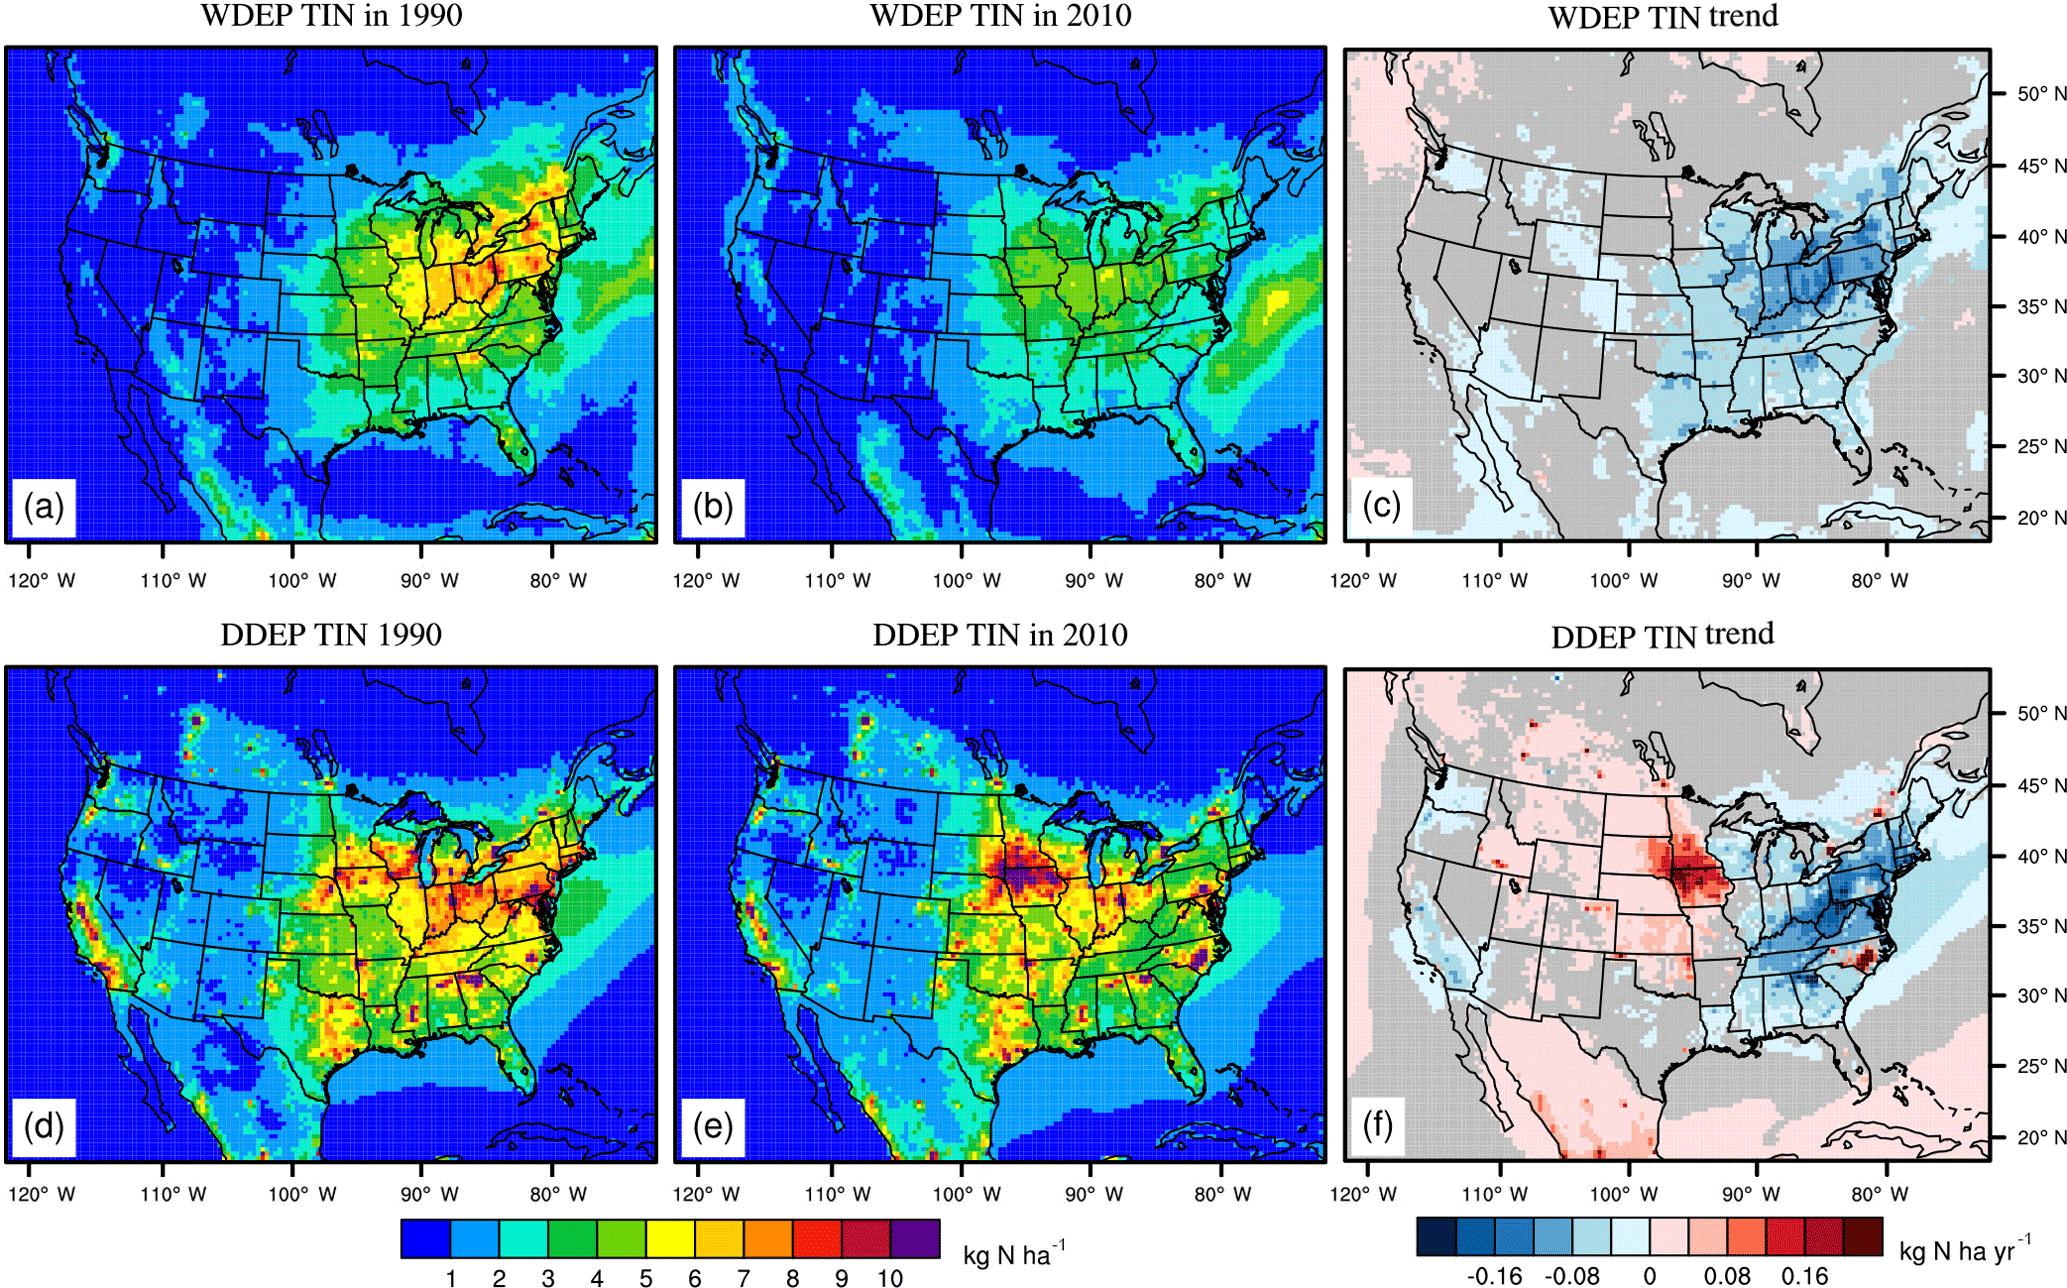
Figure 6Spatial distribution of WDEP (a–c) and DDEP (d–f) of TIN (kg N ha−1) in 1990 (a, d), 2010 (b, e), and the simulated trends (c, f, kg N ha−1 yr−1) over the 2 decades. Grey areas on the right plot show p value great than 0.05 for the standard two-tailed Student t test (i.e., areas where trend estimates were not significant at the 95 % confidence level).

Figure 7As in Fig. 6 but for sulfur. The units are kg S ha−1 for (a, b, d, e) and kg S ha−1 yr−1 for (c, f).
3.4 Deposition budget in the US
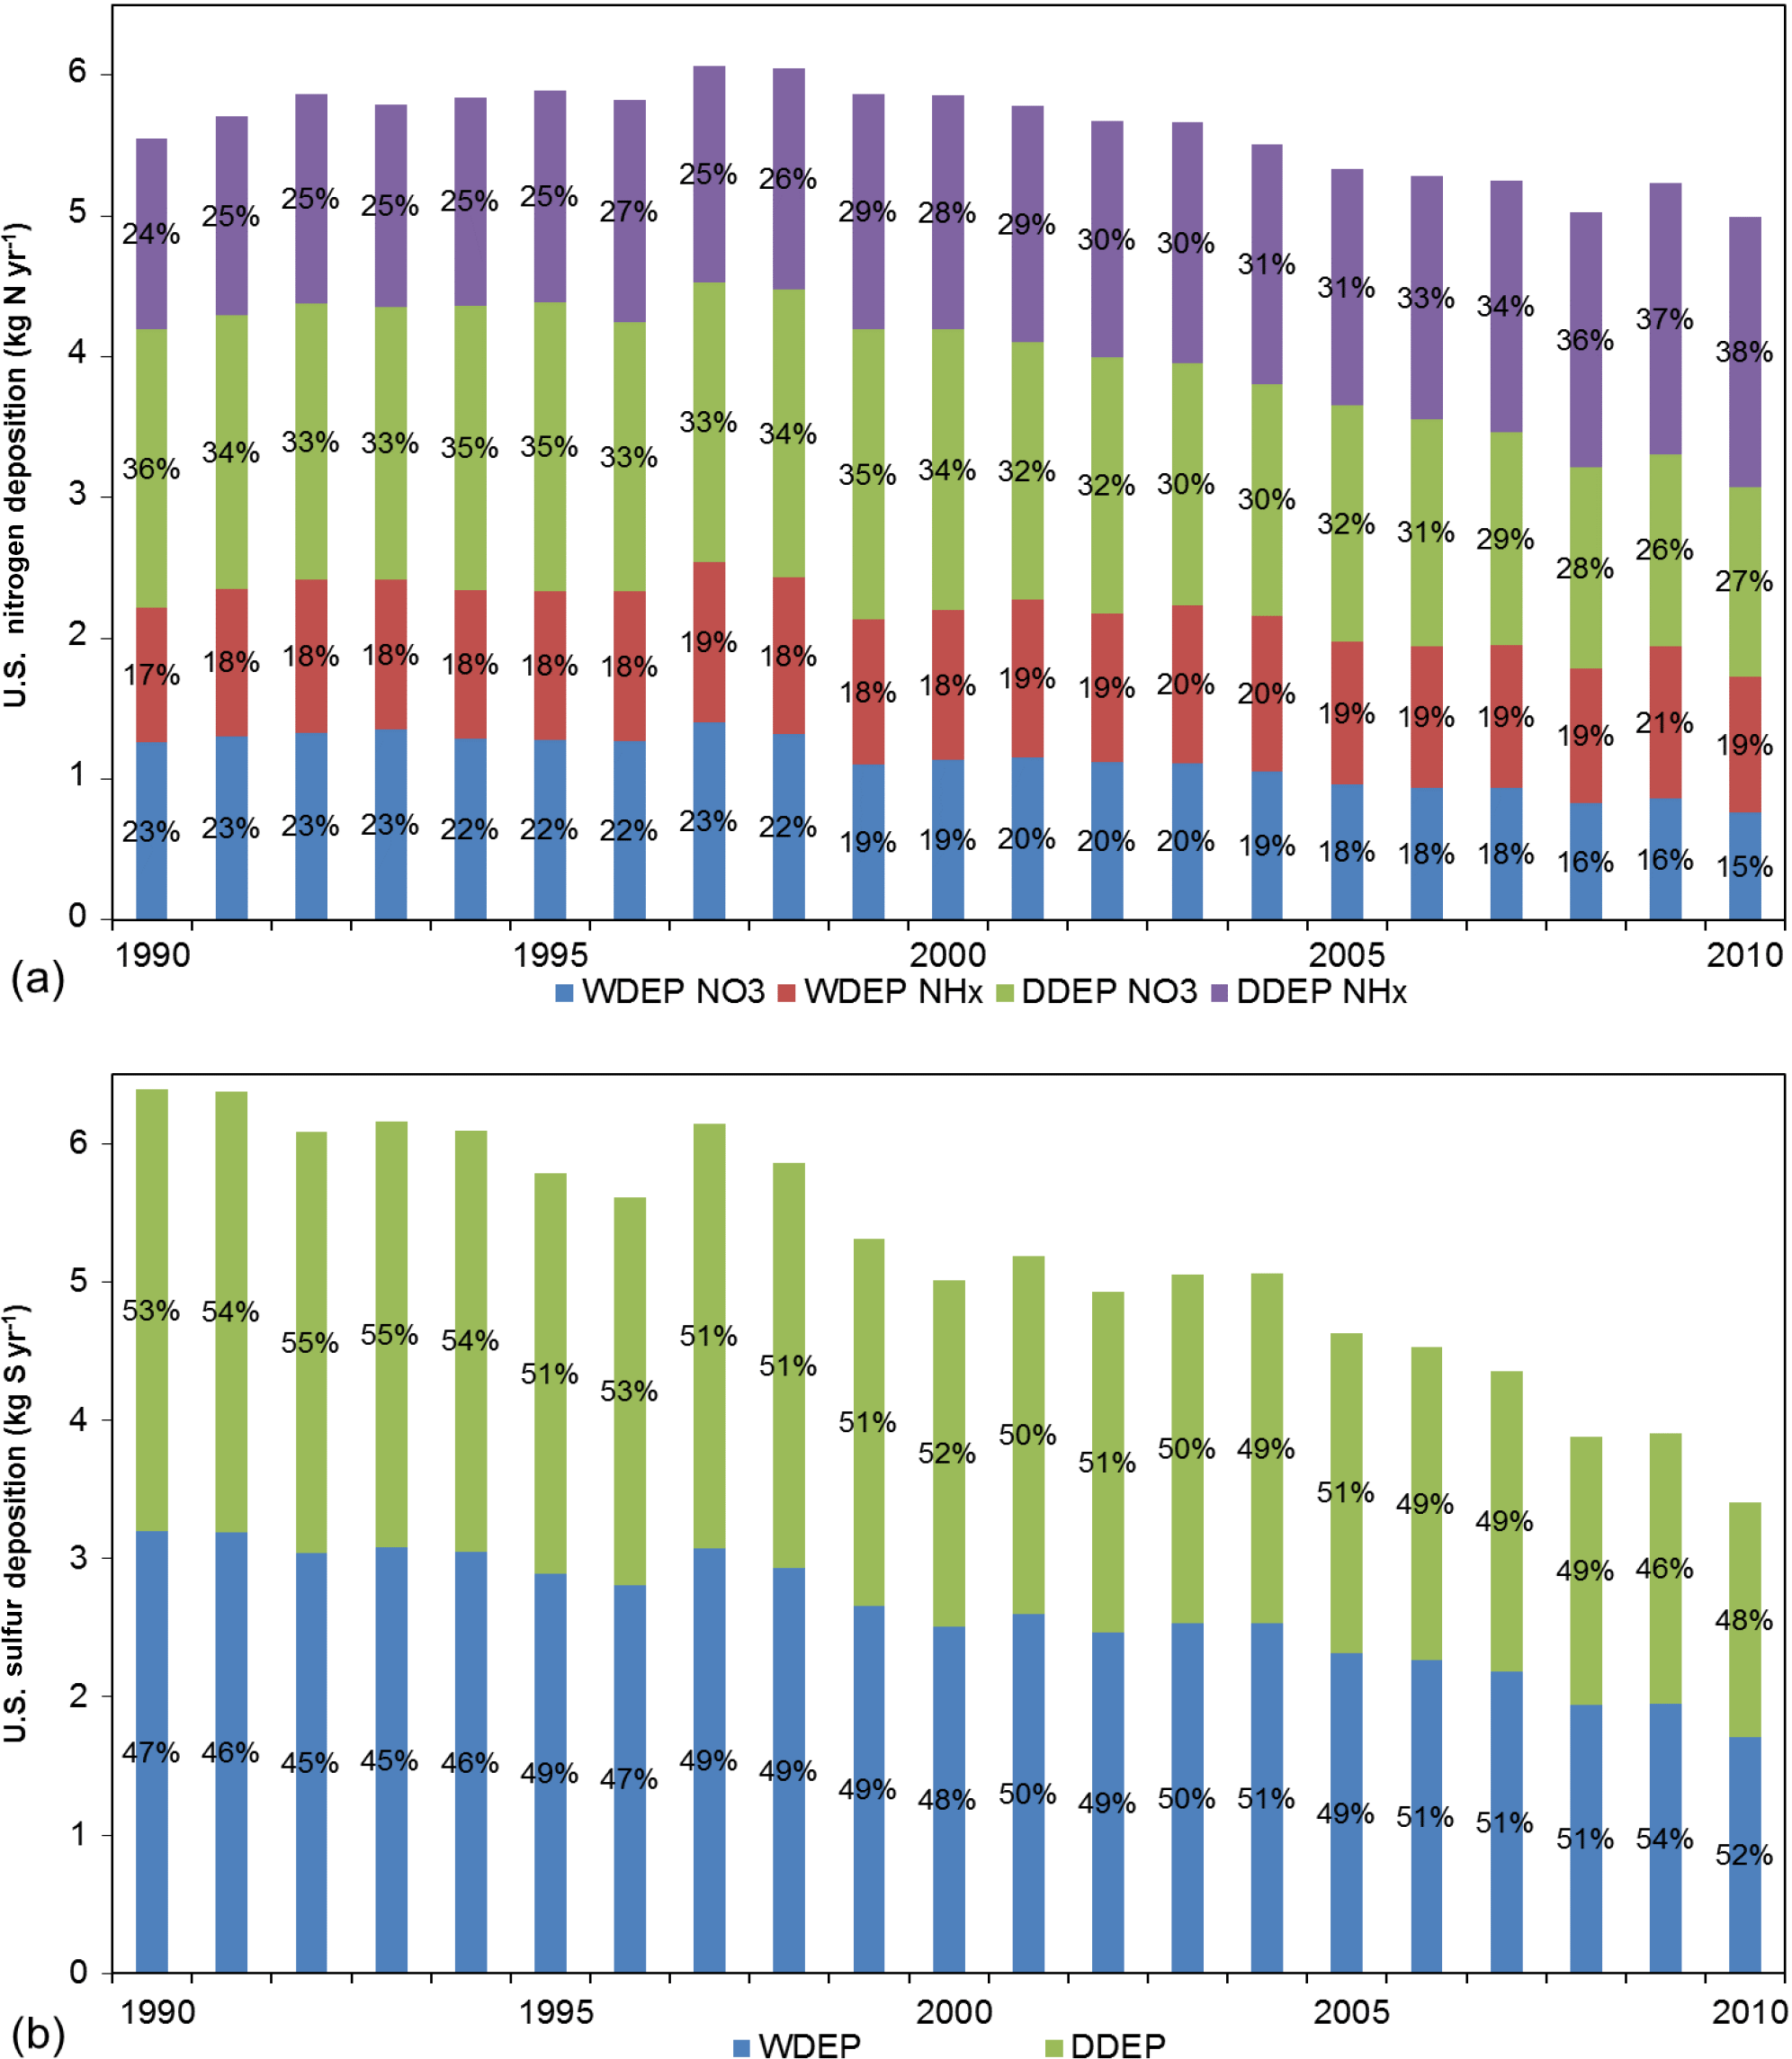
Figure 8Interannual variability of the TDEP for inorganic nitrogen (a) and sulfur (b) in the US from 1990 to 2010, including their fractions labeled as percent contributions for WDEP of oxidized nitrogen (NO3), WDEP of reduced nitrogen (NHx), DDEP of oxidized nitrogen (NO3) and DDEP of reduced nitrogen (NHx) deposition for the nitrogen, and WDEP versus DDEP for sulfur.
Figure 8a shows that the US domain average TDEP of TIN generally decrease over the past 2 decades, from 5.55 kg N ha yr−1 in 1990 to 5.00 kg N ha yr−1 in 2010. The decrease in TIN TDEP is mainly caused by reductions in TNO3. The TNO3 WDEP is estimated to decrease from 1.26 to 0.76 kg N ha yr−1 and TNO3 DDEP decrease from 1.98 to 1.35 kg N ha yr−1 during the same period. DDEP accounts for large fractions of TDEP for TIN over the entire 1990 to 2010 time period, 58–65 % of TDEP over the US (Fig. S7 in the Supplement). The relative proportions of TNO3 over the TDEP have also changed over the past 2 decades in response to changes in precursor emissions. TNO3 deposition dominates TIN TDEP until the early 2000s. After 2003, however, NHx dominates the TIN TDEP over the US (Fig. S7 in the Supplement). This is consistent with Li et al. (2016), who showed that the US TIN deposition has transitioned from being dominated by TNO3 to NHx as a result of NOx emission reductions and increases of unregulated NH3 emissions. The increasing contributions of NHx to the TIN TDEP can also be seen in Fig. 9, which shows increasing proportions of NHx contributions across larger regions of the CONUS during the 1990 to 2010 period (significant increasing trend (p < 0.05) for the NHx fraction of the total TIN across the US). This has resulted from the significant NOx reduction due to regulations and growth in NH3 emissions (Warner et al., 2017).
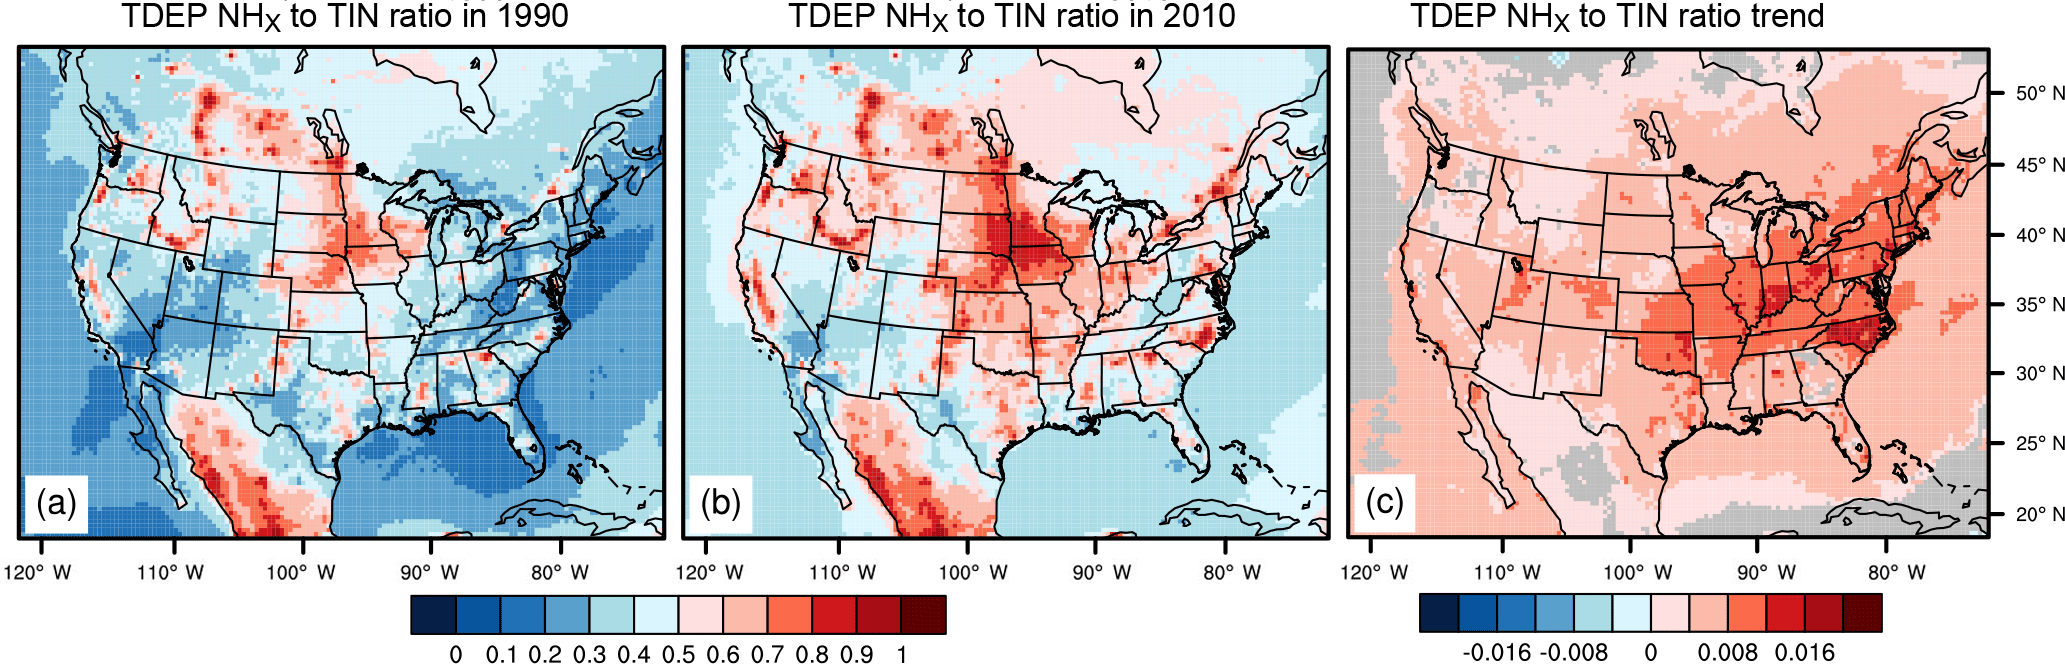
Figure 9The ratio of TDEP of NHx over the TDEP of TIN in 1990 (a), 2010 (b), and the trend (c). The blue color in panels (a, b) indicates a NHx ratio less than 0.5, which means TNO3 dominates the total nitrogen deposition, while the red color indicates a ratio larger than 0.5 and NHx dominates the total nitrogen deposition.
Similar to TIN TDEP, the TS TDEP has also decreased, from 6.85 kg S ha−1 yr−1 in 1990 to 3.26 kg S ha−1 yr−1 in 2010 (Fig. 8b), as a result of the decreasing anthropogenic SO2 emissions (Smith et al., 2011; Xing et al., 2013). The TS DDEP dominates the TS TDEP during the first decade, but TS WDEP becomes dominant after the year 2004. The dry sulfur deposition has decreased by 58 % from 1990 to 2010, from 3.65 to 1.55 kg S ha−1 yr−1, while the wet sulfur deposition has decreased by 47 %, from 3.20 to 1.70 kg S ha−1 yr−1, during the same period.
In this study, we use model simulations spanning a 21-year period from 1990 to 2010 to investigate the spatial distribution and temporal trends in the total inorganic nitrogen (TIN) and total sulfur (TS) deposition across the US, including changes in chemical composition of the deposition as well as relative importance of the wet (WDEP) and dry deposition (DDEP) components. By evaluating the model's performance against observations from the NADP network, we find that the model generally underestimated the WDEP for both the oxidized nitrogen (TNO3) deposition and reduced nitrogen (NHx) deposition across the US. The model underestimates TS WDEP in the eastern US, but overestimates it in the western US. The model exhibits better performance in simulating the WDEP in the eastern US than in the western US. The 21-year model simulations capture the spatial pattern of decreasing trends for the WDEP of TNO3 and TS very well, with a correlation coefficient typically larger than 0.9. However, the model generally underestimates the decreasing trends of the TNO3 and TS WDEP. The model performance is worse in simulating the spatial distribution and trends of the NHx deposition compared with TNO3 and TS, which may be caused by uncertainties in the representation of NH3 emissions in the model. The underestimation of the NHx deposition could also be caused by uncertainties in temporal and spatial representation of emissions associated with fertilizer applications and bi-directional exchange of NH3 between the air and underlying soil and vegetation surfaces. Applying the bi-directional NH3 exchange mechanism in the coupled model could improve the model's ability in simulating NHx deposition (Appel et al., 2011; Bash et al., 2013).
The modeled total deposition (TDEP) of TIN and TS is higher in the eastern US and lower in the western US. For TIN, it is highest in the Eastern Temperate Forests and lowest in the Northwestern Forested Mountains. For TS it is also highest in the Eastern Temperate Forests but lowest in the North American Deserts. The TDEP of TIN has seen significant decreasing trends over the Eastern Temperate Forests, Northern Forests, Mediterranean California, and Marine West Coast Forest and results from decreases in both wet and dry deposition of TNO3. Modeled TDEP of TS was found to be decreasing over the entire US, with larger decreasing trends for the dry deposition compared with the wet deposition.
The TDEP of TIN over the entire US domain is dominated by DDEP, accounting from 58 to 65 % of the total from 1990 to 2010. TDEP of oxidized nitrogen dominates TIN deposition in the US in the first decade but a shift occurred in 2003 when TDEP of reduced nitrogen becomes the dominant factor. The DDEP of TS dominates the TS deposition in the first decade while WDEP becomes the dominant factor after the year 2004.
Our analysis, as well as others (Li et al., 2016; Kharol et al., 2017), shows that reduced nitrogen has dominated the total nitrogen deposition budget in the US in recent years. Additionally, model calculations show strong increasing trends in dry deposition amounts of NHx across the US which arise from both increasing NH3 emissions and reduced transport distances. Reductions in SO2 and NOx emissions (and consequently their oxidation products) have decreased the amounts of NHx partitioning to the aerosol phase where scavenging by rain is the primary sink. Consequently, more NHx remains in the gas phase and dry deposits closer to the source regions. The study highlights the growing importance of NHx deposition as emissions of NOx and SO2 have been reduced substantially over the years. We conclude that it is urgent to acquire accurate NH3 emissions inventories and maintain additional measurements of NHx, not only for improving the air quality model's performance but also for controlling the nitrogen deposition in the US. In addition, dry deposition of TNO3 and TS is a large fraction of the total deposition in the US, demonstrating the need for accurate dry deposition measurements as well as more robust characterization of dry deposition in air quality models.
The wet deposition data from the US National Atmospheric Deposition Programm can be downloaded from the website (http://nadp.sws.uiuc.edu/, last access: 21 June 2018). The 21-year model outputs for the coupled WRF-CMAQ model can be obtained by contacting the corresponding author (Y. Zhang, yuqiangzhang.thu@gmail.com, Yuqiang.zhang@duke.edu).
The supplement related to this article is available online at: https://doi.org/10.5194/acp-18-9091-2018-supplement.
YZ and RM designed the study and JX performed the model simulations, and YZ performed the data analysis and prepared the figures and tables. YZ wrote the paper with comments from all the coauthors.
The authors declare that they have no conflict of interest.
The views expressed in this paper are those of the authors and do not necessarily represent the views or policies of the US Environmental Protection Agency.
This research was supported in part by an
appointment to the Research Participation Program at the US EPA, Office of
Research and Development (ORD), administered by the Oak Ridge Institute for
Science and Education (ORISE) through an interagency agreement between the
US Department of Energy and the US EPA. We greatly acknowledge James
Kelly and Kristen Foley from the US EPA for their comments and suggestions
on the initial version of this paper.
Edited by: Annmarie Carlton
Reviewed by: two anonymous referees
Appel, K. W., Foley, K. M., Bash, J. O., Pinder, R. W., Dennis, R. L., Allen, D. J., and Pickering, K.: A multi-resolution assessment of the Community Multiscale Air Quality (CMAQ) model v4.7 wet deposition estimates for 2002–2006, Geosci. Model Dev., 4, 357–371, https://doi.org/10.5194/gmd-4-357-2011, 2011.
Astitha, M., Luo, H., Rao, S. T., Hogrefe, C., Mathur, R., and Kumar, N.: Dynamic evaluation of two decades of WRF-CMAQ ozone simulations over the contiguous United States, Atmos. Environ., 164, 102–116, https://doi.org/10.1016/j.atmosenv.2017.05.020, 2017
Bash, J. O., Cooter, E. J., Dennis, R. L., Walker, J. T., and Pleim, J. E.: Evaluation of a regional air-quality model with bidirectional NH3 exchange coupled to an agroecosystem model, Biogeosciences, 10, 1635–1645, https://doi.org/10.5194/bg-10-1635-2013, 2013.
Bouwman, A. F., van Vuuren, D. P., Derwent, R. G., and Posch, M.: A global analysis of acidification and eutrophication of terrestrial ecosystems, Water Air Soil Poll., 141, 349–382, https://doi.org/10.1023/A:1021398008726, 2002.
Bowman, W. D., Cleveland, C. C., Halada, Å., Hreško, J., and Baron, J. S.: Negative impact of nitrogen deposition on soil buffering capacity, Nat. Geosci., 1, 767–770, https://doi.org/10.1038/ngeo339, 2008.
Cheng, I. and Zhang, L.: Long-term air concentrations, wet deposition, and scavenging ratios of inorganic ions, HNO3, and SO2 and assessment of aerosol and precipitation acidity at Canadian rural locations, Atmos. Chem. Phys., 17, 4711–4730, https://doi.org/10.5194/acp-17-4711-2017, 2017.
Clark, C. M. and Tilman, D.: Loss of plant species after chronic low-level nitrogen deposition to prairie grasslands, Nature, 451, 712–715, https://doi.org/10.1038/nature06503, 2008.
Clark, C. M., Morefield, P. E., Gilliam, F. S., and Pardo, L. H.: Estimated losses of plant biodiversity in the United States from historical N deposition (1985–2010), Ecology, 94, 1441–1448, https://doi.org/10.1890/12-2016.1, 2013.
Colette, A., Granier, C., Hodnebrog, Ø., Jakobs, H., Maurizi, A., Nyiri, A., Bessagnet, B., D'Angiola, A., D'Isidoro, M., Gauss, M., Meleux, F., Memmesheimer, M., Mieville, A., Rouïl, L., Russo, F., Solberg, S., Stordal, F., and Tampieri, F.: Air quality trends in Europe over the past decade: a first multi-model assessment, Atmos. Chem. Phys., 11, 11657–11678, https://doi.org/10.5194/acp-11-11657-2011, 2011.
Dentener, F., Drevet, J., Lamarque, J. F., Bey, I., Eickhout, B., Fiore, A. M., Hauglustaine, D., Horowitz, L. W., Krol, M., Kulshrestha, U. C., Lawrence, M., Galy-Lacaux, C., Rast, S., Shindell, D., Stevenson, D., Van Noije, T., Atherton, C., Bell, N., Bergman, D., Butler, T., Cofala, J., Collins, B., Doherty, R., Ellingsen, K., Galloway, J., Gauss, M., Montanaro, V., Müller, J. F., Pitari, G., Rodriguez, J., Sanderson, M., Solmon, F., Strahan, S., Schultz, M., Sudo, K., Szopa, S., and Wild, O.: Nitrogen and sulfur deposition on regional and global scales: A multimodel evaluation, Global Biogeochem. Cy., 20, GB4003, https://doi.org/10.1029/2005GB002672, 2006.
Du, E. Z., Vries, W. D., Galloway, J. N., Hu, X. Y., and Fang, J. Y.: Changes in wet nitrogen deposition in the United States between 1985 and 2012, Environ. Res. Lett., 9, 095004, https://doi.org/10.1088/1748-9326/9/9/095004, 2014.
EEA: Air Quality in Europe-2011 Report, Technical Report 12/2011, EEA, Kopenhagen, 2011.
Elliott, E. M., Kendall, C., Wankel, S. D., Burns, D. A., Boyer, E. W., Harlin, K., Bain, D. J., and Butler, T. J.: Nitrogen Isotopes as Indicators of NOx source Contributions to Atmospheric Nitrate Deposition Across the Midwestern and Northeastern United States, Environ. Sci. Technol., 41, 7661–7667, https://doi.org/10.1021/es070898t, 2007.
Ellis, R. A., Jacob, D. J., Sulprizio, M. P., Zhang, L., Holmes, C. D., Schichtel, B. A., Blett, T., Porter, E., Pardo, L. H., and Lynch, J. A.: Present and future nitrogen deposition to national parks in the United States: critical load exceedances, Atmos. Chem. Phys., 13, 9083–9095, https://doi.org/10.5194/acp-13-9083-2013, 2013.
Fisher, J. A., Jacob, D. J., Wang, Q., Bahreini, R., Carouge, C. C., Cubison, M. J., Dibb, J. E., Diehl, T., Jimenez, J. L., Leibensperger, E. M., Lu, Z., Meinders, M. B. J., Pye, H. O. T., Quinn, P. K., Sharma, S., Streets, D. G., van Donkelaar, A., and Yantosca, R. M.: Sources, distribution, and acidity of sulfate ammonium aerosol in the Arctic in winter-spring, Atmos. Environ., 45, 7301–7318, https://doi.org/10.1016/j.atmosenv.2011.08.030, 2011.
Flechard, C. R., Nemitz, E., Smith, R. I., Fowler, D., Vermeulen, A. T., Bleeker, A., Erisman, J. W., Simpson, D., Zhang, L., Tang, Y. S., and Sutton, M. A.: Dry deposition of reactive nitrogen to European ecosystems: a comparison of inferential models across the NitroEurope network, Atmos. Chem. Phys., 11, 2703–2728, https://doi.org/10.5194/acp-11-2703-2011, 2011.
Galloway, J. N., Townsend, A. R., Erisman, J. W., Bekunda, M., Cai, Z., Freney, J. R., Martinelli, L. A., Seitzinger, S. P., and Sutton, M. A.: Transformation of the Nitrogen Cycle: Recent trends, questions, and potential solutions, Science, 320, 889–892, https://doi.org/10.1126/science.1136674, 2008.
Gan, C.-M., Pleim, J., Mathur, R., Hogrefe, C., Long, C. N., Xing, J., Wong, D., Gilliam, R., and Wei, C.: Assessment of long-term WRF-CMAQ simulations for understanding direct aerosol effects on radiation “brightening” in the United States, Atmos. Chem. Phys., 15, 12193–12209, https://doi.org/10.5194/acp-15-12193-2015, 2015.
Gan, C.-M., Hogrefe, C., Mathur, R., Pleim, J., Xing, J., Wong, D., Gilliam, R., Pouliot, G., and Wei, C.: Assessment of the effects of horizontal grid resolution on long-term air quality trends using coupled WRF-CMAQ simulations, Atmos. Environ., 132, 207–216, https://doi.org/10.1016/j.atmosenv.2016.02.036, 2016.
Greaver, T. L., Sullivan, T. J., Herrick, J. D., Barber, M. C., Baron, J. S., Cosby, B. J., Deerhake, M. E., Dennis, R. L., Dubois, J.-J. B., Goodale, C. L., Herlihy, A. T., Lawrence, G. B., Liu, L., Lynch, J. A., and Novak, K. J.: Ecological effects of nitrogen and sulfur air pollution in the US: what do we know?, Front. Ecol. Environ., 10, 365–372, https://doi.org/10.1890/110049, 2012.
Jia, Y. L., Yu, G. R., He, N. P., Zhan, X. Y., Fang, H. J., Sheng, W. P., Zuo, Y., Zhang, D. Y., and Wang, Q. F.: Spatial and decadal variations in inorganic nitrogen wet deposition in China induced by human activity, Sci. Rep., 4, 3763, https://doi.org/10.1038/srep03763, 2014.
Kanakidou, M., Myriokefalitakis, S., Daskalakis, N., Fanourgakis, G., Nenes, A., Baker, A. R., Tsigaridis, K., and Mihalopoulos, N.: Past, Present, and Future Atmospheric Nitrogen Deposition, J. Atmos. Sci., 73, 2039–2047, https://doi.org/10.1175/jas-d-15-0278.1, 2016.
Kharol, S. K., Shephard, M. W., McLinden, C. A., Zhang, L., Sioris, C. E., O'Brien, J. M., Vet, R., Cady-Pereira, K. E., Hare, E., Siemons, J., and Krotkov, N. A.: Dry deposition of reactive nitrogen from satellite observations of ammonia and nitrogen dioxide over North America, Geophys. Res. Lett., 45, 1157–1166, https://doi.org/10.1002/2017GL075832, 2017.
Lajtha, K. and Jones, J.: Trends in cation, nitrogen, sulfate and hydrogen ion concentrations in precipitation in the United States and Europe from 1978 to 2010: a new look at an old problem, Biogeochemistry, 116, 303–334, https://doi.org/10.1007/s10533-013-9860-2, 2013.
Lamarque, J.-F., Bond, T. C., Eyring, V., Granier, C., Heil, A., Klimont, Z., Lee, D., Liousse, C., Mieville, A., Owen, B., Schultz, M. G., Shindell, D., Smith, S. J., Stehfest, E., Van Aardenne, J., Cooper, O. R., Kainuma, M., Mahowald, N., McConnell, J. R., Naik, V., Riahi, K., and van Vuuren, D. P.: Historical (1850–2000) gridded anthropogenic and biomass burning emissions of reactive gases and aerosols: methodology and application, Atmos. Chem. Phys., 10, 7017–7039, https://doi.org/10.5194/acp-10-7017-2010, 2010.
Lamarque, J.-F., Dentener, F., McConnell, J., Ro, C.-U., Shaw, M., Vet, R., Bergmann, D., Cameron-Smith, P., Dalsoren, S., Doherty, R., Faluvegi, G., Ghan, S. J., Josse, B., Lee, Y. H., MacKenzie, I. A., Plummer, D., Shindell, D. T., Skeie, R. B., Stevenson, D. S., Strode, S., Zeng, G., Curran, M., Dahl-Jensen, D., Das, S., Fritzsche, D., and Nolan, M.: Multi-model mean nitrogen and sulfur deposition from the Atmospheric Chemistry and Climate Model Intercomparison Project (ACCMIP): evaluation of historical and projected future changes, Atmos. Chem. Phys., 13, 7997–8018, https://doi.org/10.5194/acp-13-7997-2013, 2013.
Li, Y., Schichtel, B. A., Walker, J. T., Schwede, D. B., Chen, X., Lehmann, C. M. B., Puchalski, M. A., Gay, D. A., and Collett, J. L.: Increasing importance of deposition of reduced nitrogen in the United States, P. Natl. Acad. Sci. USA, 113, 5874–5879, https://doi.org/10.1073/pnas.1525736113, 2016.
Mathur, R. and Dennis, R. L.: Seasonal and annual modeling of reduced nitrogen compounds over the eastern United States: Emissions, ambient levels, and deposition amounts, J. Geophys. Res., 108, 4481, https://doi.org/10.1029/2002JD002794, 2003.
Mathur, R., Xing, J., Gilliam, R., Sarwar, G., Hogrefe, C., Pleim, J., Pouliot, G., Roselle, S., Spero, T. L., Wong, D. C., and Young, J.: Extending the Community Multiscale Air Quality (CMAQ) modeling system to hemispheric scales: overview of process considerations and initial applications, Atmos. Chem. Phys., 17, 12449–12474, https://doi.org/10.5194/acp-17-12449-2017, 2017.
Meyers, T. P., Finkelstein, P., Clarke, J., and Ellestad, T. G.: A multilayer model for inferring dry deposition using standard meteorological measurements, J. Geophys. Res. Atmos., 103, 22645–22661, 1998.
Paulot, F., Jacob, D. J., and Henze, D. K.: Sources and Processes Contributing to Nitrogen Deposition: An Adjoint Model Analysis Applied to Biodiversity Hotspots Worldwide, Environ. Sci. Technol, 47, 3226–3233, https://doi.org/10.1021/es3027727, 2013.
Paulot, F., Jacob, D. J., Pinder, R. W., Bash, J. O., Travis, K., and Henze, D. K.: Ammonia emissions in the United States, European Union, and China derived by high-resolution inversion of ammonium wet deposition data: Interpretation with a new agricultural emissions inventory (MASAGE_NH3), J. Geophys. Res.-Atmos., 119, 4343–4364, https://doi.org/10.1002/2013JD021130, 2014.
Porter, P. S., Rao, S. T., Hogrefe, C., and Mathur, R.: A reduced form model for ozone based on two decades of CMAQ simulations for the continental United States, Atmos. Pollut. Res., 8, 275–284, https://doi.org/10.1016/j.apr.2016.09.005, 2017.
Ran, L., Gilliam, R., Binkowski, F. S., Xiu, A., Pleim, J., and Band, L.: Sensitivity of the Weather Research and Forecast/Community Multiscale Air Quality modeling system to MODIS LAI, FPAR, and albedo, J. Geophys. Res.-Atmos., 120, 8491–8511, https://doi.org/10.1002/2015jd023424, 2015.
Reis, S., Pinder, R. W., Zhang, M., Lijie, G., and Sutton, M. A.: Reactive nitrogen in atmospheric emission inventories, Atmos. Chem. Phys., 9, 7657–7677, https://doi.org/10.5194/acp-9-7657-2009, 2009.
Sanderson, M. G., Dentener, F. J., Fiore, A. M., Cuvelier, C., Keating, T. J., Zuber, A., Atherton, C. S., Bergmann, D. J., Diehl, T., Doherty, R. M., Duncan, B. N., Hess, P., Horowitz, L. W., Jacob, D., Jonson, J.-E., Kaminski, J. W., Lupu, A., Mackenzie, I. A., Marmer, E., Montanaro, V., Park, R., Pitari, G., Prather, M. J., Pringle, K. J., Schroeder, S., Schultz, M. G., Shindell, D. T., Szopa, S., Wild, O., and Wind, P.: A multi-model source-receptor study of the hemispheric transport and deposition of oxidised nitrogen, Geophys. Res. Lett., 35, L17815, https://doi.org/10.1029/2008GL035389, 2008.
Savva, Y. and Berninger, F.: Sulphur deposition causes a large-scale growth decline in boreal forests in Eurasia, Global Biogeochem. Cy., 24, GB3002, https://doi.org/10.1029/2009GB003749, 2010.
Schwede, D. B. and Lear, G. G.: A novel hybrid approach for estimating total deposition in the United States, Atmos. Environ., 92, 207–220, https://doi.org/10.1016/j.atmosenv.2014.04.008, 2014.
Sickles II, J. E. and Shadwick, D. S.: Seasonal and regional air quality and atmospheric deposition in the eastern United States, J. Geophys. Res., 112, D17302, https://doi.org/10.1029/2006JD008356, 2007a.
Sickles II, J. E. and Shadwick, D. S.: Changes in air quality and atmospheric deposition in the eastern United States: 1990–2004, J. Geophys. Res., 112, D17301, https://doi.org/10.1029/2006JD007843, 2007b.
Sickles II, J. E. and Shadwick, D. S.: Air quality and atmospheric deposition in the eastern US: 20 years of change, Atmos. Chem. Phys., 15, 173–197, https://doi.org/10.5194/acp-15-173-2015, 2015.
Simkin, S. M., Allen, E. B., Bowman, W. D., Clark, C. M., Belnap, J., Brooks, M. L., Cade, B. S., Collins, S. L., Geiser, L. H., Gilliam, F. S., Jovan, S. E., Pardo, L. H., Schulz, B. K., Stevens, C. J., Suding, K. N., Throop, H. L., and Waller, D. M.: Conditional vulnerability of plant diversity to atmospheric nitrogen deposition across the United States, P. Natl. Acad. Sci. USA, 113, 4086–4091, https://doi.org/10.1073/pnas.1515241113, 2016.
Simon, H., Reff, A., Wells, B., Xing, J., and Frank, N.: Ozone trends across the United States over a period of decreasing NOx and VOC emissions, Environ. Sci. Technol., 49, 186–195, https://doi.org/10.1021/es504514z, 2015.
Smith, S. J., van Aardenne, J., Klimont, Z., Andres, R. J., Volke, A., and Delgado Arias, S.: Anthropogenic sulfur dioxide emissions: 1850–2005, Atmos. Chem. Phys., 11, 1101–1116, https://doi.org/10.5194/acp-11-1101-2011, 2011.
Stevens, C. J., Dise, N. B., Mountford, J. O., and Gowing, D. J.: Impact of Nitrogen Deposition on the Species Richness of Grasslands, Science, 303, 1876–1879, https://doi.org/10.1126/science.1094678, 2004.
Sun, K., Tao, L., Miller, D. J., Pan, D., Golston, L. M., Zondlo, M. A., Griffin, R. J., Wallace, H. W., Leong, Y. J., Yang, M. M., Zhang, Y., Mauzerall, D. L., and Zhu, T.: Vehicle Emissions as an Important Urban Ammonia Source in the United States and China, Environ. Sci. Technol., 51, 2472–2481, https://doi.org/10.1021/acs.est.6b02805, 2017.
Sun, J., Fu, J. S., Lynch, J. A., Huang, K., and Gao, Y.: Climate-driven exceedance of total (wet + dry) nitrogen (N) + sulfur (S) deposition to forest soil over the conterminous U.S, Earths Future, 5, 560–576, https://doi.org/10.1002/2017ef000588, 2017.
Vet, R., Artz, R. S., Carou, S., Shaw, M., Ro, C.-U., Aas, W., Baker, A., Bowersox, V. C., Dentener, F., Galy-Lacaux, C., Hou, A., Pienaar, J. J., Gillett, R., Forti, M. C., Gromov, S., Hara, H., Khodzher, T., Mahowald, N. M., Nickovic, S., Rao, P. S. P., and Reid, N. W.: A global assessment of precipitation chemistry and deposition of sulfur, nitrogen, sea salt, base cations, organic acids, acidity and pH, and phosphorus, Atmos. Environ., 93, 3–100, https://doi.org/10.1016/j.atmosenv.2013.10.060, 2014.
Warner, J. X., Dickerson, R. R., Wei, Z., Strow, L. L., Wang, Y., and Liang, Q.: Increased atmospheric ammonia over the world's major agricultural areas detected from space, Geophys. Res. Lett., 44, 2875–2884, https://doi.org/10.1002/2016gl072305, 2017.
Wong, D. C., Pleim, J., Mathur, R., Binkowski, F., Otte, T., Gilliam, R., Pouliot, G., Xiu, A., Young, J. O., and Kang, D.: WRF-CMAQ two-way coupled system with aerosol feedback: software development and preliminary results, Geosci. Model Dev., 5, 299–312, https://doi.org/10.5194/gmd-5-299-2012, 2012.
Xing, J., Pleim, J., Mathur, R., Pouliot, G., Hogrefe, C., Gan, C.-M., and Wei, C.: Historical gaseous and primary aerosol emissions in the United States from 1990 to 2010, Atmos. Chem. Phys., 13, 7531–7549, https://doi.org/10.5194/acp-13-7531-2013, 2013.
Xing, J., Mathur, R., Pleim, J., Hogrefe, C., Gan, C.-M., Wong, D. C., Wei, C., Gilliam, R., and Pouliot, G.: Observations and modeling of air quality trends over 1990–2010 across the Northern Hemisphere: China, the United States and Europe, Atmos. Chem. Phys., 15, 2723–2747, https://doi.org/10.5194/acp-15-2723-2015, 2015a.
Xing, J., Mathur, R., Pleim, J., Hogrefe, C., Gan, C.-M., Wong, D. C., and Wei, C.: Can a coupled meteorology-chemistry model reproduce the historical trend in aerosol direct radiative effects over the Northern Hemisphere?, Atmos. Chem. Phys., 15, 9997-10018, https://doi.org/10.5194/acp-15-9997-2015, 2015b.
Xu, W., Luo, X. S., Pan, Y. P., Zhang, L., Tang, A. H., Shen, J. L., Zhang, Y., Li, K. H., Wu, Q. H., Yang, D. W., Zhang, Y. Y., Xue, J., Li, W. Q., Li, Q. Q., Tang, L., Lu, S. H., Liang, T., Tong, Y. A., Liu, P., Zhang, Q., Xiong, Z. Q., Shi, X. J., Wu, L. H., Shi, W. Q., Tian, K., Zhong, X. H., Shi, K., Tang, Q. Y., Zhang, L. J., Huang, J. L., He, C. E., Kuang, F. H., Zhu, B., Liu, H., Jin, X., Xin, Y. J., Shi, X. K., Du, E. Z., Dore, A. J., Tang, S., Collett Jr., J. L., Goulding, K., Sun, Y. X., Ren, J., Zhang, F. S., and Liu, X. J.: Quantifying atmospheric nitrogen deposition through a nationwide monitoring network across China, Atmos. Chem. Phys., 15, 12345–12360, https://doi.org/10.5194/acp-15-12345-2015, 2015.
Zhang, L., Jacob, D. J., Knipping, E. M., Kumar, N., Munger, J. W., Carouge, C. C., van Donkelaar, A., Wang, Y. X., and Chen, D.: Nitrogen deposition to the United States: distribution, sources, and processes, Atmos. Chem. Phys., 12, 4539–4554, https://doi.org/10.5194/acp-12-4539-2012, 2012.
Zhao, Y., Duan, L., Xing, J., Larssen, T., Nielsen, C. P., and Hao, J. M.: Soil Acidification in China: Is Controlling SO2 Emissions Enough?, Environ. Sci. Technol., 43, 8021–8026, https://doi.org/10.1021/es901430n, 2009.
Zhao, Y. H., Zhang, L., Pan, Y., Wang, Y., Paulot, F., and Henze, D. K.: Atmospheric nitrogen deposition to the northwestern Pacific: seasonal variation and source attribution, Atmos. Chem. Phys., 15, 10905–10924, https://doi.org/10.5194/acp-15-10905-2015, 2015.
Zhao, Y. H., Zhang, L., Chen, Y., Liu, X., Xu, W., Pan, Y., and Duan, L.: Atmospheric nitrogen deposition to China: A model analysis on nitrogen budget and critical load exceedance, Atmos. Environ., 153, 32–40, https://doi.org/10.1016/j.atmosenv.2017.01.018, 2017.