the Creative Commons Attribution 4.0 License.
the Creative Commons Attribution 4.0 License.
 | 28 Jun 2018
Light absorption of brown carbon in eastern China based on 3-year multi-wavelength aerosol optical property observations and an improved absorption Ångström exponent segregation method
Jiaping Wang
Wei Nie
Yafang Cheng
Yicheng Shen
Xuguang Chi
Jiandong Wang
Xin Huang
Yuning Xie
Zheng Xu
Ximeng Qi
Brown carbon (BrC), a certain group of organic carbon (OC) with strong absorption from the visible (VIS) to ultraviolet (UV) wavelengths, makes a considerable contribution to light absorption on both global and regional scales. A high concentration and proportion of OC has been reported in China, but studies of BrC absorption based on long-term observations are rather limited in this region. In this study, we reported 3-year results of light absorption of BrC based on continuous measurement at the Station for Observing Regional Processes of the Earth System (SORPES) in the Yangtze River Delta, China, combined with Mie theory calculation. Light absorption of BrC was obtained using an improved absorption Ångström exponent (AAE) segregation method. The AAE of non-absorbing coated black carbon (BC) at each time step is calculated based on Mie theory simulation, together with single particle soot photometer (SP2) and aethalometer observations. By using this improved method, the variation of the AAE over time is taken into consideration, making it applicable for long-term analysis. The annual average light absorption coefficient of BrC (babs_BrC) at 370 nm was 6.3 Mm−1 at the SORPES station. The contribution of BrC to total aerosol absorption (PBrC) at 370 nm ranged from 10.4 to 23.9 % (10th and 90th percentiles, respectively), and reached up to ∼ 33 % in the open-biomass-burning-dominant season and winter. Both babs_BrC and PBrC exhibited clear seasonal cycles with two peaks in later spring/early summer (May–June, babs_BrC ∼ 6 Mm−1, PBrC ∼ 17 %) and winter (December, babs_BrC ∼ 15 Mm−1, PBrC ∼ 22 %), respectively. Lagrangian modeling and the chemical signature observed at the site suggested that open biomass burning and residential coal/biofuel burning were the dominant sources influencing BrC in the two seasons, respectively.
- Article
(2823 KB) -
Supplement
(1113 KB) - BibTeX
- EndNote


Atmospheric aerosols not only cause adverse impacts on human health, but they also alter earth's radiation balance through their strong light scattering and absorption, substantially influencing regional and even global climate change (IPCC, 2013; Dockery et al., 1993; Wang et al., 2017b). Light absorption of aerosols strongly influences the magnitude and sign of radiative transfer. Black carbon (BC) and dust have been considered to be two dominant contributors to aerosol absorption extinction. However, a certain type of organic aerosol defined as brown carbon (BrC) was revealed to be of strong light-absorbing efficiency (Formenti et al., 2003; Pöschl, 2003; Andreae and Gelencser, 2006; Kirchstetter et al., 2004; Mukai and Ambe, 1986; Patterson and McMahon, 1984), which can cause perturbations on radiation transfer similar to BC. This implies that the aerosol cooling effect could be overestimated by ignoring the light absorption from BrC. Its strong light absorption in the ultraviolet (UV) range can also affect atmospheric oxidizing capacity by restraining the photolysis rates for photochemically active gases (Laskin et al., 2015). It has been reported that the radiative forcing by BrC globally is about one-quarter of that by BC (Feng et al., 2013), while regional radiative forcing by BrC in areas with intensive combustion activities (e.g., South and East Asia, South America and Africa) can be much higher than the global average, indicating the substantial contribution by BrC to aerosol light absorption in these regions and thereby its significant influence on regional climate change. Therefore, investigation on the BrC contribution to light absorption is of great importance to reduce the uncertainties of the aerosol–radiation interaction (ARI) estimation.
BrC is defined as a type of organic carbon which can absorb solar radiation efficiently in the near-UV (300–400 nm) to the visible (VIS) range (Formenti et al., 2003; Pöschl, 2003; Andreae and Gelencser, 2006; Kirchstetter et al., 2004; Mukai and Ambe, 1986; Patterson and McMahon, 1984). It is a group of species with specific physical properties but detailed chemical components that are difficult to characterize. BrC can be produced not only from primary emissions relating to biomass burning (BB) and fuel combustion, but also from secondary organic aerosol (SOA) formation through the oxidation of volatile organic compounds (VOCs) (Andreae and Gelencsér, 2006; Saleh et al., 2014; Chen and Bond, 2010; Lack et al., 2012; Laskin et al., 2015; Healy et al., 2015). Some studies reported that vehicle and ship emissions may also be sources of BrC (Stone et al., 2009; Cavalli et al., 2004). The complication of the emitted mixtures containing BC, BrC, non-absorbing organic aerosol and inorganic materials in different proportions makes it difficult to perform source attribution and to estimate its emission factor.
Light absorption of BrC is usually estimated based on its strong wavelength dependence with higher absorption from the VIS to the UV range. The wavelength dependence of the aerosol absorption coefficient (babs) is normally represented by the absorption Ångström exponent (AAE), and its relationship with babs is (Moosmüller et al., 2011; Sun et al., 2007). Based on the difference of wavelength dependence for BC and BrC, previous studies segregated light absorption of BrC from multi-wavelength optical measurements (Lack and Langridge, 2013; Mohr et al., 2013; Shen et al., 2017), which is called the AAE method. Earlier, the similar concept was used to segregate carbonaceous aerosol fractions from different emission sources based on their difference in AAE value (e.g., wood burning and traffic emission) (Sandradewi et al., 2008; Healy et al., 2012). Usually, the AAE of BC (AAEBC) was set to be 1.0 based on the properties of bulk BC by many previous studies, assuming the unity of AAEBC between any two wavelengths within the UV to the near-infrared (IR) range (Shen et al., 2017; Olson et al., 2015; Lack and Langridge, 2013). However, large uncertainty was mentioned by Lack and Langridge (2013) when using this assumption, and also this method can only be used when the proportion of BrC is high. Moreover, it is noticed that the AAE of BC is not always 1.0; instead, it can be affected by particle size and mixing state (Lack and Cappa, 2010; Liu et al., 2015, 2014).
China, the largest country in East Asia, with tremendous fossil fuel and biofuel consumption and extensive agricultural burning, is of great concern in terms of its large contribution of carbonaceous aerosols including light-absorbing carbon (BC, BrC) (Ding et al., 2016a). The BC issue has been noticed in recent years in China, including its temporal variations, emission sources and climate effect (Cao et al., 2006, 2009; Yang et al., 2009; Wang et al., 2017a; Huang et al., 2014) as well as its “dome effect” in modifying the boundary layer and enhancing haze pollution in megacities (Ding et al., 2016b; Wang et al., 2018). Organic matter (OM) is a large contributor to PM2.5 in China (15–51 % of PM2.5; Wang et al., 2017c), especially in the Yangtze River Delta (YRD) region, which is one of the most densely populated city clusters in eastern China and also an important agricultural center, with crops planted in both cold and warm seasons (Ding et al., 2013a). In the YRD region, the OM fraction is 20–40 % of PM2.5 (Wang et al., 2017c, b) due to the influence of complicated combustion sources; therefore, it is a highly possible that BrC is a contributor to aerosol light absorption in this region. However, studies concerning BrC in China, especially in the YRD region, have still been limited up to now. Yuan et al. (2016) reported light absorption contributions of BrC in the Pearl River Delta (PRD) region to be 6.3 to 12.1 % at 405 nm in autumn and winter campaigns by using the AAE method. Shen et al. (2017) conducted light absorption measurements in Xi'an in summer and winter, and reported the average babs_BrC_370 of 6.4 and 43.0 Mm−1 in the two seasons, respectively, based on the AAE method. Yang et al. (2009) calculated the mass absorption efficiency of BrC at 370 nm to be 2.2 m2 g−1 and the AAE of BrC to be 3.5, respectively, during a campaign in March 2015 at Xianghe in northern China. It is noticed that long-term investigation of BrC light absorption in the YRD region has not been reported yet.
This study intends to provide a comprehensive analysis of light-absorbing characteristics of BrC and its influencing factors based on field measurements of multi-wavelength aerosol light absorption at the Station for Observing Regional Processes of the Earth System (SORPES) station in Nanjing in the western YRD region and an improved AAE segregation method based on Mie theory simulation and BC single particle measurements. The contribution of BrC to light absorption is estimated based on 3-year observations, and the potential sources of BrC in typical seasons are discussed.
2.1 Measurements of optical properties and relevant species
Field observation was conducted at the SORPES station, located on top of a small hill (118∘57′10 E, 32∘07′14 N; 40 m a.s.l.) in the Xianlin campus of Nanjing University (Shen et al., 2018; Ding et al., 2013c, 2016a). The SORPES station is a research and experiment platform in the western YRD, which is influenced by intensive human activities (Ding et al., 2016a). This observation site is about 20 km east of the city center. The map and emission characteristics surrounding the site were given in our previous works (e.g., Ding et al., 2013c, 2016a). Since this observation site is generally upwind from the city center and influenced by the East Asian monsoon, this site is generally downwind of a densely populated city cluster including the megacity of Shanghai. Therefore, this station can be considered as a regional background station in the western YRD region and is an ideal site to study the impact of multiple anthropogenic emissions on regional air quality in eastern China (Ding et al., 2016a, 2013c).
Aerosol optical properties were measured from 1 June 2013 to 31 May 2016. Aerosol light absorption measurements were conducted using a multi-wavelength aethalometer (Model AE-31, Magee Scientific Company Berkeley, California, USA), which performs continuous measurements at seven wavelengths, i.e., 370 nm in the UV wavelength range, 470, 520, 590, 660 and 880 nm in the VIS wavelength range and 950 nm in the IR wavelength range. The time resolution is 5 min. Sample air was obtained through a stainless-steel inlet with a PM2.5 cut cyclone (Very Sharp Cut Cyclone, VSCC, BGI Inc.) to avoid the impact of coarse-mode particles (e.g., dust), protected with a rain cap. The sample flow rate of the aethalometer was set to 5.0 liter per minute (L min−1). In this study, the measurements at 370, 520 and 880 nm were used for further analysis. The wavelength of 370 nm was used because studies have found that BrC shows strong light absorption in the near-UV wavelength range (Andreae and Gelencsér, 2006; Hansen and Schnell, 2005). Measurement data at the wavelength of 880 nm were chosen because light absorption at this wavelength normally represents the BC absorption (Virkkula et al., 2015). Regarding the wavelength dependence analysis of BC and BrC, the wavelength near 880 nm is better for the calculation of the AAE of BC because BC is the dominant absorption components in that wavelength range. However, the response of the 590 and 660 nm data may be affected by the presence of interfering materials such as hematite mineral dust and tobacco smoke (user manual of aethalometer AE-31, Hansen and Schnell, 2005); hence 520 nm data were used for the following calculations. Light scattering coefficients at three wavelengths (450, 525 and 635 nm) were measured by an integrating nephelometer (Aurora 3000, Ecotech). Sample air passed through a stainless tube with a rain cap and an external heater. In order to maintain sample air at low humidity (RH < 50 %), an internal heater was used. For those data with RH exceeding 50 % due to the malfunction of the heater, scattering coefficients were corrected for hygroscopic growth (Zhang et al., 2015). The light absorption coefficient (babs) at each wavelength λ was calculated using the method presented by Collaud Coen et al. (2010) to correct the systematic errors of filter-based absorption measurements. The attenuation coefficient bATN at each wavelength λ is firstly calculated from
where A and Q represent the spot size and flow rate, respectively. ΔATN(λ) is the attenuation change in a time step Δt. The babs at wavelength λ is then obtained after correction for a filter-loading effect, an embedded aerosol scattering effect and a multiple scattering effect by the filter fiber. The correction is performed using the Collaud Coen correction algorithm, with Schmid scattering correction adopted (Schmid et al., 2006; Collaud Coen et al., 2010). The equation can be presented as
where R is the function for the filter-loading correction calculated using the equation from Collaud Coen et al. (2010, Eq. 13). Cscat represents the aerosol scattering correction. To calculate Cscat, light scattering coefficients and scattering Ångström exponents measured by the nephelometer are used to obtain scattering at the aethalometer wavelengths, and the constants to calculate Cscat are taken from Arnott et al. (2005). Detailed calculation equations of R and Cscat can be found in Collaud Coen et al. (2010). Cref is the multiple scattering correction factor, which is set to be 4.26 according to Collaud Coen et al. (2010). A comparison of different aethalometer correction algorithms (Saturno et al., 2017) shows that the AAE derived by the Collaud Coen correction algorithm agrees well with that from multi-wavelength reference measurements, proving the reliable AAE values from this correction. The Collaud Coen correction also shows a good performance in obtaining absorption coefficients at 370 nm (Saturno et al., 2017), which is the critical wavelength in BrC segregation. Absorption coefficients are presented under standard temperature and pressure (STP, i.e., 273.15 K, 1013 hPa).
Size distribution and mixing states of refractory BC were measured using the single particle soot photometer (SP2, Droplet Measurement Technologies, USA). The operation mechanism of SP2 has been described well in previous studies (Stephens et al., 2003; Schwarz et al., 2006, 2008). SP2 uses a laser-induced incandescence technique equipped with a Nd:YAG laser (λ=1064 nm) and optical detectors to quantify the size of a single particle by detecting scattering and a laser-induced incandescence signal. The mass of refractory BC can be determined by its nearly linear relationship with the peak height of the incandescence signal. The incandescence response of SP2 was calibrated using fullerene soot with a known mobility diameter selected by DMA (Gysel et al., 2011). The mass of fullerene soot was calculated using size-resolved effective density presented by Gysel et al. (2011). For pure scattering particles, the peak height of the scattering signal is linearly proportional to the particle scattering cross section. As for BC-containing particles, due to the loss of coating and the vaporization of the BC core when the particle passes through the laser beam, the scattering signal is different from the original particle. To determine the scattering cross section of BC-containing particles and saturated scattering particles, the leading-edge-only (LEO) fit method developed by Gao et al. (2007) was adopted. Dp of BC was then estimated by using the core-shell Mie model, assuming a BC core and shell refractive index of 2.26−1.26i (Moteki et al., 2010) and 1.52−0i (Pitchford et al., 2007), respectively. The scattering signal was calibrated using polystyrene latex (PSL) spheres with known sizes. The detection range of the BC core is 80–600 nm, assuming a density of 1.8 g cm−3 (Bond and Bergstrom, 2006). In this study, the four measurement periods are 20 May–12 June 2016, 8–31 August 2017, 1–30 November 2017 and 1–28 February 2018, representing spring, summer, autumn and winter, respectively.
In the present study, water-soluble ions (K+, Cl−) were measured by the Monitor for Aerosols and Gases in Air (MARGA, Metrohm Co.); PM2.5 and meteorological data were used for further supporting discussions. More detailed descriptions of these measurements can be found in Ding et al. (2013b, c, 2016a).
2.2 Optical calculation
It has been proved that BrC shows strong light absorbance in the UV–VIS wavelength range. To quantify the light absorption of BrC based on optical measurement results, the AAE segregation method is used (Lack and Langridge, 2013; Mohr et al., 2013). Light absorption of BrC is calculated as the result of babs minus the light absorption coefficient of BC (babs_BC) at 370 nm. Here babs_BC_370 is defined as the absorption coefficient of pure BC or BC with non-absorbing coating at 370 nm, and babs_BrC is obtained from total absorption at 370 nm deducting absorption of the BC core and lensing effects, as the following equation shows:
where babs_370 and babs_880 represent the absorption coefficients at 370 and 880 nm, respectively, which are calculated from the light absorption measurement data. AAEBC520–880 and AAEBC370–520 stand for the AAEs of pure BC and BC with non-absorbing coating at long and short wavelength ranges. We calculate AAEBC520–880 and AAEBC370–520 from SP2 data using the core-shell Mie model, which has been widely applied in BC-related studies (Bond and Bergstrom, 2006). It is mentioned that BC morphology can affect the AAE (Liu et al., 2015) and it is possible to overestimate BrC absorption; however, the complex morphology can vary with time and currently it is hard to evaluate its quantitative effect. Also, this site is a regional background station influenced more by aged air plumes (Ding et al., 2016a); therefore here we implement the core-shell model. The AAE at two wavelengths is calculated as the following equation:
As mentioned above, an AAE value of 1.0 was adopted for BC by many researchers. However, AAEBC can vary with BC core size, coating thickness, morphology, etc. Evidence has shown that the AAE of pure BC cores can be lower than 1.0 as the diameter is out of the range of Rayleigh theory, and that BC with a clear shell might have an AAE higher than 1.0 (Bond et al., 2013; Lack and Cappa, 2010; Gyawali et al., 2009). It is also observed at the SORPES station that AAE520–880, which is expected to be mainly affected by BC absorption, is not always 1.0 and exhibits clear seasonal and diurnal variations (Shen et al., 2018). Hence, assuming an AAEBC of 1.0 in the estimation of BrC may induce large uncertainties or bias (comparison of calculated babs_BrC assuming AAEBC=1.0 versus the modified method will be discussed later). Therefore, it is essential to firstly evaluate the quantitative impacts of BC size and coating on the AAE value and determine the proper AAEBC for more accurate babs_BrC calculation.
Based on the core-shell Mie theory model, we conducted a series of calculations to discuss the variation pattern of the AAE for BC-containing particles (Bohren and Huffman, 1983). We used Christian Mätzler's code (Mätzler, 2002) for Mie calculations of spherical particles at different wavelengths.
Mie theory simulations were conducted firstly for monodispersed particles. Here particle core diameter (Dc) is defined as the diameter of the core alone, and the shell diameter (Dp) refers to the total particle diameter. Coating thickness was represented using Dp∕Dc. Dc increases from 1 to 200 nm with a 1 nm interval, and Dp∕Dc was set to be 1.0–3.0 with 100 bins. The refractive index (RI) of the BC core was set to be 1.56−0.47i according to Dalzell and Sarofim (1969), and it was 1.52−0i for a clear shell (Pitchford et al., 2007).
Figure 1 shows the variations of AAEBC370–520 and AAEBC520–880, with Dc and Dp∕Dc of monodispersed BC-containing particles. The black dashed lines in the figure illustrate the Dc and Dp∕Dc value range, whereby BC is mostly distributed at the SORPES station (shown in Fig. 2). Within this range, it can be found that AAEBC370–520 and AAEBC520–880 mainly exhibit a deceasing pattern as Dc increases but with a different amplitude. Taking pure BC as an example, AAEBC370–520 decreases from 1.1 to 0.6 as Dc increases from 80 to 180 nm, while AAEBC520–880 decreases from 1.2 to 1.0 as Dc increases. While as Dp∕Dc grows, the AAE of BC shows a non-monotonous variation trend. For Dc=100 nm, as Dp∕Dc grows from 1 to 3, AAEBC370–520 first increases from 1.0 to 1.3, peaks at and then decreases back to 1.0 at , while AAEBC520–880 increases with Dp∕Dc at Dc=100 nm. As for the magnitude of AAE, AAEBC370–520 is generally lower than AAEBC520–880 for BC with the same size and coating thickness. The above results suggest that the Dc and Dp∕Dc range of BC measured in this study are located in the regime in which AAEBC changes largely and non-monotonously. Moreover, in short- and long-wavelength ranges, AAEBC with the same BC size and coating thickness is also different. Therefore, instead of assuming the AAE to be a constant, real-time AAEBC determination is proposed in this study.

Figure 1Variation of absorption Ångström exponents between (a) 370 and 520 nm (AAEBC370–520) and between (b) 520 and 880 nm (AAEBC520–880) along with core diameter (Dc) and the coating thickness (Dp∕Dc) of clear (pure scattering) shell simulated with the core-shell Mie model. The refractive index (RI) of the BC core is set to be 1.56−0.47i according to Dalzell and Sarofim (1969) and 1.52−0i for a clear shell (Pitchford et al., 2007).
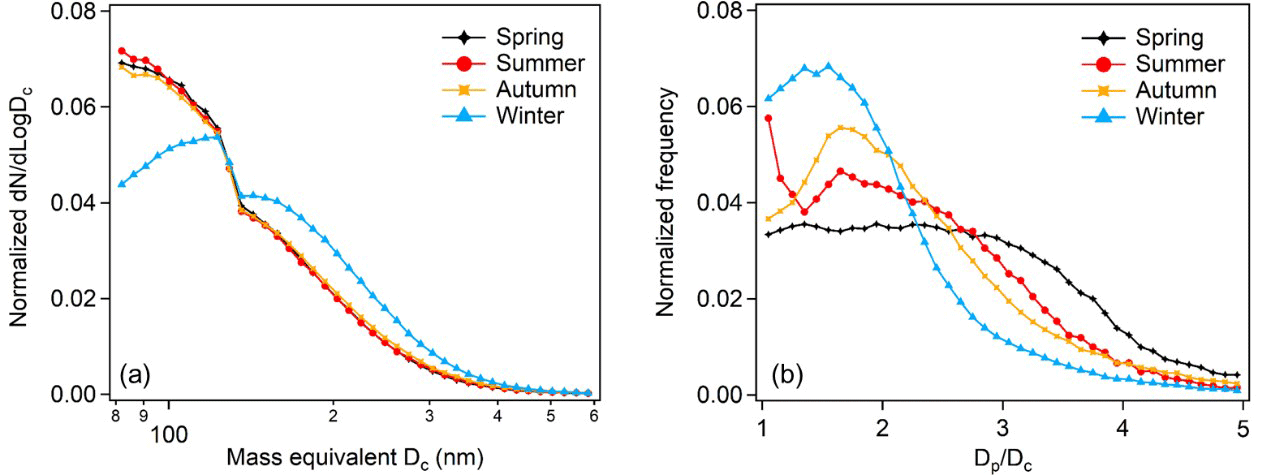
Figure 2Normalized number size distributions of (a) the BC core (Dc) and (b) Dp∕Dc of BC-containing particles from SP2 measurement in the four seasons.
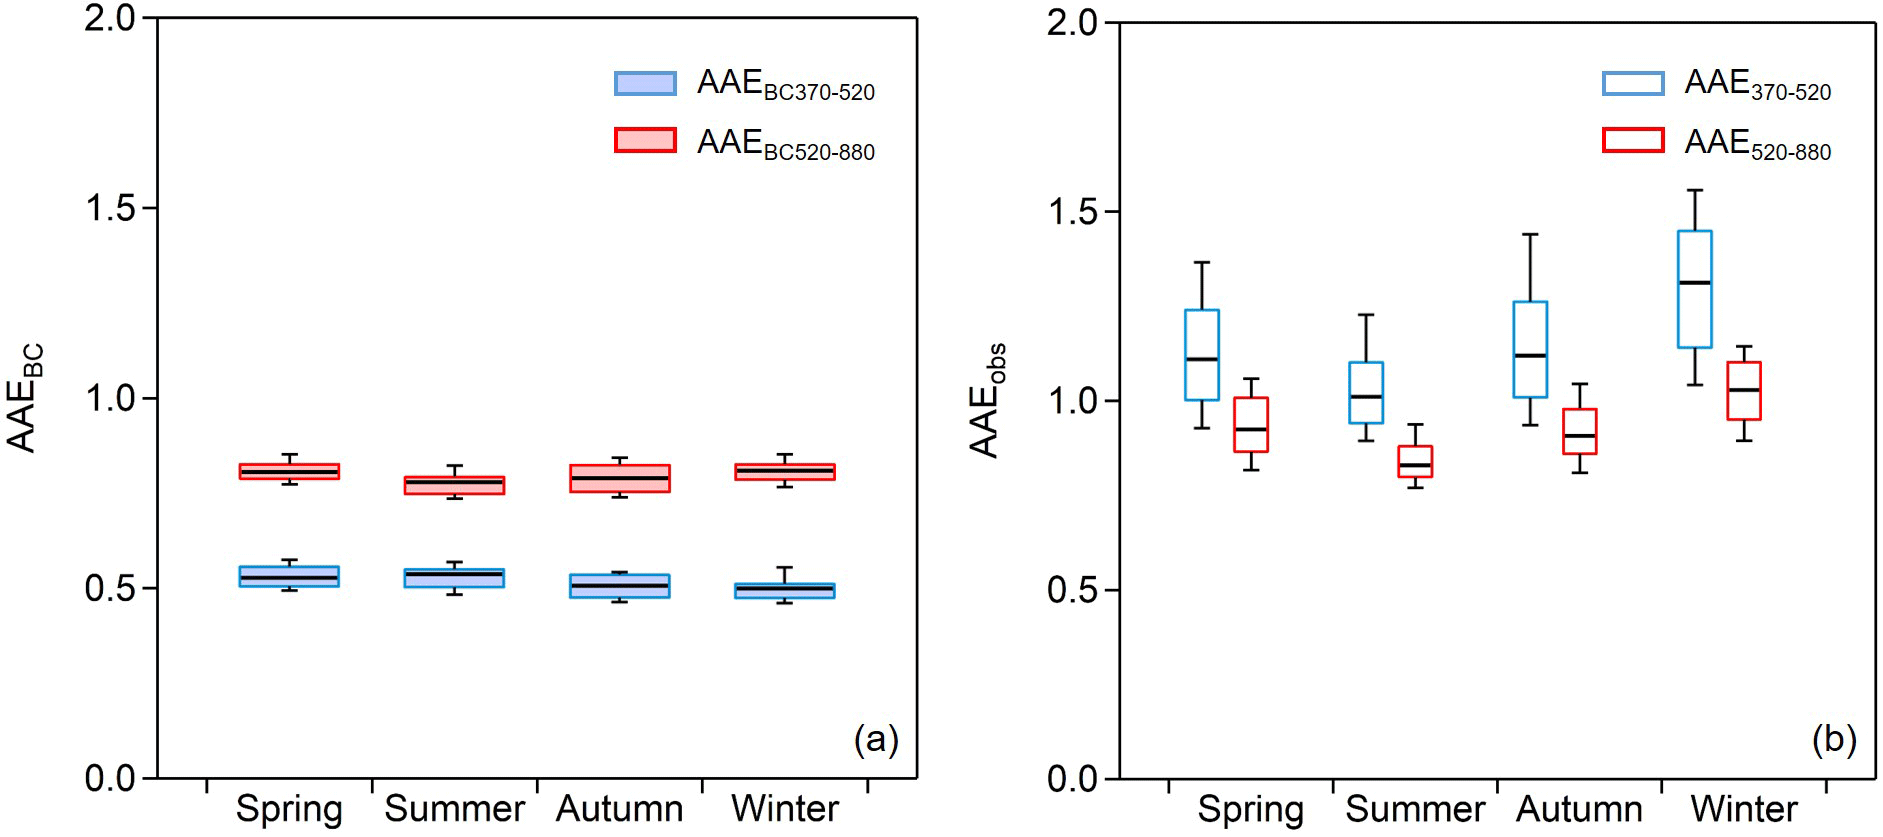
Figure 3(a) AAEBC370–520 and AAEBC520–880 in different seasons calculated using BC size distribution from SP2 and the core-shell Mie model. (b) AAE370–520 and AAE520–880 from observations using the aethalometer.
To explore the characteristics of AAEBC at short- and long-wavelength ranges at this observation site, we analyzed the size distribution and mixing state of BC measured by SP2 first. Figure 2 shows the overall Dc number size distribution and Dp∕Dc of BC-containing particles in the four seasons. It can be found that the number size distribution of BC cores in spring, summer and autumn shows a similar pattern. In winter, larger BC cores take up a higher proportion than other seasons. However, the coating thickness of BC is relatively lower in winter (peak number at Dp∕Dc ∼ 1.6), possibly due to low photochemical oxidation in this season. The coating thickness of BC is higher in spring than other seasons.
Based on the size and coating thickness of each BC-containing particle measured by SP2, babs was calculated using the core-shell Mie model. AAEBC370–520 and AAEBC520–880 were then derived, as Fig. 3a illustrates. It can be observed that the fluctuation of AAEBC at both short- and long-wavelength ranges in different seasons is not significant. Median values of AAEBC520–880 in spring, summer, autumn and winter are 0.80, 0.78, 0.79 and 0.81, respectively, and AAEBC370–520 median values are 0.53, 0.54, 0.51 and 0.50 in the four seasons. Moreover, for BC at this site, AAEBC370–520 is always lower than AAEBC520–880. Figure 3b shows the calculated AAE of particles measured by the aethalometer. The median values of AAE520–880 in the four seasons range from 0.83 to 1.03, while AAE370–520 shows a higher level and larger variation. The seasonal median values range from 1.00 to 1.31. Compared to Fig. 3a, it is noticed that observed AAE520–880 is comparable to AAEBC520–880, indicating that BC is the dominant absorbing component in this wavelength range. Contrarily, the difference between AAE370–520 and AAEBC370–520 is more obvious. Unlike AAEBC, AAE370–520 is higher than AAE520–880 in all seasons, indicating the possibility of the presence of other particle components with strong light absorption at a short wavelength range and a high AAE.
Since normally the SP2 is not used as a long-term continuous observation instrument, an alternative method to derive AAEBC is needed, especially for tracing back the historical level of BrC absorption without real-time SP2 measurement. As shown in Fig. 3, the difference between AAEBC370–520 and AAEBC520–880 at this site is not significant over time. Hence a correction factor RAAE is defined as the ratio of AAEBC370–520 to AAEBC520–880 calculated from SP2 data. Figure S2a (in the Supplement) illustrates the variation of RAAE. During the whole observation period, RAAE ranges between 0.60 and 0.69 (5th and 95th percentile), and the median value is 0.66, 0.69, 0.64 and 0.62 in spring, summer, autumn and winter, respectively. As mentioned above, AAE520–880 calculated from aethalometer data is approximately equal to AAEBC520–880 in the wavelength range in which the main absorber is BC (Lack and Langridge, 2013). Therefore, AAE520–880 is used to represent AAEBC520–880, and real-time AAEBC370–520 can be derived as Eq. (6).
Then, babs_BrC can be derived from Eqs. (4) and (6). Based on field observations at this site, we set RAAE as 0.65, which is the mean value of the whole time for the following calculation. To examine the sensitivity of babs_BrC to the RAAE value, we calculated babs_BrC using a different RAAE value. RAAE was set to be 0.1–1.0 with a 0.05 interval, and the overall average babs_BrC is plotted in Fig. S2b. The dashed lines are the lower and upper limits of RAAE (0.60 and 0.69, the 5th and 95th percentile) from SP2 measurement and the corresponding babs_BrC. Therefore, the shaded area represents the uncertainty range due to the different RAAE, which is approximately ±7 %. The time series of babs_BrC is shown in Fig. 4. Calculated babs_BrC using AAEBC=1.0 is also plotted in the figure as the black solid line. Also, as shown in Fig. 4, calculating babs_BrC assuming AAEBC=1 leads to a large number of negative values, especially when light absorption of BrC is low, while by using the modified method, long-term babs_BrC can be obtained with satisfactory data validity.
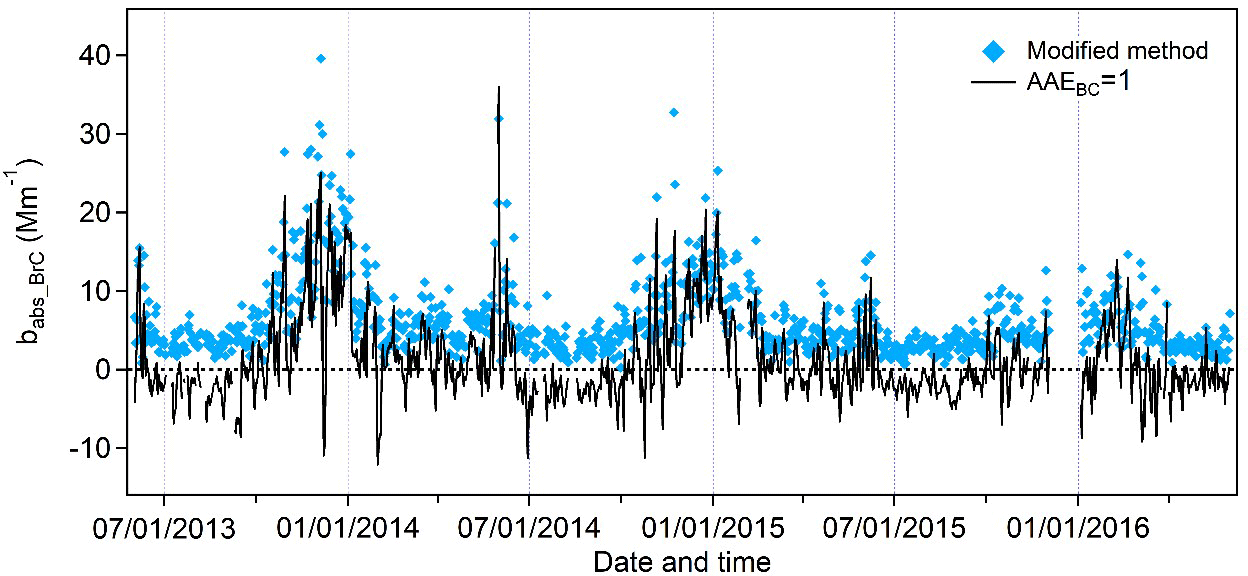
Figure 4Comparison between the time series of daily mean babs_BrC using the modified method and using AAEBC=1.0. The blue diamonds represent the calculation result using RAAE=0.65, which is the mean value from SP2 data. Calculated babs_BrC using AAEBC=1.0 is plotted by the black line.
Table 1Statistical summary of data measured at the SORPES station.

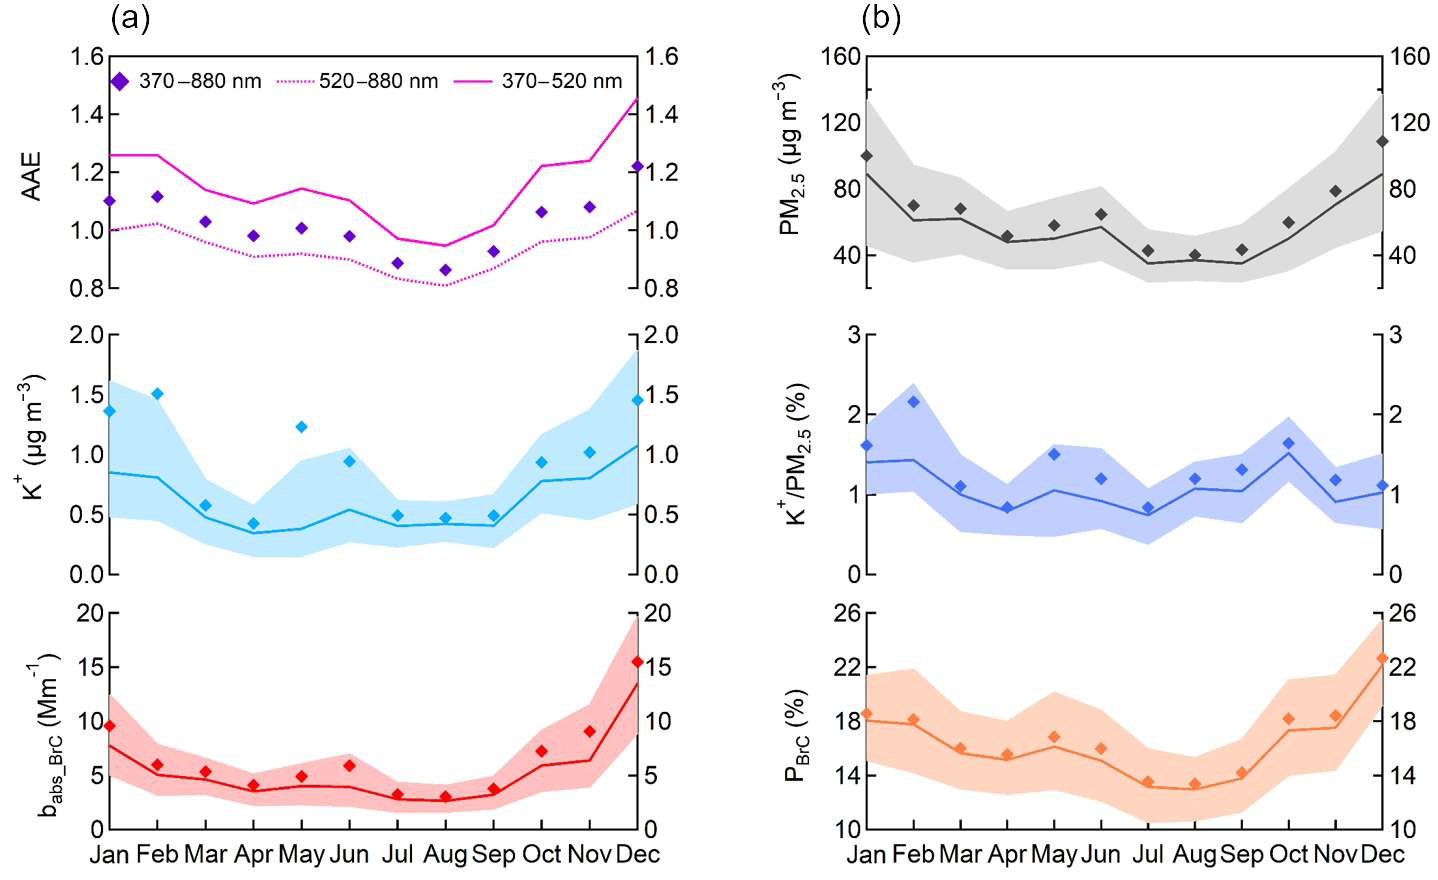
Figure 5Seasonal cycle of (a) babs_BrC, K+, and AAE at different wavelength ranges (AAE370–520, AAE370–880 and AAE370–880, shown by the solid line, dashed line and diamonds, respectively) and (b) PBrC, K+ ∕ PM2.5 and PM2.5. For babs_BrC, K+, PBrC, K+ ∕ PM2.5 and PM2.5 figures, bold solid lines represent median values, diamonds show the monthly averages and thin solid lines forming the shaded area are 25th and 75th percentiles.
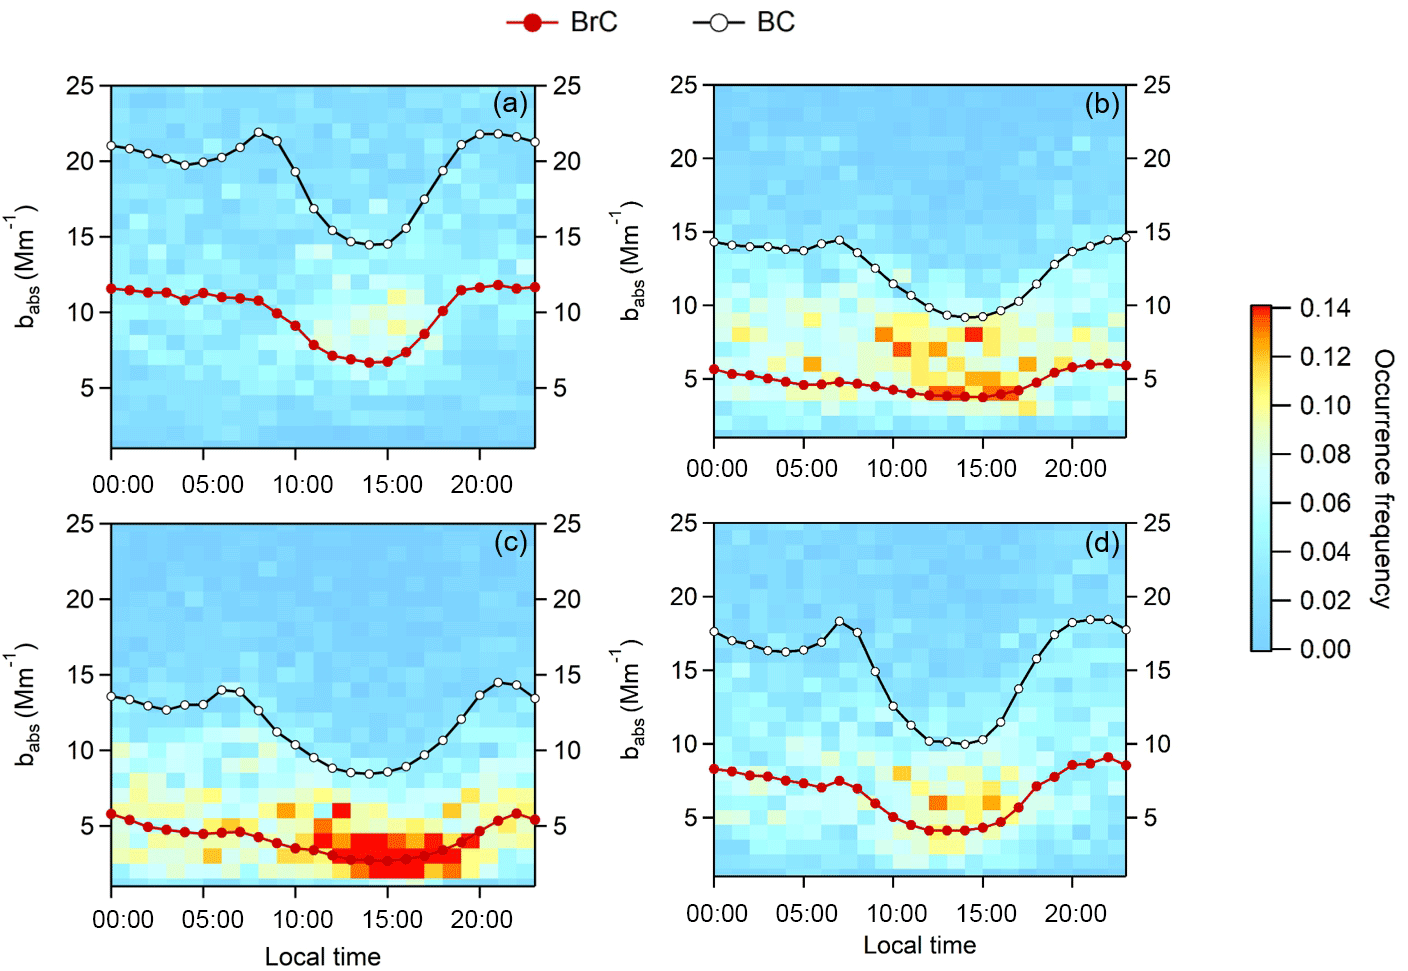
Figure 6Diurnal variations of babs_BrC and babs_BC in the four seasons of (a) winter, (b) spring, (c) summer, and (d) autumn, respectively. The plots show the occurrence frequencies of babs_BrC in each babs_BrC bin. The dark red and black circle lines represent the hourly mean babs_BrC and babs_BC, respectively.
Based on above results, babs_BrC was determined with a 1 h time interval following Eqs. (3) and (4). PBrC, defined as the contribution of light absorption by BrC at 370 nm (), was also calculated using the measurement data. A statistical overview is summarized in Table 1. Seasonal cycles of babs_BrC and PBrC are shown in Fig. 5, together with K+, K+ ∕ PM2.5, PM2.5 and AAE at different wavelength ranges. Firstly, it can be found that babs_BrC exhibits a distinct two-peak seasonal pattern, whereby the peak value occurs in June and December, with a mean babs_BrC of 5.9 and 15.5 Mm−1, respectively (Fig. 5a). It is also observed that babs_BrC during winter, especially December, is much higher than that in the other three seasons (2 to 3 times higher). PBrC also presents a two-peak seasonal trend, with the high PBrC months of May–June and December. The mean PBrC in winter and summer is 19.6 and 14.4 %, respectively, which is lower than that in Xi'an but higher than the PRD region (Shen et al., 2017; Yuan et al., 2016). The 95th percentile of PBrC can reach to 32 % in December, which certainly cannot be ignored in the light absorption estimation in the YRD region. Notably, PBrC has a similar seasonal variation pattern with K+, except in February when intensive fireworks during the Chinese New Year can lead to significantly high values of K+ concentrations. Moreover, AAE370–520 shows distinct seasonal variations, which has a much wider range of change, with 1st and 99th percentiles of 0.6 and 1.9 (Table 1), than that of AAE520–880. It is also noticed that the variation pattern of AAE370–520 is similar with K+. Since K+ is mainly emitted from primary combustion processes, the simultaneous variation of PBrC and AAE370–520 with K+ suggests that primary emissions are likely to make a considerable contribution to BrC in this area for the most of time.
Due to the distinct seasonal variation in babs_BrC observed at the SORPES station and its considerable contribution to the light absorption, it is essential to recognize the potential source areas and types of BrC in the YRD region. The diurnal variation of babs_BrC was compared to babs_BC in each season, shown in Fig. 6. Hourly mean values of babs_BrC and babs_BC are plotted. The reason to compare babs_BrC with babs_BC is that BC is one of the major light absorbers in the atmosphere and it is mostly from primary emission sources. Overall, babs_BrC shows quite a similar diurnal pattern to babs_BC in the four seasons, which is high during the night and starts decreasing after sunrise. This indicates that BrC at the site is also dominated by primary emissions. The lowest values occurred in the afternoon due to the development of the planetary boundary layer (PBL). It is observed that babs_BC exhibits clear morning peaks in all four seasons, suggesting that traffic exhaust is likely to be a considerable emission source of BC at this site. Compared to that, the morning peaks of babs_BrC in summer and autumn are less obvious than those of BC, while in winter and spring, the morning peaks are not noticeable. Such a difference reveals that during winter and spring, traffic emission is not the main contributor to local BrC.
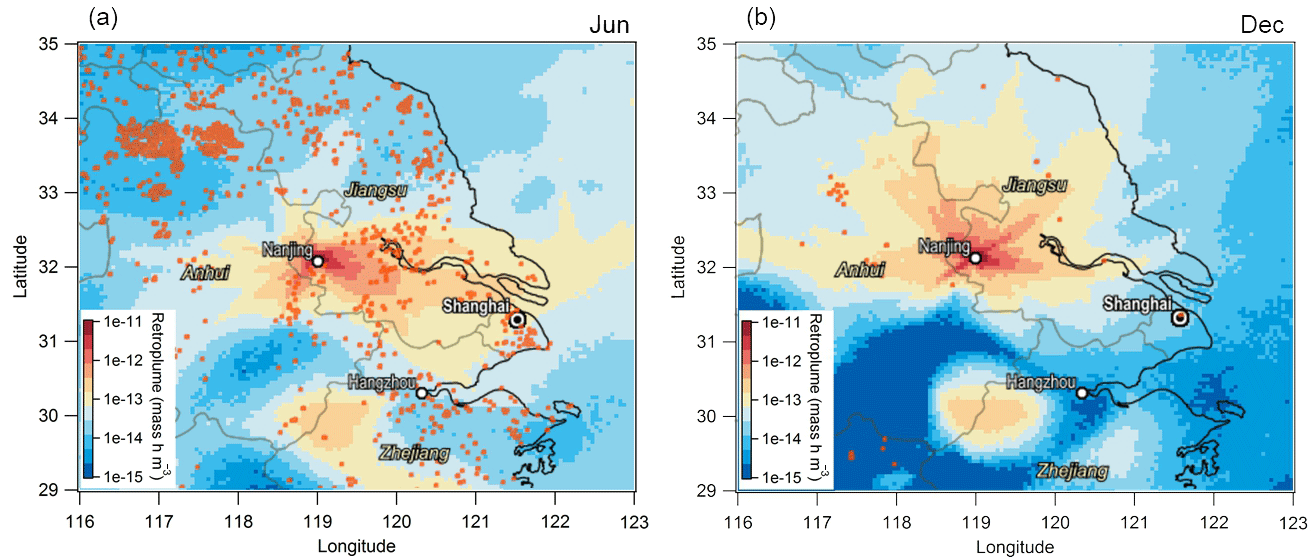
Figure 7Map of averaged 3-day backward retroplume and the fire counts for (a) June and (b) December in 2014. Fire count data are from the MODIS Collection 6 Active Fire Product provided by the NASA fire mapper (https://firms.modaps.eosdis.nasa.gov/map/, last access: 20 October 2017).
In order to investigate the potential source region of BrC at the SORPES station, Lagrangian particle dispersion modeling (LPDM) was conducted following the method developed by Ding et al. (2013b) by using the Hybrid Single-Particle Lagrangian Integrated Trajectory (HYSPLIT) model (Draxler and Hess, 1998; Stein et al., 2015). The meteorological data used in this model were GDAS (Global Data Assimilation System) data with a spatial resolution of 0.5∘ in both latitude and longitude. In each simulation, 3000 particles were released at an altitude of 100 m above ground level (Wang et al., 2017a) and backwardly run for a 3-day period, and then the retroplume, i.e., the footprint of the surface at 100 m, was obtained following the method of Ding et al. (2013b).
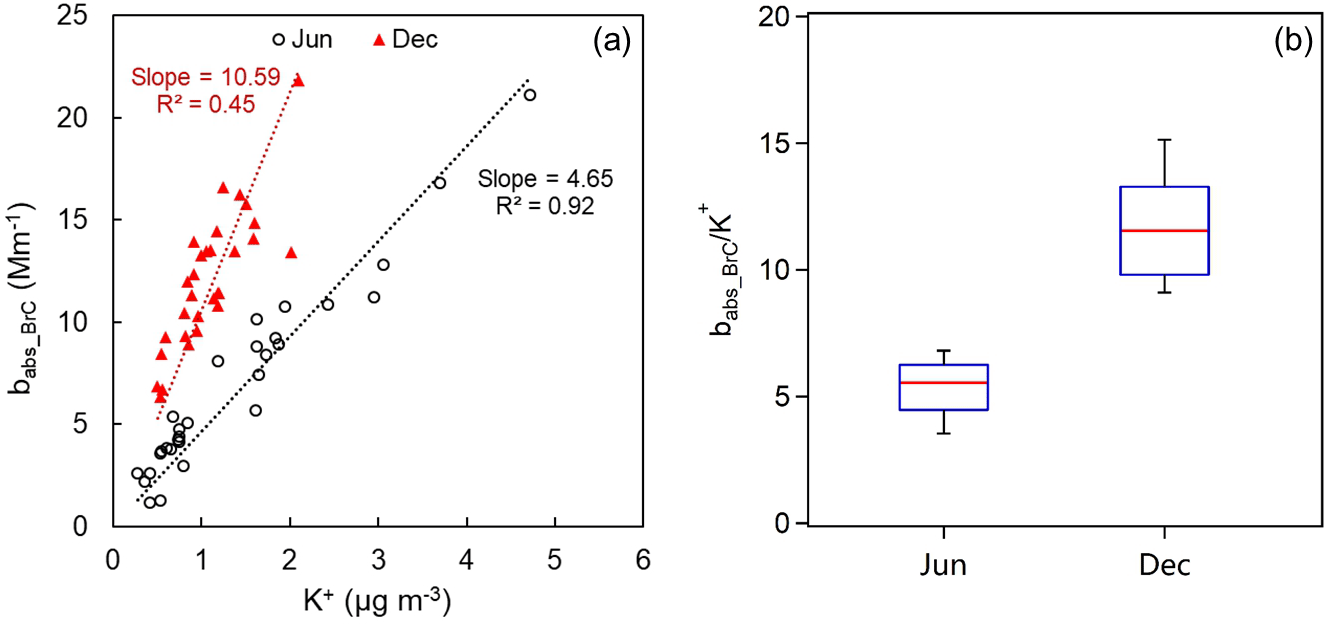
Figure 8(a) Correlations between daily average babs_BrC and K+ mass concentration in June (black circles) and December (red triangles) and (b) boxplot of babs_BrC ∕ K+ ratio in June and December (data are from the year 2014), where red lines represent the median value, blue boxes represent 25th and 75th percentile ranges and thin bars are 5th and 95th percentiles.
As shown in Fig. 5a, the two distinct peaks of babs_BrC are in June and December, respectively. It is then necessary to explore the possible emission sources in these 2 months. As mentioned before, since BrC is an operational definition, it is difficult to perform source apportionment for BrC. The feasible way to determine its sources is to compare the relationships between BrC and certain species that are possibly from the same emission sources. Since the emission of BrC is usually related to biomass burning (Laskin et al., 2015; Saleh et al., 2014), maps of fire counts in June and December of 2014 are presented in Fig. 7, together with the monthly averaged 3-day backward retroplume, in order to first diagnose whether the majority of air plumes pass through open burning areas in these 2 months. Then, correlations between babs_BrC and K+ in June and December were compared since K+ is normally considered to be a tracer of primary emission from BB (Ding et al., 2013a). The results are shown in Figs. 7 and 8.
Figure 7a shows intensive open burning, detected in June from the northwest of the site, but in this month air plumes are mainly transported from the eastern area of Nanjing where fire spots can also be found but are less concentrated than in northwestern regions. Contrarily, very few fire counts can be detected in December, suggesting much fewer open burning events in this month. Therefore, the high level of babs_BrC in December is not likely to be from open BB emissions. The map of the retroplume reveals that air masses are mainly from the northern area in December. Then, correlations between daily average babs_BrC and K+ mass concentration in June and December are compared, as Fig. 8a shows. It can be observed that the correlations between babs_BrC and K+ in these 2 months exhibit clearly different patterns. The slope of fitted babs_BrC and K+ in June is 4.65 and the correlation coefficient R2 is 0.92. Knowing the strong correlation between babs_BrC and K+ in June, combined with the observed intense fire counts in this month, it can be presumed that primary open BB emission could be a major contributor to BrC during June. As for December, babs_BrC and K+ present a much higher slope (slope is 10.59), which is approximately twice that in June. The distribution of babs_BrC vs. K+ in these two seasons is shown in Fig. 8b. The result shows that babs_BrC ∕ K+ ratio of June and December shows a significant difference (through a t test, P < 0.05), indicating that the dominant emission source of BrC in December is not open biomass burning (a significant difference test of babs_BrC ∕ K+ ratio is also done for comparison for May and June, which are the main open BB seasons, and the result shows that there is no significant difference in these 2 months; Fig. S5). The above analyses have demonstrated that BrC is not mainly from open biomass burning and vehicle exhausts in December. The increase of PBrC in winter, representing the higher ratio of BrC to BC mass, indicates the change of main emission sources. Nanjing is dominated by northeasterly wind in winter (Fig. S6), with air masses long-range transported from North China by the winter monsoon (Ding et al., 2013c, 2016a). Because of cold weather in winter, there is higher residential coal and biomass/biofuel burning emission for household heating (Fu et al., 2018). Therefore, residential coal and household biomass burning might be the main sources of high BrC in December under the influence of the winter monsoon (Zhang et al., 2016). Studies conducted in Beijing have also suggested the important contribution of residential biofuel (Yan et al., 2015; Cheng et al., 2016) and coal combustion (Yan et al., 2017) on BrC in northern China in winter. From the above analyses, it can be concluded that the high BrC absorption contributions in May–June and winter season are caused by different sources. In May–June, strong open biomass burning leads to the high BrC in Nanjing, while in winter, residential coal and household biofuel burning are possibly the major sources of BrC in winter season. Detailed sources of BrC can be further explored, combining field measurements of organic aerosols in the future.
In this study, light absorption of BrC was quantified using the optical method based on the definition of BrC. Mie theory simulation and observational results were combined to improve this method by calculating AAEBC at each time point instead of assuming a constant. Long-term variation of babs_BrC and PBrC was then derived. Apparent light absorption contributed by BrC is discovered in the YRD region. babs_BrC and PBrC both exhibit clear seasonal cycles with two peaks in May–June and December. The light absorption contribution of BrC at 370 nm ranges from 10.4 to 23.9 % (for 10th and 90th percentiles), and can reach 33.3 % in the open-BB-dominant and winter seasons. Comparison between babs_BrC and babs_BC suggests that vehicle emission has a negligible impact on the regional BrC level during winter and spring. Source analysis was performed based on temporal variations of BrC and the comparison of possible co-emitted pollutants or related parameters. LPDM and MODIS fire data were also used to support analysis. The months of June and December with the peak level of babs_BrC are chosen to analyze the potential emission sources of BrC, and it is found that the high contributions of BrC in these 2 months are dominated by different emission sources. In June, intensive primary open BB emission is the dominant source of BrC, making babs_BrC have short-term high values, raising its average level in this month. In December, a high portion of BrC is possibly contributed by residential coal and household biofuel burning.
Overall, this work explores an improved optical method to quantify babs_BrC from long-term observations. Compared to the conventional one, which may induce large uncertainty due to the assumption of constant AAEBC regardless of its variation with particle size, wavelength and time, this improved method is applicable to those sites at which the BrC proportion is low and makes long-term analysis available. This study also highlights the considerable contribution of BrC to light absorption in the near-UV range in the YRD region. Moreover, different emission sources of BrC are found in different seasons, providing a clearer reference for mitigation measures as well as regional control policies in eastern China.
The GDAS data used in the LPDM calculation can be acquired from ftp://gdas-server.iarc.uaf.edu/gdas1/ (last access: 15 June 2017). Measurement data at SORPES, including aerosol data and relevant trace gases as well as meteorological data, are available upon request from the corresponding author before the SORPES database is opened publicly.
The supplement related to this article is available online at: https://doi.org/10.5194/acp-18-9061-2018-supplement.
Aijun Ding designed the study. Jiaping Wang contributed to the measurements, data analysis and the first draft of this paper. Wei Nie, Yicheng Shen, Xuguang Chi, Yuning Xie, Peng Sun, Zheng Xu and Ximeng Qi participated in observation at the SORPES station. Aijun Ding, Wei Nie, Yafang Cheng, Jiandong Wang, Xin Huang and Hang Su contributed to analysis, modeling and editing of the paper.
The authors declare that they have no conflict of interest.
This article is part of the special issue “Pan-Eurasian Experiment (PEEX)”. It is not associated with a conference.
This work was supported by the National Key Research & Development Program of the Ministry of Science and Technology of the People's
Republic of China (2016YFC0200500 and 2016YFC0202000), the National Natural
Science Foundation of China (91544231, 41725020 and 41422504) and the
Public Welfare Projects for Environmental Protection (201509004).
Edited by: Veli-Matti Kerminen
Reviewed by: Dantong Liu and two anonymous referees
Andreae, M. O. and Gelencsér, A.: Black carbon or brown carbon? The nature of light-absorbing carbonaceous aerosols, Atmos. Chem. Phys., 6, 3131–3148, https://doi.org/10.5194/acp-6-3131-2006, 2006.
Arnott, W. P., Hamasha, K., Moosmüller, H., Sheridan, P. J., and Ogren, J. A.: Towards Aerosol Light-Absorption Measurements with a 7-Wavelength Aethalometer: Evaluation with a Photoacoustic Instrument and 3-Wavelength Nephelometer, Aerosol Sci. Tech., 39, 17–29, https://doi.org/10.1080/027868290901972, 2005.
Bohren, C. F. and Huffman, D. R.: Absorption and scattering of light by small particles, Wiley Science Paperback Series, John Wiley & Sons, New York, NY, USA, 1983.
Bond, T. C. and Bergstrom, R. W.: Light Absorption by Carbonaceous Particles: An Investigative Review, Aerosol Sci. Tech., 40, 27–67, https://doi.org/10.1080/02786820500421521, 2006.
Bond, T. C., Doherty, S. J., Fahey, D. W., Forster, P. M., Berntsen, T., DeAngelo, B. J., Flanner, M. G., Ghan, S., Kärcher, B., Koch, D., Kinne, S., Kondo, Y., Quinn, P. K., Sarofim, M. C., Schultz, M. G., Schulz, M., Venkataraman, C., Zhang, H., Zhang, S., Bellouin, N., Guttikunda, S. K., Hopke, P. K., Jacobson, M. Z., Kaiser, J. W., Klimont, Z., Lohmann, U., Schwarz, J. P., Shindell, D., Storelvmo, T., Warren, S. G., and Zender, C. S.: Bounding the role of black carbon in the climate system: A scientific assessment, J. Geophys. Res.-Atmos., 118, 5380–5552, https://doi.org/10.1002/jgrd.50171, 2013.
Cao, G., Zhang, X., and Zheng, F.: Inventory of black carbon and organic carbon emissions from China, Atmos. Environ., 40, 6516–6527, https://doi.org/10.1016/j.atmosenv.2006.05.070, 2006.
Cao, J.-J., Zhu, C.-S., Chow, J. C., Watson, J. G., Han, Y.-M., Wang, G.-H., Shen, Z.-X., and An, Z.-S.: Black carbon relationships with emissions and meteorology in Xi'an, China, Atmos. Res., 94, 194–202, https://doi.org/10.1016/j.atmosres.2009.05.009, 2009.
Cavalli, F., Facchini, M. C., Decesari, S., Mircea, M., Emblico, L., Fuzzi, S., Ceburnis, D., Yoon, Y. J., O'Dowd, C. D., Putaud, J. P., and Dell'Acqua, A.: Advances in characterization of size-resolved organic matter in marine aerosol over the North Atlantic, J. Geophys. Res.-Atmos., 109, D24215, https://doi.org/10.1029/2004JD005137, 2004.
Chen, Y. and Bond, T. C.: Light absorption by organic carbon from wood combustion, Atmos. Chem. Phys., 10, 1773–1787, https://doi.org/10.5194/acp-10-1773-2010, 2010.
Cheng, Y., He, K.-B., Du, Z.-Y., Engling, G., Liu, J.-M., Ma, Y.-L., Zheng, M., and Weber, R. J.: The characteristics of brown carbon aerosol during winter in Beijing, Atmos. Environ., 127, 355–364, https://doi.org/10.1016/j.atmosenv.2015.12.035, 2016.
Collaud Coen, M., Weingartner, E., Apituley, A., Ceburnis, D., Fierz-Schmidhauser, R., Flentje, H., Henzing, J. S., Jennings, S. G., Moerman, M., Petzold, A., Schmid, O., and Baltensperger, U.: Minimizing light absorption measurement artifacts of the Aethalometer: evaluation of five correction algorithms, Atmos. Meas. Tech., 3, 457–474, https://doi.org/10.5194/amt-3-457-2010, 2010.
Dalzell, W. H. and Sarofim, A. F.: Optical Constants of Soot and Their Application to Heat-Flux Calculations, J. Heat Transf., 91, 100–104, https://doi.org/10.1115/1.3580063, 1969.
Ding, A. J., Fu, C. B., Yang, X. Q., Sun, J. N., Petäjä, T., Kerminen, V.-M., Wang, T., Xie, Y., Herrmann, E., Zheng, L. F., Nie, W., Liu, Q., Wei, X. L., and Kulmala, M.: Intense atmospheric pollution modifies weather: a case of mixed biomass burning with fossil fuel combustion pollution in eastern China, Atmos. Chem. Phys., 13, 10545–10554, https://doi.org/10.5194/acp-13-10545-2013, 2013a.
Ding, A. J., Wang, T., and Fu, C.: Transport characteristics and origins of carbon monoxide and ozone in Hong Kong, South China, J. Geophys. Res.-Atmos., 118, 9475–9488, 2013b.
Ding, A. J., Fu, C. B., Yang, X. Q., Sun, J. N., Zheng, L. F., Xie, Y. N., Herrmann, E., Nie, W., Petäjä, T., Kerminen, V.-M., and Kulmala, M.: Ozone and fine particle in the western Yangtze River Delta: an overview of 1 yr data at the SORPES station, Atmos. Chem. Phys., 13, 5813-5830, https://doi.org/10.5194/acp-13-5813-2013, 2013c.
Ding, A. J., Nie, W., Huang, X., Chi, X., Sun, J., Kerminen, V.-M., Xu, Z., Guo, W., Petäjä, T., Yang, X., Kulmala, M., and Fu, C.: Long-term observation of air pollution-weather/climate interactions at the SORPES station: a review and outlook, Front. Environ. Sci. En., 10, 15, https://doi.org/10.1007/s11783-016-0877-3, 2016a.
Ding, A. J., Huang, X., Nie, W., Sun, J., Kerminen, V. M., Petaja, T., Su, H. L., Cheng, Y. F., Yang, X. Q., and Wang, M.: Enhanced haze pollution by black carbon in megacities in China, Geophys. Res. Lett., 2873–2879, https://doi.org/10.1002/2016GL067745, 2016b.
Dockery, D. W., Pope, C. A., Xu, X., Spengler, J. D., Ware, J. H., Fay, M. E., Ferris, B. G., and Speizer, F. E.: An Association between Air Pollution and Mortality in Six U.S. Cities, N. Engl. J. Med., 329, 1753–1759, https://doi.org/10.1056/NEJM199312093292401, 1993.
Draxler, R. and Hess, G.: An overview of the HYSPLIT_4 modeling system for trajectories, dispersion, and deposition, Aust. Meteorol. Mag., 47, 295–308, 1998.
Feng, Y., Ramanathan, V., and Kotamarthi, V. R.: Brown carbon: a significant atmospheric absorber of solar radiation?, Atmos. Chem. Phys., 13, 8607–8621, https://doi.org/10.5194/acp-13-8607-2013, 2013.
Formenti, P., Elbert, W., Maenhaut, W., Haywood, J., Osborne, S., and Andreae, M. O.: Inorganic and carbonaceous aerosols during the Southern African Regional Science Initiative (SAFARI 2000) experiment: Chemical characteristics, physical properties, and emission data for smoke from African biomass burning, J. Geophys. Res.-Atmos, 108, 8488, https://doi.org/10.1029/2002JD002408, 2003.
Fu, X., Wang, T., Wang, S., Zhang, L., Cai, S., Xing, J., and Hao, J.: Anthropogenic Emissions of Hydrogen Chloride and Fine Particulate Chloride in China, Environ. Sci. Technol., 52, 1644–1654, https://doi.org/10.1021/acs.est.7b05030, 2018.
Gao, R. S., Schwarz, J. P., Kelly, K. K., Fahey, D. W., Watts, L. A., Thompson, T. L., Spackman, J. R., Slowik, J. G., Cross, E. S., Han, J. H., Davidovits, P., Onasch, T. B., and Worsnop, D. R.: A novel method for estimating light-scattering properties of soot aerosols using a modified single-particle soot photometer, Aerosol Sci. Tech., 41, 125–135, https://doi.org/10.1080/02786820601118398, 2007.
Gyawali, M., Arnott, W. P., Lewis, K., and Moosmüller, H.: In situ aerosol optics in Reno, NV, USA during and after the summer 2008 California wildfires and the influence of absorbing and non-absorbing organic coatings on spectral light absorption, Atmos. Chem. Phys., 9, 8007–8015, https://doi.org/10.5194/acp-9-8007-2009, 2009.
Gysel, M., Laborde, M., Olfert, J. S., Subramanian, R., and Gröhn, A. J.: Effective density of Aquadag and fullerene soot black carbon reference materials used for SP2 calibration, Atmos. Meas. Tech., 4, 2851–2858, https://doi.org/10.5194/amt-4-2851-2011, 2011.
Hansen, A. and Schnell, R.: The aethalometer, Magee Scientific Company, Berkeley, California, USA, 1–209, 2005.
Healy, R. M., Sciare, J., Poulain, L., Kamili, K., Merkel, M., Müller, T., Wiedensohler, A., Eckhardt, S., Stohl, A., Sarda-Estève, R., McGillicuddy, E., O'Connor, I. P., Sodeau, J. R., and Wenger, J. C.: Sources and mixing state of size-resolved elemental carbon particles in a European megacity: Paris, Atmos. Chem. Phys., 12, 1681–1700, https://doi.org/10.5194/acp-12-1681-2012, 2012.
Healy, R. M., Wang, J. M., Jeong, C. H., Lee, A. K. Y., Willis, M. D., Jaroudi, E., Zimmerman, N., Hilker, N., Murphy, M., Eckhardt, S., Stohl, A., Abbatt, J. P. D., Wenger, J. C., and Evans, G. J.: Light-absorbing properties of ambient black carbon and brown carbon from fossil fuel and biomass burning sources, J. Geophys. Res.-Atmos., 120, 6619–6633, https://doi.org/10.1002/2015JD023382, 2015.
Huang, R.-J., Zhang, Y., Bozzetti, C., Ho, K.-F., Cao, J.-J., Han, Y., Daellenbach, K. R., Slowik, J. G., Platt, S. M., Canonaco, F., Zotter, P., Wolf, R., Pieber, S. M., Bruns, E. A., Crippa, M., Ciarelli, G., Piazzalunga, A., Schwikowski, M., Abbaszade, G., Schnelle-Kreis, J., Zimmermann, R., An, Z., Szidat, S., Baltensperger, U., Haddad, I. E., and Prévôt, A. S. H.: High secondary aerosol contribution to particulate pollution during haze events in China, Nature, 514, 218–222, https://doi.org/10.1038/nature13774, 2014.
IPCC: Climate Change 2013: The Physical Science Basis. Contribution of Working Group I to the Fifth Assessment Report of the Intergovernmental Panel on Climate Change, Cambridge University Press, Cambridge, UK and New York, NY, USA, 1535 pp., 2013.
Kirchstetter, T. W., Novakov, T., and Hobbs, P. V.: Evidence that the spectral dependence of light absorption by aerosols is affected by organic carbon, J. Geophys. Res.-Atmos., 109, D21208, https://doi.org/10.1029/2004JD004999, 2004.
Lack, D. A. and Cappa, C. D.: Impact of brown and clear carbon on light absorption enhancement, single scatter albedo and absorption wavelength dependence of black carbon, Atmos. Chem. Phys., 10, 4207–4220, https://doi.org/10.5194/acp-10-4207-2010, 2010.
Lack, D. A. and Langridge, J. M.: On the attribution of black and brown carbon light absorption using the Ångström exponent, Atmos. Chem. Phys., 13, 10535–10543, https://doi.org/10.5194/acp-13-10535-2013, 2013.
Lack, D. A., Langridge, J. M., Bahreini, R., Cappa, C. D., Middlebrook, A. M., and Schwarz, J. P.: Brown carbon and internal mixing in biomass burning particles, P. Natl. Acad. Sci. USA, 109, 14802–14807, https://doi.org/10.1073/pnas.1206575109, 2012.
Laskin, A., Laskin, J., and Nizkorodov, S. A.: Chemistry of atmospheric brown carbon, Chem. Rev., 115, 4335–4382, https://doi.org/10.1021/cr5006167, 2015.
Liu, D., Allan, J. D., Young, D. E., Coe, H., Beddows, D., Fleming, Z. L., Flynn, M. J., Gallagher, M. W., Harrison, R. M., Lee, J., Prevot, A. S. H., Taylor, J. W., Yin, J., Williams, P. I., and Zotter, P.: Size distribution, mixing state and source apportionment of black carbon aerosol in London during wintertime, Atmos. Chem. Phys., 14, 10061–10084, https://doi.org/10.5194/acp-14-10061-2014, 2014.
Liu, D. T., Taylor, J. W., Young, D. E., Flynn, M. J., Coe, H., and Allan, J. D.: The effect of complex black carbon microphysics on the determination of the optical properties of brown carbon, Geophys. Res. Lett., 42, 613–619, https://doi.org/10.1002/2014gl062443, 2015.
Mätzler, C.: MATLAB functions for Mie scattering and absorption, version 2, IAP Res. Rep, 8, University of Bern, Bern, Switzerland, 2002.
Mohr, C., Lopez-Hilfiker, F. D., Zotter, P., Prévôt, A. S. H., Xu, L., Ng, N. L., Herndon, S. C., Williams, L. R., Franklin, J. P., Zahniser, M. S., Worsnop, D. R., Knighton, W. B., Aiken, A. C., Gorkowski, K. J., Dubey, M. K., Allan, J. D., and Thornton, J. A.: Contribution of Nitrated Phenols to Wood Burning Brown Carbon Light Absorption in Detling, United Kingdom during Winter Time, Environ. Sci. Technol., 47, 6316–6324, https://doi.org/10.1021/es400683v, 2013.
Moosmüller, H., Chakrabarty, R. K., Ehlers, K. M., and Arnott, W. P.: Absorption Ångström coefficient, brown carbon, and aerosols: basic concepts, bulk matter, and spherical particles, Atmos. Chem. Phys., 11, 1217–1225, https://doi.org/10.5194/acp-11-1217-2011, 2011.
Moteki, N., Kondo, Y., and Nakamura, S.: Method to measure refractive indices of small nonspherical particles: Application to black carbon particles, J. Aerosol Sci., 41, 513–521, https://doi.org/10.1016/j.jaerosci.2010.02.013, 2010.
Mukai, H. and Ambe, Y.: Characterization of a humic acid-like brown substance in airborne particulate matter and tentative identification of its origin, Atmos. Environ., 20, 813–819, https://doi.org/10.1016/0004-6981(86)90265-9, 1986.
Olson, M. R., Victoria Garcia, M., Robinson, M. A., Van Rooy, P., Dietenberger, M. A., Bergin, M., and Schauer, J. J.: Investigation of black and brown carbon multiple-wavelength-dependent light absorption from biomass and fossil fuel combustion source emissions, J. Geophys. Res.-Atmos., 120, 6682–6697, https://doi.org/10.1002/2014JD022970, 2015.
Patterson, E. M. and McMahon, C. K.: Absorption characteristics of forest fire particulate matter, Atmos. Environ., 18, 2541–2551, https://doi.org/10.1016/0004-6981(84)90027-1, 1984.
Pitchford, M., Malm, W., Schichtel, B., Kumar, N., Lowenthal, D., and Hand, J.: Revised Algorithm for Estimating Light Extinction from IMPROVE Particle Speciation Data, J. Air Waste Manage., 57, 1326–1336, https://doi.org/10.3155/1047-3289.57.11.1326, 2007.
Pöschl, U.: Aerosol particle analysis: challenges and progress, Anal. Bioanal. Chem., 375, 30–32, https://doi.org/10.1007/s00216-002-1611-5, 2003.
Saleh, R., Robinson, E. S., Tkacik, D. S., Ahern, A. T., Liu, S., Aiken, A. C., Sullivan, R. C., Presto, A. A., Dubey, M. K., Yokelson, R. J., Donahue, N. M., and Robinson, A. L.: Brownness of organics in aerosols from biomass burning linked to their black carbon content, Nat. Geosci., 7, 647–650, https://doi.org/10.1038/ngeo2220, 2014.
Sandradewi, J., Prévôt, A. S. H., Szidat, S., Perron, N., Alfarra, M. R., Lanz, V. A., Weingartner, E., and Baltensperger, U.: Using Aerosol Light Absorption Measurements for the Quantitative Determination of Wood Burning and Traffic Emission Contributions to Particulate Matter, Environ. Sci. Technol., 42, 3316–3323, https://doi.org/10.1021/es702253m, 2008.
Saturno, J., Pöhlker, C., Massabò, D., Brito, J., Carbone, S., Cheng, Y., Chi, X., Ditas, F., Hrabe de Angelis, I., Morán-Zuloaga, D., Pöhlker, M. L., Rizzo, L. V., Walter, D., Wang, Q., Artaxo, P., Prati, P., and Andreae, M. O.: Comparison of different Aethalometer correction schemes and a reference multi-wavelength absorption technique for ambient aerosol data, Atmos. Meas. Tech., 10, 2837–2850, https://doi.org/10.5194/amt-10-2837-2017, 2017.
Schmid, O., Artaxo, P., Arnott, W. P., Chand, D., Gatti, L. V., Frank, G. P., Hoffer, A., Schnaiter, M., and Andreae, M. O.: Spectral light absorption by ambient aerosols influenced by biomass burning in the Amazon Basin. I: Comparison and field calibration of absorption measurement techniques, Atmos. Chem. Phys., 6, 3443–3462, https://doi.org/10.5194/acp-6-3443-2006, 2006.
Schwarz, J. P., Gao, R. S., Fahey, D. W., Thomson, D. S., Watts, L. A., Wilson, J. C., Reeves, J. M., Darbeheshti, M., Baumgardner, D. G., Kok, G. L., Chung, S. H., Schulz, M., Hendricks, J., Lauer, A., Karcher, B., Slowik, J. G., Rosenlof, K. H., Thompson, T. L., Langford, A. O., Loewenstein, M., and Aikin, K. C.: Single-particle measurements of midlatitude black carbon and light-scattering aerosols from the boundary layer to the lower stratosphere, J. Geophys. Res.-Atmos., 111, D16207, https://doi.org/10.1029/2006jd007076, 2006.
Schwarz, J. P., Gao, R. S., Spackman, J. R., Watts, L. A., Thomson, D. S., Fahey, D. W., Ryerson, T. B., Peischl, J., Holloway, J. S., Trainer, M., Frost, G. J., Baynard, T., Lack, D. A., de Gouw, J. A., Warneke, C., and Del Negro, L. A.: Measurement of the mixing state, mass, and optical size of individual black carbon particles in urban and biomass burning emissions, Geophys. Res. Lett., 35, L13810, https://doi.org/10.1029/2008gl033968, 2008.
Shen, Y., Virkkula, A., Ding, A., Wang, J., Chi, X., Nie, W., Qi, X., Huang, X., Liu, Q., Zheng, L., Xu, Z., Petäjä, T., Aalto, P. P., Fu, C., and Kulmala, M.: Aerosol optical properties at SORPES in Nanjing, east China, Atmos. Chem. Phys., 18, 5265–5292, https://doi.org/10.5194/acp-18-5265-2018, 2018.
Shen, Z., Lei, Y., Zhang, L., Zhang, Q., Zeng, Y., Tao, J., Zhu, C., Cao, J., Xu, H., and Liu, S.: Methanol Extracted Brown Carbon in PM2.5 Over Xi'an, China: Seasonal Variation of Optical Properties and Sources Identification, Aerosol Sci. Eng., 1, 57–65, https://doi.org/10.1007/s41810-017-0007-z, 2017.
Stein, A. F., Draxler, R. R., Rolph, G. D., Stunder, B. J. B., Cohen, M. D., and Ngan, F.: NOAA's HYSPLIT Atmospheric Transport and Dispersion Modeling System, B. Am. Meteorol. Soc., 96, 2059–2077, https://doi.org/10.1175/bams-d-14-00110.1, 2015.
Stephens, M., Turner, N., and Sandberg, J.: Particle identification by laser-induced incandescence in a solid-state laser cavity, Appl. Optics, 42, 3726–3736, https://doi.org/10.1364/AO.42.003726, 2003.
Stone, E. A., Hedman, C. J., Sheesley, R. J., Shafer, M. M., and Schauer, J. J.: Investigating the chemical nature of humic-like substances (HULIS) in North American atmospheric aerosols by liquid chromatography tandem mass spectrometry, Atmos. Environ., 43, 4205–4213, https://doi.org/10.1016/j.atmosenv.2009.05.030, 2009.
Sun, H., Biedermann, L., and Bond, T. C.: Color of brown carbon: A model for ultraviolet and visible light absorption by organic carbon aerosol, Geophys. Res. Lett., 34, L17813, https://doi.org/10.1029/2007gl029797, 2007.
Virkkula, A., Chi, X., Ding, A., Shen, Y., Nie, W., Qi, X., Zheng, L., Huang, X., Xie, Y., Wang, J., Petäjä, T., and Kulmala, M.: On the interpretation of the loading correction of the aethalometer, Atmos. Meas. Tech., 8, 4415–4427, https://doi.org/10.5194/amt-8-4415-2015, 2015.
Wang, J., Virkkula, A., Gao, Y., Lee, S., Shen, Y., Chi, X., Nie, W., Liu, Q., Xu, Z., Huang, X., Wang, T., Cui, L., and Ding, A.: Observations of aerosol optical properties at a coastal site in Hong Kong, South China, Atmos. Chem. Phys., 17, 2653–2671, https://doi.org/10.5194/acp-17-2653-2017, 2017a.
Wang, J., Xing, J., Mathur, R., Pleim, J. E., Wang, S., Hogrefe, C., Gan, C.-M., Wong, D. C., and Hao, J.: Historical trends in PM2.5-related premature mortality during 1990–2010 across the northern hemisphere, Environ. Health Persp., 125, 400–408, https://doi.org/10.1289/EHP298, 2017b.
Wang, J., Zhao, B., Wang, S., Yang, F., Xing, J., Morawska, L., Ding, A., Kulmala, M., Kerminen, V.-M., Kujansuu, J., Wang, Z., Ding, D., Zhang, X., Wang, H., Tian, M., Petäjä, T., Jiang, J., and Hao, J.: Particulate matter pollution over China and the effects of control policies, Sci. Total Environ., 584–585, 426–447, https://doi.org/10.1016/j.scitotenv.2017.01.027, 2017c.
Wang, Z., Huang, X., and Ding, A.: Dome effect of black carbon and its key influencing factors: a one-dimensional modelling study, Atmos. Chem. Phys., 18, 2821–2834, https://doi.org/10.5194/acp-18-2821-2018, 2018.
Yan, C., Zheng, M., Sullivan, A. P., Bosch, C., Desyaterik, Y., Andersson, A., Li, X., Guo, X., Zhou, T., Gustafsson, Ö., and Collett, J. L.: Chemical characteristics and light-absorbing property of water-soluble organic carbon in Beijing: Biomass burning contributions, Atmos. Environ., 121, 4–12, https://doi.org/10.1016/j.atmosenv.2015.05.005, 2015.
Yan, C., Zheng, M., Bosch, C., Andersson, A., Desyaterik, Y., Sullivan, A. P., Collett, J. L., Zhao, B., Wang, S., He, K., and Gustafsson, O.: Important fossil source contribution to brown carbon in Beijing during winter, Sci. Rep., 7, 43182, https://doi.org/10.1038/srep43182, 2017.
Yang, M., Howell, S. G., Zhuang, J., and Huebert, B. J.: Attribution of aerosol light absorption to black carbon, brown carbon, and dust in China – interpretations of atmospheric measurements during EAST-AIRE, Atmos. Chem. Phys., 9, 2035–2050, https://doi.org/10.5194/acp-9-2035-2009, 2009.
Yuan, J.-F., Huang, X.-F., Cao, L.-M., Cui, J., Zhu, Q., Huang, C.-N., Lan, Z.-J., and He, L.-Y.: Light absorption of brown carbon aerosol in the PRD region of China, Atmos. Chem. Phys., 16, 1433–1443, https://doi.org/10.5194/acp-16-1433-2016, 2016.
Zhang, L., Sun, J. Y., Shen, X. J., Zhang, Y. M., Che, H., Ma, Q. L., Zhang, Y. W., Zhang, X. Y., and Ogren, J. A.: Observations of relative humidity effects on aerosol light scattering in the Yangtze River Delta of China, Atmos. Chem. Phys., 15, 8439–8454, https://doi.org/10.5194/acp-15-8439-2015, 2015.
Zhang, Y., Ding, A., Mao, H., Nie, W., Zhou, D., Liu, L., Huang, X., and Fu, C.: Impact of synoptic weather patterns and inter-decadal climate variability on air quality in the North China Plain during 1980–2013, Atmos. Environ., 124, 119–128, 2016.