the Creative Commons Attribution 4.0 License.
the Creative Commons Attribution 4.0 License.
 | 28 Jun 2018
Comparison of primary aerosol emission and secondary aerosol formation from gasoline direct injection and port fuel injection vehicles
Zhuofei Du
Wenbin Zhang
Jing Zheng
Fangting Gu
Yanhong Qin
Yudong Yang
Mengren Li
Yusheng Wu
Min Shao
Shijin Shuai
Gasoline vehicles significantly contribute to urban particulate matter (PM) pollution. Gasoline direct injection (GDI) engines, known for their higher fuel efficiency than that of port fuel injection (PFI) engines, have been increasingly employed in new gasoline vehicles. However, the impact of this trend on air quality is still poorly understood. Here, we investigated both primary emissions and secondary organic aerosol (SOA) formation from a GDI and a PFI vehicle under an urban-like driving condition, using combined approaches involving chassis dynamometer measurements and an environmental chamber simulation. The PFI vehicle emits slightly more volatile organic compounds, e.g., benzene and toluene, whereas the GDI vehicle emits more particulate components, e.g., total PM, elemental carbon, primary organic aerosols and polycyclic aromatic hydrocarbons. Strikingly, we found a much higher SOA production (by a factor of approximately 2.7) from the exhaust of the GDI vehicle than that of the PFI vehicle under the same conditions. More importantly, the higher SOA production found in the GDI vehicle exhaust occurs concurrently with lower concentrations of traditional SOA precursors, e.g., benzene and toluene, indicating a greater contribution of intermediate volatility organic compounds and semi-volatile organic compounds in the GDI vehicle exhaust to the SOA formation. Our results highlight the considerable potential contribution of GDI vehicles to urban air pollution in the future.
- Article
(938 KB) - Full-text XML
-
Supplement
(341 KB) - BibTeX
- EndNote


Organic aerosol (OA) accounts for approximately 20–50 % of ambient fine particulate matter (PM2.5), with significant environment, climate and health effects (Maria et al., 2004; Kanakidou et al., 2005). Primary organic aerosol (POA) is emitted directly by sources, while secondary organic aerosol (SOA) is mainly formed via oxidation of gaseous precursors in the atmosphere and accounts for about 30–90 % of OA mass worldwide (Zhang et al., 2007; Hu et al., 2016). However SOA sources remain poorly constrained. Robinson et al. (2007) proposed that low-volatility gas-phase species emitted from diesel vehicles were important sources for urban ambient SOA, which achieved better mass closure between observed and modeled SOA. Using an updated Community Multiscale Air Quality (CMAQ) model, Jathar et al. (2017) found that 30–40 % OA was contributed from vehicles in southern California, half of this being SOA. In addition, it was recently revealed that 15–65 % of SOA was contributed by fossil fuel consumption (i.e., traffic and coal burning) in megacities in China (Huang et al., 2014). Zhao et al. (2016a) also reported that POA and intermediate volatility organic compounds (IVOCs) from vehicles constituted a large percentage of SOA concentration in China by chamber experiments as well as the two-dimensional volatility basis set (2D-VBS) box model simulations. These findings indicated that vehicles contribute significantly to ambient SOA in urban areas. An ambient organic aerosol measurement in the Los Angeles Basin demonstrated that SOA contributed from gasoline vehicles was significant in the urban air, much larger than that from diesel vehicles (Bahreini et al., 2012). A similar conclusion was reached by Hayes et al. (2013) based on mass spectrometer results. Meanwhile, several chamber simulation studies concluded that the exhaust of gasoline vehicles could form substantial SOA (Jathar et al., 2014). Thus, gasoline vehicle exhaust is highly associated with ambient SOA formation.
Gasoline vehicles can be categorized into two types based on the fuel injection technologies in their engines, i.e., port fuel injection (PFI) vehicles and gasoline direct injection (GDI) vehicles. Unlike a PFI engine, in which gasoline is injected into the intake port, gasoline is sprayed into the cylinder directly in a GDI engine. With the increased atomization and vaporization rate of fuel, and more accurate control of fuel volume and injection time, a GDI engine has many advantages, such as better fuel efficiency, lower CO2 emissions and less fuel pumping loss (Alkidas, 2007; Myung et al., 2012; Liang et al., 2013). In past decades, PFI vehicles have dominated the market share of gasoline cars in the world. However, in recent years, GDI vehicles have been increasingly employed, due to higher fuel efficiency. The market share of GDI vehicles in sales in 2016 reached about 25, 50 and 60 % in China, the United States and Europe, respectively (Wen et al., 2016; Zimmerman et al., 2016).
Several previous studies investigated the emissions of GDI and PFI vehicles, in terms of concentrations of gaseous pollutants, particle numbers and mass concentrations, and evaluated the reduction of emissions with upgrading emission standards (Ueberall et al., 2015; Zhu et al., 2016; Saliba et al., 2017). These studies showed that GDI vehicles emitted more primary particles than PFI vehicles (Zhu et al., 2016; Saliba et al., 2017), and even diesel vehicles equipped with a diesel particulate filter (Wang et al., 2016). These higher primary particle emissions are likely due to insufficient time allowed for gasoline fuel to be mixed with air thoroughly, as well as gasoline droplets impinging onto pistons and surfaces of the combustion chamber in the GDI engine (Chen et al., 2017; Fu et al., 2014). However, in most studies, vehicles were tested under the driving cycles of US or European standards; those results may not be representative of China's traffic conditions.
SOA production from gasoline vehicle exhaust was previously simulated in smog chambers and potential aerosol mass (PAM) flow reactors. SOA formed from gaseous pollutants exceeds the related POA emissions and contributes much more to air quality degradation. These studies mostly focused on the impacts of SOA formation by the model year (Gordon et al., 2014; Jathar et al., 2014; Liu et al., 2015), fuel formulations (Peng et al., 2017), driving cycles (including idling) (Nordin et al., 2013; Platt et al., 2013) and start-up modes of the gasoline vehicles (Nordin et al., 2013). Few studies, however, have investigated SOA formation from vehicles with different engine technologies (GDI and PFI) under the same working conditions.
In this study, both primary emissions and secondary aerosol formation from GDI and PFI vehicles were investigated. To represent typical urban driving patterns in megacities such as Beijing, the tested vehicles used gasoline fuel meeting the China Phase V fuel standard, and were operated over the cold-start Beijing cycle (BJC). The SOA formation from both the PFI and GDI vehicle exhausts was then simulated using a smog chamber. Finally, the overall contributions of the GDI and PFI gasoline vehicles to ambient particulate matter (PM) were evaluated. This study is part of a project that investigates the relationship between vehicle (engine) emissions and ambient aerosols, including the potential of SOA formation from a PFI engine (Du et al., 2018) and the effects of gasoline aromatics on SOA formation (Peng et al., 2017).
2.1 Vehicles
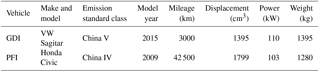
One PFI vehicle and one GDI vehicle were tested in this study to investigate their primary emissions and SOA formation. The vehicles were certified according to the China Phase IV emissions standard (equivalent to Euro IV) and the China Phase V emissions standard (equivalent to Euro V), respectively. More information on the vehicles is shown in Table 1. The fuel used in the experiments was a typical Phase V gasoline on the China market (a sulfur content of 6 mg kg−1). More information on the fuel is provided in Table S1 in the Supplement. The cold-start BJC, characterized by a higher proportion of idling periods and lower acceleration speeds than the New European Driving Cycle (NEDC), was performed to simulate the repeated braking and acceleration on roads in megacities such as Beijing. The BJC lasted for approximately 17 min, with a maximum speed of 50 km h−1 (Peng et al., 2017).
Table 1Descriptions of the gasoline direct injection (GDI) and port fuel injection (PFI) vehicles used in the experiments.
2.2 Experimental setup
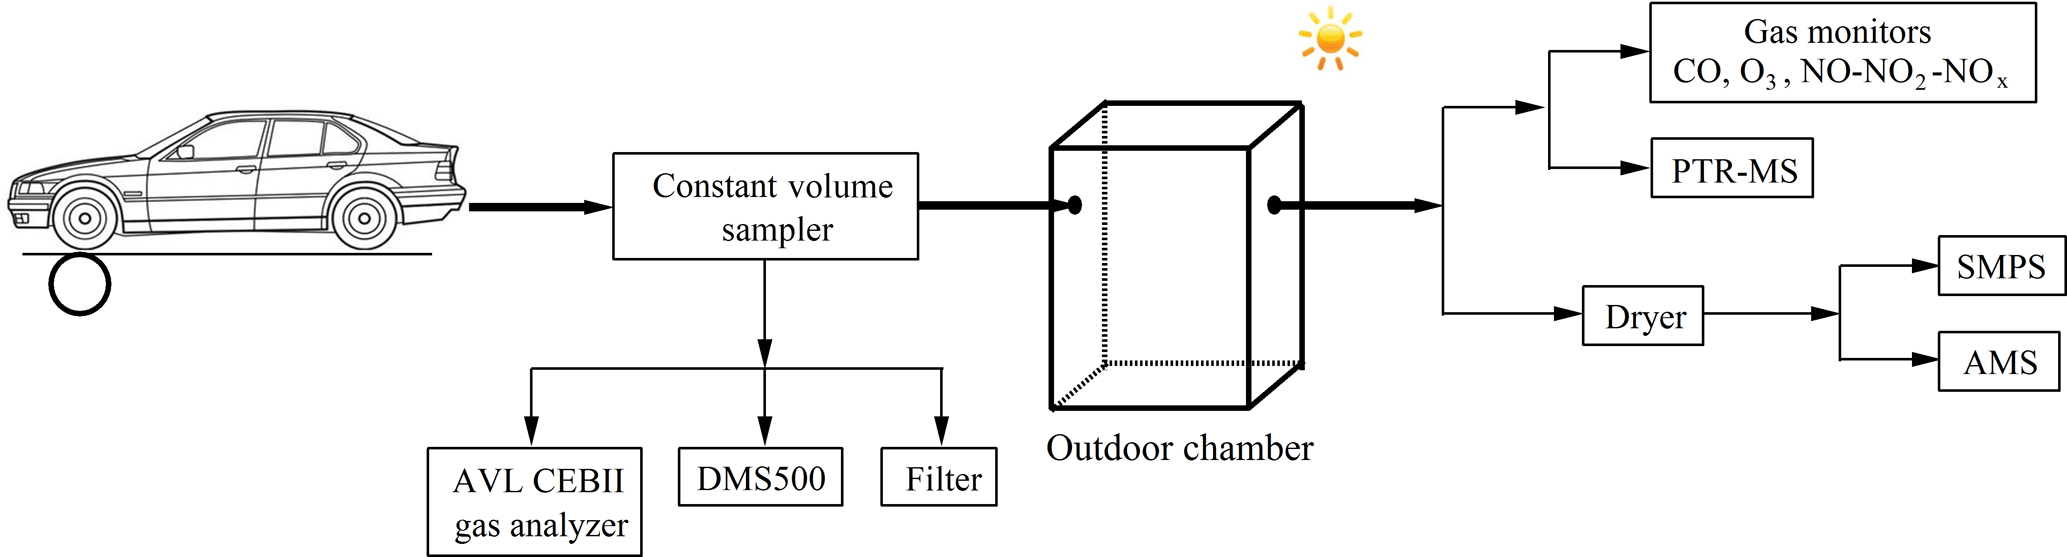
The chamber experiments were carried out in the summer at the State Key Laboratory of Automotive Safety and Energy of Tsinghua University in Beijing, including two experiments conducted with the GDI vehicle and four experiments conducted with the PFI vehicle. The tested vehicles were placed on a chassis dynamometer system (Burke E. Porter Machinery Company) with a controlled room temperature of 26.4 ± 2.5 ∘C and an absolute humidity of 11.5 ± 2.4 g m−3. The exhaust emitted by the vehicle tailpipe was diluted in a constant volume sampler (CVS) system, where the flow rate was maintained at 5.5 m3 min−1 using filtered ambient air, achieving a dilution of the exhaust of about 20-fold. Several instruments, including an AVL CEBII gas analyzer, a Cambustion Differential Mobility Spectrometer (DMS500) and a particle sampler, were connected to the CVS (detailed in Fig. 1 and Sect. 2.3) to characterize the primary gas- and particulate-phase pollutants. The diluted exhaust produced by the CVS system was injected into an outdoor chamber, where secondary aerosol formation was simulated. This was the second dilution step of the exhaust with a dilution factor of approximately 15. A schematic illustration of the outdoor experimental setup is shown in Fig. 1.
The photochemical oxidation experiments were carried out in a quasi-atmospheric aerosol evolution study (QUALITY) outdoor chamber. More details of the setup and performance of the QUALITY chamber were introduced by Peng et al. (2017). Prior to each experiment, the chamber was covered with a double-layer anti-ultraviolet (anti-UV) shade to block sunlight and was cleaned with zero air for about 15 h to create a clean environment. Approximately 120 ppb O3 were injected into the chamber prior to the injection of the vehicle exhaust to make the oxidation environment similar to the mean O3 peak concentration in the ambient atmosphere. Before the chamber was exposed to sunlight, a period of about 15 min was left to ensure that the pollutants were mixed sufficiently in the chamber, then the initial concentrations were characterized in the dark. Subsequently, the anti-UV shade was removed from the chamber and photo-oxidation was initiated. A suite of high time resolution instruments was utilized to track the evolution of pollutants during the chamber experiments. Zero air was added into the chamber during the sampling period to maintain a constant pressure.
2.3 Instrumentation
Primary gases and aerosols were measured by the instruments connected to the CVS. The concentrations of gaseous pollutants, including CO, CO2, NOx and total hydrocarbon (THC), were monitored with a gas analyzer, the AVL Combustion Emissions Bench II (CEB II, AVL, Austria). Primary aerosols were measured with both online and offline instruments. A DMS500 (Cambustion, UK) was implemented to monitor the real-time number size distribution and total number concentration of primary particles. Its sampling line was heated to maintain the temperature at 150 ∘C. The aerosols were also collected on Teflon and quartz filters by an AVL Particulate Sampling System (SPC472, AVL, Austria) to analyze the mass, organic carbon (OC) and elemental carbon (EC) emission factors using a balance and an OC ∕ EC analyzer (Sunset Lab, USA).
Table 2Overview of all instruments used to measure the gas- and particulate-phase pollutants in the experiments.
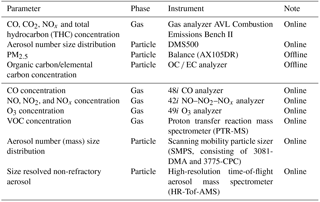
During the chamber experiments, a suite of real-time instruments was utilized to characterize the evolution of the gas- and particulate-phase pollutants. A CO analyzer, a NO–NO2–NOx analyzer and an O3 analyzer (Thermo Fisher Scientific Inc., USA) were employed to measure the concentrations of CO, NOx (including NO and NO2) and O3, respectively. The evolution of volatile organic compounds (VOCs) was monitored with a proton transfer reaction mass spectrometer (PTR-MS, IONICON Analytik, Austria) (Lindinger et al., 1998). H3O+ was used as the reagent ion, which reacted with the target compounds. The resulting ions were detected by a quadruple mass spectrometer. Meanwhile, the particle size distribution was characterized using a scanning mobility particle sizer system (SMPS, TSI, USA), which consisted of a differential mobility analyzer (DMA, TSI, USA) and a condensation particle counter (CPC, TSI, USA). This system can measure aerosols with diameters ranging from 15 to 700 nm. A high-resolution time-of-flight aerosol mass spectrometer (HR-Tof-AMS, Aerodyne Research, USA) was used to obtain mass concentrations and size distributions of submicron, non-refractory aerosols, including sulfate, nitrate, ammonium, chloride and organics (DeCarlo et al., 2006). Table 2 lists the instruments used to measure the primary emissions and their evolution in the chamber experiments.
3.1 Primary emissions
Gaseous pollutant emissions
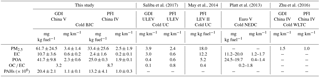
Emission factors (EFs) of CO2, THC, benzene and toluene from the GDI and PFI vehicles are listed in Table 3. The EFs of CO2 and THC are derived from measured concentrations in CVS, while the EFs of benzene and toluene were calculated from the initial concentrations in the chamber. The THC emission factor was reported in units of carbon mass, g C kg fuel−1.
The GDI vehicle emitted less CO2 and THC than the PFI vehicle due to their different fuel injection strategies and mixing features (Liang et al., 2013; Gao et al., 2015). The EF of THC from the GDI vehicle met the standard of the China Phase V Emission Standard (0.1 g km−1), but that from the PFI vehicle was slightly above the standard limit. The PFI vehicle used in this study met a less stringent emission standard (the China Phase IV), which might cause additional THC emissions compared to the China Phase V Emission Standard. In addition, in this study we employed the BJC, whereas the standard is based on the NEDC. More repeated braking and acceleration in the BJC (Fig. S2) might cause incomplete combustion and consequently higher THC emission from the PFI vehicle. As typical VOC species emitted by vehicles, benzene and toluene were measured in this study. For both vehicles, the EFs of toluene were higher than those of benzene. Consistent with the feature of THC emission, the PFI vehicle emitted more benzene and toluene than the GDI vehicle, and the enhancement of toluene was much larger than that of benzene.
Table 3Emission factors (EFs) of gaseous pollutants from the gasoline direct injection (GDI) and port fuel injection (PFI) vehicles in this study and those of previous studies.
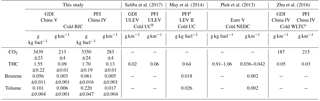
a22 PFI vehicles and 3 GDI vehicles. bUC: Unified Cycle. cWLTC: Worldwide harmonized Light-duty Test Cycle.

Figure 2Number size distributions of primary PM emitted from the GDI (red line) and PFI (blue line) gasoline vehicles. The results are the average of particle number emissions from vehicles during a whole BJC, measured by DMS500 in the CVS system. The particles were heated to 150 ∘C in the DMS500.
The EFs of the gaseous pollutants in this study had similar magnitudes to those in previous studies in which gasoline vehicles met comparable levels of emission standards and were tested under a cold-start driving condition, while the results in this study were slightly higher, as shown in Table 3. This difference might be because the California ultra-low-emission vehicles (ULEVs) (Saliba et al., 2017) and most low-emission vehicles (LEVs) II (manufactured in 2004 or later) (May et al., 2014) meet the US certification gasoline emission standards for the ULEV category, which has a lower limit of gaseous pollutants than the China Phase V Emission Standard. In addition, the different driving cycles of our study from those other studies (listed in Table 3) might be another explanation for the difference in the EFs of gaseous pollutants.
Primary particle emissions
The EFs of PM, EC, POA and particulate polycyclic aromatic hydrocarbons (PAHs) are shown in Table 4. The EF of PM2.5 from the GDI vehicle was about 1.4 times higher than that of the PFI vehicle. Both vehicles met the China Phase V Emission Standard for PM emission (4.5 mg km−1). The GDI vehicle emitted about 3.3 times more EC and 1.2 times more POA than the PFI vehicle. The primary carbonaceous aerosols (EC + POA) accounted for 85 and 82 % of the PM in the GDI and PFI vehicles respectively, suggesting that carbonaceous aerosols were the major components in the PM from gasoline vehicles, especially for the GDI vehicle.
Table 4EFs of primary aerosols, including carbonaceous aerosols and particulate polycyclic aromatic hydrocarbons (PAHs) from the GDI and PFI vehicles in this study and those of previous studies.
PAHs account for a small fraction of particulate organic matter in the atmosphere, but the molecular signature of PAHs can be utilized in source identification of vehicle emissions (Kamal et al., 2015). The GDI vehicle emitted about 1.5 times the PAHs of the PFI vehicle. The EFs of PAH compounds are listed in Table S2, and the details of PAHs measurement were described in Li et al. (2016). It should be noted that the PAHs were tested under warm-start cycles. A higher EF of PAHs would be obtained under a cold-start cycle, since the lower temperature would lead to an inefficient catalyst at the beginning of the cold-start cycle (Mathis et al., 2005). The main contributors to the total PAH mass emitted from gasoline vehicle exhaust in this study, especially from the GDI vehicle exhaust, were similar to the results reported by previous studies (Schauer et al., 2002; Hays et al., 2013).
Lower PM2.5 and POA emissions from the GDI vehicle were found in previous studies, except that a little higher PM2.5 emission from the GDI vehicle was illustrated in Saliba's study (Platt et al., 2013; May et al., 2014; Zhu et al., 2016; Saliba et al., 2017). The EC emissions were in the range of those of previous studies but on the lower level. The EF of the POA measured in this study was higher than those of other studies, leading to a higher OC ∕ EC ratio, which could be attributed to the less strict emission standard of our vehicles and the different driving cycles applied in the experiments.
The bimodal number size distributions of the primary PM from the vehicles measured by the DMS500 are shown in Fig. 2. The particle distributions of the exhaust of the GDI and PFI vehicles illustrated similar patterns, with two peaks located at about 10 nm for nucleation mode and at 60–90 nm for accumulation mode, respectively, which are consistent with the results of previous studies (Maricq et al., 1999; Chen et al., 2017). The particle number size distribution of the exhaust of the GDI vehicle showed a similar pattern to that of the PFI vehicle, with a much higher number concentration that is consistent with the emission of more particle mass.
3.2 SOA formation from gasoline vehicle exhaust
The time-resolved concentrations of gases and particles during the chamber experiments are illustrated in Fig. 3. Before removing the anti-UV shade, the initial concentrations of NOx, benzene and toluene from the PFI and GDI vehicles were 80, 3 and 5 ppb and 100, 4 and 14 ppb respectively.
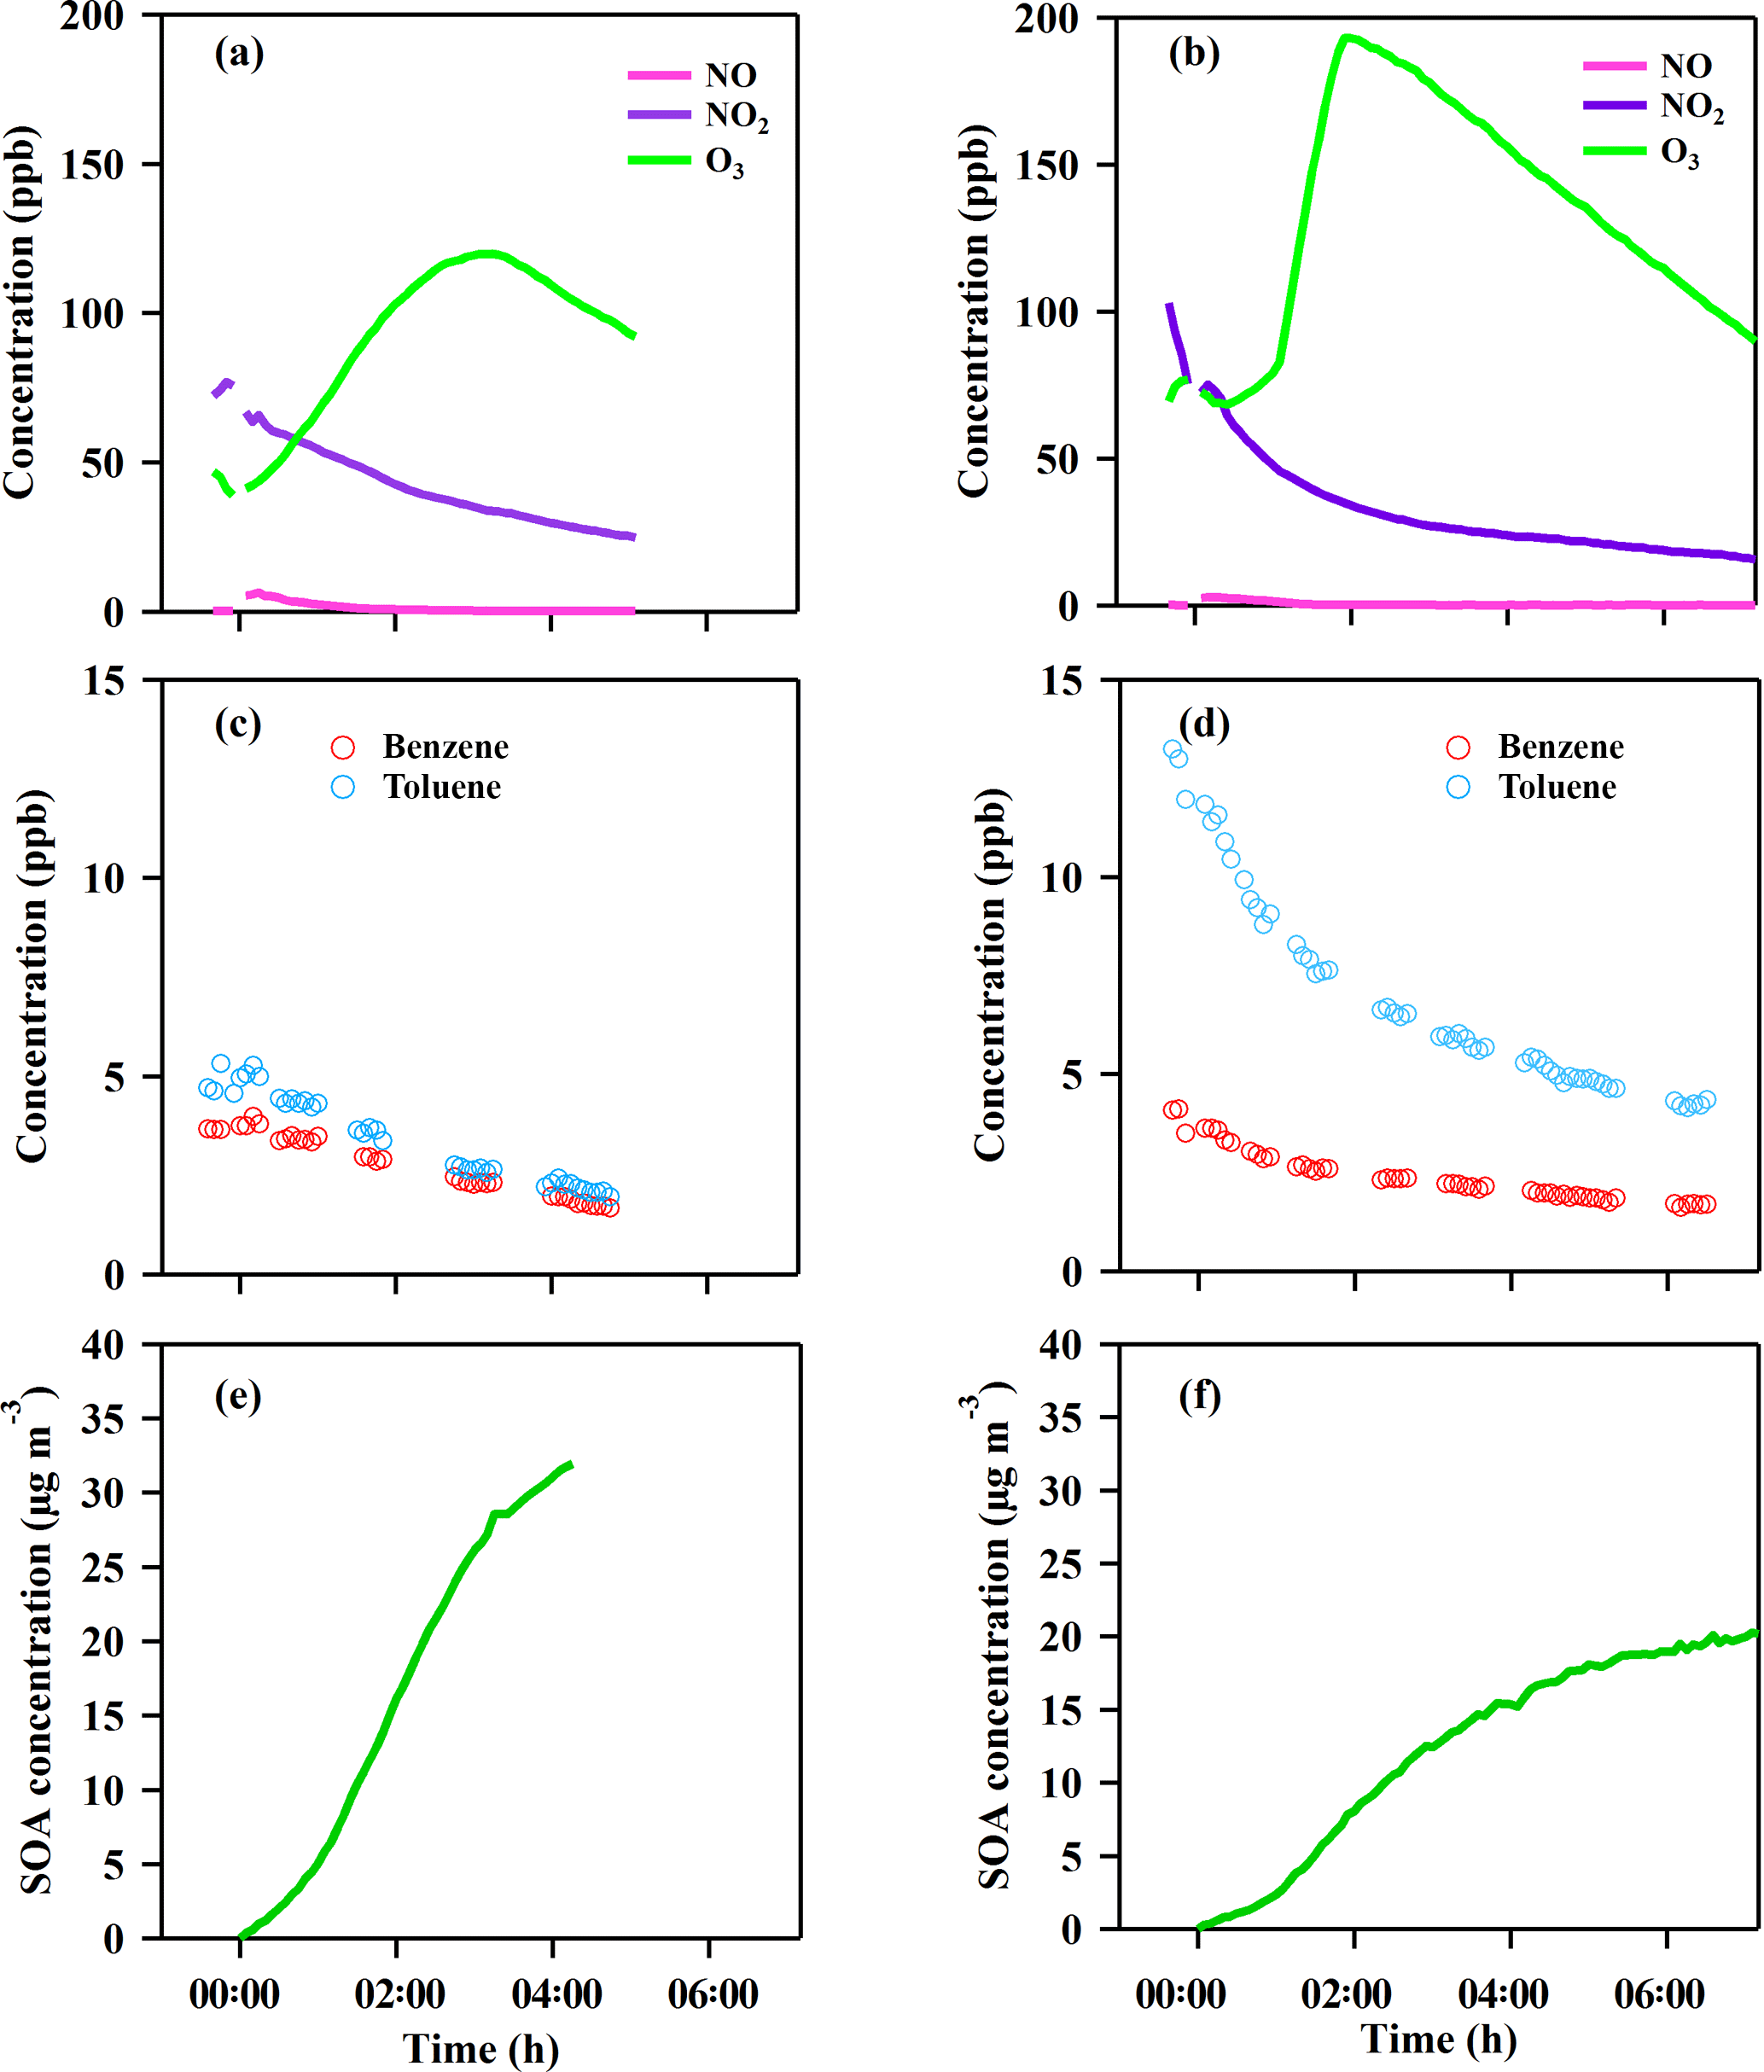
Figure 3Time series of the gases and particle evolution over the photochemical age in the chamber experiments from the GDI vehicle exhaust (a, c, e) and PFI vehicle exhaust (b, d, f). Panels (a, b) show NO, NO2 and O3 concentration; panels (c, d) show benzene and toluene concentration; panels (e, f) show corrected SOA concentration.
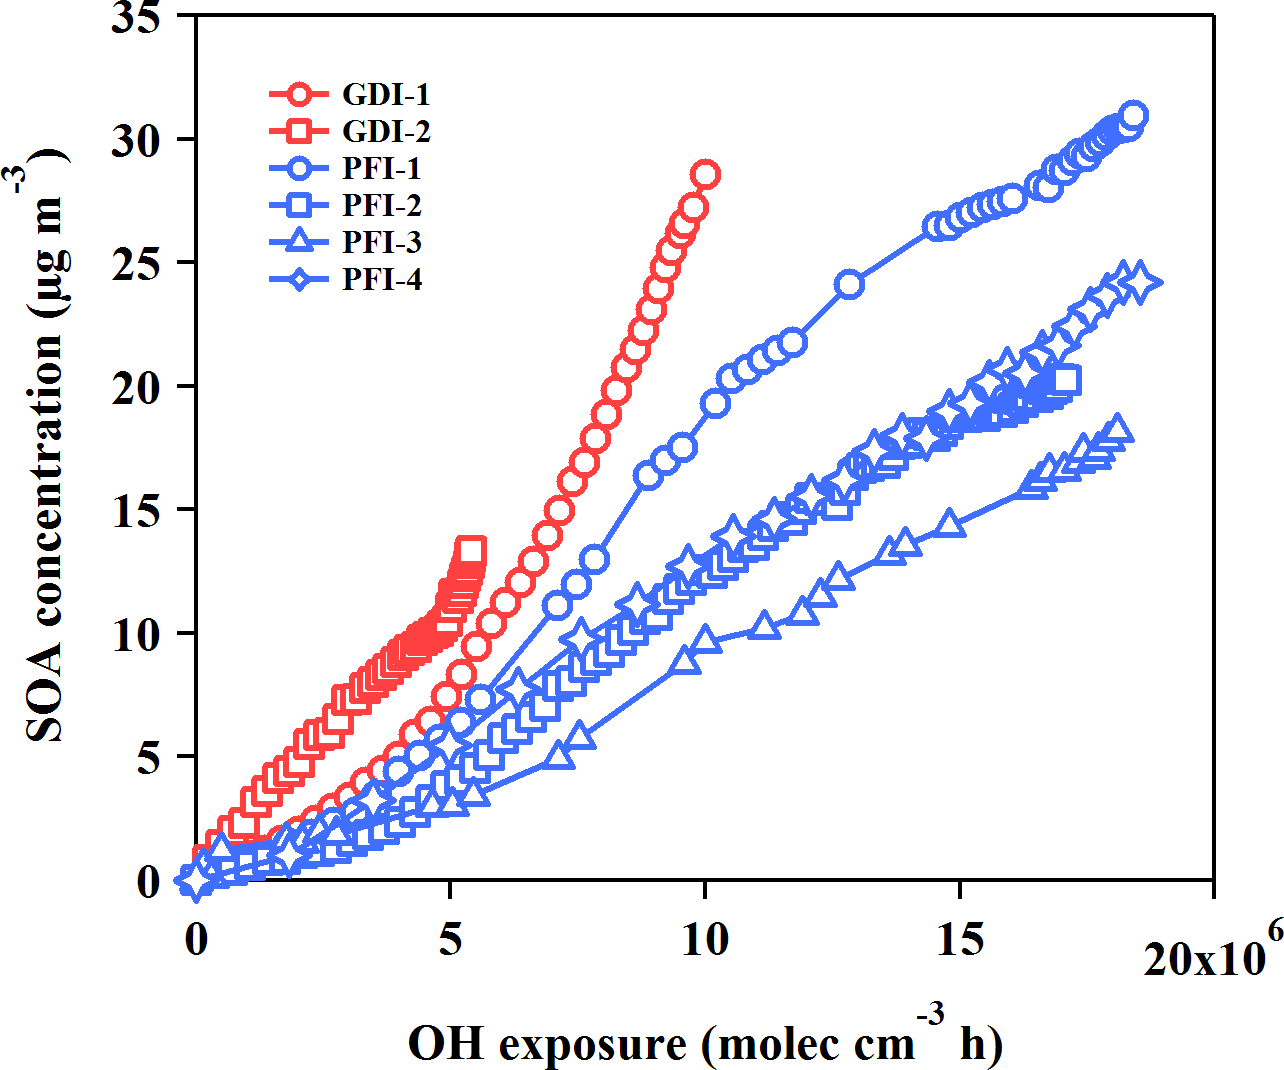
Figure 4SOA productions from the GDI vehicle exhaust (red markers) and the PFI vehicle exhaust (blue markers) as functions of OH exposure in the chamber experiments.
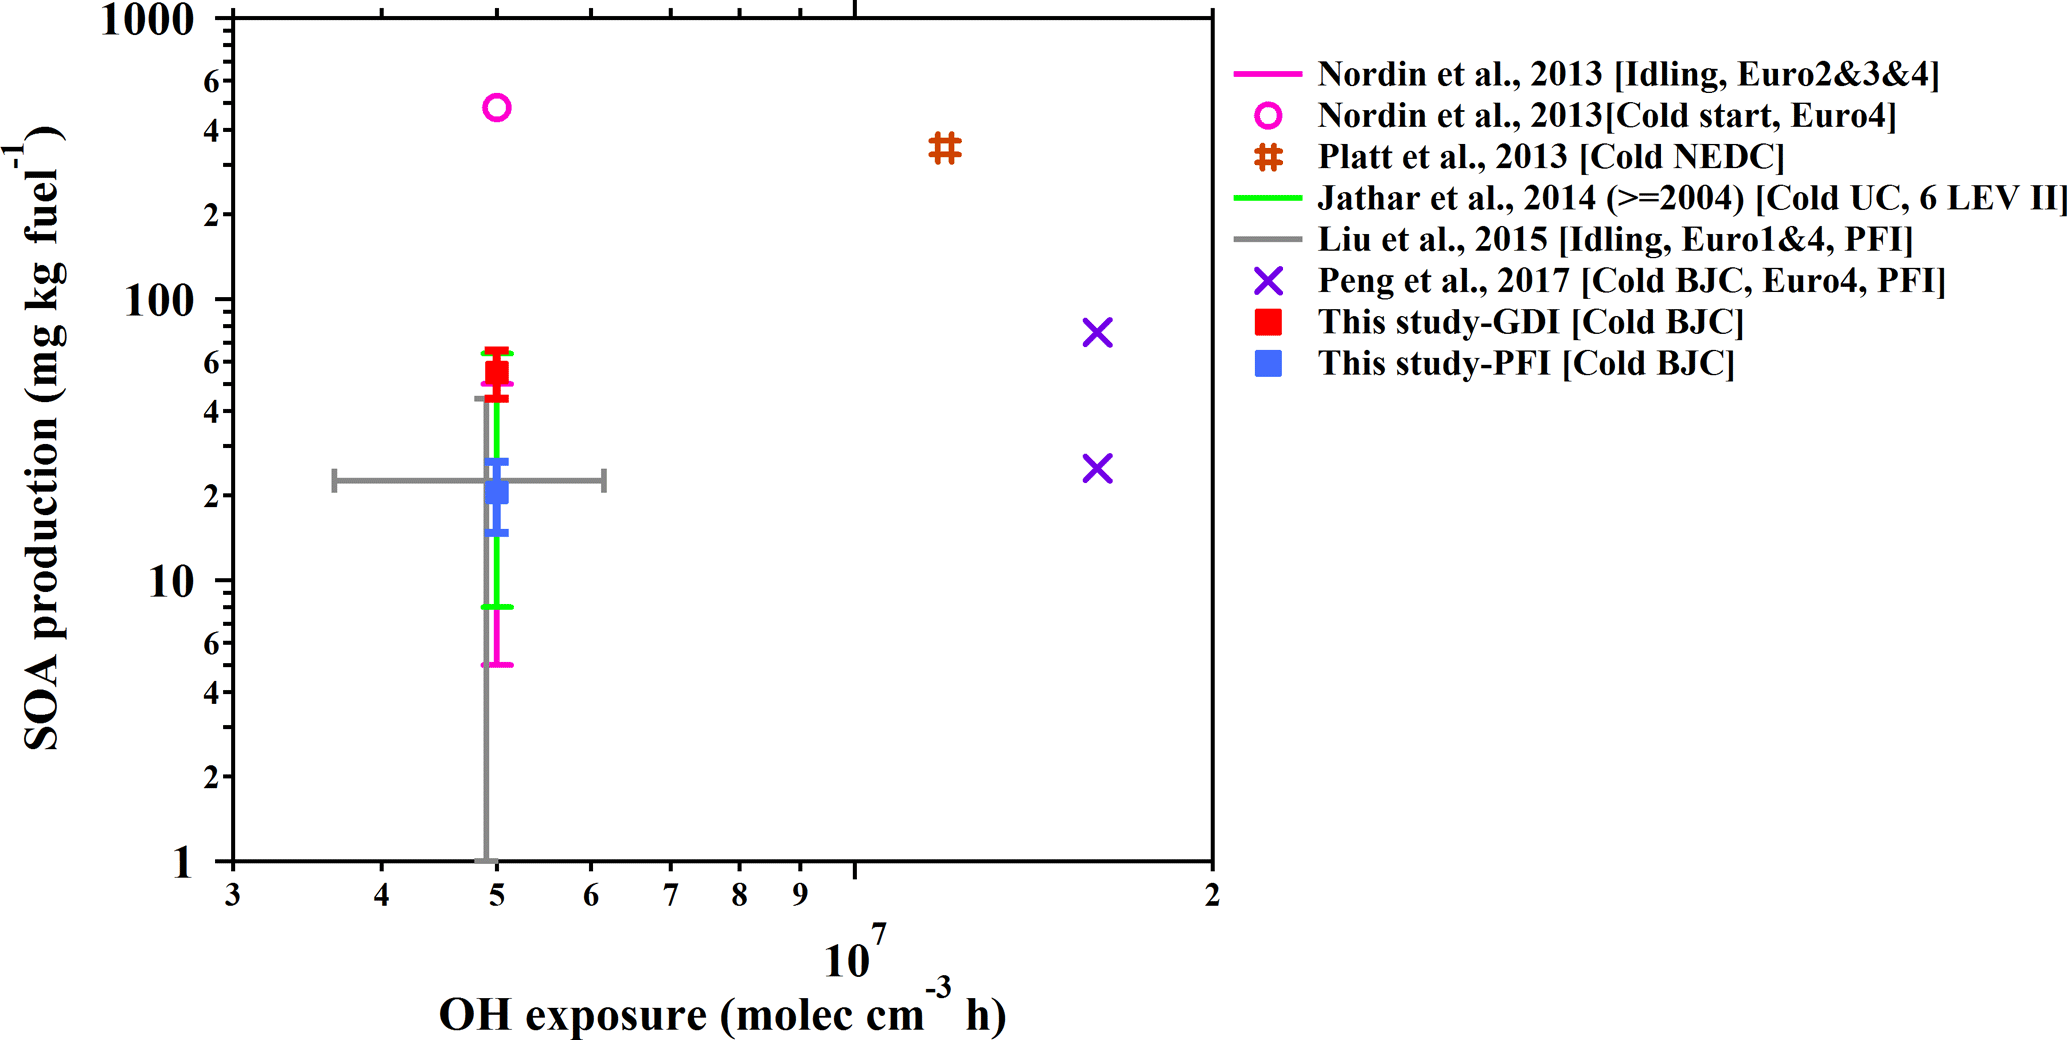
Figure 5Fuel-based SOA production from gasoline vehicle exhaust as a function of OH exposure in the chamber simulations. The SOA production data are from published studies of chamber simulations of gasoline vehicle exhaust. From the study of Jathar et al. (2014), the SOA production of vehicles manufactured in 2004 or later (LEV II) is selected, which is a model year that is more close to those of the vehicles in this study. The error bars of previous results indicate the range of OH exposure (x axis) and SOA production (y axis) in their simulations. The driving cycles and vehicle information are also noted in the legend of each study.

Figure 6EC and POA EFs as well as corrected SOA production factors from the GDI and PFI vehicle exhausts in this study (OH exposure of 5 × 10⁶ molecular cm−3 h).
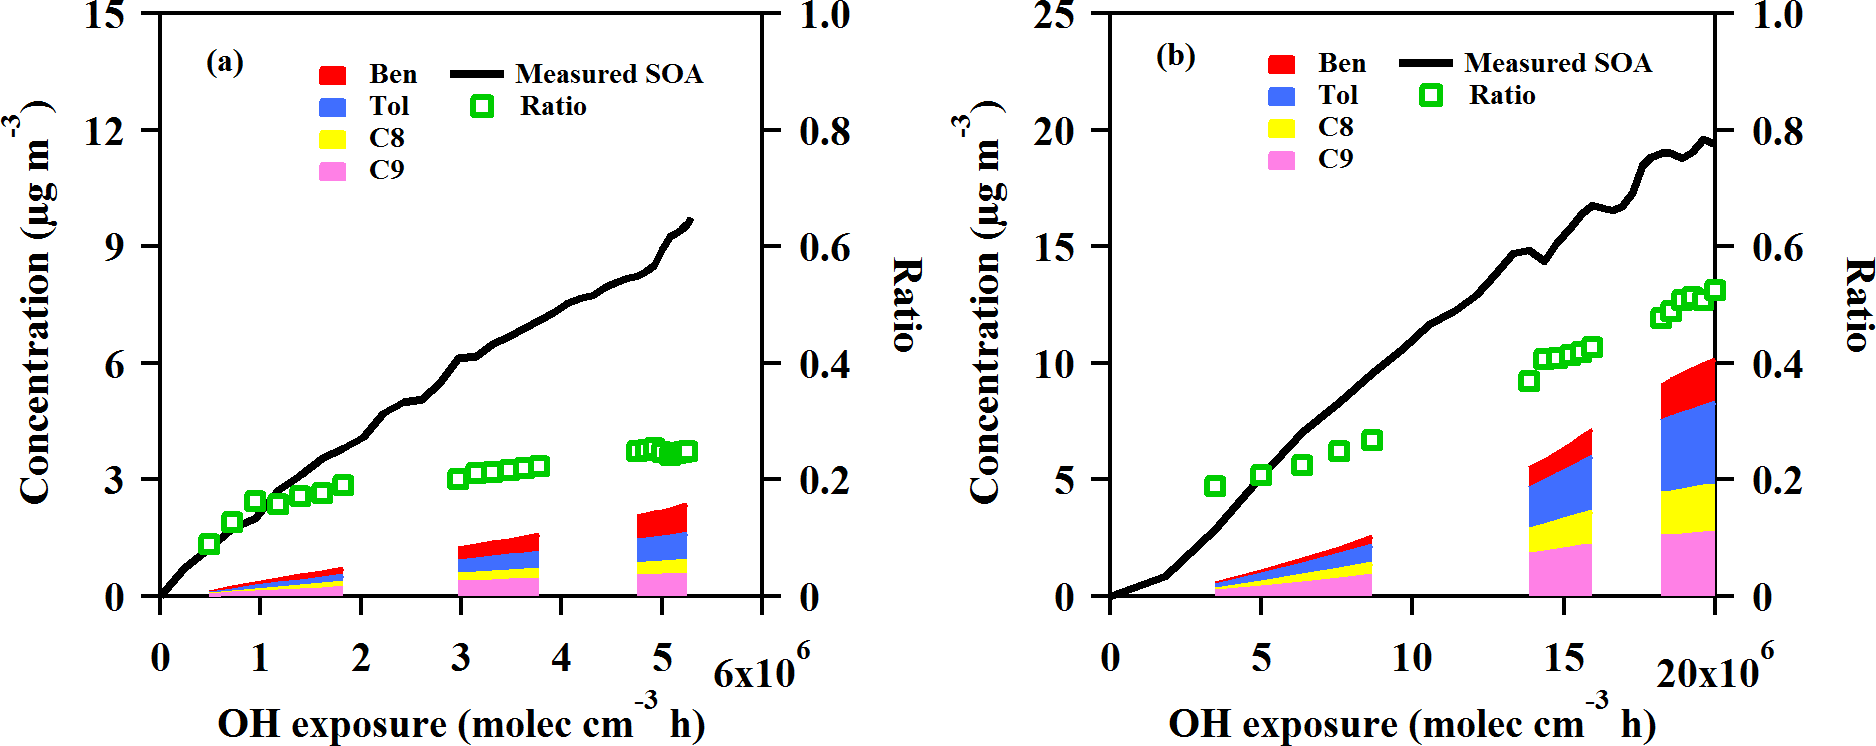
Figure 7Measured and predicted SOA concentration as a function of OH exposure from GDI vehicle exhaust (a) and PFI vehicle exhaust (b) in the chamber experiments. The black line is the measured SOA concentration with wall loss and particle dilution correction during the experiment. The red, blue, yellow and pink areas are predicted SOA concentration estimated from benzene, toluene, C8 alkylbenzene and C9 alkylbenzene, respectively. The green markers are the ratios of the predicted SOA to the measured SOA.
After the aging experiment started (t = 0 in Fig. 3), NO was formed from NO2 photolysis, which then reacted with O3 to form NO2. The O3 concentration increased rapidly to a maximum within 2–3 h and then decreased via reactions and dilution. Benzene and toluene decayed at different rates during the aging process.
New particle formation was found inside the chamber 15 min after the exhaust was exposed to sunlight, providing substantial seeds for secondary aerosol formation. Significant growth of particles in both size and mass was observed in the chamber, indicating that a large amount of secondary aerosol was formed during the photochemical oxidation. The chemical composition of the secondary aerosols was measured continuously by a HR-Tof-AMS. Organics were the dominant composition of the secondary aerosol, accounting for 88–95 % of the total particle mass inside the chamber (Fig. S1), which is consistent with our previous research (Peng et al., 2017). The SOA mass exhibited a different growth rate for the two types of vehicles. After a 4 h oxidation in the chamber, the SOA formed from the exhaust of the GDI vehicle was approximately double that of the PFI vehicle.
The solar radiation conditions significantly influenced the SOA formation. Thus, OH exposure was used to characterize the photochemical age as a normalization, instead of the experiment time. Two VOC species with noticeable differences in their reaction rate constants with OH radicals could be utilized to calculate the OH exposure ([OH] Δt) based on Eq. (1) (for benzene and toluene, as used in this study) (Yuan et al., 2012).
where kT and kB are the OH rate constants of benzene (1.2 × 10⁻¹² cm3 molecule−1 s−1) (Yuan et al., 2012) and toluene (5.5 × 10⁻¹² cm3 molecule−1 s−1) (Kramp and Paulson, 1998), respectively. is the concentration ratio of toluene to benzene at the beginning of the aging process, and is their concentration ratio measured during the aging process.
The SOA concentrations as a function of OH exposure are illustrated in Fig. 4. Wall-loss correction and dilution correction, including both particles and gaseous pollutants, were taken into consideration in the calculation of the SOA mass concentration in the chamber. Detailed descriptions of corrections are given in the Supplement. Assuming the mean OH concentration was 1.6 × 10⁶ molecular cm−3 in Beijing (Lu et al., 2013), the whole aging procedure in the chamber experiments was equal to a 6–10 h atmospheric photochemical oxidation. The average SOA concentrations were 9.25 ± 1.80 and 4.68 ± 1.32 µg m−3 for the GDI and PFI vehicles, respectively, when the OH exposure was 5 × 10⁶ molecular cm−3 h in the chamber. Considering the driving cycle mileage and fuel consumption, the SOA productions were 54.77 ± 10.70 mg kg fuel−1 or 3.06 ± 0.60 mg km−1 for the GDI vehicle and 20.57 ± 5.82 mg kg fuel−1 or 1.55 ± 0.44 mg km−1 for the PFI vehicle. Compared with the PFI vehicle, the GDI vehicle exhaust exhibited a higher potential of SOA formation, even though the PFI vehicle emitted more VOCs, which are considered as dominant classes of SOA precursors. This result indicates that higher concentrations of some other SOA precursors exist in the exhaust of GDI vehicles, which will be further discussed in Sect. 3.3.
The results from chamber simulations of SOA formation from individual gasoline vehicles are illustrated in Fig. 5. The SOA production from the both vehicles in this study is in the range of the results of previous studies (Nordin et al., 2013; Platt et al., 2013; Jathar et al., 2014; Liu et al., 2015; Peng et al., 2017). The variation of the SOA production among these studies might be caused by several factors: the model years of vehicles (corresponding to emission standards) (Nordin et al., 2013; Liu et al., 2015), their driving cycles (Nordin et al., 2013), the initial concentrations of gaseous pollutants in the chamber (Jathar et al., 2014) and the ratio of VOCs to NOx (Zhao et al., 2017) in the chamber experiments.
To investigate the dominant contributors to ambient PM from the GDI and PFI vehicles, Fig. 6 illustrates the EFs of EC and POA as well as the production factors of SOA in this study. The SOA production from the GDI vehicle was approximately 2.7 times higher than that from the PFI vehicle. At 5 × 10⁶ molecular cm−3 h OH exposure, the SOA ∕ POA ratio was close to unity. Fig. 4 illustrates that the SOA production increased with photochemical age rapidly (within 2 × 10⁷ molecular cm−3 h). Thus, SOA would exceed POA at higher OH exposure; e.g., the SOA ∕ POA ratio reached about 4 at 107 molecular cm−3 h OH exposure, becoming the major PM contributor. In terms of the POA and EC emissions as well as the SOA formation, the GDI vehicle contributed 2.2 times more than the PFI vehicle.
Although particle wall loss correction as well as particle and gas dilution corrections were considered in this study, several factors may still contribute to the uncertainties of the SOA production. First, the loss of semi-volatile vapors to the chamber walls was not corrected, which may result in an underestimation of the rate of SOA production with a factor of 1.1–4.1 (Zhang et al., 2014). Second, under some ambient conditions such as severe urban haze events (Guo et al., 2014), particle mass concentrations can be as high as 200–300 µg m−3, much higher than the 23 ± 6 µg m−3 under the chamber conditions of this study. High particle mass loadings are favorable for the partitioning of semi-volatile compounds into the particle phase, potentially increasing SOA mass yields (Odum et al., 1996; Donahue et al., 2006). Third, stronger partitioning of SOA precursors into the particle phase may reduce oxidation rate in the gas phase, which will potentially reduce the rate of SOA production (Seinfeld et al., 2003; Donahue et al., 2006).
3.3 SOA mass closure
SOA production (ΔOApredicted) estimated from VOC precursors can be defined as in Eq. (2):
where Δi is the concentration change of precursor VOCi measured with PTR-MS in the chamber experiments, and Yi is the SOA yield of the VOCi. In this study, benzene, toluene, C8 alkylbenzene (e.g., ethylbenzene and o-, m- and p-xylene) and C9 alkylbenzene (e.g., n- and i-propylbenzene, o-, m- and p-ethyltoluene and 1,2,3-, 1,2,4- and 1,3,5-trimethylbenzene) were involved in the estimation of SOA production, and alkanes and alkenes were not considered. A recent study found that ozonolysis of alkenes from gasoline vehicle exhaust could form SOA through aldol condensation reactions (Yang et al., 2018). However, much lower declines of concentrations were observed than those of aromatics during chamber experiments, so alkenes might not play a significant role in SOA formation in this study.
The SOA yield is sensitive to the VOCs ∕ NOx ratio (Song et al., 2005). In this study, the VOCs ∕ NOx ratio was in the range of 0.5–1.0 ppbC ∕ ppb; thus, the SOA formation from the vehicle exhaust was determined under high NOx conditions. The high NOx SOA yields of benzene and toluene were taken from Ng et al. (2007). The C8 and C9 alkylbenzenes used the SOA yield of m-xylene from Platt et al. (2013).
The increased predicted SOA contribution from the VOC precursors as a function of OH exposure accumulation is demonstrated in Fig. 7. At the end of the experiments, the SOA estimated from these speciated VOCs accounted for about 25 and 53 % of the measured SOA formation from the GDI and PFI vehicle exhausts, respectively. Similar to the results of previous studies (Platt et al., 2013; Nordin et al., 2013; Gordon et al., 2014), single-ring aromatics play an important role in the SOA formation, especially for the PFI vehicle which shows a higher predicted SOA fraction.
The unpredicted fraction of the measured SOA in the chamber experiments was in the range of 47–75 %. Contributions from IVOCs and semi-volatile organic compounds (SVOCs), e.g., long-branched and cyclic alkanes and gas-phase polycyclic aromatic hydrocarbons, could be a possible explanation for this underestimation because of the finding that the SOA formed by oxidation of IVOCs and SVOCs dominates over that from single-ring aromatics (Robinson et al., 2007). In addition, using a CMAQ and a 2D-VBS box model, a previous study showed that oxidation of semi-volatile POA and IVOCs from vehicles was an important source of SOA in China, and the model–measurement agreement was improved significantly when they were taken into consideration (Zhao et al., 2016a). The unpredicted SOA ratio exhibited a maximum value at the beginning of the experiment, indicating that the IVOCs and SVOCs with low volatilities produced SOA much more efficiently than the single-ring aromatics with high volatilities, as the first-generation products of photo-oxidation of these precursors form SOA (Robinson et al., 2007).
The larger fraction of the unpredicted SOA from the GDI vehicle exhaust might be associated with higher IVOCs and SVOCs emissions. Gas-phase PAH is one of the main components of speciated IVOCs (Zhao et al., 2016b). The particulate-phase PAHs from the GDI vehicle were more abundant than those from the PFI vehicle by a factor of 1.5 (Sect. 3.1). Based on gas–particle equilibrium, this indicates that more gas-phase PAHs, including some aromatic IVOCs, might be emitted by the GDI vehicles, which contribute to the SOA enhancement.
GDI and PFI vehicles have different fuel injection technologies in their engines, which affects their emissions of gaseous and particulate pollutants. In the GDI engine, the fuel is directly injected into the cylinder, which benefits the fuel atomization and vaporization and provides better control of the fuel volume and the combustion process (Liang et al. 2013; Gao et al., 2015). Thus, in this study, the tested GDI vehicle has higher fuel economy and lower THC emission than the PFI vehicle. However, the insufficient mixing time allowed for the fuel and air leads to incomplete combustion in the GDI engine (Fu et al., 2014). In addition, direct fuel injection leads to fuel impingement onto surfaces of the combustion chamber, where liquid pools form, favoring soot-like particulate formation (Ueberall et al., 2015; Chen et al., 2017). Consequently, larger particle mass and number are emitted by the GDI vehicle than by the PFI vehicle. The particles emitted by the GDI vehicle have a higher EC mass fraction, leading to a lower OC ∕ EC ratio. The considerable particle number emitted by gasoline vehicles, especially in GDI vehicle exhaust, makes a significant contribution to particle number concentration as well as seeds for further reactions in the atmosphere, and needs to be controlled in the future emission standards.
Our results show that the GDI vehicle contributes more to both primary and secondary aerosol than the PFI vehicle, and has a greater impact on the environment and air quality. In recent years, the market share of GDI vehicles has demonstrated a continuous growth in China because they provide better fuel economy and lower CO2 emissions. In 2016, GDI vehicles accounted for 25 % of China's market share in sales, and this proportion is expected to reach 60 % by 2020 (Wen et al., 2016). The PM enhancement of GDI vehicles with increasing population could potentially offset any PM emission reduction benefits, including the development of gasoline emission and fuel standards and the advanced engine technologies of gasoline vehicles. Therefore, our results highlight the necessity of further research and regulation of GDI vehicles.
It should be pointed out that the SOA formation factors in this study are based on one GDI vehicle and one PFI vehicle. Some previous studies proposed that vehicles have variations even though they meet similar specification vehicles and use the same fuel (Gordon et al., 2014; Jathar et al., 2014). Thus more research with more vehicles for each technology is needed on SOA formation from vehicle exhaust.
Primary emissions and secondary organic formation from one GDI vehicle and one PFI vehicle were investigated when driving under the cold-start BJC. The primary PM emitted by the GDI vehicle was 1.4 times greater than that emitted by the PFI vehicle, and the SOA formation from the GDI vehicle exhaust was 2.7 times greater than that from the PFI vehicle exhaust for the same OH exposure. The SOA production factors were 54.77 ± 10.70 mg kg fuel−1 or 3.06 ± 0.60 mg km−1 for the GDI vehicle and 20.57 ± 5.82 mg kg fuel−1 or 1.55 ± 0.44 mg km−1 for the PFI vehicle at an OH exposure of 5 × 10⁶ molecular cm−3 h, which is consistent with the values seen in previous studies. Considering the higher amounts of OA derived from primary emission and secondary formation, the GDI vehicle contributes considerably more to particle mass concentration in the ambient air than the PFI vehicle.
The SOA formation was predicted from the gaseous precursors emitted by the GDI and PFI vehicles under high NOx conditions. Single-ring aromatic VOCs could only explain 25–53 % of the measured SOA formation in the chamber experiments. The GDI vehicle exhibited a higher fraction of unexplained SOA. More IVOCs and SVOCs were inferred as being emitted by the GDI vehicle.
With an increasing population of GDI vehicles, any benefits of the aerosol emission reduction of gasoline vehicles are substantially offset because GDI vehicles contribute significantly to ambient aerosols. More work is needed to improve the understanding of GDI vehicle emissions and to provide information for the regulation of gasoline vehicles.
The data presented in this article are available from the authors upon request (minhu@pku.edu.cn).
The supplement related to this article is available online at: https://doi.org/10.5194/acp-18-9011-2018-supplement.
The authors declare that they have no conflict of interest.
This work was supported by the National Basic Research Program of China (973
Program) (2013CB228503, 2013CB228502), the National Natural Science Foundation
of China (91544214, 41421064, 51636003), the Strategic Priority Research
Program of Chinese Academy of Sciences (XDB05010500), the China Postdoctoral
Science Foundation (2015M580929) and the National Science and Technology
Support Program (2014BAC21B01). We also thank the State Key Lab of
Automotive Safety and Energy at Tsinghua University for support with experiments.
Edited by: Neil M. Donahue
Reviewed by: two anonymous referees
Alkidas, A. C.: Combustion advancements in gasoline engines, Energ. Convers. Manage., 48, 2751–2761, https://doi.org/10.1016/j.enconman.2007.07.027, 2007.
Bahreini, R., Middlebrook, A. M., de Gouw, J. A., Warneke, C., Trainer, M., Brock, C. A., Stark, H., Brown, S. S., Dube, W. P., Gilman, J. B., Hall, K., Holloway, J. S., Kuster, W. C., Perring, A. E., Prevot, A. S. H., Schwarz, J. P., Spackman, J. R., Szidat, S., Wagner, N. L., Weber, R. J., Zotter, P., and Parrish, D. D.: Gasoline emissions dominate over diesel in formation of secondary organic aerosol mass, Geophys. Res. Lett., 39, https://doi.org/10.1029/2011gl050718, 2012.
Chen, L., Liang, Z., Zhang, X., and Shuai, S.: Characterizing particulate matter emissions from GDI and PFI vehicles under transient and cold start conditions, Fuel, 189, 131–140, https://doi.org/10.1016/j.fuel.2016.10.055, 2017.
DeCarlo, P. F., Kimmel, J. R., Trimborn, A., Northway, M. J., Jayne, J. T., Aiken, A. C., Gonin, M., Fuhrer, K., Horvath, T., Docherty, K. S., Worsnop, D. R., and Jimenez, J. L.: Field-deployable, high-resolution, time-of-flight aerosol mass spectrometer, Anal. Chem., 78, 8281–8289, https://doi.org/10.1021/ac061249n, 2006.
Donahue, N. M., Robinson, A. L., Stanier, C. O., and Pandis, S. N.: Coupled partitioning, dilution, and chemical aging of semivolatile organics, Environ. Sci. Technol., 40, 2635–2643, https://doi.org/10.1021/es052297c, 2006.
Du, Z., Hu, M., Peng, J., Guo, S., Zheng, R., Zheng, J., Shang, D., Qin, Y., Niu, H., Li, M., Yang, Y., Lu, S., Wu, Y., Shao, M., and Shuai, S.: Potential of secondary aerosol formation from Chinese gasoline engine exhaust, J. Environ. Sci.-China, 66, 348–357, https://doi.org/10.1016/j.jes.2017.02.022, 2018.
Fu, H., Wang, Y., Li, X., and Shuai, S.: Impacts of Cold-Start and Gasoline RON on Particulate Emission from Vehicles Powered by GDI and PFI Engines, SAE Technical Paper, 2014-01-2836, 10 pp., https://doi.org/10.4271/2014-01-2836, 2014.
Gao, Z., Curran, S. J., Parks II, J. E., Smith, D. E., Wagner, R. M., Daw, C. S., Edwards, K. D., and Thomas, J. F.: Drive cycle simulation of high efficiency combustions on fuel economy and exhaust properties in light-duty vehicles, Appl. Energ., 157, 762–776, https://doi.org/10.1016/j.apenergy.2015.03.070, 2015.
Gordon, T. D., Presto, A. A., May, A. A., Nguyen, N. T., Lipsky, E. M., Donahue, N. M., Gutierrez, A., Zhang, M., Maddox, C., Rieger, P., Chattopadhyay, S., Maldonado, H., Maricq, M. M., and Robinson, A. L.: Secondary organic aerosol formation exceeds primary particulate matter emissions for light-duty gasoline vehicles, Atmos. Chem. Phys., 14, 4661–4678, https://doi.org/10.5194/acp-14-4661-2014, 2014.
Guo, S., Hu, M., Zamora, M. L., Peng, J., Shang, D., Zheng, J., Du, Z., Wu, Z., Shao, M., Zeng, L., Molina, M. J., and Zhang, R.: Elucidating severe urban haze formation in China, P. Natl. Acad. Sci. USA, 111, 17373–17378, https://doi.org/10.1073/pnas.1419604111, 2014.
Hayes, P. L., Ortega, A. M., Cubison, M. J., Froyd, K. D., Zhao, Y., Cliff, S. S., Hu, W. W., Toohey, D. W., Flynn, J. H., Lefer, B. L., Grossberg, N., Alvarez, S., Rappenglueck, B., Taylor, J. W., Allan, J. D., Holloway, J. S., Gilman, J. B., Kuster, W. C., De Gouw, J. A., Massoli, P., Zhang, X., Liu, J., Weber, R. J., Corrigan, A. L., Russell, L. M., Isaacman, G., Worton, D. R., Kreisberg, N. M., Goldstein, A. H., Thalman, R., Waxman, E. M., Volkamer, R., Lin, Y. H., Surratt, J. D., Kleindienst, T. E., Offenberg, J. H., Dusanter, S., Griffith, S., Stevens, P. S., Brioude, J., Angevine, W. M., and Jimenez, J. L.: Organic aerosol composition and sources in Pasadena, California, during the 2010 CalNex campaign, J. Geophys. Res.-Atmos., 118, 9233–9257, https://doi.org/10.1002/jgrd.50530, 2013.
Hays, M. D., Preston, W., George, B. J., Schmid, J., Baldauf, R., Snow, R., Robinson, J. R., Long, T., and Faircloth, J.: Carbonaceous aerosols emitted from light-duty vehicles operating on gasoline and ethanol fuel blends, Environ. Sci. Technol., 47, 14502–14509, https://doi.org/10.1021/es403096v, 2013.
Hu, W., Hu, M., Hu, W., Jimenez, J. L., Yuan, B., Chen, W., Wang, M., Wu, Y., Chen, C., Wang, Z., Peng, J., Zeng, L., and Shao, M.: Chemical composition, sources, and aging process of submicron aerosols in Beijing: Contrast between summer and winter, J. Geophys. Res.-Atmos., 121, 1955–1977, https://doi.org/10.1002/2015jd024020, 2016.
Huang, R.-J., Zhang, Y., Bozzetti, C., Ho, K.-F., Cao, J.-J., Han, Y., Daellenbach, K. R., Slowik, J. G., Platt, S. M., Canonaco, F., Zotter, P., Wolf, R., Pieber, S. M., Bruns, E. A., Crippa, M., Ciarelli, G., Piazzalunga, A., Schwikowski, M., Abbaszade, G., Schnelle-Kreis, J., Zimmermann, R., An, Z., Szidat, S., Baltensperger, U., Haddad, I. E., and Prévôt, A. S. H.: High secondary aerosol contribution to particulate pollution during haze events in China, Nature, 514, 218–222, https://doi.org/10.1038/nature13774, 2014.
Jathar, S. H., Gordon, T. D., Hennigan, C. J., Pye, H. O. T., Pouliot, G., Adams, P. J., Donahue, N. M., and Robinson, A. L.: Unspeciated organic emissions from combustion sources and their influence on the secondary organic aerosol budget in the United States, Proc. Natl. Acad. Sci. USA, 111, 10473–10478, https://doi.org/10.1073/pnas.1323740111, 2014.
Jathar, S. H., Woody, M., Pye, H. O. T., Baker, K. R., and Robinson, A. L.: Chemical transport model simulations of organic aerosol in southern California: model evaluation and gasoline and diesel source contributions, Atmos. Chem. Phys., 17, 4305–4318, https://doi.org/10.5194/acp-17-4305-2017, 2017.
Kamal, A., Cincinelli, A., Martellini, T., and Malik, R. N.: A review of PAH exposure from the combustion of biomass fuel and their less surveyed effect on the blood parameters, Environ. Sci. Pollut. R., 22, 4076–4098, https://doi.org/10.1007/s11356-014-3748-0, 2015.
Kanakidou, M., Seinfeld, J. H., Pandis, S. N., Barnes, I., Dentener, F. J., Facchini, M. C., Van Dingenen, R., Ervens, B., Nenes, A., Nielsen, C. J., Swietlicki, E., Putaud, J. P., Balkanski, Y., Fuzzi, S., Horth, J., Moortgat, G. K., Winterhalter, R., Myhre, C. E. L., Tsigaridis, K., Vignati, E., Stephanou, E. G., and Wilson, J.: Organic aerosol and global climate modelling: a review, Atmos. Chem. Phys., 5, 1053–1123, https://doi.org/10.5194/acp-5-1053-2005, 2005.
Kramp, F. and Paulson, S. E.: On the uncertainties in the rate coefficients for OH reactions with hydrocarbons, and the rate coefficients of the 1,3,5-trimethylbenzene and m-xylene reactions with OH radicals in the gas phase, J. Phys. Chem. A., 102, 2685–2690, https://doi.org/10.1021/jp973289o, 1998.
Li, M., Hu, M., Wu, Y., Qin, Y., Zheng, R., Peng, J., Guo, Q., Xiao, Y., Hu, W., Zheng, J., Du, Z., Xiao, J., and Shuai, S.: Characteristics of Particulate Organic Matters Emissions from Gasoline Direct Injection Engine and Its Influence Factors, Proceedings of the Chinese Society of Electrical Engineering, 36, 4443–4451, 2016.
Liang, B., Ge, Y., Tan, J., Han, X., Gao, L., Hao, L., Ye, W., and Dai, P.: Comparison of PM emissions from a gasoline direct injected (GDI) vehicle and a port fuel injected (PFI) vehicle measured by electrical low pressure impactor (ELPI) with two fuels: Gasoline and M15 methanol gasoline, J. Aerosol. Sci., 57, 22–31, https://doi.org/10.1016/j.jaerosci.2012.11.008, 2013.
Lindinger, W., Hansel, A., and Jordan, A.: On-line monitoring of volatile organic compounds at pptv levels by means of proton-transfer-reaction mass spectrometry (PTR-MS) – Medical applications, food control and environmental research, Int. J. Mass. Spectrom., 173, 191–241, https://doi.org/10.1016/s0168-1176(97)00281-4, 1998.
Liu, T., Wang, X., Deng, W., Hu, Q., Ding, X., Zhang, Y., He, Q., Zhang, Z., Lü, S., Bi, X., Chen, J., and Yu, J.: Secondary organic aerosol formation from photochemical aging of light-duty gasoline vehicle exhausts in a smog chamber, Atmos. Chem. Phys., 15, 9049–9062, https://doi.org/10.5194/acp-15-9049-2015, 2015.
Lu, K. D., Hofzumahaus, A., Holland, F., Bohn, B., Brauers, T., Fuchs, H., Hu, M., Häseler, R., Kita, K., Kondo, Y., Li, X., Lou, S. R., Oebel, A., Shao, M., Zeng, L. M., Wahner, A., Zhu, T., Zhang, Y. H., and Rohrer, F.: Missing OH source in a suburban environment near Beijing: observed and modelled OH and HO2 concentrations in summer 2006, Atmos. Chem. Phys., 13, 1057–1080, https://doi.org/10.5194/acp-13-1057-2013, 2013.
Maria, S. F., Russell, L. M., Gilles, M. K., and Myneni, S. C. B.: Organic aerosol growth mechanisms and their climate-forcing implications, Science, 306, 1921–1924, https://doi.org/10.1126/science.1103491, 2004.
Maricq, M. M., Podsiadlik, D. H., and Chase, R. E.: Gasoline vehicle particle size distributions: Comparison of steady state, FTP, and US06 measurements, Environ. Sci. Technol., 33, 2007–2015, https://doi.org/10.1021/es981005n, 1999.
Mathis, U., Mohr, M., and Forss, A. M.: Comprehensive particle characterization of modern gasoline and diesel passenger cars at low ambient temperatures, Atmos. Environ., 39, 107–117, https://doi.org/10.1016/j.atmosenv.2004.09.029, 2005.
May, A. A., Nguyen, N. T., Presto, A. A., Gordon, T. D., Lipsky, E. M., Karve, M., Gutierrez, A., Robertson, W. H., Zhang, M., Brandow, C., Chang, O., Chen, S., Cicero-Fernandez, P., Dinkins, L., Fuentes, M., Huang, S.-M., Ling, R., Long, J., Maddox, C., Massetti, J., McCauley, E., Miguel, A., Na, K., Ong, R., Pang, Y., Rieger, P., Sax, T., Tin, T., Thu, V., Chattopadhyay, S., Maldonado, H., Maricq, M. M., and Robinson, A. L.: Gas- and particle-phase primary emissions from in-use, on-road gasoline and diesel vehicles, Atmos. Environ., 88, 247–260, https://doi.org/10.1016/j.atmosenv.2014.01.046, 2014.
Myung, C.-L., Kim, J., Choi, K., Hwang, I. G., and Park, S.: Comparative study of engine control strategies for particulate emissions from direct injection light-duty vehicle fueled with gasoline and liquid phase liquefied petroleum gas (LPG), Fuel, 94, 348–355, https://doi.org/10.1016/j.fuel.2011.10.041, 2012.
Ng, N. L., Kroll, J. H., Chan, A. W. H., Chhabra, P. S., Flagan, R. C., and Seinfeld, J. H.: Secondary organic aerosol formation from m-xylene, toluene, and benzene, Atmos. Chem. Phys., 7, 3909–3922, https://doi.org/10.5194/acp-7-3909-2007, 2007.
Nordin, E. Z., Eriksson, A. C., Roldin, P., Nilsson, P. T., Carlsson, J. E., Kajos, M. K., Hellén, H., Wittbom, C., Rissler, J., Löndahl, J., Swietlicki, E., Svenningsson, B., Bohgard, M., Kulmala, M., Hallquist, M., and Pagels, J. H.: Secondary organic aerosol formation from idling gasoline passenger vehicle emissions investigated in a smog chamber, Atmos. Chem. Phys., 13, 6101–6116, https://doi.org/10.5194/acp-13-6101-2013, 2013.
Odum, J. R., Hoffmann, T., Bowman, F., Collins, D., Flagan, R. C., and Seinfeld, J. H.: Gas/particle partitioning and secondary organic aerosol yields, Environ. Sci. Technol., 30, 2580–2585, https://doi.org/10.1021/es950943+, 1996.
Peng, J., Hu, M., Du, Z., Wang, Y., Zheng, J., Zhang, W., Yang, Y., Qin, Y., Zheng, R., Xiao, Y., Wu, Y., Lu, S., Wu, Z., Guo, S., Mao, H., and Shuai, S.: Gasoline aromatics: a critical determinant of urban secondary organic aerosol formation, Atmos. Chem. Phys., 17, 10743–10752, https://doi.org/10.5194/acp-17-10743-2017, 2017.
Platt, S. M., El Haddad, I., Zardini, A. A., Clairotte, M., Astorga, C., Wolf, R., Slowik, J. G., Temime-Roussel, B., Marchand, N., Ježek, I., Drinovec, L., Mčcnik, G., Möhler, O., Richter, R., Barmet, P., Bianchi, F., Baltensperger, U., and Prévôt, A. S. H.: Secondary organic aerosol formation from gasoline vehicle emissions in a new mobile environmental reaction chamber, Atmos. Chem. Phys., 13, 9141–9158, https://doi.org/10.5194/acp-13-9141-2013, 2013.
Robinson, A. L., Donahue, N. M., Shrivastava, M. K., Weitkamp, E. A., Sage, A. M., Grieshop, A. P., Lane, T. E., Pierce, J. R., and Pandis, S. N.: Rethinking organic aerosols: Semivolatile emissions and photochemical aging, Science, 315, 1259–1262, https://doi.org/10.1126/science.1133061, 2007.
Saliba, G., Saleh, R., Zhao, Y., Presto, A. A., Lambe, A. T., Frodin, B., Sardar, S., Maldonado, H., Maddox, C., May, A. A., Drozd, G. T., Goldstein, A. H., Russell, L. M., Hagen, F., and Robinson, A. L.: Comparison of Gasoline Direct-Injection (GDI) and Port Fuel Injection (PFI) Vehicle Emissions: Emission Certification Standards, Cold-Start, Secondary Organic Aerosol Formation Potential, and Potential Climate Impacts, Environ. Sci. Technol., 51, 6542–6552, https://doi.org/10.1021/acs.est.6b06509, 2017.
Schauer, J. J., Kleeman, M. J., Cass, G. R., and Simoneit, B. R. T.: Measurement of Emissions from Air Pollution Sources. 5. C1-C32 Organic Compounds from Gasoline-Powered Motor Vehicles, Environ. Sci. Technol., 36, 1169–1180, https://doi.org/10.1021/es0108077, 2002.
Seinfeld, J. H., Kleindienst, T. E., Edney, E. O., and Cohen, J. B.: Aerosol growth in a steady-state, continuous flow chamber: Application to studies of secondary aerosol formation, Aerosol. Sci. Tech., 37, 728–734, https://doi.org/10.1080/02786820300915, 2003.
Song, C., Na, K. S., and Cocker, D. R.: Impact of the hydrocarbon to NOx ratio on secondary organic aerosol formation, Environ. Sci. Technol., 39, 3143–3149, https://doi.org/10.1021/es0493244, 2005.
Ueberall, A., Otte, R., Eilts, P., and Krahl, J.: A literature research about particle emissions from engines with direct gasoline injection and the potential to reduce these emissions, Fuel, 147, 203–207, https://doi.org/10.1016/j.fuel.2015.01.012, 2015.
Wang, Y., Zheng, R., Qin, Y., Peng, J., Li, M., Lei, J., Wu, Y., Hu, M., and Shuai, S.: The impact of fuel compositions on the particulate emissions of direct injection gasoline engine, Fuel, 166, 543–552, https://doi.org/10.1016/j.fuel.2015.11.019, 2016.
Wen, Y., Wang, Y., Fu, C., Deng, W., Zhan, Z., Tang, Y., Li, X., Ding, H., and Shuai, S.: The Impact of Injector Deposits on Spray and Particulate Emission of Advanced Gasoline Direct Injection Vehicle, SAE Technical Paper, 2016-01-2284, 10 pp., https://doi.org/10.4271/2016-01-2284, 2016.
Yang, B., Ma, P. K., Shu, J. N., Zhang, P., Huang, J. Y., and Zhang, H. X.: Formation mechanism of secondary organic aerosol from ozonolysis of gasoline vehicle exhaust, Environ. Pollut., 234, 960–968, https://doi.org/10.1016/j.envpol.2017.12.048, 2018.
Yuan, B., Shao, M., de Gouw, J., Parrish, D. D., Lu, S., Wang, M., Zeng, L., Zhang, Q., Song, Y., Zhang, J., and Hu, M.: Volatile organic compounds (VOCs) in urban air: How chemistry affects the interpretation of positive matrix factorization (PMF) analysis, J. Geophys. Res.-Atmos., 117, D24302, https://doi.org/10.1029/2012jd018236, 2012.
Zhang, Q., Jimenez, J. L., Canagaratna, M. R., Allan, J. D., Coe, H., Ulbrich, I., Alfarra, M. R., Takami, A., Middlebrook, A. M., Sun, Y. L., Dzepina, K., Dunlea, E., Docherty, K., DeCarlo, P. F., Salcedo, D., Onasch, T., Jayne, J. T., Miyoshi, T., Shimono, A., Hatakeyama, S., Takegawa, N., Kondo, Y., Schneider, J., Drewnick, F., Borrmann, S., Weimer, S., Demerjian, K., Williams, P., Bower, K., Bahreini, R., Cottrell, L., Griffin, R. J., Rautiainen, J., Sun, J. Y., Zhang, Y. M., and Worsnop, D. R.: Ubiquity and dominance of oxygenated species in organic aerosols in anthropogenically-influenced Northern Hemisphere midlatitudes, Geophys. Res. Lett., 34, L13801, https://doi.org/10.1029/2007gl029979, 2007.
Zhang, X., Cappa, C. D., Jathar, S. H., McVay, R. C., Ensberg, J. J., Kleeman, M. J., and Seinfeld, J. H.: Influence of vapor wall loss in laboratory chambers on yields of secondary organic aerosol, Proc. Natl. Acad. Sci. USA, 111, 5802–5807, https://doi.org/10.1073/pnas.1404727111, 2014.
Zhao, B., Wang, S., Donahue, N. M., Jathar, S. H., Huang, X., Wu, W., Hao, J., and Robinson, A. L.: Quantifying the effect of organic aerosol aging and intermediate-volatility emissions on regional-scale aerosol pollution in China, Sci. Rep.-UK, 6, 28815, https://doi.org/10.1038/srep28815, 2016a.
Zhao, Y., Nguyen, N. T., Presto, A. A., Hennigan, C. J., May, A. A., and Robinson, A. L.: Intermediate Volatility Organic Compound Emissions from On-Road Gasoline Vehicles and Small Off-Road Gasoline Engines, Environ. Sci. Technol., 50, 4554–4563, https://doi.org/10.1021/acs.est.5b06247, 2016b.
Zhao, Y., Saleh, R., Saliba, G., Presto, A. A., Gordon, T. D., Drozd, G. T., Goldstein, A. H., Donahue, N. M., and Robinson, A. L.: Reducing secondary organic aerosol formation from gasoline vehicle exhaust, P. Natl. Acad. Sci. USA, 114, 6984–6989, https://doi.org/10.1073/pnas.1620911114, 2017.
Zhu, R., Hu, J., Bao, X., He, L., Lai, Y., Zu, L., Li, Y., and Su, S.: Tailpipe emissions from gasoline direct injection (GDI) and port fuel injection (PFI) vehicles at both low and high ambient temperatures, Environ. Pollut., 216, 223–234, https://doi.org/10.1016/j.envpol.2016.05.066, 2016.
Zimmerman, N., Wang, J. M., Jeong, C.-H., Ramos, M., Hilker, N., Healy, R. M., Sabaliauskas, K., Wallace, J. S., and Evans, G. J.: Field Measurements of Gasoline Direct Injection Emission Factors: Spatial and Seasonal Variability, Environ. Sci. Technol., 50, 2035–2043, https://doi.org/10.1021/acs.est.5b04444, 2016.