the Creative Commons Attribution 4.0 License.
the Creative Commons Attribution 4.0 License.
 | 28 Jun 2018
Vertical distributions of aerosol optical properties during the spring 2016 ARIAs airborne campaign in the North China Plain
Fei Wang
Xinrong Ren
Qi Jiang
Russell R. Dickerson
Xiaobo Dong
Feng Lv
Vertical distributions of aerosol optical properties derived from measurements made during 11 aircraft flights over the North China Plain (NCP) in May–June 2016 during the Air Chemistry Research In Asia (ARIAs) were analyzed. Aerosol optical data from in situ aircraft measurements show good correlation with ground-based measurements. The regional variability of aerosol optical profiles such as aerosol scattering and backscattering, absorption, extinction, single scattering albedo (SSA), and the Ångström exponent (α) are thoroughly characterized for the first time over the NCP. The SSA at 550 nm showed a regional mean value of 0.85 ± 0.02 with moderate to strong absorption and the α ranged from 0.49 to 2.53 (median 1.53), indicating both mineral dust and accumulation-mode aerosols. Most of the aerosol particles were located in the lowest 2 km of the atmosphere. We describe three typical planetary boundary layer (PBL) scenarios and associated transport pathways as well as the correlation between aerosol scattering coefficients and relative humidity (RH). Aerosol scattering coefficients decreased slowly with height in the clean PBL condition, but decreased sharply above the PBL under polluted conditions, which showed a strong correlation (R2 ≥ 0.78) with ambient RH. Back-trajectory analysis shows that clean air masses generally originated from the distant northwestern part of China, while most of the polluted air masses were from the heavily polluted interior and coastal areas near the campaign region.


Aerosol loading in eastern China has become exceptionally heavy and highly variable due to drastic increases in the emissions of pollutants during the last several decades. Changes in air quality and climate are strongly coupled (Li et al., 2016), and both have tremendous impacts on the public health of the densely populated region (Kan et al., 2012).
Aerosol particles are considered to be an important radiative forcing agent in the climate system, but the detailed effects remain uncertain (Stocker et al., 2013). Aerosols modify the local and regional radiation budget and climate by absorbing and scattering solar radiation through the aerosol direct effect (Charlson and Hofmann, 1992) and impact photochemistry (Dickerson et al., 1997). Aerosols can also affect cloud–precipitation processes and aerosol–cryosphere interactions through indirect and semi-direct effects (Twomey, 1974; Lohmann and Feichter, 2005; Andreae and Rosenfeld, 2008; Nair et al., 2013). Several recent studies have shown that the magnitude of precipitation is strongly correlated to aerosol concentration (Zhao et al., 2006; Li et al., 2011; Tao et al., 2012), through various mechanisms as summarized most recently in Li et al. (2017b). Precipitation frequency and intensity are also altered by the long-term impacts of aerosols (Guo et al., 2016, 2017). Much of the uncertainty in aerosol radiative forcing comes from the variability of optical properties in anthropogenic aerosol such as scattering, absorption, backscatter, Ångström exponent (α), and aerosol optical depth (AOD). These properties depend strongly on particle size distribution, chemical composition, and the ambient relative humidity (Anderson et al., 2003). The spatial and temporal variations of these properties, especially horizontal and vertical distributions, are essential factors in the effects of aerosols on both climate and the environment (Haywood and Boucher, 2000).
Aerosol scattering and absorption coefficients (σsca and σabs, respectively) are important parameters related to atmospheric characteristics such as visibility and air quality. Observed σsca and σabs are generally distinct within versus above the planetary boundary layer (PBL). The structure of the PBL, in part determined by the vertical distribution of the aerosol extinction coefficient (σext, the sum of σsca and σabs), is a crucial factor in estimating aerosol pollution conditions (Yu et al., 2002; Dong et al., 2017), partially due to their strong interactions/coupling (Li et al., 2017a). Given the variability of PBL structure and its interaction with aerosols, the transport of pollutants is yet to be fully understood. Distinguishing between local air pollutants and pollutants transported from other source regions and identification of transport patterns under different atmospheric circulation conditions also need to be addressed. Dust aerosols can be lifted into the free troposphere, i.e., above the PBL, and transported over a long distance, altering aerosol vertical distributions over remote areas (Han et al., 2008). Topographically generated local circulations can carry high concentrations of surface air pollutants and change the PBL structure (Chen et al., 2009). Such variable aerosol vertical distributions can alter the optical properties of aerosols such as AOD, thus affecting the regional radiation balance (Liu et al., 2012) and even the global radiative forcing estimation (Zhang et al., 2013). A number of field programs have been carried out to measure the vertical distribution of dust or biomass burning aerosols with airborne and surface-based instruments (Johnson et al., 2008). The observations, combined with a radiative transfer model, allow the accurate calculation of radiative effects including aerosol optical properties (Gadhavi and Jayaraman, 2006) and absorption of solar radiation at the top of the atmosphere (Meloni et al., 2005).
Three-dimensional information about aerosol optical properties (especially vertical distributions) is of importance, but such measurements are scant (Kahn et al., 2017). Given the potential impact of aerosols on climate, additional accurate measurements of the vertical profiles of aerosol optical properties are needed. These data can be obtained directly or indirectly from platforms such as meteorological towers (Zhao et al., 2017), tethered balloons (Stratmann et al., 2003; Ferrero et al., 2010), and unmanned aerial vehicles (Corrigan et al., 2008). Although limited in terms of temporal and geographic coverage, airborne sensing provides direct, high-resolution, in situ aerosol vertical profiles, used to evaluate numerical models and satellite retrievals (Chazette and Liousse, 2001).
Airborne instruments have been used to characterize aerosol properties in the lower troposphere around the world (Wandinger et al., 2002; Haywood et al., 2003a; Taubman et al., 2004, 2006; Hains et al., 2008; Ferrero et al., 2011; Ryder et al., 2013; Kim et al., 2015; Schwarz et al., 2016; Babu et al., 2016), as well as in China, e.g., in Beijing (Zhang et al., 2006, 2009, 2011; Liu et al., 2009), Dongbei (Dickerson et al., 2007), Hebei (Sun et al., 2013), and Shanxi (Li et al., 2015a, b). Most of the measurements were made for parameters such as aerosol number concentration or size distribution.
In May–June 2016, a comprehensive joint ground and airborne experiment was conducted in the North China Plain (NCP). The study described here aimed to examine the consistency of airborne and surface-based measurements and to evaluate aerosol radiative characteristics and the distribution and transport of air pollutants both horizontally and vertically. It is an integral part of, also a foundation for, a series of studies on aerosol–cloud–climate interactions in a densely populated and rapidly developing region of China (Li et al., 2017a).
A twin-engine, turboprop airplane was deployed to measure trace gases and aerosol optical properties in the lower atmosphere, in coordination with ground-based in situ and remote measurements at the Xingtai supersite. The airplane flew ascents and descents in the boundary layer and the lower free troposphere to obtain vertical profiles of aerosol optical properties. High-resolution aircraft measurements of aerosol optical properties give detailed information about the occurrence, extent, and evolution of aerosol vertical distributions. Aerosol optical properties such as σsca and σabs, backscattering, extinction, single scattering albedo (SSA), α, and AOD from the airborne measurements are presented and discussed.
Details about the field experiment and the instruments used are given in Sect. 2. The vertical and regional distributions of aerosol optical properties are presented in Sect. 3. In Sect. 4, the structure of the PBL under both clean and polluted conditions, the correlation between vertical σsca and relative humidity (RH), and back-trajectory analyses are discussed. Section 5 summarizes the major conclusions from this study.
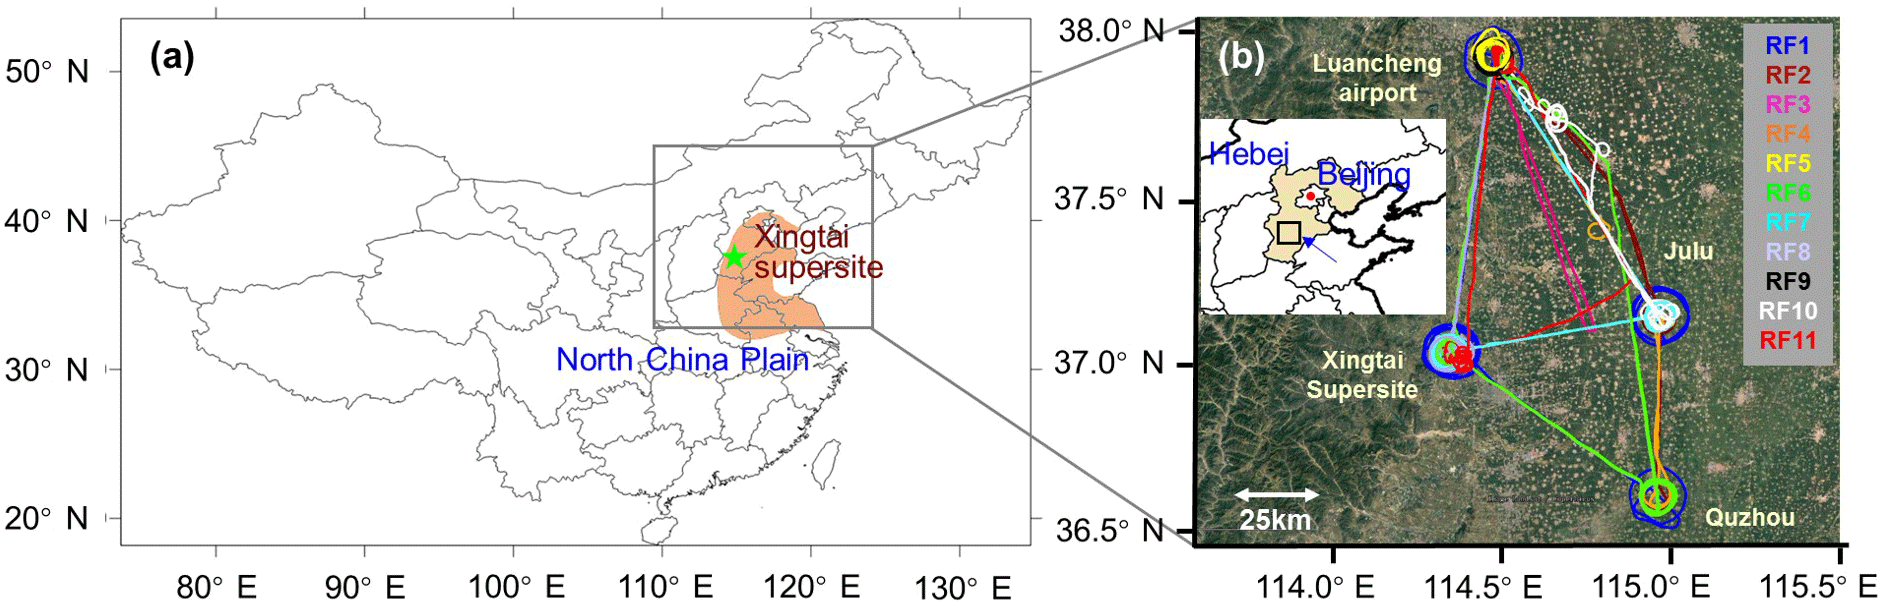
Figure 1Map of the geographic location of the North China Plain and the Xingtai supersite (a), and the flight tracks of the 11 research flights conducted over Hebei Province during May–June 2016 (b). The orange shaded area denotes the North China Plain.
2.1 Sites and flight information
The Aerosol Atmosphere Boundary-Layer Cloud (A2BC) campaign took place in Hebei Province of the NCP, about 300 km south of Beijing, from May to December 2016. An intensive observation period (IOP) was from May to June when airborne observations were conducted using two airplanes to measure aerosol and cloud properties, respectively. A supersite was established in Xingtai (XT; 114.36∘ E, 37.18∘ N; 182 m above sea level, or a.s.l.). The National Science Foundation supported the project “Air chemistry Research In Asia” (ARIAs), with the goal of integrating in situ observations, satellite remote sensing, and chemical transport models to characterize and quantify tropospheric chemistry and composition over the NCP and to improve modeling tools used to eventually evaluate the effectiveness of air pollutant reduction policies. NASA's Korean US Air Quality (KORUS-AQ) experiment was conducted at roughly the same time in the downwind region. One of the airplanes (Y-12), which was based at Luancheng Airport (LC; 114.59∘ E, 37.91∘ N; 58 m a.s.l.), located in the southeast of Shijiazhuang, the capital of Hebei Province, measured aerosol properties. The airplane was flown to three locations in the area to conduct spirals from ∼ 300 to ∼ 3.5 km, as shown in Fig. 1. These locations include XT, Julu (JL; 115.02∘ E, 37.22∘ N; 30 m a.s.l.), and Quzhou (QZ; 114.96∘ E, 36.76∘ N; 40 m a.s.l.). All four sites are located to the east of the Taihang Mountains, with XT right at the foothill of the mountain range. A total of 11 flights were conducted during the A2BC and ARIAs IOP (Table 1).
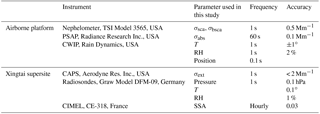
Comprehensive measurements of aerosol optical properties were made during the field campaign using the instrumented turboprop Y-12 airplane operated by the Weather Modification Office of Hebei Meteorological Bureau. The typical speed of the aircraft is 60–70 m s−1, with ascent/descent rates of 2–5 m s−1. The aircraft was equipped with multiple aerosol and gas measurement instruments, and was rigorously tested and calibrated during a ground-based campaign to optimize instrument performance. Table 2 summarizes the instruments deployed on the plane and ground.
2.2 Aircraft instruments
2.2.1 Nephelometer
Measurements of σsca from the Y-12 aircraft were made using an integrating nephelometer (TSI, model 3565) at three wavelengths: blue (450 nm), green (550 nm), and red (700 nm). Details about the instrument calibration and uncertainties have been described elsewhere (Anderson and Ogren, 1998; Anderson et al., 2009). The nephelometer was calibrated prior to the field campaign using CO2 gas and filtered zero air as described in the instrument manual. It aspirates air at a flow rate of 30 L min−1 through a forward-facing air inlet. Data were recorded at a frequency of 1 Hz.
Table 1Flight summary.
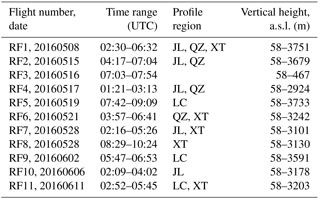
JL: Julu. LC: Luancheng Airport. QZ: Quzhou. XT: Xingtai.
The conical double diffuser aerosol inlet, designed for a Twin Otter, was installed on the Y-12. This inlet system was manufactured by Droplet Measurements Technologies (MP-1806-A and MP-1807-A, Boulder, CO, USA) (Hegg et al., 2005). It has been used extensively on the University of Maryland's Cessna 402 (Brent et al., 2015). The passing efficiency is expected to be near 100 % for particle diameters up to 2.5 µm and near 50 % for particles between 3 and 4 µm (Huebert et al., 2004; McNaughton et al., 2007).
The actual range of total scattering angles captured by the nephelometer is less than the ideal range of 0 to 180∘. To correct the biases, we adjusted them with empirically derived angular truncation correction factors using the calculated α (Anderson and Ogren, 1998). To account for the hygroscopic growth of aerosols, the scattering values were adjusted using a correction factor f(RH) (Anderson et al., 2003; Shinozuka et al., 2007), calculated as
where RHneph is the internal nephelometer RH, RHamb is the ambient RH, γ is an experimentally determined dry versus humid factor of the hygroscopicity (Beyersdorf et al., 2016), σsca_adj is the adjusted scattering coefficient, σsca is the measured scattering coefficient, and C is the angular truncation factor. During the study period, the relative uncertainty after calibration was around a few percent (evaluated from the reproducibility of laboratory measurements).
2.2.2 PSAP
A particle soot absorption photometer (PSAP, Radiance Research, 565 nm) provides highly sensitive absorption measurements without interference by scattering signals. Its observation principle and uncertainties have been well documented (Bond et al., 1999; Sheridan et al., 2005; Virkkula et al., 2005; Chaudhry et al., 2007). To ensure a steady sample flow during flights, we monitored the total flow and PSAP flow rates to enhance the accuracy of measurements. The instrument operates at a flow rate of 2 L min−1 when 1 min measurement averages are used. The raw absorption coefficients from the PSAP, , were corrected to 550 nm using Eq. (3):
where λi is the ith wavelength. Ideally, for this calculation, the absorption coefficient would also be measured under ambient conditions, but it is somewhat less dependent on humidification than scattering is (Schafer et al., 2014). Therefore, such calibrated measurement was not done during the field campaign.
2.2.3 Meteorological instruments
A cloud water inertial probe (CWIP, Rain Dynamics) measuring pressure, temperature (T), and RH was installed on the Y-12 aircraft. It was calibrated prior to the deployment and synchronized with the global positioning system (GPS) time and geolocation of the scientific data, dually calibrated by the GPS and the compass navigation satellite system (CNSS).
2.3 Instrumentation at the Xingtai supersite
A full suite of instruments to measure aerosol and meteorological parameters was deployed at the Xingtai surface supersite. Those of concern to this study include aerosol optical remote sensing observations (CIMEL radiometer), in situ particle light extinction measurements (cavity attenuated phase shift spectroscopy (CAPS) particle light extinction monitor), and radiosondes for meteorological parameters.
2.3.1 CAPS
We present field measurements of the ambient aerosol extinction coefficient (σext) by using a CAPS instrument with a time resolution of 1 s at the Xingtai supersite. This technique has advantages such as high sensitivity, cost efficiency, easy control, and a long effective absorption optical path. The CAPS instrument measures the phase shift of a distorted waveform of the modulated light from a light emitting diode (LED) in a sample cell with two high reflectivity mirrors (Sun et al., 2014). It has a demonstrated sensitivity of less than 2 Mm−1 for 1 s sampling periods. A method description, including results from laboratory characterization and field deployment, has been reported previously (Massoli et al., 2010). The CAPS extinction and the σext measured by the combination of the nephelometer and the PSAP showed a good correlation in both laboratory-generated test particles and ambient aerosols (Petzold et al., 2013). The detailed principles of the CAPS technology, optical path adjustment process, and calibration method can be found in previous studies (Kebabian et al., 2008; Kebabian and Freedman, 2007).
2.3.2 Radiosondes
For comparisons with airborne measurements, radiosondes (Model DFM-09, Graw Radiosonde GmbH & Co. KG, Germany) were launched from the Xingtai supersite during the IOP. The DFM-09 radiosonde is a lightweight weather radiosonde that measures temperature (at a resolution of 0.1 ∘C with an accuracy of 0.2 ∘C), pressure (at a resolution of 0.1 hPa with an accuracy of 0.5 hPa), RH (at a resolution of 1 % with an accuracy of 2 %), and wind speed (accuracy = 0.2 m s−1) (Navas-Guzmán et al., 2014). RH is measured by a thin-film capacitance sensor, and its uncertainties and errors depend on temperature and GPS location (Steinke et al., 2015). Data acquisition and processing were performed at the Graw ground station located at the Xingtai supersite using the Grawmet software.
2.3.3 CIMEL automatic Sun–sky radiometer
To obtain an optical characterization of aerosol vertical distribution and to complement airborne measurements, we deployed a CIMEL sun photometer, the standard instrument used in the Aerosol Robotic Network (AERONET). The CIMEL (CE-318) used at the Xingtai AERONET site is a two-detector eight-channel (340, 380, 440, 500, 675, 870, 940, and 1020 nm) radiometer designed to make, automatically track, and measure direct solar and sky radiances with a field of view of approximately 1.2∘. AOD and SSA are computed at each wavelength except the 940 nm channel, used to retrieve total column water vapor. The measurement uncertainty for field instruments, primarily due to calibration uncertainty, is spectrally dependent, with higher errors in the UV (Eck et al., 1999). The details of the CIMEL radiometer operating principles and network are described by Holben et al. (1998).
3.1 Comparison between aircraft and ground-based measurements
Ground-based measurements collected at XT were matched in time and space with airborne measurements over the site. Figure 2 shows the vertical profiles of RH and T from the sounding done at 05:55 coordinated universal time (UTC, 13:55 local time) on 8 May 2016 and from aircraft measurements made over the site before the radiosonde launch (04:40–05:40 UTC, one descent spiral and two ascent spirals). Both RH and T derived from sounding data and measured from the aircraft follow the same general trends, with inversions near 800 and 2400 m.
For a final evaluation of the performance of the airborne instruments in measuring ambient aerosol characteristics, the σext measured by the nephelometer/PSAP on board the aircraft and by the ground-based CAPS PMex during research flight (RF) 6 (RF6; 21 May), RF7 (28 May), RF8 (28 May), and RF11 (11 June) is shown in Fig. 3. CAPS-measured σext collected during the spiralling part of the flight was averaged and all σext data were adjusted to a wavelength of 550 nm. In general, mean values of surface σext were consistent with (∼ 12 % smaller than) the corresponding aircraft-measured σext located at the bottom of the profiles.
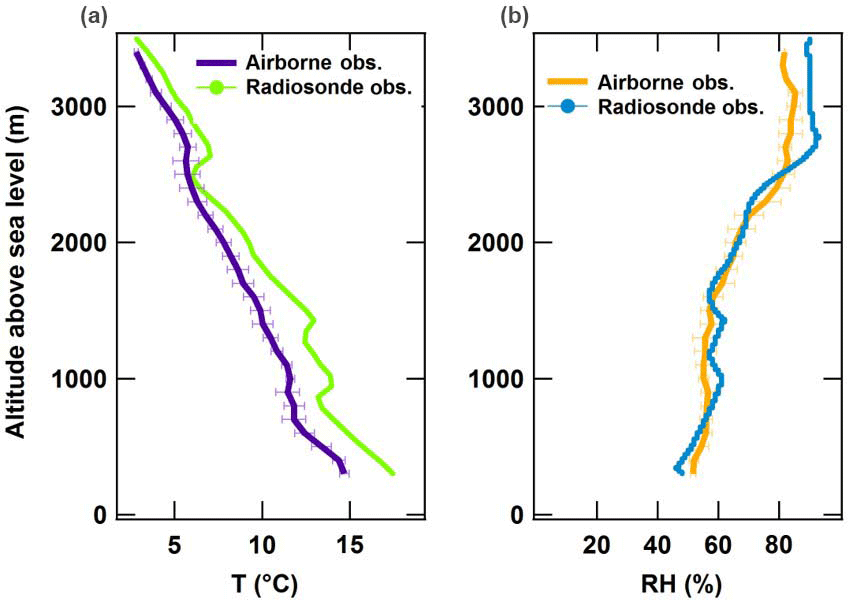
Figure 2Vertical profiles of temperature (T, a) and relative humidity (RH, b) from radiosonde and airborne measurements made on 8 May 2016 over the Xingtai supersite. Horizontal bars represented standard deviations.
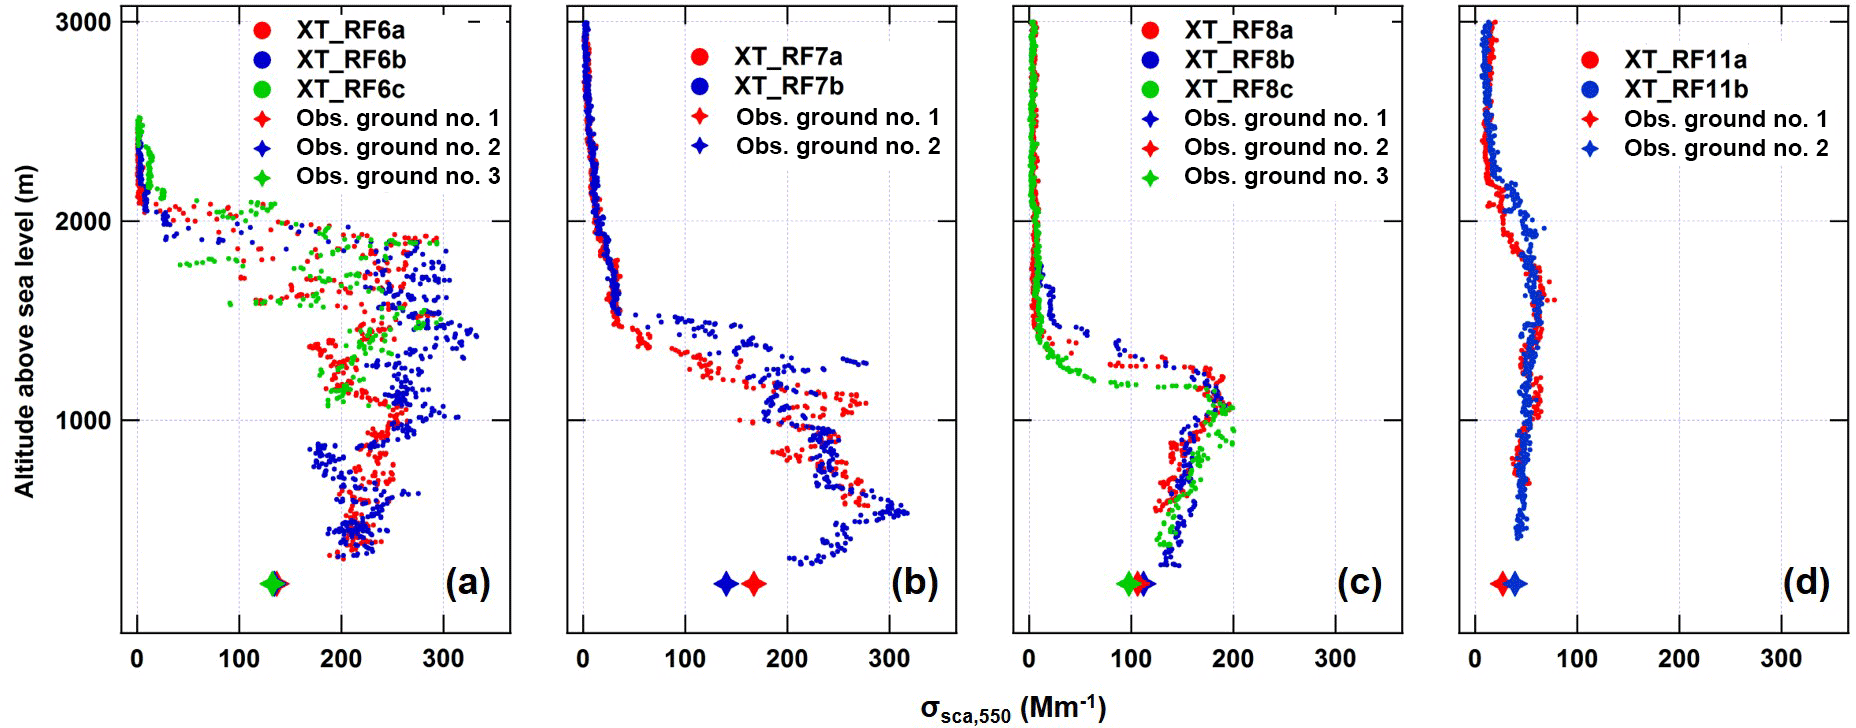
Figure 3Aircraft-measured vertical profiles (colored circles) and surface CAPS-measured (colored plus symbols) σext at 550 nm on (a) 21 May (RF6, panels a, b, and c represent spiral up/down), (b) 28 May (RF7), (c) 28 May (RF8), and (d) 11 June (RF11).
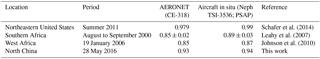
There is an expected comparability of retrieval parameters (e.g., SSA) between ground-based observations and aircraft measurements. For example, the SSA values, derived from AERONET in Baltimore–Washington, DC, United States, were on average 0.011 lower than the values derived from aircraft profile measurements (Schafer et al., 2014). For aircraft–AERONET (based on the nephelometer combined with the PSAP, also used in this study) comparisons with ground-based AERONET at multiple sites over southern Africa, the SSA with a mean difference of 0.01 (rms: 0.03) in biomass burning aerosol measurements (Leahy et al., 2007). There is also a small difference between aircraft in situ (0.87) and CIMEL (0.85) measurements of SSA on a day with both an upper-level smoke aerosol layer and low-level dust layer in the Banizoumbou (Johnson et al., 2010). For this study, retrievals from a ground-based CIMEL automatic Sun-sky radiometer (CE-318) were compared with aircraft in situ measurements.
We calculated the columnar SSA from airborne measurements and its uncertainties following Leahy et al. (2007) and Schafer et al. (2014). The sampled SSA (ωsample) was calculated from σsca and σabs measured by a nephelometer and a PSAP, respectively. We assumed that in situ SSA measured between the minimum and maximum flight levels represents the entire column. In order to produce a column mean SSA (ωcolumn) and compare it with that retrieved from AERONET data, the SSA values were averaged for the duration of the profile after weighting the values according to aerosol loading. The columnar SSA was calculated with the same method for different types of aerosol layers in the vertical. Considering the vertical distributions of σsca and σabs, the SSA measured at higher altitudes (lower aerosol loading) is substantially lower than in the lower troposphere or the aerosol enrichment layer. Thus, the weighted mean is better than a simple average of ωsample, which would overestimate the absorption features of aerosol that has a negligible effect on radiation at the surface where the CIMEL radiometer is located.
Table 3Comparison of AERONET-retrieved and in situ aircraft-measured ω550 from this and other studies.
Aerosol loading, denoted by σsca values, and the profiles were limited to samples collected at the lower level below 400 m and at the higher level greater than 2000 m to adequately represent the entire column. For every profile, weighting factors for each SSA measurement were generated that corresponded to the normalized magnitude of σsca. The measured SSA values were scaled proportionally to the aerosol loading at the altitude of the observation as in the following equation:
where N equals the number of ωsample in the profile.
Table 4Means and standard deviations of aerosol optical properties over LC, JL, QZ, and XT during the experiment.
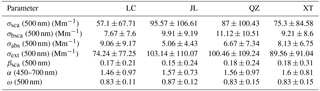
JL:Julu. LC: Luancheng Airport. QZ: Quzhou. XT: Xingtai.
The SSA at 550 nm retrieved from the CIMEL (0.93) agreed well with airborne measurements (0.94) on 28 May (Table 3). The well-matched vertical profiles and ground-based data present a more complete profile of aerosol optical information in the lower atmosphere, demonstrating the high credibility and quality of airborne measurements. These SSA values obtained in the NCP are lower than those observed in Africa, and in the northeastern United States. The reason for the difference is probably due to different types of aerosols in these different locations: primarily mineral dust aerosols in Africa and secondary aerosols in the northeastern United States, and a mix of these two types of aerosols in the NCP.
3.2 Statistics of aerosol optical properties
A statistical summary of aerosol optical properties retrieved from aircraft measurements over the four target areas (LC, JL, QZ, and XT) is given in Table 4. Aerosol scattering coefficients (σsca) and backscattering coefficients (σbsca) are directly obtained from the nephelometer. The truncation correction was applied and the σsca values were corrected for the ambient RH. The mean σsca values at 550 nm measured at LC, JL, QZ, and XT were 57.10 ± 67.71, 95.57 ± 106.61, 87.00 ± 100.43, and 75.30 ± 84.58 Mm−1, respectively, and the mean σbsca value in each target area was 7.67 ± 7.6, 9.91 ± 9.19, 11.12 ± 10.51, and 9.21 ± 8.6 Mm−1, respectively. Aerosol absorption properties at LC and XT were stronger than those at JL and QZ. Note that each variable has a large standard deviation, and there were large variations associated with these aerosol optical properties.
Mean vertical distributions of σsca and σabs at 550 nm derived from aircraft measurements made over the four target areas are shown in rows 3 and 4 of Fig. 4. In general, the values of σsca and σabs decrease with altitude. Peaks in the σsca profiles at certain heights are seen at JL, QZ, and XT. The σsca profile at LC changes little below 3000 m. Compared with the other target areas, σabs values at JL are relatively lower near the ground and gradually decrease with height, which suggests that there were fewer light-absorbing and more scattering aerosols in this area.
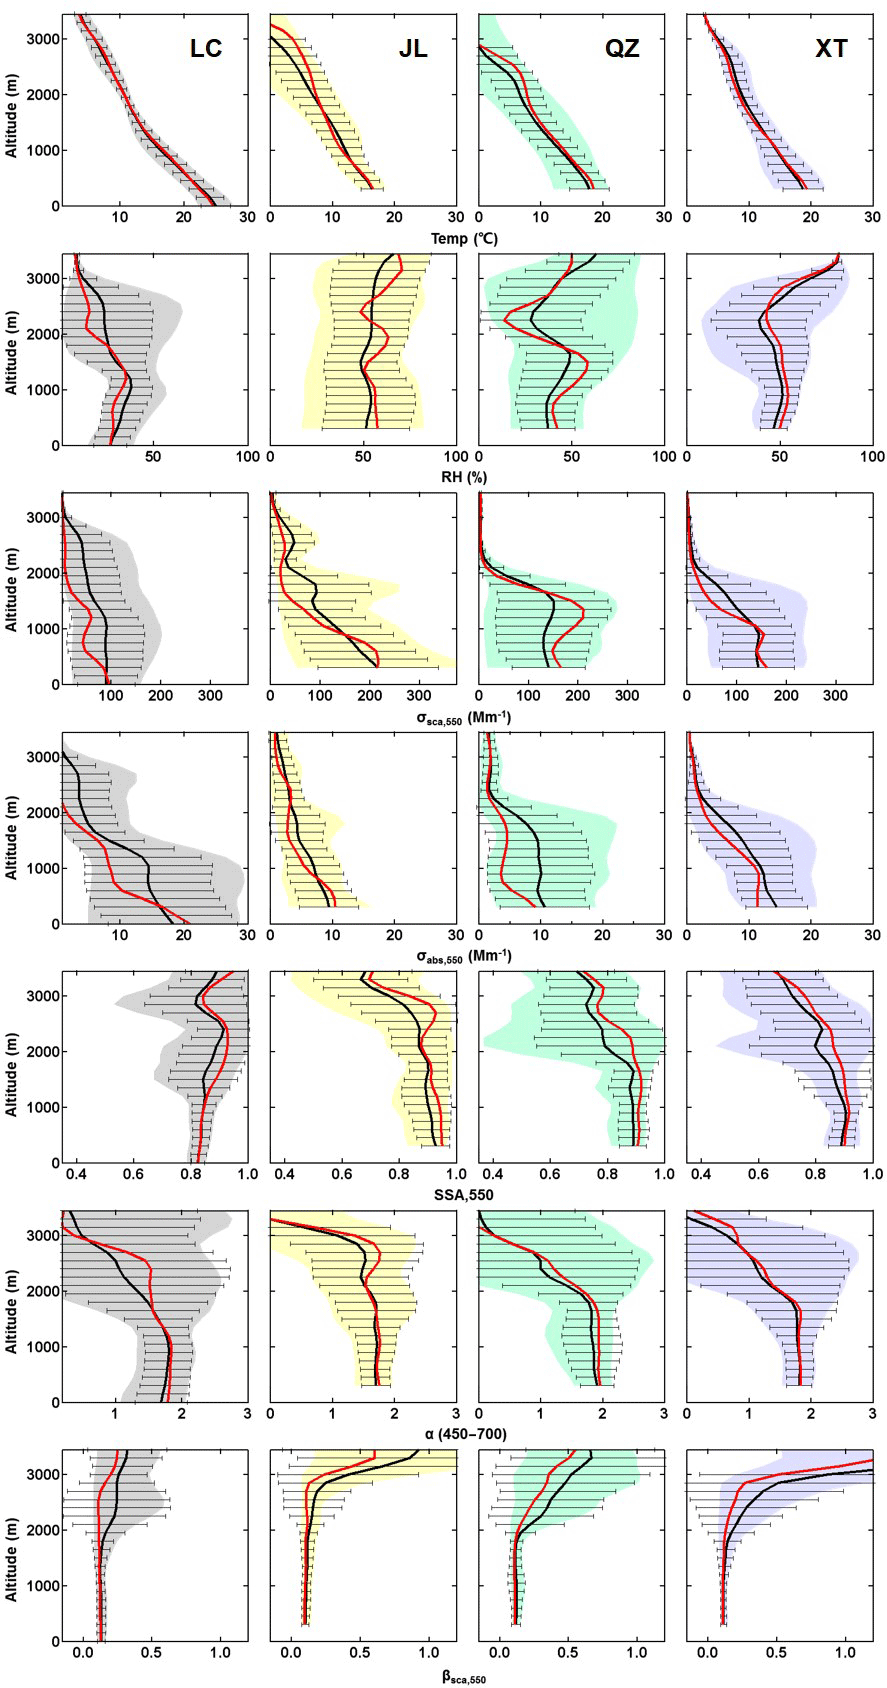
Figure 4Mean vertical distributions of (from the top row to the bottom row) temperature (∘C), relative humidity (%), σsca at 550 nm (Mm−1), σabs at 550 nm (Mm−1), SSA at 550 nm, Ångström exponent (α), and βsca at 550 nm over LC, JL, QZ, and XT (from the left column to the right column, respectively). Black and red lines represent the mean and the median, respectively, and horizontal bars are standard deviations at every 150 m level. The colored shaded areas represent the 10th and 90th percentiles of the data.
Based on measurements of aerosol scattering and absorption coefficients, the aerosol extinction coefficient (σext, defined as the sum of σsca and σabs) and SSA (ω, defined as the ratio of σsca to σext) was calculated at 550 nm following Eq. (5):
The small mismatch in calculating ω was corrected by linearly extrapolating the σabs values to the wavelengths of the scattering measurements as defined. Both σext and ω are considered to be primary determinants for the direct radiative effect of aerosols. The vertical profile of σext closely follows that of aerosol mass concentration (Kim et al., 2015). SSA was described as an important factor in controlling whether an aerosol layer has a cooling or warming effect; it can also be used for studying the radiative forcing at the top of the atmosphere (Bergstrom and Russell, 1999). In this study, the ω550 in the range 0.68–0.99 with a mean value of 0.85 indicates the importance of absorbing aerosols.
The α was calculated using Eq. (6) where σsca,λ is the scattering coefficient at a given reference wavelength λ:
In this study, we used two wavelengths, λ1=450 nm and λ2=700 nm.
An analogous expression can be written for the wavelength dependence of absorption. In general, α is a basic measure of the aerosol size distribution. It is related to the ratio of fine to coarse particles, with α less than 1 for coarse-mode aerosol such as dust particles and α ∼ 2.0 for very fine-mode aerosol such as smoke particles (Hamonou et al., 1999). Vertical profiles of the median values of ω550 and α are shown in rows 5 and 6 of Fig. 4. The profiles were generated by calculating the median value at each altitude layer from all the measured profiles. The variations seen may reflect changes in the origin of aerosol particles and transport routes (Léon et al., 2009), although the values fall well within the range of the standard deviations.
Angular-corrected data from the nephelometer is the scattered light intensity in the backward hemisphere of the particle (90–180∘). The backscattering fraction, βsca, is the ratio of the backscattering coefficient over the total scattering coefficient at a given wavelength (Garland et al., 2009). The ratio of forward scattering to backscattering varies with the particle size parameter and reflects the angular characteristics of particle scattering and the proportion of fine particles (diameters < 2 µm). During the field campaign, βsca remained at low values below 2000 m. Mean values of βsca measured in the four target areas were 0.13 ± 0.003, 0.11 ± 0.005, 0.12 ± 0.003, and 0.12 ± 0.006. Fluctuations above 2000 m suggest that particle sizes changed quickly, due presumably to different air masses transported from different directions.
During the experiment period, the majority of aerosol layers were well characterized by the sampled vertical profiles, and most aerosols resided below the maximum flight levels. Mie theory was applied to calculate the extinction profiles and the AOD and to estimate the impact of different aerosol vertical distributions on these optical properties. The AOD was calculated by integrating the extinction coefficient over height as
where σsca(z) is the extinction coefficient at a height of z and Z2 is above most of the aerosol. Figure 5 shows the mean AOD at 550 nm for different altitude ranges. The regional mean AOD in each altitude range (< 1, 1–2, and 2–3 km) was 0.10 ± 0.08, 0.10 ± 0.07, and 0.03 ± 0.03, respectively. Standard deviations are greater than 50 % of the mean, suggesting that AODs varied greatly within an altitude range. The magnitude of AOD generally decreased with altitude. The effect of the transport of atmospheric pollutants is evident at QZ, where the largest AOD values were found in the 1–2 km layer instead of at the surface.
The vertical distribution of aerosol particles is important for determining radiative effects, especially in the presence of clouds. During haze episodes, the vertical profiles of CO, the aerosol concentration, and the scattering coefficient have been found to be well correlated (Haywood et al., 2003b). Formenti et al. (2003a, b) presented a full analysis of the correlations among these variables. Examples of typical vertical profiles of aerosol scattering and RH, and transport pathways over the target areas are presented here.
4.1 Clean PBL
Generally driven by the weather conditions at flight time, a clean PBL is defined by a mean value of σsca less than 100 Mm−1 in every 100 m layer (except that adjacent to the surface layer). Figure 6a and c show the vertical profiles of σsca and ambient RH, retrieved from airborne measurements made under clean PBL conditions. Values of σsca near the surface ranged from 11.7 to 84.5 Mm−1, with an average value of 48.5 Mm−1. In general, σsca slowly decreased with height, which suggests that the atmosphere was relatively clean, with no distinct aerosol layer identified. The mean σsca profile decreases approximately exponentially with height, expressed as
where σsca,0 is σsca measured at the surface, H is the altitude above sea level, and Hp is the aerosol scale height (Hp represents the height where σsca is reduced to 1∕e of its surface value); HRS represents a relative stable layer near the surface where the vertical variation of σsca was insignificant. In the cases of a clean PBL, Mm−1, Hp=1146 m, and HRS=837 m. A linear regression analysis shows the correlation coefficient, r2=0.96. The ambient RH under clean PBL conditions was divided into two groups: dry (RH: 27.4–36.8 %) and humid (RH: 53.1–83.6 %). Under dry conditions, σsca and ambient RH showed a good correlation (R2=0.62, Fig. 8a), while under humid conditions, the correlation was low (R2=0.23). To understand the sources and transport pathways of aerosols over the target areas during the field campaign, we calculated isentropic air mass back trajectories for 72 h using the NOAA Hybrid Single Particle Lagrangian Integrated Trajectory (HYSPLIT) model (Draxler and Hess, 1997; Stein et al., 2016) at 0.5, 1.5, and 2.5 km above mean sea level. The HYSPLIT model (http://ready.arl.noaa.gov/HYSPLIT.php, last access: 6 June 2018) was used along with the National Center for Environmental Prediction's Global Data Assimilation System 1∘ × 1∘ meteorological database to calculate backward trajectories terminated at the Xingtai supersite. Figure 9a shows 72 h air mass back trajectories under clean PBL conditions during the field campaign. Air masses most commonly originated from the northwestern region of the study area. Some of the trajectories can be traced back as far as Mongolia and Siberia, passing over the arid areas to the west of southern Hebei. Some clean and moist air masses originating from the less polluted southern and local areas were also seen.
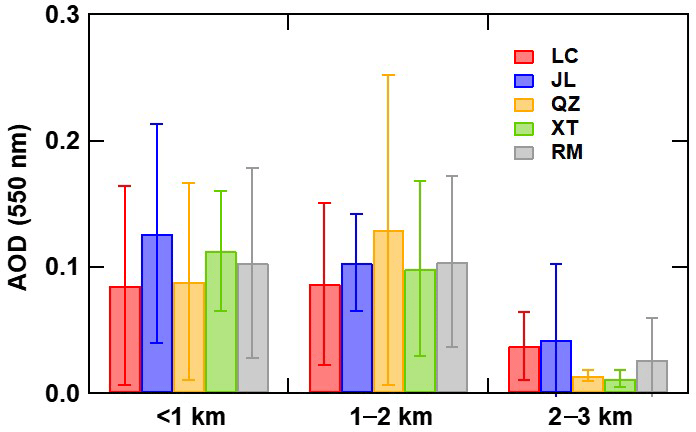
Figure 5Mean AOD at 550 nm at LC, JL, QZ, and XT, and overall mean AOD (RM) at 550 nm for different altitude ranges (< 1, 1–2, and 2–3 km). Standard deviations are also shown.
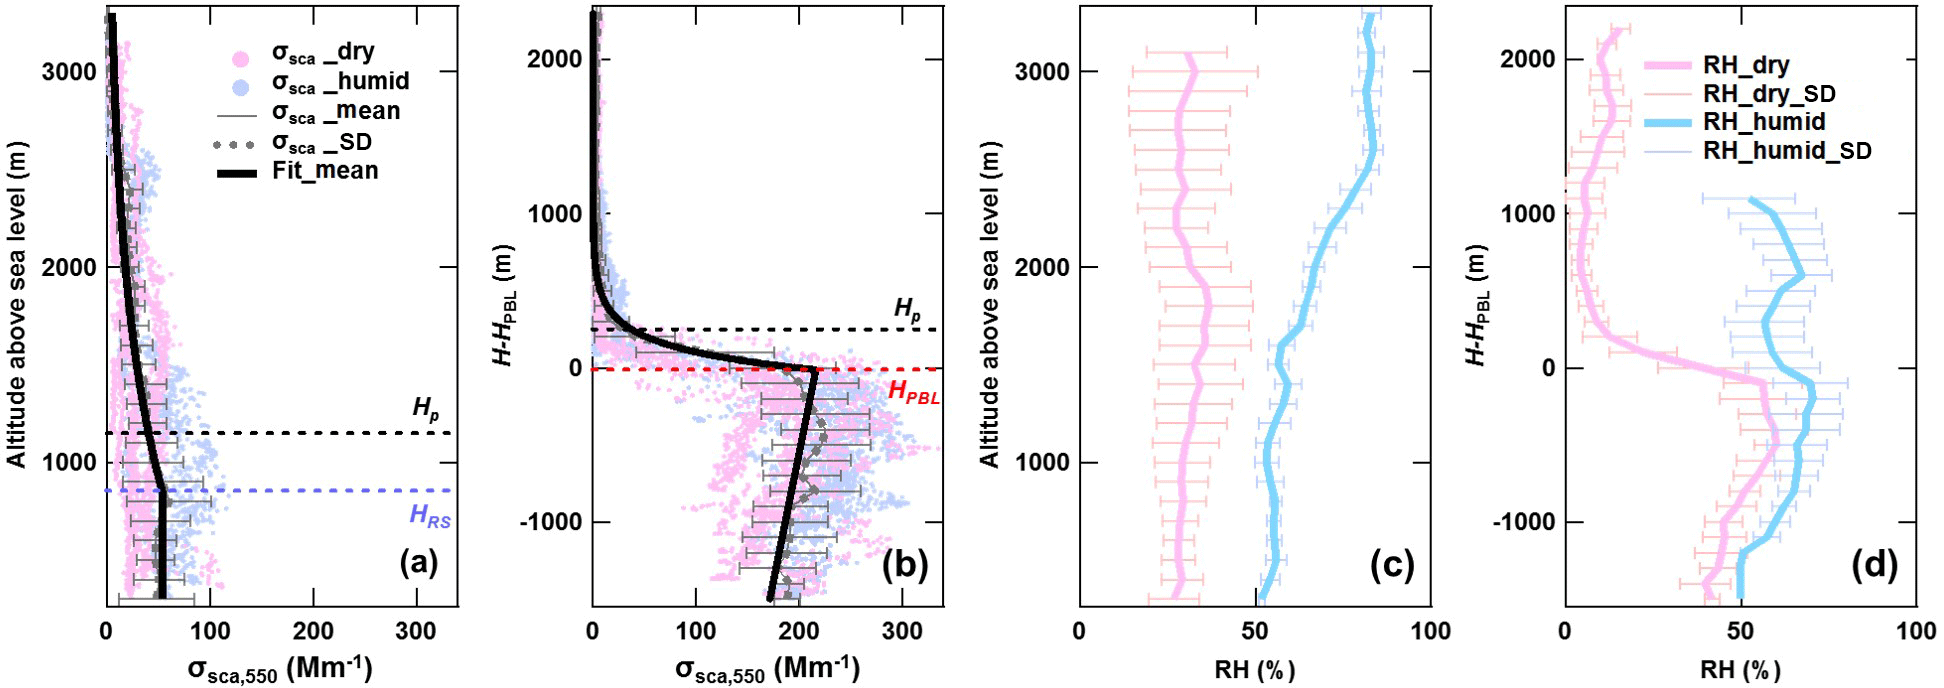
Figure 6Mean vertical distributions of σsca at 550 nm (in Mm−1) and relative humidity (%) during the flight campaign for those cases of (a, c) clean PBL and (b, d) pollution in the lower layer of the PBL where PBL heights have been normalized to the same altitude. Grey dashed lines represent mean σsca vertical profiles, the light pink and blue dots represent 1 s nephelometer-measured σsca, under dry or humid conditions, respectively. Thick lines show the calculated fitting curves of the σsca profiles (see Eqs. 8 and 9). Magenta and blue lines represent RH data collected under dry or humid conditions (c, d). The horizontal error bars represent the standard deviations at every 100 m level.
4.2 Pollution in the lower layer of the PBL
The vertical distribution of air pollutants varied greatly from case to case due to a variety of influences. One of the crucial factors was PBL structure, which determines the vertical profile of σsca; see Fig. 6b. The corresponding ambient RH profiles (Fig. 6d), σsca as a function of RH (Eq. 9), and the back-trajectory analysis (Fig. 9b) are also shown. The PBL height is determined by the shapes of σsca vertical profiles. When pollution is confined primarily to the lower layer of the troposphere, the magnitude of σsca increased slightly with height up to an altitude where σsca decreased sharply. In this study, the mean rate of decrease was about 0.81 Mm−1 m−1. We defined the bottom of this layer as PBL height (HPBL). We normalized the curves by the shapes of σsca vertical profiles, and the PBL heights of different σsca and ambient RH profiles were adjusted to the same level to show the similarity of the shapes. The PBL heights, as determined by vertical profiles of σsca, ranged from 900 to 2000 m with an average value of ∼ 1400 m. The average σsca profile was determined as follows:
where HPBL is the normalized altitude of PBL height, Hp is the aerosol scale height in the free troposphere, and k is the changing rate of σsca in the PBL. In these cases, Mm−1, Hp=216 m, k = 0.03 Mm−1 m−1, and r2=0.9394. Figure 6d shows the ambient RH profiles under dry and humid conditions. The shapes of dry and humid RH profiles were similar in the PBL, but at the top of the PBL, the RH_dry profiles decreased dramatically, and the RH_humid profiles changed only slightly. Linear fits were made to determine the correlation between RH and σsca. Under dry conditions, there was a pronounced correlation (r2=0.95) between RH_dry and σsca profiles. But under humid conditions, the correlation coefficient was only 0.12, suggesting little impact of RH on σsca.
Most back trajectories under polluted conditions originated from the heavily populated and industrialized interior and coastal areas south of the study area (Fig. 9b). Some drier air masses (corresponding to RH_dry) were traced back to southern and local areas just as in the case of clean air masses. Moist air masses originated from the clean marine atmosphere to the southeast, then passed over the densely populated eastern/southeastern regions in the free troposphere before reaching the observation site. This analysis of both dry and moist air masses with aerosols in the lowest layer of the PBL shows that heavy local/regional pollution dominated during the field campaign and that the long-range transport of aerosols was less significant.
4.3 Pollution in the middle and upper layers of the PBL
In addition to high aerosol concentrations in the lower PBL, upper-layer (referred to as the type A case, an example of which occurred on 2 June 2016) and multi-layer (referred to as the type B case, an example of which occurred on 6 June 2016) aerosol vertical distributions were also observed. In the type A case (Fig. 7a), the vertical profile of aerosol σsca retrieved from airborne measurements shows a mean σsca near the surface of about 45 Mm−1 and little variation below 1 km. A sharp increase in σsca was observed above with a peak value of 200 Mm−1 occurring around 2–3 km, and aloft the σsca profile decreased exponentially with height. For the type B case (Fig. 7b), mean σsca varied greatly with height, which suggests that multiple layers of aerosol particles were present in the PBL. The vertically inhomogeneous distribution of σsca suggests that aerosol particles in the PBL might be significantly affected by the long-range transport of air pollutants or local emissions in the study area. The profiles of σsca and ambient RH for type A and type B cases have similar shapes with a correlation coefficient of R2 = 0.91 and 0.59, respectively (Fig. 8c and d).
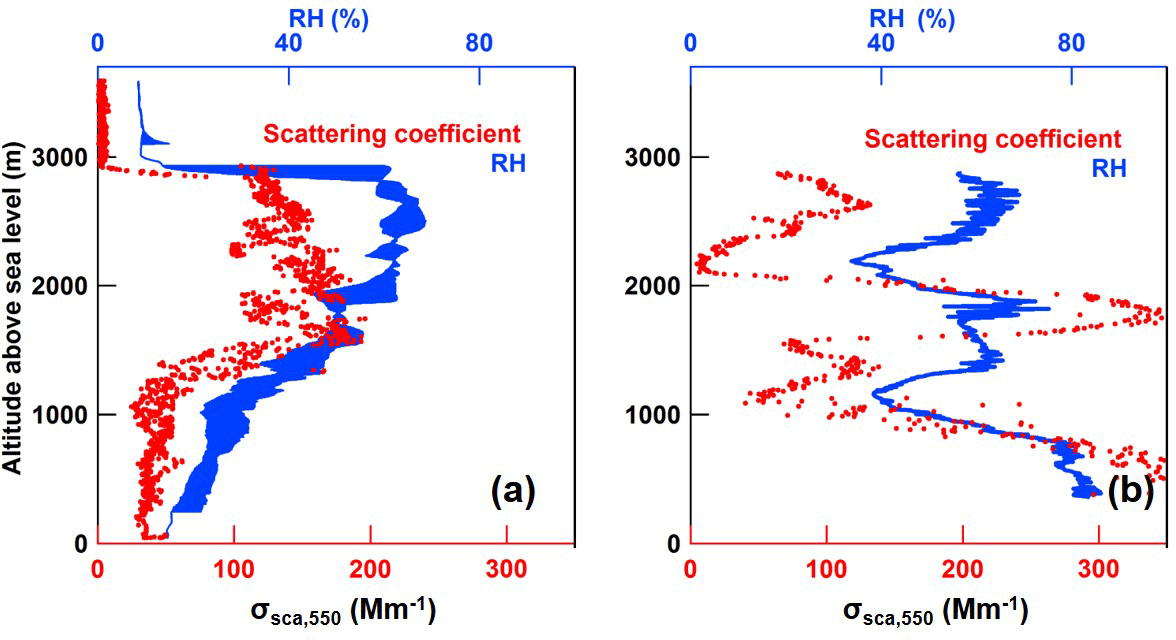
Figure 7Vertical distributions of σsca at 550 nm (red) and relative humidity (RH, blue) for the enrichment of aerosols in the upper layer of the PBL on 2 June in LC (a) and in multiple layers of the PBL on 6 June in JL (b).
As shown in Fig. 9c, back trajectories for the type A case originated from less polluted regions in northeastern China which then moved toward the marine atmosphere over Bohai Bay and the densely populated region east of the study area. The aerosol enrichment in the upper layer of the PBL was probably due to regional transport and mixture of anthropogenic and sea-salt aerosols into the free troposphere. The back trajectories ending at 0.5, 1.5, and 2.5 km over the observation site for the type B case (Fig. 9d) show that air masses originated from the clean marine environment to the southeast, from the polluted environment to the southwest, and from the eastern coastal region. This could explain the strata, i.e., the multi-layered vertical distribution, of aerosols in the PBL.

Figure 8σsca at 500 nm as a function of relative humidity (RH, in %) for those cases when the PBL was (a) clean and dry, (b) polluted in the lower PBL and dry, (c) polluted in the upper PBL in the flight on 2 June, and (d) polluted in multiple layers of the PBL in the flight on 6 June. The linear regression best-fit lines through the data are shown (dashed lines). The regression relationships and coefficients of determination are given in each panel.
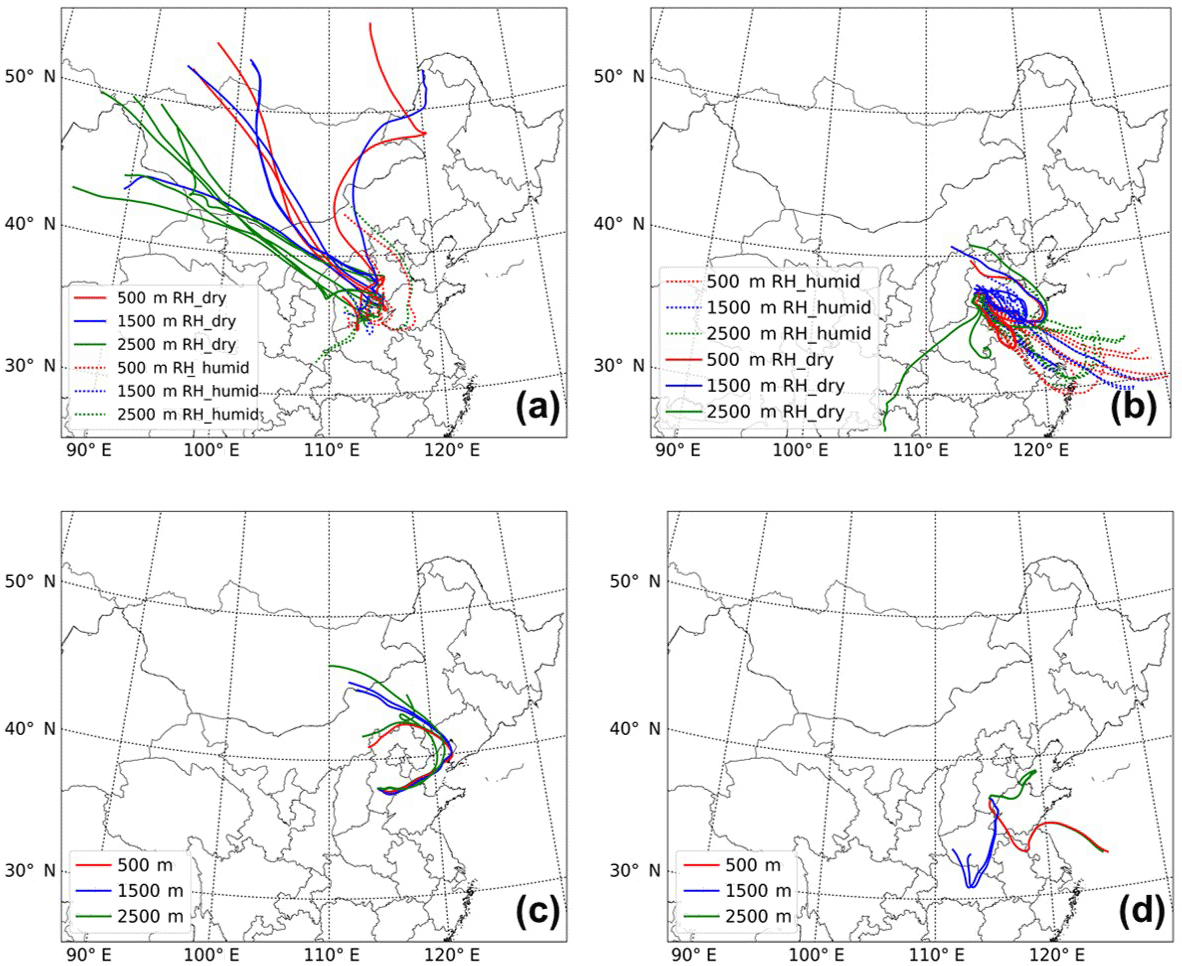
Figure 972 h HYSPLIT back trajectories for the cases when the PBL was (a) clean, (b) polluted in the lower PBL, (c) polluted in the upper PBL in the flight on 2 June, and (d) polluted in multiple layers of the PBL in the flight on 6 June. Trajectories at different levels under dry (solid lines) and humid (dashed lines) conditions are shown: 500 m (red), 1500 m (blue), and 2500 m (green) above mean sea level.
Vertical distributions of aerosol optical properties were characterized using extensive measurements made by airborne and ground-based instruments during a field experiment in May and June of 2016 in the heavily industrialized North China Plain around Xingtai, Hebei Province. During the field campaign, a total of 11 research fights (about 25 flight hours in total) were made as a part of the A2BC and ARIAs experiment. Measurements used in this study include aerosol scattering and backscattering, absorption, extinction, single scattering albedo, Ångström exponent, and AOD. The vertical and regional characteristics of the PBL structure were characterized to better understand their impact on air quality and climate.
Statistical summaries of the vertical distributions of aerosol optical properties focused on four target areas in the NCP region. A total of 38 profiles were compiled and analyzed. Ground-based CAPS and CIMEL retrievals and meteorological soundings were made at the same time as the airborne measurements to ensure data comparability. Aircraft measurements agree generally well with independent measurements made by radiosondes of temperature and humidity, and with aerosol extinction from CAPS, and aerosol single scattering albedo from the CIMEL sun photometer. While aerosol scattering and extinction coefficients generally decreased with height, there were distinct patterns of profiles for clean and polluted episodes. Profiles over the target area showed relatively high values of σsca and σabs, suggesting that there were higher concentrations of light-absorbing and scattering pollutants in this region. Mean SSA (ω550) ranged from 0.83 to 0.87 over the four regions, suggesting that moderately strong-absorbing aerosols are present in the region. The regional mean AOD in each altitude range (< 1, 1–2, and 2–3 km) was 0.10 ± 0.08, 0.10 ± 0.07, and 0.03 ± 0.03, respectively. Most of the total aerosol concentration in the lower troposphere was found below 2 km during the aircraft campaign.
Three typical PBL structures were identified, with distinct air mass transport pathways and correlations between σsca and RH. In the clean PBL, σsca is strong near the surface and slowly weakens with height. The correlation coefficient of σsca and ambient RH under relatively dry conditions was 0.62. Clean air masses most commonly originated from the northwest, which is far from the study area.
When there was pollution in the lower PBL, σsca increased slightly with height, then sharply decreased at the top of the PBL. Aerosol scattering and relative humidity showed a good correlation (R2=0.78) in the PBL. Most trajectories of this type originated from the heavily polluted interior and coastal areas south and east of the study area. When there was a pollution layer higher in the PBL or multiple layers of pollution, the σsca and ambient RH profiles had similar shapes, and the PBL structure could be explained by the source and transmission process of air masses.
The field experiment data used in this study can be downloaded from ftp://210.73.20.4 (last access: 12 June 2018). Registration information is available upon request (please contact Fei Wang at feiwang@cma.gov.cn).
The authors declare that they have no conflict of interest.
This work was funded by the National Science Foundation of China (grant no. 91544217), National Key Research and Development
Program of China (grant no. 2017YFC1501702), the National Science Foundation of the
United States (grant no. 1558259), and the National Basic Research Programs of China
(grant nos. 2017YFC1501702 and 2013CB955804). We also thank all of the A2BC and ARIAs research team,
especially the flight crew of Hebei Weather Modification Office's Y-12
airplane. The flight campaign was conducted in association with the NASA's KORUS-AQ.
Edited by: Qiang Fu
Reviewed by: three anonymous referees
Anderson, T. L. and Ogren, J. A.: Determining Aerosol Radiative Properties Using the TSI 3563 Integrating Nephelometer, Aerosol Sci. Tech., 29, 57–69, 1998.
Anderson, T. L., Masonis, S. J., Covert, D. S., Ahlquist, N. C., Howell, S. G., Clarke, A. D., and Mcnaughton, C. S.: Variability of aerosol optical properties derived from in situ aircraft measurements during ACE-Asia, J. Geophys. Res.-Atmos., 108, 8647, https://doi.org/10.1029/2002JD003247, 2003.
Anderson, T. L., Covert, D. S., Marshall, S. F., Laucks, M. L., Charlson, R. J., Waggoner, A. P., Ogren, J. A., Caldow, R., Holm, R. L., and Quant, F. R.: Performance Characteristics of a High-Sensitivity, Three-Wavelength, Total Scatter/Backscatter Nephelometer, J. Atmos. Ocean. Tech., 13, 967–986, 2009.
Andreae, M. O. and Rosenfeld, D.: Aerosol–cloud–precipitation interactions. Part 1. The nature and sources of cloud-active aerosols, Earth-Sci. Rev., 89, 13–41, 2008.
Babu, S. S., Nair, V. S., Gogoi, M. M., and Moorthy, K. K.: Seasonal variation of vertical distribution of aerosol single scattering albedo over Indian sub-continent: RAWEX aircraft observations, Atmos. Environ., 125, 312–323, 2016.
Bergstrom, R. W. and Russell, P. B.: Estimation of aerosol direct radiative effects over the mid-latitude North Atlantic from satellite and in situ measurements, Geophys. Res. Lett., 26, 1731–1734, 1999.
Beyersdorf, A. J., Ziemba, L. D., Chen, G., Corr, C. A., Crawford, J. H., Diskin, G. S., Moore, R. H., Thornhill, K. L., Winstead, E. L., and Anderson, B. E.: The impacts of aerosol loading, composition, and water uptake on aerosol extinction variability in the Baltimore–Washington, D.C. region, Atmos. Chem. Phys., 16, 1003–1015, https://doi.org/10.5194/acp-16-1003-2016, 2016.
Bond, T. C., Anderson, T. L., and Campbell, D.: Calibration and Intercomparison of Filter-Based Measurements of Visible Light Absorption by Aerosols, Aerosol Sci. Tech., 30, 582–600, 1999.
Brent, L., Thorn, W., Gupta, M., Leen, B., Stehr, J., He, H., Arkinson, H., Weinheimer, A., Garland, C., and Pusede, S.: Evaluation of the use of a commercially available cavity ringdown absorption spectrometer for measuring NO2 in flight, and observations over the Mid-Atlantic States, during DISCOVER-AQ, J. Atmos. Chem., 72, 503–521, 2015.
Charlson, R. J. and Hofmann, D. J.: Climate forcing by anthropogenic aerosols, Science, 255, 423–430, 1992.
Chaudhry, Z., Martins, J. V., Li, Z., Tsay, S. C., Chen, H., Wang, P., Wen, T., Li, C., and Dickerson, R. R.: In situ measurements of aerosol mass concentration and radiative properties in Xianghe, southeast of Beijing, J. Geophys. Res.-Atmos., 112, 6033–6044, 2007.
Chazette, P. and Liousse, C.: A case study of optical and chemical ground apportionment for urban aerosols in Thessaloniki, Atmos. Environ., 35, 2497–2506, 2001.
Chen, Y., Zhao, C., Zhang, Q., Deng, Z., Huang, M., and Ma, X.: Aircraft study of Mountain Chimney Effect of Beijing, China, J. Geophys. Res.-Atmos., 114, 1–10, 2009.
Corrigan, C. E., Roberts, G. C., Ramana, M. V., Kim, D., and Ramanathan, V.: Capturing vertical profiles of aerosols and black carbon over the Indian Ocean using autonomous unmanned aerial vehicles, Atmos. Chem. Phys., 8, 737–747, https://doi.org/10.5194/acp-8-737-2008, 2008.
Dickerson, R., Kondragunta, S., Stenchikov, G., Civerolo, K., Doddridge, B., and Holben, B.: The impact of aerosols on solar ultraviolet radiation and photochemical smog, Science, 278, 827–830, 1997.
Dickerson, R. R., Li, C., Li, Z., Marufu, L. T., Stehr, J. W., Mcclure, B., Krotkov, N., Chen, H., Wang, P., and Xia, X.: Aircraft observations of dust and pollutants over northeast China: Insight into the meteorological mechanisms of transport, J. Geophys. Res.-Atmos., 112, 177–180, 2007.
Dong, Z., Li, Z., Yu, X., Cribb, M., Li, X., and Dai, J.: Opposite long-term trends in aerosols between low and high altitudes: a testimony to the aerosol–PBL feedback, Atmos. Chem. Phys., 17, 7997–8009, https://doi.org/10.5194/acp-17-7997-2017, 2017.
Draxler, R. R. and Hess, G. D.: Description of the HYSPLIT_4 modelling system, National Oceanic & Atmospheric Administration Technical Memorandum Erl Arl, available at: http://www.arl.noaa.gov/data/web/models/hysplit4/win95/arl-224.pdf (last access: 16 April 2018), 1997.
Eck, T. F., Holben, B. N., Reid, J. S., Dubovik, O., Smirnov, A., O'Neill, N. T., Slutsker, I., and Kinne, S.: Wavelength dependence of the optical depth of biomass burning, urban, and desert dust aerosols, J. Geophys. Res.-Atmos., 104, 333–331, 1999.
Ferrero, L., Perrone, M. G., Petraccone, S., Sangiorgi, G., Ferrini, B. S., Lo Porto, C., Lazzati, Z., Cocchi, D., Bruno, F., Greco, F., Riccio, A., and Bolzacchini, E.: Vertically-resolved particle size distribution within and above the mixing layer over the Milan metropolitan area, Atmos. Chem. Phys., 10, 3915–3932, https://doi.org/10.5194/acp-10-3915-2010, 2010.
Ferrero, L., Mocnik, G., Ferrini, B. S., Perrone, M. G., Sangiorgi, G., and Bolzacchini, E.: Vertical profiles of aerosol absorption coefficient from micro-Aethalometer data and Mie calculation over Milan, Sci. Total Environ., 409, 2824–2837, 2011.
Formenti, P., Elbert, W., Maenhaut, W., Haywood, J., and Andreae, M. O.: Chemical composition of mineral dust aerosol during the Saharan Dust Experiment (SHADE) airborne campaign in the Cape Verde region, September 2000, J. Geophys. Res.-Atmos., 108, 1409–1419, 2003a.
Formenti, P., Elbert, W., Maenhaut, W., Haywood, J., Osborne, S., and Andreae, M. O.: Inorganic and carbonaceous aerosols during the Southern African Regional Science Initiative (SAFARI 2000) experiment: Chemical characteristics, physical properties, and emission data for smoke from African biomass burning, J. Geophys. Res.-Atmos., 108, 335–346, 2003b.
Gadhavi, H. and Jayaraman, A.: Airborne lidar study of the vertical distribution of aerosols over Hyderabad, an urban site in central India, and its implication for radiative forcing calculations, Ann. Geophys., 24, 2461–2470, https://doi.org/10.5194/angeo-24-2461-2006, 2006.
Garland, R. M., Schmid, O., Nowak, A., Achtert, P., Wiedensohler, A., Gunthe, S. S., Takegawa, N., Kita, K., Kondo, Y., and Hu, M.: Aerosol optical properties observed during Campaign of Air Quality Research in Beijing 2006 (CAREBeijing-2006): Characteristic differences between the inflow and outflow of Beijing city air, J. Geophys. Res.-Atmos., 114, 1065–1066, 2009.
Guo, J., Deng, M., Lee, S. S., Wang, F., Li, Z., Zhai, P., Liu, H., Lv, W., Yao, W., and Li, X.: Delaying Precipitation and Lightning by Air Pollution over the Pearl River Delta. Part I: Observational Analyses, J. Geophys. Res.-Atmos., 121, 6472–6488, 2016.
Guo, J., Su, T., Li, Z., Miao, Y., Li, J., Liu, H., Xu, H., Maureen, C., and Zhai, P.: Declining frequency of summertime local-scale precipitation over eastern China from 1970–2010 and its potential link to aerosols, Geophys. Res. Lett., 44, 5700–5708, 2017.
Hains, J. C., Taubman, B. F., Thompson, A. M., Stehr, J. W., Marufu, L. T., Doddridge, B. G., and Dickerson, R. R.: Origins of chemical pollution derived from Mid-Atlantic aircraft profiles using a clustering technique, Atmos. Environ., 42, 1727–1741, 2008.
Hamonou, E., Chazette, P., Balis, D., Dulac, F., Schneider, X., Galani, E., Ancellet, G., and Papayannis, A.: Characterization of the vertical structure of Saharan dust export to the Mediterranean basin, J. Geophys. Res.-Atmos., 104, 22257–22270, 1999.
Han, Y., Fang, X., Zhao, T., and Kang, S.: Long range trans-Pacific transport and deposition of Asian dust aerosols, J. Environ. Sci., 20, 424–428, 2008.
Haywood, J. and Boucher, O.: Estimates of the direct and indirect radiative forcing due to tropospheric aerosols: A review, Rev. Geophys., 38, 513–543, 2000.
Haywood, J., Francis, P., Dubovik, O., Glew, M., and Holben, B.: Comparison of aerosol size distributions, radiative properties, and optical depths determined by aircraft observations and Sun photometers during SAFARI 2000, J. Geophys. Res., 108, 225–231, 2003a.
Haywood, J. M., Osborne, S. R., Francis, P. N., Keil, A., Formenti, P., Andreae, M. O., and Kaye, P. H.: The mean physical and optical properties of regional haze dominated by biomass burning aerosol measured from the C-130 aircraft during SAFARI 2000, J. Geophys. Res.-Atmos., 108, 225–231, 2003b.
Hegg, D. A., Covert, D. S., Jonsson, H., and Covert, P. A.: Determination of the transmission efficiency of an aircraft aerosol inlet, Aerosol Sci. Tech., 39, 966–971, 2005.
Holben, B. N., Eck, T. F., Slutsker, I., Tanré, D., Buis, J. P., Setzer, A., Vermote, E., Reagan, J. A., Kaufman, Y. J., and Nakajima, T.: AERONET – A Federated Instrument Network and Data Archive for Aerosol Characterization, Remote Sens. Environ., 66, 1–16, 1998.
Huebert, B., Bertram, T., Kline, J., Howell, S., Eatough, D., and Blomquist, B.: Measurements of organic and elemental carbon in Asian outflow during ACE-Asia from the NSF/NCAR C-130, J. Geophys. Res.-Atmos., 109, D19S11, https://doi.org/10.1029/2004JD004700, 2004.
Johnson, B., Heese, B., McFarlane, S. A., Chazette, P., Jones, A., and Bellouin, N.: Vertical distribution and radiative effects of mineral dust and biomass burning aerosol over West Africa during DABEX, J. Geophys. Res.-Atmos., 113, D00C12, https://doi.org/10.1029/2008JD009848, 2008.
Johnson, B. T., Christopher, S., Haywood, J. M., Osborne, S. R., Mcfarlane, S., Hsu, C., Salustro, C., and Kahn, R.: Measurements of aerosol properties from aircraft, satellite and ground-based remote sensing: a case-study from the Dust and Biomass-burning Experiment (DABEX), Q. J. Roy. Meteor. Soc., 135, 922–934, 2010.
Kahn, R. A., Berkoff, T. A., Brock, C., Chen, G., Ferrare, R. A., Ghan, S., Hansico, T. F., Hegg, D. A., Martins, J. V., and Mcnaughton, C. S.: SAM-CAAM: A Concept for Acquiring Systematic Aircraft Measurements to Characterize Aerosol Air Masses, B. Am. Meteorol. Soc., 98, 2215–2228, https://doi.org/10.1175/BAMS-D-16-0003.1, 2017.
Kan, H., Chen, R., and Tong, S.: Ambient air pollution, climate change, and population health in China, Environ. Int., 42, 10–19, 2012.
Kebabian, P. L. and Freedman, A.: System and Method for Trace Species Detection Using Cavity Attenuated Phase Shift Spectroscopy with an Incoherent Light Source, U.S. Patent No. 7301639, 2007.
Kebabian, P. L., Wood, E. C., Herndon, S. C., and Freedman, A.: A practical alternative to chemiluminescence-based detection of nitrogen dioxide: cavity attenuated phase shift spectroscopy, Environ. Sci. Technol., 42, 6040–6045, 2008.
Kim, P. S., Jacob, D. J., Fisher, J. A., Travis, K., Yu, K., Zhu, L., Yantosca, R. M., Sulprizio, M. P., Jimenez, J. L., and Campuzano-Jost, P.: Sources, seasonality, and trends of Southeast US aerosol: an integrated analysis of surface, aircraft, and satellite observations with the GEOS-Chem chemical transport model, Working Paper, 15, 17651–17709, 2015.
Leahy, L. V., Anderson, T. L., Eck, T. F., and Bergstrom, R. W.: A synthesis of single scattering albedo of biomass burning aerosol over southern Africa during SAFARI 2000, Geophys. Res. Lett., 34, 261–263, 2007.
Léon, J.-F., Derimian, Y., Chiapello, I., Tanré, D., Podvin, T., Chatenet, B., Diallo, A., and Deroo, C.: Aerosol vertical distribution and optical properties over M'Bour (16.96∘ W; 14.39∘ N), Senegal from 2006 to 2008, Atmos. Chem. Phys., 9, 9249–9261, https://doi.org/10.5194/acp-9-9249-2009, 2009.
Li, J., Liu, X., Yuan, L., Yin, Y., Li, Z., Li, P., Ren, G., Jin, L., Li, R., and Dong, Z.: Vertical distribution of aerosol optical properties based on aircraft measurements over the Loess Plateau in China, J. Environ. Sci., 34, 44–56, 2015a.
Li, J., Yin, Y., Li, P., Li, Z., Li, R., Cribb, M., Dong, Z., Zhang, F., Li, J., and Ren, G.: Aircraft measurements of the vertical distribution and activation property of aerosol particles over the Loess Plateau in China, Atmos. Res., 155, 73–86, 2015b.
Li, Z., Niu, F., Fan, J., Liu, Y., Rosenfeld, D., and Ding, Y.: Long-term impacts of aerosols on the vertical development of clouds and precipitation, Nat. Geosci., 4, 888–894, 2011.
Li, Z., Lau, W. K. M., Ramanathan, V., Wu, G., Ding, Y., Manoj, M. G., Liu, J., Qian, Y., Li, J., and Zhou, T.: Aerosol and monsoon climate interactions over Asia, Rev. Geophys., 54, 866–929, https://doi.org/10.1002/2015RG000500, 2016.
Li, Z., Guo, J., Ding, A., Liao, H., Liu, J., Sun, Y., Wang, T., Xue, H., Zhang, H., and Zhu, B.: Aerosol and boundary-layer interactions and impact on air quality, Natl. Sci. Rev., 4, 810–833, https://doi.org/10.1093/nsr/nwx117, 2017a.
Li, Z., Rosenfeld, D., and Fan, J.: Aerosols and their Impact on Radiation, Clouds, Precipitation & Severe Weather Events, Pacific Northwest National Lab. (PNNL), Richland, WA, USA, 2017b.
Liu, J., Zheng, Y., Li, Z., Connor, F., and Maureen, C.: Seasonal variations of aerosol optical properties, vertical distribution and associated radiative effects in the Yangtze Delta region of China, Medicină Internă, 13, 933–945, 2012.
Liu, P., Zhao, C., Zhang, Q., Deng, Z., Huang, M., Xincheng, M. A., and Tie, X.: Aircraft study of aerosol vertical distributions over Beijing and their optical properties, Tellus B, 61, 756–767, 2009.
Lohmann, U. and Feichter, J.: Global indirect aerosol effects: a review, Atmos. Chem. Phys., 5, 715–737, https://doi.org/10.5194/acp-5-715-2005, 2005.
Massoli, P., Kebabian, P. L., Onasch, T. B., Hills, F. B., and Freedman, A.: Aerosol Light Extinction Measurements by Cavity Attenuated Phase Shift (CAPS) Spectroscopy: Laboratory Validation and Field Deployment of a Compact Aerosol Particle Extinction Monitor, Aerosol Sci. Tech., 44, 428–435, 2010.
McNaughton, C. S., Clarke, A. D., Howell, S. G., Pinkerton, M., Anderson, B., Thornhill, L., Hudgins, C., Winstead, E., Dibb, J. E., and Scheuer, E.: Results from the DC-8 Inlet Characterization Experiment (DICE): Airborne versus surface sampling of mineral dust and sea salt aerosols, Aerosol Sci. Tech., 41, 136–159, 2007.
Meloni, D., Di Sarra, A., Di Iorio, T., and Fiocco, G.: Influence of the vertical profile of Saharan dust on the visible direct radiative forcing, J. Quant. Spectrosc. Ra., 93, 397–413, 2005.
Nair, V. S., Babu, S. S., Moorthy, K. K., Sharma, A. K., Marinoni, A., and Ajai: Black carbon aerosols over the Himalayas: Direct and surface albedo forcing, Tellus B, 65, 129–133, 2013.
Navas-Guzmán, F., Fernández-Gálvez, J., Granados-Muñoz, M. J., Guerrero-Rascado, J. L., Bravo-Aranda, J. A., and Alados-Arboledas, L.: Tropospheric water vapour and relative humidity profiles from lidar and microwave radiometry, Atmos. Meas. Tech., 7, 1201–1211, https://doi.org/10.5194/amt-7-1201-2014, 2014.
Petzold, A., Onasch, T., Kebabian, P., and Freedman, A.: Intercomparison of a Cavity Attenuated Phase Shift-based extinction monitor (CAPS PMex) with an integrating nephelometer and a filter-based absorption monitor, Atmos. Meas. Tech., 6, 1141–1151, https://doi.org/10.5194/amt-6-1141-2013, 2013.
Ryder, C. L., Highwood, E. J., Rosenberg, P. D., Trembath, J., Brooke, J. K., Bart, M., Dean, A., Crosier, J., Dorsey, J., Brindley, H., Banks, J., Marsham, J. H., McQuaid, J. B., Sodemann, H., and Washington, R.: Optical properties of Saharan dust aerosol and contribution from the coarse mode as measured during the Fennec 2011 aircraft campaign, Atmos. Chem. Phys., 13, 303–325, https://doi.org/10.5194/acp-13-303-2013, 2013.
Schafer, J. S., Eck, T. F., Holben, B. N., Thornhill, K. L., Anderson, B. E., Sinyuk, A., Giles, D. M., Winstead, E. L., Ziemba, L. D., and Beyersdorf, A. J.: Intercomparison of aerosol single-scattering albedo derived from AERONET surface radiometers and LARGE in situ aircraft profiles during the 2011 DRAGON-MD and DISCOVER-AQ experiments, J. Geophys. Res.-Atmos., 119, 7439–7452, 2014.
Schwarz, J. P., Weinzierl, B., Samset, B. H., Dollner, M., Heimerl, K., Markovic, M. Z., Perring, A. E., and Ziemba, L.: Aircraft Measurements of Black Carbon Vertical Profiles Show Upper Tropospheric Variability and Stability, Geophys. Res. Lett., 44, 1132–1140, https://doi.org/10.1002/2016GL071241, 2016.
Sheridan, P. J., Arnott, W. P., Ogren, J. A., Andrews, E., Atkinson, D. B., Covert, D. S., Moosmüller, H., Petzold, A., Schmid, B., and Strawa, A. W.: The Reno Aerosol Optics Study: An Evaluation of Aerosol Absorption Measurement Methods, Aerosol Sci. Tech., 39, 1–16, 2005.
Shinozuka, Y., Clarke, A. D., Howell, S. G., Kapustin, V. N., Mcnaughton, C. S., Zhou, J., and Anderson, B. E.: Aircraft profiles of aerosol microphysics and optical properties over North America: Aerosol optical depth and its association with PM2.5 and water uptake, J. Geophys. Res.-Atmos., 112, 1037–1044, 2007.
Stein, A. F., Draxler, R. R., Rolph, G. D., Stunder, B. J. B., Cohen, M. D., and Ngan, F.: NOAA's HYSPLIT Atmospheric Transport and Dispersion Modeling System, B. Am. Meteorol. Soc., 96, 2059–2077, https://doi.org/10.1175/BAMS-D-14-00110.1, 2016.
Steinke, S., Eikenberg, S., Löhnert, U., Dick, G., Klocke, D., Di Girolamo, P., and Crewell, S.: Assessment of small-scale integrated water vapour variability during HOPE, Atmos. Chem. Phys., 15, 2675–2692, https://doi.org/10.5194/acp-15-2675-2015, 2015.
Stocker, T. F., Qin, D., Plattner, G. K., Tignor, M., Allen, S. K., Boschung, J., Nauels, A., Xia, Y., and Bex, V.: The physical science basis. Contribution of Working Group I to the Fifth Assessment Report of the Intergovernmental Panel on Climate Change, Computational Geometry, 18, 95–123, 2013.
Stratmann, F., Siebert, H., Spindler, G., Wehner, B., Althausen, D., Heintzenberg, J., Hellmuth, O., Rinke, R., Schmieder, U., Seidel, C., Tuch, T., Uhrner, U., Wiedensohler, A., Wandinger, U., Wendisch, M., Schell, D., and Stohl, A.: New-particle formation events in a continental boundary layer: first results from the SATURN experiment, Atmos. Chem. Phys., 3, 1445–1459, https://doi.org/10.5194/acp-3-1445-2003, 2003.
Sun, X., Yin, Y., Sun, Y., Sun, Y., Liu, W., and Han, Y.: Seasonal and vertical variations in aerosol distribution over Shijiazhuang, China, Atmos. Environ., 81, 245–252, 2013.
Sun, Y., Jiang, Q., Wang, Z., Fu, P., Li, J., Yang, T., and Yin, Y.: Investigation of the sources and evolution processes of severe haze pollution in Beijing in January 2013, J. Geophys. Res.-Atmos., 119, 4380–4398, 2014.
Tao, W. K., Chen, J. P., Li, Z., Wang, C., and Zhang, C.: Impact of aerosols on convective clouds and precipitation, Rev. Geophys., 50, 1–62, 2012.
Taubman, B. F., Marufu, L. T., Piety, C. A., Doddridge, B. G., Stehr, J. W., and Dickerson, R. R.: Airborne Characterization of the Chemical, Optical, and Meteorological Properties, and Origins of a Combined Ozone-Haze Episode over the Eastern United States, J. Atmos. Sci., 61, 1781–1793, https://doi.org/10.1175/1520-0469(2004)061<1781:acotco>2.0.co;2, 2004.
Taubman, B. F., Hains, J. C., Thompson, A. M., Marufu, L. T., Doddridge, B. G., Stehr, J. W., Piety, C. A., and Dickerson, R. R.: Aircraft vertical profiles of trace gas and aerosol pollution over the mid-Atlantic United States: Statistics and meteorological cluster analysis, J. Geophys. Res.-Atmos., 111, 10–17, 2006.
Twomey, S.: Pollution and the planetary albedo, Atmos. Environ., 8, 1251–1256, 1974.
Wandinger, U., Muller, D., Bockmann, C., Althausen, D., Matthias, V., Bosenberg, J., Weiss, V., Fiebig, M., Wendisch, M., Stohl, A., and Ansmann, A.: Optical and microphysical characterization of biomass-burning and industrial-pollution aerosols from multiwavelength lidar and aircraft measurements, J. Geophys. Res.-Atmos., 107, 8125, https://doi.org/10.1029/2000JD000202, 2002.
Virkkula, A., Ahlquist, N. C., Covert, D. S., Arnott, W. P., Sheridan, P. J., Quinn, P. K., and Coffman, D. J.: Modification, Calibration and a Field Test of an Instrument for Measuring Light Absorption by Particles, Aerosol Sci. Tech., 39, 68–83, 2005.
Yu, H., Liu, S. C., and Dickinson, R. E.: Radiative effects of aerosols on the evolution of the atmospheric boundary layer, J. Geophys. Res.-Atmos., 107, 4142, https://doi.org/10.1029/2001JD000754, 2002.
Zhang, L., Li, Q. B., Gu, Y., Liou, K. N., and Meland, B.: Dust vertical profile impact on global radiative forcing estimation using a coupled chemical-transport–radiative-transfer model, Atmos. Chem. Phys., 13, 7097–7114, https://doi.org/10.5194/acp-13-7097-2013, 2013.
Zhang, Q., Zhao, C., Tie, X., Wei, Q., Huang, M., Li, G., Ying, Z., and Li, C.: Characterizations of aerosols over the Beijing region: A case study of aircraft measurements, Atmos. Environ., 40, 4513–4527, https://doi.org/10.1016/j.atmosenv.2006.04.032, 2006.
Zhang, Q., Ma, X., Tie, X., Huang, M., and Zhao, C.: Vertical distributions of aerosols under different weather conditions: Analysis of in-situ aircraft measurements in Beijing, China, Atmos. Environ., 43, 5526–5535, https://doi.org/10.1016/j.atmosenv.2009.05.037, 2009.
Zhang, Q., Quan, J., Tie, X., Huang, M., and Ma, X.: Impact of aerosol particles on cloud formation: Aircraft measurements in China, Atmos. Environ., 45, 665–672, https://doi.org/10.1016/j.atmosenv.2010.10.025, 2011.
Zhao, C., Tie, X., and Lin, Y.: A possible positive feedback of reduction of precipitation and increase in aerosols over eastern central China, Geophys. Res. Lett., 33, 229–239, 2006.
Zhao, J., Du, W., Zhang, Y., Wang, Q., Chen, C., Xu, W., Han, T., Wang, Y., Fu, P., Wang, Z., Li, Z., and Sun, Y.: Insights into aerosol chemistry during the 2015 China Victory Day parade: results from simultaneous measurements at ground level and 260 m in Beijing, Atmos. Chem. Phys., 17, 3215–3232, https://doi.org/10.5194/acp-17-3215-2017, 2017.