the Creative Commons Attribution 4.0 License.
the Creative Commons Attribution 4.0 License.
 | 21 Jun 2018
Investigating the role of dust in ice nucleation within clouds and further effects on the regional weather system over East Asia – Part 1: model development and validation
Jimmy C. H. Fung
The GOCART–Thompson microphysics scheme coupling the GOCART aerosol model and the aerosol-aware Thompson–Eidhammer microphysics scheme has been implemented in the WRF-Chem to quantify and evaluate the effect of dust on the ice nucleation process in the atmosphere by serving as ice nuclei (IN). The performance of the GOCART–Thompson microphysics scheme in simulating the effect of dust in atmospheric ice nucleation is then evaluated over East Asia during spring, a typical dust-intensive season, in 2012. Based upon the dust emission reasonably reproduced by WRF-Chem, the effect of dust on atmospheric cloud ice water content is well reproduced. With abundant dust particles serving as IN, the simulated ice water mixing ratio and ice crystal number concentration increases by 15 and 7 % on average over the dust source region and downwind areas during the investigated period. The comparison with the ice water path from satellite observations demonstrated that the simulation of the cloud ice profile is substantially improved by considering the indirect effect of dust particles in the simulations. Additional sensitivity experiments are carried out to optimize the parameters in the ice nucleation parameterization in the GOCART–Thompson microphysics scheme. Results suggest that lowering the threshold relative humidity with respect to ice to 100 % for the ice nucleation parameterization leads to further improvement in cloud ice simulation.
- Article
(9369 KB) - Companion paper
- BibTeX
- EndNote


Dust aerosol is the second largest contributor to the global aerosol burden (Textor et al., 2006), and it is estimated to contribute around 20 % to annual global aerosol emissions (Tomasi et al., 2017). The Intergovernmental Panel on Climate Change (IPCC) has recognized dust as a major component of atmospheric aerosols, which are an “essential climate variable.” East Asia is a main contributor to the Earth's dust emissions. It has been reported in previous studies that East Asian dust contributes 25–50 % of global emissions, depending on the climate of the particular year (Ginoux et al., 2001).
Dust in the atmosphere alters the Earth's weather and climate in certain ways. By reflecting, absorbing, and scattering the incoming solar radiation, dust can cause a warming effect within the atmosphere and a cooling effect at the surface layer (Lacis, 1995), which is the direct effect of dust. The semi-direct effect of dust is related to the absorption of shortwave and longwave radiation by dust aerosol within clouds, leading to a warming of the surrounding environment and causing a shrinking of cloud and a lower cloud albedo, thus modifying the radiation budget (Perlwitz and Miller, 2010; Hansen et al., 1997). The dust–cloud interaction is also referred to as the indirect effect of dust. Dust particles are recognized as effective IN and play an important role in the ice nucleation process in the atmosphere, directly affecting the dynamics in ice and mixed-phase clouds, such as the formation and development of clouds and precipitation (Koehler et al., 2010; Twohy et al., 2009).
To date, many studies have been conducted to evaluate the direct radiative effect of dust aerosol using radiation schemes implemented in numerical models all over the world (Mallet et al., 2009; Nabat et al., 2015a; Ge et al., 2010; Hartmann et al., 2013; Huang et al., 2009; Bi et al., 2013; Y. Liu et al., 2011; J. Liu et al., 2011; Chen et al., 2017). Recently, the semi-direct effect of dust has been investigated in a few studies over different regions by applying various global and regional models (Tesfaye et al., 2015; Nabat et al., 2015b; Seigel et al., 2013). Unfortunately, due to the poor understanding of the dust–cloud interactions in microphysics processes, quantifying the microphysical effect of dust remains a difficult problem. Various ice nucleation parameterizations have been implemented into global models to estimate the importance of dust in atmospheric ice nucleation (Lohmann and Diehl, 2006; Karydis et al., 2011; Hoose et al., 2008; Zhang et al., 2014). However, most regional models are not capable of estimating the indirect effect of dust, and very rarely has work been done to assess the indirect effects of dust on the weather system, especially over East Asia, which is a major contributor to global dust emissions. Currently, only a few microphysics schemes considering the aerosol–cloud interaction are implemented in regional models. In most of these microphysics schemes only the cloud condensation nuclei (CCN) served by aerosols are considered (Perlwitz and Miller, 2010; Solomos et al., 2011; Miller et al., 2004), while IN are not treated or represented by a prescribed IN distribution (Chapman et al., 2009; Baró et al., 2015), and the production of ice crystals is simplified by a function of temperature or ice saturation. In reality, however, the number of ice crystals that can form in the atmosphere is highly dependent on the number of particles that can act as IN, and dust is the most abundant aerosol that can effectively serve as IN and affect the formation and development of mixed-phase and ice clouds in the atmosphere. This effect should not be neglected in numerical models, especially in the simulations over arid regions during strong wind events (DeMott et al., 2003, 2015; Koehler et al., 2010; Lohmann and Diehl, 2006; Atkinson et al., 2013).
In 2014, the aerosol-aware Thompson–Eidhammer microphysics scheme, which takes into account the aerosols serving as CCN and IN, has been implemented into the Weather Research and Forecast (WRF) model and also the Weather Research and Forecast model coupled with Chemistry (WRF-Chem), enabling the model to explicitly predict the number concentration for cloud droplets and ice crystals (Thompson and Eidhammer, 2014). Therefore, the aerosol-aware Thompson–Eidhammer scheme is an ideal microphysics scheme for evaluating the effect of dust in atmospheric ice nucleation processes. However, this scheme is not coupled with any aerosol model in WRF-Chem. When the aerosol-aware Thompson–Eidhammer microphysics scheme is activated, the model reads in pre-given climatological aerosol data derived from the output of other global climate models, which introduces large errors into the estimation of the effects of dust in microphysical processes. This problem can be solved by embedding a dust scheme into the Thompson–Eidhammer scheme or by coupling the microphysics scheme with WRF-Chem. Compared with WRF, WRF-Chem integrates various emission schemes and aerosol mechanisms for simulating the emission, transport, mixing, and chemical transformation of aerosols simultaneously with the meteorology (Grell et al., 2013). Therefore, WRF-Chem is more capable of producing a realistic aerosol field by comparing the performances of different emission schemes or aerosol mechanisms.
In light of the above, we aim to fully couple the aerosol-aware Thompson–Eidhammer microphysics scheme with the Goddard Chemistry Aerosol Radiation and Transport (GOCART) model (Ginoux et al., 2001) in the WRF-Chem modeling system in this study, enabling WRF-Chem to simultaneously simulate the effect of dust aerosol in ice nucleation processes during simulations. Based upon the implementation, the performance of the coupled GOCART–Thompson microphysics scheme in simulating the ice nucleation process involving dust particles was validated and the role that East Asian dust plays in the ice nucleation process in the atmosphere was further investigated.
The remainder of the paper is presented as follows. Section 2 provides a description of the model, and the implementation work for coupling the aerosol-aware Thompson–Eidhammer microphysics scheme and the GOCART aerosol model in WRF-Chem is elaborated in Sect. 3, followed by the model configurations for numerical simulations in Sect. 4. Section 5 presents the observational data used to validate the performance of the GOCART–Thompson microphysics scheme. Section 6 presents the results and discussion, followed by the conclusions in Sect. 7.
WRF-Chem is an online coupled regional modeling system, which means that it can simultaneously simulate the meteorological field, the chemical field, and the interactions in between (Grell et al., 2013). The chemical model contains several gas- and aerosol-phase chemical schemes. In this study, we focus on the GOCART model, a simple aerosol model that will be used for dust simulation.
2.1 GOCART aerosol model
GOCART is an aerosol model for simulating major tropospheric natural-source aerosol components, such as sulfate, mineral dust, black carbon, organic carbon, and sea-salt aerosols (Ginoux et al., 2001; Chin et al., 2000). It has been implemented into WRF-Chem as a bulk aerosol scheme. GOCART is a simple aerosol scheme that can predict the mass of aerosol components, but does not account for complex chemical reactions. Therefore, it is numerically efficient in simulating aerosol transport and thus applicable to cases without many chemical processes, especially dust events. Typically, it requires 40 to 50 % more computational time by applying WRF-Chem run with the GOCART aerosol model than the standard WRF to produce the same period of simulation.
Shao's dust emission scheme (Kang et al., 2011; Shao, 2004, 2001; Shao et al., 2011) is one of the dust emission schemes in the GOCART aerosol model and has been demonstrated to exhibit superior performance in reproducing the dust cycle over East Asia compared to other emission schemes (Su and Fung, 2015). The Shao emission scheme was updated in WRF-Chem since version 3.8 released in 2016 to produce five size bins for dust emission, with diameters of < 2, 2–3.6, 3.6–6.0, 6.0–12.0, and 12.0–20.0 µm and mean effective radii of 0.73, 1.4, 2.4, 4.5, and 8.0 µm.
2.2 Thompson–Eidhammer microphysics scheme
The Thompson microphysics scheme is a bulk two-moment aerosol-aware microphysics scheme that considers the mixing ratios and number concentrations for five water species: cloud water, cloud ice, rain, snow, and a hybrid graupel–hail category (Thompson et al., 2004). The updated Thompson–Eidhammer scheme is an aerosol-aware version of the Thompson scheme (Thompson and Eidhammer, 2014), which incorporates the activation of aerosols serving as cloud condensation nuclei and IN, and therefore it explicitly predicts the number concentrations of CCN and IN, as well as the number concentrations of cloud droplets and ice crystals. Hygroscopic aerosols that serve as cloud condensation nuclei are referred to as water-friendly aerosols, and those non-hygroscopic ice-nucleating aerosols are referred to as ice-friendly aerosols. The cloud droplets nucleate from explicit aerosol number concentrations using a look-up table for the activated fraction as determined by the predicted temperature, vertical velocity, number of available aerosols, and predetermined values of the hygroscopicity parameter and aerosol mean radius.
In the Thompson–Eidhammer scheme, the ice nucleation process is triggered once the relative humidity with respect to ice (RHi) exceeds 105 %. Furthermore, when the relative humidity with respect to water (RHw) is above 98.5 %, it is counted as condensation and immersion freezing and calculated by DeMott's parameterization scheme (DeMott et al., 2010); when RHw is below 98.5 %, it is treated as deposition nucleation and determined by the Phillips parameterization scheme (Phillips et al., 2008). Both the DeMott scheme and the Phillips scheme are coupled with the concentration of ice-friendly aerosols. In addition, the freezing of deliquesced aerosols using the hygroscopic aerosol concentration is parameterized following Koop's parameterization scheme (Koop et al., 2000), and it is coupled with the concentration of water-friendly aerosols.
The DeMott parameterization scheme for determining the condensation and immersion freezing in the Thompson–Eidhammer microphysics scheme was proposed in 2010 (DeMott et al., 2010, hereafter referred to as the DeMott2010 scheme) based on combined data from field experiments at a variety of locations over 14 years. In the Demott2010 parameterization, the relationship between the number concentration of aerosol-friendly aerosols and ice-nucleating particles (INP) is as follows:
where is the INP number concentration at a temperature of Tk, naero is the number concentration of ice-friendly aerosols, and a, b, c, and d are constant coefficients equal to , 3.33, , and , respectively. The parameterization was tested with various temperatures and number concentrations of ice-friendly aerosols, yielding a good performance in reproducing the ice crystal number concentration under conditions of a relatively low mixing ratio of water vapor or a low concentration of INP compared with field–experimental data. The relationship between the simulated number concentrations of ice-friendly aerosols and INP is basically linear for concentrations of both of under 1000 cm−3 (DeMott et al., 2010).
The above parameterization was further developed in 2015 (DeMott et al., 2015, hereafter the DeMott2015 scheme) for conditions of a higher mixing ratio of water vapor or a higher concentration of ice crystals based on the latest data from field and laboratory experiments. According to the updated observational data, INP concentration increases exponentially with the number concentration of ice-friendly aerosols, and existing aerosols with relatively low concentrations (less than 1000 cm−3) can produce a large number of INP (more than 100 000 cm−3). The updated relationship between the number concentrations of ice-friendly aerosols and INP in the DeMott2015 parameterization scheme is as follows:
where α, β, γ, and δ are constant coefficients equal to 0, 1.25, 0.46, and −11.6, respectively. The calibration factor cf ranges from 1 to 6 and is recommended to be 3.
The number concentration of INP produced by the DeMott2015 scheme is much higher than that produced by the DeMott2010 scheme, and the difference grows larger with decreasing temperature and an increasing number concentration of ice-friendly aerosols (DeMott et al., 2015). Although the DeMott2015 scheme has been implemented in the code of the Thompson–Eidhammer scheme, it cannot be used without modifying the code. Instead of using the DeMott2010 scheme by default, we modified the code to call the DeMott2015 scheme in the Thompson–Eidhammer scheme for the condensation and immersion freezing in our simulations investigate ice nucleation involving dust.
Originally, the calibration factor cf is set to be 3 and the threshold temperature is set to be −20 ∘C. For the ice nucleation process in the Thompson–Eidhammer scheme, the number concentrations of both water-friendly aerosols and ice-friendly aerosols are pre-given in the initialization of the simulations and are derived from the climatological data produced by global model simulations in which particles and their precursors are emitted by natural and anthropogenic sources and explicitly modeled with various size bins for multiple species of aerosols by the GOCART model. In the consequent simulations, a fake aerosol emission is implemented by giving a variable lower boundary condition based on the initial near-surface aerosol concentration and a simple mean surface wind for calculating a constant aerosol flux at the lowest level in the model. The number concentrations of both water-friendly aerosols and ice-friendly aerosols are then updated at every time step by summing up the fake aerosol emission fluxes and tendencies induced by aerosol–cloud interactions. The limitation of the current aerosol-aware Thompson–Eidhammer scheme is that the aerosol profile generated from a fake emission cannot represent the realistic aerosol level all the time, especially over areas with complex weather such as East Asia, leading to errors in quantifying the indirect effects of aerosols.
Coupling the GOCART aerosol model with the Thompson–Eidhammer microphysics scheme allows the model to explicitly evaluate the indirect effect of natural-source aerosols on the basis of a relatively realistic emission production, for instance the effect of dust on ice nucleation during severe dust episodes or a dust-intensive season.
To investigate the real-time indirect effects of dust aerosol over East Asia, a new treatment was implemented into WRF-Chem to couple the GOCART aerosol model and the Thompson–Eidhammer microphysics scheme, namely the GOCART–Thompson microphysics scheme. To accomplish this, WRF-Chem version 3.8.1 has been modified in the following three steps.
3.1 Upgraded GOCART aerosol model
Currently, the GOCART aerosol model generates only the mass concentration for aerosols but no number concentrations. However, the number concentrations of aerosols are required for a microphysics scheme to evaluate the indirect effects of aerosols. Therefore, modification was needed to provide information about the number concentrations of aerosols from the mass concentration produced in the GOCART aerosol model.
The aerosol mass concentration was converted into a number concentration using the aerosol density and effective radius for each size bin. Assuming that dust particles are spherical, the mass per dust particle (mp, µg−1) for a size bin can be approximated through the mean effective radius (rdust, m) and density (ρdust, kg m−3) for that size bin.
The number concentration of dust particles N (kg−1) for size bin n at a grid point is then calculated by using the following equation:
where is the dust mass mixing ratio (µg kg−1) for size bin n at grid point . Summing up the aerosol number concentrations through all of the size bins gives a total dust number concentration, which will be passed into the Thompson–Eidhammer microphysics scheme. Note that all of the dust particles are treated as ice-friendly aerosols in this study and represented by a newly introduction variable, ice-friendly aerosol produced by the GOCART aerosol model (GNIFA).
3.2 GOCART–Thompson microphysics scheme
This part of the modification was to hook up the GOCART aerosol model and the Thompson–Eidhammer microphysics scheme.
Instead of reading in the pre-given climatological aerosol data, the initialization module of the Thompson–Eidhammer microphysics scheme was modified to apply the bulk number concentration of ice-friendly aerosols produced by the GOCART aerosol model for the calculation of the number concentration of ice-nucleating particles.
After the microphysical processes are finished for a particular time step, the tendency of the bulk aerosol number concentration (tendust, ) produced by the microphysics scheme is then passed into a wet scavenging scheme, which will be described in detail in the following subsection, for the model to calculate the loss of aerosol mass due to the microphysical processes within clouds and update the aerosol mass field.
3.3 In-cloud wet scavenging
As no in-cloud scavenging is considered for dust aerosol in WRF-Chem, a new wet scavenging process was introduced into WRF-Chem to calculate the loss of aerosol mass due to the microphysical processes within clouds using the tendency of aerosol number concentration produced by the microphysics scheme. Assuming that the collection of dust particles is proportional to the number concentration of dust particles, the fraction of dust particles for each size bin (φ, %) can be calculated in the GOCART aerosol model.
The tendency of ice-friendly aerosol is then distributed into each size bin and the loss of dust mass due to the microphysical processes (wetscav, µg kg−1) for a particular size bin n is calculated by using the following equation:
where dt is the time step for the simulation.
The mass mixing ratio (C, µg kg−1) for dust aerosol in a particular size bin n is then updated at the next time step.
Apart from the in-cloud scavenging, the below-cloud wet removal is calculated by the default wet deposition scheme in the GOCART aerosol model, in which the wet removal of dust is accomplished by a constant scavenging factor when there is precipitation (Duce et al., 1991; Hsu et al., 2009).
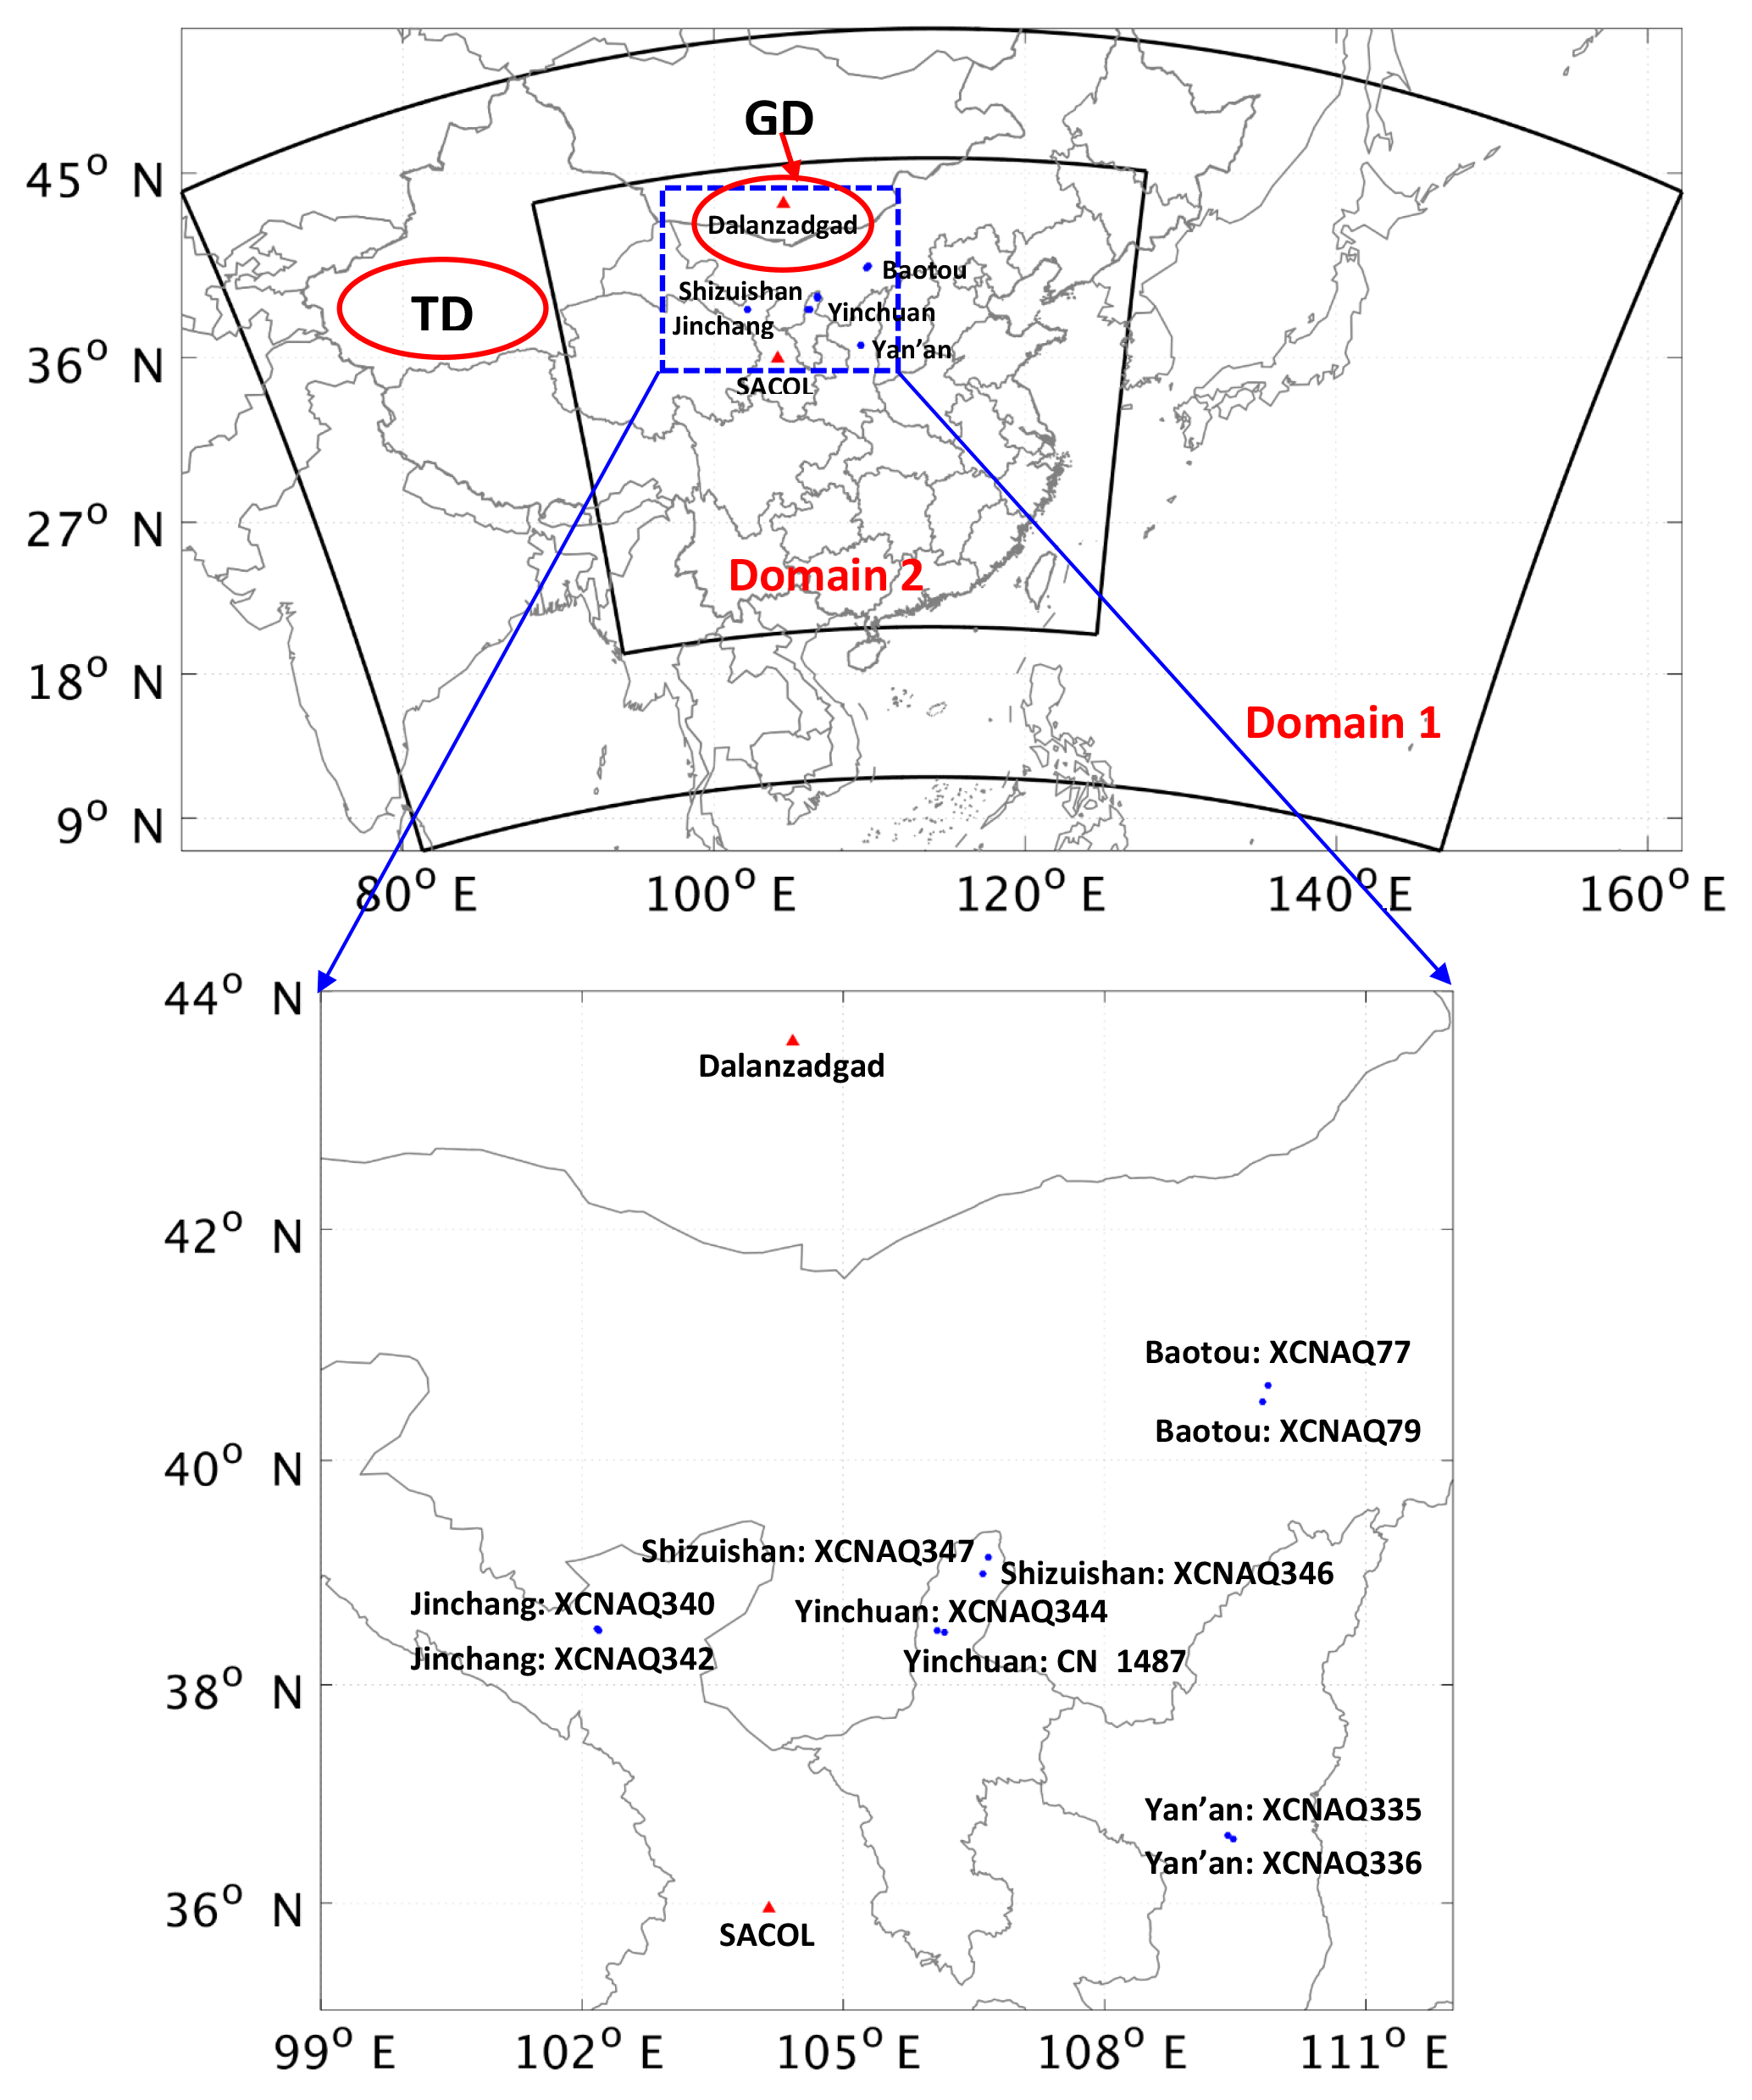
Figure 1Nested domain set for the simulations. Blue dots represent the 10 monitoring stations used for model validation. TD: the Taklimakan Desert; GD: the Gobi Desert.
A numerical experiment was conducted to examine the performance of the newly implemented GOCART–Thompson microphysics scheme in simulating the ice nucleation process induced by dust in the atmosphere. Two simulations were carried out for the numerical test. One control run (CTRL) was simulated without dust and one test run (DUST) with dust. According to the observations, the dust events in 2012 over East Asia were concentrated in mid-March to late April, and the satellite observations from mid-March to the end of April were available for model validation; therefore, the simulation period was from 9 March to 30 April 2012, with the first 8 days as “spin-up” time. Only the results from 17 March to 30 April 2012 were used for the analysis. The final reanalysis data provided by the United States National Center of Environmental Prediction with a horizontal resolution of 1∘ were used for generating the initial and boundary conditions for the meteorological fields, and the simulations were re-initialized every 4 days with the aerosol field being recycled, which means that the output of the aerosol field from the previous 4-day run was used as the initial aerosol state for the subsequent 4-day run. The integration time step for the simulations was 90 s.
Two nested domains were used for the simulations, as shown in Fig. 1. The outer domain (domain 1) is in a horizontal resolution of 27 km and covers the entire East Asia region. The inner domain (domain 2) is in a horizontal resolution of 9 km and covers the entirety of central to eastern China. Both domains have 40 vertical layers, with the top layer at 50 hPa. The locations of the two major dust sources, the Taklimakan Desert (TD) and the Gobi Desert (GD), are marked in Fig. 1.
In the GOCART–Thompson scheme, deposition nucleation is determined by the Phillips parameterization (Phillips et al., 2008), the freezing of deliquesced aerosols using the hygroscopic aerosol concentration is parameterized following Koop's parameterization scheme (Koop et al., 2000), and the condensation and immersion freezing is parameterized by the DeMott2015 ice nucleation scheme. The new wet scavenging scheme was used for the in-cloud wet scavenging of aerosols due to microphysical processes. The GOCART aerosol model was applied to simulate aerosol processes (Ginoux et al., 2001, 2004) and produce the number concentration of dust particles in DUST. Shao's dust emission (Kang et al., 2011; Shao et al., 2011) with soil data from the United States Geological Survey (USDA, 1993), which have been demonstrated to have good performance in reproducing dust emissions over East Asia, were used to generate dust emissions in the simulations of TEST. The number concentration of dust particles was then fed into the GOCART–Thompson microphysics scheme and treated as ice-friendly aerosols for calculating the condensation and immersion freezing involving dust by the DeMott2015 parameterization scheme. In addition, the pre-given climatological profiles applied in the original Thompson–Eidhammer scheme (Thompson and Eidhammer, 2014) were used to provide the number concentration of water-friendly aerosols for the freezing of deliquesced aerosols calculated by Koops's parameterization scheme to consider the background indirect effect of aerosols on ice nucleation for the simulations of both CTRL and DUST in this study.
Other important physical and chemical parameterizations applied for the simulations are as follows. The Mellor–Yamada–Janjić (MYJ) turbulent kinetic energy scheme was used for the planetary boundary layer parameterization (Janjić, 2002, 1994); the moisture convective processes were parameterized by the Grell–Freitas scheme (Grell and Freitas, 2014); the shortwave (SW) and longwave (LW) radiation budgets were calculated by the Rapid Radiative Transfer Model for General Circulation (RRTMG) SW and LW radiation schemes (Mlawer et al., 1997; Iacono et al., 2008); the gravitational settling and surface deposition were combined for the aerosol dry deposition calculation (Wesely, 1989); a simple washout method was used for the below-cloud wet deposition of aerosols (Duce et al., 1991; Hsu et al., 2006); and the aerosol optical properties were calculated based on the volume-averaging method (Horvath, 1998).
5.1 Surface PM10 observations
Hourly observations of the surface concentration of particulate matter with a diameter smaller than 10 µm (PM10) at 10 environmental monitoring stations located in or surrounding the dust source areas in East Asia were used to examine the capability of the model to reproduce dust levels at the ground surface during the simulation period. The 10 stations (indicated by blue dots in Fig. 1) were located in the following five cities: Jinchang (Gansu Province), Yinchuan (Qinghai Province), Shizuishan (Ningxia Province), Baotou (Inner Mongolia), and Yan'an (Shaanxi Province), with 2 stations in each city.
5.2 AERONET AOD observations
The AERONET program is a ground-based aerosol remote sensing network for measuring aerosol optical properties at sites distributed around the globe. This program provides a long-term database of aerosol optical properties such as aerosol extinction coefficient, single-scattering albedo, and aerosol optical depth (AOD) measured at various wavelengths. The observational data from two sites were available for comparison with the simulation results during the simulation period in this study. One was Dalanzadgad, located to the north of the Gobi Desert in Mongolia, and the other was the Semi-Arid Climate and Environment Observatory of Lanzhou University (SACOL), located in Lanzhou, Gansu Province, China. The exact locations of the two AERONET sites are depicted by the red triangles in Fig. 1. All of the measured data passed the quality control standard level 2 with an uncertainty of ±0.01 (Holben et al., 2001).
5.3 Satellite data
5.3.1 Multi-angle Imaging SpectroRadiometer (MISR)
The MISR instrument aboard the Terra platform of the United State National Aeronautics and Space Administration (NASA) has been monitoring aerosol properties globally since 2000. It measures the aerosol properties in four narrow spectral bands centered at 443, 555, 670, and 865 nm, due to which the aerosol properties even over highly bright surfaces, such as deserts, can be retrieved (Martonchik et al., 2004; Diner et al., 1998). In this study, the AOD data at 555 nm retrieved from the MISR level 3 products with a spatial resolution of 0.5∘ were used for comparison with the spatial distribution of simulated AOD over East Asia during the investigated period.
5.3.2 Moderate Resolution Imaging Spectroradiometer (MODIS)
The MODIS instruments aboard the Terra and Aqua platforms of NASA monitor Earth's surface and provide global high-resolution cloud and aerosol optical properties at a near-daily interval (Kaufman et al., 1997).
To retrieve aerosol information over bright surfaces, the Deep Blue algorithm was developed to employ retrievals from the blue channels of the MODIS instruments, at which wavelength the surface reflectance is very low such that the presence of aerosol can be detected by increasing total reflectance and enhanced spectral contrast (Hsu et al., 2006). By applying this algorithm, the AOD values at wavelengths of 214, 470, 550, and 670 nm over bright surfaces can be retrieved. In this study, the MODIS level 2 AOD data at 550 nm with a spatial resolution of 10 km were used for comparison with the simulated AOD during the simulation period.
5.3.3 Cloud-Aerosol Lidar and Infrared Pathfinder Satellite Observation (CALIPSO)
The Cloud-Aerosol Lidar and Infrared Pathfinder Satellite, which is aboard the Aqua platform of NASA, combines an active light detection and ranging (lidar) instrument with passive infrared and visible imagers to probe the vertical structure and properties of thin clouds and aerosols around the globe (Vaughan et al., 2004). It aims to fill existing gaps in the ability to measure the global distribution of aerosols and cloud properties and provides three-dimensional perspectives of how clouds and aerosols form, evolve, and affect weather and climate. It measures high-resolution vertical profiles of aerosol and cloud extinction coefficients globally at wavelengths of 532 and 1064 nm. The atmospheric IWC is derived from the observational cloud extinction coefficients at 532 nm (Winker et al., 2009). In this study, the vertical profiles of CALIPSO IWC with a horizontal resolution of 5 km and a vertical resolution of 60 m were applied to verify the performance of the model in simulating the vertical distribution of atmospheric IWC.
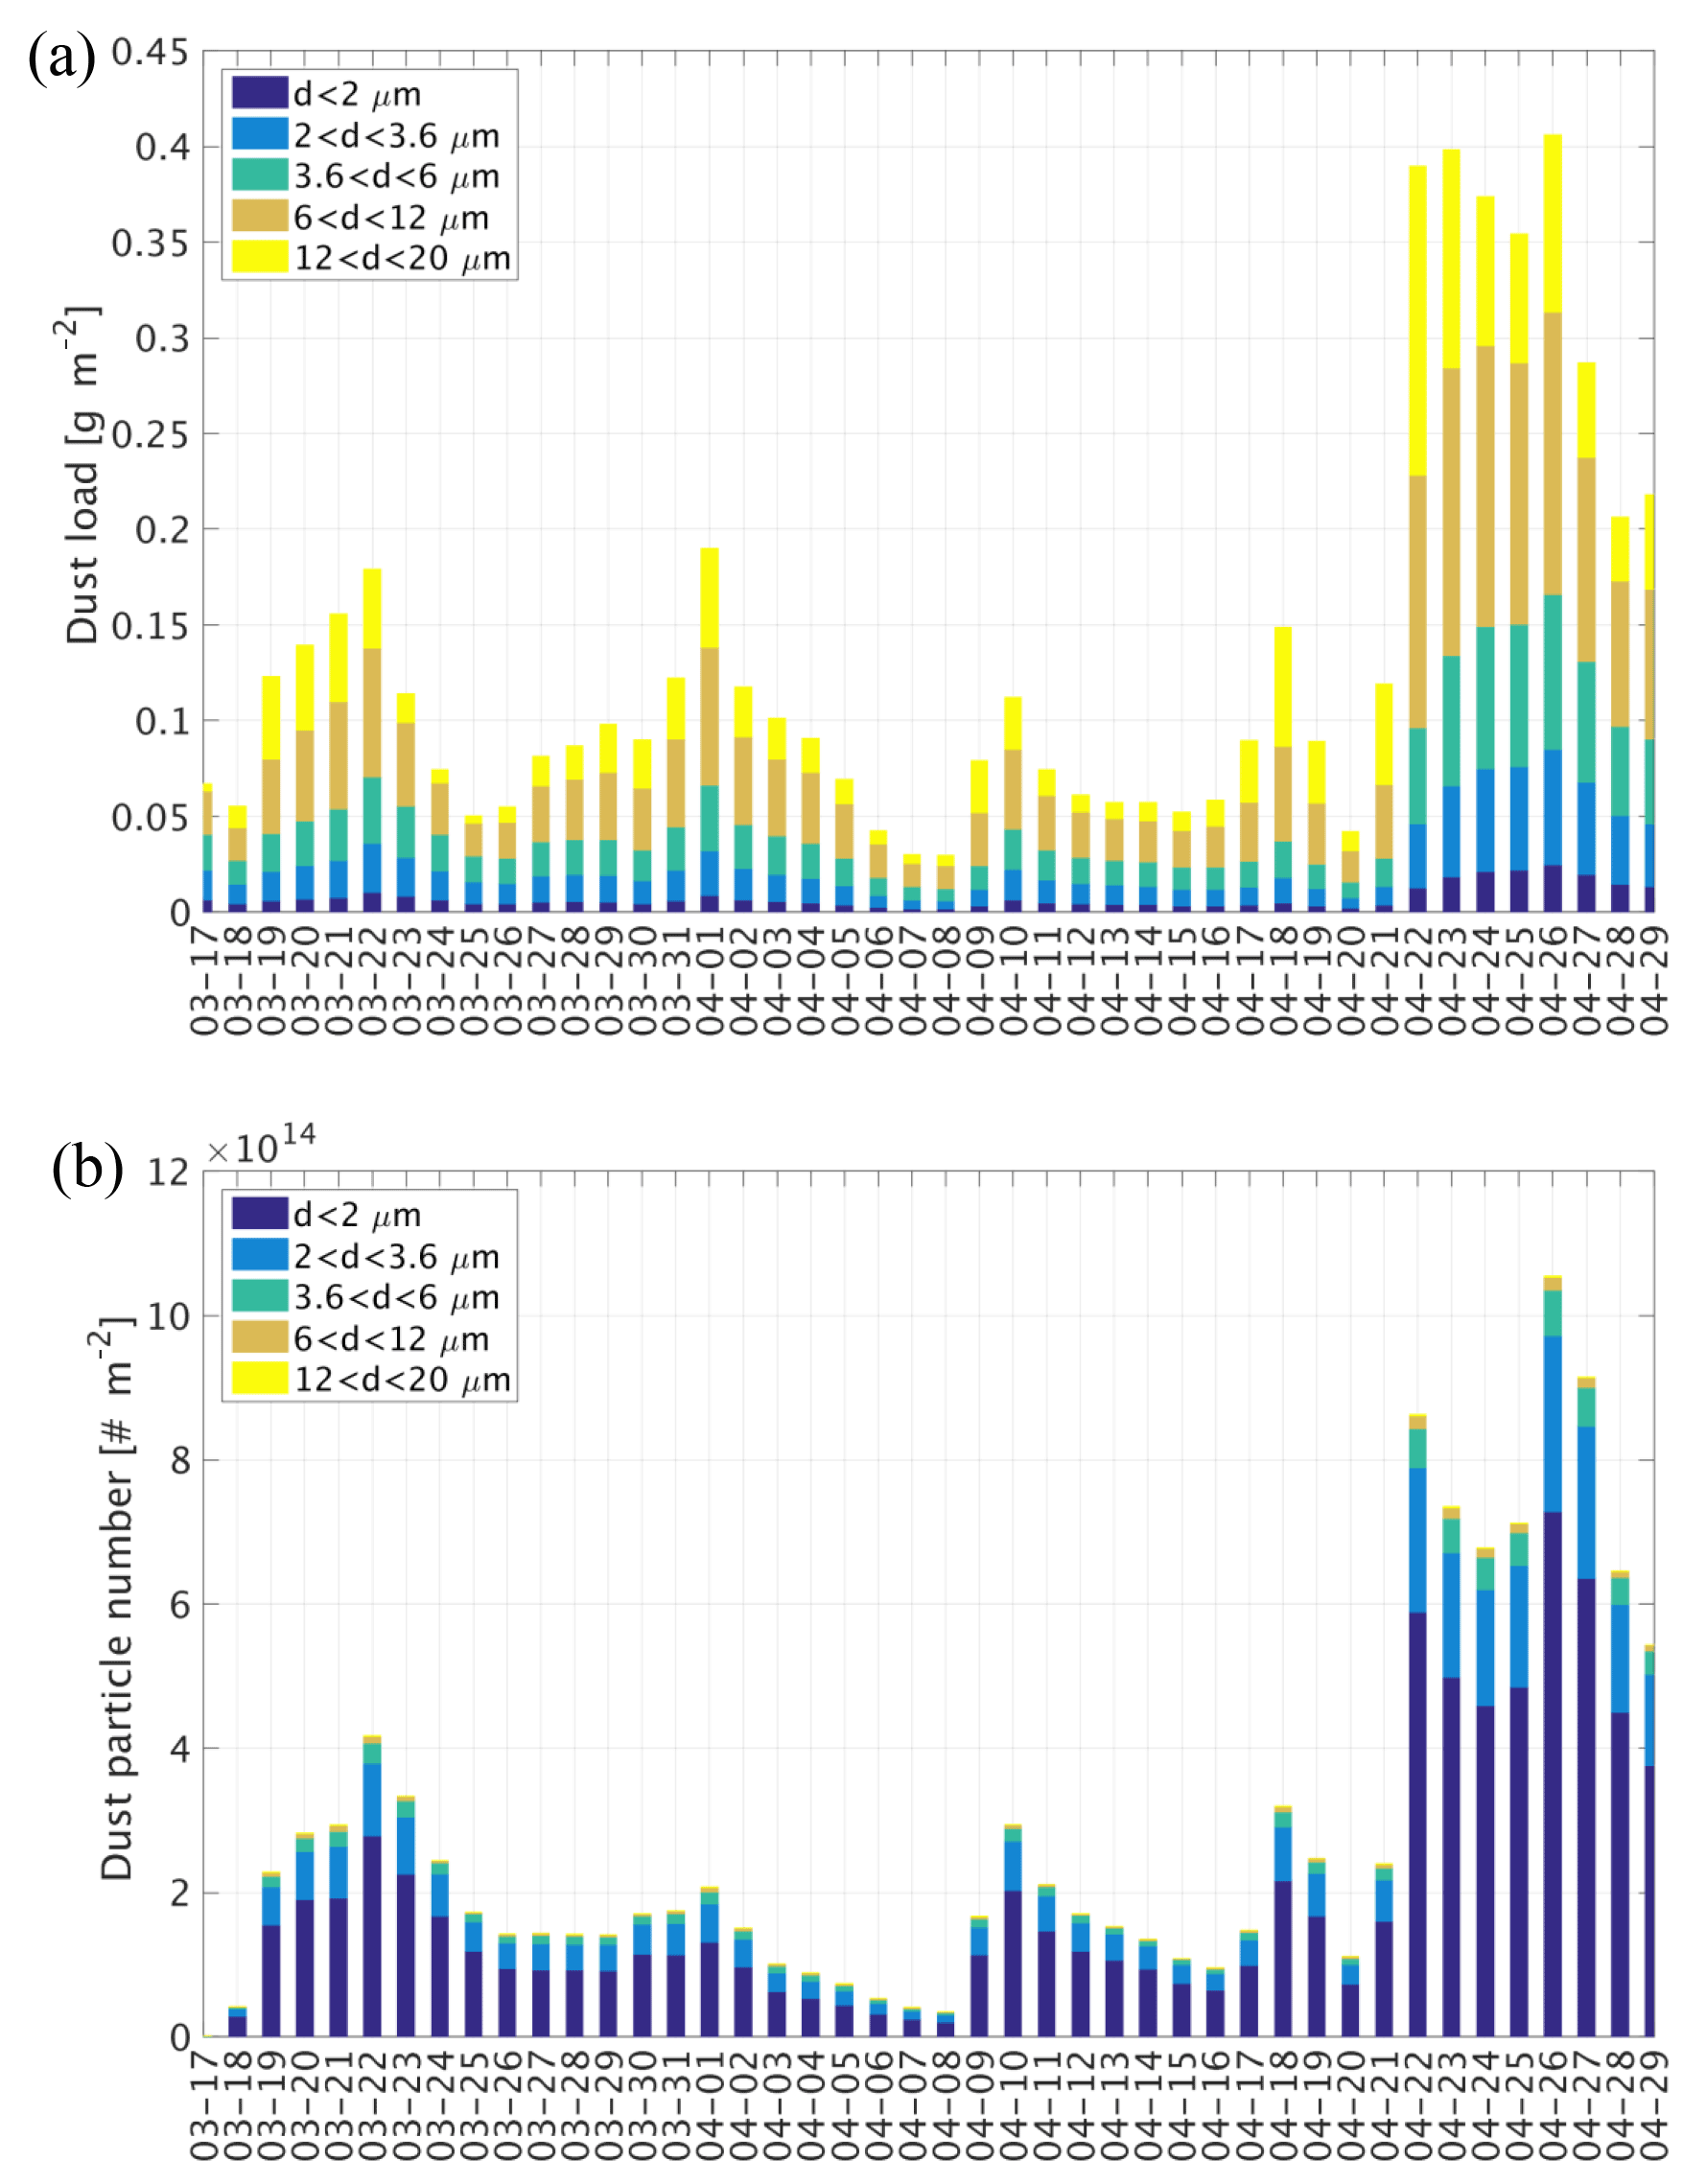
Figure 2Time series of spatially averaged daily dust mass load (a) and daily number density of dust particles (b) over East Asia (domain 1) during the simulation period.
6.1 Dust over East Asia
The time series of daily average dust load over the entire East Asia region (domain 1) during the simulation period is shown in Fig. 2a. In total four dust events occurred during the simulation period, lasting from 18 to 25 March, 30 March to 7 April, 9 to 19 April, and 22 to 29 April 2012. The case from 22 to 29 April was the most significant one, with a daily dust load double that of the other cases. The fraction of daily dust load for each size bin is also shown in Fig. 2a. The dust particles in the fourth and fifth bins with effective diameters ranging from 6 to 20 µm account for the major part (around 60 %) of the total mass of dust aerosols.
The number concentrations of dust particles over East Asia were vertically integrated to obtain the number density of dust particles. As shown in Fig. 2b, the time series of the daily average number density of dust particles over East Asia during the simulation period shows a similar distribution as that for dust load; the noteworthy distinction between the two time series lies in the fraction of each size bin. The two size bins with the smallest diameters (no larger than 3.6 µm) account for over 80 % of the total number of dust particles, and the particles with diameters smaller than 6 µm account for over 95 % of the total number of dust particles, indicating that the smallest dust particles are the main source of ice-friendly aerosol to serve as IN in the atmosphere.
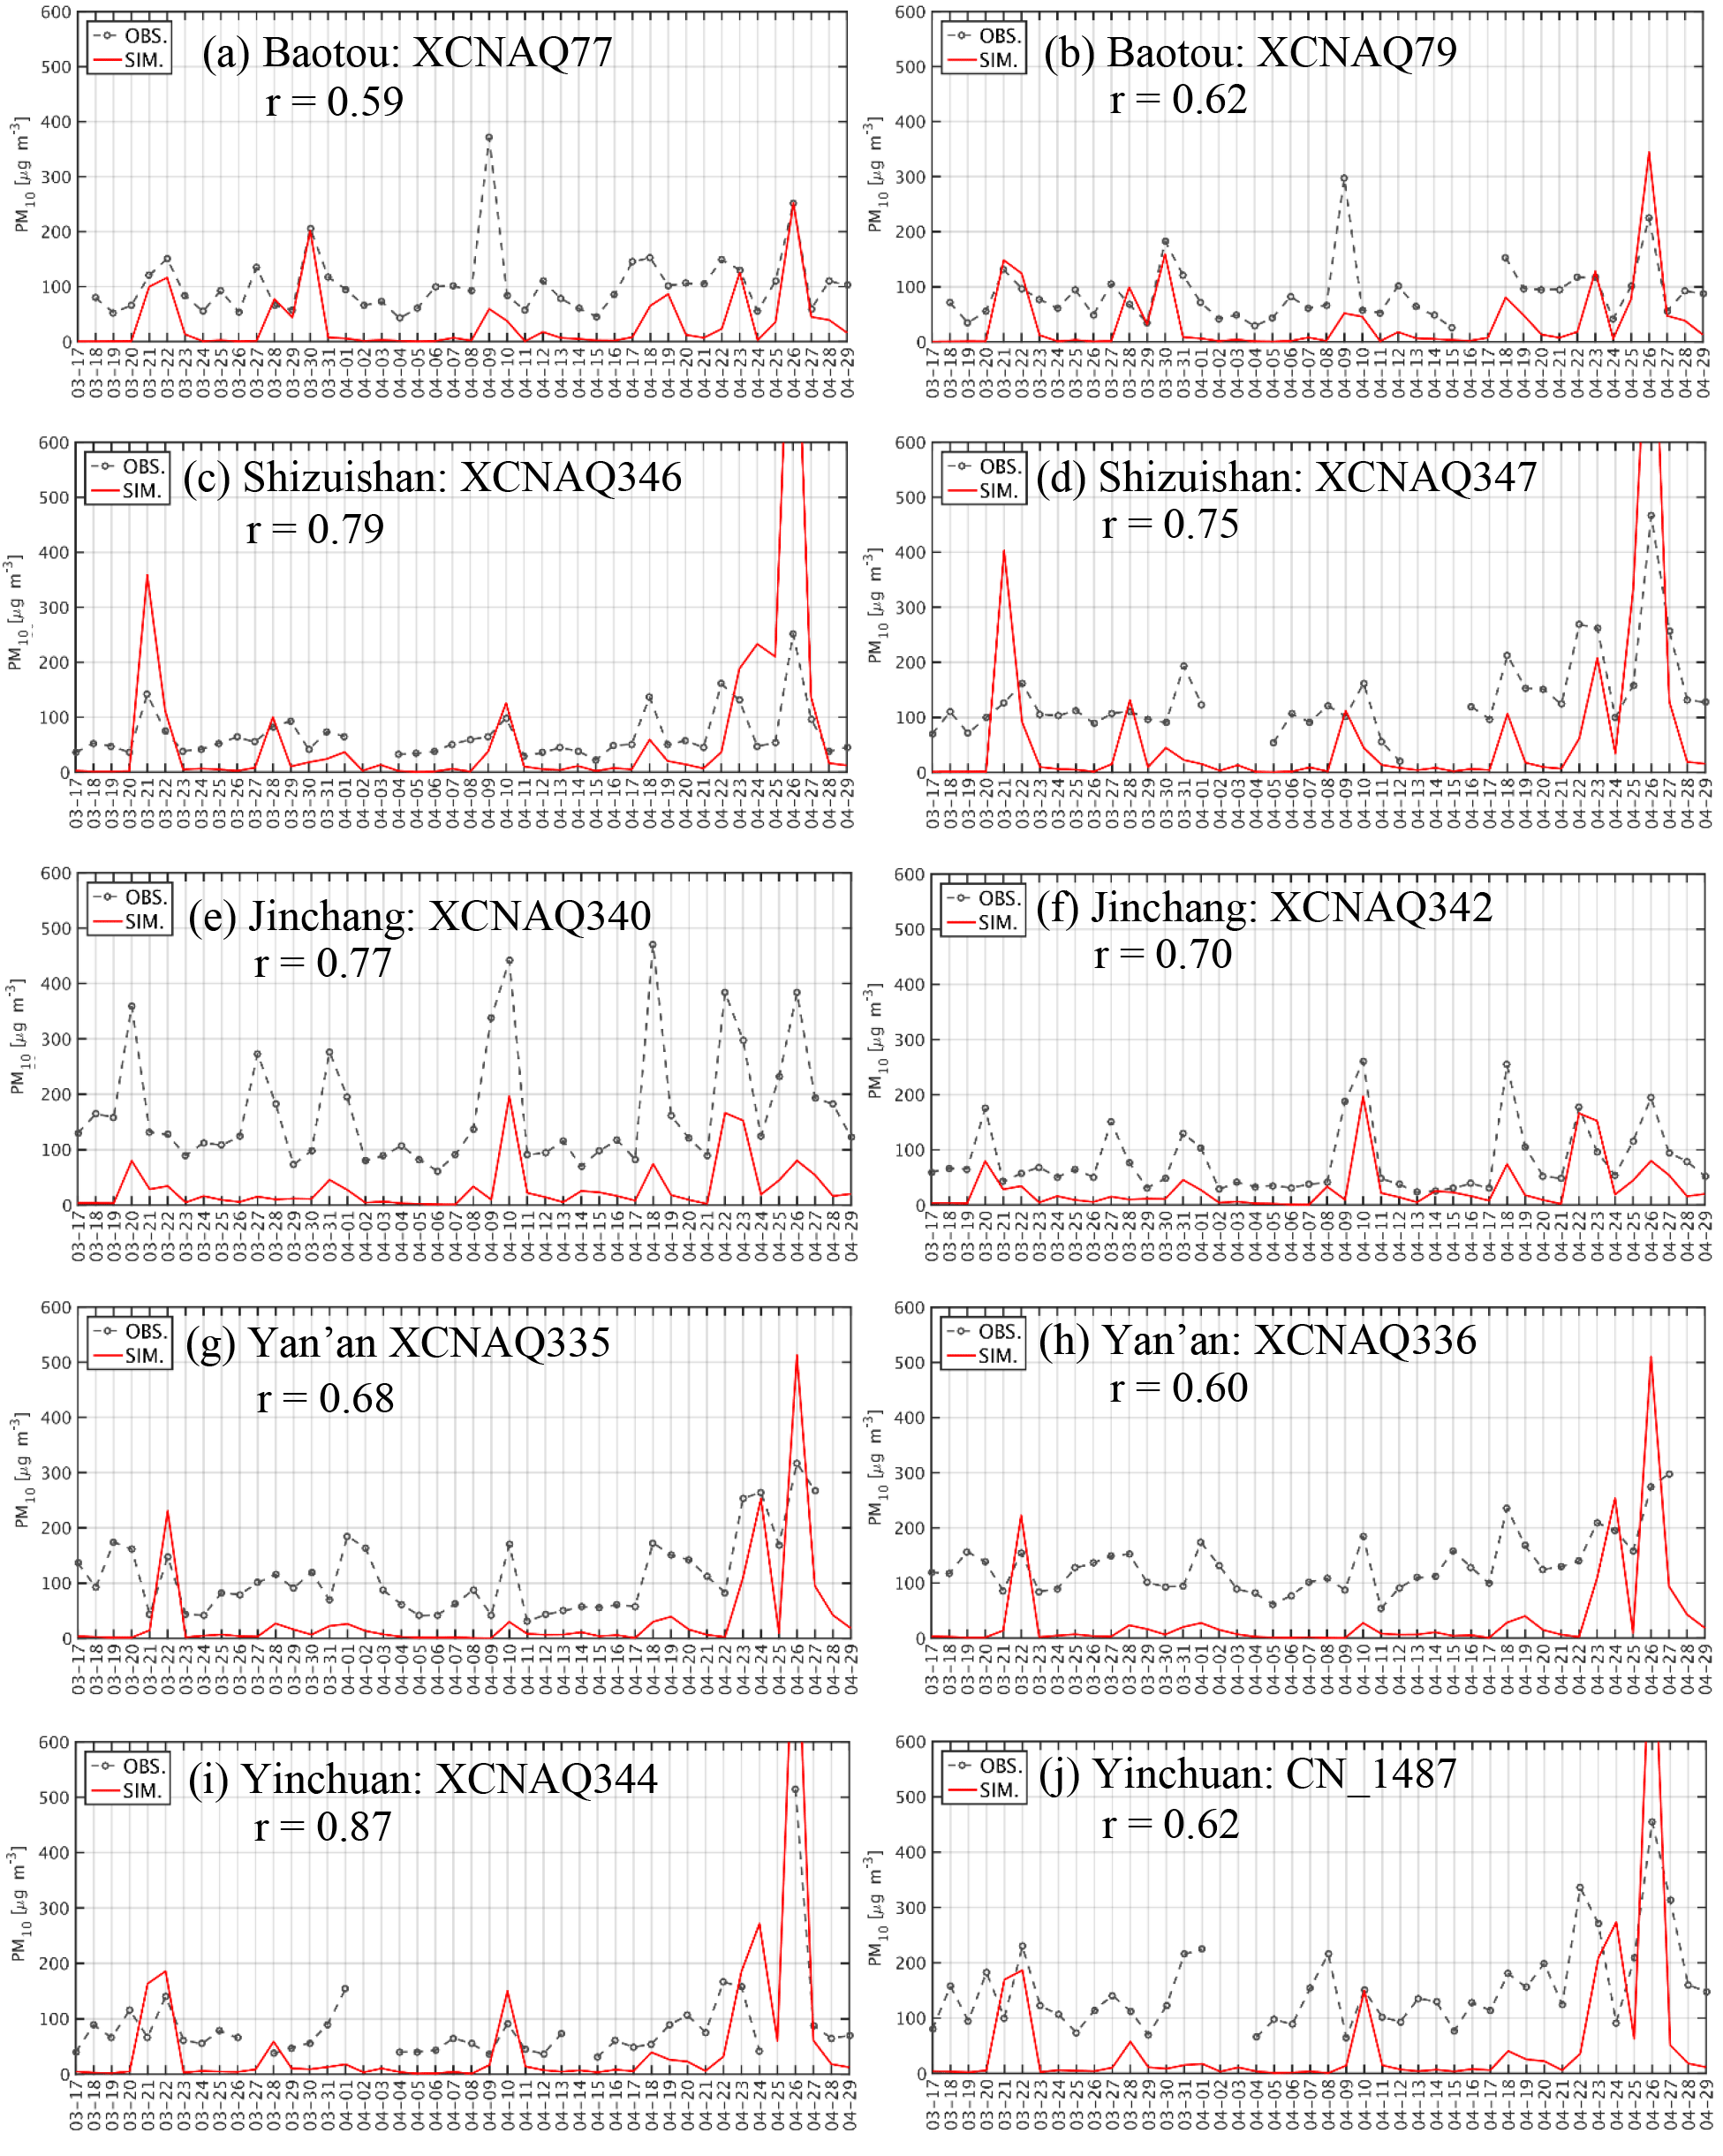
Figure 3Time series of hourly observed and simulated surface PM10 concentrations at various environmental monitoring stations; r represents the correlation coefficient between simulation results and observations.
Table 1Performance statistics for the model in simulating surface PM10 concentrations at environmental monitoring stations during the simulation period.
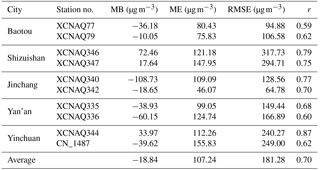
MB: mean bias; ME: mean error; RMSE: root mean squared error; r: correlation coefficient.
6.1.1 Surface PM10 concentration
To evaluate the performance of WRF-Chem in reproducing dust emissions over East Asia, the simulated surface PM10 concentrations were compared with the observations from the 10 environmental monitoring stations located near dust sources and downwind areas (described in Sect. 5.1). The time series of the observed and simulated surface PM10 concentrations during the simulation period are shown in Fig. 3. Note that the simulated PM10 concentrations were extracted from the nearest grid point to the geographical coordinates of the stations. The stations in the same city were assigned into one group such that there are five groups in Fig. 3. Overall, the model shows a good performance in simulating the dust cycle at different locations, with the evolution and magnitude of the daily mean PM10 concentration well captured at most of the stations. The model tends to produce lower surface PM10 concentration than those observed, as no other emissions were considered in the simulations apart from dust. However, the dust events on 21 March and 26 April were overestimated by the model at both stations in Shizuishan (Fig. 3c and d) and Yinchuan (Fig. 3i and j).
The performance statistics were computed from the daily average simulated PM10 concentration from DUST and the corresponding observations, as shown in Table 1. The model tends to produce lower surface PM10 concentrations than those observed, as no other emissions were considered in the simulations. The mean bias (MB) ranged from −108.73 to 72.46 µg m−3, with a mean over all the stations of −18.84 µg m−3. The mean error (ME) ranged from 46.07 to 155.83 µg m−3, with a mean over all of the stations of 107.24 µg m−3. The root mean squared error (RMSE) ranged from 64.78 to 317.73 µg m−3, with a mean over all of the stations of 181.28 µg m−3. The relatively large values of the MB, ME, and RMSE are mainly attributed to the fact that no other aerosol emissions were considered in the simulations other than dust, while the surface PM10 concentration at the monitoring stations is influenced by aerosols emitted from other sources, such as anthropogenic emissions. The correlation coefficient (r) ranged from 0.59 to 0.87, with an average for all of the stations of 0.70. The comparisons between the observed and simulated surface PM10 concentration indicates that the model is capable of reproducing the surface dust concentration reasonably during dust events over East Asia.
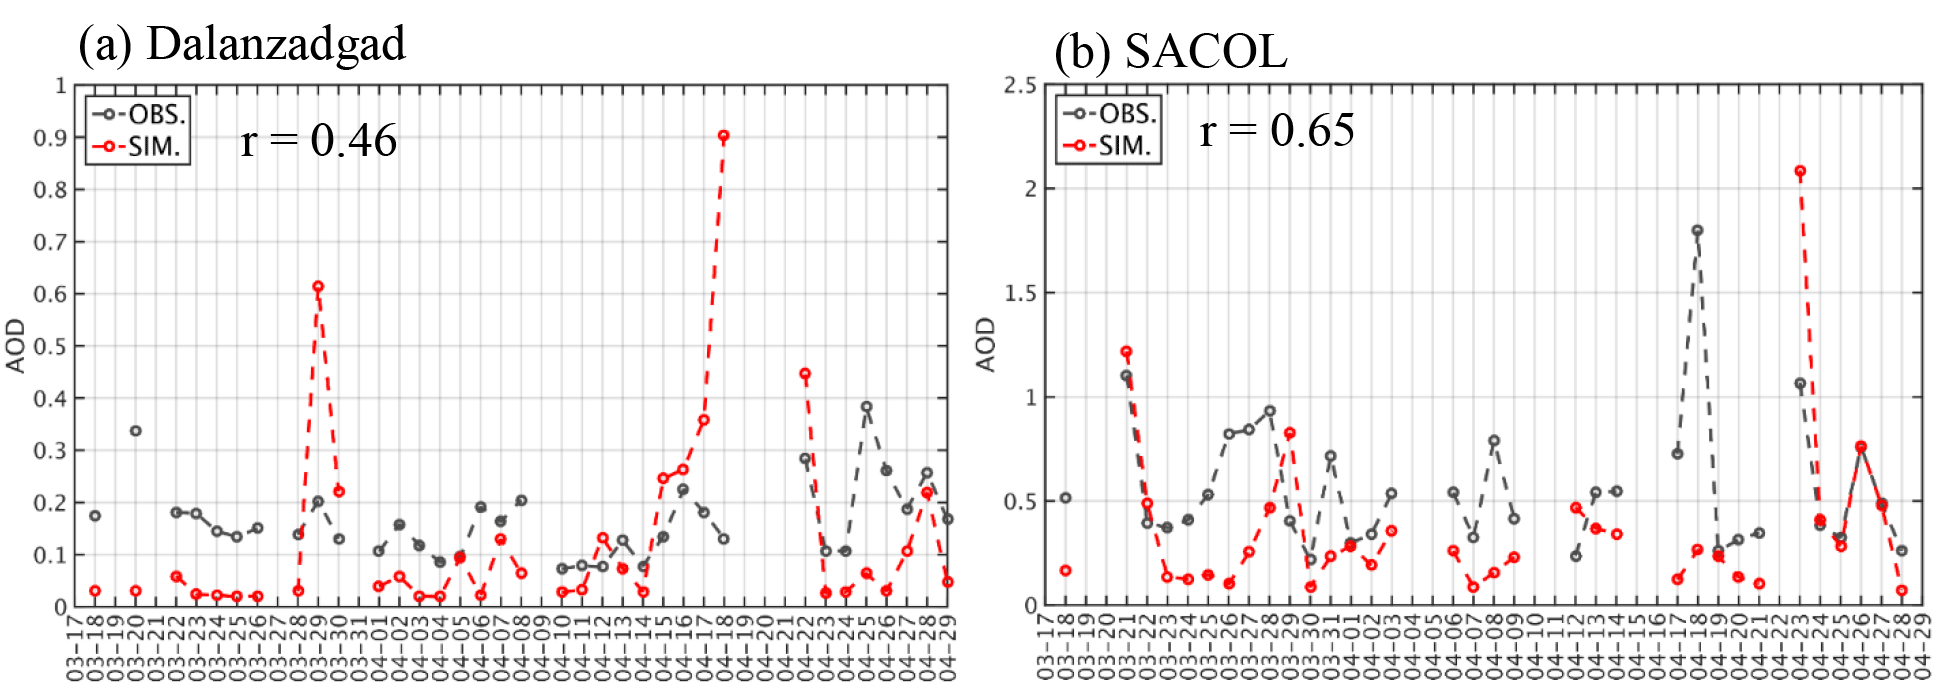
Figure 4Time series of daily mean observed and simulated aerosol optical depths at Dalanzadgad (a) and SACOL (b); r represents the correlation coefficient between simulation results and observations.
6.1.2 AOD time series
To examine the performance of the model in reproducing the column sum of dust in the atmosphere, the simulated AOD values were compared with observations measured at two AERONET sites during the simulation period, as shown in Fig. 4.
The site at Dalanzadgad (Fig. 4a) is located in Mongolia to the north of the Gobi Desert. Overall, the evolution and magnitude of the AOD time series at Dalanzadgad were reasonably reproduced by the model during the simulation period, despite the fact that the simulated AOD was overestimated at the end of March and in mid-April compared to the observed values.
SACOL (Fig. 4b) is a site located in Lanzhou, Gansu Province, which is a typical downwind area for dust in China. The model showed a good performance in reproducing the time series of AOD at SACOL during the entire simulation period, with the evolution and magnitude of AOD well captured.
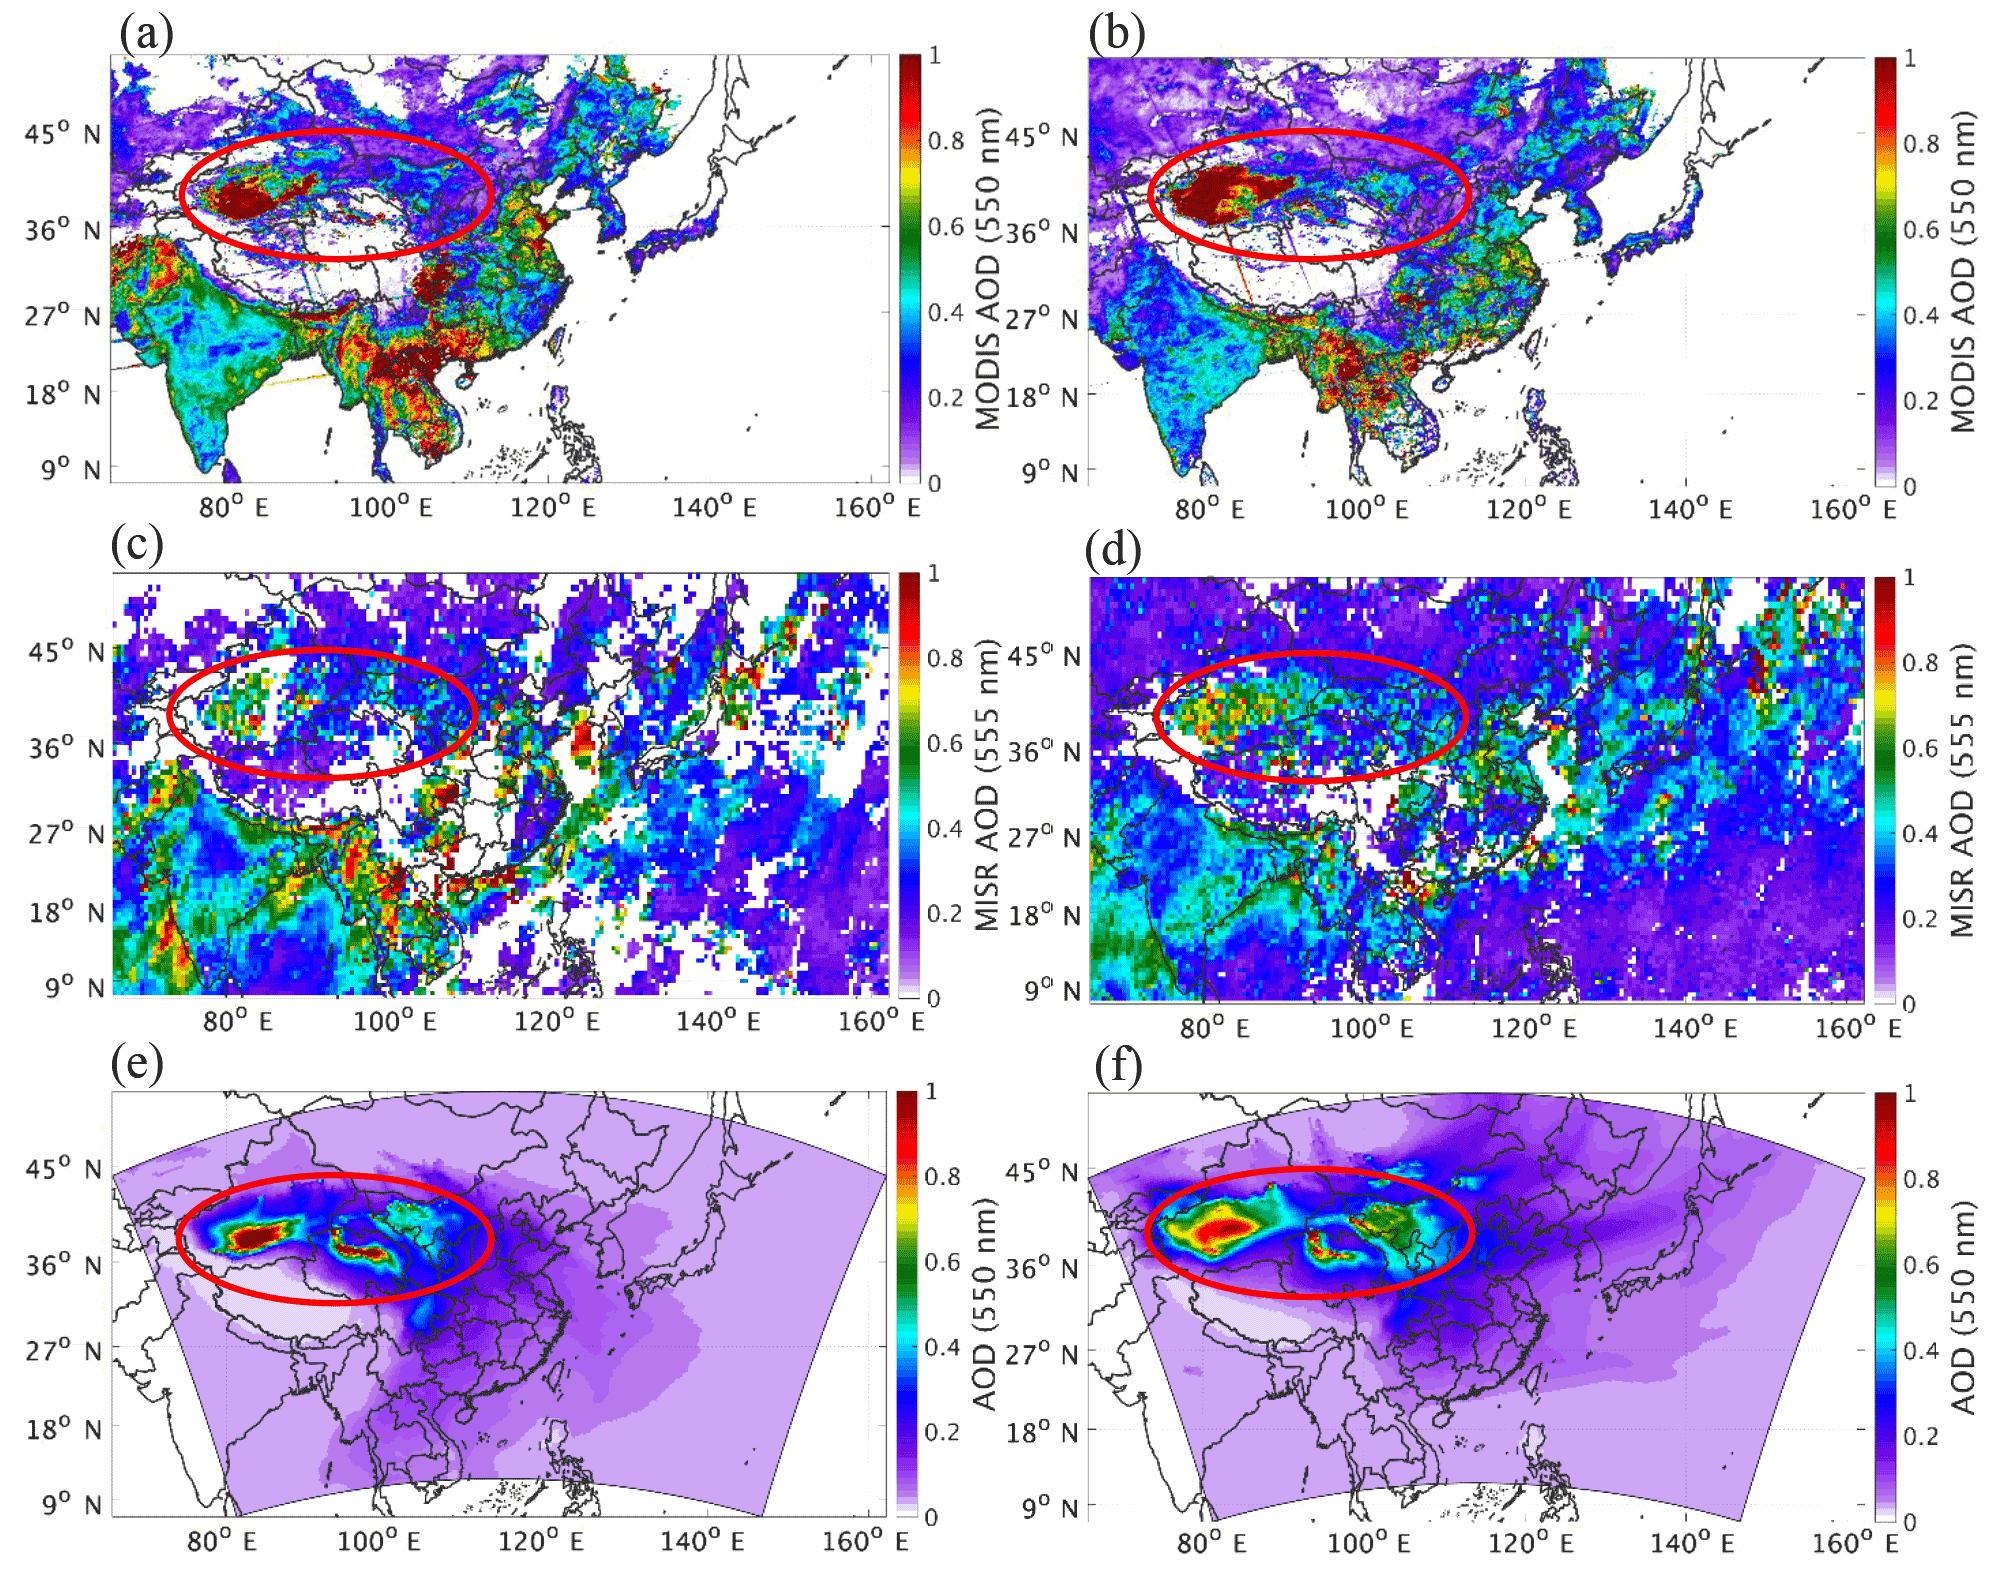
Figure 5Spatial distributions of monthly mean AOD from MODIS observations (a, b), MISR observations (c, d), and simulation results (e, f) for March (left column) and April (right column) of 2012.
6.1.3 AOD spatial distribution
The spatial distribution of monthly mean simulated AOD is also compared with observed values from MODIS and MISR products in Fig. 5. Note that the high AOD values observed in northern, eastern, and southern China and part of Southeast Asia are attributed to the abundant anthropogenic emissions, while those high values in the circle area are mostly due to dust events. The region with high AOD values in the western part of the circled area is TD, and the region with relatively lower AOD in the eastern part of the circled area is GD. The AOD observed by MODIS showed high values at the dust source region in both March and April of 2012, as shown in Fig. 5a and b. The mean observed AOD over GD was lower than that over TD in both March and April, and the mean observed AOD was higher in April than in March over both dust source areas. The spatial patterns of AOD observed by MISR are similar to MODIS, with comparable mean values over GD. However, the mean AOD values over TD observed by MISR are 36 and 40 % lower than those by MODIS in March and April, respectively (Fig. 5c and d).
The spatial patterns for the mean simulated AOD were similar to the observed values in both months but closer to those from MODIS, as shown in Fig. 5e and f. The model shows a good capability in capturing the spatial characteristics of the AOD over the dust source areas. For example, the mean observed AOD was higher in the southern part of TD than that in the northern part in March and showed an increase from March to April over GD, both of which were captured by the model. The values of the mean simulated AOD over the Gobi Desert (0.33 for March and 0.39 for April) are comparable to the observational values from both MODIS (0.30 for March and 0.32 for April) and MISR (0.31 for March and 0.34 for April), but the mean simulated AOD values over TD (0.54 for March and 0.64 for April) are between the values of the MISR observations (0.72 for March and 0.88 for April) and the MODIS observations (0.46 for March and 0.53 for April).
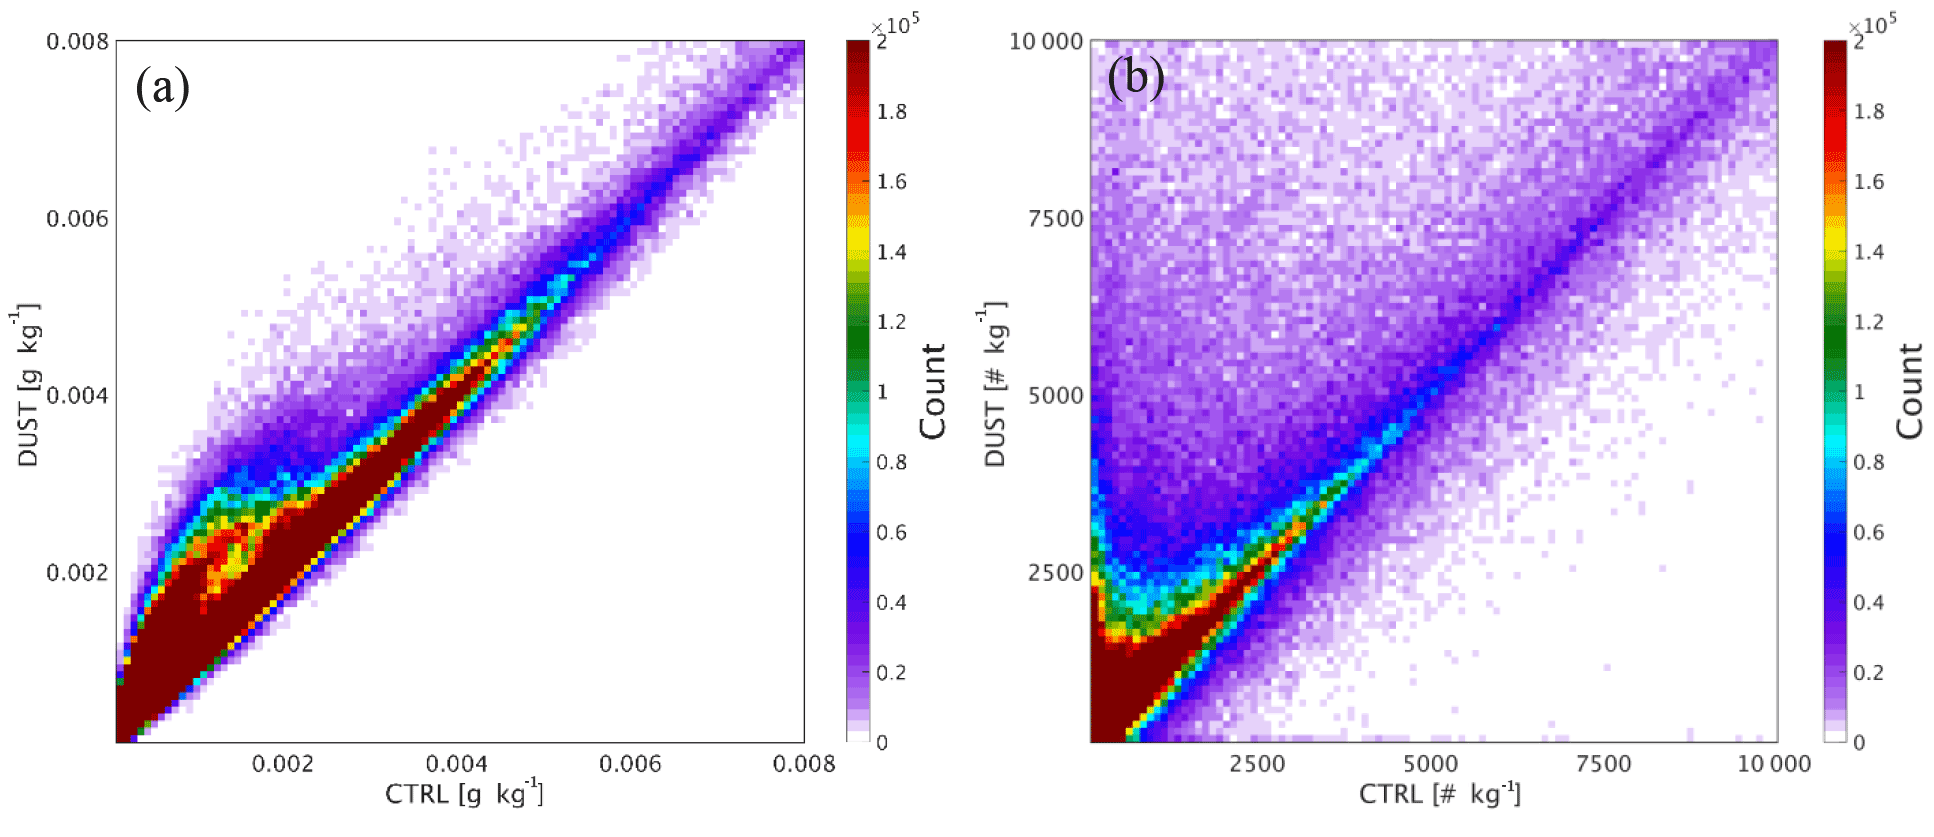
Figure 62-D histogram of simulated cloud ice mixing ratio (a) and cloud ice crystal number concentration (b) from CTRL and DUST. The color scales indicate the number of grid points in specific value bins of ice mixing ratio and ice crystal number concentration.
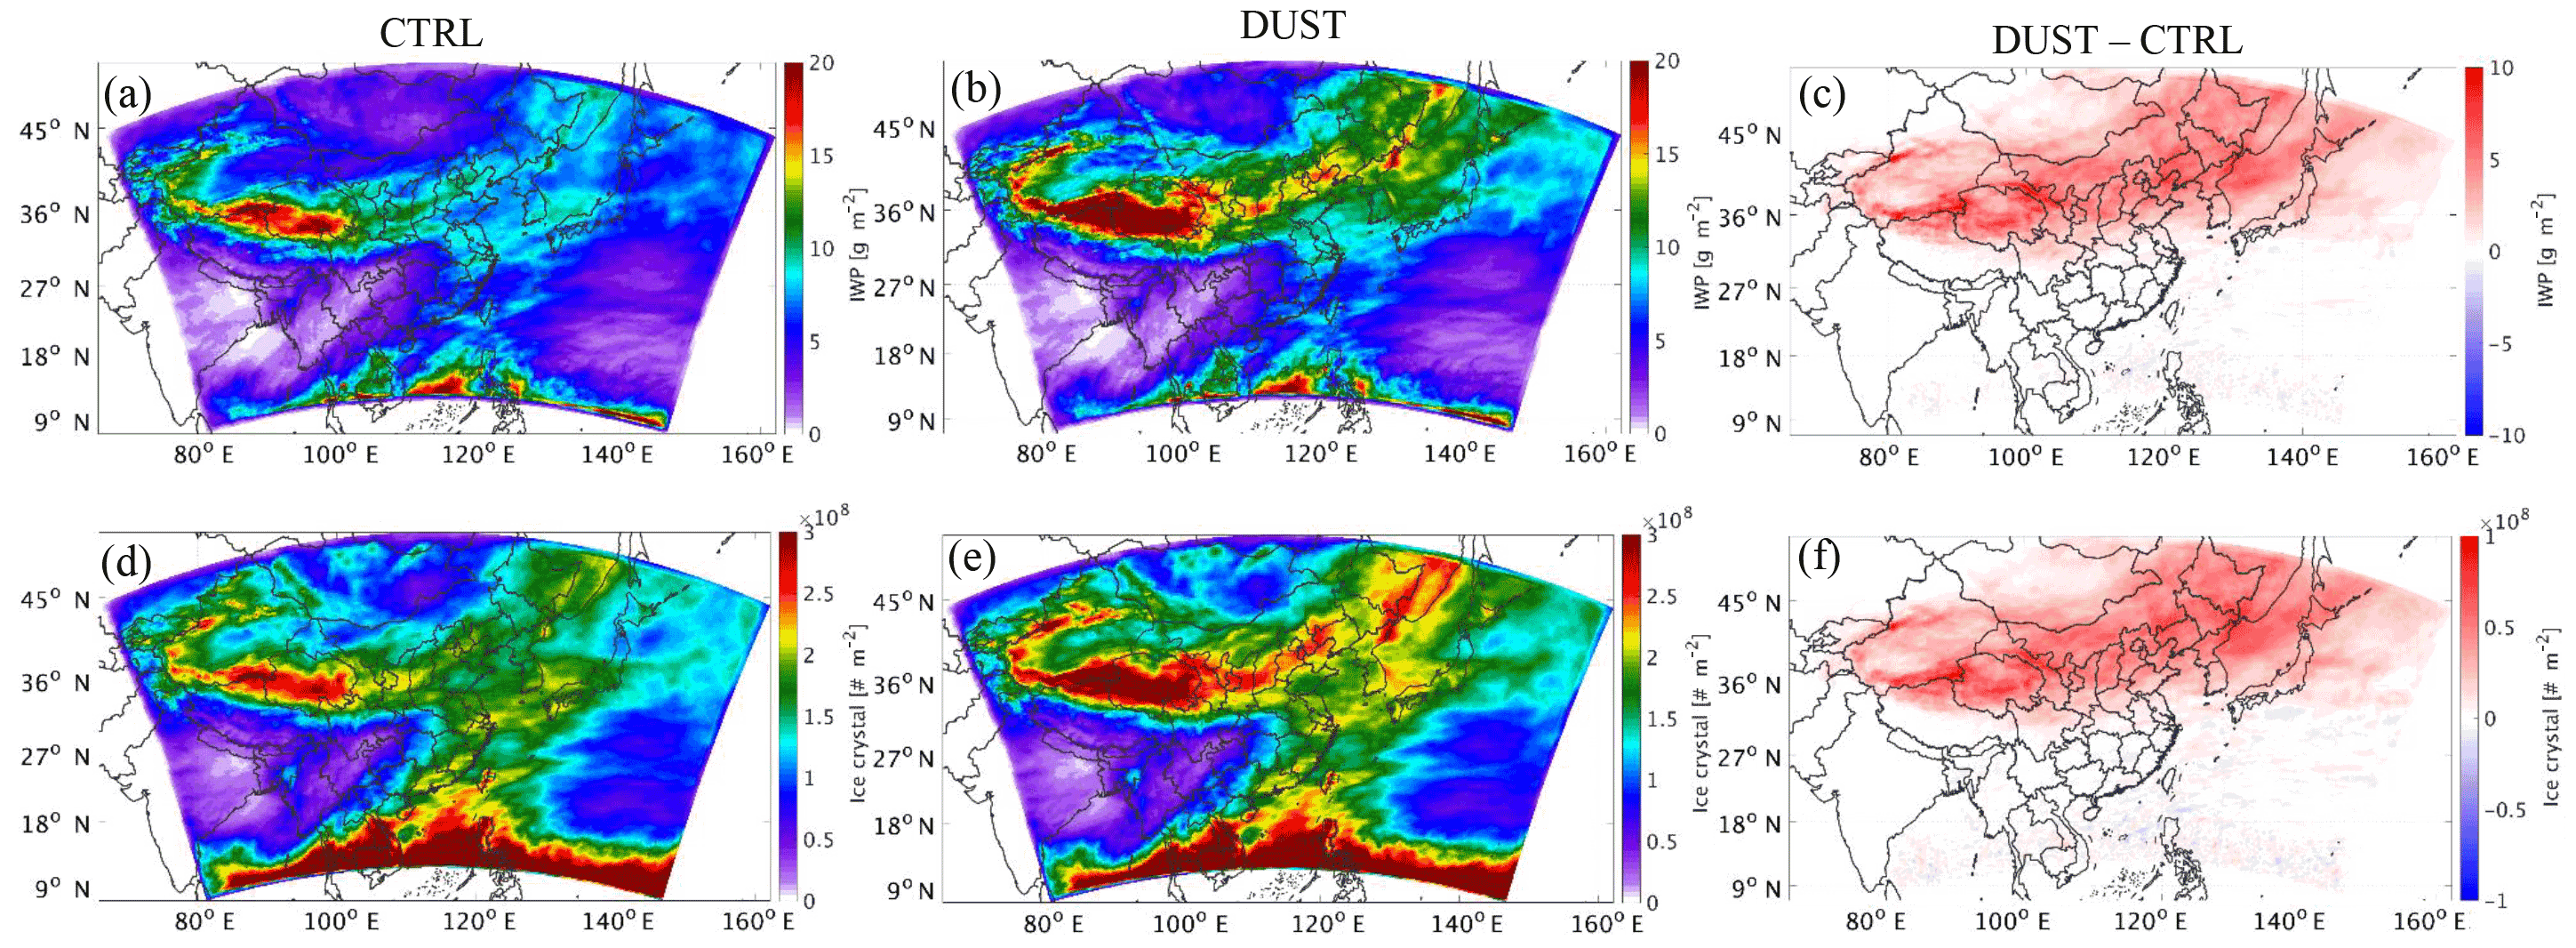
Figure 7Spatial distributions for the temporal mean simulated cloud ice water path (a–c) and ice crystal number density (d–f) from CTRL (left column), DUST (middle column), and the difference between CTRL and DUST (right column) over East Asia (domain 1) during the simulation period.
In summary, it was demonstrated that the dust emissions simulated by WRF-Chem are reliable for further analysis by the comparison between the simulation results and the observations for surface PM10 concentrations, as well as the temporal and spatial distributions of AOD values.
6.2 Cloud ice over East Asia
Dust particles are effective IN and play an important role in ice nucleation in the atmosphere under appropriate conditions. With the large number of IN created by dust particles emitted into the atmosphere, an increase in the number of ice crystals is expected in the results from DUST compared with those from CTRL, after taking into account the effects of dust particles in the GOCART–Thompson microphysics scheme. Figure 6 shows the overall comparison between the number of grid points of simulated cloud ice mixing ratio and ice crystal number concentration in corresponding value bins (at all model grids at hourly intervals) from CTRL and DUST during the entire simulation period.
As expected, the model produces a higher cloud ice mixing ratio (Fig. 6a) and ice crystal number concentration (Fig. 6b) in DUST. The simulated cloud ice mixing ratio produced in DUST is substantially higher than that produced in CTRL throughout all value bins, especially in those bins with values lower than 0.05 g kg−1. Similarly, the simulated ice crystal number concentration produced in DUST tends to be higher than that in CTRL in all value bins. The substantial increase in the simulated cloud ice mixing ratio and ice crystal number concentration indicates that the enhancement of the ice nucleation process induced by dust is successfully reproduced by the newly implemented GOCART–Thompson microphysics scheme during the simulation period.
6.2.1 Spatial distribution of ice water path (IWP)
The spatial distributions of the simulated IWP and ice crystal number density from CTRL and DUST in Fig. 7 further demonstrate the enhancement in cloud ice due to dust over East Asia. The IWP produced by CTRL was relatively high over western and eastern China, as well as at the southern boundary of the simulation domain, with values as high as 20 g m−2 (Fig. 7a). After considering the effect of dust in the ice nucleation process, the IWP produced by DUST increased substantially over dust sources and downwind areas (Fig. 7b and c), with values higher by 5–10 g m−2. The mean IWP averaged over the domain during the simulation period was 9.33 g m−2 for DUST and 7.95 g m−2 for CTRL. As shown in Fig. 7d–f, the spatial pattern for the enhancement of ice crystal number density over East Asia was similar to that for the IWP. The mean ice crystal number density averaged over the domain during the simulation period was 2.91×10⁸ m−2 for DUST and 2.76×10⁸ m−2 for CTRL.
The mean IWP and ice crystal number density were increased by 15 and 8 % over vast areas of East Asia upon considering the effect of dust in the ice nucleation process in the simulation, and such an effect can reach as far as the open ocean of the Western Pacific (Fig. 7b and e), as the outbreak of a cold high system over northeast Asia can bring quantitative dust aerosol down to the Western Pacific or even further during the dust season.
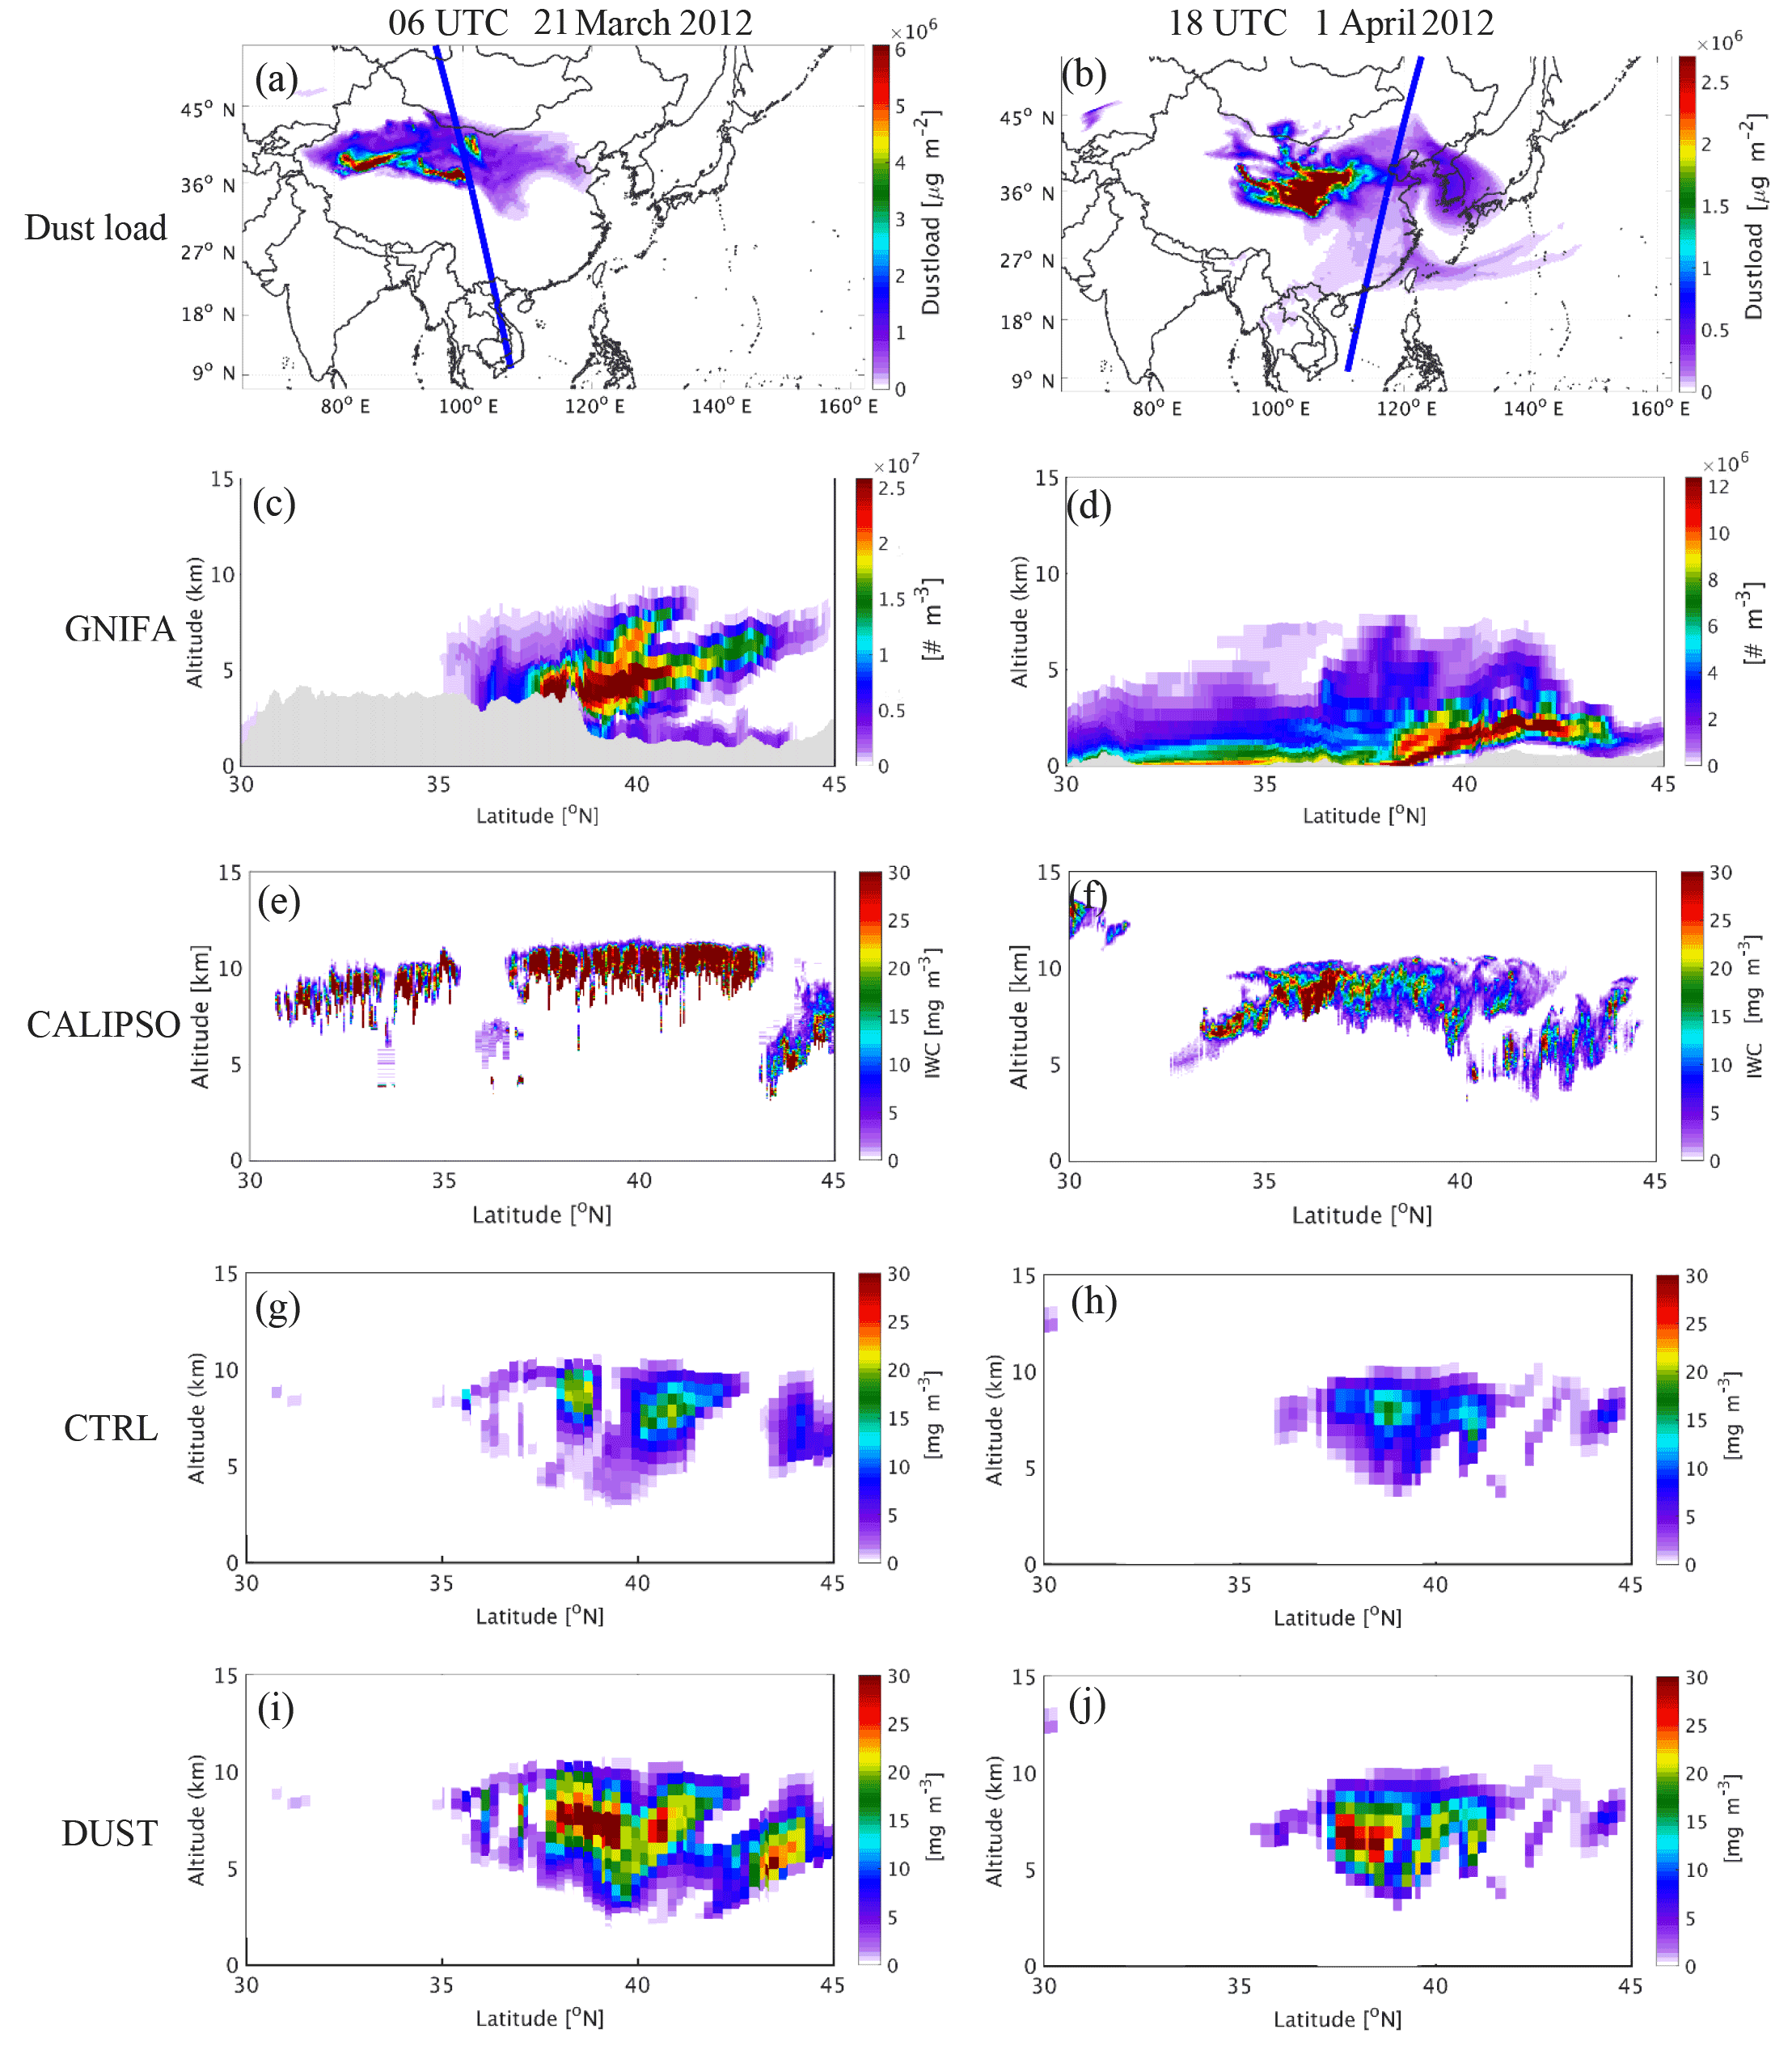
Figure 8Spatial distribution for simulated dust load and satellite scanning track (a, b); the simulated vertical profile of ice-friendly aerosol (GNIFA) number concentration (c, d), with the orography represented by the shaded area; the CALIPSO vertical profile of IWC (e, f); and the simulated vertical profile of IWC from CTRL (g, h) and DUST (i, j) for the case on 21 March (left column) and 1 April (right column) of 2012.
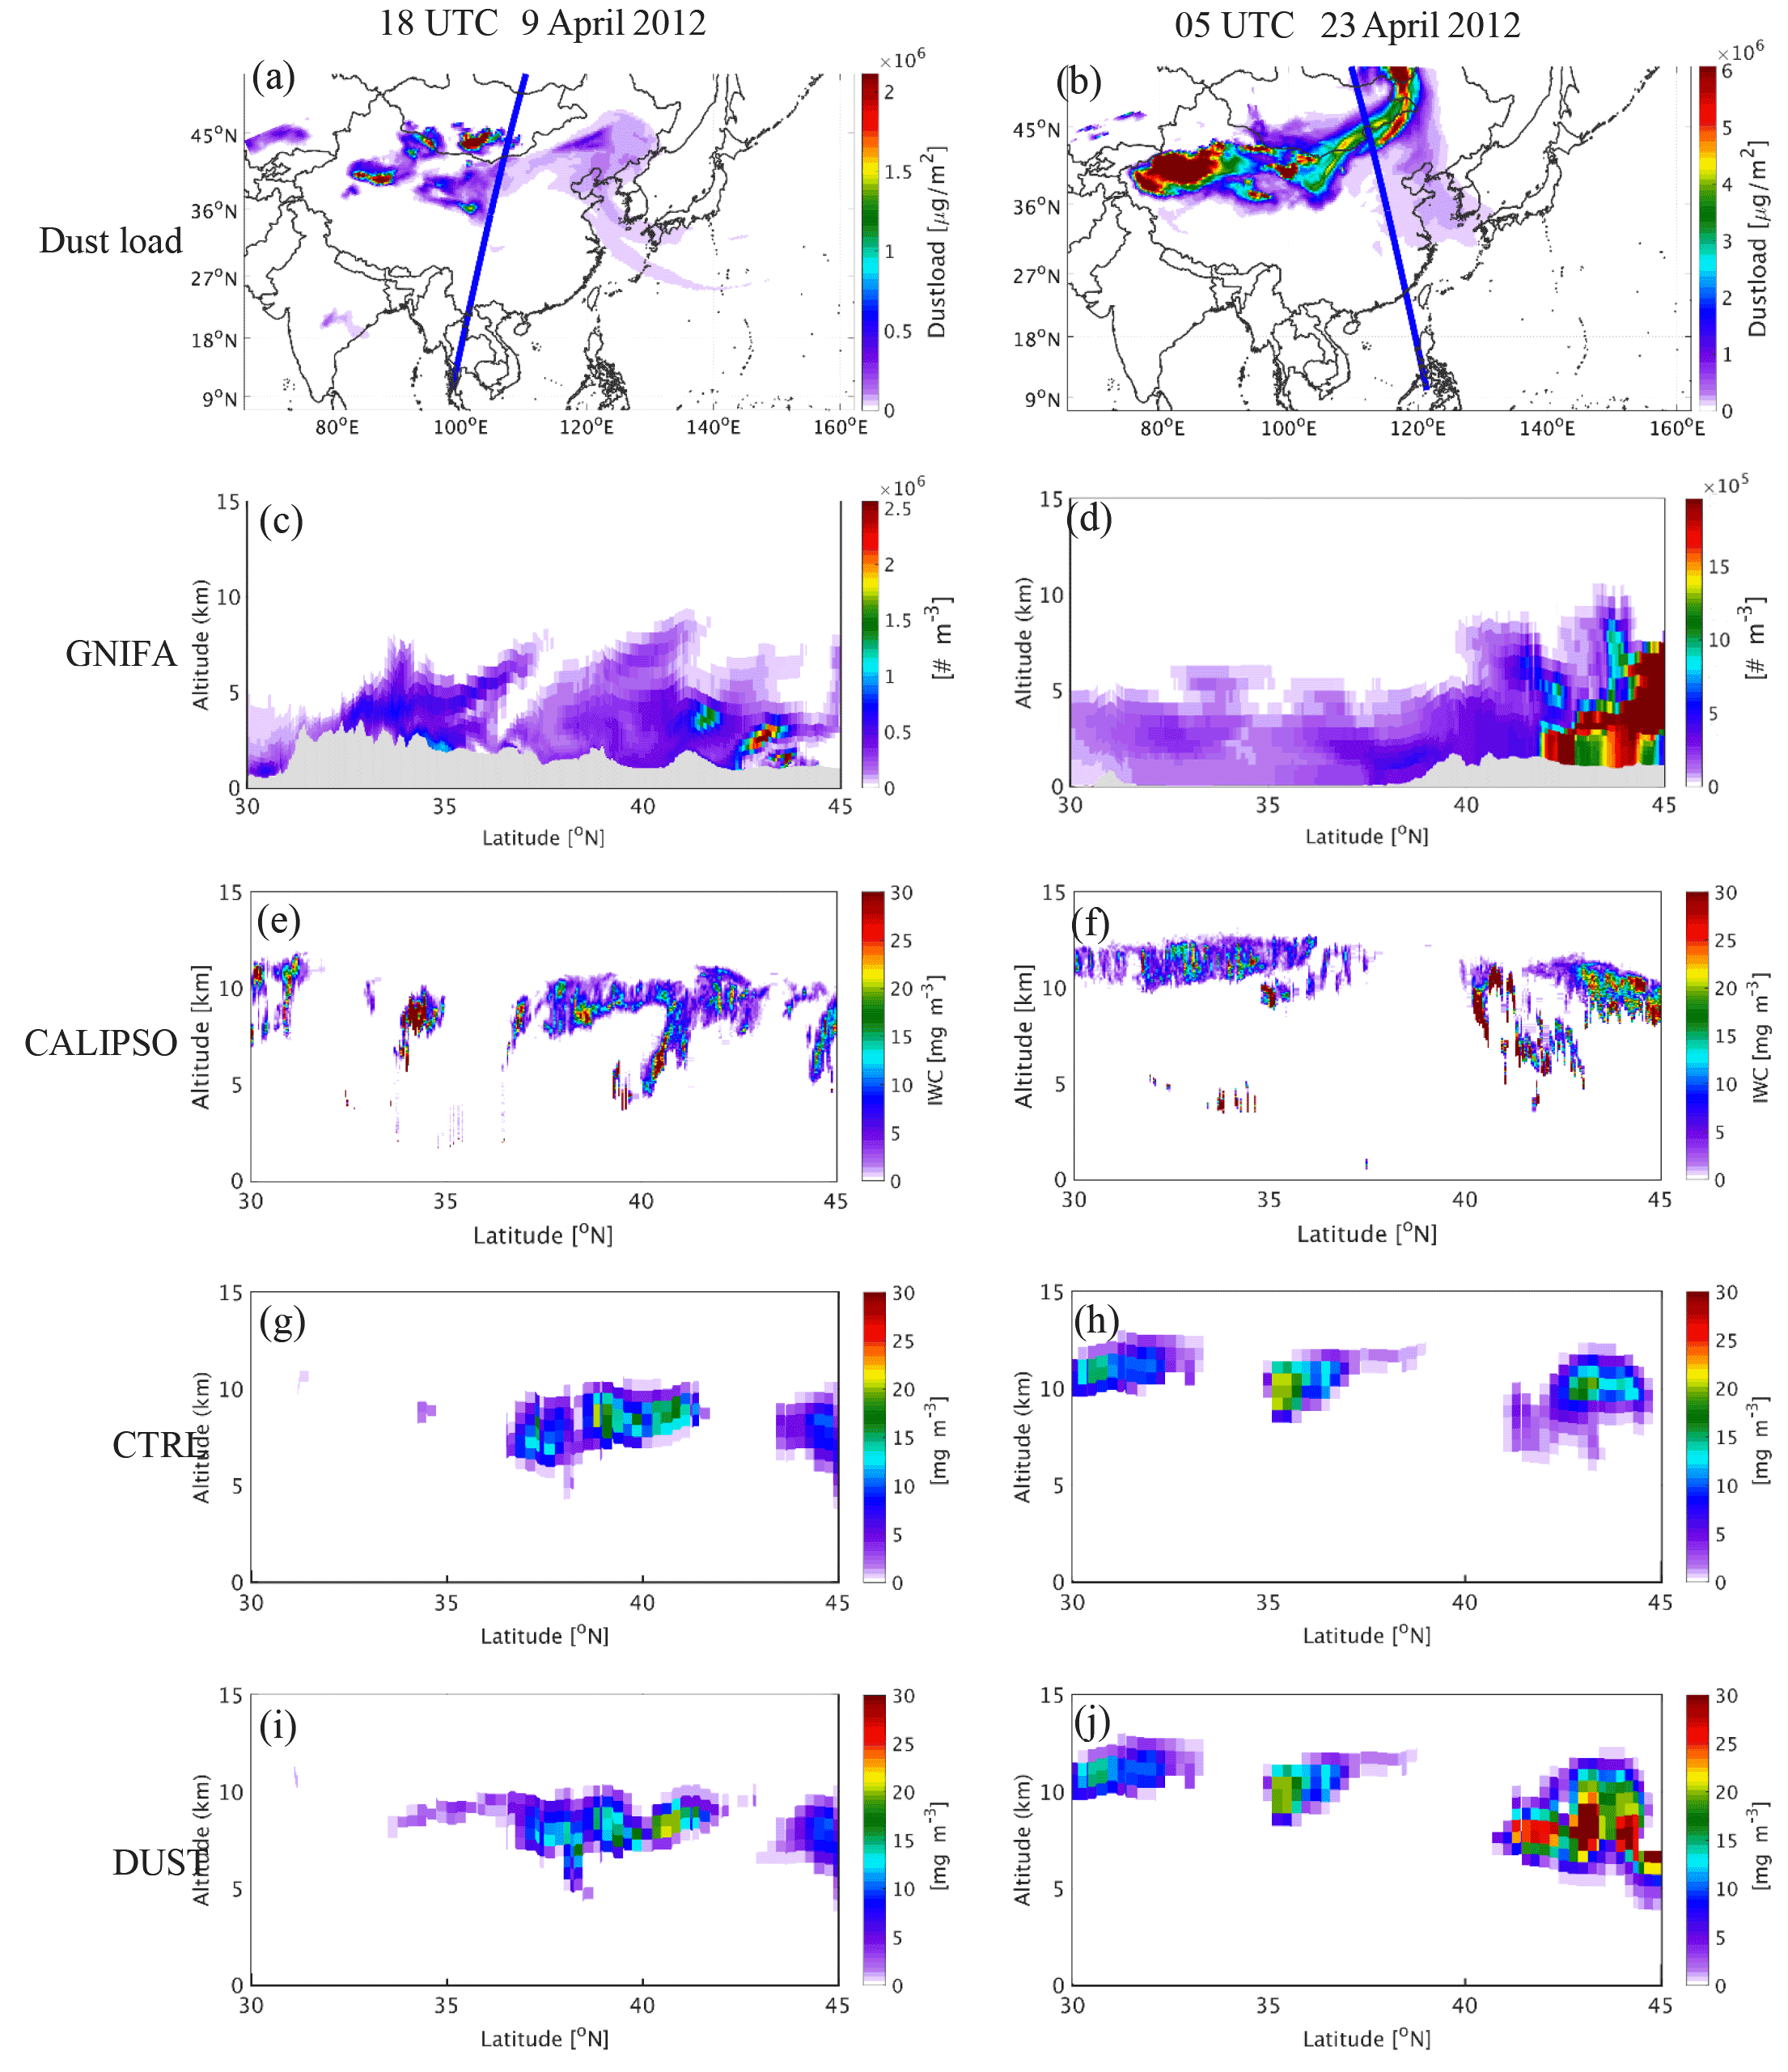
Figure 9As Fig. 8 but for the cases on 9 April (left column) and 23 April (right column) of 2012.
6.2.2 IWC during dust events
The vertical profile of the simulated IWC was also compared with the observation from CALIPSO during dust events. As mentioned in Sect. 5.1, a total of four dust events occurred during the simulation period, lasting from 18 to 25 March, 30 March to 7 April, 9 to 19 April, and 22 to 28 April 2012. As shown in Figs. 8 and 9, the performance of the model in simulating the vertical profile of IWC was evaluated by comparing the observations measured at 06:00 UTC on 21 March, 18:00 UTC on 1 April, 18:00 UTC on 9 April, and 05:00 UTC on 23 April 2012 with the simulated profiles at the same hour.
CALIPSO measures the global distribution of aerosol and cloud properties by lidar, which uses a laser to generate visible light with a wavelength of 1 µm or less to detect small particles or droplets in the atmosphere. Therefore, CALIPSO instruments are more sensitive to tenuous ice clouds and liquid clouds composed of small particles or droplets, which are invisible to instruments using signals of near-infrared or infrared wavelength to detect clouds. Moreover, the lidar signal is attenuated rapidly in optically dense clouds that the infrared or near-infrared signals can easily penetrate (Winker et al., 2010). As a result, the CALIPSO observations of IWC are mostly at the locations where the temperature is lower than −40 ∘C and the altitude is greater than 6 km poleward to 12 km equatorward, mostly without precipitating ice. Given the above considerations, the simulated IWC profiles compared with the CALIPSO observations are referred to as only cloud ice in this section.
The simulated dust load over East Asia at 06:00 UTC on 21 March 2012 is shown in Fig. 8a, in which the dust covered vast areas from western to eastern China between 35 and 45∘ N, and the orbit of the satellite passed through the area with a heavy dust load at around 100∘ E. Along the satellite orbit, the abundant dust particles were transported to as high as 10 km aloft (Fig. 8c). At this time, a high concentration of IWC was observed along the satellite orbit at an altitude of around 10 km between 30 and 45∘ N (Fig. 8e). The simulation result from CTRL (Fig. 8g) shows that the model produces some ice cloud at altitudes of 9–10 km between 35 and 45∘ N, but with much lower IWC compared to the observations. Nevertheless, considering the effect of dust on the ice nucleation process in DUST results in a much higher IWC at altitudes of 9–10 km between 35 and 45∘ N (Fig. 8i), which is much more consistent with the observations. The comparison between the simulation results from CTRL and DUST indicates that the high IWC observed by the satellite between 30 and 35∘ N might be unrelated to microphysical processes, but instead due to strong convective motions over southern China.
On 1 April 2012, central to eastern China was covered by a thick dust plume, and the orbit of the satellite passed between 25 and 43∘ N along 120∘ E at 18:00 UTC (Fig. 8b). Dust particles were distributed vertically from the surface to over 8 km along the satellite orbit (Fig. 8d). A band of high IWC was observed by the satellite at altitudes of 5 to 10 km between 33 and 44∘ N (Fig. 8f), which was highly underestimated in the results of the CTRL run without dust. In contrast, the observed band of high IWC was reproduced by the model in DUST with much more consistent magnitude (Fig. 8j).
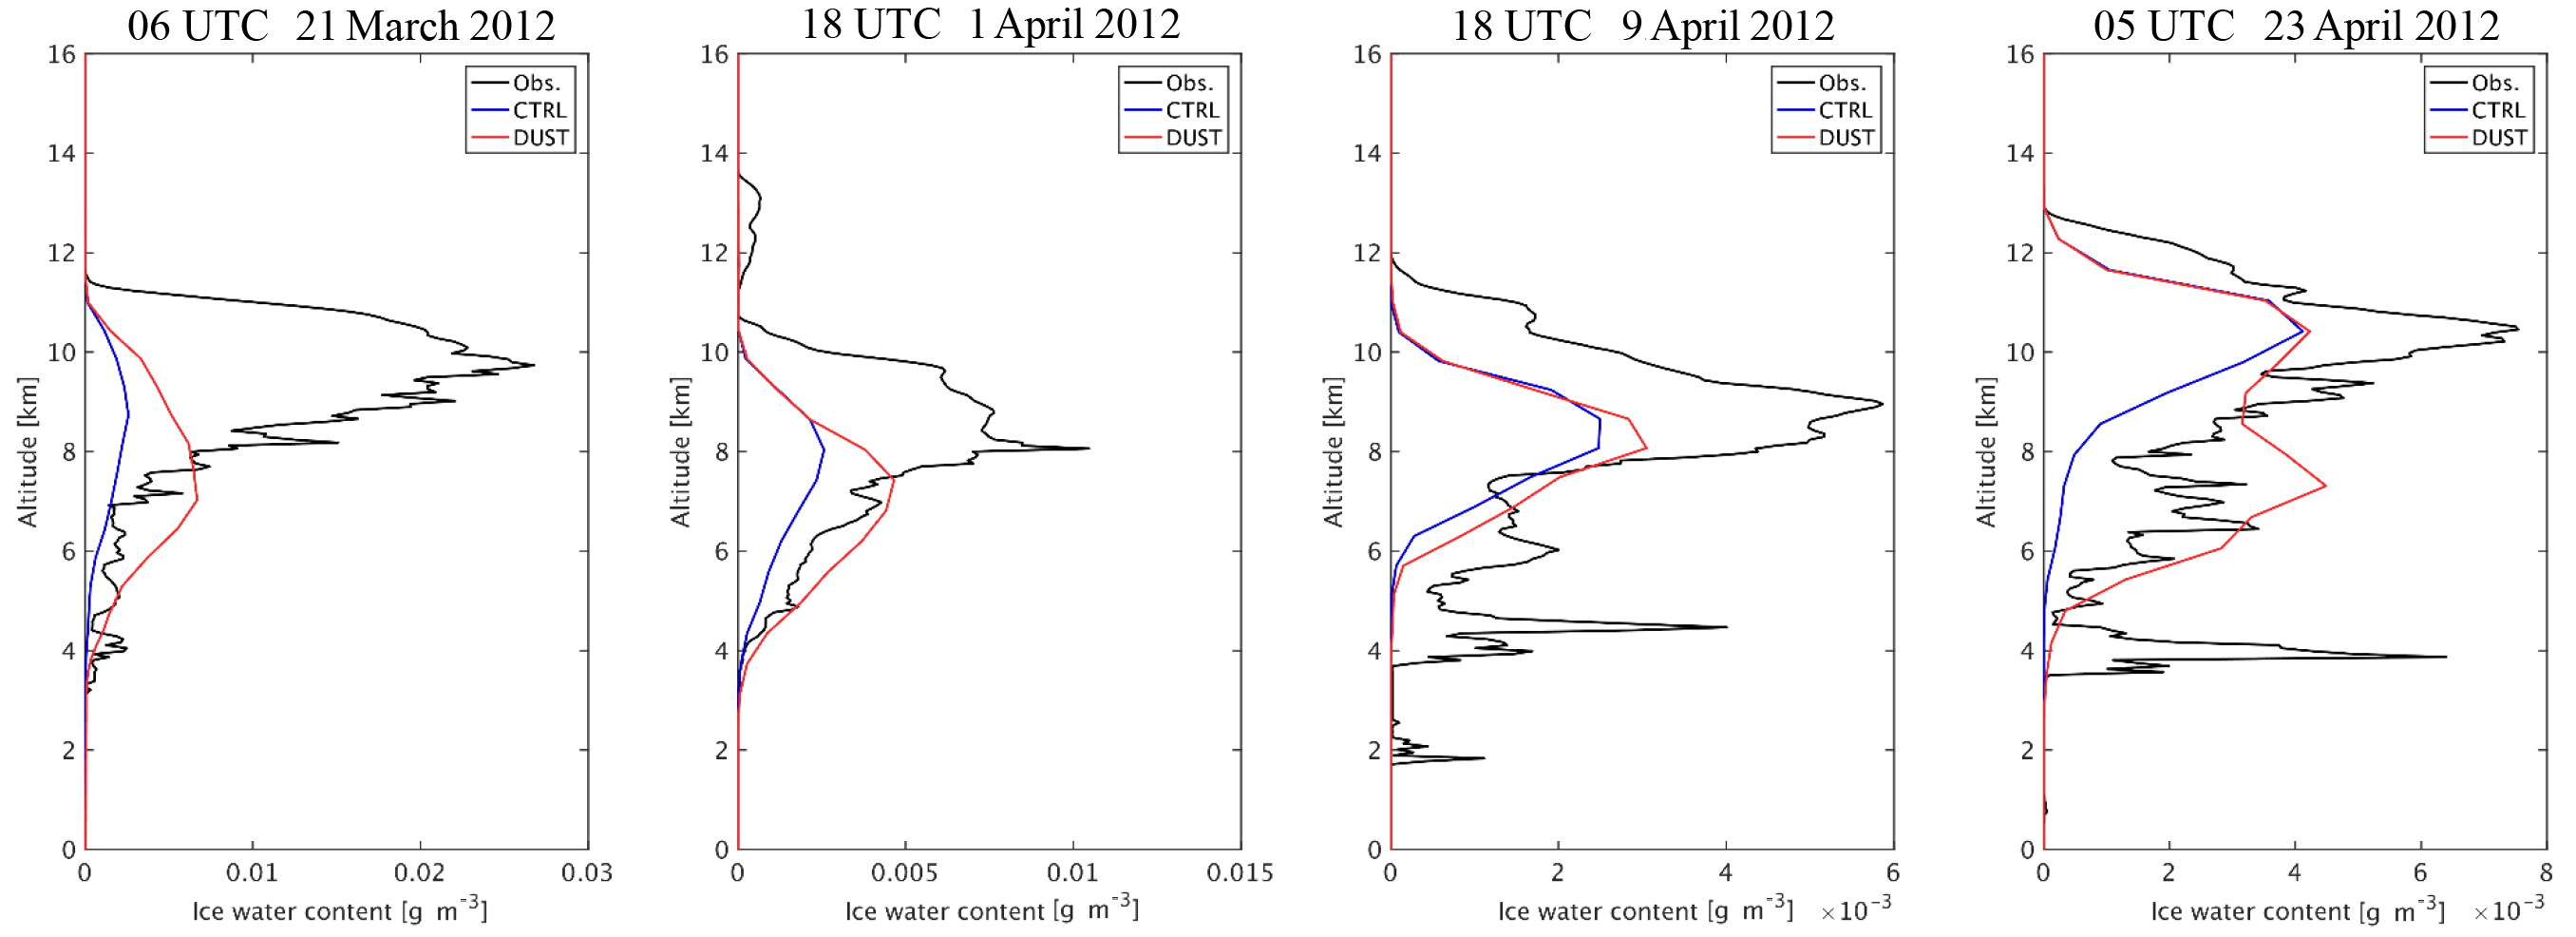
Figure 10Vertical profiles for the mean observed IWC from CALIPSO and the simulated IWC from CTRL and DUST for dust events on 21 March and 1, 9, and 23 April 2012.
At 18:00 UTC on 9 April 2012, the satellite was scanning the dust source over GD, which was covered by a thick dust plume between 35 and 45∘ N (Fig. 10a), with dust particles lifted up to 10 km above the surface (Fig. 9c). High concentration of IWC was observed by the satellite at altitude from 5 to 11 km between 30 and 45∘ N (Fig. 9e). In this case, the model reproduced the high concentration of IWC at the observed location in the results from both CTRL and DUST, although the IWC was significantly underestimated in the results from CTRL (Fig. 9g), while it was better reproduced in the results from DUST (Fig. 9j).
Similar to the previous cases, the satellite was scanning along the east coast of China at 05:00 UTC on 23 April 2012, when a dust plume was arriving from the dust sources and affecting areas between 35 and 45∘ N (Fig. 9b), and dust particles were distributed vertically from the surface to 10 km along the scanning track of the satellite (Fig. 9d). Along the orbit of the satellite, a band of high IWC areas was observed at altitudes between 5 and 12 km from 30 to 45∘ N (Fig. 9f). In the results from CTRL, the model reproduced the high IWC values at the correct locations, but with substantially lower values (Fig. 9h); however, upon taking into account the effect of dust in the GOCART–Thompson microphysics scheme, the high IWC areas were well reproduced by the model with much more consistent values (Fig. 9j).
By comparing the satellite-observed and simulated vertical profiles of IWC during the various dust events, it was demonstrated that the model reproduces the enhancement of IWC clouds in the middle to upper troposphere by taking into account the effect of dust in the ice nucleation process, which substantially improves the simulation of cloud ice.
6.2.3 Mean vertical profiles of IWC
The mean profiles of the observed IWC, as well as the simulated IWC from CTRL and DUST for the four dust events discussed in Sect. 6.2.2, are shown in Fig. 10. Note that the “mean profile” of IWC is the average over the available data points for the IWC along the orbit of the satellite between 30 to 45∘ N for each of the dust events shown in Figs. 8 and 9.
Compared with the results from CTRL, the vertical profile of the simulated IWC was substantially improved in DUST for each dust event, with the enhancement of the ice nucleation process well captured by the GOCART–Thompson microphysics scheme. However, there were still discrepancies between observations and the simulation results from DUST, and the magnitudes of the vertical IWC produced by the model were always lower than the observed values.
For the cases on 21 March and 1 April, the peaks of IWC were observed at 9.5 and 8 km, respectively, whereas the simulated peaks of IWC were located at 7 and 7.5 km, respectively, with lower peak values. The lower peak value for the case on 21 March was due to the missing high IWC observed between 30 and 45∘N in the simulation results (Fig. 8e and i), while the lower peak value for the case on 1 April was due to the underestimation of the IWC around 35∘ N (Fig. 8f and j). The locations of the peaks of simulated IWC for the cases on 9 and 23 April were more consistent with the observed peaks, but still possessed lower values due to the missing or underestimated high IWC with respect to the observations.
6.3 Sensitivity test and discussion
As discussed in Sect. 6.2.3, the simulation of cloud ice is greatly improved by considering the enhancement of the ice nucleation process induced by dust, which is well captured by the GOCART–Thompson microphysics scheme. However, the IWC is still underestimated by the model during dust events. To determine the reason for this limitation, numerical experiments were performed to investigate the sensitivity of simulated IWC to the parameters of the ice nucleation parameterization in the GOCART–Thompson microphysics scheme.
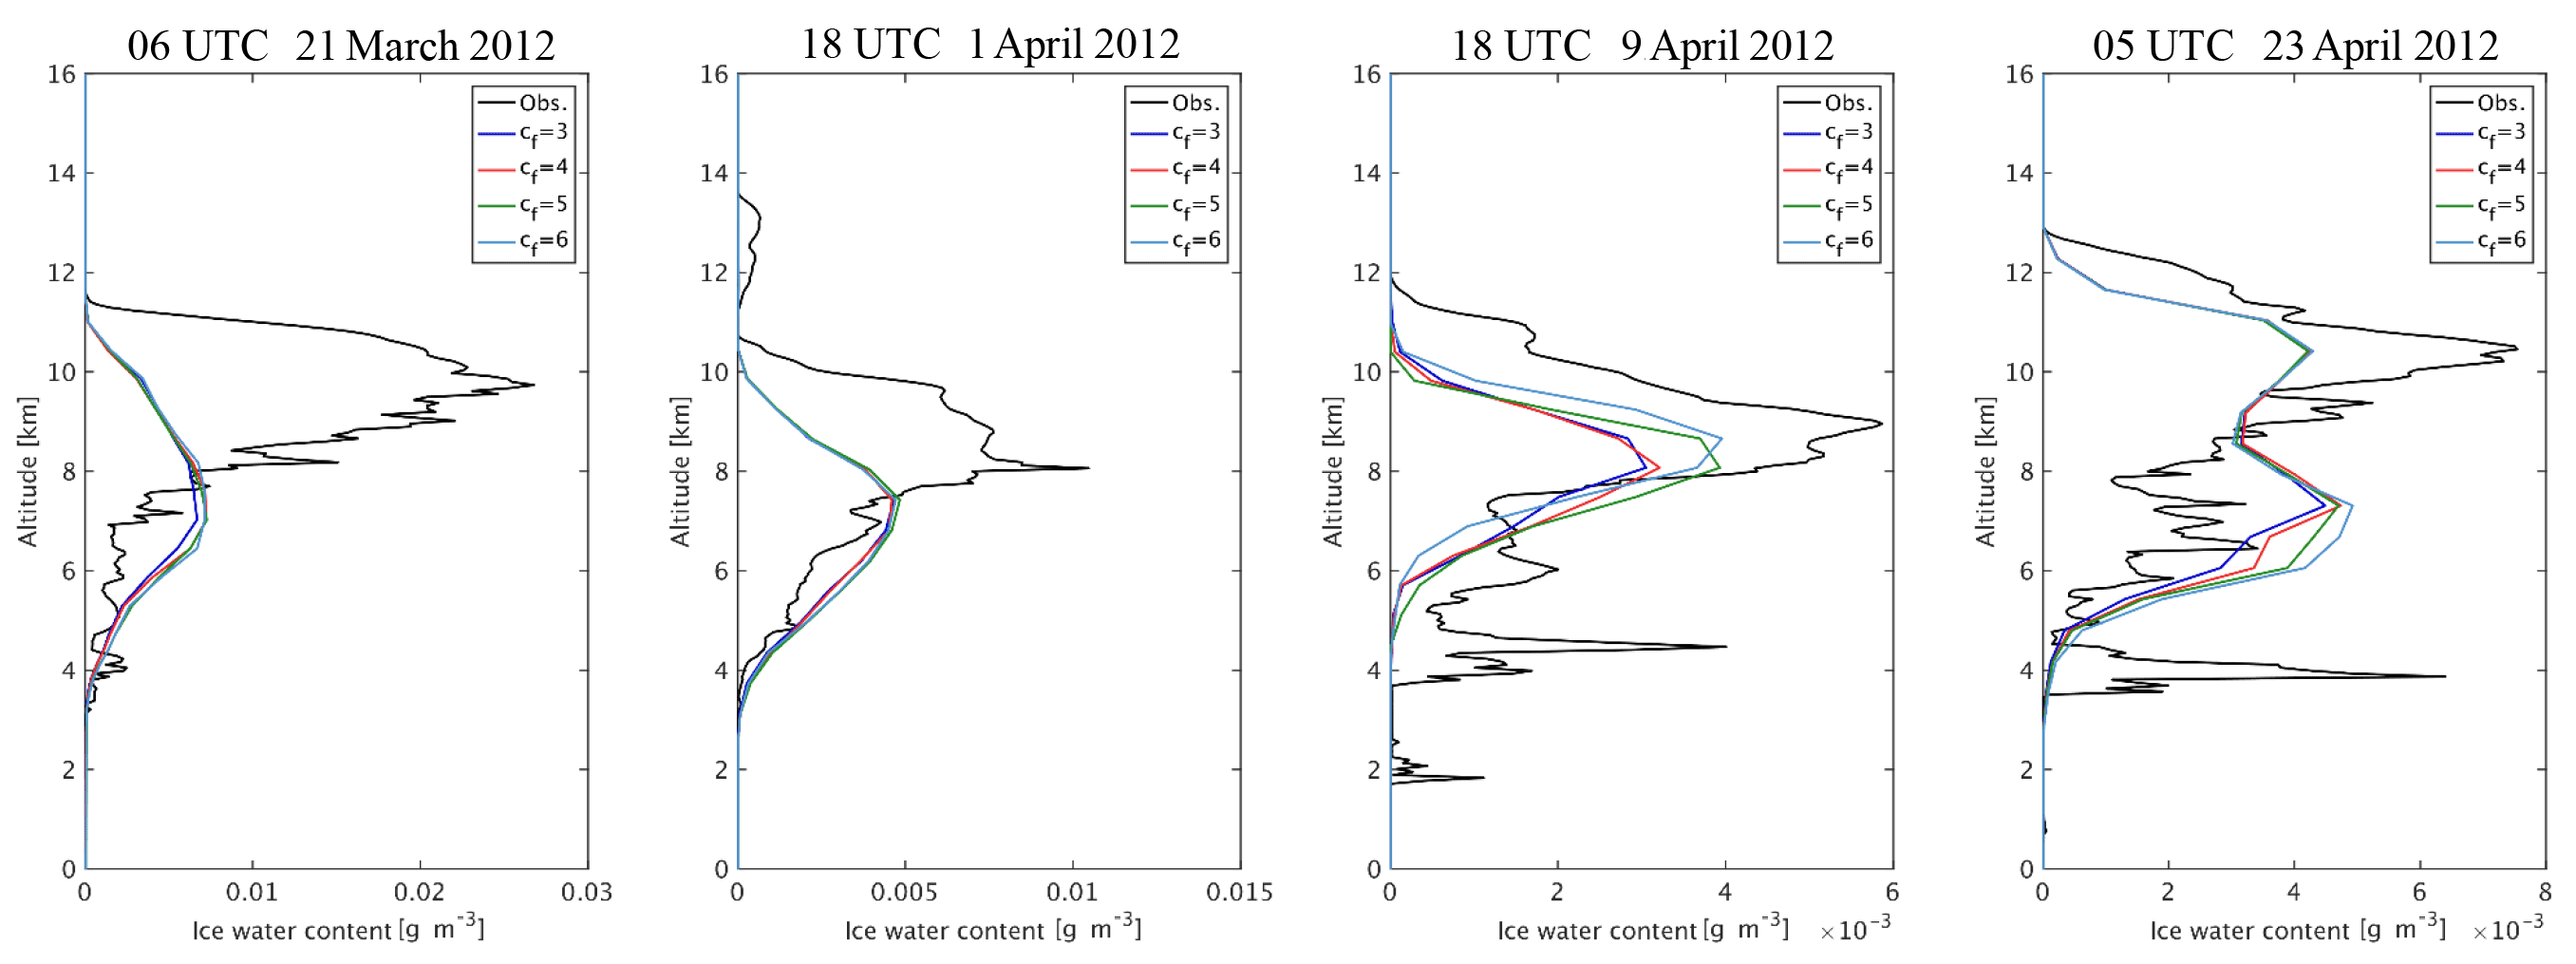
Figure 11Vertical profiles for the mean observed IWC from CALIPSO and the simulated IWC with various cf for the dust events on 21 March and 1, 9, and 23 April 2012.
6.3.1 Calibration factor cf
The calibration factor cf is an empirical tuning coefficient derived from observational data from field and laboratory experiments. It ranges from 1 to 6 and is recommended to be 3 (DeMott et al., 2015), which was applied in the previous simulations. Three other experiments were conducted to investigate the sensitivity of the simulated IWC to cf values ranging from 3 to 6.
The mean profiles of IWC from simulation results were compared with the CALIPSO observations for the dust events discussed in Sect. 6.2.2 and 6.2.3, as shown in Fig. 11. For the cases on 21 March and 1 April, changing cf did not result in an increase in IWC; instead, the simulated IWC remained consistent for cf values varying from 3 to 6.
For the case on 9 April, the simulated IWC increased between 6 and 9 km and was higher and closer to the observed profile when cf was equal to 5 and 6 compared to the case in which cf was set to 3 and 4.
For the case on 23 April, two peaks were observed in the profiles of simulated IWC located at 7 and 10 km. By increasing cf values from 3 to 6, the simulated IWC remained unchanged for the peak at 10 km, but gradually increased for the peak at 7 km. The peak of the simulated IWC at 7 km should correspond to the observed peak between 6 and 8 km, which was slightly overestimated by the model.
In summary, increasing the calibration factor cf from 3 to 6 does not necessarily lead to a significant variation in the simulated IWC during dust events, and the model achieves a relatively better performance in reproducing the profile of IWC when the cf is set to 5.
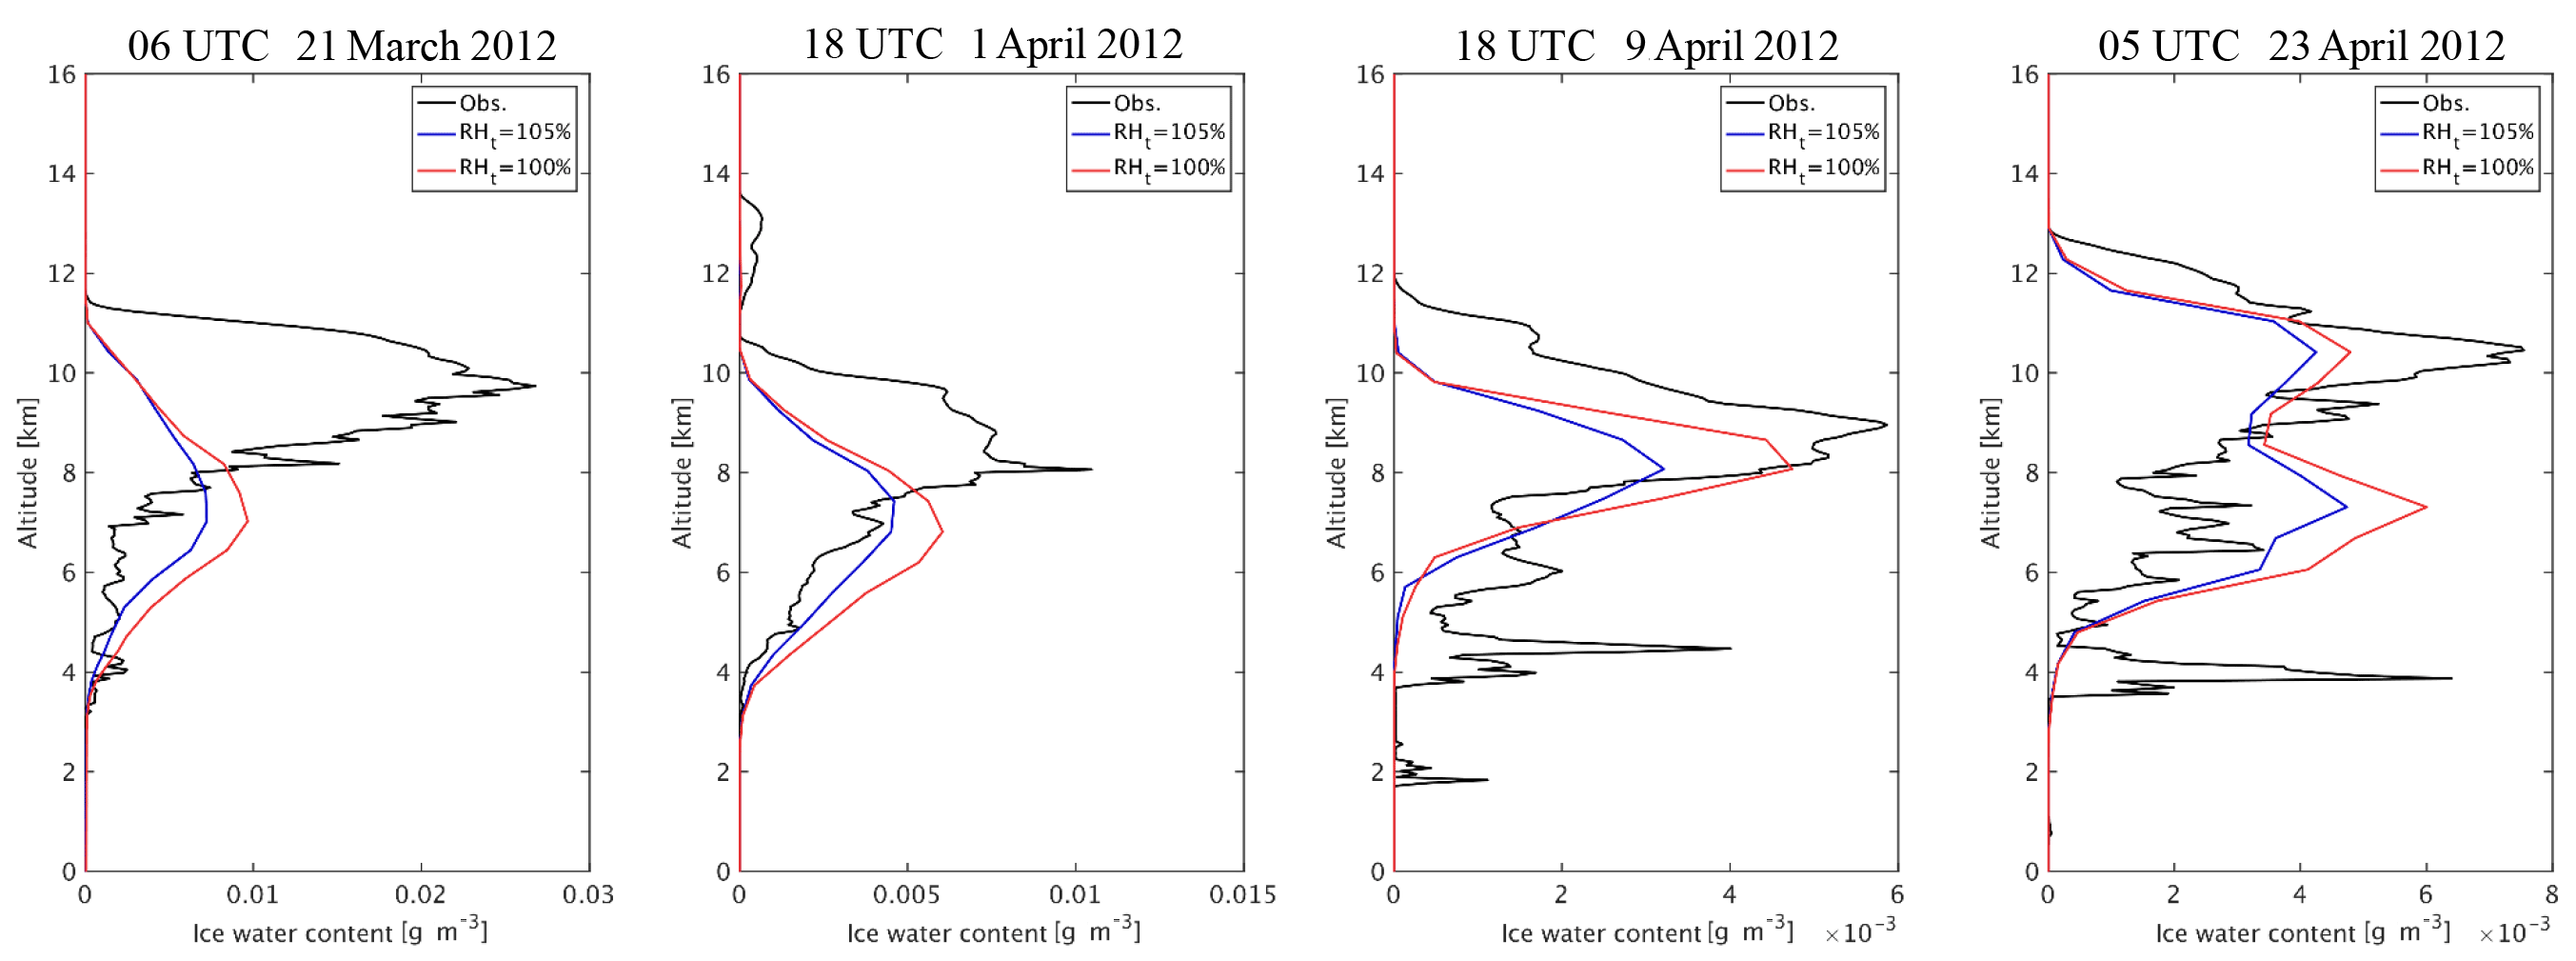
Figure 12Vertical profiles for the mean observational IWC from CALIPSO and the simulated IWC with threshold RH values of 105 and 100 % for the dust events on 21 March and 1, 9, and 23 April 2012.
As ice nucleation occurs only in a supersaturated atmosphere with respect to water vapor, the ice nucleation process would be terminated in the GOCART–Thompson microphysics scheme when the environmental RHi is lower than the threshold RHi, which was set to 105 % for the simulations in this study. The consistency in the simulated IWC with increasing cf for the cases in Fig. 11 indicates that in these cases, the environmental RHi had already reached below 105 % when cf was set to 3, meaning that the water vapor available for freezing into ice crystals has been consumed with cf equal to 3. Therefore, increasing cf could not lead to a further increase in simulated IWC. Given the above, lowering the threshold RHi might result in an enhancement of the ice nucleation process as well as the simulated IWC, which will be discussed in the following section.
6.3.2 Threshold of relative humidity
In this study, the threshold relative humidity to trigger the ice nucleation process in the simulation was originally set to 105 %, which was selected for the central lamina condition in the laboratory experiments to derive the DeMott2015 ice nucleation scheme (DeMott et al., 2015). However, as reported in other studies, the number of ice-nucleating particles starts to rise when the relative humidity exceeds 100 % (DeMott et al., 2011). Therefore, a sensitivity experiment was carried out to investigate the response of simulated IWC to a lower threshold relative humidity.
The mean profiles of IWC from the simulation results were compared with the CALIPSO observations for the aforementioned dust events, as shown in Fig. 12. With the threshold relative humidity lowered to 100 %, the simulated IWC showed an increase throughout the vertical profile with the most significant increase at the peaks, suggesting more consistency with the observations for all of the dust events, except the one on 1 April. In the case on 1 April, the simulated IWC increased at lower altitudes than the observed peak, but slightly decreased right at the peak with lowering the threshold relative humidity to 100 %. Overall, the simulation of IWC during dust events was significantly improved by lowering the threshold relative humidity from 105 to 100 %.
A new treatment, the GOCART–Thompson scheme, was implemented into WRF-Chem to couple the GOCART aerosol model to the aerosol-aware Thompson–Eidhammer microphysics scheme. By applying this newly implemented microphysics scheme, the effect of dust on the ice nucleation process by serving as IN in the atmosphere can be quantified and evaluated. Numerical experiments, including a control run without dust and a test run with dust, were then carried out to evaluate the performance of the newly implemented GOCART–Thompson microphysics scheme in simulating the effect of dust on the content of cloud ice over East Asia during a typical dust-intensive period by comparing the simulation results with various observations.
Based on the GOCART aerosol model the model reproduced dust emissions reasonably well by capturing the evolution and magnitude of the surface PM10 concentration at the locations of various environmental monitoring stations and the AOD at two AERONET sites. The spatial patterns of the mean AOD over East Asia during the simulation period were also consistent with satellite observations.
The effect of dust on the ice nucleation process was then quantified and evaluated in the GOCART–Thompson microphysics scheme. Upon considering the effect of dust in the simulation, the simulated ice water mixing ratio and ice crystal number concentration over East Asia were 15 and 7 % higher than those simulated without dust, with the most significant enhancements located over dust source regions and downwind areas.
Comparison between the vertical profiles of the satellite-observed and simulated IWC during various dust events indicated that the enhancement of cloud ice induced by abundant dust particles serving as IN is well captured by the GOCART–Thompson microphysics scheme, with the results from the simulation with dust much more consistent with the satellite observations, although the IWC is generally underestimated by the model.
Sensitivity experiments revealed that the simulated IWC was not very sensitive to the calibration factor defined in the DeMott2015 ice nucleation scheme, but the model delivered a slightly better performance in reproducing the IWC when the calibration factor was set to 5. However, the simulated IWC was sensitive to the threshold relative humidity to trigger the ice nucleation process in the model and was improved by lowering the threshold relative humidity from 105 to 100 %.
The WRF-Chem outputs and surface PM10 observations are available from the authors upon request (lsu@connect.ust.hk). The MODIS level 2 data can be downloaded freely from the NASA LAADS website (https://ladsweb.modaps.eosdis.nasa.gov/search/order/2/MOD06_L2–61, last access: 18 June 2018). The MISR level 3 data can be obtained from the NASA Atmospheric Science Data Center (https://eosweb.larc.nasa.gov/project/misr/misr_table, last access: 18 June 2018). The AERONET data can be obtained from the AERONET program website (https://aeronet.gsfc.nasa.gov/, last access: 18 June 2018).
The authors declare that they have no conflict of interest.
We would like to acknowledge the provision of the MODIS and
the MISR observations by the Ministry of Environmental Protection Data
Center, U.S. National Center for Atmospheric Research (NCAR) and the
CALIPSO data by the U.S. National Aeronautics and Space Administration
(NASA) Data Center. We thank the principal investigators and their staff for
establishing and maintaining the two AERONET sites used in this study. We appreciate the assistance of the Hong
Kong Observatory (HKO), which provided the meteorological data. Lin Su would
like to thank Georg Grell, Stuart McKeen, and Ravan Ahmandov
from the Earth System Research Laboratory, U.S. National Oceanic and
Atmospheric Administration for insightful discussions. Other data used this
paper are properly cited and referred to in the reference list. All data
shown in the results are available upon request. This work was supported by
NSFC/RGC grant no. HKUST631/05,
NSFC-FD grant U1033001, and RGC grant 16303416.
Edited by: Corinna Hoose
Reviewed by: Gregory Thompson and two anonymous referees
Atkinson, J. D., Murray, B. J., Woodhouse, M. T., Whale, T. F., Baustian, K. J., Carslaw, K. S., Dobbie, S., O'Sullivan, D., and Malkin, T. L.: The importance of feldspar for ice nucleation by mineral dust in mixed-phase clouds, Nature, 498, 355–398, 2013.
Baró, R., Jiménez-Guerrero, P., Balzarini, A., Curci, G., Forkel, R., Grell, G., Hirtl, M., Honzak, L., Langer, M., and Pérez, J. L.: Sensitivity analysis of the microphysics scheme in WRF-Chem contributions to AQMEII phase 2, Atmos. Environ., 115, 620–629, 2015.
Bi, J., Huang, J., Fu, Q., Ge, J., Shi, J., Zhou, T., and Zhang, W.: Field measurement of clear-sky solar irradiance in Badain Jaran Desert of Northwestern China, J. Quant. Spectrosc. Ra., 122, 194–207, 2013.
Chapman, E. G., Gustafson Jr., W. I., Easter, R. C., Barnard, J. C., Ghan, S. J., Pekour, M. S., and Fast, J. D.: Coupling aerosol-cloud-radiative processes in the WRF-Chem model: Investigating the radiative impact of elevated point sources, Atmos. Chem. Phys., 9, 945–964, https://doi.org/10.5194/acp-9-945-2009, 2009.
Chen, S., Huang, J., Kang, L., Wang, H., Ma, X., He, Y., Yuan, T., Yang, B., Huang, Z., and Zhang, G.: Emission, transport, and radiative effects of mineral dust from the Taklimakan and Gobi deserts: comparison of measurements and model results, Atmos. Chem. Phys., 17, 2401–2421, https://doi.org/10.5194/acp-17-2401-2017, 2017.
Chin, M., Rood, R. B., Lin, S.-J., Müller, J.-F., and Thompson, A. M.: Atmospheric sulfur cycle simulated in the global model GOCART: Model description and global properties, J. Geophys. Res.-Atmos, 105, 24671–24687,2000.
DeMott, P. J., Sassen, K., Poellot, M. R., Baumgardner, D., Rogers, D. C., Brooks, S. D., Prenni, A. J., and Kreidenweis, S. M.: African dust aerosols as atmospheric ice nuclei, Geophys. Res. Lett., 30, https://doi.org/10.1029/2003GL017410, 2003.
DeMott, P. J., Prenni, A. J., Liu, X., Kreidenweis, S. M., Petters, M. D., Twohy, C. H., Richardson, M., Eidhammer, T., and Rogers, D.: Predicting global atmospheric ice nuclei distributions and their impacts on climate, P. Natl. Acad. Sci. USA, 107, 11217–11222, 2010.
DeMott, P. J., Möhler, O., Stetzer, O., Vali, G., Levin, Z., Petters, M. D., Murakami, M., Leisner, T., Bundke, U., and Klein, H.: Resurgence in ice nuclei measurement research, B. Am. Meteorol. Soc., 92, 1623–1635, 2011.
DeMott, P. J., Prenni, A. J., McMeeking, G. R., Sullivan, R. C., Petters, M. D., Tobo, Y., Niemand, M., Möhler, O., Snider, J. R., Wang, Z., and Kreidenweis, S. M.: Integrating laboratory and field data to quantify the immersion freezing ice nucleation activity of mineral dust particles, Atmos. Chem. Phys., 15, 393–409, https://doi.org/10.5194/acp-15-393-2015, 2015.
Diner, D. J., Barge, L. M., Bruegge, C. J., Chrien, T. G., Conel, J. E., Eastwood, M. L., Garcia, J. D., Hernandez, M. A., Kurzweil, C. G., and Ledeboer, W. C.: The Airborne Multi-angle Imaging SpectroRadiometer (AirMISR): instrument description and first results, IEEE T. Geosci. Remote, 36, 1339–1349, 1998.
Duce, R., Liss, P., Merrill, J., Atlas, E., Buat-Menard, P., Hicks, B., Miller, J., Prospero, J., Arimoto, R., and Church, T.: The atmospheric input of trace species to the world ocean, Global Biogeochem. Cy., 5, 193–259, 1991.
Ge, J., Su, J., Ackerman, T., Fu, Q., Huang, J., and Shi, J.: Dust aerosol optical properties retrieval and radiative forcing over northwestern China during the 2008 China-US joint field experiment, J. Geophys. Res.-Atmos., 115, https://doi.org/10.1029/2009JD013263, 2010.
Ginoux, P., Chin, M., Tegen, I., Prospero, J. M., Holben, B., Dubovik, O., and Lin, S. J.: Sources and distributions of dust aerosols simulated with the GOCART model, J. Geophys. Res.-Atmos., 106, 20255–20273, 2001.
Ginoux, P., Prospero, J. M., Torres, O., and Chin, M.: Long-term simulation of global dust distribution with the GOCART model: correlation with North Atlantic Oscillation, Environ. Modell. Softw., 19, 113–128, 2004.
Grell, G., Peckham, S., Fast, J., Singh, B., Easter, R., Gustafson, W., Rasch, P., Wolters, S., Barth, M., and Pfister, G.: WRF-Chem V3. 5: A summary of status and updates, EGU General Assembly Conference Abstracts, EGU General Assembly 2013, 7–12 April 2013, Vienna, Austria, EGU2013-11332, 11332, 2013.
Grell, G. A. and Freitas, S. R.: A scale and aerosol aware stochastic convective parameterization for weather and air quality modeling, Atmos. Chem. Phys., 14, 5233–5250, https://doi.org/10.5194/acp-14-5233-2014, 2014.
Hansen, J., Sato, M., and Ruedy, R.: Radiative forcing and climate response, J. Geophys. Res.-Atmos., 102, 6831–6864, 1997.
Hartmann, D., Tank, A., and Rusticucci, M.: IPCC fifth assessment report, climate change 2013: The physical science basis, IPCC AR5, 31–39, 2013.
Holben, B., Tanre, D., Smirnov, A., Eck, T., Slutsker, I., Abuhassan, N., Newcomb, W., Schafer, J., Chatenet, B., and Lavenu, F.: An emerging ground-based aerosol climatology: Aerosol optical depth from AERONET, J. Geophys. Res.-Atmos., 106, 12067–12097, 2001.
Hoose, C., Lohmann, U., Erdin, R., and Tegen, I.: The global influence of dust mineralogical composition on heterogeneous ice nucleation in mixed-phase clouds, Environ. Res. Lett., 3, 025003, https://doi.org/10.1088/1748-9326/3/2/025003, 2008.
Horvath, H.: Influence of atmospheric aerosols upon the global radiation balance, Atmospheric Particles, 5, 62–63, 1998.
Hsu, N. C., Tsay, S.-C., King, M. D., and Herman, J. R.: Deep blue retrievals of Asian aerosol properties during ACE-Asia, IEEE T. Geosci. Remote, 44, 3180–3195, 2006.
Hsu, S. C., Liu, S. C., Arimoto, R., Liu, T. H., Huang, Y. T., Tsai, F., Lin, F. J., and Kao, S. J.: Dust deposition to the East China Sea and its biogeochemical implications, J. Geophys. Res.-Atmos., 114, https://doi.org/10.1029/2008JD011223, 2009.
Huang, J., Fu, Q., Su, J., Tang, Q., Minnis, P., Hu, Y., Yi, Y., and Zhao, Q.: Taklimakan dust aerosol radiative heating derived from CALIPSO observations using the Fu-Liou radiation model with CERES constraints, Atmos. Chem. Phys., 9, 4011–4021, https://doi.org/10.5194/acp-9-4011-2009, 2009.
Iacono, M. J., Delamere, J. S., Mlawer, E. J., Shephard, M. W., Clough, S. A., and Collins, W. D.: Radiative forcing by long-lived greenhouse gases: Calculations with the AER radiative transfer models, J. Geophys. Res.-Atmos., 113, https://doi.org/10.1029/2008JD009944, 2008.
Janjić, Z. I.: The step-mountain eta coordinate model: Further developments of the convection, viscous sublayer, and turbulence closure schemes, Mon. Weather Rev., 122, 927–945, 1994.
Janjić, Z. I.: Nonsingular implementation of the Mellor–Yamada level 2.5 scheme in the NCEP Meso model, NCEP office note, 437, 61, 2002.
Kang, J. Y., Yoon, S. C., Shao, Y., and Kim, S. W.: Comparison of vertical dust flux by implementing three dust emission schemes in WRF/Chem, J. Geophys. Res.-Atmos., 116, https://doi.org/10.1029/2010JD014649, 2011.
Karydis, V., Kumar, P., Barahona, D., Sokolik, I., and Nenes, A.: On the effect of dust particles on global cloud condensation nuclei and cloud droplet number, J. Geophys. Res.-Atmos., 116, https://doi.org/10.1029/2011JD016283, 2011.
Kaufman, Y., Tanré, D., Remer, L. A., Vermote, E., Chu, A., and Holben, B.: Operational remote sensing of tropospheric aerosol over land from EOS moderate resolution imaging spectroradiometer, J. Geophys. Res.-Atmos., 102, 17051–17067, 1997.
Koehler, K. A., Kreidenweis, S. M., DeMott, P. J., Petters, M. D., Prenni, A. J., and Möhler, O.: Laboratory investigations of the impact of mineral dust aerosol on cold cloud formation, Atmos. Chem. Phys., 10, 11955–11968, https://doi.org/10.5194/acp-10-11955-2010, 2010.
Koop, T., Luo, B., Tsias, A., and Peter, T.: Water activity as the determinant for homogeneous ice nucleation in aqueous solutions, Nature, 406, 611–614, 2000.
Lacis, A.: Climate forcing, climate sensitivity, and climate response: A radiative modeling perspective on atmospheric aerosols, Dahl Ws. Env., 11–42, 1995.
Liu, J., Zheng, Y., Li, Z., Flynn, C., Welton, E. J., and Cribb, M.: Transport, vertical structure and radiative properties of dust events in southeast China determined from ground and space sensors, Atmos. Environ., 45, 6469–6480, 2011.
Liu, Y., Huang, J., Shi, G., Takamura, T., Khatri, P., Bi, J., Shi, J., Wang, T., Wang, X., and Zhang, B.: Aerosol optical properties and radiative effect determined from sky-radiometer over Loess Plateau of Northwest China, Atmos. Chem. Phys., 11, 11455–11463, https://doi.org/10.5194/acp-11-11455-2011, 2011.
Lohmann, U. and Diehl, K.: Sensitivity studies of the importance of dust ice nuclei for the indirect aerosol effect on stratiform mixed-phase clouds, J. Atmos. Sci., 63, 968–982, 2006.
Mallet, M., Tulet, P., Serça, D., Solmon, F., Dubovik, O., Pelon, J., Pont, V., and Thouron, O.: Impact of dust aerosols on the radiative budget, surface heat fluxes, heating rate profiles and convective activity over West Africa during March 2006, Atmos. Chem. Phys., 9, 7143–7160, https://doi.org/10.5194/acp-9-7143-2009, 2009.
Martonchik, J., Diner, D., Kahn, R., Gaitley, B., and Holben, B.: Comparison of MISR and AERONET aerosol optical depths over desert sites, Geophys. Res. Lett., 31, https://doi.org/10.1029/2004GL019807, 2004.
Miller, R., Tegen, I., and Perlwitz, J.: Surface radiative forcing by soil dust aerosols and the hydrologic cycle, J. Geophys. Res.-Atmos., 109, https://doi.org/10.1029/2003JD004085, 2004.
Mlawer, E. J., Taubman, S. J., Brown, P. D., Iacono, M. J., and Clough, S. A.: Radiative transfer for inhomogeneous atmospheres: RRTM, a validated correlated-k model for the longwave, J. Geophys. Res.-Atmos., 102, 16663–16682, 1997.
Nabat, P., Somot, S., Mallet, M., Michou, M., Sevault, F., Driouech, F., Meloni, D., di Sarra, A., Di Biagio, C., Formenti, P., Sicard, M., Léon, J.-F., and Bouin, M.-N.: Dust aerosol radiative effects during summer 2012 simulated with a coupled regional aerosol–atmosphere–ocean model over the Mediterranean, Atmos. Chem. Phys., 15, 3303–3326, https://doi.org/10.5194/acp-15-3303-2015, 2015a.
Nabat, P., Somot, S., Mallet, M., Sevault, F., Chiacchio, M., and Wild, M.: Direct and semi-direct aerosol radiative effect on the Mediterranean climate variability using a coupled regional climate system model, Clim. Dynam., 44, 1127–1155, 2015b.
Perlwitz, J. and Miller, R. L.: Cloud cover increase with increasing aerosol absorptivity: A counterexample to the conventional semidirect aerosol effect, J. Geophys. Res.-Atmos., 115, https://doi.org/10.1029/2009JD012637, 2010.
Phillips, V. T., DeMott, P. J., and Andronache, C.: An empirical parameterization of heterogeneous ice nucleation for multiple chemical species of aerosol, J. Atmos. Sci., 65, 2757–2783, 2008.
Seigel, R. B., van den Heever, S. C., and Saleeby, S. M.: Mineral dust indirect effects and cloud radiative feedbacks of a simulated idealized nocturnal squall line, Atmos. Chem. Phys., 13, 4467–4485, https://doi.org/10.5194/acp-13-4467-2013, 2013.
Shao, Y.: A model for mineral dust emission, J. Geophys. Res.-Atmos., 106, 20239–20254, 2001.
Shao, Y.: Simplification of a dust emission scheme and comparison with data, J. Geophys. Res.-Atmos., 109, https://doi.org/10.1029/2003JD004372, 2004.
Shao, Y., Ishizuka, M., Mikami, M., and Leys, J.: Parameterization of size-resolved dust emission and validation with measurements, J. Geophys. Res.-Atmos., 116, https://doi.org/10.1029/2010JD014527, 2011.
Solomos, S., Kallos, G., Kushta, J., Astitha, M., Tremback, C., Nenes, A., and Levin, Z.: An integrated modeling study on the effects of mineral dust and sea salt particles on clouds and precipitation, Atmos. Chem. Phys., 11, 873–892, https://doi.org/10.5194/acp-11-873-2011, 2011.
Su, L. and Fung, J. C.: Sensitivities of WRF-Chem to dust emission schemes and land surface properties in simulating dust cycles during springtime over East Asia, J. Geophys. Res.-Atmos., 120, https://doi.org/10.1002/2015JD023446, 2015.
Tesfaye, M., Tsidu, G. M., Botai, J., and Sivakumar, V.: Mineral dust aerosol distributions, its direct and semi-direct effects over South Africa based on regional climate model simulation, J. Arid Environ., 114, 22–40, 2015.
Textor, C., Schulz, M., Guibert, S., Kinne, S., Balkanski, Y., Bauer, S., Berntsen, T., Berglen, T., Boucher, O., Chin, M., Dentener, F., Diehl, T., Easter, R., Feichter, H., Fillmore, D., Ghan, S., Ginoux, P., Gong, S., Grini, A., Hendricks, J., Horowitz, L., Huang, P., Isaksen, I., Iversen, I., Kloster, S., Koch, D., Kirkevåg, A., Kristjansson, J. E., Krol, M., Lauer, A., Lamarque, J. F., Liu, X., Montanaro, V., Myhre, G., Penner, J., Pitari, G., Reddy, S., Seland, Ø., Stier, P., Takemura, T., and Tie, X.: Analysis and quantification of the diversities of aerosol life cycles within AeroCom, Atmos. Chem. Phys., 6, 1777–1813, https://doi.org/10.5194/acp-6-1777-2006, 2006.
Thompson, G. and Eidhammer, T.: A study of aerosol impacts on clouds and precipitation development in a large winter cyclone, J. Atmos. Sci., 71, 3636–3658, 2014.
Thompson, G., Rasmussen, R. M., and Manning, K.: Explicit forecasts of winter precipitation using an improved bulk microphysics scheme. Part I: Description and sensitivity analysis, Mon. Weather Rev., 132, 519–542, 2004.
Tomasi, C., Fuzzi, S., and Kokhanovsky, A.: Atmospheric Aerosols: Life Cycles and Effects on Air Quality and Climate, John Wiley & Sons, Weinheim, Germany, 2017.
Twohy, C. H., Kreidenweis, S. M., Eidhammer, T., Browell, E. V., Heymsfield, A. J., Bansemer, A. R., Anderson, B. E., Chen, G., Ismail, S., and DeMott, P. J.: Saharan dust particles nucleate droplets in eastern Atlantic clouds, Geophys. Res. Lett., 36, https://doi.org/10.1029/2008GL035846, 2009.
USDA: Soil Survey Manual, Revised Edition, United States Department of Agriculture Handbook No. 18, US Department of Agriculture, Washington, D.C., 1993.
Vaughan, M. A., Young, S. A., Winker, D. M., Powell, K. A., Omar, A. H., Liu, Z., Hu, Y., and Hostetler, C. A.: Fully automated analysis of space-based lidar data: An overview of the CALIPSO retrieval algorithms and data products, Remote Sens.-Basel, 16–30, 2004.
Wesely, M.: Parameterization of surface resistances to gaseous dry deposition in regional-scale numerical models, Atmos. Environ., 23, 1293–1304, 1989.
Winker, D. M., Vaughan, M. A., Omar, A., Hu, Y., Powell, K. A., Liu, Z., Hunt, W. H., and Young, S. A.: Overview of the CALIPSO mission and CALIOP data processing algorithms, J. Atmos. Ocean. Technol., 26, 2310–2323, 2009.
Winker, D. M., Pelon, J., Coakley Jr., J., Ackerman, S., Charlson, R., Colarco, P., Flamant, P., Fu, Q., Hoff, R., and Kittaka, C.: The CALIPSO mission: A global 3D view of aerosols and clouds, B. Am. Meteorol. Soc., 91, 1211–1229, 2010.
Zhang, C., Wang, M., Morrison, H., Somerville, R. C., Zhang, K., Liu, X., and Li, J. L. F.: Investigating ice nucleation in cirrus clouds with an aerosol-enabled Multiscale Modeling Framework, J. Adv. Model Earth. Sy., 6, 998–1015, 2014.