the Creative Commons Attribution 4.0 License.
the Creative Commons Attribution 4.0 License.
 | 18 Jun 2018
Reactive bromine in the low troposphere of Antarctica: estimations at two research sites
Laura Gómez-Martín
Olga Puentedura
Mónica Navarro-Comas
Javier Iglesias
José Ramón de Mingo
Manuel Pérez
Héctor Ochoa
María Elena Barlasina
Gerardo Carbajal
Margarita Yela
For decades, reactive halogen species (RHSs) have been the subject of detailed scientific research due to their influence on the oxidizing capacity of the atmosphere and on the climate. From the RHSs, those containing bromine are of particular interest in the polar troposphere as a result of their link to ozone-depletion events (ODEs) and to the perturbation of the cycle of toxic mercury, for example. Given its remoteness and related limited accessibility compared to the Arctic region, the RHSs in the Antarctic troposphere are still poorly characterized. This work presents ground-based observations of tropospheric BrO from two different Antarctic locations: Marambio Base (64∘13′ S, 56∘37′ W) and Belgrano II Base (77∘52′ S, 34∘7′ W) during the sunlit period of 2015. By means of MAX-DOAS (Multi-axis Differential Optical Absorption Spectroscopy) measurements of BrO performed from the two research sites, the seasonal variation in this reactive trace gas is described along with its vertical and geographical distribution in the Antarctic environment. Results show an overall vertical profile of BrO mixing ratio decreasing with altitude, with a median value of 1.6 pmol mol−1 in the lowest layers of the troposphere. Additionally, observations show that the polar sunrise triggers a geographical heterogeneous increase in bromine content in the Antarctic troposphere yielding a maximum BrO at Marambio (26 pmol mol−1), amounting to 3-fold the values observed at Belgrano at dawn. Data presented herein are combined with previous studies and ancillary data to update and expand our knowledge of the geographical and vertical distribution of BrO in the Antarctic troposphere, revealing Marambio as one of the locations with the highest BrO reported so far in Antarctica. Furthermore, the observations gathered during 2015 serve as a proxy to investigate the budget of reactive bromine (BrOx = Br + BrO) and the bromine-mediated ozone loss rate in the Antarctic troposphere.
- Article
(10535 KB) -
Supplement
(1306 KB) - BibTeX
- EndNote


The importance of the halogens (X = Cl, Br, I) in atmospheric chemistry and climate became clear decades ago after observations of these substances were made in the stratosphere and also in the troposphere (e.g., Molina and Rowland, 1974; Farman et al., 1985; Barrie et al., 1988; Oltmans et al., 1989; Fan and Jacob, 1992; Hausmann and Platt, 1994; Solomon, 1999). Indeed, reactive halogen species (RHSs) are of special interest in the troposphere for limiting the lifetime of species such ozone (O3), mercury (Hg), dimethyl sulfide (DMS) and organic compounds; for affecting the partitioning of NOx (NO + NO2) and HOx (OH + HO2); and, in the case of iodine, for participating in new aerosol formation. As such, the presence and the impact of the tropospheric halogen chemistry have been the subject of numerous studies with focus on remote regions and on environments under anthropogenic influence (e.g., Simpson et al., 2015 and references therein). Particular attention has been paid by the scientific community to the role of halogens in the polar regions. Although not unique to these regions, it is in the polar areas where bromine becomes particularly relevant, directing the oxidizing capacity of the atmosphere during springtime and causing ozone- and mercury-depletion events (ODEs and AMDEs, respectively). For details on sources, sinks and historical background, the reader is kindly referred to the compendium works of Simpson et al. (2007, 2015), Steffen et al. (2008), and Ariya et al. (2015) and references therein, for example.
Briefly, while the presence of reactive bromine in the global pristine troposphere is primarily due to the photolysis and oxidation of very-short-lived bromocarbons emitted from the oceans (e.g., Carpenter et al., 2014), in the polar regions its dominant source is of inorganic origin and is linked to heterogeneous chemistry. Through experimental and modeling studies, it is known that a set of heterogeneous reactions based on acidic substrates comprising hypobromous acid (HOBr) and bromide (Br−) take place in sea ice, open leads, brine, frost flowers, snowpacks or sea-salt aerosols, for example (e.g., Fan and Jacob, 1992; Vogt et al., 1996; Platt and Lehrer, 1997; Abbatt et al., 2012; Pratt et al., 2013, Toyota et al., 2014; Simpson et al., 2015, Thompson et al., 2015, 2017; Custard et al., 2017; Wang and Pratt, 2017). These reactions are summarized as
or
yielding the possibility that molecular bromine (Br2) transforms from the aqueous (aq) to the gas phase. When this is followed by the photolysis of Br2 into two bromine atoms, an autocatalytic release of bromine is triggered, resulting in an exponential buildup of reactive bromine BrOx (Br + BrO) in the troposphere and the so-called “bromine explosion” events (e.g., Fan and Jacob, 1992; Platt and Lehrer, 1997; Wennberg, 1999; Simpson et al., 2015). These events were first observed in the Arctic region by correlating the detection of filterable bromine with ODEs (e.g., Barrie et al., 1988) and, later on, by observing a very high amount of BrO (tens of picomoles per mole) in the boundary layer just after the polar sunrise (e.g., Hausmann and Platt, 1994; Tuckermann et al., 1997). Since then, several studies have tried to determine the chemical sources, sinks and pathways of these compounds (e.g., Simpson et al., 2007, 2015). In particular, the main BrO source reactions involve
In pristine environments (i.e., very low nitrogen oxide), along with photodissociation (in polar spring JBrO ∼ 3 × 10⁻² s−1; e.g., Thompson et al., 2015), the BrO sink reactions associated with the catalytic ODEs are
where Reaction 10 (R10) represents the main channel for the abovementioned bromine explosions causing ODEs (e.g., Bottenheim et al., 1986; Barrie et al., 1988; Oltmans et al., 1989; Platt and Hönninger, 2003; Simpson al., 2007), where the ozone loss rate is limited by the BrO itself and cross reactions (R8) and (R9) and estimated as (e.g, Hausmann and Platt, 1994; Le Bras and Platt, 1995; Platt and Jenssen, 1995; Platt and Lehrer, 1997)
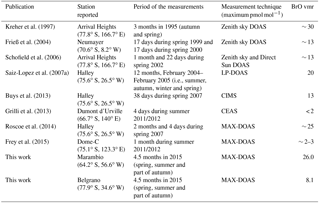
Overall, the attempts from the scientific community to estimate the presence of BrOx in the Antarctic troposphere were initiated 20 years ago with ground-based DOAS measurements of BrO from Arrival Heights (77.8∘ S, 166.7∘ E), observations compatible with the presence of 30 pmol mol−1 in the first 2 km of the troposphere (Kreher et al., 1997). Due to the complexity of performing measurements in such a hostile and remote environment, very few ground-based scientific works have followed that study (summarized in Table 1). In addition to the sparse ground-based measurements, the presence of tropospheric BrO in the Antarctic region has also been addressed through satellite observations (e.g., Wagner and Platt, 1998; Wagner et al., 2001; Richter et al., 2002; Theys et al., 2011), shipborne measurements (e.g., Wagner et al., 2007) and, more recently, by airborne DOAS measurements (e.g., Hüneke et al., 2017). In spite of the elapsed years and the efforts of the scientific community, compared to its northern counterpart, the current characterization of BrOx in the Antarctic troposphere is very poor given the very scarce geographical coverage available with vertical information. Moreover, most of the observations are campaign based in random years and hence the time coverage is also quite limited (see Table 1). The present work aims at improving this geographical, vertical and time coverage by adding two Antarctic sites to those few observing BrO in the Antarctic troposphere. These observations were made by endurable, stable and sensitive DOAS instrumentation built specifically for long-term measurements in hostile environments. Particularly, herein we present the observations performed during 2015 from two stations. The measurement sites and methodologies are introduced in Sect. 2. Section 3 puts forward the results obtained in terms of time series of BrO along with time series of the aerosol optical thickness, near-surface O3 and meteorology parameters. Then it deepens into the details of the vertical information gained after these observations and assesses the budget and distribution of inorganic reactive bromine in the troposphere of Antarctica. Section 4 summarizes the work.
Table 1Summary of the published ground-based observations of tropospheric BrO made in Antarctica. Published works of tropospheric BrO observations performed from different Antarctic stations. The time periods of the observations, measurement technique used and maximum BrO reported are also included. The “∼” symbols in the maximum BrO reported correspond to estimated values. For details, please refer to the respective publications.
During 2015, ground-based spectroscopic measurements were performed from two Antarctic research stations: Marambio and Belgrano II. Details of the measurement sites and methods are provided below, along with ancillary observations.

Figure 1Sea ice concentration surrounding the two Antarctic stations. The figure shows the sea ice concentration in Antarctica at the end of the austral summer (left) and at mid-winter (right) of 2015. The sea ice maps are downloaded from https://seaice.uni-bremen.de/databrowser/ (last access: 17 November 2017) (Spreen et al., 2008). The two Antarctic stations of Marambio and Belgrano are marked in yellow in both figures. Note the variability in the sea ice mainly near Marambio.
2.1 Measurement sites
In 2010, in collaboration with the National Antarctic Direction of Argentina/Argentinian Antarctic Institute (DNA/IAA), the National Institute for Aerospace Technology (INTA) deployed a MAX-DOAS (Multi-axis Differential Optical Absorption Spectroscopy; e.g., Platt and Stutz, 2008) instrument at the research base of Belgrano II (77∘52′ S, 34∘37′ W; 256 m a.s.l.), at the southern end of the Weddell Sea (from now on referred to as “Belgrano”). Later on, in 2015, similar instrumentation was installed at the site of Marambio (64∘13′ S, 56∘37′ W; 198 m a.s.l.), located on Seymour Island (a small island just east of James Ross Island), on the northern tip of the Antarctic Peninsula. Since then, MAX-DOAS observations have been maintained remotely. In 2016, both DOAS stations were accepted as part of the NDACC (Network for the Detection of Atmospheric Composition Change, http://www.ndsc.ncep.noaa.gov/, last access: 11 December 2017), aiming at long-term atmospheric observations (e.g., De Mazière et al., 2018). Note that, given their location around the Weddell Sea, long-term trace gas observations from these Antarctic sites provide a great opportunity for investigating the troposphere–sea ice interactions in two different scenarios: a station surrounded by seasonal sea ice (Marambio) and another where the perennial (edged) sea ice dominates (Belgrano). Figure 1 shows the locations at which INTA has instrumentation deployed in Antarctica and it shows the sea ice concentration (Spreen et al., 2008) surrounding these stations by the end of the austral summer and by mid-winter of the year 2015, which was the first year that both instruments operated simultaneously.
2.2 Measuring method
The spectral measurement technique used for the observations presented in this work was MAX-DOAS, gathering UV/VIS scattered skylight in the sunlit atmosphere. Through this technique, tropospheric vertical profiles of aerosol extinction coefficients (AECs) and BrO volume mixing ratios (vmr's) can be inferred. Specific details of the instruments' deployment and the spectral analysis and inversion scheme are provided in the following.
2.2.1 MAX-DOAS instruments
Although on a few occasions tropospheric BrO has been measured in remote regions with in situ techniques (e.g., chemical ionization mass spectrometry; Liao et al., 2011), the operational activities in remote and hostile environments render the DOAS (differential optical absorption spectroscopy) technique a very suitable approach given its sensitivity, versatility and instrumental endurance (e.g., Platt and Stutz, 2008). Either with active setups (e.g., long-path DOAS) or with passive ones (e.g., zenith DOAS, MAX-DOAS, satellite observations), the DOAS technique has been used broadly to research the troposphere in remote environments (e.g., Wagner and Platt, 1998; Bobrowsky et al., 2003; Wagner et al., 2007; Saiz-Lopez et al., 2007a, b; Puentedura et al., 2012; Prados-Roman et al., 2015; Peterson et al., 2017). In particular, the MAX-DOAS instrumental setup referred to in this work consists of a telescope scanning the atmosphere at different elevation angles, inferring with it vertically resolved information of the status of the atmosphere regarding aerosols and trace gases (e.g., Hönninger et al., 2004; Wagner et al., 2004). This is indeed an advantage that the MAX-DOAS configuration offers over the standard setup of the long-path DOAS, for example, and also over in situ instruments (e.g., chemical ionization mass spectrometry, CIMS), whose information is commonly limited to the instrument's altitude. Also, the MAX-DOAS specific ability to characterize the low troposphere overcomes the often limited sensitivity of the satellite observations to the planetary boundary layer.
Table 2Details of the MAX-DOAS instruments installed in Antarctica. The NEVA II instrument is located at the Belgrano research station while the NEVA III instrument is placed at Marambio.
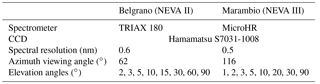
The hardware and software of the MAX-DOAS instruments referred to in this work were developed by INTA. For decades, the group has been investigating the atmosphere from different sites of the world using the DOAS technique, particularly from polar regions (e.g., Gil et al., 1996, 2008; Yela et al., 2017). The two MAX-DOAS instruments referred to in this study consist of an outdoor unit with a temperate pointing system developed and built at INTA (Fig. 2), comprising a stepper motor and a telescope with an 8 cm focal length fused silica lens yielding a field of view of 1∘. The sunlight is focused in a quartz fibre bundle, which is directed into the indoor unit comprising a temperature-stabilized Czerny–Turner monochromator and a CCD camera fully developed by INTA based on a Hamamatsu S7031-1008 sensor, kept at −40 ∘C ± 0.05 ∘C with a temperature control developed and built at INTA. Both instruments operate in off-axis mode scanning the atmosphere from the horizon to the zenith every 15 min while the solar zenith angle (SZA) is lower than 85∘. For a SZA higher than 85∘, the telescopes are fixed at zenith position and during the polar night no measurements are performed (i.e., April–August at Marambio and March–September at Belgrano). Further details of the MAX-DOAS instruments installed at Antarctica are provided in Table 2.
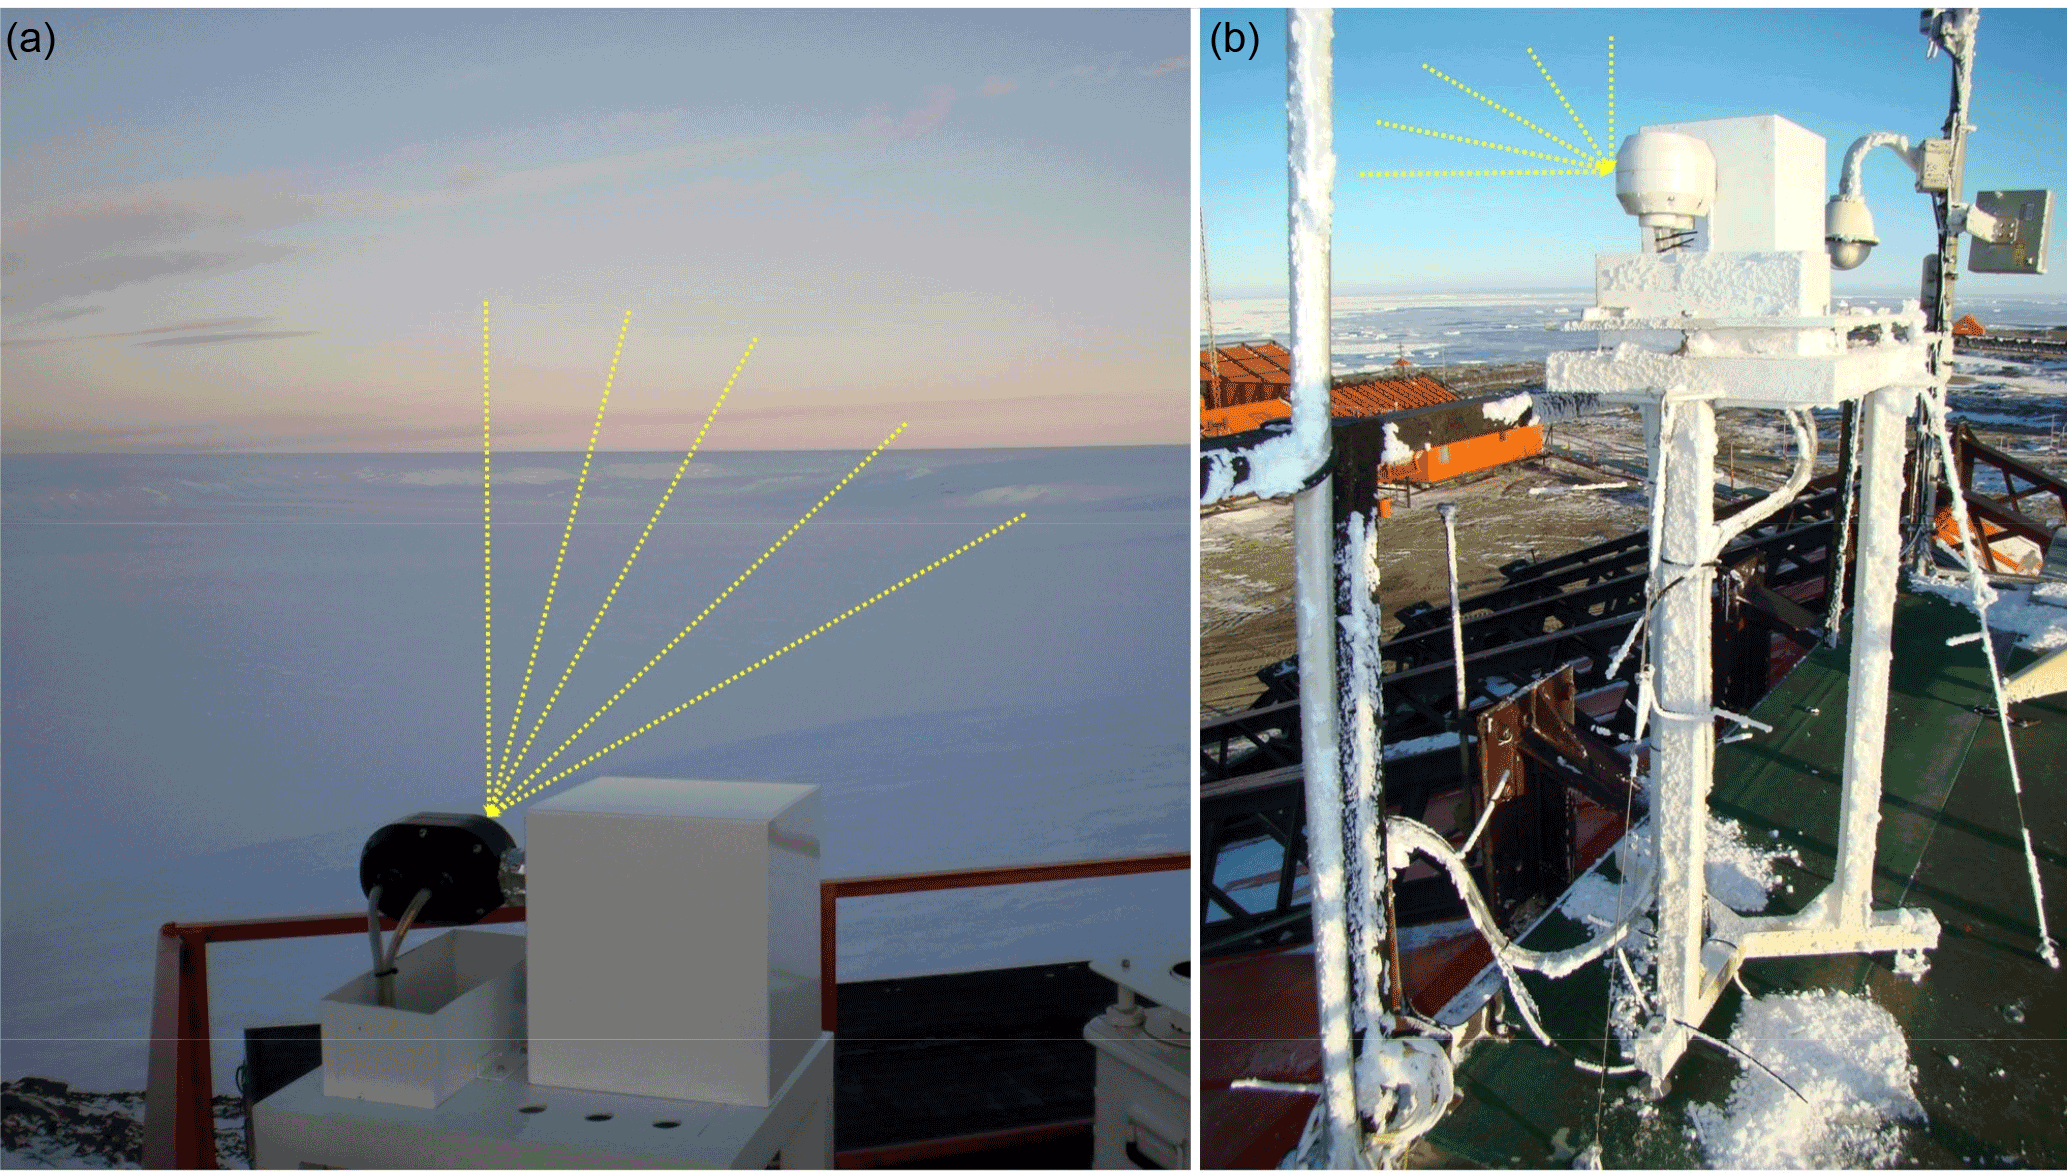
Figure 2INTA's MAX-DOAS instruments mounted at the two Antarctic stations. The outdoor unit of the MAX-DOAS instrument installed at Belgrano is shown in (a) while the one at Marambio is shown in (b). By scanning the atmosphere at different elevation angles (yellow lines), vertical information of aerosols and trace gases can be retrieved.
2.2.2 Spectral analysis and vertical profile inversion
The spectral analysis of the DOAS observations shown in this work was performed with INTA's software LANA (e.g., Gil et al., 2008; Peters et al., 2017). The retrieval of BrO was centered in the 335–358 nm spectral range, including the absorption cross sections of BrO (Fleischmann et al., 2004), O4 (Thalman and Volkamer, 2013), CH2O (Meller and Moortgat, 2000), OClO (Kromminga et al., 2003), NO2 (Vandaele et al., 1998), O3 (Bogumil et al., 2003) and of a pseudo-Ring spectra (Chance and Spurr, 1997), along with a fifth-degree closure term and constant intensity offset. In order to decrease possible instrumental instabilities and to minimize the influence of stratospheric trace gases in the retrieval, the zenith spectrum from each scan was used as a reference. Moreover, only data gathered in off-axis mode with a SZA < 75∘ were used in this work.
Similarly, the O4 differential slant column densities (dSCDs) were also retrieved (337–370 nm spectral window) in order to invert the vertical profile of the AEC and therefore to characterize the scattering properties of the atmosphere and the light path of the photons reaching the detector. The reliability of the aerosol vertical information retrieved by MAX-DOAS observations has already been demonstrated under different visibility conditions (e.g., Frieß et al., 2016). This retrieval is based on the concept that the concentration O4 is known and stable in the atmosphere. Hence, a variation in the O4 dSCDs is usually related to a change of the optical path, generally due to the presence of aerosols (e.g., Hönninger et al., 2004; Wagner et al., 2004). The inverted AEC vertical profile was then used as input for the linear inversion of the vertical profile of the BrO vmr.
In this work, the inversion of the vertical profiles of the AEC and the BrO concentration was based on the optimal estimation method (e.g., Rodgers, 2000). The radiative transfer model (RTM) used was LIDORT (Spurr, 2008) and the inversion scheme was BePRO (BIRA, Clémer et al., 2010). The procedure consisted of a two-step approach. First, the AECs were retrieved from the observed O4 dSCDs through an iterative nonlinear process (e.g., Hendrick et al., 2014; Córdoba-Jabonero et al., 2016). The inferred AEC was then used to invert the targeted BrO profiles.
The RTM input parameters characterizing the profile retrievals were carefully chosen for polar conditions and always bearing in mind that the aim is to gain long-term observations in the hostile conditions of Antarctica. For the measurements performed from the Marambio station, the pressure (P), temperature (T), O3 and NO2 vertical profiles were obtained from the standard atmosphere for subarctic latitudes (Anderson et al., 1986). For the observations made from Belgrano, the considered P, T and O3 profiles were obtained from monthly averaged available ozonesonde records (from 1999 to 2006, e.g., Parrondo et al., 2014), while the NO2 profile was taken from the same standard atmosphere. The modeled atmosphere was stratified into layers of 100 m from 0 to 4 km altitude, layers of 1 km from 4 to 6 km (wider grid related to less sensibility at those altitudes) and layers of the same width of those of the standard atmosphere above this altitude. The retrieved profiles were obtained up to an altitude of 6 km. In the inversion scheme, the diagonal elements of the measurement uncertainty covariance matrix were the square of the dSCD error after the DOAS fit (1σ). The statistics of the DOAS fit are included in the Supplement. The diagonal elements of the a priori covariance matrix in the inversion were calculated as 100 % of the a priori profile for BrO and based on Clémer et al. (2010) for the aerosol extinction retrieval. Note that, given the large variability in the visibility conditions at Antarctica, the true aerosol profile can strongly differ from the a priori profile. In order to allow the extinction profile retrieval to capture these variations, we followed the method described in Clémer et al. (2010). In this method, the diagonal element of Sa closest to the surface (i.e., Sa (1,1)) is set equal to the square of a scaling factor (β) times the maximum partial aerosol optical depth (AOD) of the extinction profile obtained in the precedent iteration. In this study, β has been set to 1. The other diagonal elements decrease linearly with altitude down to 20 % of Sa (1,1). Note that, despite not being a statistically Bayesian method, it allows the profiles corresponding to large AOD to differ significantly from the a priori AOD profile, while the profiles with smaller AOD present lower variations from the a priori AOD profile. The non-diagonal elements were calculated following a Gaussian distribution with a correlation length of 100 m for aerosols and 300 m for trace gases (e.g., Hendrick et al., 2004). Therefore, the error of the retrieved profiles provided in this work contains the measurement error (experimental dSCD error) and the smoothing error of the retrieval. The last takes into account that the retrieval is an estimate of the true profile smoothed by the averaging kernel functions.
Given that the measurements in Antarctic stations are frequently affected by blowing snow, the aerosol optical properties were obtained using Henyey–Greenstein phase functions for the single-scattering albedo SSA = 0.999982 and asymmetry parameter g= 0.89, corresponding to typical values of clean ice crystal (e.g., Frieß et al., 2011). After several tests considering typical snow albedos (between 0.8 and 0.9), the surface albedo was set to 0.8. Note that this value is consistent with observations of the sea ice albedo performed in the UVA spectral range in the Arctic region (e.g., Ehrlich, 2009). In order to avoid unrealistic values, an upper limit for AOD was set to 0.5, therefore neglecting all the observations made in such complicated conditions from the light scattering point of view. Also, only retrievals with degrees of freedom higher than 1 were taken into consideration. The degrees of freedom of the data set presented in this work are summarized in the Supplement (Table S1).
After the AEC vertical profile was estimated at 360 nm by means of the measured O4 dSCDs, the aimed BrO vmr vertical profiles were retrieved at 338 nm using the calculated AEC as input of the RTM. In order to properly include the inferred AEC in the retrieval of the BrO vmr profiles, they were calculated at the corresponding wavelength using an Ångström parameter of 2.2 (e.g., Hegg et al., 2010). An exponential decreasing profile corresponding to AOD = 0.02 was chosen as the a priori AEC vertical profile for the AEC vertical profile. The scale height of the a priori AEC was set to 0.5 km for Belgrano and to 2 km for Marambio since these values provided the lower differences between observed and modeled O4 dSCD for each station. The a priori BrO vertical density corresponded to an exponentially decreasing profile with a scale height of 1 km and a surface value of ∼ 1.5 pmol mol−1.
2.3 Ancillary data
As a consequence of its logistically complicated location and very harsh weather conditions, there are very scarce observational data describing the atmosphere at Antarctica. In order to interpret the bromine results, in addition to the spectra gathered by the MAX-DOAS measurements, near-surface O3 vmr's measured at both stations were also compiled. At both sites, the surface O3 was measured with ozone analyzers (Thermo Environmental Instrument, Thermo Fisher Scientific, model 49; i.e., TEI49). The operation principle of this in situ instrumentation consists of the attenuation of an ultraviolet light beam (254 nm) by an air sample containing ozone and has a manufactured sensitivity and limit of detection of 1 nmol mol−1. In the case of the Marambio station, which contributes to the GAW network (Global Atmosphere Watch, WMO World Data Centre for Greenhouse Gases, WDCGG), the measurements of surface O3 were carried out by the National Meteorological Service of Argentina (SMN) and can be retrieved from the WMO WDCGG (https://ds.data.jma.go.jp/gmd/wdcgg/, last access: 18 September 2017). These data from the TEI49 from Marambio are compared every year against the regional standard (WMO, RCC-BsAs, TEI49PS). At the research site of Belgrano, the year-round surface O3 has been measured by INTA since February 2007 (e.g., Jones et al., 2013). At this site, the inlet of the analyzer, protected from rain, snow and dust, is placed 0.85 m above the roof of the base in the cleanest area of the station, free of pollution from the research site.
Additionally, the weather information was obtained from the observations performed by the SMN at Marambio (WMO station 89055) and by INTA at Belgrano. In the case of Marambio, the weather station is installed in the so-called scientific pavilion of the Marambio Antarctic station together with an automated met station (AMS), which measures the temperature, humidity, precipitation, wind speed and direction in addition to the atmospheric pressure. The data acquisition system is carried out through a Campbell Scientific CR100 datalogger. In the case of Belgrano, the weather parameters are gathered by a Vaisala weather station installed at the site in 2009. In this case, the weather station is installed on the roof of the base, on a 210 cm mast and it provides wind speed and direction, atmospheric pressure, temperature, and relative humidity.
This section is divided into three main parts. First, it presents the time series of the DOAS measurements and the ancillary observations performed during 2015, offering an overview of the information gathered within the frame of this study. Then, the details and discussion of the retrieved BrO and AEC vertical distributions at the two sites are provided. Finally, the activation of bromine in the Antarctic troposphere during 2015 is investigated along with the reactivity of the Antarctic troposphere with regard to inorganic reactive bromine.
3.1 Time series
This section presents the observations gathered during 2015 at each station. It first shows the DOAS measurements in terms of AOD and BrO vertical column densities (VCDs). Later on, it shows the results of the ancillary observations (weather parameters and surface ozone).
3.1.1 DOAS observations: BrO VCD2 km and AOD2 km
Herein, we present the AOD and the BrO VCD measured with the DOAS technique during the sunlit period of 2015. This period lasted for about 8.5 months at Marambio and 7.5 months at Belgrano (Figs. 3 and 4). Due to instrumental issues, there were missing data at the beginning of the year at both stations. Note, however, that the polar sunrise and therefore the peak season of the bromine activation was well covered at both sites (e.g., Simpson et al., 2007).
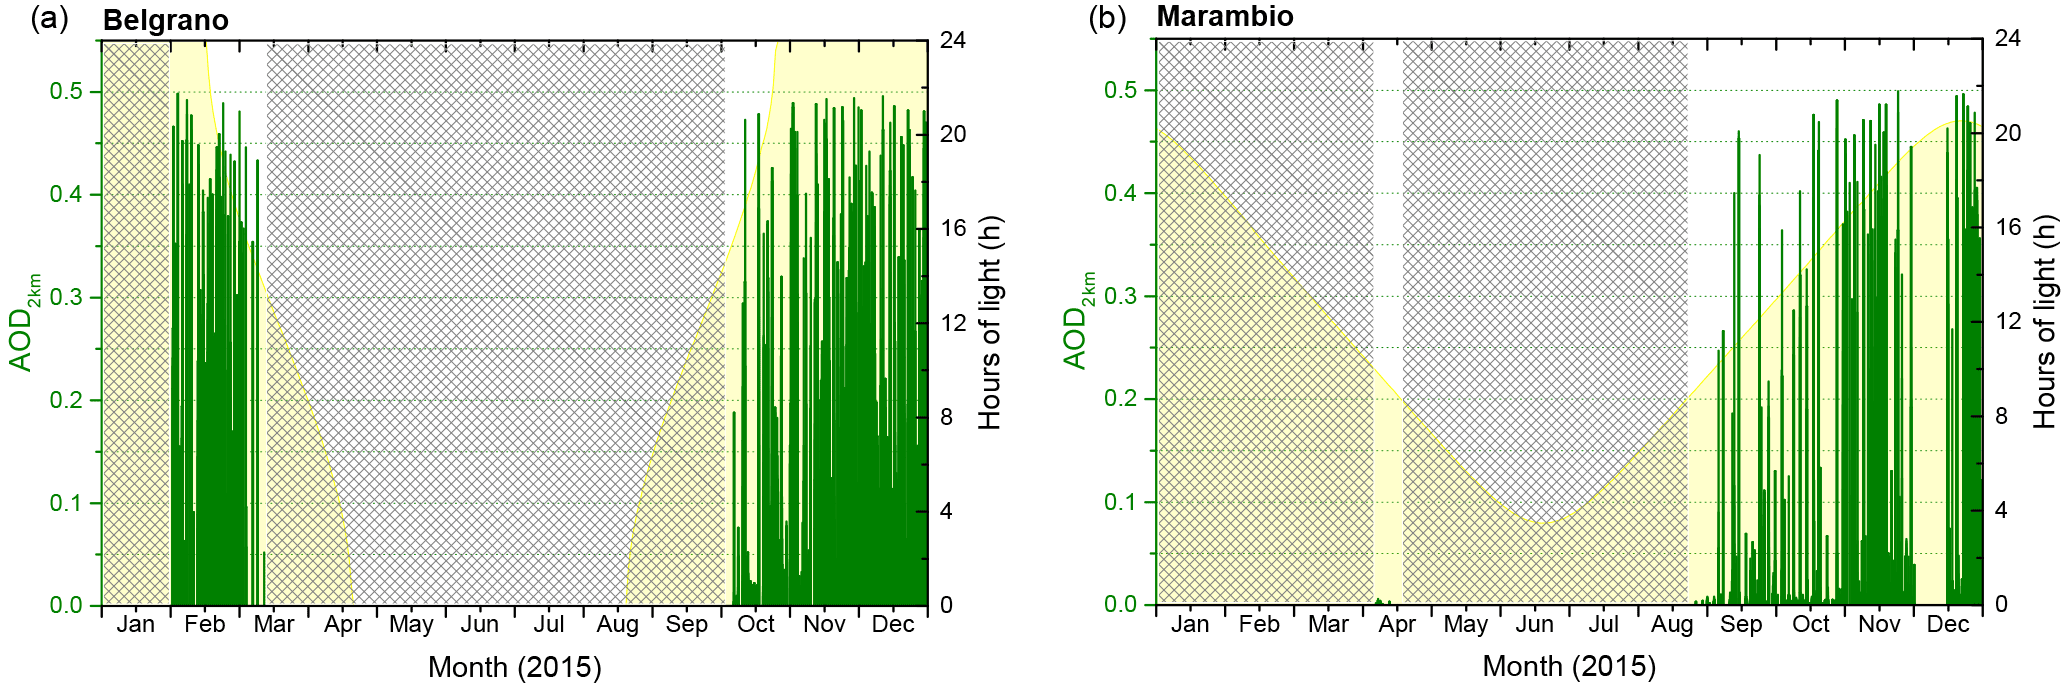
Figure 3Time series of the aerosol optical depth (AOD) in the first 2 km of the troposphere as observed at Belgrano (a) and at Marambio (b) during 2015. The horizontal scale indicates the time of the year while the left vertical scale shows the AOD. The scale on the right shows the hours of light at each station (shown in yellow in the plots). Note that the same scales apply to both figures. Time periods without MAX-DOAS observations (i.e., instrumental issues or SZA > 75∘) are indicated with shaded areas.
As mentioned in Sect. 2.2.2, the sensitivity of the MAX-DOAS observations decreases with altitude. Hence, aiming also at comparing both stations, here we refer to the AOD and BrO VCD inferred in the first 2 km of the troposphere at each site (i.e., AOD2 km and VCD2 km, respectively). Figure 3 shows the AOD2 km retrieved at both stations (mean relative error of 40 %). Observations indicate that the aerosol optical thickness of the low troposphere at Belgrano was generally higher than at Marambio. At Belgrano, 62 % of the AOD2 km was lower than 0.05 (12 % between 0.05 and 0.1) compared to 90 % of the AOD2 km at Marambio that was below 0.05. In addition to this geographical dependence of the AOD, Fig. 3 also suggests that the period with higher aerosol thickness lasted longer in the southernmost station of Belgrano. As seen in the figure, while high AODs were observed at Belgrano during most of the sunlit period, the AOD at Marambio intensified from September until December. The geographical variability in the aerosol load within Antarctica has already been reported (e.g., Savoie et al., 1993; Minikin et al., 1998), although further studies on the distribution of aerosols are needed in order to understand the interannual variability in the different sources (e.g., Giordano et al., 2017). Further insights into the aerosol properties within the Antarctic troposphere during 2015 will be provided in a following work (Gómez-Martín et al., 2018).
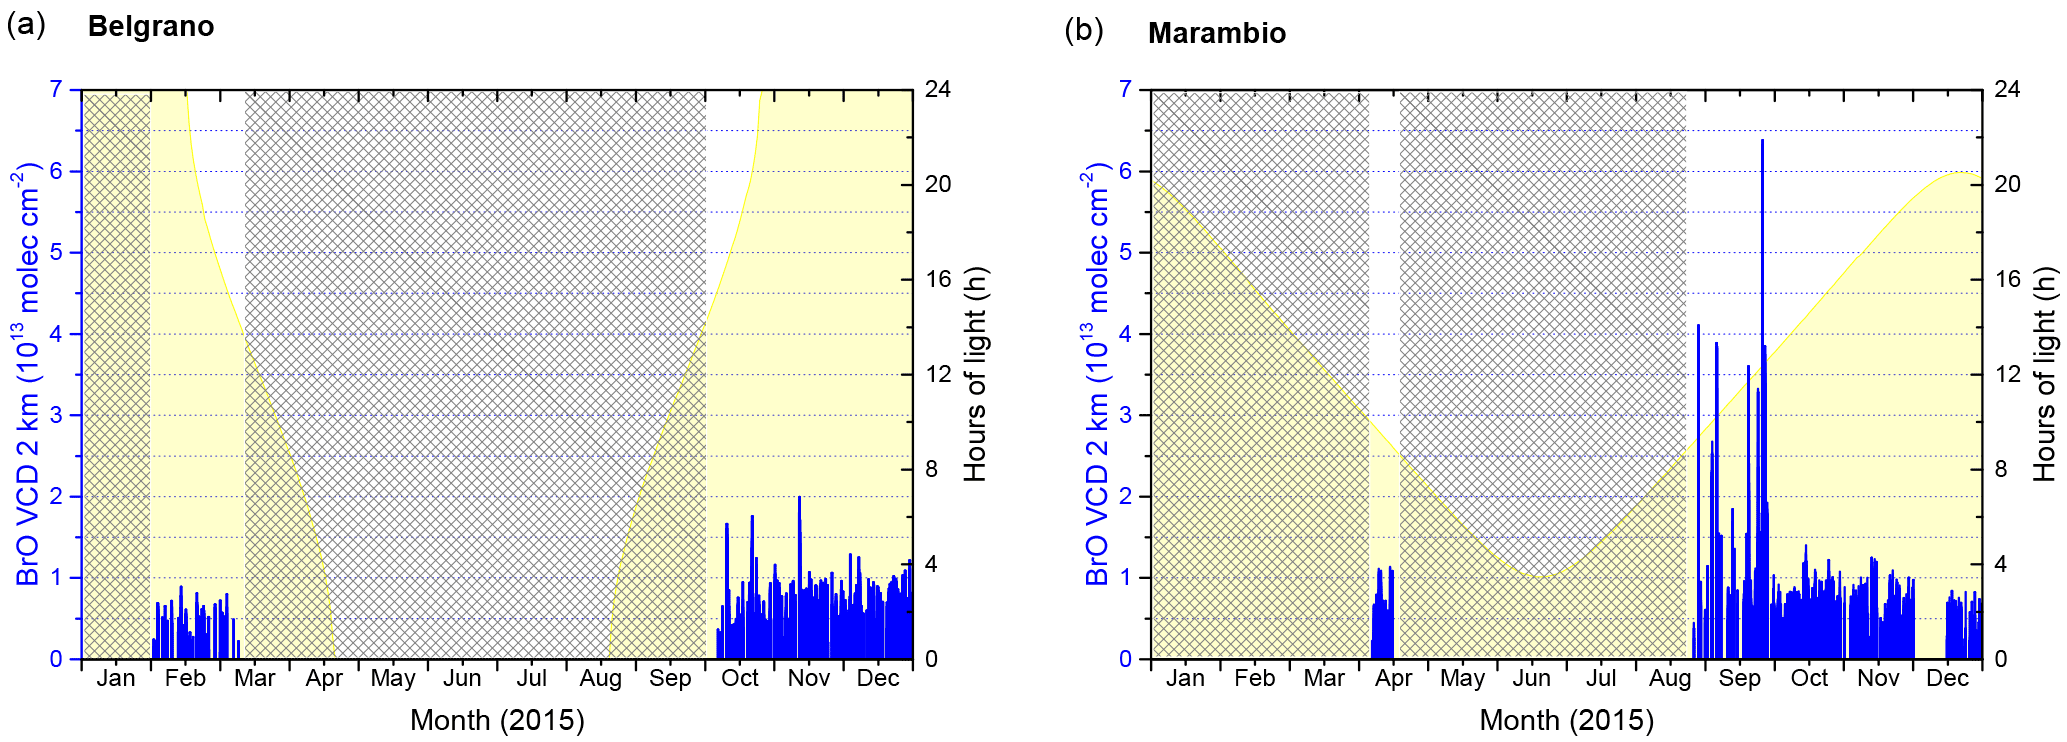
Figure 4Time series of the BrO vertical column density (VCD) in the first 2 km as observed at Belgrano (a) and at Marambio (b) during 2015. The horizontal scale indicates the time of the year while the left vertical scale shows the BrO VCD. The scale on the right shows the hours of light at each station (shown in yellow in the plots). Note that the same scales apply to both figures. Time periods without MAX-DOAS observations (i.e., instrumental issues or SZA > 75∘) are indicated with shaded areas.
Regarding the BrO, the pseudo-vertical column densities (VCD2 km) are calculated by integrating the BrO concentration obtained within the first 2 km of the troposphere. Results, shown in Fig. 4, indicate that BrO was present in the sunlit Antarctic troposphere at both stations. The median BrO VCD2 km values at both sites were quite similar (∼ 0.5 × 10¹³ molec cm−2, with a mean relative error of 10 %) and 75 % of the observations at both stations fell below a similar value (0.8 × 10¹³ molec cm−2). Also, at both sites, the maximum BrO VCD2 km values were observed after the polar sunrise (i.e., SZA < 75∘ herein) and the BrO levels were undetectable just before the polar sunset (i.e., SZA > 75∘ herein) and immediately after the polar sunrise. However, the magnitude of and variability in the BrO VCD2 km maximums direct the difference between both stations, with an absolute maximum BrO VCD2 km observed at Marambio that is 3.2× higher than at Belgrano. As can be observed in Fig. 4, it is also worth noticing the clear photolytic activation of BrO at Marambio during austral spring, with levels an order of magnitude higher than the median BrO VCD2 km values at the station. Insights into the vertical distribution of BrO and aerosol extinction in the Antarctic troposphere are provided later on in Sect. 3.2.
Table 3Meteorological parameters (temperature T and snowfall) observed during 2015 at both stations. Data are provided by the World Meteorological Organization (WMO), the Argentinian Meteorological Centre and INTA's meteorological station (Belgrano). The snowfall is based on surface synoptic observations.
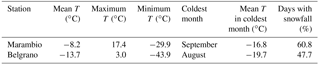

Figure 5Wind rose at the Belgrano (a) and Marambio (b) stations (2015). The vertical scale indicates the frequency count. Belgrano data are gathered from INTA's weather station and those at Marambio are provided by the WMO and the Argentinian Weather Service. The color code in both plots refers to different wind speed regimes: low wind conditions (< 6 m s−1, in green), medium wind conditions (6–12 m s−1, in grey) and blowing snow conditions (> 12 m s−1, e.g., Jones et al., 2009, in black). The statistics of each regime at each station during 2015 are indicated in parentheses.
3.1.2 Ancillary observations: meteorological parameters and surface O3
Aiming at contextualizing both research stations, this section briefly presents some weather parameters and the near-surface ozone characterizing the sites of Marambio and Belgrano during 2015.
Regarding the weather information at each station, the mean observed values of meteorological parameters such as temperature (T) and precipitation are provided in Table 3. Overall, observations indicate that Belgrano station sits at a dryer and colder location where, in 2015, temperatures dropped below −40 ∘C. Regarding the wind measurements, the wind rose of the 2015 measurements at each station is shown in Fig. 5 for low, medium and high wind speeds. Note that the information reported for 2015 at Marambio is consistent with the recent publication of Asmi et al. (2018) referring to the 2013–2015 period. The 2015 observations at both stations indicate that, although the higher gusts of wind were quite similar at both stations (∼ 34 m s−1), the median wind speed at Marambio (7.2 m s−1) was in general 50 % higher than at Belgrano. Concerning the wind direction observed at each station during 2015 (Fig. 5), while the air masses arriving at Marambio had no clear dominant direction, those arriving at Belgrano usually came from the south-southwest. Hence, based on the wind rose (Fig. 5), during 2015 Marambio was mostly influenced by air masses coming along the west edge of the Weddell Sea but also from the surrounding Scotia and Amundsen seas, while the air masses from continental Antarctica dominated the observations performed at Belgrano station.

Figure 6The 2015 near-surface ozone observations at the Belgrano (a) and Marambio (b) research stations. Note the same vertical scale in both plots. Both data sets were gathered by in situ O3 observations made by INTA (at Belgrano) and by the Argentinian Meteorological Service (at Marambio). The periods with MAX-DOAS data (SZA < 75∘) at each station are contained within the green boxes.
As for the near-surface O3, the annual variation at both stations showed the seasonal pattern expected at high-latitude stations (Antarctic and sub-Antarctic regions, Fig. 6) and is typical of remote, low NOx environments with O3 being accumulated during winter (maximum) and destroyed (minimum) during summer. Also, the observed amplitude of the surface O3 annual cycle at both stations was also characteristic of an Antarctic station (e.g., Helmig et al., 2007; Legrand et al., 2016). While in 2015 the median values of surface O3 were quite similar at both locations (23 nmol mol−1 at Marambio and 24 nmol mol−1 at Belgrano), the maximum values reported at Marambio (36.8 nmol mol−1) were about a 10 % higher than those observed at the Belgrano station. Regarding the absolute minimum surface O3 detected, 2015 observations at Marambio indicate ozone depletion events (ODEs) with measurements very close to or below instrumental detection limit (1 nmol mol−1), while the minimum surface O3 detected at Belgrano was not lower than 6 nmol mol−1. This suggests that, compared to Belgrano, Marambio is either a more photochemically active region or a region more exposed to ozone-depleted air masses. Noteworthy is also the high variability in surface ozone observed at Marambio during the polar sunrise compared to observations at the Belgrano station. This behavior is characteristic of a coastal Antarctic station as reported by Helmig et al. (2007), for example.
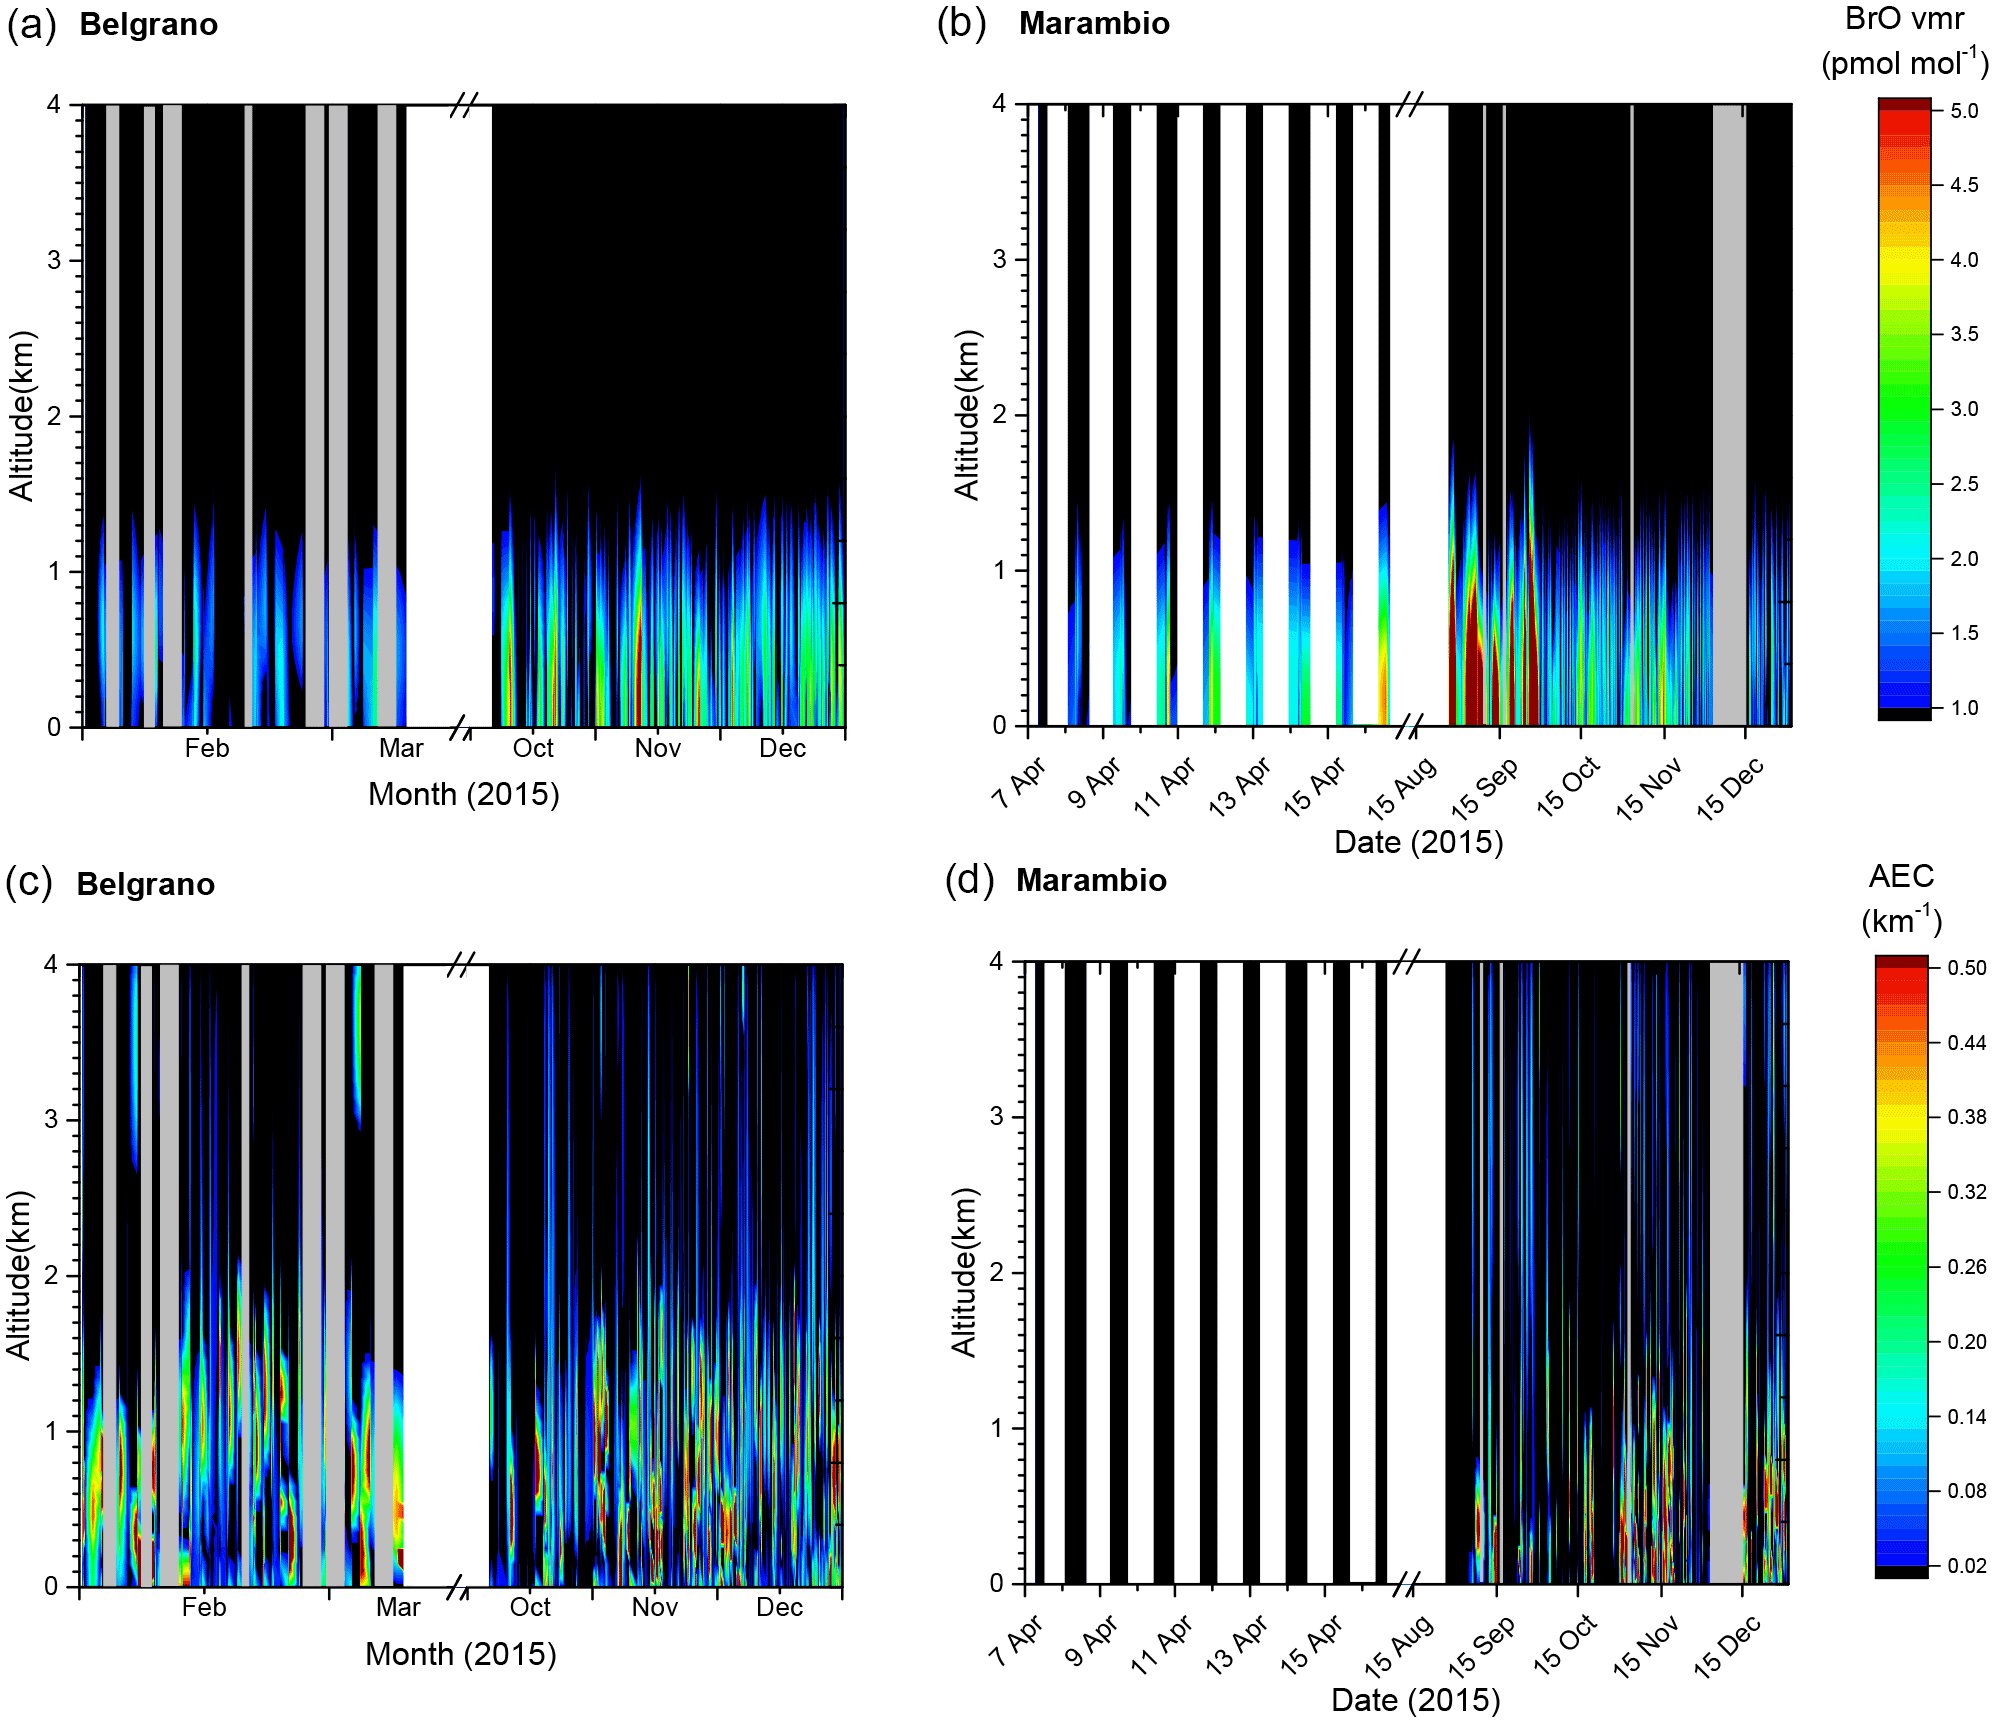
Figure 7BrO vmr (a, b) and AEC (c, d) observed during 2015 in the troposphere of Belgrano (a, c) and Marambio (b, d). The vertical scales show the altitude and are forced to be the same for the sake of comparison. The horizontal scales indicate the periods of the measurements, which depended on the station. The color code of the upper figures corresponds to the BrO vmr and is forced to be the same for the sake of comparison. The same applies to the color code of the lower figures, which indicate the AEC at each station. The BrO vmr higher than 5 pmol mol−1 and AEC higher than 0.5 km−1 are shown in dark red, while values below the detection limit are shown in black. Time periods with no observations (SZA > 75∘) are indicated with white areas and those with data below quality filters are shown with grey areas. The vertical grid of the retrieval is indicated with the small ticks in the vertical axis.
3.2 Vertical profiles of BrO in the Antarctic troposphere
The time series of BrO vmr retrieved during 2015 in the lowest kilometers of the troposphere of Marambio and Belgrano are provided in Fig. 7, along with the AEC. For clarity, Fig. 8 shows, in more detail, some examples of the time evolution of BrO as measured at Belgrano and at Marambio and in Fig. 9 the sea ice conditions during those days. The wind speed on those selected days was below 10 m s−1. As can be seen in Fig. 8, the maximum of BrO was located close to the surface, although its specific altitude depended on the day, always located below 1 km of altitude. Some days the peak of BrO was located just above the surface (e.g., 11 November at Belgrano or 25 September at Marambio in Fig. 8; both days with winds ≤ 6 m s−1), while in others that BrO maximum was slightly elevated, suggesting heterogeneous reactions aloft (e.g., 29 October at Belgrano with wind speed ≤ 2 m s−1 or 28 November at Marambio with wind speed 6.5–9 m s−1; in Fig. 8). Worth noticing is also the time and seasonal variability in the occurrence of the maximum of BrO vmr. As shown in Fig. 8, on 29 October at Belgrano, some days the BrO vmr followed the diurnal evolution with a noon maximum predicted by model studies (e.g., Saiz-Lopez et al., 2008) and observations (e.g., Buys et al., 2013) in which the BrO formation is linked to the solar irradiance and the photolysis of bromine sources (e.g., Br2, BrCl). Based on the calm wind conditions observed during that particular day (29 October), those sources are most probably not far from the station of Belgrano (Fig. 9). Conversely, on 28 November at Marambio, for example (Fig. 8), on other days BrO was present in the low troposphere with a double maximum (morning and evening), characteristic of a late spring behavior and more related to bromine being recycled through HOBr, for example (e.g., von Glasow et al., 2002; Pöhler et al., 2010; Liao et al., 2012; Buys et al., 2013). The slightly higher southeasterly winds during those observations on 28 November at Marambio point towards bromine sources in the Weddell Sea (Fig. 9). This shown time and altitude dependence of the BrO distribution in the troposphere reinforces the benefits of the sort of instrumentation employed in this work, which offers vertically resolved information and is able to perform long-term observations.
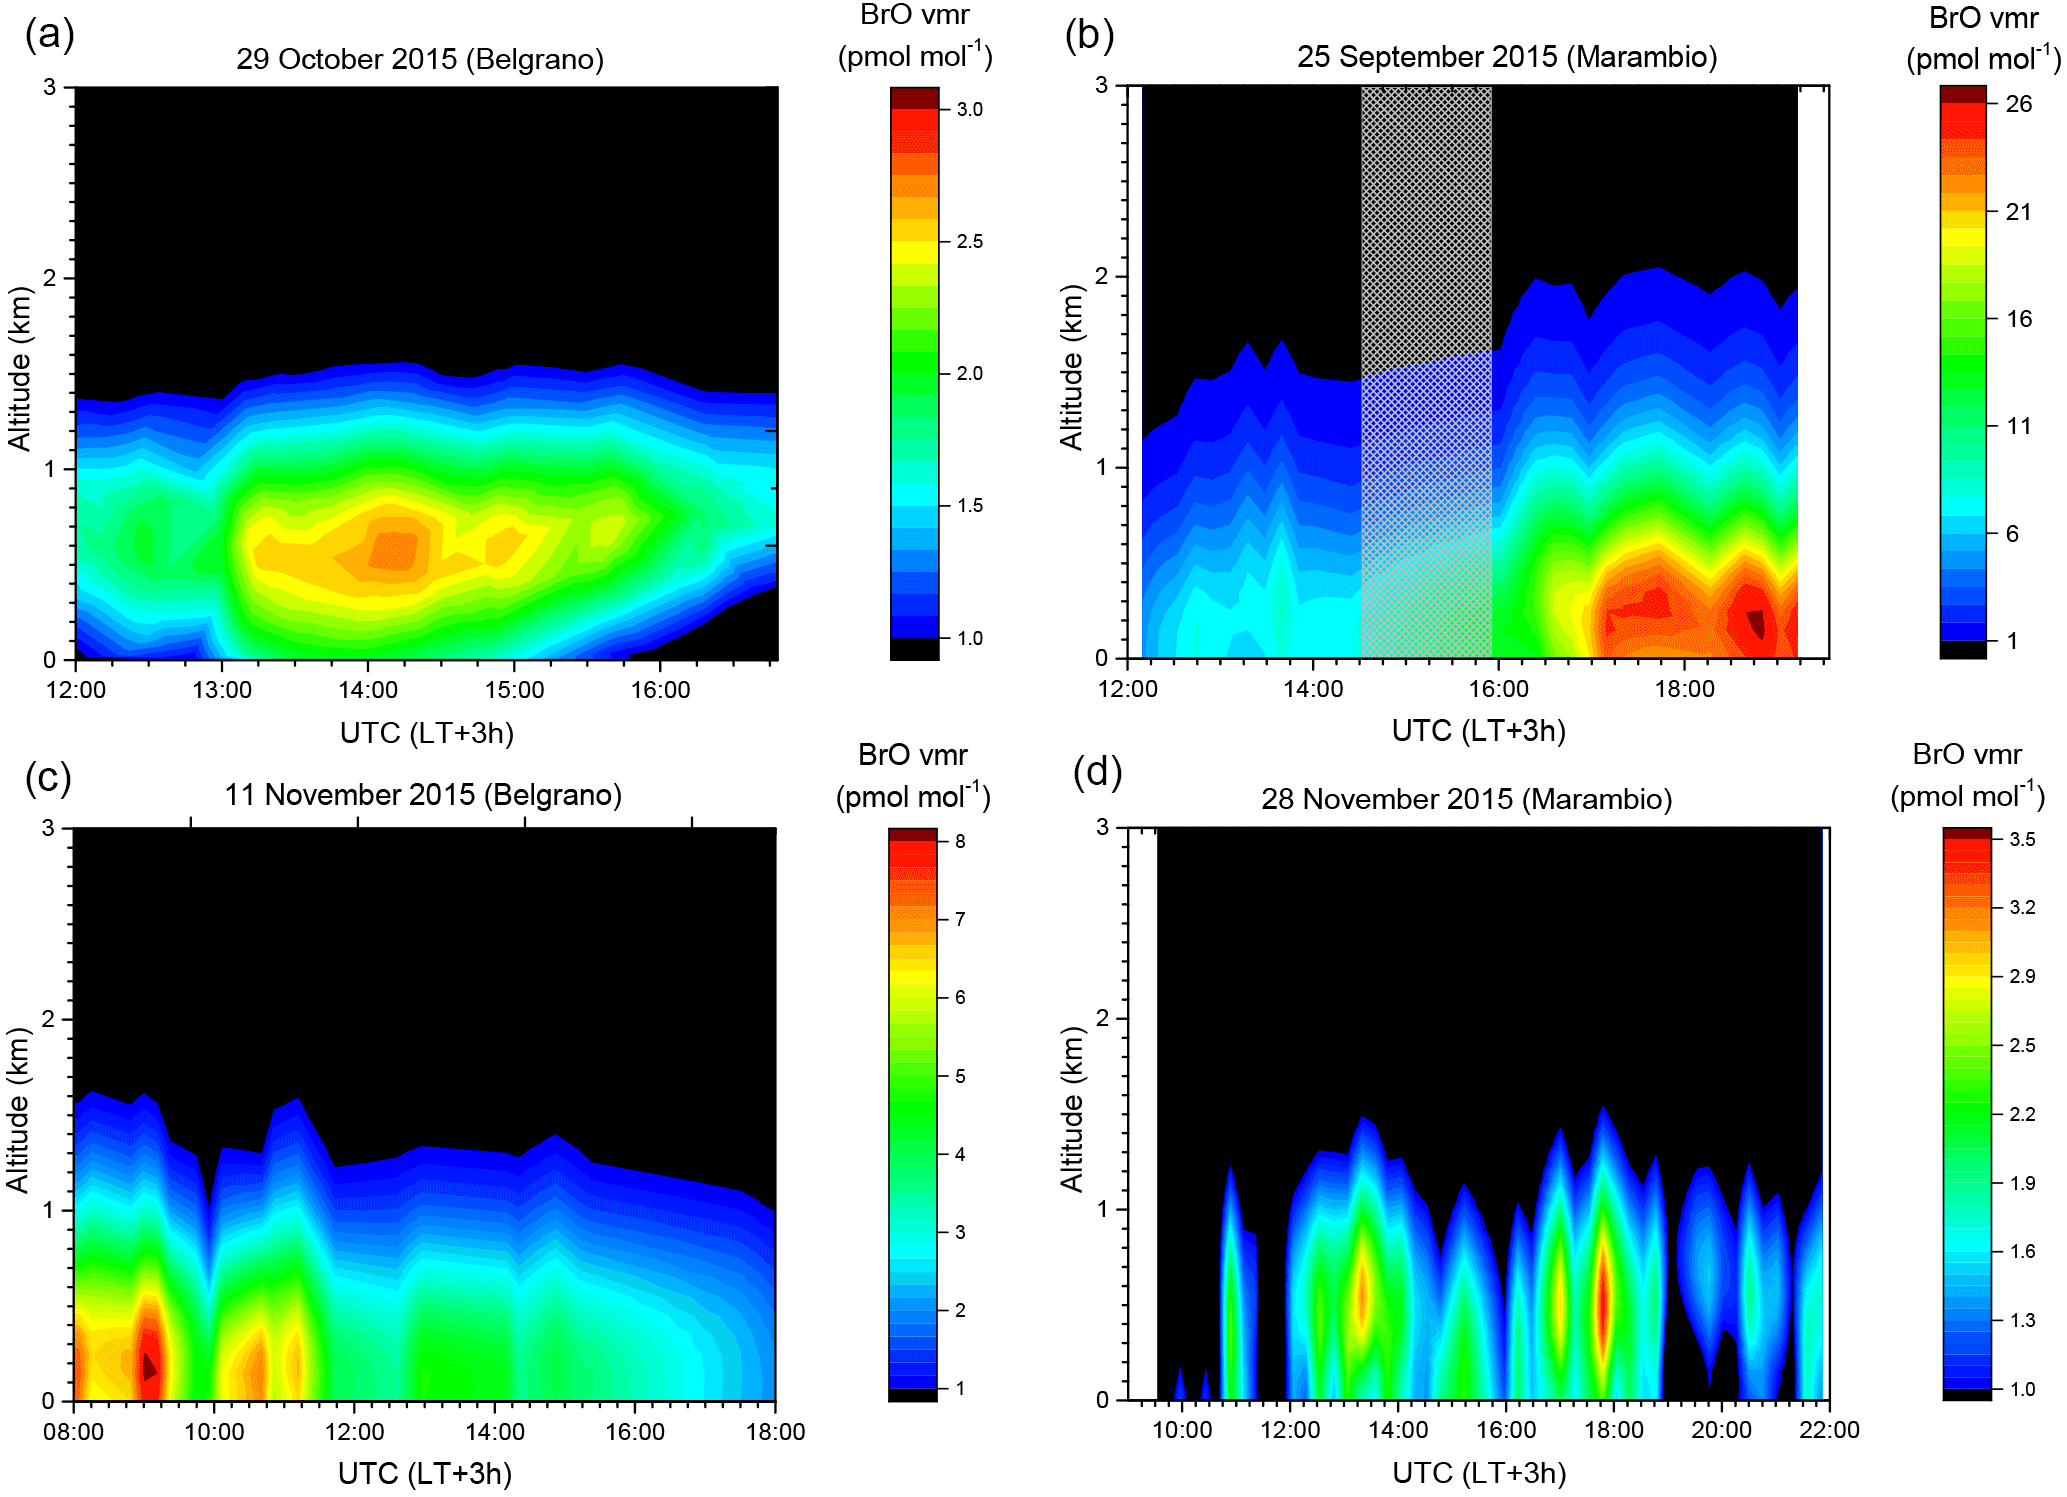
Figure 8Examples of the daily and vertical evolution of BrO at Belgrano (a, c) and at Marambio (b, d). The horizontal scales indicate the time of the day while the vertical scales show the altitude (small ticks indicate the vertical grid of the retrieval). The color code corresponds to the BrO vmr with values below detection limit shown in black. Observations below quality filters are indicated by the grey dashed area. Note the different vmr scales of each day.
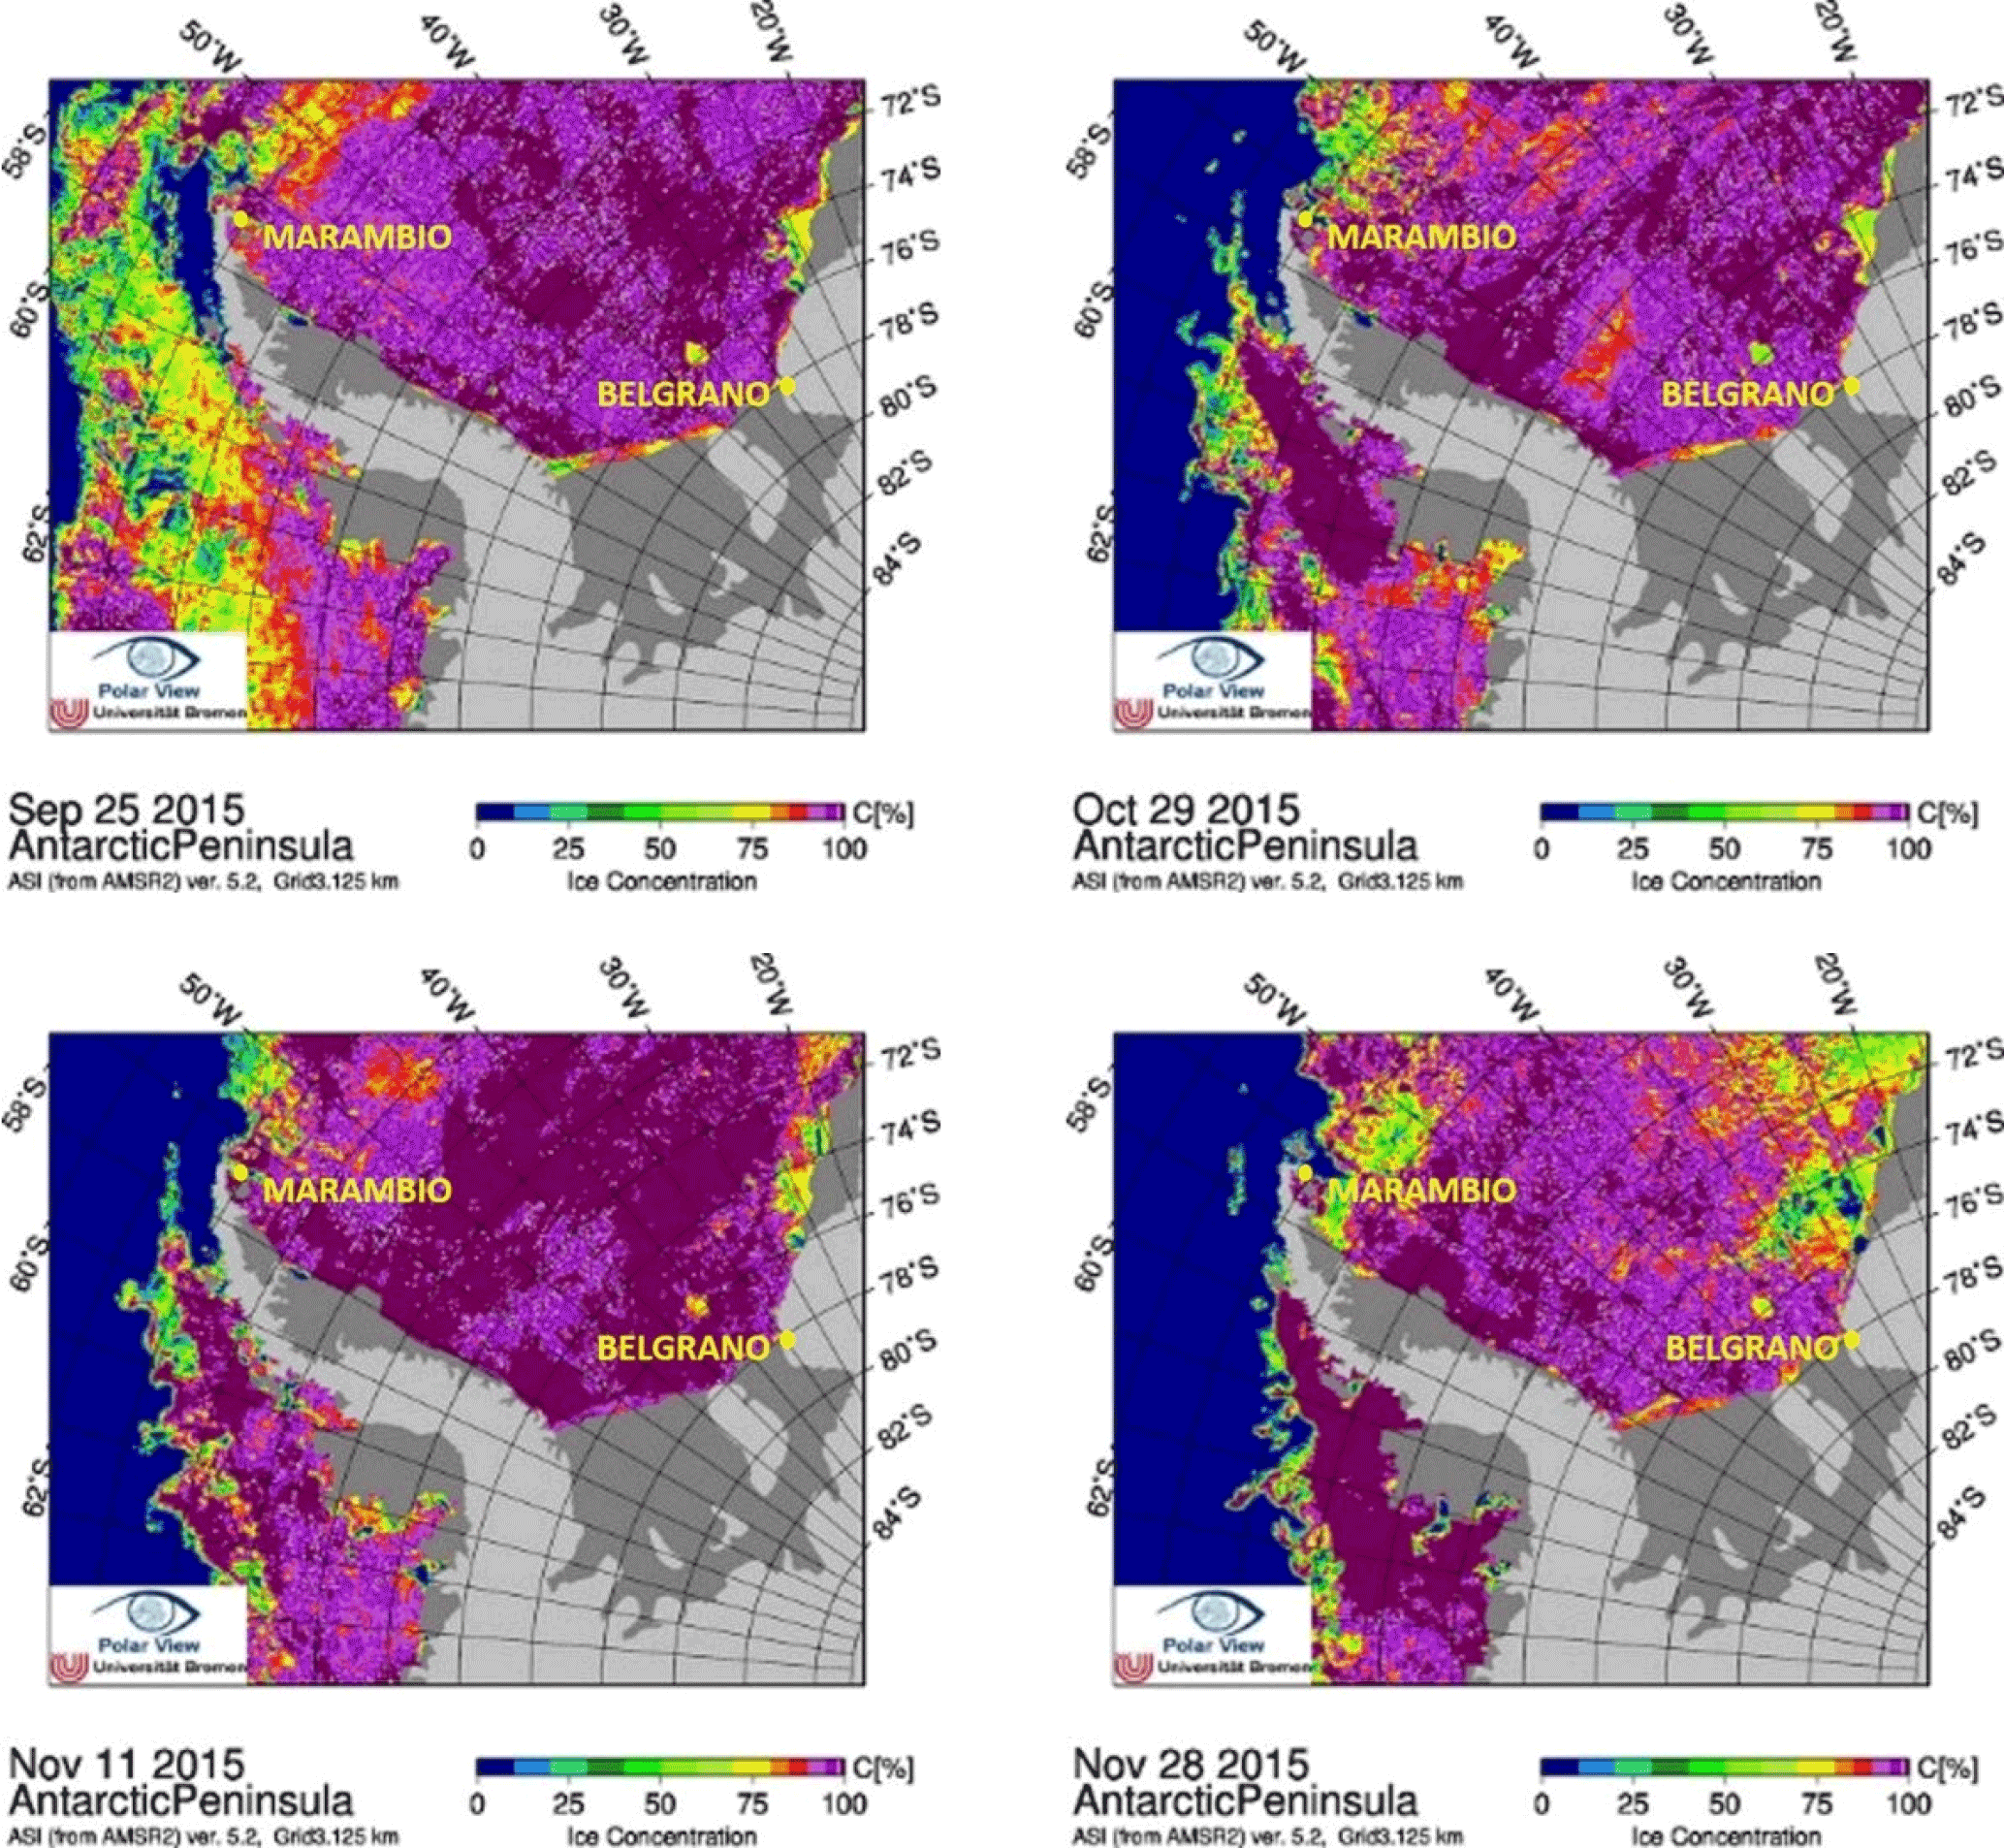
Figure 9Sea ice conditions around the measurement sites during the exemplary days shown in Fig. 8. The maps of the sea ice concentration are downloaded from https://seaice.uni-bremen.de/databrowser/ (last access: 18 May 2018) (Spreen et al., 2008) and are sorted based on the date. The stations of Marambio and Belgrano are marked in yellow in the figures. As can be seen in the figures, in barely 1 month (25 September–29 October) the sea ice surrounding Marambio underwent strong transformation, going from medium–highly concentrated sea ice after winter (upper left figure) with barely permanent open waters to pretty much open ocean (all the sea ice disappearing beyond 50∘ W). During the timeframe of that sea ice transformation, BrO VCD2km peaked at Marambio (Fig. 4). Also, note how the edge of the sea ice near Belgrano transforms towards summer (e.g., lower right).
Figure 10 shows a summary of the BrO vmr vertical profiles observed at each station during the sunlit period of 2015. The median BrO vmr in the lowest layers of the troposphere (< 0.5 km) was similar at both stations (∼ 1.6 pmol mol−1 above the surface) with 75 % of the BrO data below 2.5 pmol mol−1. However, as shown in Fig. 7, the maximum BrO values observed after the polar sunrise (i.e., SZA < 75∘) at Marambio (26.0 ± 0.4 pmol mol−1) were over 3-fold of those observed after the sun rose at Belgrano (see also Fig. 4). This maximum BrO was detected during austral spring at ∼ 200 m of altitude, with a magnitude dependent on the station. This slightly elevated peak of BrO (e.g., Fig. 10), also mentioned above, has already been foreseen by studies accounting for the vertical gradient of the acidity of the aerosols and/or the effect of convection (e.g., von Glasow et al., 2002; Wagner et al., 2007). Also note that, as shown in Fig. 7, while at Belgrano the maximum BrO observed during October–November (8.1 ± 0.6 pmol mol−1) quadrupled its mean value measured during the rest of the sunlit period, the BrO values observed at Marambio just after the sunrise were over 15× higher than the BrO mean values at that station. All this suggests that the halogen reactivity at Marambio is considerably stronger than at Belgrano (see also Sect. 3.3). The BrO vmr ranges reported herein (Fig. 10) are comparable to previous tropospheric Arctic studies (e.g., Tuckermann et al., 1997; Hönninger and Platt, 2002; Prados-Roman et al., 2011; Liao et al., 2012; Peterson et al., 2017; Simpson et al., 2017) and consistent with the few existing Antarctic measurements (e.g., Table 1). By adding the BrO measurements provided in the frame of this work to the few previous ground-based observations performed at Antarctica from different sites, Fig. 11 depicts an updated map of the maximum values of BrO observed in the lower troposphere of Antarctica, pointing once more to its heterogeneity with regard to reactive bromine load. Section 3.3 offers a closer look at this heterogeneity.

Figure 10Vertical profile of the BrO volume mixing ratio in the Antarctic troposphere (2015). The observations performed from Belgrano station are shown in (a) while those performed from Marambio are given in (b). The median BrO values retrieved are indicated in thick blue lines while the shaded blue areas mark the variability range of BrO vmr throughout the sunlit period (SZA < 75∘). The a priori BrO profiles (and error) used in the inversion are shown in dark grey. The vertical grid of the retrieval (100 m) is indicated with the small ticks on the vertical axis. Note the same scales in both plots.
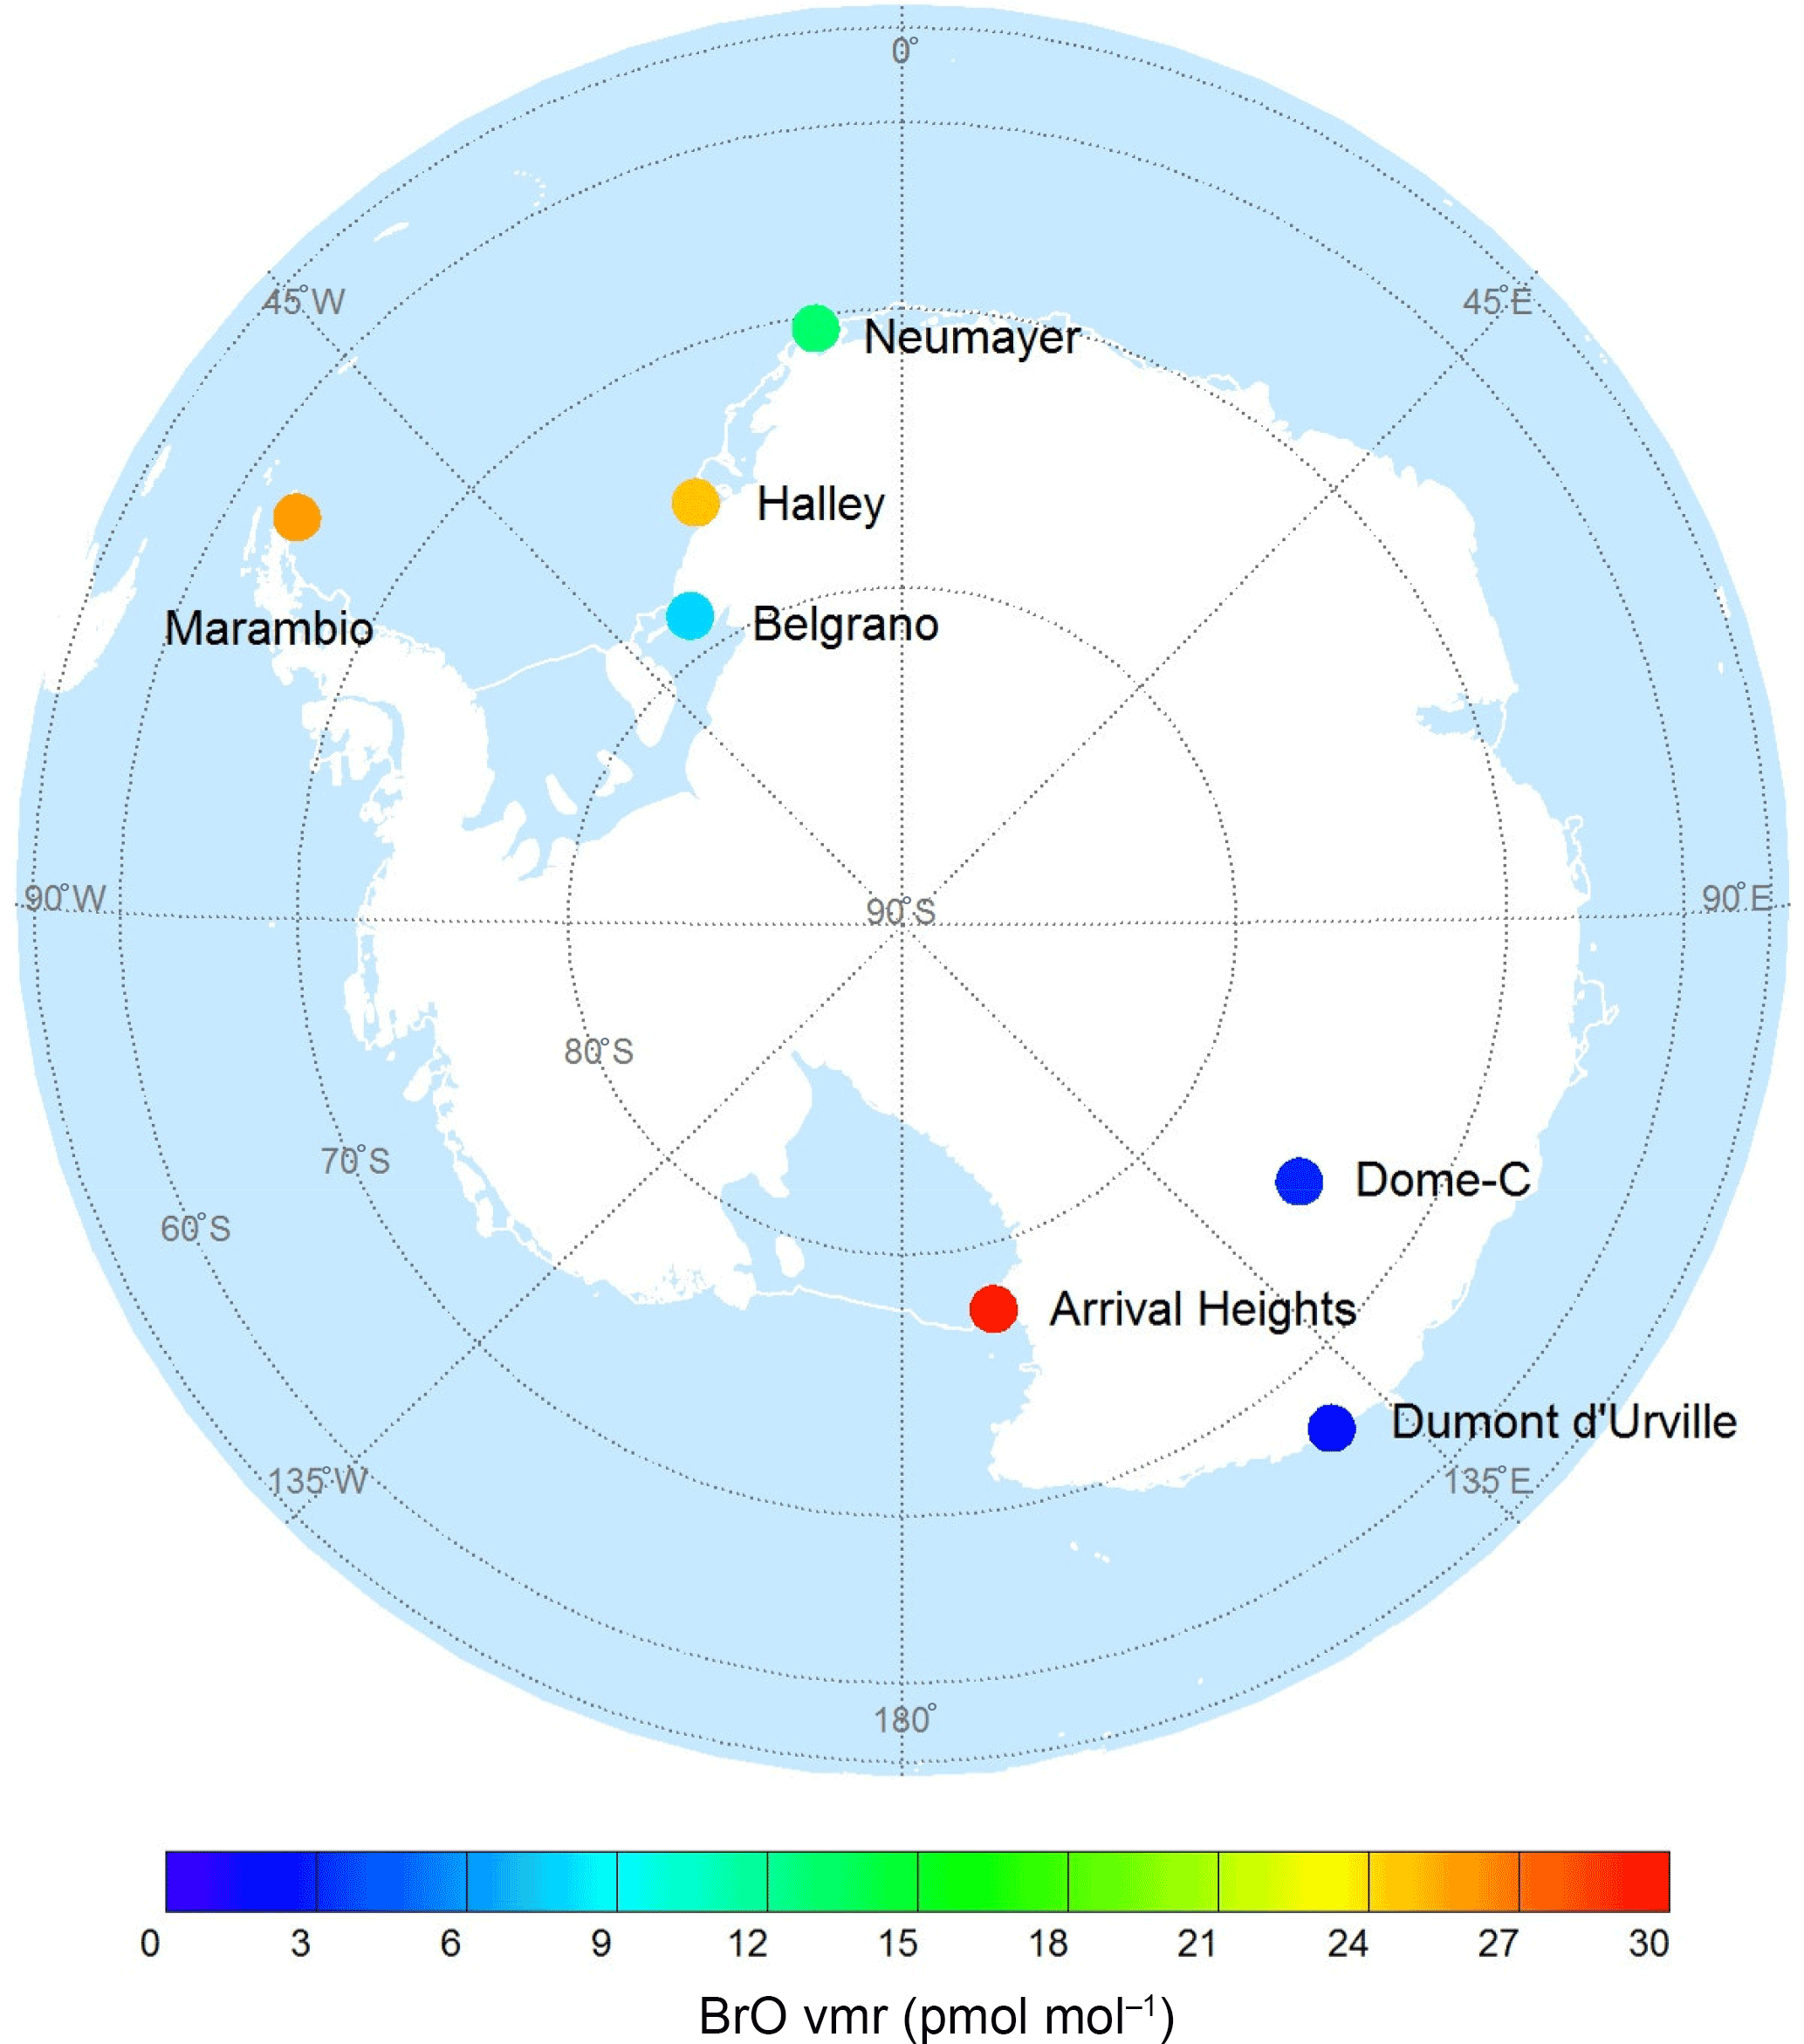
Figure 11Maximum values of BrO vmr reported in the low troposphere of Antarctica as measured with ground-based observations. The different sites where BrO has been reported in the low troposphere are indicated with a colored dot. The color code of each dot (station) refers to the maximum BrO vmr reported in literature (Arrival Heights: Kreher et al., 1997; Neumayer: Frieß et al., 2004; Dumont d'Urville: Grilli et al., 2013; Halley: Roscoe et al., 2014; Dome-C: Frey et al., 2015; Marambio and Belgrano: this work). Note that only the present study provides contemporary observations from different sites. Further details are provided on Table 1.
Overall, the observations presented in this study indicate that the vertical profile of BrO in the Antarctic troposphere descended with altitude (Fig. 10). Note that, in this work, the detection limit of BrO is regarded as the threshold value above which the inferred BrO is significantly higher than the noise of the inversion. In this case, it is defined as double the inversion error (Sect. 2.2.2) and corresponds to a mean value of 1 pmol mol−1. In previous studies of the Antarctic troposphere (e.g., Frieß et al., 2004; Roscoe et al., 2014), the presence of uplifted reactive bromine was suggested. While the work of Frieß et al. (2004) remarked on the presence of uplifted reactive bromine (> 4 km altitude) due to advection processes, in the work of Roscoe et al. (2014), the authors were able to differentiate between two types of BrO vertical profiles: those with only near-surface BrO (centered at 200 m) and those with a double peak (centered at 2 km and near surface). In the work presented here, no uplifted layers (> 2 km) of BrO were detected, although, given the limited vertical information content of the MAX-DOAS observations (Supplement), double-peak types of BrO profiles cannot be ruled out. Although the definition of the height of the boundary layer over ice and snow surfaces (e.g., Anderson and Neff, 2008) is out of the scope of this work, previous studies place the top of the boundary layer in Antarctica between 100 m and 2 km, depending on the boundary layer parameterization, station and time of year (e.g., King et al., 2006; Nygård et al., 2013). Nygård et al. (2013) marked the height of the boundary layer at Marambio between 1 and 1.4 km for the non-winter periods of our interest, and the ozonesondes performed at Belgrano set that height between 1 and 2.5 km at that site (e.g., Parrondo et al., 2014). However, the altitude threshold between the boundary layer and the free troposphere cannot be assessed at the time resolution of our observations. Additional investigations at the two sites would be needed to confirm whether BrO reaches the free troposphere and, given the case, to assess the budget of BrO in the Antarctic free troposphere. Note that previous work on polar environments set BrO below 1.5 and 2 pmol mol−1 in the Arctic and Antarctic free troposphere, respectively (e.g., Frieß et al., 2011; Prados-Roman et al., 2011; Peterson et al., 2017; Hüneke et al., 2017).
In addition to the BrO knowledge gained after this work, the information related to the vertical AEC is also noteworthy (Fig. 7, lower panels), sustaining the particularity of the surroundings at each station. In addition to the aforementioned different aerosol optical thickness at both stations (Sect. 3.1.1), there is also a noticeable difference regarding the seasonality and altitude of the maximum AEC at the two sites. While at Marambio the peak of the AEC appeared close to the surface with a clear maximum extinction observed in November, the observations performed from Belgrano suggest that, at this site, the height of the aerosol layer was much more variable than at Marambio, manifesting once more the relevance of vertically resolved observations within the Antarctic troposphere. As mentioned before, the work of Gómez-Martín et al. (2018) will address these issues.
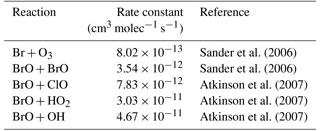
Table 4Rates (k) of reactions provided in Sect. 1 and employed in Sect. 3.3. The temperature used for the calculations was T= 262 K, similar to the mean temperature observed during 2015 at each station (Table 3).
3.3 BrOx in Antarctica
In order to investigate the hinted heterogeneity of the Antarctic lower troposphere regarding reactive bromine (BrOx = Br + BrO), in this section the budget of bromine [Br] is estimated considering the steady state of BrO in a pristine atmosphere with virtually no NO (e.g., Zeng at al., 2006), a concentration of ClO of 1.7 × 10⁸ molec cm−3 (typical of Arctic conditions; e.g., Halfacre et al., 2014), and concentrations of HO2 and OH of 2.2 × 10⁷ and 3.9 × 10⁵ molec cm−3, respectively (mean values observed at the Antarctic station of Halley; e.g., Bloss et al., 2007). Hence, [Br] can be estimated from the observed BrO and O3 concentrations as (e.g., Hausmann and Platt, 1994; Le Bras and Platt, 1995; Zeng et al., 2006; Stephens et al., 2012)
where J represents the rate of photolysis (JBrO= 3.10−2 s−1 for noontime in the polar spring; e.g., Thompson et al., 2015) and k the different reaction rates (Table 4). Since the measurements of O3 were performed near the surface, accordingly only the BrO retrieved in the lowest atmospheric grid (i.e., 100 m) is considered for the calculation of the Br and BrOx budgets at each site. The possible influence of horizontal advection and blowing snow is limited in the data set by applying an upper limit for the wind speed of 6 m s−1. Note that previous studies pointed to 8 m s−1 as the wind threshold for blowing snow (e.g., Jones et al., 2009) and others indicated that the steady-state approximation is valid for wind speeds lower than the 6 m s−1 threshold considered here (e.g., Liao et al., 2012).
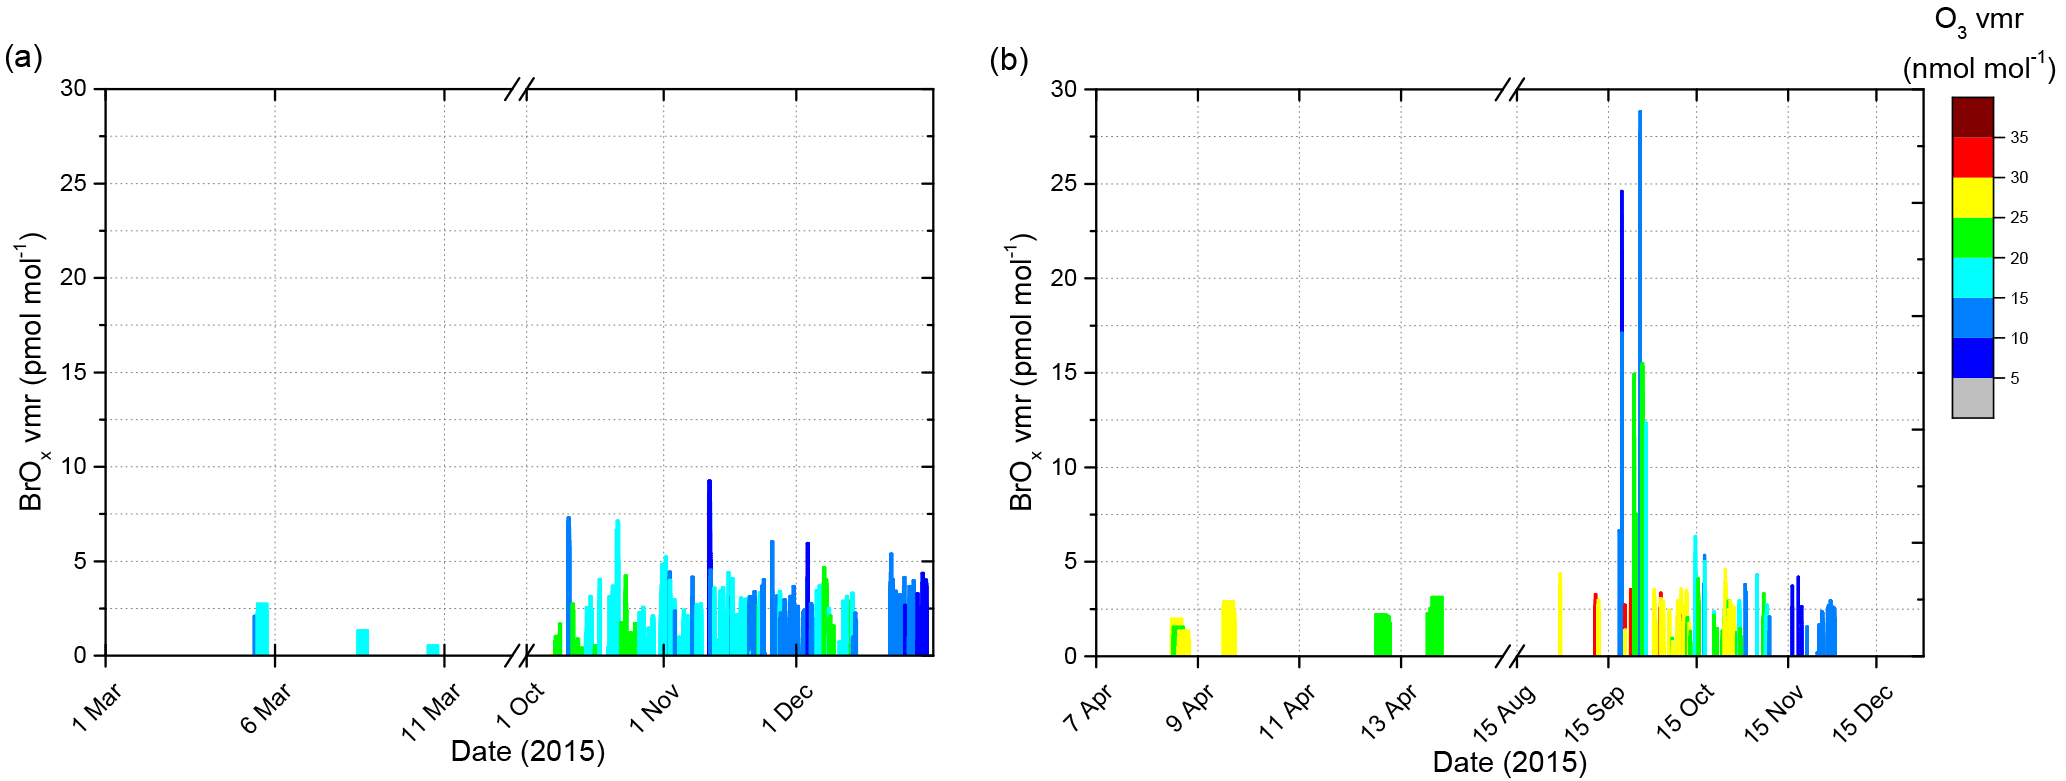
Figure 12Reactive bromine in the low troposphere of Belgrano (a) and Marambio (b) under different O3 regimes. The vertical scale depicts the BrOx (Br + BrO) at each station and the color code refers to the collocated observed O3 vmr. Note that the vertical scale and the color code apply to both figures. Only observations performed under low wind conditions (< 6 m s−1) and a SZA < 75∘ are included.
Based on Eq. (2) and observed near-surface BrO and O3 under low wind conditions (time stamp of the DOAS measurements), Fig. 12 shows the 2015 seasonal evolution of the BrOx budget at each station and Fig. 13 presents the BrO–Br–BrOx statistical analysis in the form of box charts at each site (only data for SZA < 75∘ are considered). Since the kinetic calculations used herein are based on observations performed under low wind conditions, these budgets may be considered to be representative of the surroundings of each station. Figure 12 indicates that, in agreement with Peterson et al. (2015), the presence of reactive bromine at both stations does not only correspond to advected bromine-enriched air masses or blowing snow. As expected from previous polar studies (e.g., Simpson et al., 2007, and references therein) and shown in Fig. 12, the maximum bromine-related reactivity of the troposphere at both stations takes place just after the photolysis is triggered with the polar sunrise. As shown in Fig. 12, this maximum reactivity does occur at a medium O3 regime at both stations (10–25 nmol mol−1). The study of the BrO–Br–BrOx data (Fig. 13) indicates that, during the sunlit period of 2015, the mean budget of BrOx at Belgrano (2.0 pmol mol−1) was ∼ 17 % higher than at Marambio. However, just after sunrise (i.e., SZA < 75∘), the BrOx budget (and hence the oxidizing capacity) at Marambio triplicated the one at Belgrano (e.g., Fig. 12). Estimated values for atomic bromine radicals present in the lowermost troposphere during the sunlit period of 2015 were up to 1.4 pmol mol−1 at Belgrano and up to 3.4 pmol mol−1 at Marambio (Fig. 13). These ranges are in line with previous model studies for Antarctic latitudes (e.g., von Glasow et al., 2004; Saiz-Lopez et al., 2008) and in the lower limit of Arctic model studies (e.g., Thompson et al., 2017).
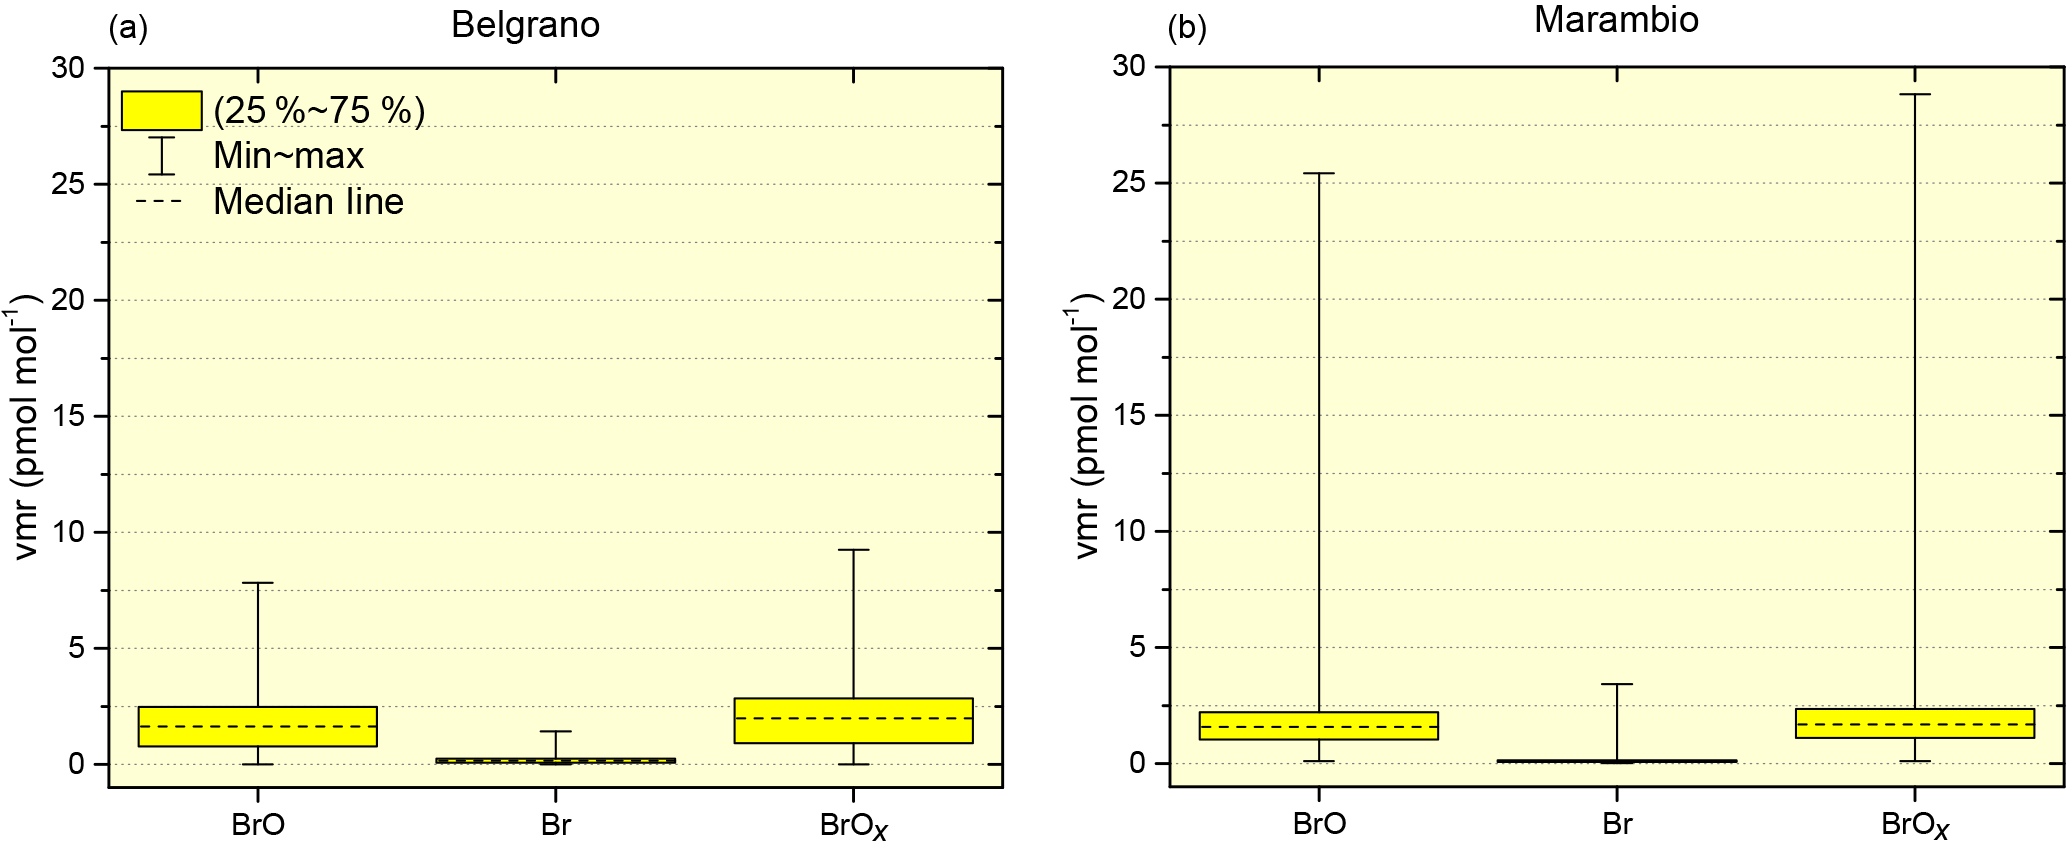
Figure 13Statistical analysis of the reactive bromine and its partitioning estimated at Belgrano (a) and at Marambio (b) during the sunlit period of 2015. The vertical scale, which is the same in both plots, indicates the range of mixing ratios of BrO, Br and BrOx at both stations (SZA < 75∘). The legend applies to both figures, where the whiskers display the range of the maximum and minimum vmr, the boxes in dark yellow provide the vmr ranges of 25–75 % of the data and dashed lines depict the median vmr.
Overall, these estimations indicate that the BrOx partitioning was clearly driven by BrO at both sites, indicating that ozone in general was not fully depleted as confirmed by the observations (Sect. 3.1.2). The evolution of the ratio Br to BrO after the polar sunrise (SZA < 75∘) is shown in Fig. 14 for each site. The initial Br : BrO after dawn was ∼ 0.05 at both stations. Throughout the polar spring, during ODEs, that ratio rose over 4-fold at both sites. The baseline of the Br-to-BrO ratio during the sunlit period could be approximated by an exponential growth with a time constant of about 10 days at Belgrano and 17 days at Marambio (blue line in Fig. 14). Towards summer, that baseline increased up to 0.17 at Belgrano and to 0.10 at Marambio. In the simplified scheme suggested by Eq. (2) and discussed in this section, this Br : BrO increase could be explained by the overall summer decrease in surface O3 compared to springtime (Fig. 6). Additional investigations on the variability and geographical distribution of the bromine source gases throughout the year are suggested to address the bromine pathways in the Antarctic troposphere and their consequences. Bearing in mind this simplified scheme, based on Eq. (1) and the same fixed concentration of ClO as for Eq. (2) (i.e., to typical values in the Arctic environment), the bromine-mediated ozone loss rate can be assessed at each research site for the different BrO and O3 regimes observed at low wind speed. Similar median BrO values measured during 2015 at both stations (1.6 pmol mol−1) yield a similar ozone loss rate of 0.4 nmol mol−1 day−1 at both sites. During the more active bromine season of October–November at Belgrano (e.g., Fig. 12), this rate speeds up to 2.9 nmol mol−1 day−1. During September at Marambio (peak bromine season at that station), the bromine-mediated ozone loss occurs at a much faster rate of between 0.7 and 17.4 nmol mol−1 day−1 (i.e., up to 6× faster than at Belgrano). Former works have estimated that the bromine-driven ozone loss in the polar atmosphere represents 44 % of the total O3 chemical loss (e.g., Liao et al., 2012; Thompson et al., 2017). Therefore, in the sites referred to in this work the shortest (i.e., at highest BrOx and low wind speed) ozone chemical lifetime expected is 2.6 days at Belgrano and 0.7 days at Marambio. Note that the estimations provided herein are limited by the information content inherent in the in situ technique measuring near-surface ozone (i.e., information at the exact instrument's location) compared to the DOAS data, which integrate information several kilometers away from the instrument (depending on scattering conditions) in the horizontal field of view and also in the vertical field of view (see retrieved averaging kernels in the Supplement). Further studies would be needed to confirm these numbers, including investigations on different sources and sinks of bromine radicals in the Antarctic environment, which herein are based on ozone depletion through (only) the BrO–BrO and BrO–ClO channels, dominant however in the polar spring (e.g., Simpson et al., 2007).
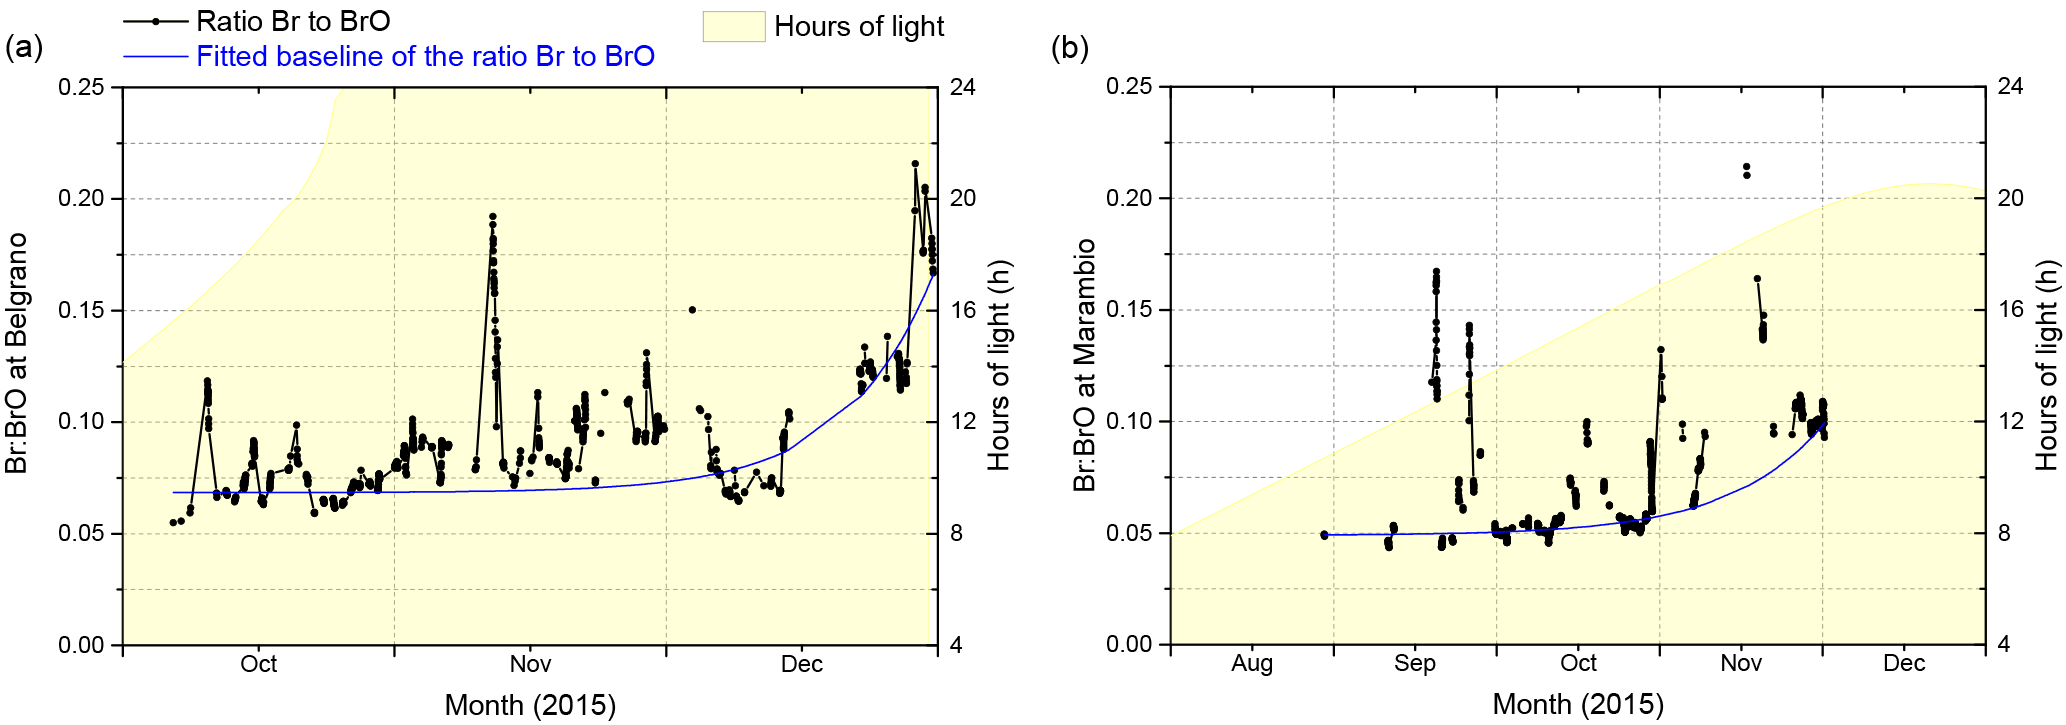
Figure 14Variability in the ratio of Br to BrO after the polar sunrise at Belgrano (a) and Marambio (b). The left axes refer to the Br-to-BrO ratio (same scales on both plots) with the estimated ratios shown in black and the fitted baseline in blue. The right axes on both plots refer to the hours of light at each station. The horizontal scales indicate the time period. Note that only data observed under low wind conditions and with a SZA < 75∘ are considered.
All these kinetic approximations are historically based on conclusions from numerical models and laboratory and campaigned-based observations obtained in the polar regions (mainly the Arctic; e.g., Simpson et al., 2007). Nevertheless, the year-round erratic behavior of the wind speed in Antarctica at each station makes the verification of these estimated (low wind) with observations complicated. However, the exemplary days provided in Fig. 8 with higher BrO at each station (upper figures) may serve the purpose (low wind speeds). For instance, based on the ozone observations (Fig. 6), the rate of O3 depletion measured at Marambio (25 September) was 4.1 nmol mol−1 h−1 and at Belgrano (29 October) it was 0.58 nmol mol−1 h−1. Therefore, as suggested by the above related theoretical calculations, the destruction of surface O3 during the bromine peak season was indeed much faster at Marambio (7× faster than at Belgrano). Considering the mean O3 vmr observed at each station on those days, the observed at Belgrano was 1.3 days while at Marambio it was 10-fold shorter. Note that, as shown in Fig. 8 (upper figures), on those specific days the BrO load at Marambio was also over an order of magnitude higher than at Belgrano. Comparing these observed values with the estimated above from kinetics, the measurements show shorter at both stations (50 % shorter at Belgrano and 18 % shorter at Marambio). Despite the low statistical meaning of this sort of “case study” exercise, the resemblance of the observed and calculated at Marambio suggests that the assumptions made at Marambio's surroundings (e.g., the Br–Cl channel dominates the ozone depletion) is close to reality, which seems not to be the case for Belgrano's surroundings. This reinforces, once more, the need for further long-term investigations for a better understanding of all the processes and key parameters involved in the halogens' pathways in the Antarctic troposphere.
As a result of its remoteness and a more complex logistics compared to the Arctic region, the characterization of the Antarctic troposphere with regard to halogen compounds is still very scarce. Based on contemporary ground-based observations performed at two Antarctic sites during 2015 (new sites as far as tropospheric BrO observations are concerned), this study reports on the presence and vertical distribution of reactive inorganic bromine in the low troposphere at the two sites and discusses the geographical distribution of BrOx. Prior to this study, throughout Antarctica only five sites had reported ground-based observations of BrO in the low troposphere. With the appropriate instrumental setup at the research stations of Belgrano and Marambio, INTA has expanded this net considerably. Moreover, to the authors' knowledge, this is the first study in which these bromine observations are reported simultaneously from two Antarctic stations, making it possible to gain an insight into the geographical distribution of reactive bromine in the Antarctic troposphere. Additionally, through the 2015 MAX-DOAS measurements performed at the two sites, this work presents vertically resolved observations of BrO at two different Antarctic stations with a dedicated inversion scheme for inferring the vertical distribution of BrO throughout the Antarctic troposphere. Furthermore, the aerosol extinction and the surface ozone at the two sites are also provided.
Overall, results show the expected seasonal and daytime variation in BrO related to the photolytic activation of reactive bromine triggered by the polar sunrise at the two sites. However, as referred to above and unlike some former studies, during the sunlit period of 2015 no elevated plumes of BrO were detected above 2 km. Also, this study reports on the positive detection of BrO in the low troposphere (< 2 km) of Antarctica even under low wind conditions, suggesting that the presence of this trace gas is not only related to horizontal advection but also to surface emissions and/or vertical mixing. As for the vertical and geographical distribution of BrO in the lower layers of the troposphere, observations indicate a slightly elevated BrO peak at 200 m at both stations, with a maximum value measured at Marambio considerably higher than the observed value at Belgrano (26 pmol mol−1 vs. 8 pmol mol−1, respectively).
In general, the observations and assessments presented in this work reveal a remarkable geographical heterogeneity of the Antarctic low troposphere with regard to the budget of reactive bromine. Beyond blowing snow, the inferred 3-fold enhancement of BrOx at Marambio compared to Belgrano after the polar sunrise also denotes a geographical heterogeneity on the bromine sources. Marambio sits on a region surrounded by open waters and seasonal sea ice while the dominant sea ice near Belgrano is perennial (Fig. 9). Since bromine explosions are linked to heterogeneous reactions related to sea ice, open leads and snow surfaces, for example, the type of sea ice and its seasonal evolution around each station may be a good starting point to tackle the bromine sources riddle and to investigate how climate change may affect the budget of BrOx in the troposphere of Antarctica. Moreover, the geographical distribution of BrOx and its partitioning addressed in this work also suggest that the reactivity of the troposphere at Marambio is particularly enhanced compared to other Antarctic sites (“hot spot”). Since the presence of BrOx in the polar atmosphere represents a sink for elemental mercury, this study also reveals the tip of the Antarctic Peninsula (Marambio) as a region for potentially enhanced mercury deposition (bioaccumulation) worth looking into. Also, dedicated investigations combining models and collocated observations of halogenated substances (not only BrO), organic compounds, DMS, NOx, HOx, particles and sea ice properties at different stations, for example, could assist a thorough study of the bromine sources and pathways in Antarctica, their geographical distribution and their projections under a changing environment.
In addition to the bromine-related information gained from this work, this study also emphasizes the benefits of deploying quality instrumentation in pristine and remote locations able to provide not only surface but also vertically resolved information. It also shows the scientific benefits of maintaining long-term observations despite the efforts related to sustaining research activities in such a hostile environment. The data provided by the two ground-based instruments presented herein may, for instance, assist the satellite retrievals to distinguish between tropospheric and stratospheric BrO signal and hence facilitate a more accurate assessment of stratospheric BrO and ozone trends, for example. Additionally, they could also serve chemistry–climate models for constraining the chemistry behind processes specifically related to polar regions, areas where global models are often weak (particularly in Antarctica).
Data are available from the corresponding author upon request.
The supplement related to this article is available online at: https://doi.org/10.5194/acp-18-8549-2018-supplement.
The authors declare that they have no conflict of interest.
Sea ice concentration maps are obtained from the website of the Sea Ice
Remote Sensing group of the University of Bremen
(https://seaice.uni-bremen.de/start/data-archive/, last access: 18 May 2018). This work was supported
by the Spanish Ministry of Economy and Competitiveness (MINECO) under the
projects HELADO (CTM2013-41311-P), VIOLIN (CGL2010-20353) and the Spanish
contribution to ORACLE-O3 (POL2006-00382). The authors would also like to
acknowledge the work done by the different technicians at the stations of
Belgrano and Marambio.
Edited by: Anna Jones
Reviewed by: two anonymous referees
Abbatt, J. P. D., Thomas, J. L., Abrahamsson, K., Boxe, C., Granfors, A., Jones, A. E., King, M. D., Saiz-Lopez, A., Shepson, P. B., Sodeau, J., Toohey, D. W., Toubin, C., von Glasow, R., Wren, S. N., and Yang, X.: Halogen activation via interactions with environmental ice and snow in the polar lower troposphere and other regions, Atmos. Chem. Phys., 12, 6237–6271, https://doi.org/10.5194/acp-12-6237-2012, 2012.
Anderson, G. P., Clough, S. A., Kneizys, F. X., Chetwynd, J. H., and Shettle, E. P.: AFGL atmospheric constituent profiles (0–120 km), Tech. rep., AFGL-TR-86-0110, Environemental Research papers No. 954, 1986.
Anderson, P. S. and Neff, W. D.: Boundary layer physics over snow and ice, Atmos. Chem. Phys., 8, 3563–3582, https://doi.org/10.5194/acp-8-3563-2008, 2008.
Ariya, P. A., Amyot, M., Dastoor, A., Deeds, D., Feinberg, A., Kos, G., Poulain, A., Ryjkov, A., Semeniuk, K., Subir, M., and Toyota, K.: Mercury Physicochemical and Biogeochemical Transformation in the Atmosphere and at Atmospheric Interfaces: A Review and Future Directions, Chem. Rev., 115, 3760–3802, https://doi.org/10.1021/cr500667e, 2015.
Asmi, E., Neitola, K., Teinilä, K., Rodriguez, E., Virkkula, A., Backman, J., Bloss, M., Jokela, J., Lihavainen, H., de Leeuw, G., Paatero, J., Aaltonen, V., Mei, M., Gambarte, G., Copes, G., Albertini, M., Pérez Fogwill, G., Ferrara, J., Barlasina, M. E., and Sánchez, R.: Primary sources control the variability of aerosol optical properties in the Antarctic Peninsula, Tellus B, 70, 1414571, https://doi.org/10.1080/16000889.2017.1414571, 2018.
Atkinson, R., Baulch, D. L., Cox, R. A., Crowley, J. N., Hampson, R. F., Hynes, R. G., Jenkin, M. E., Rossi, M. J., and Troe, J.: Evaluated kinetic and photochemical data for atmospheric chemistry: Volume III – gas phase reactions of inorganic halogens, Atmos. Chem. Phys., 7, 981–1191, https://doi.org/10.5194/acp-7-981-2007, 2007.
Barrie, L. A., Bottenheim, J. W., Schnell, R. C., Crutzen, P. J., and Rasmussen, R. A.: Ozone destruction and photochemical reactions at polar sunrise in the lower Arctic atmosphere, Nature, 334, 138–141, https://doi.org/10.1038/334138a0, 1988.
Bloss, W. J., Lee, J. D., Heard, D. E., Salmon, R. A., Bauguitte, S. J.-B., Roscoe, H. K., and Jones, A. E.: Observations of OH and HO2 radicals in coastal Antarctica, Atmos. Chem. Phys., 7, 4171–4185, https://doi.org/10.5194/acp-7-4171-2007, 2007.
Bobrowski, N., Hönninger, G., Galle, B., and Platt, U.: Detection of bromine monoxide in a volcanic plume, Nature, 423, 273–276, https://doi.org/10.1038/nature01625, 2003.
Bogumil, K., Orphal, J., Homann, T., Voigt, S., Spietz, P., Fleischmann, O. C., Vogel, A., Hartmann, M., Bovensmann, H., Frerik, J., and Burrows, J. P.: Measurements of molecular absorption spectra with the SCIAMACHY Pre-Flight Model: Instrument characterization and reference spectra for atmospheric remote sensing in the 230–2380 nm region, J. Photoch. Photobio. A, 157, 167–184, https://doi.org/10.1016/S1010-6030(03)00062-5, 2003.
Bottenheim, J. W., Gallant, A. G., and Brice, K. A.: Measurements of NOy species and O3 at 82∘ N latitude, Geophys. Res. Lett., 13, 113–116, https://doi.org/10.1029/GL013i002p00113, 1986.
Buys, Z., Brough, N., Huey, L. G., Tanner, D. J., von Glasow, R., and Jones, A. E.: High temporal resolution Br2, BrCl and BrO observations in coastal Antarctica, Atmos. Chem. Phys., 13, 1329–1343, https://doi.org/10.5194/acp-13-1329-2013, 2013.
Carpenter, L. J., Reimann, S., Burkholder, J. B., Clerbaux, C., Hall, B. D., Hossaini, R., Laube, J. C., and Yvon-Lewis, S. A.: Ozone-Depleting Substances (ODSs) and Other Gases of Interest to the Montreal Protocol, Chapter 1 in Scientific Assessment of Ozone Depletion: 2014, Global Ozone Research and Monitoring Project – Report No. 55, World Meteorological Organization, Geneva, Switzerland, 2014.
Chance, K. and Spurr, R. J. D.: Ring effect studies; Rayleigh scattering, including molecular parameters for rotational Raman scattering and the Fraunhofer spectrum, Appl. Opt., 36, 5224–5230, https://doi.org/10.1364/AO.36.005224, 1997.
Clémer, K., Van Roozendael, M., Fayt, C., Hendrick, F., Hermans, C., Pinardi, G., Spurr, R., Wang, P., and De Mazière, M.: Multiple wavelength retrieval of tropospheric aerosol optical properties from MAXDOAS measurements in Beijing, Atmos. Meas. Tech., 3, 863–878, https://doi.org/10.5194/amt-3-863-2010, 2010.
Córdoba-Jabonero, C., Andrey-Andrés, J., Gómez, L., Adame, J.A., Sorribas, M., Navarro-Comas, M., Puentedura, O., Cuevas, E., and Gil-Ojeda, M.: Vertical mass impact and features of Saharan dust intrusions derived from ground-based remote sensing in synergy with airborne in-situ measurements, Atmos. Environ., 142, 420–429, https://doi.org/10.1016/j.atmosenv.2016.08.003, 2016.
Custard, K. D., Raso, A. R. W., Shepson, P. B., Staebler, R. M., and Pratt, K. A.: Production and Release of Molecular Bromine and Chlorine from the Arctic Coastal Snowpack, ACS Earth and Space Chemistry, 1, 142–151, https://doi.org/10.1021/acsearthspacechem.7b00014, 2017.
De Mazière, M., Thompson, A. M., Kurylo, M. J., Wild, J., Bernhard, G., Blumenstock, T., Hannigan, J., Lambert, J.-C., Leblanc, T., McGee, T. J., Nedoluha, G., Petropavlovskikh, I., Seckmeyer, G., Simon, P. C., Steinbrecht, W., and Strahan, S.: The Network for the Detection of Atmospheric Composition Change (NDACC): History, status and perspectives, Atmos. Chem. Phys., 18, 4935–4964, https://doi.org/10.5194/acp-18-4935-2018, 2018.
Ehrlich, A.: The Impact of Ice Crystals on Radiative Forcing and Remote Sensing of Arctic Boundary-Layer Mixed-Phase Clouds, PhD thesis, Johannes Gutenberg University Mainz, Germany, available at: https://d-nb.info/994470355/34 (last access: 1 March 2018), 2009.
Fan, S.-M. and Jacob, D. J.: Surface ozone depletion in Arctic spring sustained by bromine reactions on aerosols, Nature, 359, 522–524, https://doi.org/10.1038/359522a0, 1992.
Farman, J. C., Gardiner, B. G., and Shanklin, J. D.: Large losses of total ozone in Antarctica reveal seasonal ClOx/NOx interaction, Nature, 315, 207–210, https://doi.org/10.1038/315207a0, 1985.
Fleischmann, O. C., Hartmann, M., Burrows, J. P., and Orphal, J.: New ultraviolet absorption cross-sections of BrO at atmospheric temperatures measured by time-windowing Fourier transform spectroscopy, J. Photoch. Photobio. A, 168, 117–132, https://doi.org/10.1016/j.jphotochem.2004.03.026, 2004.
Frey, M. M., Roscoe, H. K., Kukui, A., Savarino, J., France, J. L., King, M. D., Legrand, M., and Preunkert, S.: Atmospheric nitrogen oxides (NO and NO2) at Dome C, East Antarctica, during the OPALE campaign, Atmos. Chem. Phys., 15, 7859–7875, https://doi.org/10.5194/acp-15-7859-2015, 2015.
Frieß, U., Hollwedel, J., König-Langlo, G., Wagner, T., and Platt, U.: Dynamics and chemistry of tropospheric bromine explosion events in the Antarctic coastal region, J. Geophys. Res., 109, D06305, https://doi.org/10.1029/2003JD004133, 2004.
Frieß U., Sihler H., Sander R., Pöhler D., Yilmaz S., and Platt U.: The vertical distribution of BrO and aerosols in the Arctic: Measurements by active and passive differential optical absorption spectroscopy, J. Geophys. Res., 116, D00R04, https://doi.org/10.1029/2011JD015938, 2011.
Frieß, U., Klein Baltink, H., Beirle, S., Clémer, K., Hendrick, F., Henzing, B., Irie, H., de Leeuw, G., Li, A., Moerman, M. M., van Roozendael, M., Shaiganfar, R., Wagner, T., Wang, Y., Xie, P., Yilmaz, S., and Zieger, P.: Intercomparison of aerosol extinction profiles retrieved from MAX-DOAS measurements, Atmos. Meas. Tech., 9, 3205–3222, https://doi.org/10.5194/amt-9-3205-2016, 2016.
Gil, M., Puentedura, O., Yela, M., Parrondo, C., Jadhav, D. B., and Thorkelsson, B.: OClO, NO2 and O3 total column observations over Iceland during the winter 1993/94, Geophys. Res. Lett., 23, 3337–3340, https://doi.org/10.1029/96GL03102, 1996.
Gil, M., Yela, M., Gunn, L. N., Richter, A., Alonso, I., Chipperfield, M. P., Cuevas, E., Iglesias, J., Navarro, M., Puentedura, O., and Rodríguez, S.: NO2 climatology in the northern subtropical region: diurnal, seasonal and interannual variability, Atmos. Chem. Phys., 8, 1635–1648, https://doi.org/10.5194/acp-8-1635-2008, 2008.
Grilli, R., Legrand, M., Kukui, A., Mejean, G., Preunkert, S., and Romanini, D.: First investigations of IO, BrO, and NO2 summer atmospheric levels at a coastal East Antarctic site using modelocked cavity enhanced absorption spectroscopy, Geophys. Res. Lett., 40, 791–796, 2013.
Giordano, M. R., Kalnajs, L. E., Avery, A., Goetz, J. D., Davis, S. M., and DeCarlo, P. F.: A missing source of aerosols in Antarctica – beyond long-range transport, phytoplankton, and photochemistry, Atmos. Chem. Phys., 17, 1–20, https://doi.org/10.5194/acp-17-1-2017, 2017.
Gómez-Martín, L., Prados-Roman, C., Puentedura, O., Córdoba-Jabonero, C, Navarro-Comas, M., Ochoa, H., and Yela, Y.: Aerosol extinction profiles retrieved from MAX-DOAS measurements at two Antarctic stations, in preparation, 2018.
Halfacre, J. W., Knepp, T. N., Shepson, P. B., Thompson, C. R., Pratt, K. A., Li, B., Peterson, P. K., Walsh, S. J., Simpson, W. R., Matrai, P. A., Bottenheim, J. W., Netcheva, S., Perovich, D. K., and Richter, A.: Temporal and spatial characteristics of ozone depletion events from measurements in the Arctic, Atmos. Chem. Phys., 14, 4875–4894, https://doi.org/10.5194/acp-14-4875-2014, 2014.
Hausmann, M. and Platt, U.: Spectroscopic measurement of bromine oxide and ozone in the high Arctic during Polar Sunrise Experiment 1992, J. Geophys. Res., 99, 25399, https://doi.org/10.1029/94JD01314, 1994.
Hegg, D. A., Warren, S. G., Grenfell, T. C., Doherty, S. J., and Clarke, A. D.: Sources of light-absorbing aerosol in arctic snow and their seasonal Variation, Atmos. Chem. Phys., 10, 10923–10938, https://doi.org/10.5194/acp-10-10923-2010. 2010.
Helmig, D., Oltmans, S. J., Carlson, D., Lamarque, J. F., Jones, A., Labuschagne, C., Anlauf, K., and Hayden, K.: A review of surface ozone in the polar regions, Atmos. Environ., 41, 5138–5161, https://doi.org/10.1016/j.atmosenv.2006.09.053, 2007.
Hendrick, F., Barret, B., Van Roozendael, M., Boesch, H., Butz, A., De Mazière, M., Goutail, F., Hermans, C., Lambert, J.-C., Pfeilsticker, K., and Pommereau, J.-P.: Retrieval of nitrogen dioxide stratospheric profiles from ground-based zenith-sky UV-visible observations: validation of the technique through correlative comparisons, Atmos. Chem. Phys., 4, 2091–2106, https://doi.org/10.5194/acp-4-2091-2004, 2004.
Hendrick, F., Müller, J.-F., Clémer, K., Wang, P., De Mazière, M., Fayt, C., Gielen, C., Hermans, C., Ma, J. Z., Pinardi, G., Stavrakou, T., Vlemmix, T., and Van Roozendael, M.: Four years of ground-based MAX-DOAS observations of HONO and NO2 in the Beijing area, Atmos. Chem. Phys., 14, 765–781, https://doi.org/10.5194/acp-14-765-2014, 2014.
Hönninger, G. and Platt, U.: Observations of BrO and its vertical distribution during surface ozone depletion at Alert, Atmos. Environ., 36, 2481–2489, 2002.
Hönninger, G., von Friedeburg, C., and Platt, U.: Multi axis differential optical absorption spectroscopy (MAX-DOAS), Atmos. Chem. Phys., 4, 231–254, https://doi.org/10.5194/acp-4-231-2004, 2004.
Hüneke, T., Aderhold, O.-A., Bounin, J., Dorf, M., Gentry, E., Grossmann, K., Grooß, J.-U., Hoor, P., Jöckel, P., Kenntner, M., Knapp, M., Knecht, M., Lörks, D., Ludmann, S., Matthes, S., Raecke, R., Reichert, M., Weimar, J., Werner, B., Zahn, A., Ziereis, H., and Pfeilsticker, K.: The novel HALO mini-DOAS instrument: inferring trace gas concentrations from airborne UV/visible limb spectroscopy under all skies using the scaling method, Atmos. Meas. Tech., 10, 4209–4234, https://doi.org/10.5194/amt-10-4209-2017, 2017.
Jones, A. E., Anderson, P. S., Begoin, M., Brough, N., Hutterli, M. A., Marshall, G. J., Richter, A., Roscoe, H. K., and Wolff, E. W.: BrO, blizzards, and drivers of polar tropospheric ozone depletion events, Atmos. Chem. Phys., 9, 4639–4652, https://doi.org/10.5194/acp-9-4639-2009, 2009.
Jones, A. E., Wolff, E. W., Brough, N., Bauguitte, S. J.-B., Weller, R., Yela, M., Navarro-Comas, M., Ochoa, H. A., and Theys, N.: The spatial scale of ozone depletion events derived from an autonomous surface ozone network in coastal Antarctica, Atmos. Chem. Phys., 13, 1457–1467, https://doi.org/10.5194/acp-13-1457-2013, 2013.
King, J. C., Argentini, S. A., and Anderson, P. S.: Contrast between the summertime surface energy balance and boundary layer structure at Dome C and Halley stations, Antarctica, J. Geophys. Res., 111, D02105, https://doi.org/10.1029/2005JD006130, 2006.
Kreher, K., Johnston, P. V., Wood, S. W., Nardi, B., and Platt, U.: Ground-based measurements of tropospheric and stratospheric BrO at Arrival Heights, Antarctica, Geophys. Res. Lett., 24, 3021–3024, https://doi.org/10.1029/97GL02997, 1997.
Kromminga, H., Orphal, J., Spietz, P., Voigt, S., and Burrows, J. P.: New measurements of OClO absorption cross sections in the 325-435 nm and their temperature dependence between 213-293 K, J. Photoch. Photobio. A., 157, 149–160, https://doi.org/10.1016/S1010-6030(03)00071-6, 2003.
Le Bras, G. and Platt, U.: A possible mechanism for combined chlorine and bromine catalyzed destruction of tropospheric ozone in the Arctic, Geophys. Res. Lett., 22, 599–602, https://doi.org/10.1029/94GL03334, 1995.
Legrand, M., Preunkert, S., Savarino, J., Frey, M. M., Kukui, A., Helmig, D., Jourdain, B., Jones, A. E., Weller, R., Brough, N., and Gallée, H.: Inter-annual variability of surface ozone at coastal (Dumont d'Urville, 2004–2014) and inland (Concordia, 2007–2014) sites in East Antarctica, Atmos. Chem. Phys., 16, 8053–8069, https://doi.org/10.5194/acp-16-8053-2016, 2016.
Liao, J., Sihler, H., Huey, L. G., Neuman, J. A., Tanner, D. J., Friess, U., Platt, U., Flocke, F. M., Orlando, J. J., Shepson, P. B., Beine, H. J., Weinheimer, A. J., Sjostedt, S. J., Nowak, J. B., Knapp, D. J., Staebler, R. M., Zheng, W., Sander, R., Hall, S. R., and Ullmann, K.: A comparison of Arctic BrO measurements by chemical ionization mass spectrometry and long pathdifferential optical absorption spectroscopy, J. Geophys. Res., 116, D00R02, https://doi.org/10.1029/2010JD014788, 2011.
Liao, J., Huey, L., Tanner, D., Flocke, F., Orlando, J., Neuman, J., Nowak, J., Weinheimer, A., Hall, S., Smith, J., Fried, A., Staebler, R., Wang, Y., Koo, J.-H., Cantrell, C., Weibring, P., Walega, J., Knapp, D., Shepson, P., and Stephens, C.: Observations of inorganic bromine (HOBr, BrO, and Br2) speciation at Barrow, Alaska, in spring 2009, J. Geophys. Res., 117, D00R16, https://doi.org/10.1029/2011JD016641, 2012.
Meller, R. and Moortgat, G. K.: Temperature dependence of the absorption cross sections of formaldehyde between 223 and 323K in the wavelength range 225–375 nm, J. Geophys. Res., 105, 7089–7101, https://doi.org/10.1029/1999JD901074, 2000.
Minikin, A., M. Legrand, J. Hall, D. Wagenbach, C. Kleefeld, E. Wolff, E. C. Pasteur, and Ducroz, F.: Sulfur-containing species (sulfate and methanesulfonate) in coastal Antarctic aerosol and precipitation, J. Geophys. Res., 103, 10975–10990, https://doi.org/10.1029/98JD00249, 1998.
Molina, M. J. and Rowland, F. S.: Stratospheric sink for chlorofluoromethanes: chlorine atom catalysed destruction of ozone, Nature, 249, 810–812, https://doi.org/10.1038/249810a0, 1974.
Nygård, T., Valkonen, T., and Vihma, T.: Antarctic Low-Tropopause Humidity Inversions: 10-yr Climatology, J. Climate, 26, 5205–5219, https://doi.org/10.1175/JCLI-D-12-00446.1, 2013.
Oltmans, S. J., Schnell, R. C., Sheridan, P. J., Peterson, R. E., Li, S.-M., Winchester, J. W., Tans, P. P., Sturges, W. T., Kahl, J. D., and Barrie, L. A.: Seasonal surface ozone and filterable bromine relationship in the high Arctic, Atmos. Environ., 23, 2431–2441, 1989.
Parrondo, M. C., Gil, M., Yela, M., Johnson, B. J., and Ochoa, H. A.: Antarctic ozone variability inside the polar vortex estimated from balloon measurements, Atmos. Chem. Phys., 14, 217–229, https://doi.org/10.5194/acp-14-217-2014, 2014.
Peters, E., Pinardi, G., Seyler, A., Richter, A., Wittrock, F., Bösch, T., Van Roozendael, M., Hendrick, F., Drosoglou, T., Bais, A. F., Kanaya, Y., Zhao, X., Strong, K., Lampel, J., Volkamer, R., Koenig, T., Ortega, I., Puentedura, O., Navarro-Comas, M., Gómez, L., Yela González, M., Piters, A., Remmers, J., Wang, Y., Wagner, T., Wang, S., Saiz-Lopez, A., García-Nieto, D., Cuevas, C. A., Benavent, N., Querel, R., Johnston, P., Postylyakov, O., Borovski, A., Elokhov, A., Bruchkouski, I., Liu, H., Liu, C., Hong, Q., Rivera, C., Grutter, M., Stremme, W., Khokhar, M. F., Khayyam, J., and Burrows, J. P.: Investigating differences in DOAS retrieval codes using MAD-CAT campaign data, Atmos. Meas. Tech., 10, 955–978, https://doi.org/10.5194/amt-10-955-2017, 2017.
Peterson, P. K., Simpson, W. R., Pratt, K. A., Shepson, P. B., Frieß, U., Zielcke, J., Platt, U., Walsh, S. J., and Nghiem, S. V.: Dependence of the vertical distribution of bromine monoxide in the lower troposphere on meteorological factors such as wind speed and stability, Atmos. Chem. Phys., 15, 2119–2137, https://doi.org/10.5194/acp-15-2119-2015, 2015.
Peterson, P. K., Pöhler, D., Sihler, H., Zielcke, J., General, S., Frieß, U., Platt, U., Simpson, W. R., Nghiem, S. V., Shepson, P. B., Stirm, B. H., Dhaniyala, S., Wagner, T., Caulton, D. R., Fuentes, J. D., and Pratt, K. A.: Observations of bromine monoxide transport in the Arctic sustained on aerosol particles, Atmos. Chem. Phys., 17, 7567–7579, https://doi.org/10.5194/acp-17-7567-2017, 2017.
Platt, U. and Hönninger, G.: The role of halogen species in the troposphere, Chemosphere, 52, 325–338, https://doi.org/10.1016/S0045-6535(03)00216-9, 2003.
Platt, U. and Janssen, C.: Observation and role of the free radicals NO3, ClO, BrO and IO in the troposphere, Faraday Discuss., 100, 175–198, https://doi.org/10.1039/FD9950000175, 1995.
Platt, U. and Lehrer, E.: Arctic Tropospheric Ozone Chemistry (ARCTOC) – Results from field, laboratory and modelling studies, Final Report of the EU-Project EV5VCT93-0318, available at: http://bookshop.europa.eu/en/arctic-tropospheric-ozone-chemistry-pbCGNA17783/ (last access: 28 August 2017), 1997.
Platt, U. and Stutz, J.: Differential Optical Absorption Spectroscopy (DOAS), Principle and Applications, ISBN: 3-340-21193-4, Springer Verlag, Heidelberg, 2008.
Pöhler, D., Vogel, L., Frieß, U., and Platt, U.: Observation of halogen species in the Amundsen Gulf, Arctic, by active long-path differential optical absorption spectroscopy, P. Natl. Acad. Sci. USA, 107, 6582–6587, https://doi.org/10.1073/pnas.0912231107, 2010.
Prados-Roman, C., Butz, A., Deutschmann, T., Dorf, M., Kritten, L., Minikin, A., Platt, U., Schlager, H., Sihler, H., Theys, N., Van Roozendael, M., Wagner, T., and Pfeilsticker, K.: Airborne DOAS limb measurements of tropospheric trace gas profiles: case studies on the profile retrieval of O4 and BrO, Atmos. Meas. Tech., 4, 1241–1260, https://doi.org/10.5194/amt-4-1241-2011, 2011.
Prados-Roman, C., Cuevas, C. A., Hay, T., Fernandez, R. P., Mahajan, A. S., Royer, S.-J., Galí, M., Simó, R., Dachs, J., Großmann, K., Kinnison, D. E., Lamarque, J.-F., and Saiz-Lopez, A.: Iodine oxide in the global marine boundary layer, Atmos. Chem. Phys., 15, 583–593, https://doi.org/10.5194/acp-15-583-2015, 2015.
Pratt, K. A., Custard, K. D., Shepson, P. B., Douglas, T. A., Pöhler, D., General, S., Zielcke, J., Simpson, W. R., Platt, U., Tanner, D. J., Huey, L. G., Carlsen, M., and Stirm, B. H.: Photochemical production of molecular bromine in Arctic surface snowpacks, Nat. Geosci., 6, 351–356, https://doi.org/10.1038/ngeo1779, 2013.
Puentedura, O., Gil, M., Saiz-Lopez, A., Hay, T., Navarro-Comas, M., Gómez-Pelaez, A., Cuevas, E., Iglesias, J., and Gomez, L.: Iodine monoxide in the north subtropical free troposphere, Atmos. Chem. Phys., 12, 4909–4921, https://doi.org/10.5194/acp-12-4909-2012, 2012.
Richter, A., Wittrock, F., Ladstätter-Weißenmayer, A., and Burrows, J.: GOME measurements of stratospheric and tropospheric BrO, Adv. Space Res., 29, 1667–1672, https://doi.org/10.1016/S0273-1177(02)00123-0, 2002.
Rodgers, C.: Inverse methods for atmospheric sounding,World Scientific, Singapore, New Jersey, London, Hongkong, 2000.
Roscoe, H., Brough, N., Jones, A., Wittrock, F., Richter, A., Roozendael, M. V., and Hendrick, F.: Characterisation of vertical BrO distribution during events of enhanced tropospheric BrO in Antarctica, from combined remote and insitu measurements, J. Quant. Spectrosc. Ra., 138, 70–81, https://doi.org/10.1016/j.jqsrt.2014.01.026, 2014.
Roscoe, H. K., Kreher, K., and Friess, U.: Ozone loss episodes in the free Antarctic troposphere, suggesting a possible climate feedback, Geophys. Res. Lett., 28, 2911–2914, https://doi.org/10.1029/2000GL012583, 2001.
Saiz-Lopez, A., Mahajan, A. S., Salmon, R. A., Bauguitte, S. J. B., Jones, A. E., Roscoe, H. K., and Plane, J. M. C.: Boundary Layer Halogens in Coastal Antarctica, Science, 317, 348–351, https://doi.org/10.1126/science.1141408, 2007a.
Saiz-Lopez, A., Chance, K., Liu, X., Kurosu, T. P., and Sander, S. P.: First observations of iodine oxide from space, Geophys. Res. Lett., 34, L12812, https://doi.org/10.1029/2007GL030111, 2007b.
Saiz-Lopez, A., Plane, J. M. C., Mahajan, A. S., Anderson, P. S., Bauguitte, S. J.-B., Jones, A. E., Roscoe, H. K., Salmon, R. A., Bloss, W. J., Lee, J. D., and Heard, D. E.: On the vertical distribution of boundary layer halogens over coastal Antarctica: implications for O3, HOx, NOx and the Hg lifetime, Atmos. Chem. Phys., 8, 887–900, https://doi.org/10.5194/acp-8-887-2008, 2008.
Sander, S. P., Golden, D., Kurylo, M., Moortgat, G.,Wine, P., Ravishankara, A., Kolb, C., Molina, M., Finlayson-Pitts, B., and Huie, R.: Chemical kinetics and photochemical data for use in atmospheric studies evaluation number 15, available at: http://hdl.handle.net/2014/41648 (last access: 30 November 2017), 2006.
Savoie, D., Prospero, J. M., Larsen, R. J., Huang, F., Izaguirre, M. A., Huang, T., Snowdon, T. H., Custals, L., and Sanderson, C. G.: Nitrogen and sulfur species in Antarctic aerosols at Mawson, Palmer Station, and Marsh (King George Island), J. Atmos. Chem., 17, 95–122, 1993.
Schofield, R., Johnston, P. V., Thomas, A., Kreher, K., Connor, B. J., Wood, S., Shooter, D., Chipperfield, M. P., Richter, A., von Glasow, R., and Rodgers, C. D.: Tropospheric and stratospheric BrO columns over Arrival Heights, Antarctica, 2002, J. Geophys. Res.-Atmos., 111, D22310, https://doi.org/10.1029/2005JD007022, 2006.
Simpson, W. R., von Glasow, R., Riedel, K., Anderson, P., Ariya, P., Bottenheim, J., Burrows, J., Carpenter, L. J., Frieß, U., Goodsite, M. E., Heard, D., Hutterli, M., Jacobi, H.-W., Kaleschke, L., Neff, B., Plane, J., Platt, U., Richter, A., Roscoe, H., Sander, R., Shepson, P., Sodeau, J., Steffen, A., Wagner, T., and Wolff, E.: Halogens and their role in polar boundary-layer ozone depletion, Atmos. Chem. Phys., 7, 4375–4418, https://doi.org/10.5194/acp-7-4375-2007, 2007.
Simpson, W. R., Brown, S. S., Saiz-Lopez, A., Thornton, J. A., and von Glasow, R.: Tropospheric Halogen Chemistry: Sources, Cycling, and Impacts, Chem. Rev., 115, 4035–4062, https://doi.org/10.1021/cr5006638, 2015.
Simpson, W. R., Peterson, P. K., Frieß, U., Sihler, H., Lampel, J., Platt, U., Moore, C., Pratt, K., Shepson, P., Halfacre, J., and Nghiem, S. V.: Horizontal and vertical structure of reactive bromine events probed by bromine monoxide MAX-DOAS, Atmos. Chem. Phys., 17, 9291–9309, https://doi.org/10.5194/acp-17-9291-2017, 2017.
Solomon, S.: Stratospheric ozone depletion: A review of concepts and history, Rev. Geophys., 37, 275–316, https://doi.org/10.1029/1999RG900008, 1999.
Spreen, G., Kaleschke, L., and Heygster, G.: Sea ice remote sensing using AMSR-E 89 GHz channels, J. Geophys. Res., 113, C02S03, https://doi.org/10.1029/2005JC003384, 2008.
Spurr, R.: LIDORT and VLIDORT: linearized pseudo-spherical scalar and vector discrete ordinate radiative transfer models for use in remote sensing retrieval problems, in: Light Scattering Reviews 3, Springer Praxis Books, edited by: Kokhanovsky, A., vol. 7., Springer, Berlin Heidelberg, 229–275, 2008.
Steffen, A., Douglas, T., Amyot, M., Ariya, P., Aspmo, K., Berg, T., Bottenheim, J., Brooks, S., Cobbett, F., Dastoor, A., Dommergue, A., Ebinghaus, R., Ferrari, C., Gardfeldt, K., Goodsite, M. E., Lean, D., Poulain, A. J., Scherz, C., Skov, H., Sommar, J., and Temme, C.: A synthesis of atmospheric mercury depletion event chemistry in the atmosphere and snow, Atmos. Chem. Phys., 8, 1445–1482, https://doi.org/10.5194/acp-8-1445-2008, 2008.
Stephens, C. R., Shepson, P. B., Steffen, A., Bottenheim, J. W., Liao, J., Huey, L. G., Apel, E., Weinheimer, A., Hall, S. R., and Cantrell, C.: The relative importance of chlorine and bromine radicals in the oxidation of atmospheric mercury at Barrow, Alaska, J. Geophys. Res., 117, D00R11, https://doi.org/10.1029/2011JD016649, 2012.
Thalman, R. and Volkamer, R.: Temperature dependent absorption cross-sections of O2-O2 collision pairs between 340 and 630 nm at atmospherically relevant pressure, Phys. Chem. Chem. Phys., 15, 15371–15381, https://doi.org/10.1039/C3CP50968K, 2013.
Theys, N., Van Roozendael, M., Hendrick, F., Yang, X., De Smedt, I., Richter, A., Begoin, M., Errera, Q., Johnston, P. V., Kreher, K., and De Mazière, M.: Global observations of tropospheric BrO columns using GOME-2 satellite data, Atmos. Chem. Phys., 11, 1791–1811, https://doi.org/10.5194/acp-11-1791-2011, 2011.
Thompson, C. R., Shepson, P. B., Liao, J., Huey, L. G., Apel, E. C., Cantrell, C. A., Flocke, F., Orlando, J., Fried, A., Hall, S. R., Hornbrook, R. S., Knapp, D. J., Mauldin III, R. L., Montzka, D. D., Sive, B. C., Ullmann, K., Weibring, P., and Weinheimer, A.: Interactions of bromine, chlorine, and iodine photochemistry during ozone depletions in Barrow, Alaska, Atmos. Chem. Phys., 15, 9651–9679, https://doi.org/10.5194/acp-15-9651-2015, 2015.
Thompson, C. R., Shepson, P. B., Liao, J., Huey, L. G., Cantrell, C., Flocke, F., and Orlando, J.: Bromine atom production and chain propagation during springtime Arctic ozone depletion events in Barrow, Alaska, Atmos. Chem. Phys., 17, 3401–3421, https://doi.org/10.5194/acp-17-3401-2017, 2017.
Toyota, K., McConnell, J. C., Staebler, R. M., and Dastoor, A. P.: Air–snowpack exchange of bromine, ozone and mercury in the springtime Arctic simulated by the 1-D model PHANTAS – Part 1: In-snow bromine activation and its impact on ozone, Atmos. Chem. Phys., 14, 4101–4133, https://doi.org/10.5194/acp-14-4101-2014, 2014.
Tuckermann, M., Ackermann, R., Gölz, C., Lorenzen-Schmidt, H., Senne, T., Stutz, J., Trost, B., Unold, W., and Platt, U.: DOAS observation of halogen radical-catalysed arctic boundary layer ozone destruction during the ARCTOC-campaigns 1995 and 1996 in Ny-Ålesund, Spitsbergen, Tellus B, 49, 533–555, https://doi.org/10.1034/j.1600-0889.49.issue5.9.x, 1997.
Vandaele, A., Hermans, C., Simon, P., Carleer, M., Colin, R., Fally, S., Mérienne, M., Jenouvrier, A., and Coquart, B.: Measurements of the NO2 absorption cross-section from 42 000 cm−1 to 10 000 cm−1 (238–1000 nm) at 220 K and 294 K, J. Quant. Spectrosc. Ra., 59, 171–184, https://doi.org/10.1016/S0022-4073(97)00168-4, 1998.
Vogt, R., Crutzen, P. J., and Sander, R.: A mechanism for halogen release from sea-salt aerosol in the remote marine boundary layer, Nature, 383, 327–330, https://doi.org/10.1038/383327a0, 1996.
von Glasow, R., Sander, R., Bott, A., and Crutzen, P. J.: Modelling halogen chemistry in the marine boundary layer, 1. Cloud-free MBL, J. Geophys. Res., 107, 4341–4356, https://doi.org/10.1029/2001JD000942, 2002.
von Glasow, R., von Kuhlmann, R., Lawrence, M. G., Platt, U., and Crutzen, P. J.: Impact of reactive bromine chemistry in the troposphere, Atmos. Chem. Phys., 4, 2481–2497, https://doi.org/10.5194/acp-4-2481-2004, 2004.
Wagner, T. and Platt, U.: Satellite mapping of enhanced BrO concentrations in the troposphere, Nature, 395, 486–490, https://doi.org/10.1038/26723, 1998.
Wagner, T., Leue, C., Wenig, M., Pfeilsticker, K., and Platt, U.: Spatial and temporal distribution of enhanced boundary layer BrO concentrations measured by the GOME instrument aboard ERS-2, J. Geophys. Res., 106, 24225–24235, https://doi.org/10.1029/2000jd000201, 2001.
Wagner, T., Dix, B., von Friedeburg, C., Frieß, U., Sanghavi, S., Sinreich, R., and Platt, U.: MAX-DOAS O4 measurements: A new technique to derive information on atmospheric aerosols – Principles and information content, J. Geophys. Res., 109, D22205, https://doi.org/10.1029/2004JD004904, 2004.
Wagner, T., Ibrahim, O., Sinreich, R., Frieß, U., von Glasow, R., and Platt, U.: Enhanced tropospheric BrO over Antarctic sea ice in mid winter observed by MAX-DOAS on board the research vessel Polarstern, Atmos. Chem. Phys., 7, 3129–3142, https://doi.org/10.5194/acp-7-3129-2007, 2007.
Wang, S. and Pratt, K. A.: Molecular halogens above the Arctic snowpack: Emissions, diurnal variations, and recycling mechanisms, J. Geophys. Res.-Atmos., 122, 11991–12007, https://doi.org/10.1002/2017JD027175, 2017.
Wennberg, P.: Bromine explosion, Nature, 397, 299–301, https://doi.org/10.1038/16805, 1999.
Yela, M., Gil-Ojeda, M., Navarro-Comas, M., Gonzalez-Bartolomé, D., Puentedura, O., Funke, B., Iglesias, J., Rodríguez, S., García, O., Ochoa, H., and Deferrari, G.: Hemispheric asymmetry in stratospheric NO2 trends, Atmos. Chem. Phys., 17, 13373–13389, https://doi.org/10.5194/acp-17-13373-2017, 2017.
Zeng, T., Wang, Y., Chance, K., Blake, N., Blake, D., and Ridley, B.: Halogen-driven low-altitude O3 and hydrocarbon losses in spring at northern high latitudes, J. Geophys. Res., 111, D17313, https://doi.org/10.1029/2005JD006706, 2006.