the Creative Commons Attribution 4.0 License.
the Creative Commons Attribution 4.0 License.
 | 06 Jun 2018
On the representation of aerosol activation and its influence on model-derived estimates of the aerosol indirect effect
Alexander Avramov
Chien Wang
Interactions between aerosol particles and clouds contribute a great deal of uncertainty to the scientific community's understanding of anthropogenic climate forcing. Aerosol particles serve as the nucleation sites for cloud droplets, establishing a direct linkage between anthropogenic particulate emissions and clouds in the climate system. To resolve this linkage, the community has developed parameterizations of aerosol activation which can be used in global climate models to interactively predict cloud droplet number concentrations (CDNCs). However, different activation schemes can exhibit different sensitivities to aerosol perturbations in different meteorological or pollution regimes. To assess the impact these different sensitivities have on climate forcing, we have coupled three different core activation schemes and variants with the CESM-MARC (two-Moment, Multi-Modal, Mixing-state-resolving Aerosol model for Research of Climate (MARC) coupled with the National Center for Atmospheric Research's (NCAR) Community Earth System Model (CESM; version 1.2)). Although the model produces a reasonable present-day CDNC climatology when compared with observations regardless of the scheme used, ΔCDNCs between the present and preindustrial era regionally increase by over 100 % in zonal mean when using the most sensitive parameterization. These differences in activation sensitivity may lead to a different evolution of the model meteorology, and ultimately to a spread of over 0.8 W m−2 in global average shortwave indirect effect (AIE) diagnosed from the model, a range which is as large as the inter-model spread from the AeroCom intercomparison. Model-derived AIE strongly scales with the simulated preindustrial CDNC burden, and those models with the greatest preindustrial CDNC tend to have the smallest AIE, regardless of their ΔCDNC. This suggests that present-day evaluations of aerosol-climate models may not provide useful constraints on the magnitude of the AIE, which will arise from differences in model estimates of the preindustrial aerosol and cloud climatology.
- Article
(7117 KB) -
Supplement
(3656 KB) - BibTeX
- EndNote


Interactions between aerosol and water in different phases contribute significant uncertainty towards the assessment of anthropogenic climate change. Much of this uncertainty arises from the role of aerosol particles as nuclei which seed the formation of clouds. Changes in the ambient particle burden influence the microstructure of clouds and their optical properties, leading to an “indirect effect” (AIE) on climate (Twomey, 1977; Albrecht, 1989). Constraining the magnitude of this influence, though, is difficult, and large uncertainties persist despite rapid developments in both modeling and observations (Boucher et al., 2013).
The difficulty in constraining the indirect effect's magnitude on contemporary climate change arises from two different but complementary sources. Ghan et al. (2013) and Carslaw et al. (2013) illustrated, using two distinct approaches, that a lack of constraints on natural aerosol emissions and their preindustrial size distributions and chemistry contributes a component of epistemic uncertainty to the problem. However, interactions between aerosols and clouds are also state-dependent; the sensitivity of cloud processes and properties such as precipitation or albedo to aerosol perturbations can vary widely across aerosol and cloud regimes (Quaas et al., 2009; Zhang et al., 2016; McCoy et al., 2017). Thus, efforts to either improve historical constraints on the ambient aerosol burden or improve the simulation of aerosol–cloud interactions could help reduce uncertainty in the AIE.
Details concerning the representation or parameterization of aerosol and cloud processes in global climate models can also influence the magnitude of their simulated AIE. Hoose et al. (2009) showed that in one model, the indirect effect scaled nearly linearly with an artificial constraint placed on the minimum permissible cloud droplet number concentration (CDNC), a tuning parameter first developed to mitigate unrealistically low droplet numbers in remote maritime clouds. A similar threshold used to tune droplet autoconversion parameterizations also yielded scaled estimates of the AIE in a different model (Golaz et al., 2011). Assumed empirical relationships between ambient sulfate burden and CDNC were shown to contribute largely to the spread in shortwave (SW) cloud forcing observed in a previous generation of global climate models (Storelvmo et al., 2009). Furthermore, the fundamental representation of aerosol particle size distribution has also been implicated as a large contributor to a given model's AIE (Kodros and Pierce, 2017).
Here, we consider a fundamental component of aerosol–cloud interactions (ACIs hereafter) included in contemporary global climate models – the nucleation of cloud droplets from the ambient aerosol population (also known as “aerosol activation”). Droplet nucleation plays a key role in setting the climatology of CDNC simulated within global models by providing the initial inputs to cloud microphysical processes. In this manner, activation schemes provide a direct linkage between otherwise independently modeled aerosol and microphysical processes, enabling an explicit representation of the indirect effect. This explicit representation has been implicated as a critical component necessary to resolve regional aerosol impacts on both warming trends over the 20th century (Ekman, 2014) and changes in precipitation patterns (Wang et al., 2015).
Several activation schemes have previously been developed for use in global climate models (e.g. Abdul-Razzak and Ghan, 2000; Nenes and Seinfeld, 2003; Ming et al., 2006; Shipway and Abel, 2010). However, the subjective choice of activation scheme used in a model can influence its simulated CDNC and ACI. Ghan et al. (2011) found a 10 % difference in the AIE when using two different activation schemes in the same global model, despite a 20–50 % difference in simulated CDNC, which is much smaller than the typical inter-model spread in the AIE (e.g. Lohmann and Ferrachat, 2010; Boucher et al., 2013). Using a similar global model but with a more complex aerosol chemistry module, Gantt et al. (2014) dramatically increased the difference in simulated CDNC to 155 % for the same two schemes, which led to a change in present-day SW cloud forcing of 13%. In another study using the same global model, Gettelman (2015) observed a 28 % decrease in the indirect effect when altering the numerics of activation such that droplets are nucleated before other microphysical tendencies are computed.
This work extends these previous literature efforts by quantifying the influence of the representation of activation on estimates of the indirect effect using a suite of state-of-the-science parameterizations coupled to an aerosol-climate model. We include in our suite of parameterizations a sophisticated emulator of droplet nucleation based on an adiabatic cloud parcel model (Rothenberg and Wang, 2017). Furthermore, as a reference, we compare our results to an intercomparison of indirect effect calculations using a suite of global climate models with different aerosol and microphysical schemes. Although we cannot fully explore the aerosol and cloud microphysical parameter space over which AIE could be sensitive, these comparisons highlight the importance of the aerosol–cloud coupling in influencing the problem.
This paper is organized as follows. Section 2 introduces the MARC aerosol-climate model used to investigate the influence of droplet activation on the indirect effect, as well as the observational and model intercomparison datasets used in this study. In Sect. 3.1.1–3.1.2 we consider how different activation schemes influence the simulation of clouds and radiation in a present-day emission scenario, and their sensitivity to aerosol perturbations. We follow this with analysis in Sect. 3.3–3.6 of the influence of droplet activation on the indirect effect. Section 4 summarizes our findings and discusses implications for future studies. Finally, we include a supplement documenting MARC's simulation of aerosol physical and radiative forcing climatologies with available observational data.
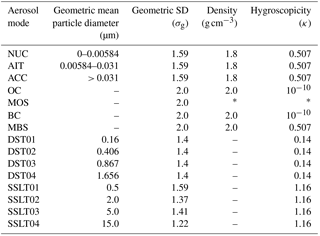
Table 1MARC aerosol mode size distribution and chemistry parameters. The MOS mode (*) has a composition-dependent density and hygroscopicity which is computed using the internal mixing state of organic carbon and sulfate present at a given grid cell and timestep.
2.1 MARC Global Aerosol-Climate Model
In order to assess aerosol impacts on climate, we have utilized the two-Moment, Multi-Modal, Mixing-state-resolving Aerosol model for Research of Climate (MARC) coupled with the National Center for Atmospheric Research's (NCAR) Community Earth System Model (CESM; version 1.2), which includes the Community Atmosphere Model (CAM; version 5.3). In this CESM-MARC model (MARC hereafter) we replace the default aerosol scheme (the Modal Aerosol Model Liu et al., 2012) with an aerosol physics and chemistry model based on the scheme by Wilson et al. (2001). MARC has previously been used to resolve aerosol physics in both cloud-resolving (Ekman et al., 2004, 2006, 2007; Wang, 2005a, b; Engström et al., 2008) and climate (Kim et al., 2008, 2014; Ekman et al., 2012) simulations.
MARC explicitly simulates the evolution of a complex mixture of aerosol species, each with an associated lognormal size distribution. Within MARC, the aerosol species are divided into a set of externally mixed modes, including three distinct sulfate modes (nucleation or “NUC”, Aitken or “AIT”, and accumulation “ACC”), pure black carbon (BC), and organic carbon (OC). Additionally, MARC resolves two internally mixed modes, consisting of sulfate–black carbon (MBS) and sulfate–organic carbon (MOS). With the MBS mixture, particles are assumed to consist of a black carbon core coated with a sulfate shell; within the MOS mixture, particles are totally internally mixed according to the volumetric ratio of sulfate and organic carbon present. For each mode, MARC tracks the evolution of total number and mass concentrations. Additionally, MARC tracks the partitioning between carbon and sulfate for both the MOS and MBS modes.
Sulfate particles are formed in MARC via binary nucleation of H2SO4 and H2O (Vehkamäki, 2002), with prognostic gaseous sulfuric acid predicted by the default CAM interactive sulfur chemistry module (Barth et al., 2000). Both gas-phase oxidation of SO2 and dimethyl sulfide (DMS) provide sources for H2SO4, as well as aqueous reactions of S(IV) with both H2O2 and O3. Coagulation between modes produces both pure (externally mixed sulfate) and mixed (MOS and MBS) particles; the pure carbon (BC and OC) modes age into their mixed counterparts through a prescribed constant-time aging scheme (40 and 20 h, respectively) which is limited by the availability of H2SO4 for condensation. Both primary and secondary organic carbon aerosol are emitted into the OC mode; biogenic volatile organic vapors (specifically isoprene and monoterpenes) are converted upon emission into OC using a simple yield coefficient suggested by Griffin et al. (1999). We assume that both pure carbonaceous modes are hydrophobic.
Dust and sea salt are computed in MARC using a sectional, single-moment (fixed-size) scheme (with mean size bins of 0.16, 0.406, 0.867, and 1.656 µm bins for dust and 0.2, 2, 5, and 15 µm for sea salt). Sea salt is assumed to be composed of NaCl, while dust is assumed to be a mixture of minerals (Albani et al., 2014; Scanza et al., 2015). Prescribed size distribution and hygroscopicity parameters for each mode are summarized in Table 1.
The aerosols simulated by MARC fully couple and interact with both the CESM radiative transfer model and its cloud microphysics scheme (through droplet nucleation). Particles from all modes can be lost through dry deposition, gravitational settling, and impaction scavenging via precipitation, and each mode undergoes these processes with different efficiencies related to their size and hygroscopicity (Petters and Kreidenweis, 2007). Additionally, nucleation scavenging occurs in both deep convective and stratiform clouds. In deep convection, a prescribed cloud-base supersaturation of 0.1 % is assumed to estimate scavenging. However, in stratiform clouds, nucleation scavenging is calculated through a prognostic aerosol activation scheme, taking into account both local meteorology (sub-grid-scale updraft speeds) and the total availability of ambient aerosol. Although several aerosol species (sulfate and dust) play a role in heterogeneous ice formation in MARC (following Liu et al., 2007), this process does not remove ambient aerosol.
MARC adopts the stratiform cloud microphysics scheme from CAM5.3 (Morrison et al., 2008) and includes the updates to code structure and droplet nucleation tendencies referred to as MG1.5 by Gettelman and Morrison (2015). The contribution of droplet nucleation to the cloud droplet number tendency, , is computed following Ovtchinnikov and Ghan (2005), and can be nonzero in both newly formed and preexisting clouds. Droplet nucleation is restricted to occur at the cloud base in preexisting clouds but can occur at all levels of newly formed clouds where cloud water mass is predicted to develop. Additionally, includes sink terms such as accretion of cloud water, self-collection of hydrometeors, evaporation, autoconversion, advection, and inter-type scavenging of hydrometeors. Autoconversion is parameterized as a function of cloud water content and droplet number, Nd (Khairoutdinov and Kogan, 2000). Ice and mixed-phase cloud microphysics are based on Liu et al. (2007) and Gettelman et al. (2010).
2.2 Simulation design and analysis
We perform a set of simulations with MARC using different activation schemes
(see Appendix A for more details). For both the
pseudo-analytical ARG (Abdul-Razzak and Ghan, 2000) and iterative
nenes (Morales Betancourt and Nenes, 2014b) schemes, we include both a
_comp and a _min_smax variant. The
_min_smax
approach incorporates a minimum Smax heuristic and neglects
inter-modal competition for water vapor during activation
(Appendix A4). Rothenberg and Wang (2017) demonstrated, using a
large ensemble of parcel model simulations, that in much of the
physicochemical parameter space which describes a given aerosol population
with fixed modes, activation dynamics are insensitive to changes in all but a
single “dominant” aerosol mode. The number concentration of particles in
this mode (often the accumulation-mode sulfate) then strongly constrains the
total number of droplets nucleated from the complete aerosol population. In
addition to the desire to test a variety of different activation schemes,
including these _min_smax simulations affords a novel way to
evaluate the behavior of the complex nenes and ARG schemes.
For the PCM schemes, we use both the main4 and
gCCN3 schemes of Rothenberg and Wang (2017), and the fourth-order OLS
scheme (ols4) of Rothenberg and Wang (2016) for the
minimum Smax heuristic. We also note that for the nenes
scheme, we apply the kappa-Köhler theory formulation to handle dust
instead of the adsorption mechanics implemented by Kumar et al. (2009). Other
than the change in activation schemes, the simulations use the same emissions
scenarios and physics schemes.
For each scheme, we performed a pair of 6-year simulations using a horizontal grid resolution of and 30 vertical levels. Each simulation is run with prescribed sea surface temperatures and ice cover running an annual cycle for the year 2000. To focus this work on the indirect effect, we diagnose the aerosol direct radiative effect through additional radiative transfer calls during model run time, but we do not include this effect in the heating rates used to forward-integrate the model. The pairs of simulations differ only in their prescribed aerosol and precursor gas emissions; here, we use a present day (“PD”) and preindustrial (“PI”) value corresponding to the years 2005 and 1850, respectively. Following Kim et al. (2008), we use constant emissions derived using an offline modeling process (Mayer et al., 2000; Wang, 2004) for BC and primary OC; emissions of DMS and volatile organic compounds (VOCS; isoprene and monoterpene) vary on a monthly basis. SO2 emissions are taken from the default CESM inventory (Lamarque et al., 2010). Dust emissions are based on modeled wind speeds and land-surface usage and are tuned following Albani et al. (2014). Similarly, sea salt emissions are dependent on both wind speeds near the surface as well as sea surface temperature and use the original scheme used in CESM (Liu et al., 2012).
For all simulations, we output monthly mean fields and analyze the final 3 years of output for both the PD and PI cases. The change in SW cloud radiative forcing between the two cases is diagnosed using a decomposition which takes into account impacts due to surface albedo change (Ghan, 2013):
where Δ indicates the difference between the PD and PI simulations, Fclean is the radiative flux calculated neglecting the scattering and absorption of all aerosol, and Fclear,clean further excludes clouds.
Additionally, we output a suite of instantaneous cloud micro- and macrophysical variables sampled at either the cloud top or 1 km above the surface and saved every 3 h over the duration of the simulations. For consistency with the radiative transfer calculations in the model, the maximum-random overlap hypothesis is used to derive cloud-top quantities (e.g. Morcrette, 1991), which assumes that adjacent layers of clouds overlap as completely as possible, but separate layers of clouds randomly overlap. To estimate the sensitivity of the indirect effect and cloud microphysical properties to cloud and aerosol perturbations, we analyze time series of the quantities of interest in each grid cell, considering only those where liquid water clouds are present (temperature < −5 ∘C) between −60∘ S and 60∘ N. From these masked time series in each grid cell we compute climatologies of aerosol and cloud radiative microphysical properties, which we then compare against to assess sensitivity of the SW cloud radiative effect (CRE) to aerosol and cloud microphysical perturbation.
2.3 Other data
2.3.1 Satellite observations
To assess MARC's performance in simulating present-day cloud and radiation fields, we use a climatology of observations derived from satellite-based sensors. Cloud micro- and macro-physical fields were derived from the MODerate Resolution Imaging Spectroradiometer (MODIS; Collection 5.1). Cloud droplet number is derived from Level 1 data from the same instrument using a technique employing an adiabatic cloud assumption (Bennartz and Rausch, 2017); for this reason, it is only suitable for maritime cloud regimes equator-ward of 60∘. The global radiative budget at the top of the atmosphere is estimated using the climatology from the Clouds and Earth's Radiant Energy System (CERES) Energy Balanced and Filled (EBAF) dataset (Loeb et al., 2009). All data are re-gridded to the MARC simulation grid before time-averaging for analysis; because the CERES data are originally a higher resolution than the MARC simulation grid, this introduces a small bias by suppressing regional variability. Therefore, care is warranted when comparing regional features of the dataset with the radiation fields produced by our simulations.
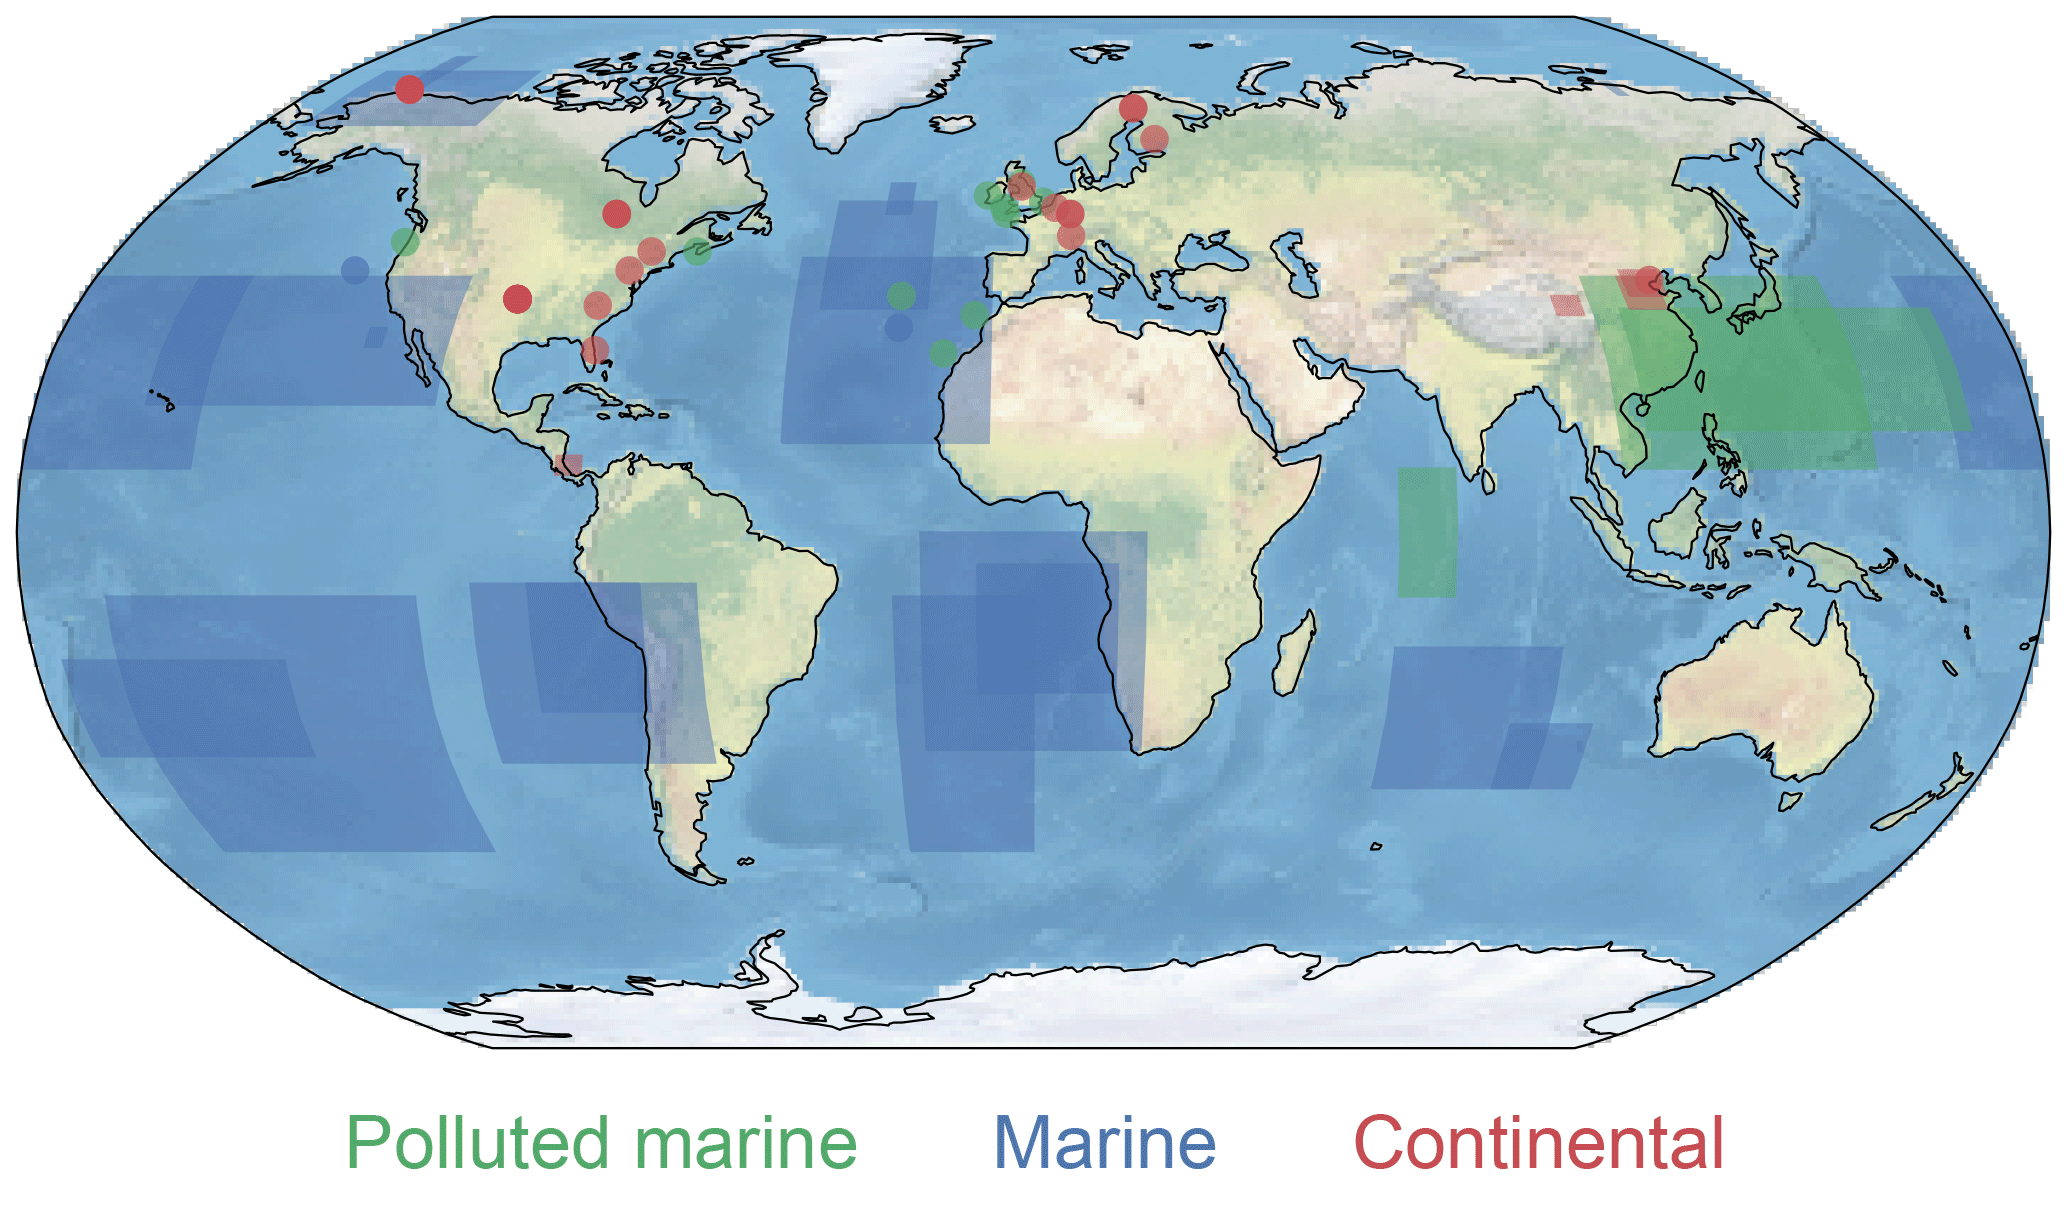
Figure 1Locations of in situ observational data reported by Karydis et al. (2011). Different colors correspond to classifications of different aerosol regimes.
2.3.2 CDNC observations
Because the MODIS-derived cloud droplet number concentration retrievals have a high degree of uncertainty, we also evaluate simulated droplet numbers against a large collection of in situ observations previously compiled by Karydis et al. (2011) (see their Table 2). We compare these observations to instantaneous output of in-cloud droplet number from our present-day simulations, first interpolated to 850 mb, and then averaged over the indicated seasons and observation areas for the final 3 years in each model run. For observations from a specific location, we locate the model grid cell containing that location for analysis. As a reference, we include the modeled CDNC corresponding to each observation produced by the chemical transport model simulations performed by Karydis et al. (2011). Figure 1 plots the global distribution of where the observations are sourced.
2.3.3 AeroCom model comparison
We supplement our simulations by further analyzing an additional set of climate model output from the Aerosol Comparisons between Observations and Models (AeroCom) Indirect Effects Experiment. This intercomparison includes five independent aerosol-climate models (CAM5, ECHAM6-HAM2, ModelE-TOMAS, SPRINTARS, and HadGEM3-UKCA), as well as several variations of the core models adjusting the cloud microphysical scheme (CAM5-MG2), the turbulence closure (CAM5-CLUBB), and the autoconversion scheme (SPRINTARS-KK). Similar to the experiment conducted here, pairs of integrations (using present-day and preindustrial emissions scenarios) were performed with each model, using the same IPCC emissions scenarios for primary aerosol and precursors (Lamarque et al., 2011). Each simulation uses prescribed sea surface temperatures, sea-ice extent, and atmospheric greenhouse gas concentrations, and was run for a length of five model years. A detailed summary of each model and its suite of parameterizations relevant for modeling the indirect effect can be found in Appendix A of Zhang et al. (2016).
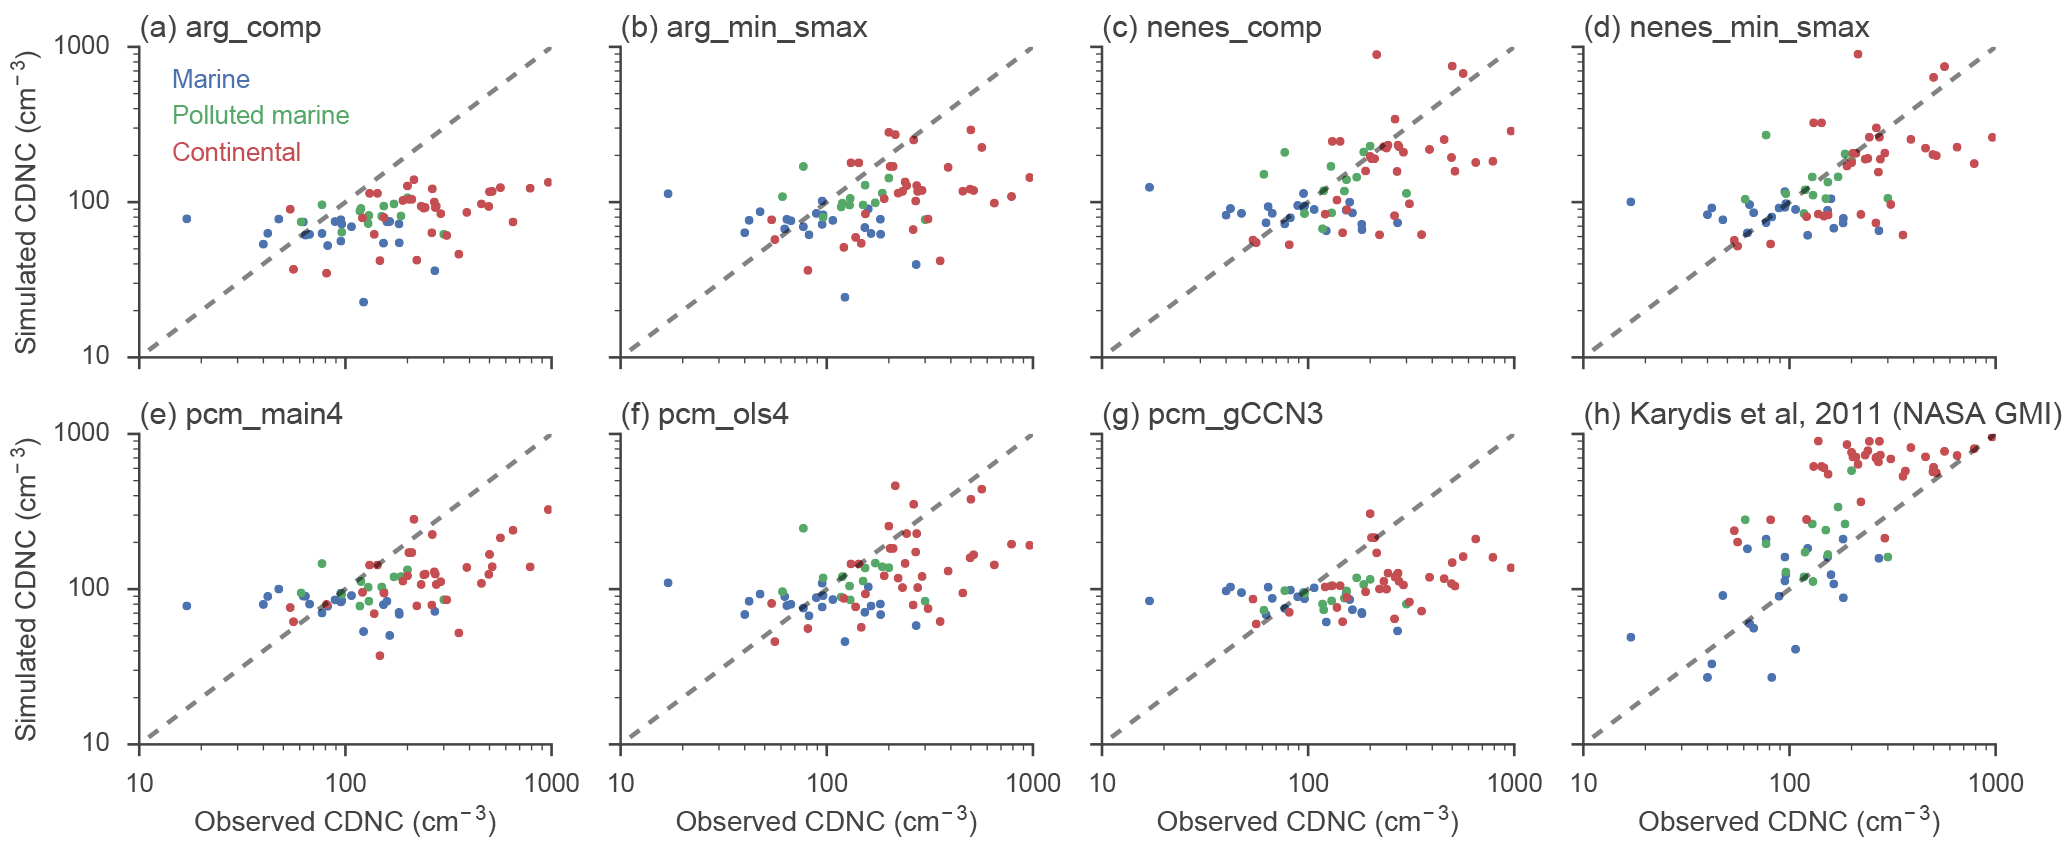
Figure 2One-to-one comparisons between observed and simulated cloud droplet number concentrations from regions across the globe. Panels (a)–(g) show results from the MARC simulations using the indicated droplet activation schemes; panel (h) shows results of CDNC modeled by a chemical transport model with detailed aerosol and activation treatments.
3.1 Influence of activation scheme versus observations
3.1.1 Cloud droplet number concentration
Predicted cloud droplet number concentrations (CDNCs) from each variant of MARC
are compared against observations sourced from around the globe
(Fig. 1) in Fig. 2. MARC
generally underpredicts CDNC in regimes where observed CDNCs are very high,
particularly over polluted continental regions. Both of the nenes
schemes and each of the min_smax schemes (relative to their
full-competition reference) are more able to simulate the high CDNC values
in these regions. In clean marine regimes, all of the MARC simulations
produce too little variance in simulated CDNCs, although most of the
comparisons are within ± 50 % of the observations, which tend to be
small. The detailed aerosol, chemistry, and activation treatment in the NASA
GMI model utilized by Karydis et al. (2011) produces much better agreement with
observations, although their model also tends to consistently predict too
much CDNC over continental regions; over half of their reported values are
greater than their corresponding observed CDNC values by ±50 %.
Distributions of relative error in model-simulated CDNC versus observations
aggregated by region are shown in Fig. 3. On average, MARC
performs the worst in continental regimes, regardless of activation scheme.
In contrast, the average simulated CDNC in clean marine regimes is
well calibrated, but has much higher variance. Polluted maritime regimes tend
to have the least variance, and the model performs better in these regimes
than over continents. In the global average, though, CDNC burden is
relatively well predicted in comparison with recent modeling estimates.
Estimates of global-average CDNC in the simulations performed here range from
60 to 91 cm−3 (for the arg_comp and
nenes_min_smax cases, respectively). This is mostly in agreement
with recent studies, albeit on the lower side of estimates
(75–135 cm−3 by Penner et al. (2006), using a suite of models
employing the Abdul-Razzak and Ghan (2000) activation scheme; 83 cm−3
by Leibensperger et al. (2011), using an empirical relationship between aerosol
and droplet number; and 96 cm−3 by Barahona et al. (2011), using an
earlier variant of the Morales Betancourt and Nenes (2014b) activation scheme).
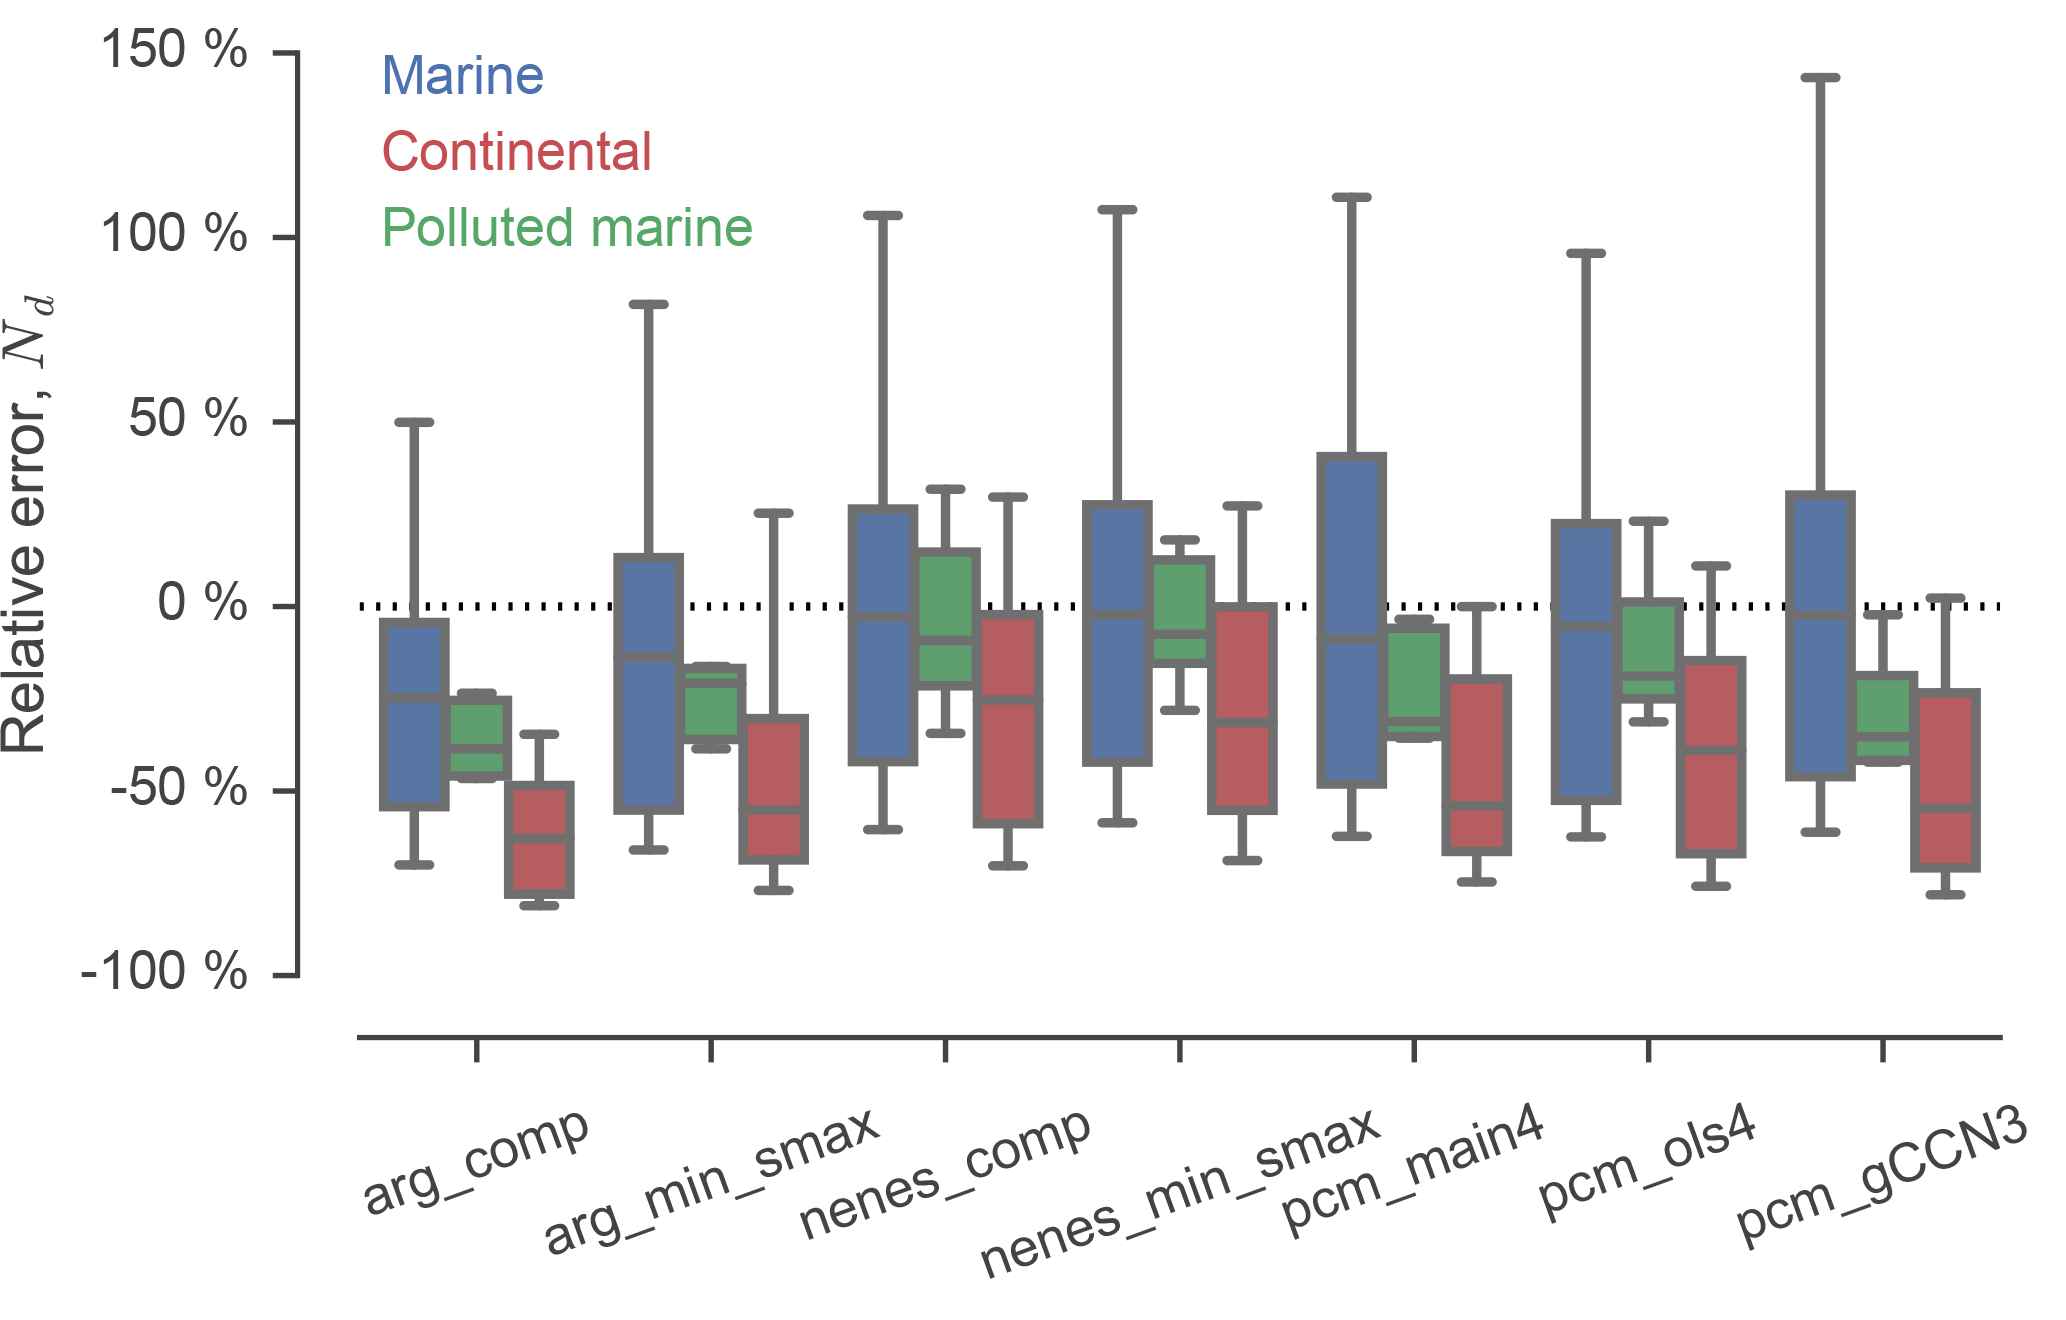
Figure 3Distributions of relative error between observed and simulated CDNC (Nd) for each configuration of MARC, aggregated by region.
For a more rigorous assessment of simulated CDNC, we compare MARC fields to
CDNC derived from MODIS observations (Bennartz and Rausch, 2017) in
Fig. 4. Enhancement in CDNC downwind and in the
vicinity of continents and anthropogenic emissions sources is clearly
visible in the satellite dataset, particularly in the regions offshore of the
United States and China. Averaged over the entire oceanic region under
consideration, MARC underpredicts CDNC by 45–56 %, depending on which
activation scheme is used. However, CDNC is consistently too small in several
regions regardless of activation scheme, particularly in both the North and
South Atlantic, in the portion of the Southern Ocean that lies south of the
Indian Ocean, and in the North Pacific. The only oceanic region where the
model overestimates CDNC is in the equatorial upwelling region of the
eastern Pacific. Enhancement of CDNC by anthropogenic aerosol in coastal
regions is best captured by the nenes and PCM schemes;
this is particularly the case downwind of China and the United States, where
the ARG schemes tend to yield a greater underprediction of CDNC
versus the other schemes.
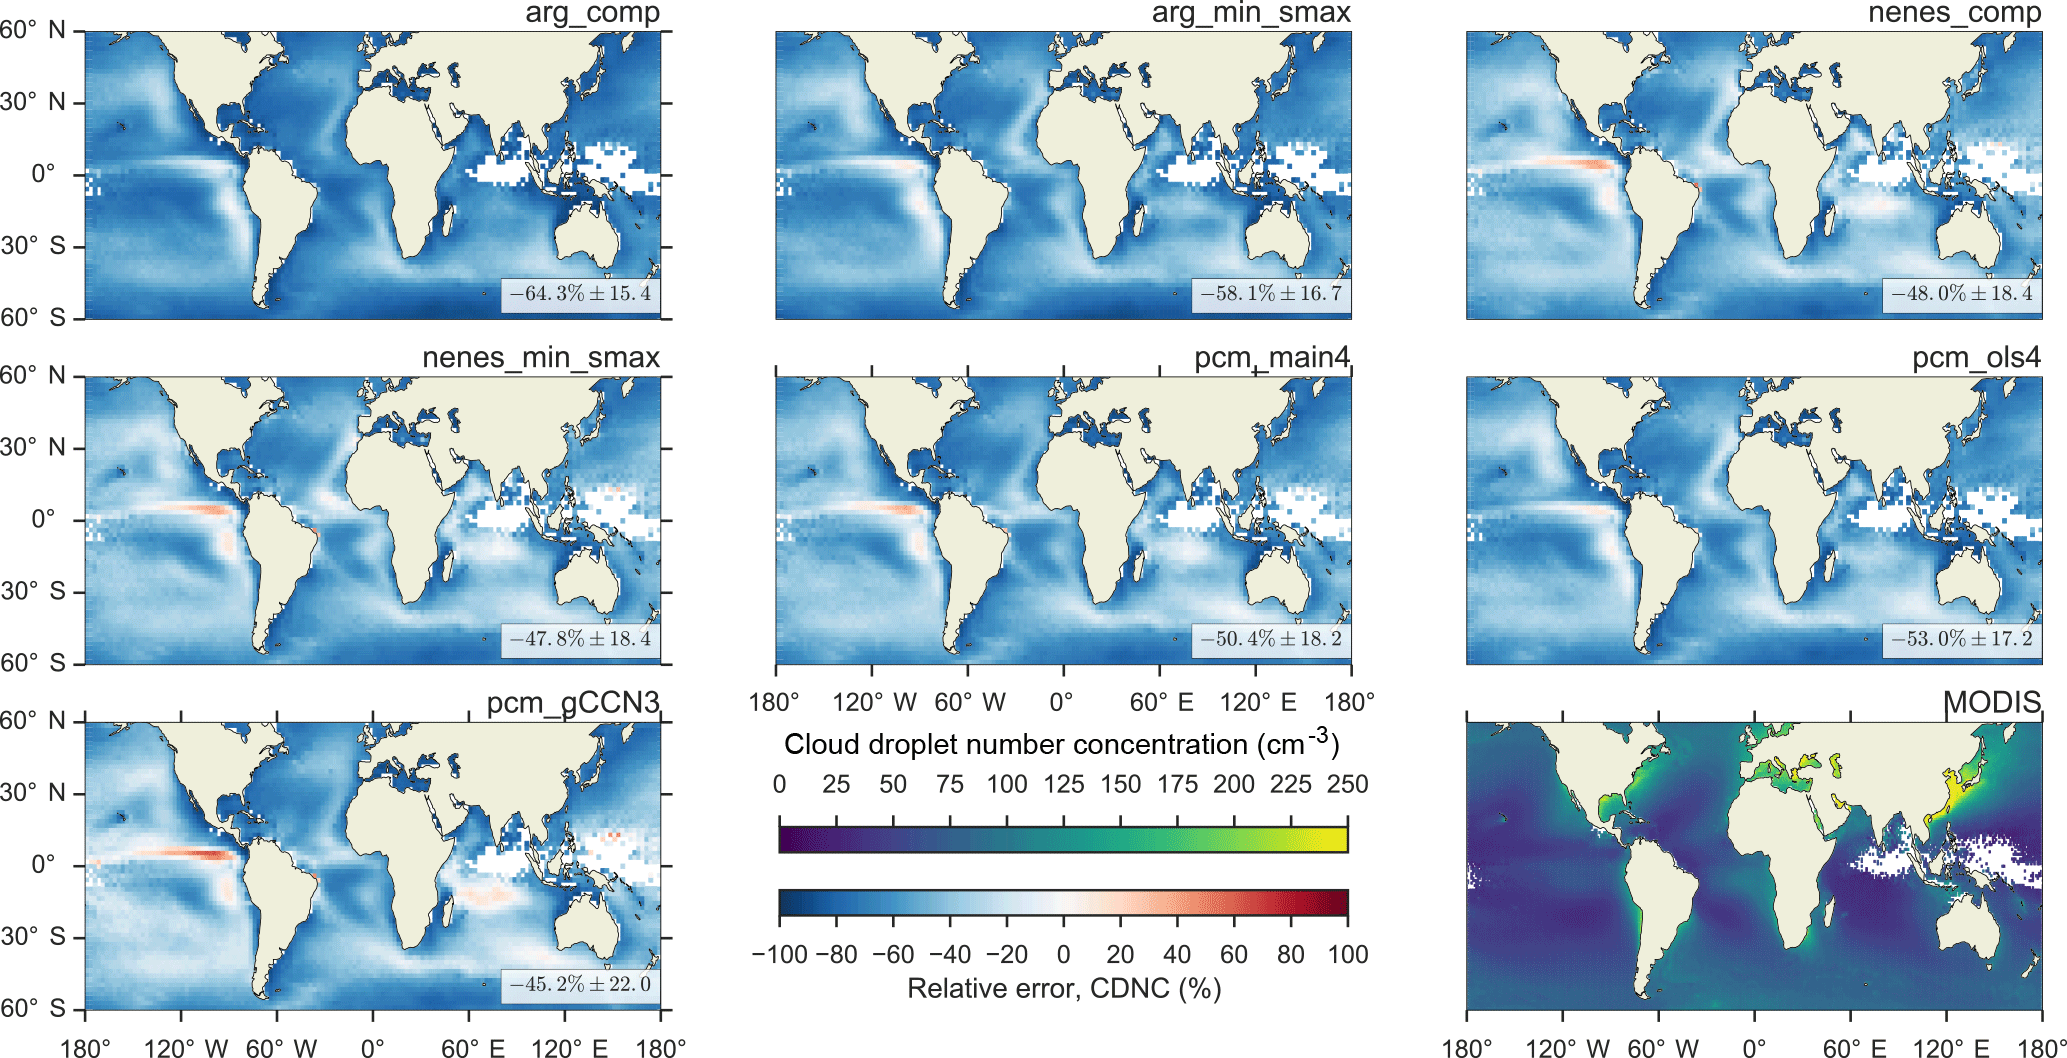
Figure 4Global distribution in relative error of MARC-simulated CDNC versus MODIS-derived satellite observations (bottom right).

Figure 5Zonal average aerosol, cloud, and radiation fields under present-day emissions scenario. Colored lines correspond to configurations of MARC using different activation schemes; black lines are derived from CERES-EBAF (SW cloud radiative effect, CRE) and MODIS (all other panels) observations. The shaded gray area corresponds to the inter-model spread for all available models participating in the AeroCom Indirect Effects Experiment; dashed white lines are the zonal averages for each participating model. Cloud droplet number is computed at the cloud top, using only grid cells over the ocean. Here, the SW CRE is computed using the difference between clear-sky and all-sky fluxes.
Although using different activation schemes does not directly perturb the
simulated aerosol distributions in MARC, the two-way coupling facilitated by
nucleation scavenging can indirectly influence average aerosol number
concentrations. In these simulations, the PD accumulation-mode number
concentration over the oceans is 31–40 % smaller in the simulations
using the nenes and PCM activation schemes versus the
ARG. This is likely because the former two schemes tend to
nucleate more droplets, given a similar aerosol population. The attendant
increase in nucleation scavenging decreases accumulation-mode number, which
then depresses potential cloud droplet number. As a result, the difference in
the long-term average CDNC between the different schemes is not as large as
it otherwise might be, hence the similar distributions of error relative to
MODIS-derived CDNC. The region of CDNC that is too high, simulated by MARC in the
eastern equatorial Pacific, coincides with a region of enhanced, persistent
deep convection and precipitation in the model.
3.1.2 Clouds and radiation
Compared to the original version of CESM/CAM5.3, the inclusion of an alternative aerosol formulation does not substantially change the model's simulated cloud and radiation fields, as illustrated in Fig. 5. To demonstrate the extent to which altering the activation scheme can influence these fields on the large scale, in Fig. 5 we have included zonal averages computed from an ensemble of aerosol-climate models from the AeroCom experiment, four of which are themselves variants on the CAM5.3 with alternative microphysics (Gettelman and Morrison, 2015) and/or the moist turbulence scheme (Bogenschutz et al., 2013). Except in the Northern Hemisphere subtropics, MARC tends to underpredict total aerosol optical depth (AOD) relative to both observations and the reference models (Fig. 5a). This is generally the case for all of the reference models as well, and MODIS estimates of AOD are thought to be biased high over oceanic regimes (Levy et al., 2013). However, MARC consistently predicts smaller AOD than the other models considered here. As previously noted in Sect. 3.1.1, there are differences in simulated accumulation-mode sulfate number concentration depending on the activation scheme used with MARC, but the fact that these differences do not show up in the zonal-average AOD suggests that MARC consistently predicts too few coarse-mode aerosols.
Present-day zonal average cloud macrophysical properties are summarized in
Fig. 5b–d. MARC generally performs comparably
with other models in reproducing zonal patterns in cloud fraction, cloud
optical depth, and liquid water path. The nenes and PCM
schemes produce slightly higher cloud optical depth across all latitudes and
particularly in the tropics relative to the other activation schemes. MARC
tends to underpredict cloud optical depth and liquid water path in polar
regions, although this error is common in nearly all AeroCom models as well.
The preponderance of mixed-phase clouds greatly complicates the assessment of these
regions, and MODIS retrievals can become unreliable due to changing surface
conditions (in particular, reflective surfaces such as snow which increase in
frequency towards the poles). MARC is well within the inter-model spread of
simulated cloud macrophysical properties across latitudes.
The zonal averages of liquid cloud optical depth in Fig. 5c suggest that MARC may tend to overpredict the influence of deep convective clouds in the tropics, while underpredicting their influence in the subtropics. Again, this behavior is common in nearly all the AeroCom models analyzed here. However, Fig. 4 shows that some MARC simulations also overpredict CDNC in the equatorial eastern Pacific, relative to available observations, although we also note that the observations are very few in number in this region. It is possible that this regional overprediction of CDNC could be related to a local enhancement in the frequency of deep convection, although we note that convective precipitation in this region differs very little between runs with different activation schemes, suggesting that they play only a minor role here.
Following the discussion in Sect. 3.1.1 the largest
activation-induced differences between simulations arise in cloud-top CDNC (Fig. 5e). Poleward of
60∘, CDNC simulated by the nenes schemes is up to double
that simulated by the ARG schemes. These differences are most
pronounced in latitudes with significant anthropogenic aerosol emissions,
particularly in the Northern Hemisphere. All the models shown here
substantially underpredict CDNC in the extra-tropics, but the MODIS-derived
estimates are highly uncertain in this region (Bennartz, 2007). The
combination of these differences in cloud microphysical properties yields
small differences in the model-estimated SW CRE (Fig. 5f).
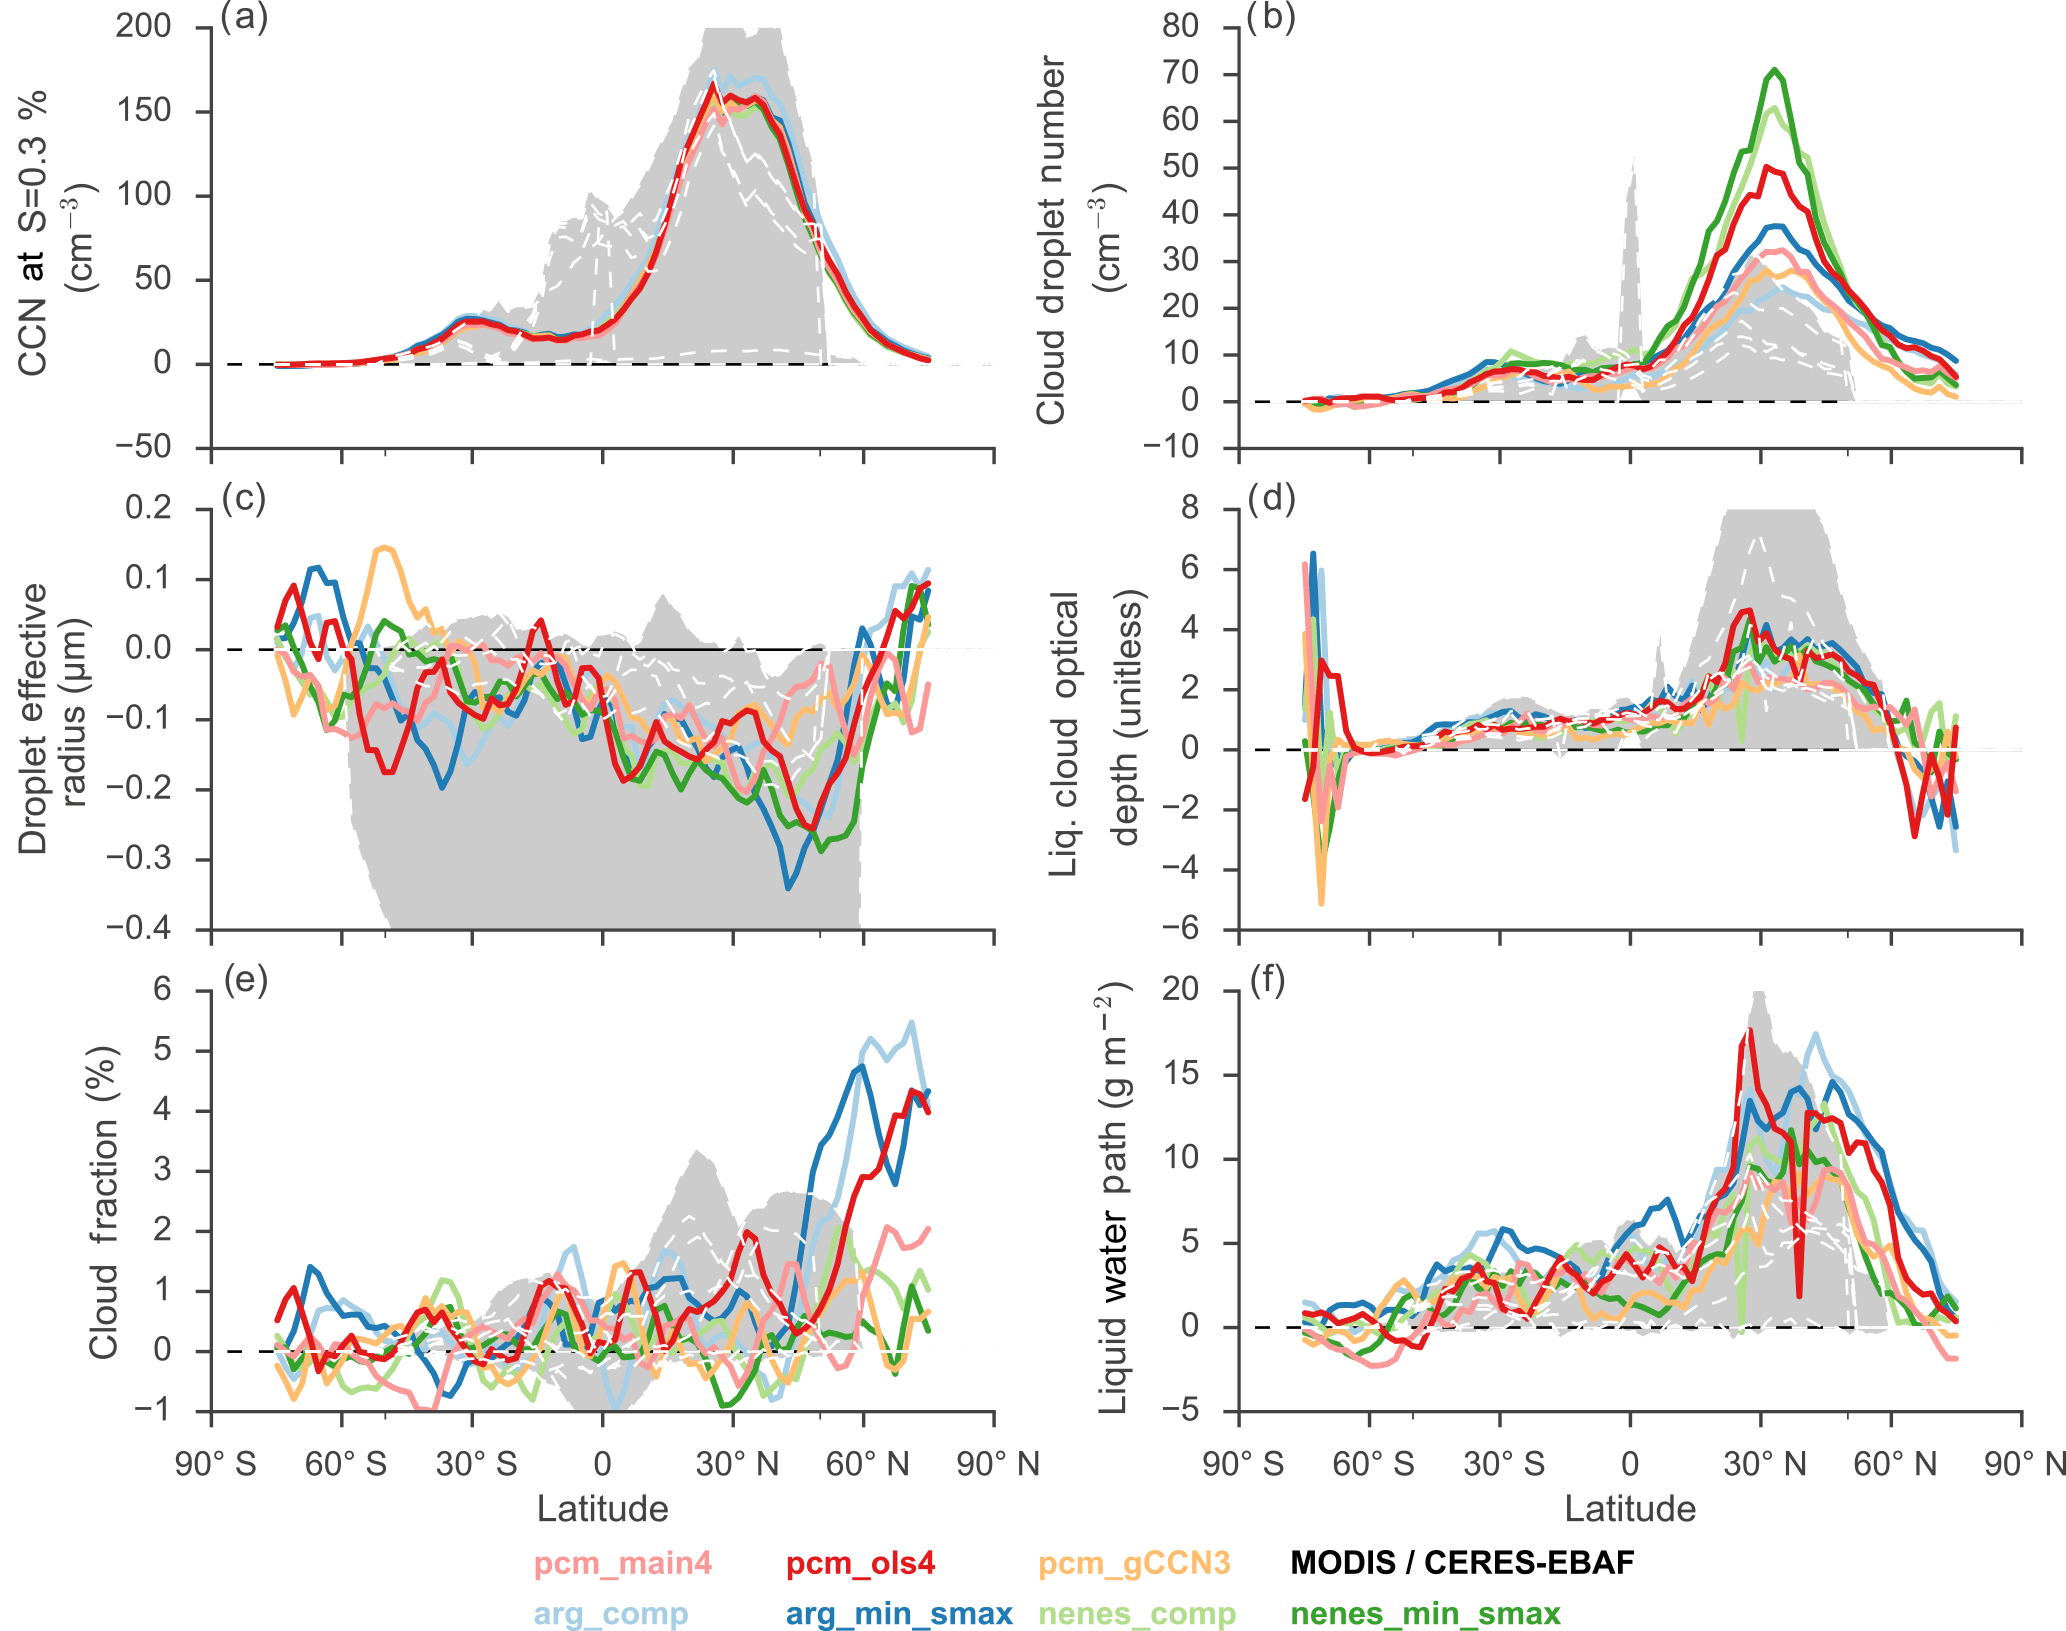
Figure 6Same as Fig. 5, except illustrating differences in indicated fields between preindustrial (PI) and present-day (PD) emissions scenarios. CCN here is computed at an altitude of 1 km in the model.
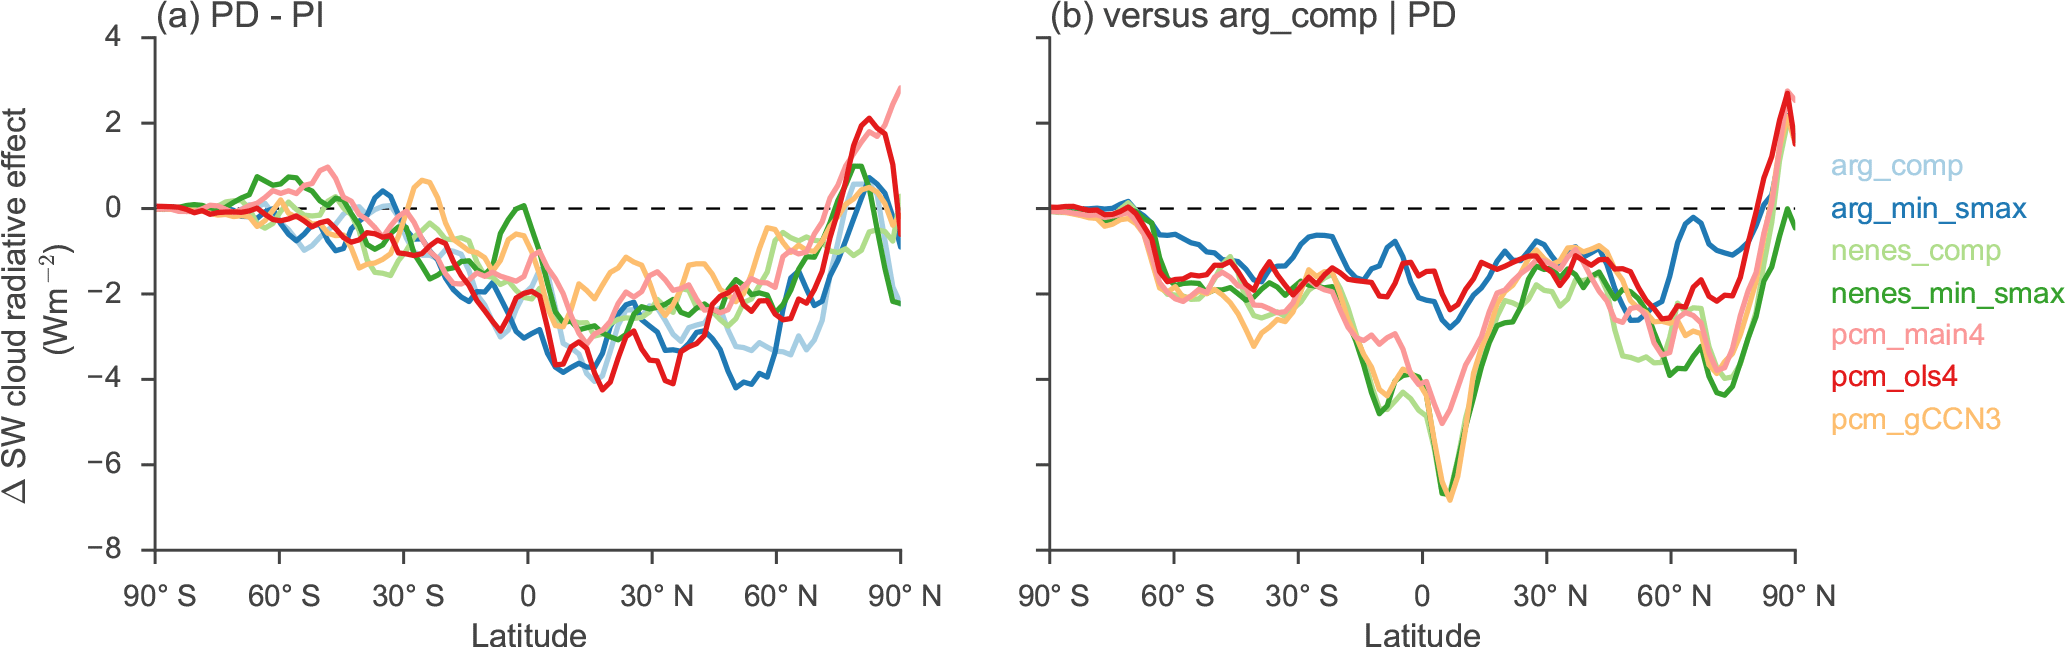
Figure 7Difference in SW CRE between preindustrial and present-day emissions scenarios (a) and relative to the arg_comp simulation for present-day emissions (b).
3.2 PD–PI changes in clouds and radiation
Figure 7b illustrates that in absolute terms,
the difference in PD SW CRE simulated using each
activation scheme is small. However, the change in CRE between the PD and PI simulations (Fig. 7a) has
a spread of nearly 2 W m−2 across all latitudes. Note that these
differences can be much larger on local scales. Activation schemes which
produce the smallest cloud-top CDNC generally produce
the largest differences in CRE between the two emission
scenarios. Relative to the arg_comp scheme, all other schemes
produce a smaller CRE in the PD emissions case
(Fig. 7b); the magnitude of these inter-scheme
differences is comparable to the total change between the PD and PI
simulations for all schemes. The largest differences between schemes occur in
the tropics and in the midlatitudes of the Northern Hemisphere, both regions
influenced by anthropogenic aerosol emissions and where the largest
differences in CDNC also occur.
Table 2Aerosol direct and indirect effects (in W m2) for the different activation schemes considered in this study. In all cases, we consider the change in the top-of-atmosphere radiative flux to compute these metrics (the net balance of which is given by ΔR). Our decomposition of the shortwave cloud radiative effect (SW CRE) follows Ghan (2013) to account for above-cloud scattering and absorbing aerosol; similarly, the direct effect is computed diagnostically within each simulation. Following Gettelman (2015) we compute a residual (Res) between the top-of-atmosphere radiative imbalance and the direct and indirect effects such that Res = total CRE + DRF −ΔR.
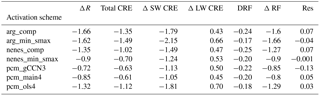
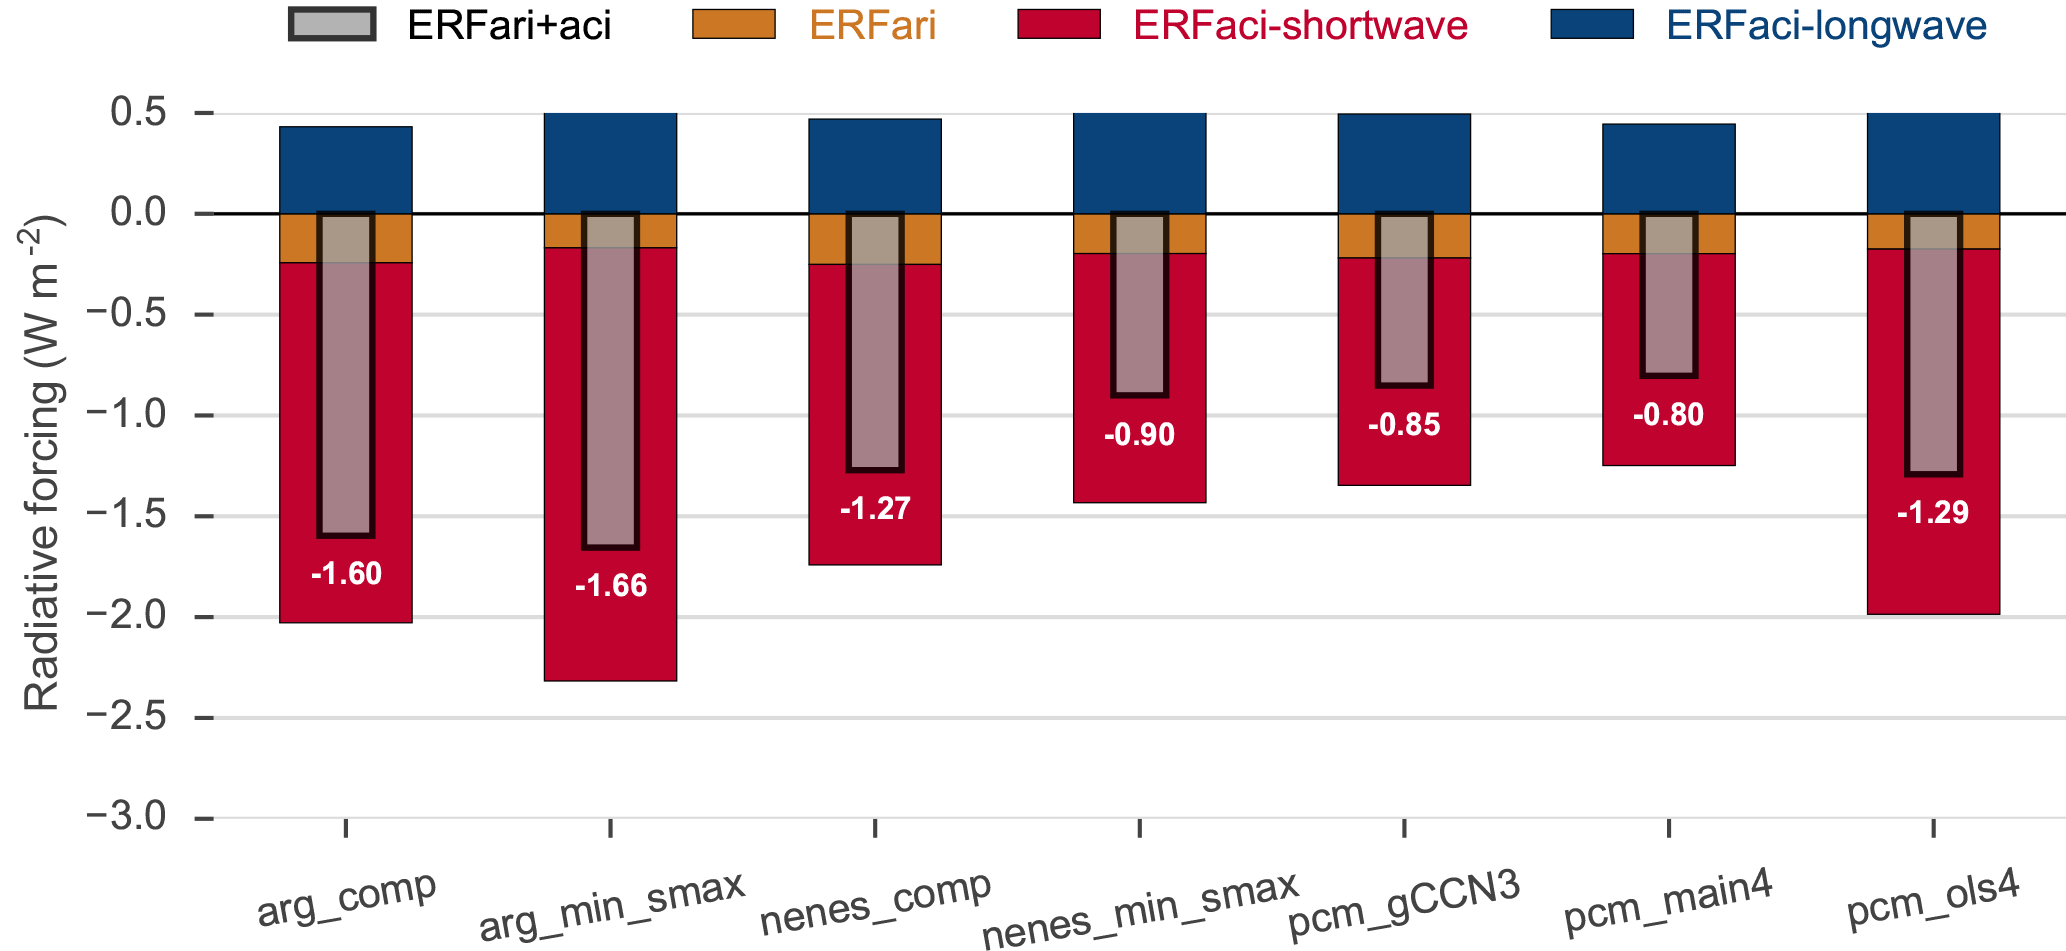
Figure 8Global-average effective radiative forcing for aerosol direct radiative effects (ERFari) and indirect effects (ERFaci) in both the shortwave and longwave. The total effect is computed as the sum of the direct and both indirect components.
To better illustrate the sources of differences in simulated CRE, changes in aerosol and cloud microphysical properties between the PD and PI emission scenarios are shown in Fig. 6. Cloud condensation nuclei (CCN) robustly increase in Fig. 6a as aerosol emissions increase from the PI to the PD scenarios. Furthermore, CCN increases the most in the Northern Hemisphere, where anthropogenic aerosol emissions are the largest. The regions of largest increases in CCN also tend to feature the largest increases in CDNC (Fig. 6b), although there is a factor of 3–4 difference between CDNC simulated by the various activation schemes. At the same latitudes, the droplet effective radius decreases (Fig. 6c), the optical depth increases (Fig. 6d), and the liquid water path increases (Fig. 6f). Changes in cloud fraction (Fig. 6e) are much noisier, but generally there is an increase in cloudiness between the two cases.
Regardless of which activation scheme is used, compared to Fig. 5c–d, the liquid water path and cloud optical depth increase by up to 20 %, co-located where the largest increases in CDNC occur. The latitudes of the largest PD–PI differences in CCN, CDNC, droplet effective radius, and liquid water path are coincident with the largest changes in cloud optical depth and attendant SW CRE. Changes in cloud fraction do not necessarily coincide with these other changes in cloud properties, and instead maximize in the high latitudes of the Northern Hemisphere. However, given that CCN (as a proxy for aerosol available to nucleate cloud droplets) differs little when using different activation schemes, the spatial pattern of these changes in cloud microstructure and CRE strongly suggests that the specifics of activation in the MARC simulations are driving the changes in CRE.
3.3 Influence on the aerosol indirect effect
Figure 8 shows differences in globally averaged aerosol direct and indirect effects computed from the pairs of PD and PI runs for each activation scheme. These simulations yield differences of up to 0.8 W m−2 between simulations, or a 100 % increase by the strongest over the weakest estimate. Differences in the total aerosol influence on climate (adopting the IPCC nomenclature “ERFaci + ari” to denote the separate contributions from the indirect (aci) and direct (ari) effects; Boucher et al., 2013) here are strongly modulated by perturbations to the SW CRE, ERFaci-shortwave, which is broadly consistent with the changes in cloud microphysical properties illustrated in Fig. 6.
Each perturbed component in the top-of-atmosphere (TOA) radiative budget is decomposed in Table 2. Consistent with expectations, there is relatively little variance in the direct radiative forcing diagnosed for each activation scheme, even accounting for the feedback of increased nucleation scavenging depressing aerosol number. Similarly, there is not much difference in the longwave CRE, which is dominated by ice-phase clouds and not directly influenced by adjusting the activation scheme. The longwave indirect effect in these models is net positive in all cases; dust and large sulfate particles in the model can nucleate ice crystals (Liu et al., 2007), and the increase in aerosol between the two emission scenarios yields ice clouds with modestly higher ice crystal number concentration, higher ice water path, and increased longwave influence relative to the shortwave. Using a similar modeling setup, Gettelman et al. (2012) previously showed a similar influence of aerosol on ice cloud–longwave radiation interactions.
Furthermore, we note that the indirect effect in the longwave is critically sensitive to the baseline ice crystal number burden simulated in the model. Additional tests using an alternative, aerosol-coupled ice nucleation scheme (DeMott et al., 2010) decreased the longwave CRE in MARC in a manner that scaled nearly linearly with the ice crystal number. Using this alternative scheme produced much higher cloud-top ice crystal concentrations and ice water path, as well as a larger change between the two fields in the PI and PD simulations.
The majority of the difference in the indirect effect and net TOA radiative
flux thus arises from changes in cloud interactions with SW radiation
via cloud optical thickness. For the SW CRE alone, the spread between
the different activation schemes is larger than the net effect itself at
1.1 W m−2. Both the longwave CRE and aerosol direct radiative
forcing act to minimize the net radiative effect and are approximately
proportional to the magnitude of the SW contribution; for instance,
the arg_min_smax (which has the largest SW contribution)
has the largest longwave effect. The small spread in direct effect in these
simulations correlates very strongly with the change in global-average
aerosol optical depth, but changes in that field are only loosely related to
changes in the available CCN.
The difference in SW radiative forcing between the comp and
_min_smax cases for the ARG and nenes
simulations is an important detail. Following
Fig. 6b, for both of these simulations the
_min_smax case produces a larger change in CDNC than the
comp one. However, the resulting comparative changes in SW
radiative forcing have opposite signs; for ARG the
_min_smax case has a larger (more negative) radiative forcing,
but for nenes it is smaller (less negative). By comparison, the
equivalent case for pcm (the _ols4 case) has a larger
radiative forcing than both pcm_main4 and pcm_gCCN3.
3.4 Potential influence of model response
The previously discussed changes in the indirect effect and net TOA SW
radiative flux potentially have implications for the model meteorology
observed in our simulations. Although modifying the activation schemes only
directly influences the cloud microphysics, the resulting changes in
radiative forcing could impact both the larger scale circulation and locally affect processes such as convection. To highlight this,
Fig. 10 illustrates the simulated annual climatology of
the convective precipitation rate for the baseline arg_comp simulation,
and Fig. 11 summarizes the absolute difference
between this metric for each of the other simulations with modified
activation schemes.
The majority of the global-average convective precipitation simulated by MARC
occurs in the intertropical convergence zone, extending from the Indian
Ocean basin into the Pacific around the equator. This region plays an
important role in the global SW radiative budget, as evidenced by both
the localized enhancement in cloud optical depth and SW CRE previously noted in Fig. 5. Each
of the simulations plotted in Fig. 11 yields an
increase in the global average convective precipitation rate; several of the
simulations, particularly those with smaller PD–PI SW radiative
forcing such as the nenes_min_smax and pcm_gCCN3 case,
show large localized increases in convective precipitation rate in the Indian
Ocean and western Pacific, with decreases over the Maritime Continent. In
contrast, changes in the large-scale precipitation rate generally decrease in the
global average, with the largest local changes following storm tracks in the
Northern Hemisphere and Southern Hemisphere (not shown here), with minimal changes in
the tropics.
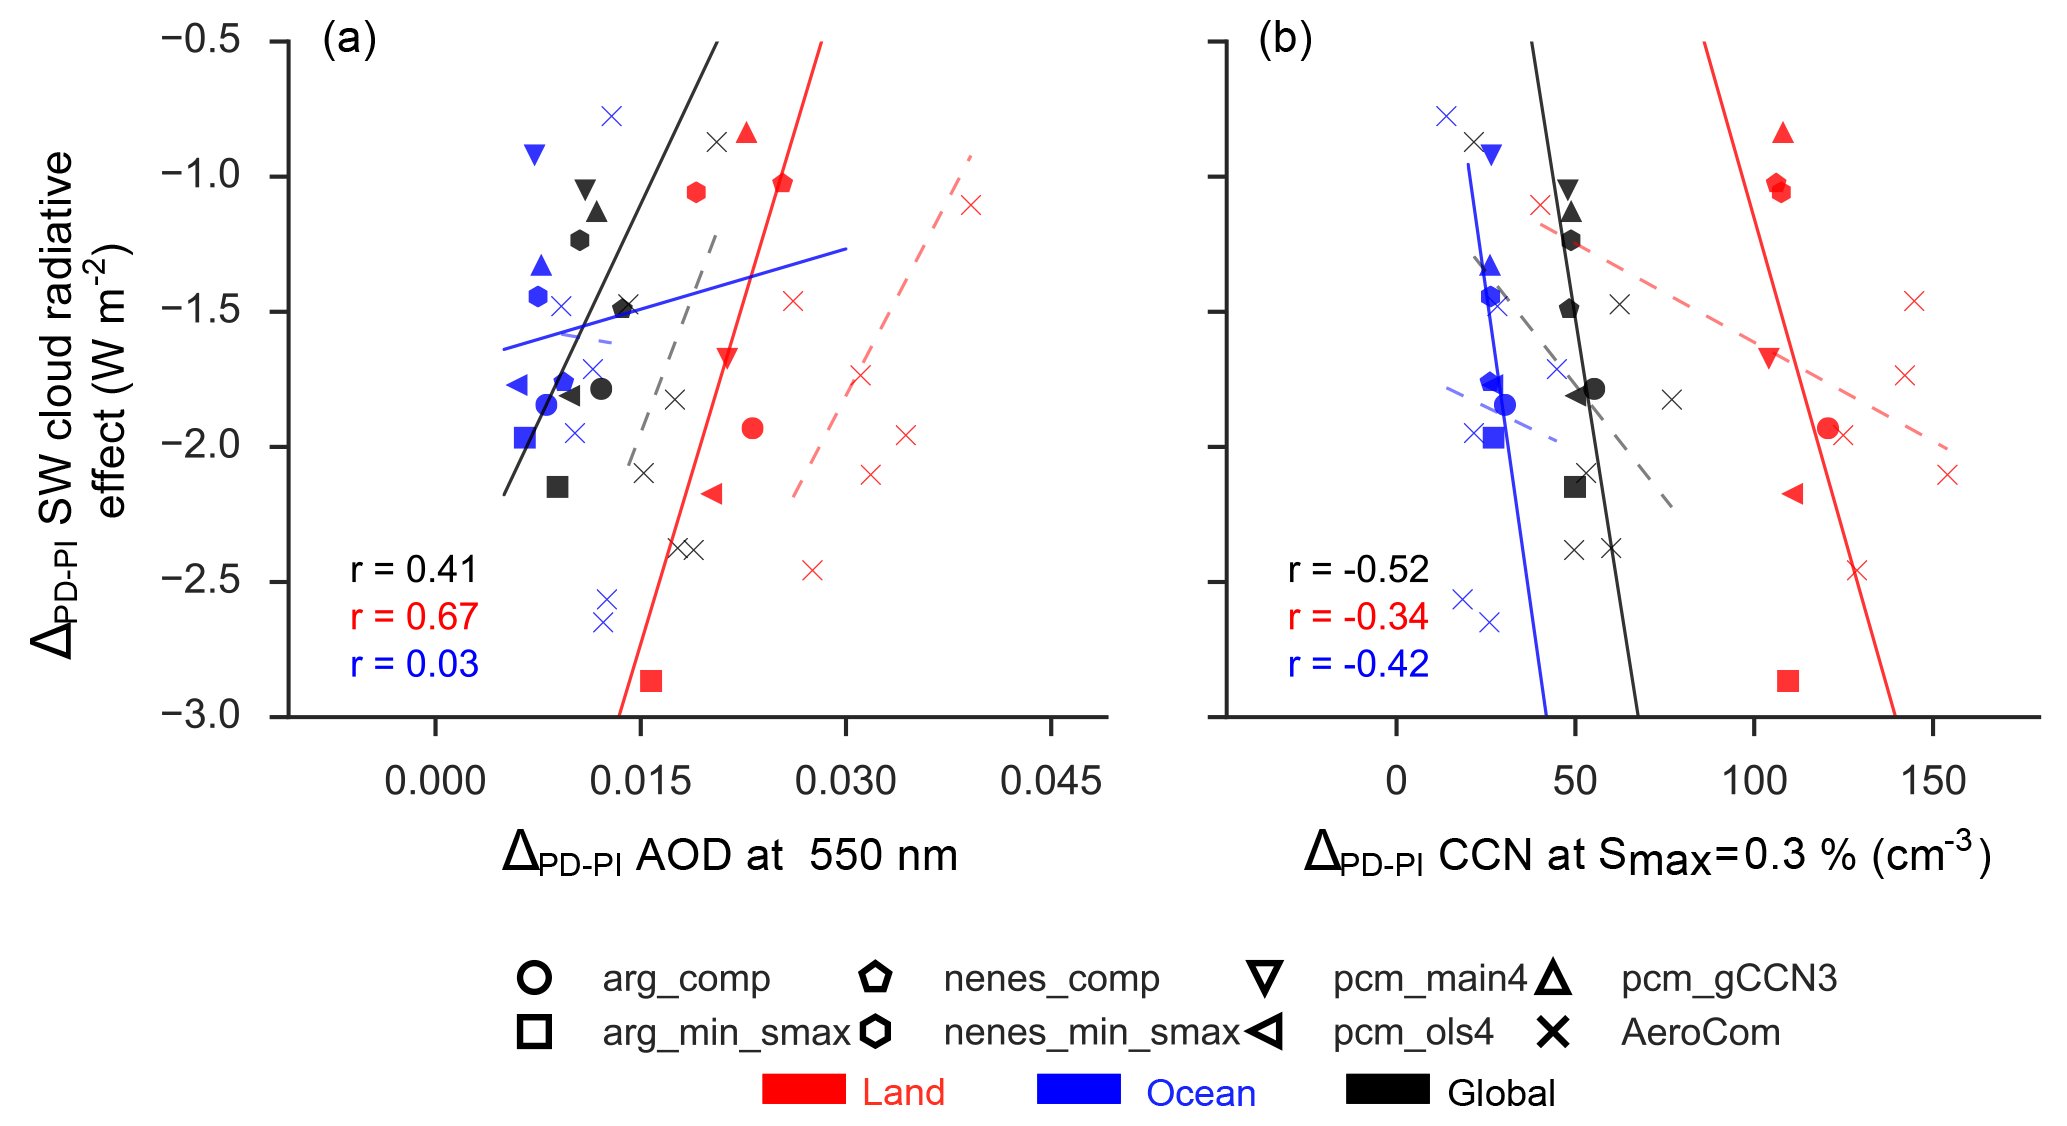
Figure 9Relationship between regionally averaged PD–PI change in SW CRE and aerosol optical depth (a) or CCN concentration (b). Colors denote averages over all land area (red), ocean (blue), or the whole globe (black). Glyphs denote MARC simulations with different activation schemes; X denotes AeroCom model. Linear regressions for MARC simulations are represented by solid lines, with the corresponding correlation coefficient indicated on the plot; linear regressions for AeroCom models are given by the dashed lines.
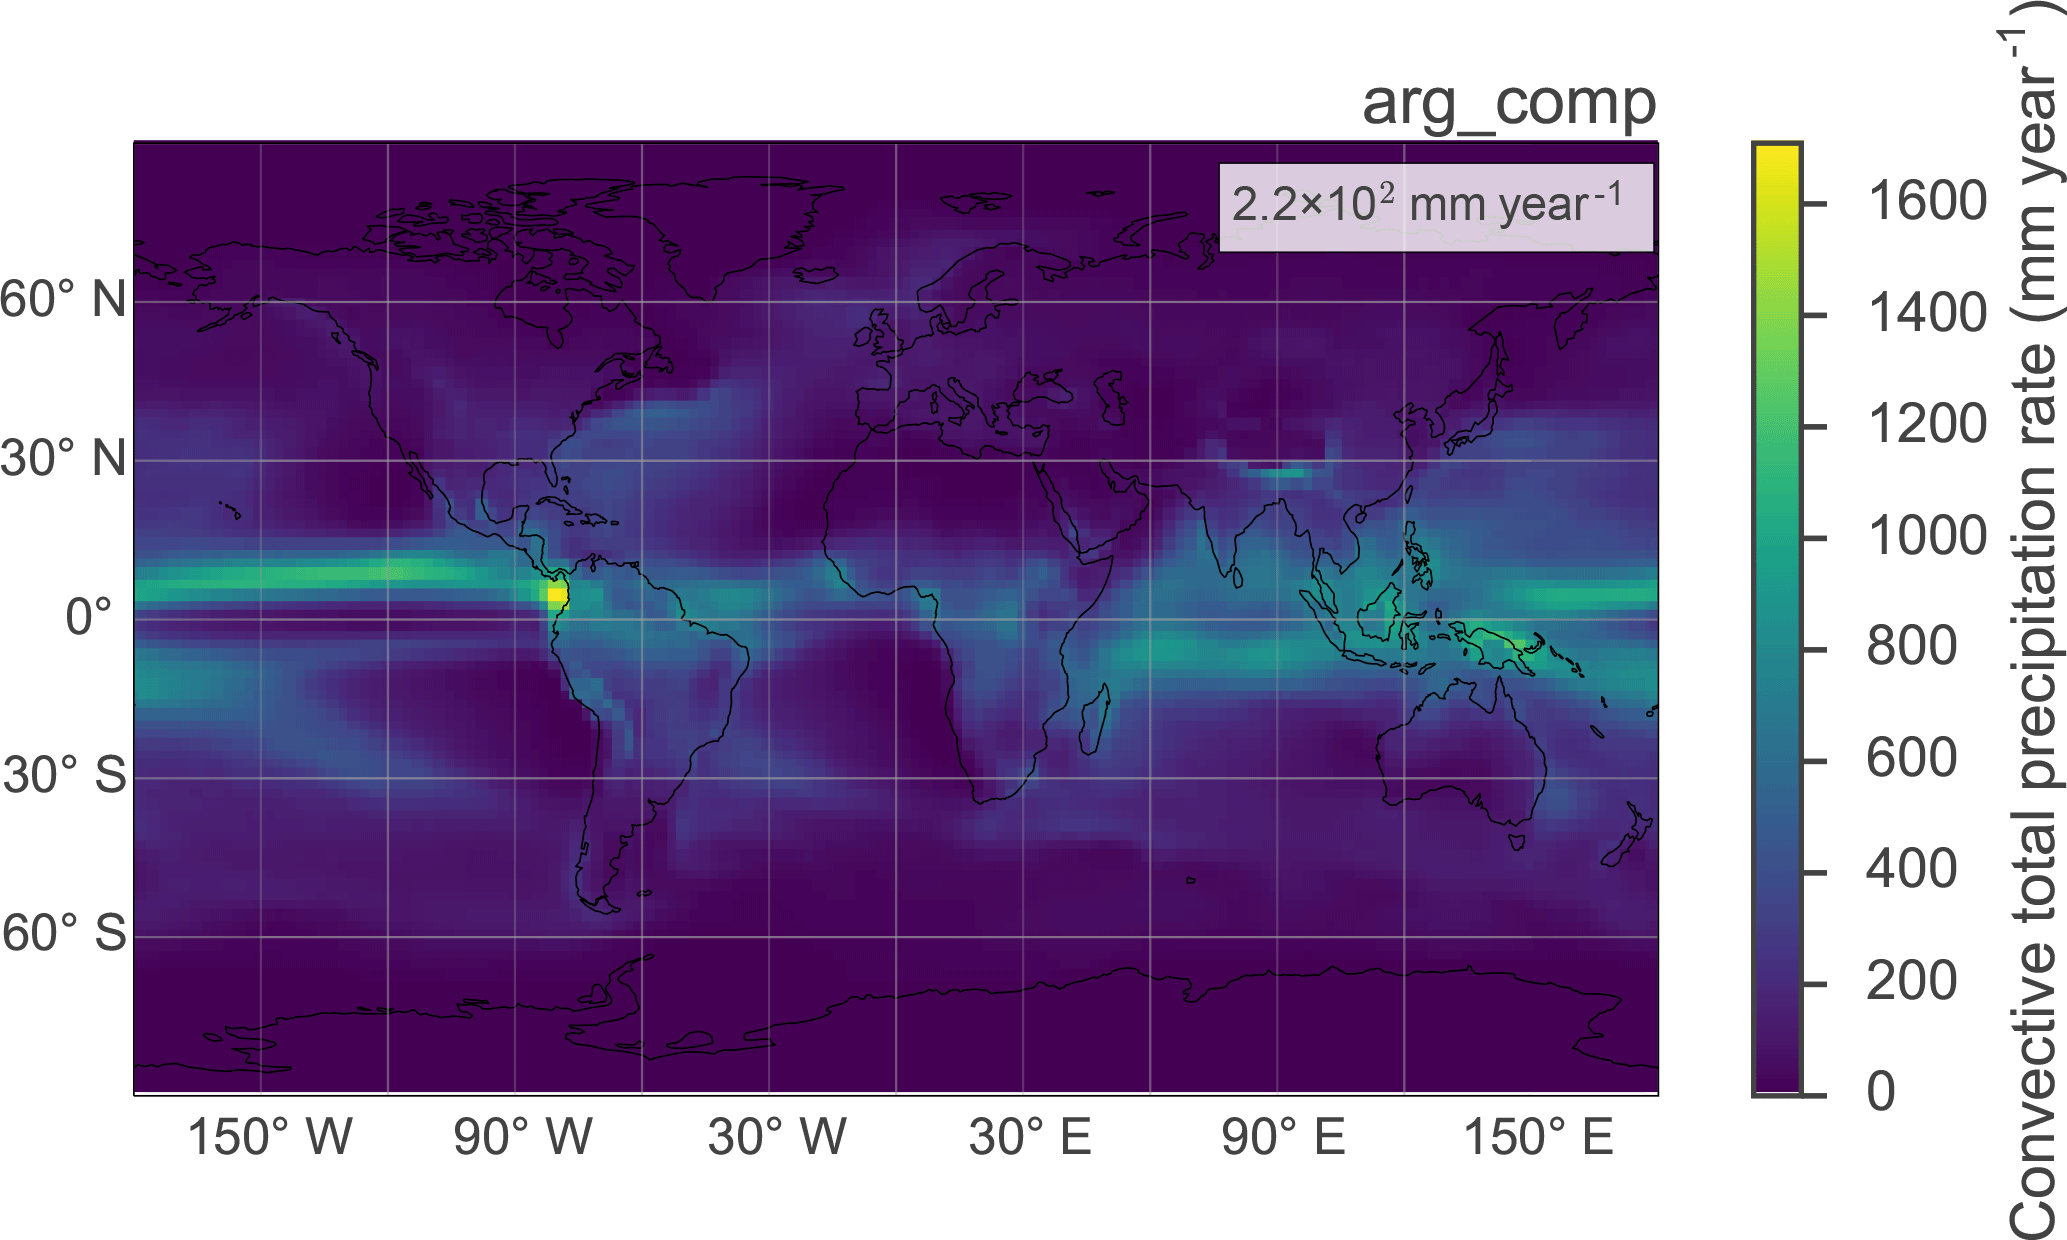
Figure 10Annual average convective precipitation rate in the present-day
arg_comp simulation.
These local increases of up to 10 % of the reference simulation convective precipitation rate suggest that local changes in meteorology might play a larger role in the observed changes in cloud optical depth and other radiative forcing diagnostics than local aerosol effects and their derivatives alone. For instance, the localized increases in convective precipitation rate observed in several of the simulations in Fig. 11 could correspond to changes in either the frequency or intensity of convective activity in these regions, which could partly explain some of the differences between simulated changes in cloud optical depths in the PD case. Aerosol activation does not explicitly or directly impact convection as simulated by MARC, but both local and nonlocal impacts from aerosol forcing could influence the model-simulated meteorology in such a way that bolsters convective activity. Some of these changes in meteorology could arise from other parameterizations embedded in MARC, particularly the deep convection scheme, each of which may have their own idiosyncrasies and produce complex interactions with each other.
Because of these effects, the potential role of the meteorological response in contributing towards the observed changes in cloud optical depth and thus SW CRE in the simulations presented here confounds to some extent the purely activation-driven changes.
3.5 Indirect effect sensitivity to aerosol–cloud perturbations
We highlight in Fig. 9 the relationship between the change in SW CRE to model-simulated aerosol burdens over maritime and continental regions. The increase in direct aerosol and precursor gas emissions in the PD emission case leads to an increase in both AOD and the availability of CCN. However, the exact magnitude of this increase is dependent on the formulation of the aerosol module in each model, especially their simulated size distributions. Inter-model spread in the PD case for AOD and its sensitivity to perturbation from the PI climate has been associated with up to a 0.5 W m−2 spread in estimates of the direct effect (Shindell et al., 2013), but it also has implications for the indirect effect following Fig. 9a.
The largest AOD increases occur over land, and these are also associated with larger perturbations to SW CRE. The MARC simulations and most of the AeroCom models do not simulate major increases in AOD over the ocean, even while there is considerable spread in the magnitude of ΔCRE in that regime. One potential explanation for the small response in AOD over these ocean regimes could be that AOD is dominated by large natural aerosol such as sea salt in these regions, which would not directly increase in response to anthropogenic emissions.

Figure 11Absolute difference between present-day annual average convective
precipitation for each of the indicated simulations versus the
arg_comp reference simulation.
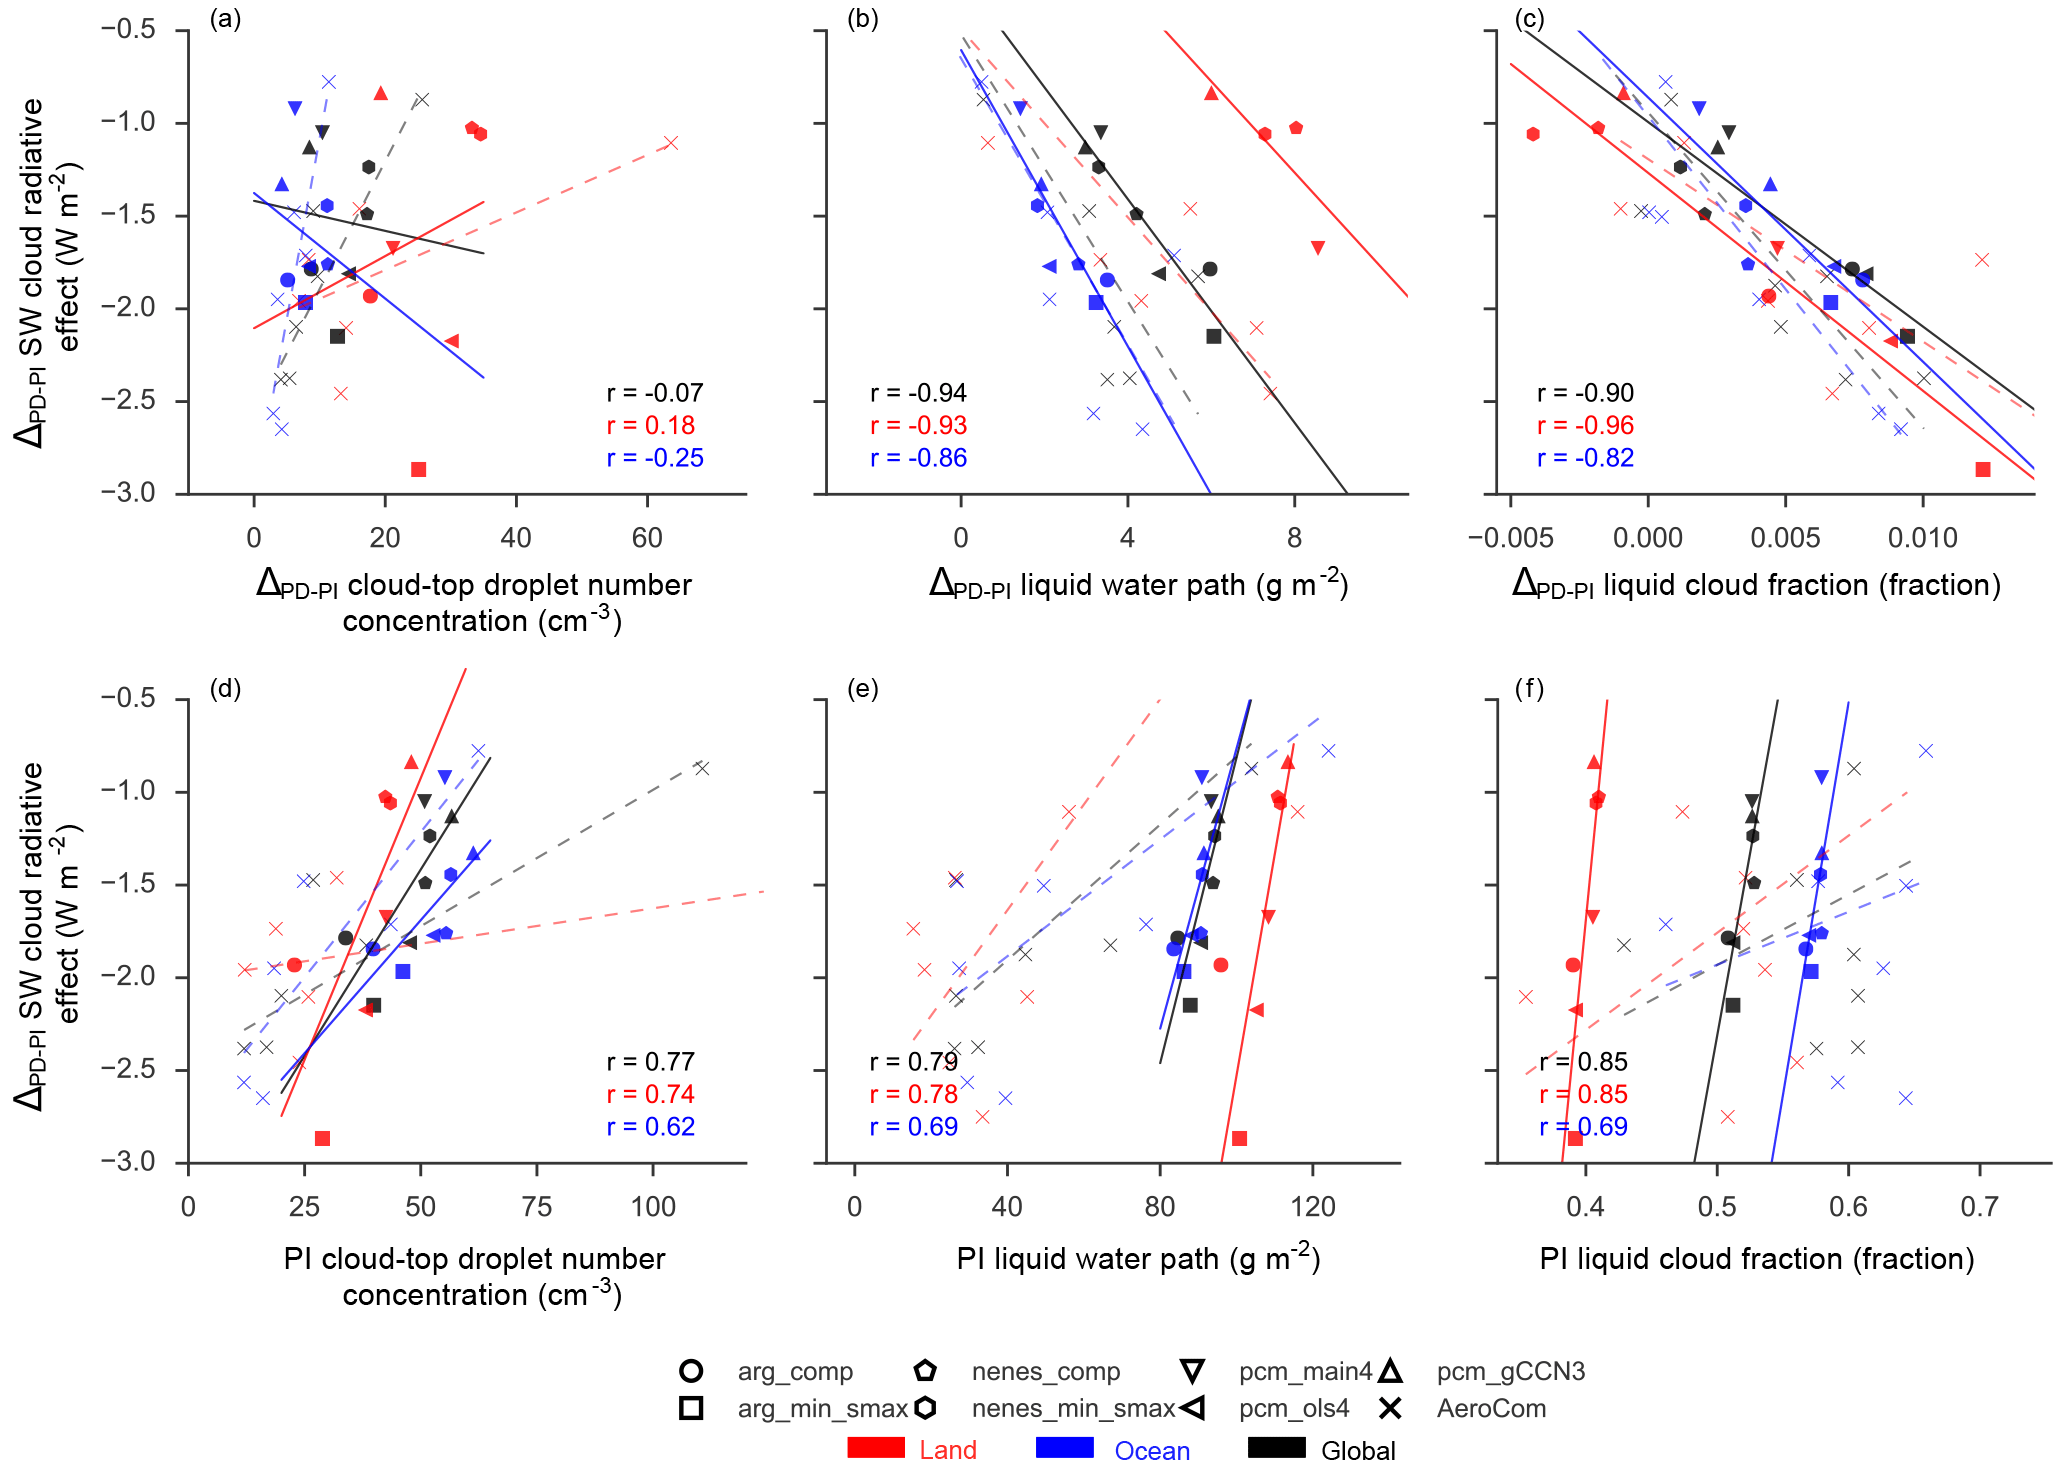
Figure 12Similar to Fig. 9; panels (a)–(c) denote the relationship between PD–PI changes in SW CRE and cloud properties, and panels (d)–(f) show regression versus averages from the PI emissions scenario.
CCN also directly increases with anthropogenic emissions. However, in contrast with AOD, small PD–PI changes in CCN are associated with a larger (more negative) indirect effect (Fig. 9b). For the entire set of AeroCom models and the MARC simulations performed here, as the model-simulated ΔAOD increases, the indirect effect becomes weaker. The slope of the ΔCCN–ΔCRE relationship is much steeper for the MARC simulations than the AeroCom ones (due to an outlier model with relatively insensitive CCN fields). Different aerosol metrics have previously been shown to have different relationships with model- and satellite-derived estimates of the indirect effect, but they usually have the same sign (Penner et al., 2011). This suggests that each metric is capturing a different facet of the aerosol size distribution which may or may not be relevant to changes in the indirect effect, depending on how they influence CDNC, which would potentially be conditioned on the initial climatology of CDNC simulated under a PI emissions case.
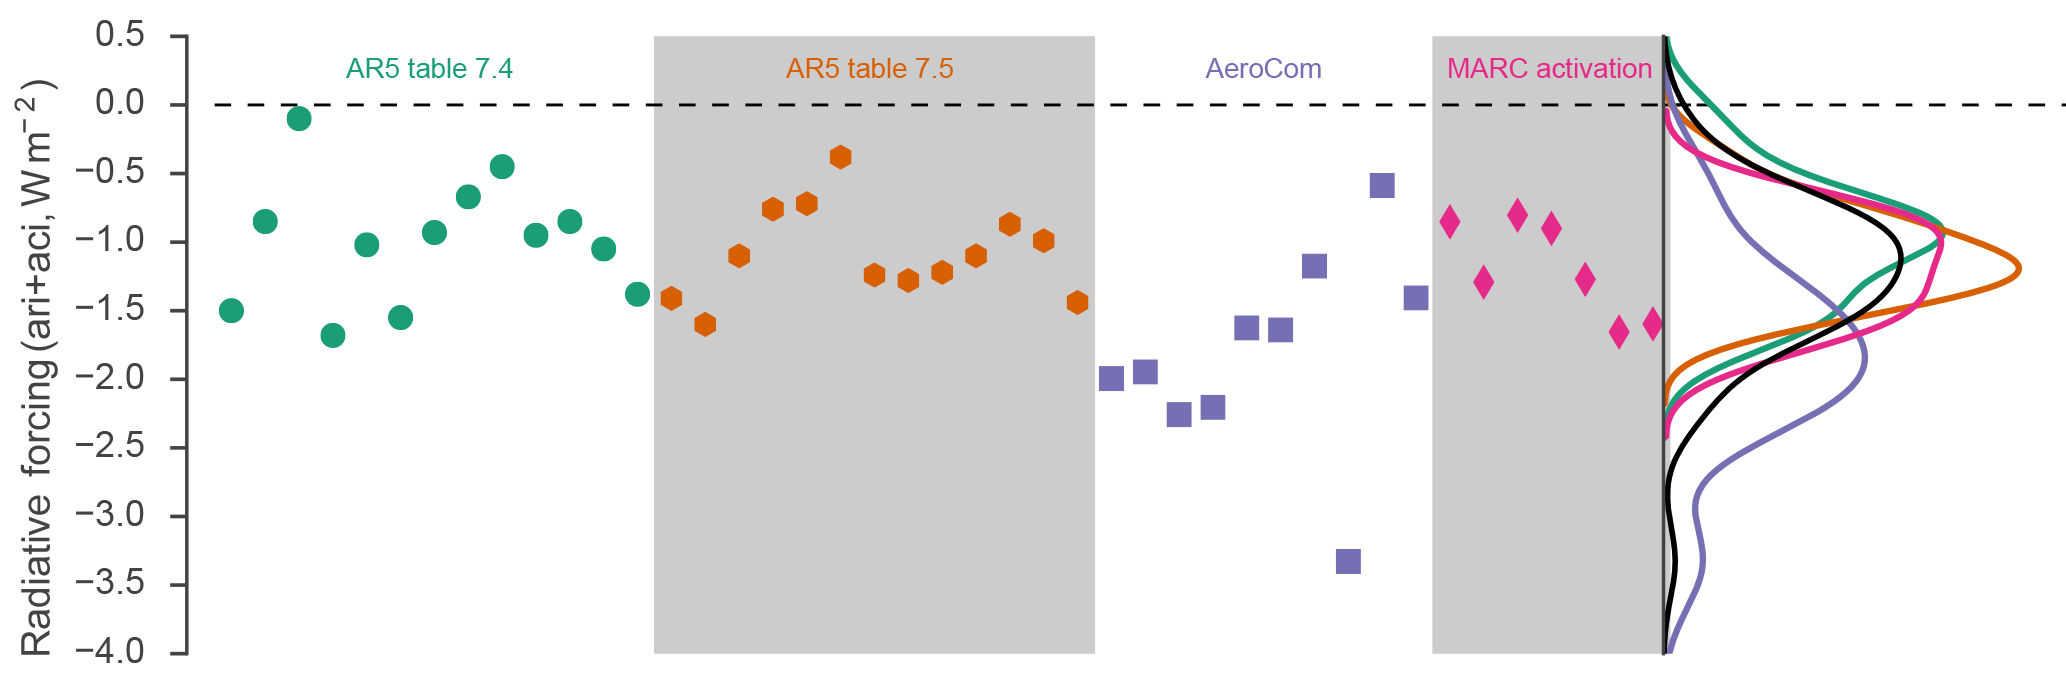
Figure 13Comparison between estimates of ERFari + aci derived here and a subset of those previously reported by the IPCC AR5. Corresponding kernel density estimates of the distribution of ERFari + aci are given in the right-hand panel; the solid black curve shows the distribution accounting for all the estimates on the plot.
To assess this influence, we plot similar relationships between CDNC, liquid water path (LWP), and liquid cloud fraction in Fig. 12. The spread change in CDNC between different models very weakly correlates with the strength of the indirect effect (Fig. 12a). Instead, a much better predictor of the indirect effect is the preindustrial CDNC (Fig. 12b), which itself strongly positively correlates with the change in CDNC between PI and PD. This is evident in Fig. 12b, which shows a positive correlation between preindustrial CDNC levels and the indirect effect, such that as PI CDNC increases, Δ CRE decreases (becomes more negative). The models which produce higher CDNC for the same background or natural aerosol tend to have weaker indirect effects.
The liquid water path and cloud fraction exhibit a different relationship with the indirect effect (Fig. 12c–f). Using different activation schemes in MARC directly influences the sensitivity of LWP to aerosol perturbation through enhancement of CDNC, which strongly modulates the indirect effect. Although MARC generally simulates much larger LWP in the PI case, the range of indirect effects it simulates spans the spread of those obtained from the AeroCom models. The same relationships hold for liquid cloud fraction, which is correlated with LWP in both MARC and the ensemble of AeroCom models, particularly for oceanic regimes. The AeroCom models simulate far more diversity in LWP and cloud fraction in the PI case, but tend to agree on the magnitude of change in PI and PD, as does MARC.
Using different activation cases produces larger differences in simulated PI CDNC versus either LWP or cloud fraction. This suggests that the large-scale cloud properties in MARC are insensitive to the background aerosol level. Instead, changes in the simulated indirect effect arising from the different activation schemes are dominated by the first indirect effect and a change in the ambient CDNC burden, which is driving microphysical changes leading to the observed perturbations in both cloud optical properties and their spatiotemporal distribution.
3.6 Summarizing the influence of aerosol activation
To contextualize the influence of aerosol activation on the indirect effect in the simulations presented here, we plot estimates of the indirect effect (ERFari + aci) reported by Boucher et al. (2013) in Fig. 13. These include a highlighted subset of models and results combining satellite observations with model analysis (Fig. 13, AR5 Table 7.4), results from a previous model intercomparison using CMIP-class models (Fig. 13, AR5 Table 7.5 Shindell et al., 2013), and new estimates derived from the AeroCom models considered here and the various configurations of MARC with different activation schemes. The estimates presented here span a wide variety of potential model physics and aerosol couplings and, therefore, different aerosol indirect effects.
In our simulations with MARC, differences in aerosol activation produce a spread in estimates of the indirect effect comparable in magnitude to the total inter-model diversity. Furthermore, our estimates – especially for the configurations with lower CDNC – tend to cluster in the higher end of estimates compared to previous intercomparisons. The same is true for the AeroCom models considered here, although we note that four of the AeroCom models are closely related variants of the same parent model as MARC (the NCAR CAM5.3), and therefore the estimates are not totally independent of one another.
Our range of indirect effects induced by different activation treatments is
much larger than the few others reported in the literature. By reordering
the droplet activation calculation in each model timestep,
Gettelman (2015) induced a 0.43 W m−2 decrease in the
magnitude of the indirect effect; Ghan et al. (2011) reduced it by just
0.16 W m−2 when switching between two different activation
schemes. This range is much smaller than the sensitivity of
0.86 W m−2 we report for the experiments conducted here. We note
that both of those previous estimates of the sensitivity of the indirect
effect to activation used nearly identical global models (early versions of
the NCAR CAM5 with the same aerosol module). Our use of a unique aerosol
model could contribute to some of the difference in the range of estimates of
the indirect effect. This possibility can indirectly be tested using the
suite of model results presented in this work, since one AeroCom
model included is the NCAR CAM5.3 in its default configuration, which should be nearly
identical to the arg_comp MARC configuration here save for the
different aerosol module. The difference in ERFari + aci between these
two simulations is 0.45 W m−2, which is half of the total range
reported here for MARC with different activation schemes.
Additionally, we note a non-negligible meteorological response to the changes in activation in some of our simulations, particularly with regards to convective activity in the tropics. These changes in meteorology might imprint on the estimated sensitivity of MARC to changes in the activation scheme, since they can produce effects in cloud optical depth or other fields which influence the SW CRE.
In this study, we have quantified the influence of the representation of droplet activation in global models on the sensitivity of the aerosol indirect effect. Using a suite of state-of-the-science activation parameterizations incorporated into our global aerosol-climate model, MARC, we performed simulations under both preindustrial and present-day aerosol emissions scenarios to estimate the magnitude of the indirect effect and its relationship to changes in both cloud and aerosol fields. Previously, few studies exploring the indirect effect focused explicitly on the role of droplet activation, instead concentrating on either the processes that produce ambient aerosol itself (emissions and atmospheric chemistry) or the results of changes occurring purely in cloud droplet number concentration (such as imposed minimum values for cloud droplet number or in microphysical processes which modify it).
Beyond assessing three unique activation schemes, we supplement our analysis by considering three additional, idealized droplet activation schemes which use a heuristic to simplify accounting for competition between different aerosol modes for moisture during the nucleation process. Including these heuristics provides more than just additional variability in the activation schemes studied here. Previous work has shown that for many aerosol–meteorology parameter combinations arising in a global model, a single dominant mode (typically the accumulation mode, especially if it is mostly comprised of sulfate) tends to be a good predictor for the activation dynamics of the full aerosol population (Rothenberg and Wang, 2017). Our results here indicate that the small differences in droplets nucleated, assessed through this heuristic for a given activation scheme, can have very large impacts on clouds and radiation in the global average, even if it only leads to small regional changes in those fields. Additionally, this suggests a caveat that must be tackled when these activation schemes are used with novel aerosol-climate models: compared to more detailed parcel model calculations, the sensitivity and accuracy of the activation schemes may be impacted by the precise size and number distributions produced by a given modal or sectional aerosol formulation. Documenting these sensitivities when evaluating new aerosol-climate models would provide useful information for contextualizing aerosol–cloud interactions simulated by those models relative to others.
The relationship between cloud droplet number concentration and aerosol in MARC is critically influenced by the representation of droplet activation. Estimates of CDNC in the present-day climate are up to 40 % higher in polluted regimes when using the most-sensitive activation scheme, and the increase from preindustrial to present-day emissions is up to twice as large. CDNC in regimes dominated by natural aerosol, especially remote marine regions with prevalent sea salt, is also impacted by the activation scheme. Using the advanced droplet activation schemes included here, which explicitly account for biases due to giant CCN particles, helps reduce the underprediction in maritime regimes compared to satellite observations and in polluted regimes compared to in situ observations. However, MARC systematically produces CDNC that is too low in most parts of the globe. While this could be due to misrepresentation of aerosol–cloud processes, we emphasize that it could also be fundamentally related to the simulated aerosol size distribution within MARC and how it apportions aerosol number and mass in the size ranges where likely CCN reside. However, evaluations of previous versions of the model (Wang, 2004; Kim et al., 2008; Ekman et al., 2012) and those presented in the Supplement to this work suggest that MARC captures the bulk aerosol climatology rather well across the globe; thus, these systematic biases in CDNC and CCN could apply to other aerosol-climate models as well. Future work will more explicitly compare the simulated aerosol fields versus the original aerosol module coupled to the CESM to better understand how these differences contribute to simulated aerosol direct and indirect effects.
We note that MARC's underprediction of CDNC may contribute to an oversensitivity of the indirect effect to perturbations in aerosol emissions. This is best understood in the context of Twomey (1991) and Carslaw et al. (2013); in regimes where CDNC is low, cloud albedo can be particularly sensitive to changes in a baseline CDNC level. Therefore, it is plausible that the AIE simulated by MARC may be more sensitive to the details of activation than other similar aerosol-climate models would be.
Compared to available satellite measurements and the models participating in the AeroCom intercomparison, though, MARC does well at capturing the present-day climatology of cloud and radiation fields, likely because its parent model, the NCAR CESM, is itself well tuned towards this end. However, the details of activation and how it influences cloud microphysics plays a major role in setting the SW CRE. Under present-day emissions, the differences between that effect for each of the different activation schemes is as large as the change from the preindustrial case for each scheme. This leads to large differences in the modeled indirect effect in each model, almost entirely occurring due to the SW CRE. The resulting spread in indirect effect estimates is twice as large as that previously reported by studies considering activation, and about as large as the inter-model spread from both historical and recent model intercomparisons, which consider models including a variety of different aerosol effects.
We note that the preindustrial CDNC burden is a very strong predictor of the
strength of the indirect effect, but not necessarily the change between
preindustrial and present-day emissions; this hints at the previously hypothesized
buffering effect of clouds on aerosol perturbations (Stevens and Feingold, 2009). Our
analysis strongly supports this notion; our case which produces the largest
change in CDNC, nenes_min_smax, yields nearly the smallest
indirect effect, but simultaneously produces the highest values for
preindustrial CDNC. While consistent with the results of Hoose et al. (2009),
this is opposite to the results reported by Storelvmo et al. (2009), although
their model uses prescribed aerosol fields, so there is no interaction between
cloud and aerosol processes. Changes in liquid water path and cloud fraction
correlate strongly with modeled total changes in CRE but
poorly with changes in CDNC in our simulations. This suggests that the
buffering effect must be dominated by changes in the second indirect effect,
rather than the first. Both of these relationships hold for the broader
sample of models provided by the AeroCom intercomparison.
Additionally, we note that in our simulations with MARC, changes to the activation scheme seem to elicit local meteorological responses beyond those that might be directly accounted for by changes in cloud microphysics alone. In particular, we noted changes in convective precipitation in the tropics that might hint at changes in the frequency and/or intensity of convection which imprint on the local climatology and sensitivity of cloud optical depth to aerosol perturbation. Model meteorological responses confound to at least some extent the changes in the AIE arising from the initial changes to the activation schemes. The largest changes in convective precipitation rate are associated with a smaller AIE, though, potentially pointing to a buffering effect when considering that these simulations also have the largest PI CDNC burdens. To address this potential confounding impact, future work should address whether or not this is an idiosyncrasy of MARC or a more general result by carrying out similar simulations with alternative global aerosol-climate models.
The weight of these results suggests an important role of activation in setting the sensitivity of the indirect effect. However, we caution that our approach is not able to disentangle the influence of activation from that due to the underlying aerosol model and its implicit aerosol size and CCN distributions. This is not meant to diminish the influence of cloud microphysical treatments on the indirect effect; Gettelman (2015) illustrates the importance of the implicit cloud lifetime effects arising from liquid water path changes associated with aerosols in contributing to the indirect effect. But since these relationships are themselves highly sensitive to simulated CDNC, the influence of the aerosol size distribution and activation is somewhat more fundamental and just as poorly constrained by available observations. Furthermore, because of the chain of sensitivities initiating with the aerosol size distribution and activation, estimates of the indirect effect produced from models with highly simplified aerosol–CDNC relationships (such as explicitly prescribed CDNC or empirical fits to aerosol mass or volume) are likely significantly biased.
To test this idea, additional work following this and Kodros and Pierce (2017), where the embedded aerosol model in a given global model is substituted while all other physics remain the same, could prove useful. We also suggest that future sensitivity analyses in the vein of Carslaw et al. (2013) include perturbations to the fundamental activation or CCN–CDNC relationship to account for this source of uncertainty. Constraining this uncertainty is a different matter altogether. Current observations can not constrain the spatiotemporal variance in the ambient aerosol size distribution, which is critical in setting the sensitivity of CDNC and cloud optical properties to aerosol perturbations. New data from aircraft sampling clouds in regimes with the greatest aerosol–cloud sensitivities across the globe could play a key role in addressing this limitation.
In order to better understand contemporary climate change and account for its future trajectory, the aerosol community must continue to seek constraints on the aerosol indirect effect. Although epistemic uncertainty due to unknown preindustrial emissions complicates this task, the role of droplet activation illustrated in this work highlights an additional path that the community may explore to provide indirect or emergent constraints on the AIE via the basic aerosol–CDNC relationship.
A Git repository archiving the scripts and build files used to process the MARC and AeroCom output and perform the analyses presented in this work can be found at https://github.mit.edu/darothen/aerocom_activation; documentation on which scripts and notebooks perform which analyses can be found in the README.md file therein. The source code for MARC can be found in a Git repository at https://github.mit.edu/marc/marc_cesm, as well as instructions for setting up the model from a standard CESM installation; MARC v.1.0.2 was used in this work (Avramov et al., 2016). The emissions datasets and scripts used to generate them for this work are archived at https://github.mit.edu/marc/marc_input (Avramov and Rothenberg, 2016).
Output from the simulations used in this analysis are available upon request.
Droplet nucleation, or aerosol activation, refers to the process through which aerosols, which are entrained through the base or sides of a cloud, grow into a nascent cloud droplet population. Assessing this process is complicated by the fact that latent heat release from condensation on the surface of aerosol within an adiabatically ascending (and therefore cooling) parcel provides a strong feedback, limiting the development of supersaturation (relative humidity over 100 %) and thus the potential for some particles (usually referred to as cloud condensation nuclei, or CCN) to grow into droplets. Contrary to its common usage in the field, CCN is not necessarily a stand-alone, diagnostic measure of a given aerosol population; instead, all aerosols are potentially CCN, given an updraft sufficient enough in strength to drive a high enough supersaturation such that they grow large enough to activate. In the ensuing discussion, we eschew the term CCN and instead focus explicitly on total aerosol number (Na) and cloud droplet number (Nd), emphasizing the importance of the activation process in determining how many particles will nucleate a droplet.
The aerosol size distributions predicted by MARC are explicitly used to constrain droplet activation in the stratiform cloud microphysics scheme; the shallow and deep convection schemes do not include the prognostic droplet number. With respect to stratiform clouds, activation is driven by a characteristic sub-grid-scale vertical velocity derived from the turbulent kinetic energy (TKE) predicted by the University of Washington shallow convection and moist turbulence parameterization (Park and Bretherton, 2009):
All of the aerosol species described in Table 1 – except for the pure BC and OC modes – are included in droplet activation calculations. Each mode is assigned a fixed hygroscopicity (Petters and Kreidenweis, 2007), except for the mixed sulfate–organic carbon (MOS) mode, for which the hygroscopicity is computed as a volume-weighted mean based on the amount of each species present. Dust is assumed to be comprised of weakly hygroscopic minerals following Scanza et al. (2015); the mixed sulfate–black carbon mode (MBS) particles are assumed to have a surface area purely comprised of sulfate, which dictates their hygroscopicity.
In this work, we have implemented several additional activation schemes and associated variants. Fundamentally, each activation scheme attempts to simplify the calculation of the maximum supersaturation achieved in a parcel under the simultaneous influence of both cooling from adiabatic ascent and warming from latent heat release as water condenses on particles contained within the parcel. The total of this physical process can be summarized in a single, integro-differential equation:
Here, α and γ are functions weakly dependent on the parcel's temperature and pressure, V is the velocity of the parcel's adiabatic ascent, r2(tact) indicates the size of a given parcel at the time it activates (when it grows large enough that, following Köhler theory, further condensational growth is thermodynamically favorable even if the relative humidity drops; Seinfeld and Pandis, 2006), G is a particle-dependent condensational growth coefficient, tmax indicates the time at which the maximum supersaturation achieved in the parcel, Smax, occurs, and represents the aerosol size distribution rewritten in terms of Köhler theory and expressed as a function of a particle's “critical” size. For a rigorous derivation of Eq. (A2) and discussion on the assumptions necessary to simplify it, we refer the reader to Ghan et al. (2011).
It is immediately useful to simplify Eq. (A2) by partitioning the integral over dS into two ranges, [0,Spart] and [Spart,Smax]. These ranges effectively split the aerosol population into a subset of aerosols which do not grow very much between tact and tmax and a subset of aerosols which do. Partitioning the integral in this produces the following alternative formulation:
The first two activation schemes employed in this study utilize this formulation of the activation equation; the third implicitly uses the equation, albeit in an alternative form as a system of coupled ordinary differential equations.
A1 Abdul-Razzak and Ghan (2000) (ARG)
Abdul-Razzak et al. (1998) assumed the aerosol size distribution can be
described by a single lognormal mode, and parameterized the dependence
between Smax and the critical supersaturation of the geometric mean
radius of that mode, Sm. This parameterization yields two
nondimensional terms, ηm and ζ. The mode geometric mean
standard deviation, σg, does not appear in either term,
allowing Abdul-Razzak and Ghan (the version used here; ARG)
to use a parcel model to relate Smax to Sm, ηm, ζ, and σg. Although originally tuned assuming
a condensation coefficient (αc) of unity, Ghan et al. (2011)
proposed scaling G in the expressions for ηm and ζ to
account for smaller values. However, within the scheme, G is determined in
such a way that the ARG scheme neglects gas kinetic effects
completely and cannot be easily extended to account for organic films or
surfactants, or other effects which may model surface tension or
αc on a particle-by-particle basis.
A2 Morales Betancourt and Nenes (2014b) (nenes)
Nenes and Seinfeld (2003) developed an iterative scheme to solve Eq. (A2) based on a sectional aerosol distribution, which Fountoukis and Nenes (2005) extended to accommodate lognormal modes. The iterative nature of its computation allows the scheme to branch under two conditions. In the first, when kinetic limitations on droplet growth are expected, Smax and Spart are parameterized empirically from a suite of precomputed numerical simulations. In the alternative branch, the integrals in Eq. (A2) are analytically computed with the assumption that ; in other terms, particles which activate do not grow much beyond their critical size. The resulting set of equations is similar to the one derived by Abdul-Razzak and Ghan (2000), owing to their common starting point and lognormal-mode assumptions.
Owing to its flexibility, the iterative scheme has been successively modified
over the course of several follow-on papers. Barahona and Nenes (2007)
incorporated the effect of entrainment on a parcel in which activation
occurs; Kumar et al. (2009) added the ability to include insoluble CCN using an
adsorption framework; Barahona et al. (2010) modified the original equations to
comprehensively account for the impact of giant CCN; and
Morales Betancourt and Nenes (2014a) (the version used here; nenes)
revised the population-splitting approach underlying the iterative scheme to
better handle giant CCN and avoid an unphysical discontinuity in their
branching conditions. Critically, these schemes improve on the ARG
scheme by accounting for the interplay between gas kinetics and the
diffusivity of water vapor. To accomplish this, the schemes compute G using
an average value of the diffusivity over a particle size range corresponding
to the mode undergoing activation. This obviates the need for scaling G
based on the chosen value of αc.
However, there are two drawbacks to this method. First, the need for a
reference parcel model for tuning is not completely eliminated; the branch
of the iterative scheme accounting for kinetic limitations still requires an
empirical relationship. Second, the iterative scheme can be much more
computationally expensive than the ARG scheme, since the
calculations – including costly error function evaluations – must be
performed multiple times.
A3 Rothenberg and Wang (2016) (PCM)
An alternative approach to parameterizing droplet activation calculations involves building look-up tables for inclusion in global models. However, this approach is not widely used; in a modern model, the parameter space influencing activation is very large, and covering such a space in a look-up table is intractable. Fundamentally, a look-up table is a cache of results from a higher complexity model (in this case, a detailed parcel model), which are used to generate a piecewise-planar response surface on the fly during model run time. With respect to activation, look-up table emulation has been successfully employed with cloud-resolving models featuring simple aerosol/CCN distributions (Ward et al., 2010; Ward and Cotton, 2011) and to improve the performance of activation schemes in global models (Ming et al., 2006).
Rothenberg and Wang (2016) applied polynomial chaos expansion to emulate a
detailed parcel model simulating activation of a single lognormal aerosol
mode. The technique was later extended to analyze and assess activation of a
full-complexity aerosol scheme (Rothenberg and Wang, 2017). These schemes provide
a means to efficiently embed the physics of a full-complexity parcel model
within the context of a global model. The PCM scheme provides a
polynomial function mapping a set of predetermined input parameters (such as
the parcel updraft speed, temperature/pressure, and the moments closing the
aerosol size distribution) to a value of Smax, which can then be
used to diagnose equilibrium droplet activation. Like a look-up table, a
cache of parameters (the coefficients of the mapping chaos expansion basis
polynomials) must be precomputed to use the PCM. However, the
highest order expansion of the eight terms reported in Rothenberg and Wang (2016)
required just 495 coefficients to be saved to disk, compared to an isotropic
or full-factorial design look-up table which would require 108 values for
the same setup.
Unlike the ARG and nenes schemes, feedbacks on the
development of S in a cloudy parcel due to kinetic limitations on droplet
growth are explicitly treated in the PCM scheme, as is the
dependence of condensation (G) on particles' composition and size. However,
inertial limitations on activation (where a particle may experience its
critical supersaturation, but has not yet grown large enough to explicitly
activate) remain a source of bias in the formulation applied here because of
the equilibrium assumption used to diagnose Nd from Smax.
Minimum Smax heuristic
Additionally, we supplement the PCM, nenes, and
ARG schemes with an alternative formulation for expressing the
competition between multiple aerosol modes to nucleate droplets.
Rothenberg and Wang (2017) showed that in the majority of cases, a single mode
“dominated” activation calculations; that is, there was one aerosol mode
which, when activated alone, in isolation of its competitor modes, provided a
strong constraint activation dynamics and accurately predicted Smax
within a few percent. This dominant mode is defined as the mode which, in
isolation of the other modes, produces the smallest Smax when
present in an adiabatically cooling air parcel. Using just the dominant mode
as a surrogate for the complete aerosol population will always lead to an
overprediction of Nd because neglecting additional modes
effectively limits the surface area of the aerosol available for
condensation, and thus the potential for a large source of latent heat
release to overcome adiabatic cooling in the parcel and limit the development
of Smax; this effect tends to dominate the reduction in the sink of
ambient water vapor which typically constrains Smax. However, a large ensemble of calculations
showed this overprediction of Nd to be small in most situations.
While there is no substitute for detailed calculations of droplet activation which
take into account all potential factors, using just the dominant mode for
assessing activation provides a simple heuristic for widening the pool of
potential activation schemes to couple in our model. For the ARG and
nenes schemes, the heuristic is applied by looping over each
available aerosol mode and computing activation independently. For the
PCM schemes, the same technique applies, but we use a chaos
expansion explicitly built for single-mode calculations. Including the
minimum Smax scheme variants in our global modeling calculations
allows us to explore the dependence of the indirect effect on the nuances of
droplet activation without resorting to imposing unphysical restrictions on
either cloud droplet number or aerosol activation dynamics.
The supplement related to this article is available online at: https://doi.org/10.5194/acp-18-7961-2018-supplement.
The authors declare that they have no conflict of interest.
The work in this study was supported by the National Science Foundation
Graduate Research Fellowship Program under both NSF grant 1122374 and NSF
grant AGS- 1339264, the National Research Foundation of Singapore through the
Singapore–MIT Alliance for Research and Technology and the interdisciplinary
research group of the Center for Environmental Sensing and Modeling, and the
US Department of Energy, Office of Science (DE-FG02-94ER61937). We thank
Steve Ghan (PNNL) and Athanasios Nenes (Georgia Tech) for reference
implementations of their activation parameterizations, and Natalie Mahowald
(Cornell) for assistance in tuning the natural dust simulations in
MARC.
Edited by: Graham
Feingold
Reviewed by: two anonymous referees
Abdul-Razzak, H. and Ghan, S. J.: A parameterization of aerosol activation 2. Multiple aerosol types, J. Geophys. Res., 105, 6837, https://doi.org/10.1029/1999JD901161, 2000. a, b, c, d, e
Abdul-Razzak, H., Ghan, S. J., Rivera-Carpio, C., Razzak, H. A., and Carpio, C. R.: A parameterization of aerosol activation: 1. Single aerosol type, J. Geophys. Res., 103, 6123, https://doi.org/10.1029/97JD03735,1998. a
Albani, S., Mahowald, N. M., Perry, A. T., Scanza, R. A., Zender, C. S., Heavens, N. G., Maggi, V., Kok, J. F., and Otto-Bliesner, B. L.: Improved dust representation in the Community Atmosphere Model, J. Adv. Model. Earth Sy., 6, 541–570, https://doi.org/10.1002/2013MS000279, 2014. a, b
Albrecht, B. A.: Aerosols, cloud microphysics, and fractional cloudiness, Science, 245, 1227–1230, https://doi.org/10.1126/science.245.4923.1227, 1989. a
Avramov, A. and Rothenberg, D.: Emissions scripts and datasets for MARC, Zenodo, https://doi.org/10.5281/zenodo.1260283, 2016. a
Avramov, A., Rothenberg, D., Garimella, S., and Wang, C.: MARC – Model for Research of Aerosols and Climate, Zenodo, https://doi.org/10.5281/zenodo.168192, 2016. a
Barahona, D. and Nenes, A.: Parameterization of cloud droplet formation in large-scale models: Including effects of entrainment, J. Geophys. Res., 112, D16206, https://doi.org/10.1029/2007JD008473, 2007. a
Barahona, D., West, R. E. L., Stier, P., Romakkaniemi, S., Kokkola, H., and Nenes, A.: Comprehensively accounting for the effect of giant CCN in cloud activation parameterizations, Atmos. Chem. Phys., 10, 2467–2473, https://doi.org/10.5194/acp-10-2467-2010, 2010. a
Barahona, D., Sotiropoulou, R., and Nenes, A.: Global distribution of cloud droplet number concentration, autoconversion rate, and aerosol indirect effect under diabatic droplet activation, J. Geophys. Res., 116, D09203, https://doi.org/10.1029/2010JD015274, 2011. a
Barth, M. C., Rasch, P. J., Kiehl, J. T., Benkovitz, C. M., and Schwartz, S. E.: Sulfur chemistry in the National Center for Atmospheric Research Community Climate Model: Description, evaluation, features, and sensitivity to aqueous chemistry, J. Geophys. Res.-Atmos., 105, 1387–1415, https://doi.org/10.1029/1999JD900773, 2000. a
Bennartz, R.: Global assessment of marine boundary layer cloud droplet number concentration from satellite, J. Geophys. Res., 112, D02201, https://doi.org/10.1029/2006JD007547, 2007. a
Bennartz, R. and Rausch, J.: Global and regional estimates of warm cloud droplet number concentration based on 13 years of AQUA-MODIS observations, Atmos. Chem. Phys., 17, 9815–9836, https://doi.org/10.5194/acp-17-9815-2017, 2017. a, b
Bogenschutz, P. A., Gettelman, A., Morrison, H., Larson, V. E., Craig, C., and Schanen, D. P.: Higher Order Turbulence Closure and Its Impact on Climate Simulations in the Community Atmosphere Model, J. Climate, 26, 9655–9676, https://doi.org/10.1175/JCLI-D-13-00075.1, 2013. a
Boucher, O., Randall, D., Artaxo, P., Bretherton, C. S., Feingold, G., Forster, P., Kerminen, V.-M., Kondo, Y., Liao, H., Lohmann, U., Rasch, P., Satheesh, S. K., Sherwood, S., Stevens, B., and Zhang, X. Y.: Clouds and Aerosols, in: Climate Change 2013: The Physical Science Basis, Contribution of Working Group I to the Fifth Assessment Report of the Intergovernmental Panel on Climate Change, edited by: Stocker, T. F., Qin, D., Plattner, G.-K., Tignor, M., Allen, S. K., Boschung, J., Nauels, A., Xia, Y., Bex, V., and Midgley, P. M., Cambridge University Press, Cambridge, UK, New York, NY, USA, chap. 7, 571–657,2013. a, b, c, d
Carslaw, K. S., Lee, L. A., Reddington, C. L., Pringle, K. J., Rap, A., Forster, P. M., Mann, G. W., Spracklen, D. V., Woodhouse, M. T., Regayre, L. A., and Pierce, J. R.: Large contribution of natural aerosols to uncertainty in indirect forcing, Nature, 503, 67–71, https://doi.org/10.1038/nature12674, 2013. a, b, c
DeMott, P. J., Prenni, A. J., Liu, X., Kreidenweis, S. M., Petters, M. D., Twohy, C. H., Richardson, M. S., Eidhammer, T., and Rogers, D. C.: Predicting global atmospheric ice nuclei distributions and their impacts on climate, P. Natl. Acad. Sci. USA, 107, 11217–11222, https://doi.org/10.1073/pnas.0910818107, 2010. a
Ekman, A. M. L.: Do sophisticated parameterizations of aerosol-cloud interactions in CMIP5 models improve the representation of recent observed temperature trends?, J. Geophys. Res.-Atmos., 119, 817–832, https://doi.org/10.1002/2013JD020511, 2014. a
Ekman, A. M. L., Wang, C., Wilson, J., and Ström, J.: Explicit simulations of aerosol physics in a cloud-resolving model: a sensitivity study based on an observed convective cloud, Atmos. Chem. Phys., 4, 773–791, https://doi.org/10.5194/acp-4-773-2004, 2004. a
Ekman, A. M. L., Wang, C., Ström, J., and Krejci, R.: Explicit Simulation of Aerosol Physics in a Cloud-Resolving Model: Aerosol Transport and Processing in the Free Troposphere, J. Atmos. Sci., 63, 682–696, https://doi.org/10.1175/JAS3645.1, 2006. a
Ekman, A. M. L., Engström, A., and Wang, C.: The effect of aerosol composition and concentration on the development and anvil properties of a continental deep convective cloud, Q. J. Roy. Meteor. Soc., 133, 1439–1452, https://doi.org/10.1002/qj.108, 2007. a
Ekman, A. M. L., Hermann, M., Gro, P., Heintzenberg, J., Kim, D., and Wang, C.: Sub-micrometer aerosol particles in the upper troposphere/lowermost stratosphere as measured by CARIBIC and modeled using the MIT-CAM3 global climate model, J. Geophys. Res.-Atmos., 117, 1–18, https://doi.org/10.1029/2011JD016777, 2012. a, b
Engström, A., Ekman, A. M. L., Krejci, R., Ström, J., de Reus, M., and Wang, C.: Observational and modelling evidence of tropical deep convective clouds as a source of mid-tropospheric accumulation mode aerosols, Geophys. Res. Lett., 35, L23813, https://doi.org/10.1029/2008GL035817, 2008. a
Fountoukis, C. and Nenes, A.: Continued development of a cloud droplet formation parameterization for global climate models, J. Geophys. Res., 110, D11212, https://doi.org/10.1029/2004JD005591, 2005. a
Gantt, B., He, J., Zhang, X., Zhang, Y., and Nenes, A.: Incorporation of advanced aerosol activation treatments into CESM/CAM5: model evaluation and impacts on aerosol indirect effects, Atmos. Chem. Phys., 14, 7485–7497, https://doi.org/10.5194/acp-14-7485-2014, 2014. a
Gettelman, A.: Putting the clouds back in aerosol–cloud interactions, Atmos. Chem. Phys., 15, 12397–12411, https://doi.org/10.5194/acp-15-12397-2015, 2015. a, b, c, d
Gettelman, A. and Morrison, H.: Advanced Two-Moment Bulk Microphysics for Global Models, Part I: Off-Line Tests and Comparison with Other Schemes, J. Climate, 28, 1268–1287, https://doi.org/10.1175/JCLI-D-14-00102.1, 2015. a, b
Gettelman, A., Liu, X., Ghan, S. J., Morrison, H., Park, S., Conley, A. J., Klein, S. A., Boyle, J., Mitchell, D. L., and Li, J.-L. F.: Global simulations of ice nucleation and ice supersaturation with an improved cloud scheme in the Community Atmosphere Model, J. Geophys. Res., 115, D18216, https://doi.org/10.1029/2009JD013797, 2010. a
Gettelman, A., Kay, J. E., and Shell, K. M.: The Evolution of Climate Sensitivity and Climate Feedbacks in the Community Atmosphere Model, J. Climate, 25, 1453–1469, https://doi.org/10.1175/JCLI-D-11-00197.1, 2012. a
Ghan, S. J.: Technical Note: Estimating aerosol effects on cloud radiative forcing, Atmos. Chem. Phys., 13, 9971–9974, https://doi.org/10.5194/acp-13-9971-2013, 2013. a, b
Ghan, S. J., Abdul-Razzak, H., Nenes, A., Ming, Y., Liu, X., Ovchinnikov, M., Shipway, B., Meskhidze, N., Xu, J., and Shi, X.: Droplet nucleation: Physically-based parameterizations and comparative evaluation, J. Adv. Model. Earth Sy., 3, M10001, https://doi.org/10.1029/2011MS000074, 2011. a, b, c, d
Ghan, S. J., Smith, S. J., Wang, M., Zhang, K., Pringle, K., Carslaw, K., Pierce, J., Bauer, S., and Adams, P.: A simple model of global aerosol indirect effects, J. Geophys. Res.-Atmos. 118, 6688–6707, https://doi.org/10.1002/jgrd.50567, 2013. a
Golaz, J.-C., Salzmann, M., Donner, L. J., Horowitz, L. W., Ming, Y., and Zhao, M.: Sensitivity of the Aerosol Indirect Effect to Subgrid Variability in the Cloud Parameterization of the GFDL Atmosphere General Circulation Model AM3, J. Climate, 24, 3145–3160, https://doi.org/10.1175/2010JCLI3945.1, 2011. a
Griffin, R. J., Cocker, D. R., Seinfeld, J. H., and Dabdub, D.: Estimate of global atmospheric organic aerosol from oxidation of biogenic hydrocarbons, Geophys. Res. Lett., 26, 2721–2724, https://doi.org/10.1029/1999GL900476, 1999. a
Hoose, C., Kristjánsson, J. E., Iversen, T., Kirkevåg, A., Seland, Ø., and Gettelman, A.: Constraining cloud droplet number concentration in GCMs suppresses the aerosol indirect effect, Geophys. Res. Lett., 36, L12807, https://doi.org/10.1029/2009GL038568, 2009. a, b
Karydis, V. A., Kumar, P., Barahona, D., Sokolik, I. N., and Nenes, A.: On the effect of dust particles on global cloud condensation nuclei and cloud droplet number, J. Geophys. Res.-Atmos., 116, D23204, https://doi.org/10.1029/2011JD016283, 2011. a, b, c, d
Khairoutdinov, M. and Kogan, Y.: A New Cloud Physics Parameterization in a Large-Eddy Simulation Model of Marine Stratocumulus, Mon. Weather Rev., 128, 229–243, https://doi.org/10.1175/1520-0493(2000)128<0229:ANCPPI>2.0.CO;2, 2000. a
Kim, D., Wang, C., Ekman, A. M. L., Barth, M. C., and Rasch, P. J.: Distribution and direct radiative forcing of carbonaceous and sulfate aerosols in an interactive size-resolving aerosol–climate model, J. Geophys. Res., 113, D16309, https://doi.org/10.1029/2007JD009756, 2008. a, b, c
Kim, D., Wang, C., Ekman, A. M. L., Barth, M. C., and Lee, D.-I.: The responses of cloudiness to the direct radiative effect of sulfate and carbonaceous aerosols, J. Geophys. Res.-Atmos., 119, 1172–1185, https://doi.org/10.1002/2013JD020529, 2014. a
Kodros, J. K. and Pierce, J. R.: Important global and regional differences in aerosol cloud-albedo effect estimates between simulations with and without prognostic aerosol microphysics, J. Geophys. Res.-Atmos., 122, 4003–4018, https://doi.org/10.1002/2016JD025886, 2017. a, b
Kumar, P., Sokolik, I. N., and Nenes, A.: Parameterization of cloud droplet formation for global and regional models: including adsorption activation from insoluble CCN, Atmos. Chem. Phys., 9, 2517–2532, https://doi.org/10.5194/acp-9-2517-2009, 2009. a, b
Lamarque, J.-F., Bond, T. C., Eyring, V., Granier, C., Heil, A., Klimont, Z., Lee, D., Liousse, C., Mieville, A., Owen, B., Schultz, M. G., Shindell, D., Smith, S. J., Stehfest, E., Van Aardenne, J., Cooper, O. R., Kainuma, M., Mahowald, N., McConnell, J. R., Naik, V., Riahi, K., and van Vuuren, D. P.: Historical (1850–2000) gridded anthropogenic and biomass burning emissions of reactive gases and aerosols: methodology and application, Atmos. Chem. Phys., 10, 7017–7039, https://doi.org/10.5194/acp-10-7017-2010, 2010. a
Lamarque, J.-F., Kyle, G. P., Meinshausen, M., Riahi, K., Smith, S. J., van Vuuren, D. P., Conley, A. J., and Vitt, F.: Global and regional evolution of short-lived radiatively-active gases and aerosols in the Representative Concentration Pathways, Clim. Change, 109, 191–212, https://doi.org/10.1007/s10584-011-0155-0, 2011. a
Leibensperger, E. M., Mickley, L. J., Jacob, D. J., Chen, W.-T., Seinfeld, J. H., Nenes, A., Adams, P. J., Streets, D. G., Kumar, N., and Rind, D.: Climatic effects of 1950–2050 changes in US anthropogenic aerosols – Part 1: Aerosol trends and radiative forcing, Atmos. Chem. Phys., 12, 3333–3348, https://doi.org/10.5194/acp-12-3333-2012, 2012. a
Levy, R. C., Mattoo, S., Munchak, L. A., Remer, L. A., Sayer, A. M., Patadia, F., and Hsu, N. C.: The Collection 6 MODIS aerosol products over land and ocean, Atmos. Meas. Tech., 6, 2989–3034, https://doi.org/10.5194/amt-6-2989-2013, 2013. a
Liu, X., Penner, J. E., Ghan, S. J., and Wang, M.: Inclusion of ice microphysics in the NCAR Community Atmospheric Model version 3 (CAM3), J. Climate, 20, 4526–4547, https://doi.org/10.1175/JCLI4264.1, 2007. a, b, c
Liu, X., Easter, R. C., Ghan, S. J., Zaveri, R., Rasch, P., Shi, X., Lamarque, J.-F., Gettelman, A., Morrison, H., Vitt, F., Conley, A., Park, S., Neale, R., Hannay, C., Ekman, A. M. L., Hess, P., Mahowald, N., Collins, W., Iacono, M. J., Bretherton, C. S., Flanner, M. G., and Mitchell, D.: Toward a minimal representation of aerosols in climate models: description and evaluation in the Community Atmosphere Model CAM5, Geosci. Model Dev., 5, 709–739, https://doi.org/10.5194/gmd-5-709-2012, 2012. a, b
Loeb, N. G., Wielicki, B. A., Doelling, D. R., Smith, G. L., Keyes, D. F., Kato, S., Manalo-Smith, N., and Wong, T.: Toward optimal closure of the Earth's top-of-atmosphere radiation budget, J. Climate, 22, 748–766, https://doi.org/10.1175/2008JCLI2637.1, 2009. a
Lohmann, U. and Ferrachat, S.: Impact of parametric uncertainties on the present-day climate and on the anthropogenic aerosol effect, Atmos. Chem. Phys., 10, 11373–11383, https://doi.org/10.5194/acp-10-11373-2010, 2010. a
Mayer, M., Wang, C., Webster, M., and Prinn, R. G. R.: Linking Local Air Pollution to Global Chemistry and Climate, J. Geophys. Res., 105, 22869–22896, https://doi.org/10.1029/2000JD900307, 2000. a
McCoy, D. T., Bender, F. A.-M., Mohrmann, J. K. C., Hartmann, D. L., Wood, R., and Grosvenor, D. P.: The global aerosol-cloud first indirect effect estimated using MODIS, MERRA, and AeroCom, J. Geophys. Res.-Atmos., 122, 1779–1796, https://doi.org/10.1002/2016JD026141, 2017. a
Ming, Y., Ramaswamy, V., Donner, L. J., and Phillips, V. T. J.: A New Parameterization of Cloud Droplet Activation Applicable to General Circulation Models, J. Atmos. Sci., 63, 1348–1356, https://doi.org/10.1175/JAS3686.1, 2006. a, b
Morales Betancourt, R. and Nenes, A.: Understanding the contributions of aerosol properties and parameterization discrepancies to droplet number variability in a global climate model, Atmos. Chem. Phys., 14, 4809–4826, https://doi.org/10.5194/acp-14-4809-2014, 2014a. a
Morales Betancourt, R. and Nenes, A.: Droplet activation parameterization: the population-splitting concept revisited, Geosci. Model Dev., 7, 2345–2357, https://doi.org/10.5194/gmd-7-2345-2014, 2014b. a, b
Morcrette, J.-J.: Radiation and cloud radiative properties in the European Centre for Medium Range Weather Forecasts forecasting system, J. Geophys. Res., 96, 9121–9132, https://doi.org/10.1029/89JD01597, 1991. a
Morrison, H., Gettelman, A., Morrison, H., and Ghan, S. J.: A New Two-Moment Bulk Stratiform Cloud Microphysics Scheme in the Community Atmosphere Model, Version 3 (CAM3). Part I: Description and Numerical Tests, J. Climate, 21, 3642–3659, https://doi.org/10.1175/2008JCLI2105.1, 2008. a
Nenes, A. and Seinfeld, J. H.: Parameterization of cloud droplet formation in global climate models, J. Geophys. Res., 108, 4415, https://doi.org/10.1029/2002JD002911, 2003. a, b
Ovtchinnikov, M. and Ghan, S. J.: Parallel simulations of aerosol influence on clouds using cloud-resolving and single-column models, J. Geophys. Res.-Atmos., 110, 1–13, https://doi.org/10.1029/2004JD005088, 2005. a
Park, S. and Bretherton, C. S.: The University of Washington shallow convection and moist turbulence schemes and their impact on climate simulations with the community atmosphere model, J. Climate, 22, 3449–3469, https://doi.org/10.1175/2008JCLI2557.1, 2009. a
Penner, J. E., Quaas, J., Storelvmo, T., Takemura, T., Boucher, O., Guo, H., Kirkevåg, A., Kristjánsson, J. E., and Seland, Ø.: Model intercomparison of indirect aerosol effects, Atmos. Chem. Phys., 6, 3391–3405, https://doi.org/10.5194/acp-6-3391-2006, 2006. a
Penner, J. E., Xu, L., and Wang, M.: Satellite methods underestimate indirect climate forcing by aerosols, P. Natl. Acad. Sci. USA, 108, 13404–13408, https://doi.org/10.1073/pnas.1018526108, 2011. a
Petters, M. D. and Kreidenweis, S. M.: A single parameter representation of hygroscopic growth and cloud condensation nucleus activity, Atmos. Chem. Phys., 7, 1961–1971, https://doi.org/10.5194/acp-7-1961-2007, 2007. a, b
Quaas, J., Ming, Y., Menon, S., Takemura, T., Wang, M., Penner, J. E., Gettelman, A., Lohmann, U., Bellouin, N., Boucher, O., Sayer, A. M., Thomas, G. E., McComiskey, A., Feingold, G., Hoose, C., Kristjánsson, J. E., Liu, X., Balkanski, Y., Donner, L. J., Ginoux, P. A., Stier, P., Grandey, B., Feichter, J., Sednev, I., Bauer, S. E., Koch, D., Grainger, R. G., Kirkevåg, A., Iversen, T., Seland, Ø., Easter, R., Ghan, S. J., Rasch, P. J., Morrison, H., Lamarque, J.-F., Iacono, M. J., Kinne, S., and Schulz, M.: Aerosol indirect effects – general circulation model intercomparison and evaluation with satellite data, Atmos. Chem. Phys., 9, 8697–8717, https://doi.org/10.5194/acp-9-8697-2009, 2009. a
Rothenberg, D. and Wang, C.: Metamodeling of Droplet Activation for Global Climate Models, J. Atmos. Sci., 73, 1255–1272, https://doi.org/10.1175/JAS-D-15-0223.1, 2016. a, b, c
Rothenberg, D. and Wang, C.: An aerosol activation metamodel of v1.2.0 of the pyrcel cloud parcel model: development and offline assessment for use in an aerosol–climate model, Geosci. Model Dev., 10, 1817–1833, https://doi.org/10.5194/gmd-10-1817-2017, 2017. a, b, c, d, e, f
Scanza, R. A., Mahowald, N., Ghan, S., Zender, C. S., Kok, J. F., Liu, X., Zhang, Y., and Albani, S.: Modeling dust as component minerals in the Community Atmosphere Model: development of framework and impact on radiative forcing, Atmos. Chem. Phys., 15, 537–561, https://doi.org/10.5194/acp-15-537-2015, 2015. a, b
Seinfeld, J. H. and Pandis, S. N.: Atmospheric Chemistry and Physics: From Air Pollution to Climate Change, vol. 2nd, Wiley, 2006. a
Shindell, D. T., Lamarque, J.-F., Schulz, M., Flanner, M., Jiao, C., Chin, M., Young, P. J., Lee, Y. H., Rotstayn, L., Mahowald, N., Milly, G., Faluvegi, G., Balkanski, Y., Collins, W. J., Conley, A. J., Dalsoren, S., Easter, R., Ghan, S., Horowitz, L., Liu, X., Myhre, G., Nagashima, T., Naik, V., Rumbold, S. T., Skeie, R., Sudo, K., Szopa, S., Takemura, T., Voulgarakis, A., Yoon, J.-H., and Lo, F.: Radiative forcing in the ACCMIP historical and future climate simulations, Atmos. Chem. Phys., 13, 2939–2974, https://doi.org/10.5194/acp-13-2939-2013, 2013. a, b
Shipway, B. J. and Abel, S. J.: Analytical estimation of cloud droplet nucleation based on an underlying aerosol population, Atmos. Res., 96, 344–355, https://doi.org/10.1016/j.atmosres.2009.10.005, 2010. a
Stevens, B. and Feingold, G.: Untangling aerosol effects on clouds and precipitation in a buffered system, Nature, 461, 607–613, https://doi.org/10.1038/nature08281, 2009. a
Storelvmo, T., Lohmann, U., and Bennartz, R.: What governs the spread in shortwave forcings in the transient IPCC AR4 models?, Geophys. Res. Lett., 36, 1–5, https://doi.org/10.1029/2008GL036069, 2009. a, b
Twomey, S.: The Influence of Pollution on the Shortwave Albedo of Clouds, J. Atmos. Sci., 34, 1149–1152, https://doi.org/10.1175/1520-0469(1977)034<1149:TIOPOT>2.0.CO;2, 1977. a
Twomey, S.: Aerosols, clouds and radiation, Atmos. Environ., 25, 2435–2442, https://doi.org/10.1016/0960-1686(91)90159-5, 1991. a
Vehkamäki, H.: An improved parameterization for sulfuric acid–water nucleation rates for tropospheric and stratospheric conditions, J. Geophys. Res., 107, 4622, https://doi.org/10.1029/2002JD002184, 2002. a
Wang, C.: A modeling study on the climate impacts of black carbon aerosols, J. Geophys. Res., 109, D03106, https://doi.org/10.1029/2003JD004084, 2004. a, b
Wang, C.: A modeling study of the response of tropical deep convection to the increase of cloud condensation nuclei concentration: 1. Dynamics and microphysics, J. Geophys. Res., 110, 1–16, https://doi.org/10.1029/2004JD005720, 2005a. a
Wang, C.: A modeling study of the response of tropical deep convection to the increase of cloud condensation nuclei concentration: 2. Radiation and tropospheric chemistry, J. Geophys. Res., 110, 1–15, https://doi.org/10.1029/2005JD005829, 2005b. a
Wang, H.-J., Chen, H.-P., and Liu, J.-P.: Arctic Sea Ice Decline Intensified Haze Pollution in Eastern China, Atmos. Ocean. Sci. Lett., 8, 1–9, https://doi.org/10.3878/AOSL20140081, 2015. a
Ward, D. and Cotton, W.: A method for forecasting cloud condensation nuclei using predictions of aerosol physical and chemical properties from WRF/Chem, J. Appl. Meteorol. Climatol., 50, 1601–1615, https://doi.org/10.1175/2011JAMC2644.1, 2011. a
Ward, D. S., Eidhammer, T., Cotton, W. R., and Kreidenweis, S. M.: The role of the particle size distribution in assessing aerosol composition effects on simulated droplet activation, Atmos. Chem. Phys., 10, 5435–5447, https://doi.org/10.5194/acp-10-5435-2010, 2010. a
Wilson, J., Cuvelier, C., and Raes, F.: A modeling study of global mixed aerosol fields, J. Geophys. Res., 106, 34081–34108, https://doi.org/10.1029/2000JD000198, 2001. a
Zhang, S., Wang, M., Ghan, S. J., Ding, A., Wang, H., Zhang, K., Neubauer, D., Lohmann, U., Ferrachat, S., Takeamura, T., Gettelman, A., Morrison, H., Lee, Y., Shindell, D. T., Partridge, D. G., Stier, P., Kipling, Z., and Fu, C.: On the characteristics of aerosol indirect effect based on dynamic regimes in global climate models, Atmos. Chem. Phys., 16, 2765–2783, https://doi.org/10.5194/acp-16-2765-2016, 2016. a, b