the Creative Commons Attribution 4.0 License.
the Creative Commons Attribution 4.0 License.
 | 06 Jun 2018
High-resolution modeling of gaseous methylamines over a polluted region in China: source-dependent emissions and implications of spatial variations
Jingbo Mao
Yan Zhang
Jingyu An
Jun Zheng
Lei Yao
Weichun Ma
Qi Yu
Cheng Huang
Limin Chen
Amines have received increasing attention in recent years because of their potential role in new particle formation in the atmosphere and their impact on aerosol chemistry. High concentrations of amines are expected to be limited to the vicinity of source regions due to their short lifetime, highlighting the necessity of having a better understanding of contributions of emissions from different source types. This study presents the first high-resolution model simulation of concentrations of methylamines on a regional scale over the Yangtze River Delta region in East China. The WRF-Chem with nested grids is used in model simulations. In contrast to the very limited existing modeling studies that assumed a fixed ratio (FR) of amines to total ammonia emission, we derive source-dependent ratios (SDR) that distinguish C1-amine (CH3NH2), C2-amines (C2H7N), C3-amines (C3H9N) emissions from five different source types (agriculture, residential, transportation, chemical industry, and other industry). The amines-to-ammonia mass emission ratios, estimated from previous measurements, are 0.026, 0.0015, 0.0011, 0.0011, and 0.0011 for C1-amine; 0.007, 0.0018, 0.0015, 0.01, and 0.0009 for C2-amines; and 0.0004, 0.0005, 0.00043, 0.0006, and 0.0004 for C3-amines for chemical–industrial, other industrial, agricultural, residential, and transportational sources, respectively. The simulated concentrations of C1-, C2-, and C3-amines, based on both FR and SDR, have been compared with field measurements at a suburban site in Nanjing and at an urban site in Shanghai, China. SDR substantially improves the ability of the model in capturing the observed concentrations of methylamines. Concentrations of C1-, C2-, and C3-amines in the surface layer in the Yangtze River Delta region are generally in the range of 2–20, 5–50, and 0.5–4 pptv. Vertically, the concentrations of C1-, C2-, and C3-amines decrease quickly with altitude, dropping by a factor of ∼10 from the surface to ∼900 hPa. Results from the present study are critical to evaluating potential roles of amines in nucleation and chemical processes in polluted air.
- Article
(7710 KB) - Full-text XML
- BibTeX
- EndNote


Gaseous amines may play an important role in new particle formation and growth based on chamber experiments, theoretical calculations, and field observations (Kurtén et al., 2008; Almeida et al., 2013; Zhao et al., 2011; Erupe et al., 2011; Chen et al., 2012; Yu et al., 2012; You et al., 2014; Chen et al., 2016; Jen et al., 2016; Olenius et al., 2017). CLOUD (Cosmics Leaving OUtdoor Droplets) chamber experiments (Almeida et al., 2013) demonstrate that dimethylamine (DMA) of above 3 pptv can enhance nucleation rate by more than 1000-fold. Lehtipalo et al. (2016) reported that the growth rate of sub-3 nm particles at a given H2SO4 monomer concentration was enhanced by a factor of 10 with addition of >5 pptv DMA, compared to a factor of 2–3 enhancement when NH3 of >100 pptv was added. As ubiquitous atmospheric organic bases, amines can form ammonium salts by acid–base reactions (Murphy et al., 2007; Kürten et al., 2014; Lehtipalo et al., 2016; Tao et al., 2016). In addition to dry and wet deposition, the concentrations of amines in the air decrease through oxidization reactions with OH, NOx, and ozone (Carl and Crowley, 1998; Murphy et al., 2007; Nielsen et al., 2012) and uptake by particles (Qiu et al., 2011; Zhang et al., 2012; Qiu and Zhang, 2013). There are about 150 gaseous amines identified in the atmosphere, but little is known about their thermodynamic and kinetic properties and their importance in the atmosphere (Ge et al., 2011). While measurements of amines in different environments (e.g., rural, urban, marine, and forest) have been reported (Sellegri et al., 2005; Hanson et al., 2011; VandenBoer et al., 2011; Yu and Lee, 2012; Freshour et al., 2014; You et al., 2014; Zheng et al., 2015; Yao et al., 2016), they are very limited, especially in China. Zheng et al. (2015) measured C1-, C2-, and C3- amines at a suburban site of Nanjing, China, during the summer of 2012 and they reported an average total amines value of 7.4±4.7 pptv. Similar measurements of amines were conducted at Fudan University, an urban site in Shanghai, China, during the summer of 2015 and the observed mean concentrations of gaseous C1–C6 amines were 15.7±5.9, 40.0±14.3, 1.1±0.6, 15.4±7.9, 3.4±3.7, and 3.5±2.2 pptv, respectively (Yao et al., 2016). The results in both Nanjing and Shanghai suggest that amines-enhanced particle formation and growth may be important in the Yangtze River Delta, one of the highly polluted regions in China.
It is necessary and important to know the concentrations of key amines and their variations in order to understand the role of amines in particle nucleation and growth. In this regard, numerical models can be useful in simulating the distributions of amines on regional or global scales. To our knowledge, only three modeling studies of amines have been reported in the literature, all on a global scale (Myriokefalitakis et al., 2010; Yu and Luo, 2014; Bergman et al., 2015). Myriokefalitakis et al. (2010) investigated the potential contribution of amines emitted from oceans to secondary organic formation (SOA) formation, assuming total amine emissions to be one-tenth of the oceanic ammonia emissions. They did not consider amines from continental sources and also did not report any simulated concentrations of gaseous amines over oceans. Yu and Luo (2014) studied the global distributions of the most common and abundant amines in the air: monomethylamine (MMA), dimethylamine (DMA), and trimethylamine (TMA). They used the ratios of MMA, DMA, and TMA to ammonia fluxes given in Schade and Crutzen (1995), but approximate the spatial distributions and seasonal variations of amine emissions following those of ammonia. Bergman et al. (2015) added one single (unified) alkylamine species that has the physical and chemical properties of TMA into a global aerosol–climate model, and assumed an amine-to-ammonia ratio of 0.0057 kg (amine (N)) kg−1 (ammonia (N)). Due to the lack of information regarding the emission of amines from different sources, these three previous studies (Myriokefalitakis et al., 2010; Yu and Luo, 2014; Bergman et al., 2015) used fixed amines to ammonia ratios to estimate amine emissions. While such an approximation provides a first order of magnitude estimation of amine emission, it may lead to large uncertainties in the model-predicted concentrations of amines, especially their spatial distributions at regional and urban scales. In fact, Yu and Luo (2014) showed that the predicted concentrations of amines based on a global model, with amines to ammonia ratios as reported in the literature, are significantly lower than those observed. One possible reason for the model underprediction is the uncertainty in amine emissions near the sites of measurements.
Amines are emitted into the atmosphere from both natural and anthropogenic sources, including animal husbandry, chemical facilities, industry, carbon sequestration, combustion, fish processing, automobiles, sewage, composting operations, vegetation, soil, biomass burning, and the oceans (Ge et al., 2011). In many situations, amines are co-emitted with ammonia, but the ratios of amines to ammonia from various sources may differ significantly and there may also exist stand-alone sources of amines (Kuhn et al., 2011; Zheng et al., 2015). For example, measurements have indicated that industrial amine emission may be important sources in Nanjing (Zheng et al., 2015). Kuhn et al. (2011) concluded that amines in agricultural regions are mainly released from animal housing and grazing animals, in contrast to ammonia, which is mostly emitted into the atmosphere from agricultural fertilizers. Bergman et al. (2015) also pointed out that the direct calculation of amine emissions based on ammonia can skew the spatial extent of the amine emission and emphasized a clear need for improved estimates of amine emissions from different emission sectors.
Apparently, there is a clear need to better understand emissions of amines from various source types and to improve the model simulations of concentrations of amines and their spatial distributions. The main objective of this study is to estimate amine emissions from five different source types (chemical industry, other industry, agriculture, residential, and transportation) and simulate spatial distributions of gaseous amines over the Yangtze River Delta region in China, using recently available amines measurements and year 2014 emission inventories in the region for various emission sectors with 4 km×4 km horizontal resolution. The observational data used to constrain model simulations includes continuous measurements of amines during a 1-month period (summer of 2015) at an urban site in Shanghai, China (Yao et al., 2016), and a 1-week period (summer of 2012) at a suburban site in Nanjing, China (Zheng et al., 2015).
2.1 Emission inventory for anthropogenic sources
Anthropogenic particulate and gas emissions for Asia and China are based on INTEX-B (Zhang et al., 2009) and Multiple-resolution emission inventory for China (MEIC) developed by Tsinghua University (http://www.meicmodel.org, last access: 4 June 2018), respectively. The emissions for SO2, NOx, CO, VOC, PM10, PM2.5, and primary black carbon and organic carbon are included in the INTEX-B database with 0.5∘ × 0.5∘ horizontal resolution, and (with NH3 emissions as well) in the MEIC database with 0.25∘ × 0.25∘ horizontal resolution.
To improve the emission accuracy and spatial resolution for the Yangtze River Delta region, we employ a refined bottom-up emission inventory (4 km×4 km resolution) for the year 2014 developed by the Shanghai Academy of Environmental Sciences (SAES). The SAES 2014 inventory includes anthropogenic emissions from various chemical, industrial, vehicular, shipping, agricultural, and residential sources. The SAES 2014 inventory is updated from the previous work (Huang et al., 2011; Li et al., 2011), which consists of large point sources, industrial, mobile, residential, and agricultural sources. Point sources in this inventory consist of power plants and large industrial combustion and processing sources. The point sources data are obtained from a national environmental statistical database. Mobile sources consist of on-road vehicle, non-road vehicle, and ship emissions. The vehicle volume data, residential fuel combustion, and the activity data of agriculture sources including the amount of livestock and fertilizer consumption are obtained from the statistical yearbooks of the 41 cities in the Yangtze River Delta. The detailed information about estimation of ship emissions is given in Fan et al. (2016).
For the temporal variations of emissions, we used profiles derived from local investigation for different emissions sources (Tan et al., 2015). For the spatial distributions of various emissions, ArcGIS was used to distribute area and stack sources in the emission inventory. Stack sources were allocated into grid cells based on their geographical positions. The height of stack emissions ranges from 20 to 250 m were based on NOx and PM10 emission flux (Tan et al., 2015). Mobile, residential, and agricultural emissions were treated as area sources and distributed into corresponding grid cells.
2.2 Amine emissions
It is presently impossible to develop either a global or regional bottom-up emission inventory of amines due to insufficient direct measurements. The fixed amines to ammonia ratio assumed in two previous global studies (Yu and Luo, 2014; Bergman et al., 2015) resulted in higher concentrations of amines in agricultural areas than in other areas because agriculture dominates NH3 emissions. However, very high concentrations of amines at an urban site have been reported (Yao et al., 2016), indicating strong amines sources not associated with agricultural activities. A refined amine emission inventory is apparently needed.
Low-molecular-weight amines are the most common among about 150 amines that have been identified so far. The present study focuses on C1-amine (CH3NH2), C2-amines (C2H7N), and C3-amines (C3H9N). In contrast to previous modeling studies assuming a fixed ratio (FR) of amines to total ammonia emission, we take into account the dependence of C1-, C2-, and C3-amines-to-ammonia ratios on five different source types (chemical industry, other industry, agriculture, residential, transportation). Agriculture includes livestock, biomass burning, soil, and fertilizer usage. Ammonia is emitted from fertilizer plants by volatilization, which is similar to ammonia volatilization in soil. Hence, we group fertilizer plants into agricultural sources. The chemical–industrial source type includes emissions from petrochemicals, pharmaceuticals, agrochemicals excluding fertilizer plants, paints, fine chemicals, and solvent use industries, while other industrial type includes power plants, iron and steel mills, cement, carbon sequestration, food industry (e.g., fish processing), and other industry boilers. Residential source type includes cooking, human waste, and gas (water) disposal, while transportation includes automobiles and ships.
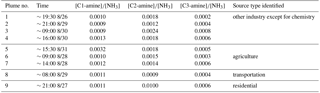
Zheng et al. (2015) simultaneously measured NH3, C1-, C2-, and C3-amines, NOx and SO2 using an aerodyne HR-ToF-CIMS with high time resolution at Nanjing University of Information Science and Technology (NUIST), a suburban site in Nanjing, China, from 26 August to 8 September 2012. The high-time-resolution HR-ToF-CIMS data resolve individual plumes. Zheng et al. (2015) analyzed these data in detail and identified the possible source types of plumes based on the differences in the concentrations of SO2 and NOx along with wind directions. Table 1 gives the ratios of concentrations of C1-, C2-, and C3-amines to ammonia for individual plumes with different origins as identified by the authors. The ratios were derived from the peak values of plumes simultaneously measured concentrations of ammonia, C1-, C2-, and C3-amines shown in Fig. 6 of Zheng et al. (2015). It is noteworthy that the ratios derived from peak values are comparable with those based on orthogonal distance regression analyses (Zheng et al., 2015) and the differences are well within the uncertainty. Table 1 summarizes the ratios of C1-, C2-, and C3-amines to ammonia in four source types: other industry, agriculture, transportation, and residential based on the plumes. For the chemical industry, Zheng et al. (2015) reported the presence of relatively high concentrations of amines (2.6 % of MA, 0.7 % of C2-amines, and 0.04 % of C3-amines) in the ammonia water solution from a local chemical supplier that has been used as absorbent during flue gas treatment. With the above information, the estimated amines to ammonia emission ratios are 0.026, 0.0015, 0.0011, 0.0011, and 0.0011 for C1-amine, 0.007, 0.0018, 0.0015, 0.01, and 0.0009 for C2-amines, and 0.0004, 0.0005, 0.00043, 0.0006, and 0.0004 for C3-amines for chemical–industrial, other industrial, agricultural, residential, and transportational source types, respectively. We acknowledge that the above estimation of amine emissions from different sources is subject to a large uncertainty, mainly due to very limited measurements available to constrain the estimation. Nevertheless, the above approach represents the first attempt to derive source-type dependent amines to ammonia ratios, which, as we show below, improves the skill of the model in simulating concentrations of amines in polluted regions. We derive regional C1-, C2-, and C3-amine emissions based on SDR ratios and ammonia emissions from five different source types. In the present study, the temporal and spatial distributions of C1-, C2-, and C3-amines follow those of ammonia for the five different sources (agriculture, residential, transportation, chemical industry, and other industry), whose emission frequency is hourly with a daily cycle.
Table 1The ratios of C1-, C2-, and C3-amines to that of ammonia from the peak values of individual plumes with different origins, derived from measurements taken at a suburban site of Nanjing as reported in Zheng et al. (2015).
2.3 Model setup and configurations
We employ WRF-Chem (version 3.7.1), a regional multi-scale meteorology model coupled with online chemistry (Grell et al., 2005). Ammonia is simulated in the standard version of WRF-Chem, but amines are not considered in previous studies. To simulate gaseous amines, we add three new tracers (C1-amine, C2-amines, and C3-amines) in WRF-Chem. The model configurations include Morrison2-mom microphysics (Morrison et al., 2009), RRTMG longwave and shortwave radiation (Clough et al., 2005), Noah land surface, Grell-3 cumulus (Grell and Freitas, 2014), and YSU PBL scheme (Hong et al., 2006). For gas-phase chemistry, we use the CB05 scheme (Yarwood et al., 2005). The surface areas of pre-existing particles, important for the uptake of amines in the atmosphere, are calculated from particle size distributions predicted by an advanced particle microphysics (APM) model embedded into WRF-Chem (Luo and Yu, 2011). The initial and boundary conditions for meteorology are generated from the National Centers for Environmental Prediction (NCEP) Final (FNL) with horizontal resolution at and time intervals at 6 h. The detailed anthropogenic emissions are described in Sect. 2.1, and the biogenic emissions are calculated online using MEGAN (Guenther et al., 2006). After emissions, gaseous amines are removed by dry and wet deposition, gas-phase reaction, and aerosol uptake (Yu and Luo, 2014; Bergman et al., 2015). Yu and Luo (2014) showed that gas-phase oxidation and aerosol uptake dominate removal of amines. In the present study, the oxidation of C1-, C2-, and C3-amines by OH is considered, with the reaction coefficients of 1.79 × 10⁻¹¹, 6.49 × 10⁻¹¹, and 3.58 × 10⁻¹¹ cm3 molecule−1 s−1 for C1-, C2-, and C3-amines (Carl and Crowley, 1998), respectively. The reactions of amines with NOx and O3 are quite small (Ge et al., 2011) and thus are not considered (Yu and Luo, 2014). The uptake of amines by particles is calculated from particle surface areas derived from simulated particle size distributions and uptake coefficient (γ), a main uncertainty of gas-to-particle partitioning. Based on laboratory measurements, the uptake coefficient was found to range from 10−2 to 2.3 × 10⁻⁴ (Wang et al., 2010; Qiu et al., 2011). In the numerical modeling, Yu and Luo (2014) carried out sensitivity study with γ values ranging from 0 to 0.03, while Bergman et al. (2015) assumed γ to be 0.002. We assumed γ to be 0.001 in our baseline case simulations with γ=0.01 and 0.03 for sensitivity tests. The dry and wet deposition of amines is treated in a way similar to that of ammonia.
WRF-Chem/APM is used for four nested domains simulations with horizontal resolutions of 81, 27, 9, and 3 km (Fig. 1) and vertical resolution of 22 layers (from surface to ∼11.8 km) with 8 levels below 1.5 km. Domain 1 covers East Asia and part of southeast Asia. Nested domains 2, 3, and 4 cover a large part of East China, the Yangtze River Delta (including Nanjing and Shanghai), and Shanghai with the complex underlying surface, respectively.
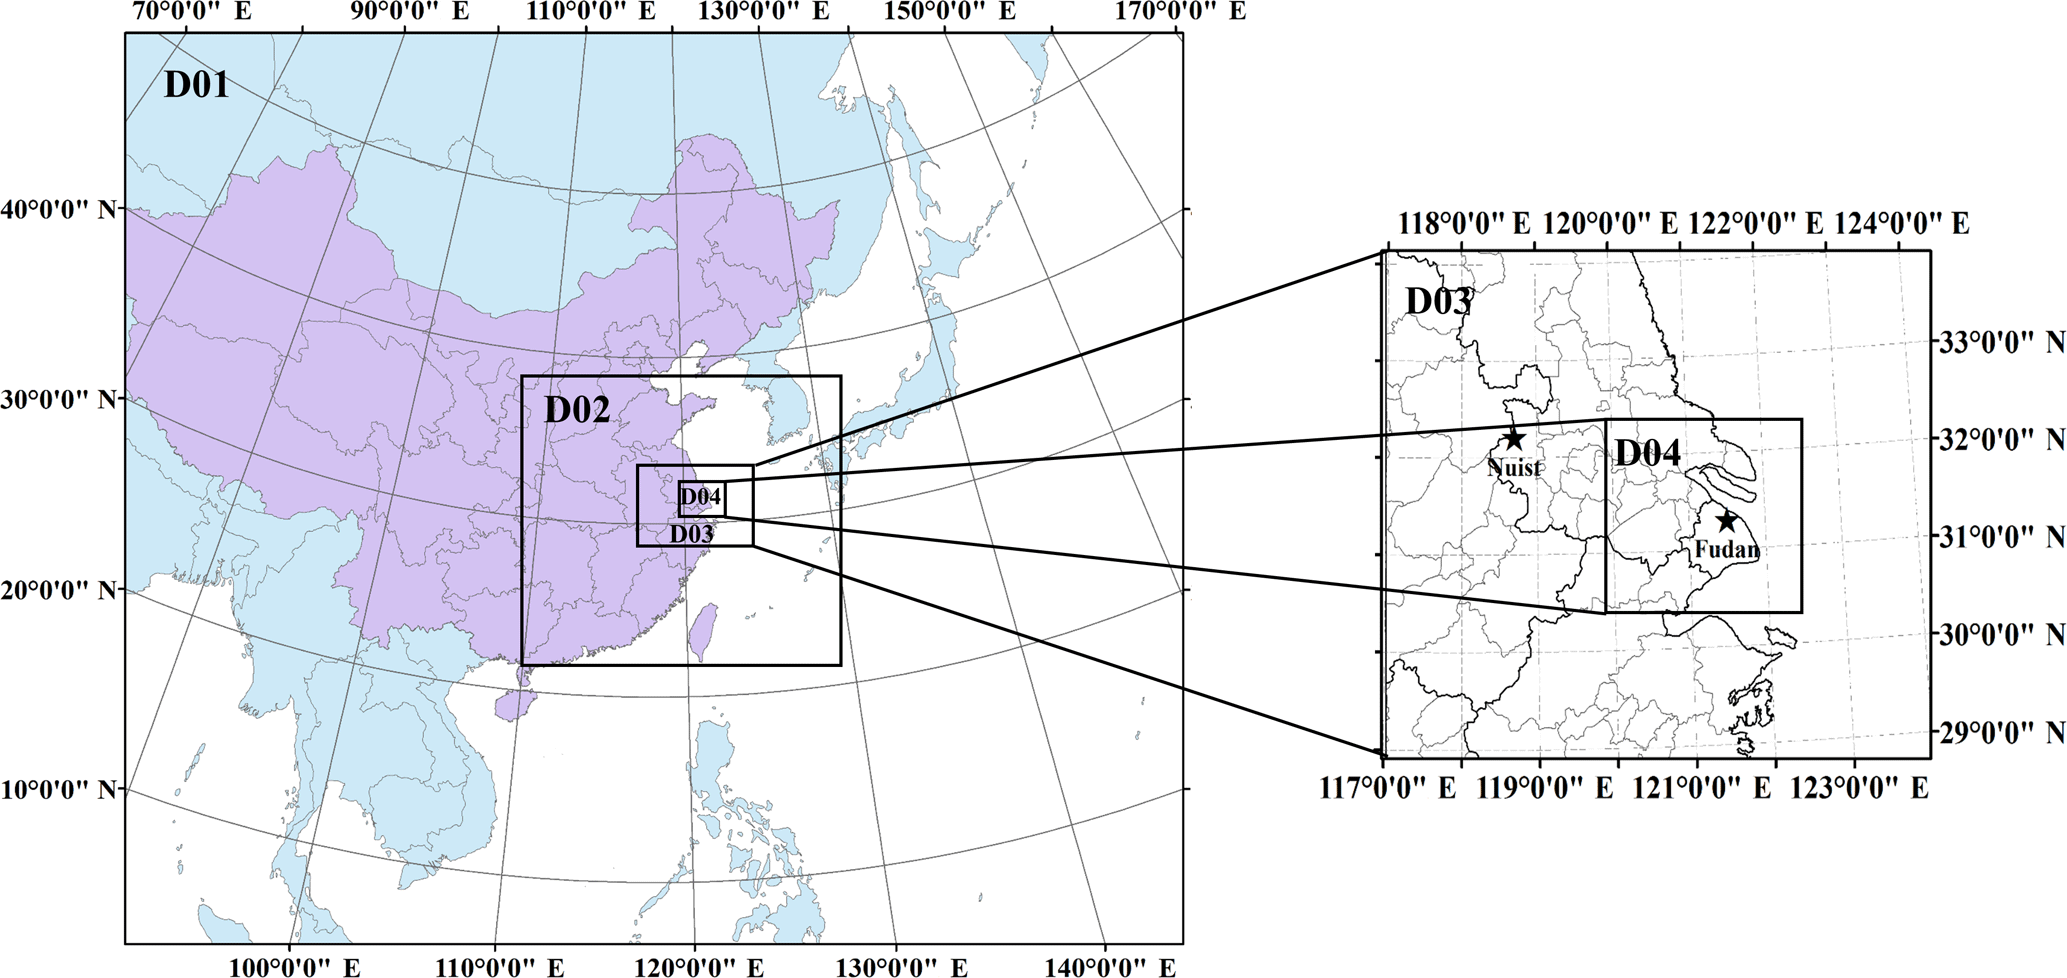
Figure 1Four nested domains in the present study. Domain 1 covers East Asia and part of southeast Asia. Nested domains 2, 3, and 4 cover a large part of East China, the Yangtze River Delta (including Nanjing, Shanghai), and Shanghai, respectively.
Our simulations focus on two periods during which continuous measurements of amines are available: (1) 26 to 31 August 2012, and (2) 25 July to 25 August 2015. The model spin-up time is 3 days for each case. For each period, two separate simulations were carried out: one assumes a fixed ratio (FR) of amines to ammonia emissions used in all previous studies (Myriokefalitakis et al., 2010; Yu and Luo, 2014; Bergman et al., 2015), and the other one employs source-dependent ratios (SDR) as described in Sect. 2.2. Table 2 summarizes the four simulation cases: FR2012, SDR2012, FR2015, and SDR2015. For the two FR cases, the ratios of amines to ammonia emissions for C1-, C2-, and C3-amines for all source types, estimated from the global emission budgets given in Schade and Crutzen (1995), are 0.0017, 0.0007, and 0.0034, respectively. For the two SDR cases, we also carry out a sensitivity study by halving and doubling the ratios given in Table 1. For the SDR2015 case, a sensitivity study for different uptake coefficients (γ=0.01, 0.03) has been carried out and the results are shown in Table 2.
3.1 Contribution of methylamine emissions from various source types
Ammonia, C1-, C2-, and C3-amine emission rates based on SDR and ammonia emissions in the Yangtze River Delta for residential, agricultural, other industrial, chemical–industrial, and transportational sources are summarized in Table 3. Ammonia emission rate in the Yangtze River Delta region is 919.61 Gg N yr−1, and total C1-, C2-, and C3-amine emission rates based on SDR (FR) are estimated as 551.88 (1563.34), 849.11 (643.73), and 117.78 (3126.67) Mg N yr−1, respectively. The significant difference in the estimated emission rates of amines in the region can be clearly seen, especially for C1- and C3-amines. Based on SDR, the contributions of agricultural, residential, transportational, other industrial, and chemical–industrial sources to domain-averaged methylamines (C1-amine + C2-amines + C3-amines) are 66.04, 30.81, 1.61, 0.81, and 0.73 %, respectively. Agricultural source type is the largest contributor for C1-, C2-, and C3-amines, while residential is another main contributor, especially for C2-amines (∼46 %).
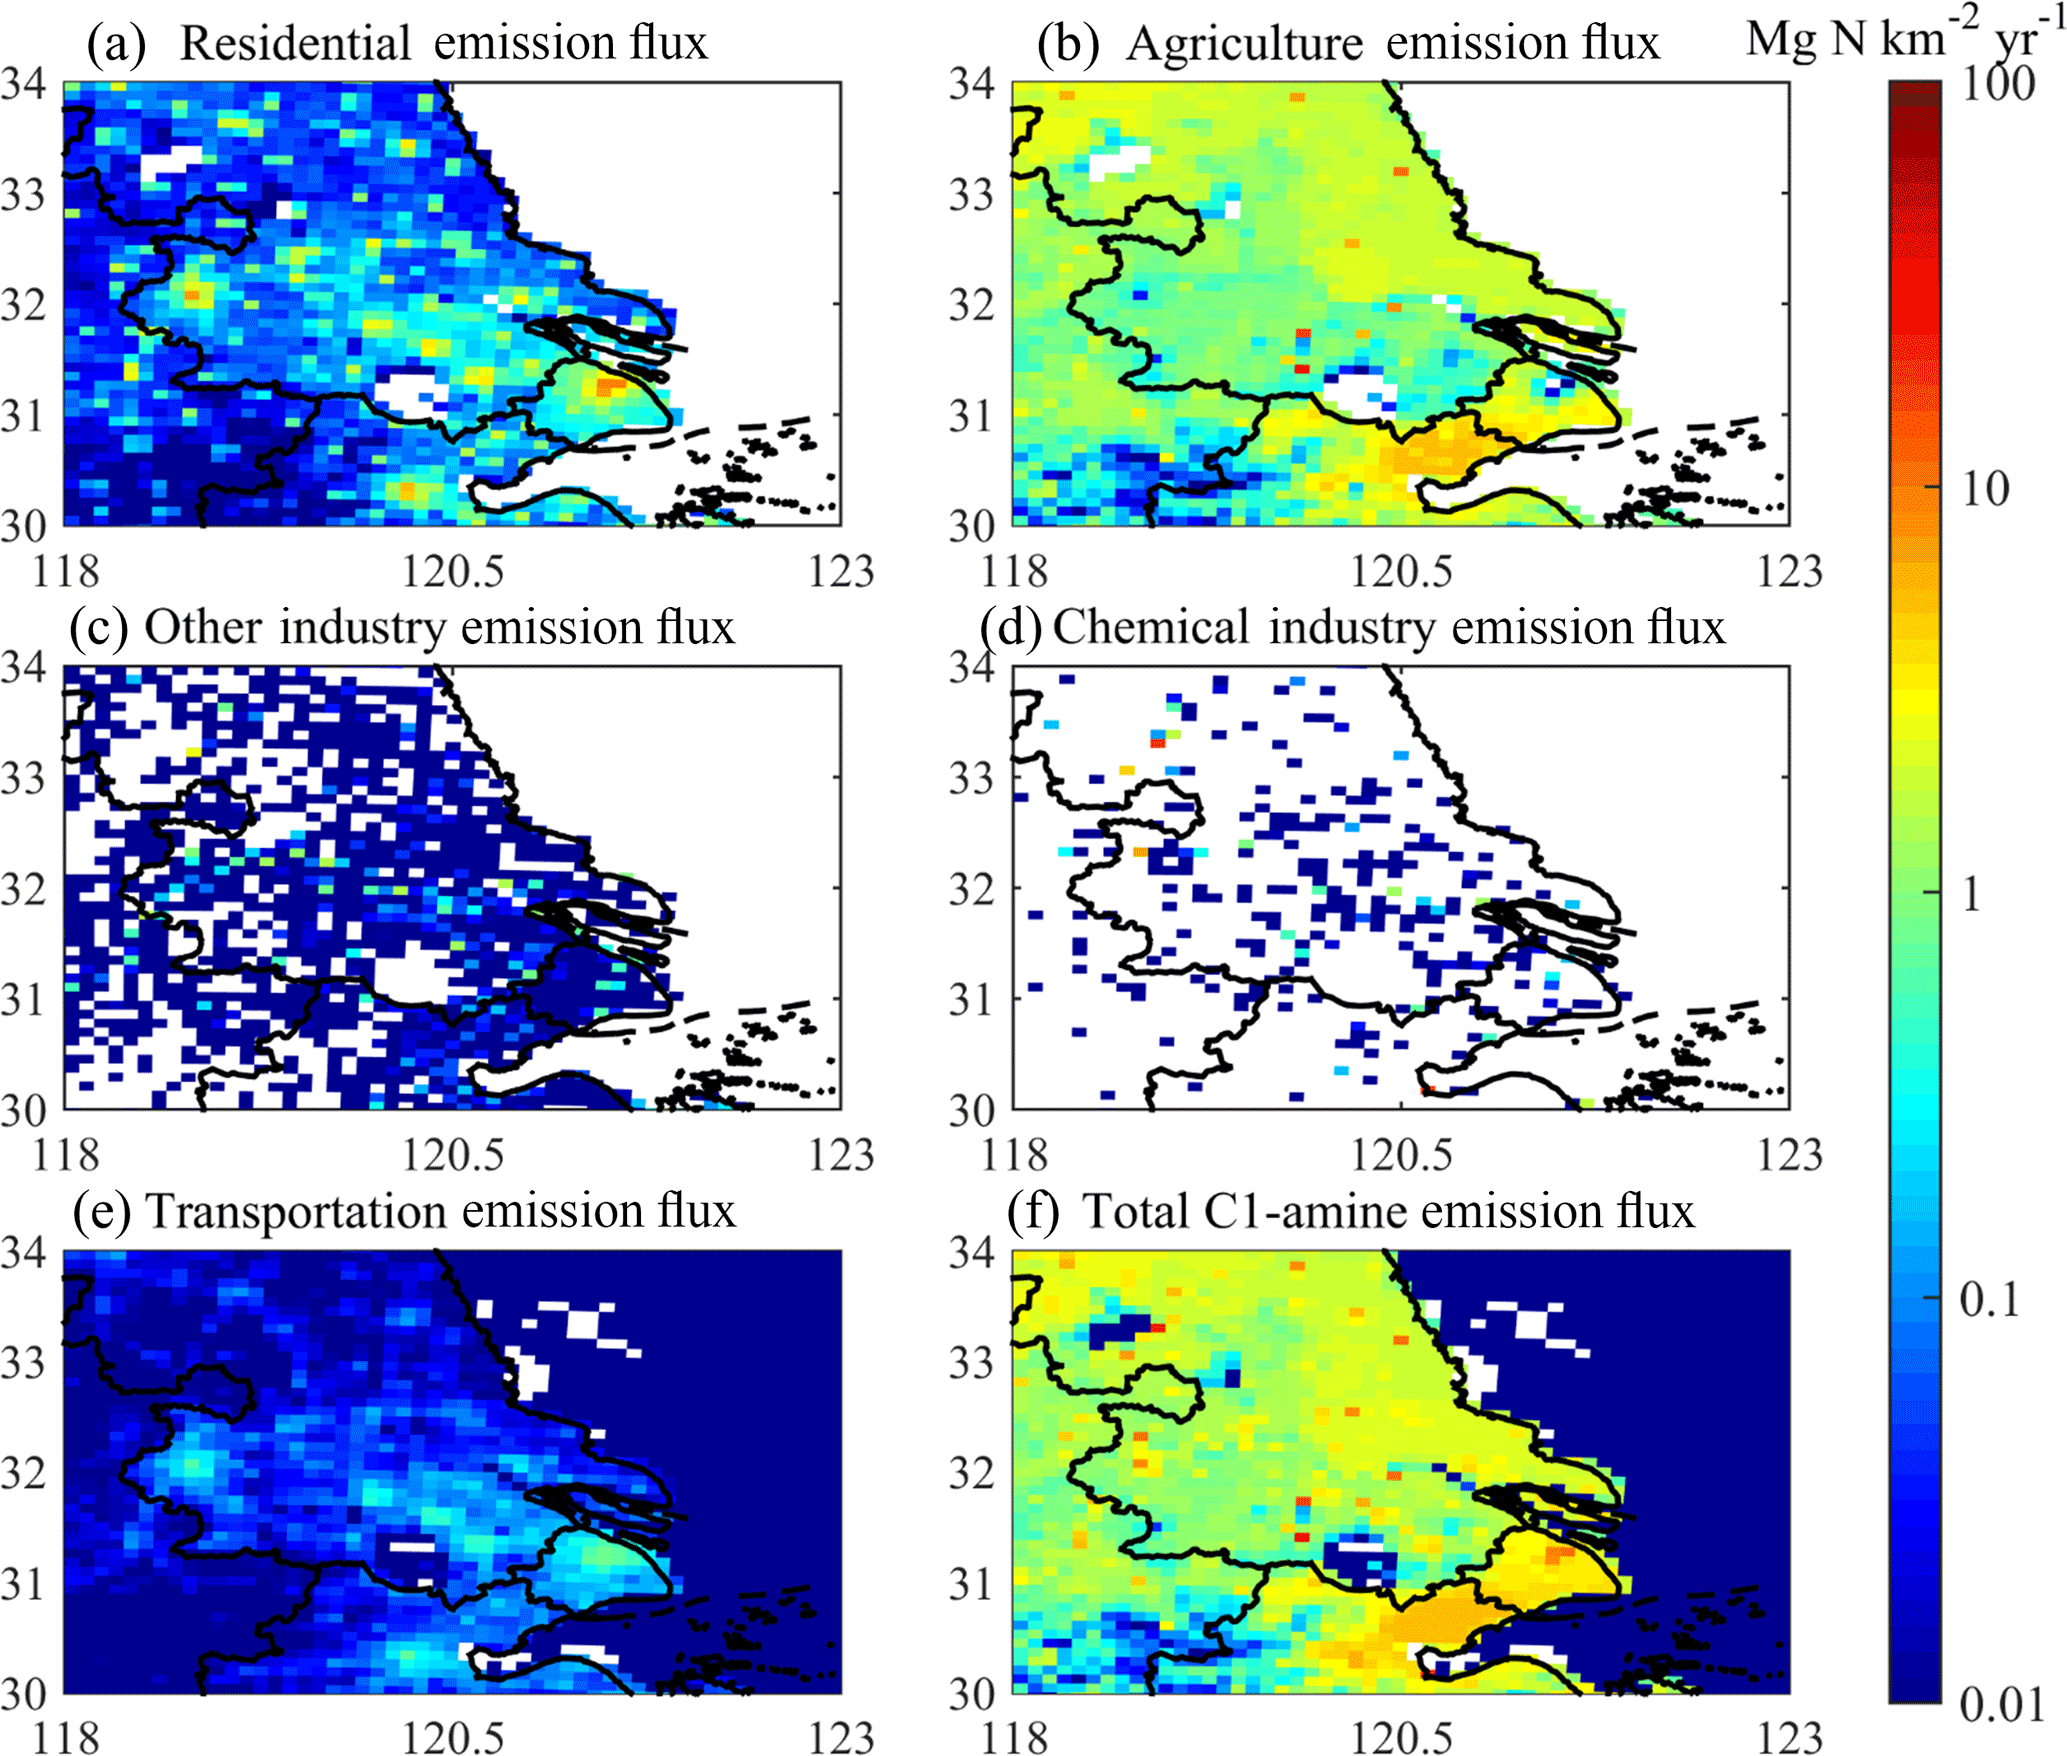
Figure 2The horizontal emission flux distributions for C1-amine: (a) residential; (b) agriculture; (c) other industry; (d) chemical industry; (e) transportation; (f) total.

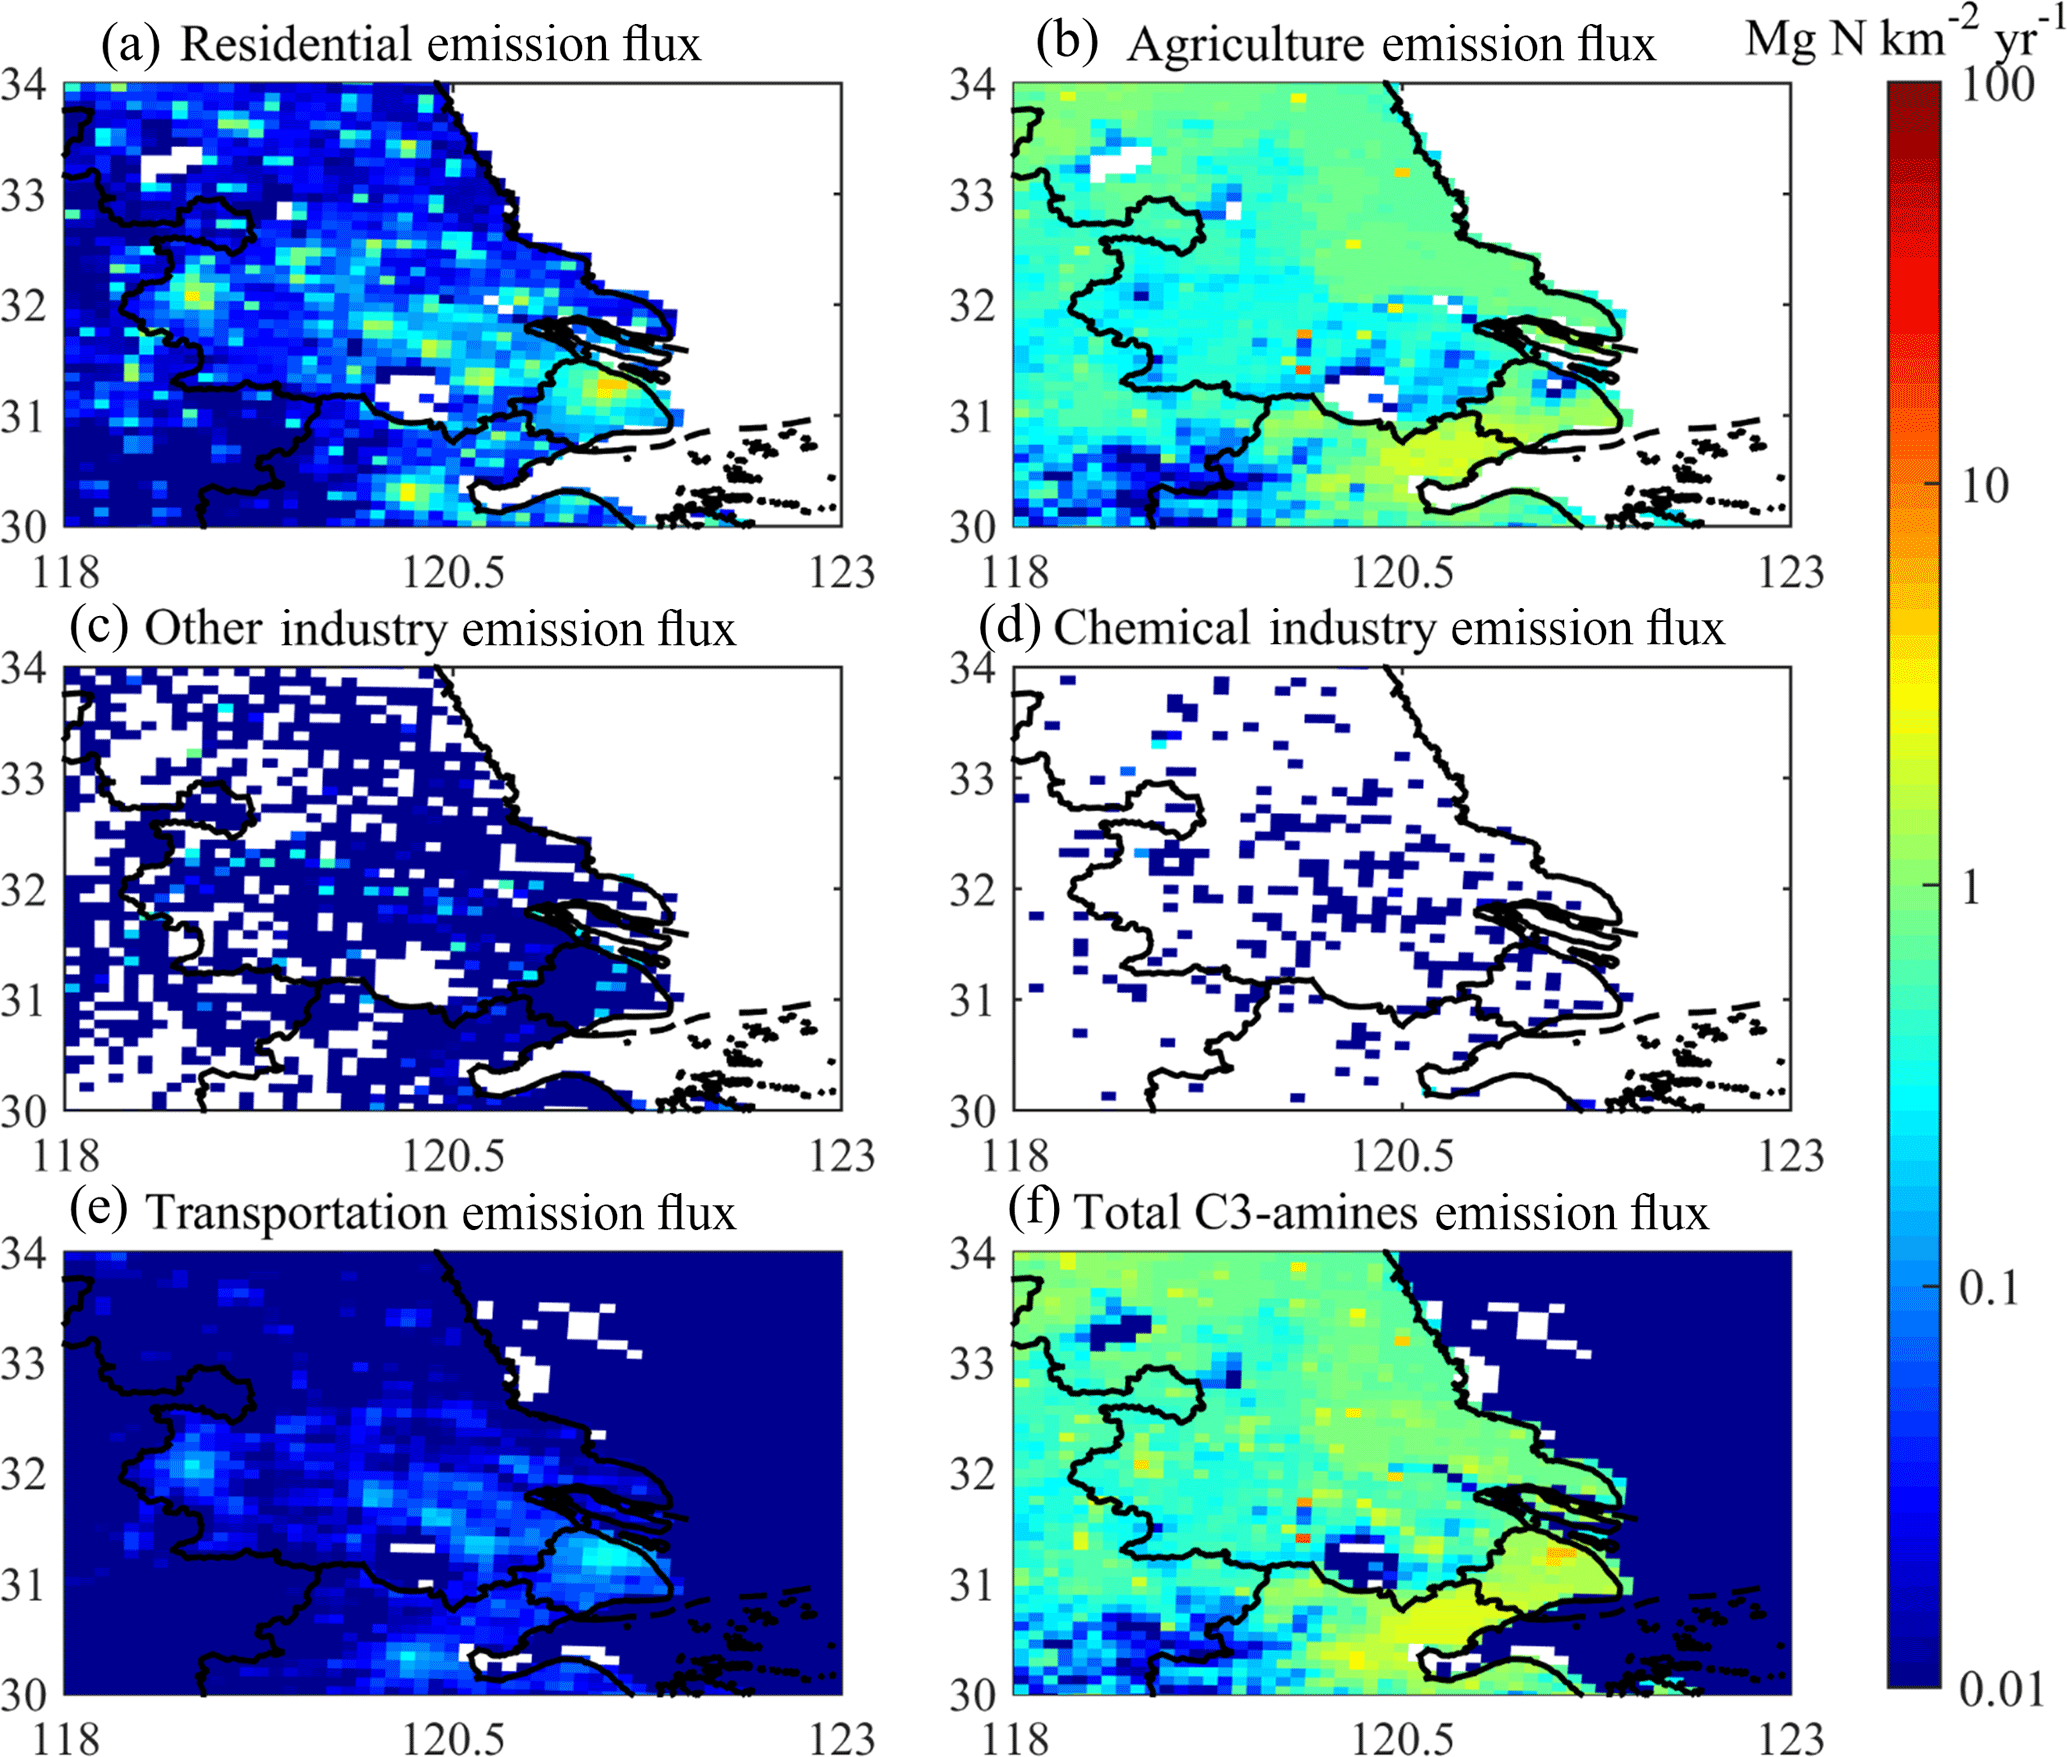
The horizontal distributions of C1-amine, C2-amines and C3-amines from different sources and total emission fluxes are presented in Figs. 2–4. The emission fluxes for C1-amine, C2-amines, and C3-amines, respectively, from five sources are mainly in the range of 0.1–10, 1–100, and 0.05–6 from residential sources (Figs. 2a–4a), 0.1–50, 0.5–60, and 0.1–8 from agriculture (Figs. 2b–4b), 0.01–1, 0.01–3, and 0.01–0.6 from other industry (Figs. 2c–4c), 0.01–20, 0.01–10, and 0.01–0.03 from chemical industry (Figs. 2d–4d), and 0.01–0.8, 0.01–0.6, and 0.01–0.3 from transportation (Figs. 2e–4e). Total emission flux of C2-amines is in the range of 0.1–100 over land in the Yangtze River Delta and below 0.01 over ocean near Yangtze River Delta (Fig. 3f). For C1-amine and C3-amines, the total emission fluxes are 0.1–50 and 0.1–6 and less than 0.01 over oceanic area (see Figs. 2f and 4f). As mentioned earlier, we assumed that the spatial distributions of methylamines from five sources (agriculture, residential, transportation, other industry, and chemical industry) to be the same as those of ammonia. As can be seen from Figs. 2f–4f, the horizontal distributions of total C1-, C2-, and C3-amine emission fluxes are different from those of ammonia (not shown), especially over agricultural areas for C2-amines. To assess the effect of amine emission assumptions, comparisons of simulated C1-, C2-, and C3-amines based on the SDR approach in the present study with the FR method used in previous studies (e.g., Yu and Luo, 2014) with those observed at a suburban site (NUIST site, Nanjing, China) and an urban site (Fudan site, Shanghai, China) are given in the next section.
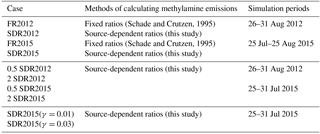
Table 3Emission rates of ammonia, C1, C2, C3-amines from different sources based on SDR for domain 3.
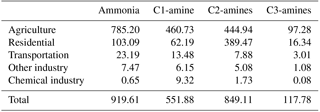
Notes: ammonia is in units of Gg (N) yr−1 and C1-, C2-, and C3-amines in units of Mg (N) yr−1.

Figure 5Comparisons of simulated and observed wind direction at 10 m (a), wind speed at 10 m (b), C1-amine (c), C2-amines (d), and C3-amines (e) concentrations at the NUIST site in Nanjing, China, from 26 to 31 August 2012. In (c–e), black, red, and green lines represent observations, simulated values in domain 3 based on SDR, and simulated values in domain 3 based on FR, respectively.
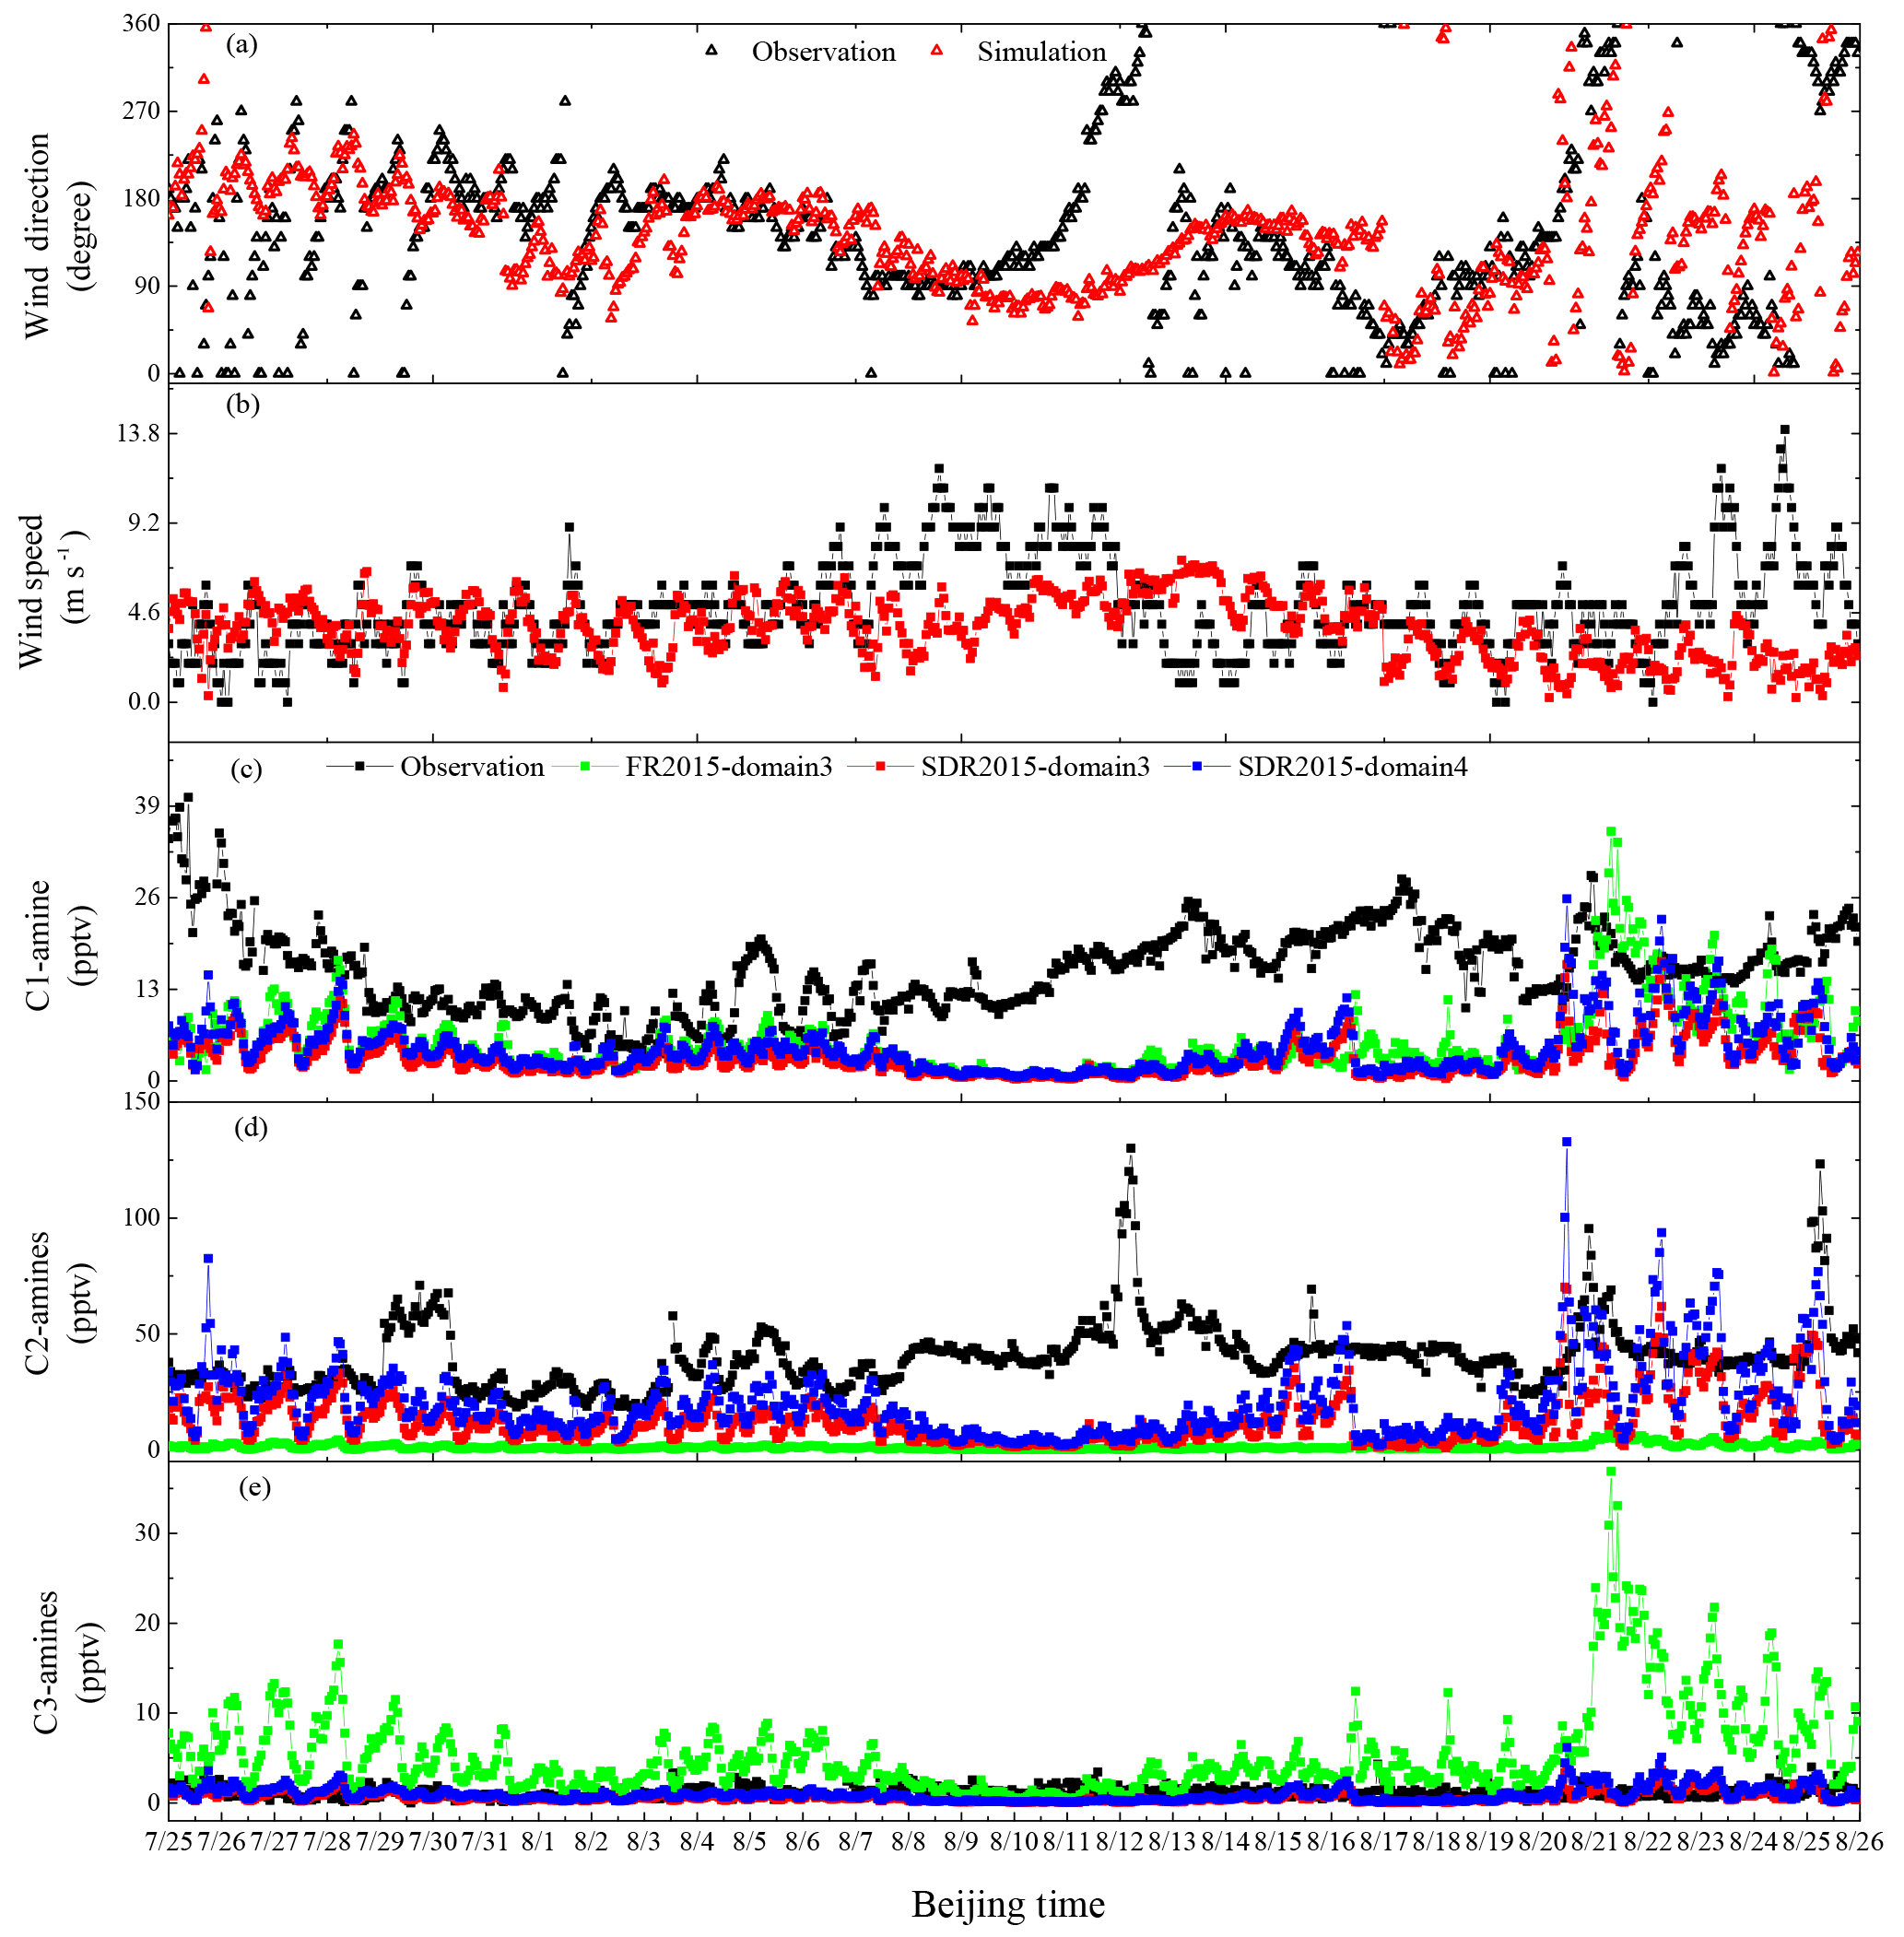
Figure 6Comparisons of simulated and observed wind direction (a), wind speed (b), C1-amine (c), C2-amines (d), and C3-amines (e) concentrations at the Fudan site in Shanghai, China from 25 July to 25 August 2015. In (c–e), black, blue, red, and green lines present observations, simulated values in domain 4 based on SDR, domain 3 based on SDR, and domain 3 based on FR, respectively.
3.2 Comparisons of simulations with observations
Figures 5 and 6 compare wind fields and concentrations of C1-, C2-, and C3-amines simulated using FR and SDR with measurements at the NUIST site in Nanjing, China (FR2012 and SDR2012, Fig. 5), and the Fudan site in Shanghai, China (FR2015 and SDR2015, Fig. 6). Simulated wind direction at the NUIST site (Fig. 5a) is overall consistent with observations, and so is wind speed at 10 m (Fig. 5b), except that the model overpredicted for 28 August to midday of 29 August. For the Fudan site, model simulations (Fig. 6a) generally reproduce observed wind direction, although there exist large differences during some periods. The simulated wind speeds at 10 m (Fig. 6b) are in agreement with observations, except during the periods of 7–14 and 23–25 August. These deviations may be caused by local underlying surface or other physical parameters in the complex urban environment.
Mean values and normalized mean biases (NMBs) are given in Table 4 to summarize the statistical performance of model-calculated C1-, C2-, and C3-amines for different cases. Previous global simulations (Yu and Luo, 2014) show general underprediction of the model (NMB values of −61.4 % for C1-amine, −79.9 % for C2-amines, and −60.9 % for C3-amines), while this study indicates that concentrations of amines based on the model with high spatial resolution can also be overpredicted. Overall, simulations based on SDR are in much better agreement with measurements than those based on FR, especially for C2- and C3-amines. Replacement of FR with SDR improves NMB for C2-amines from −71.5 to 49.12 % at the NUIST site and from −96.13 to −37.43 % at the Fudan site, while NMB improves for C3-amine from 359.02 to −41.26 % at the NUIST site and from 494.28 to 21.34 % at the Fudan site. The different performance of the model in the NUIST and Fudan sites is probably due to, but not limited to, uncertainties in meteorology fields, amine emissions and loss processes, and model resolutions. For C1-amine, both FR and SDR overpredict the concentrations by a factor of 2–3 at the NUIST site, while they underpredict by a factor of 3–4 at the Fudan site. A comparison of simulated C1-, C2-, and C3-amines in domain 4 at a resolution of 3 km×3 km (blue lines in Fig. 6c–e) with those in domain 3 (9 km×9 km horizontal resolution) (red lines in Fig. 6c–e) shows that the concentrations in domain 4 are generally higher, especially for peak values. As can be seen from the NMB values, domain 4 values are in better agreement with observations, highlighting the importance of high-resolution modeling in resolving the spatial variations in urban environments. It should be noted that the model-predicted C1- and C2-amines at the Fudan site for the period of 7–19 August are much lower than the observed values (Fig. 6c–d), at least partially due to the large deviation of the simulated wind directions and speeds during the period (Fig. 6a–b).
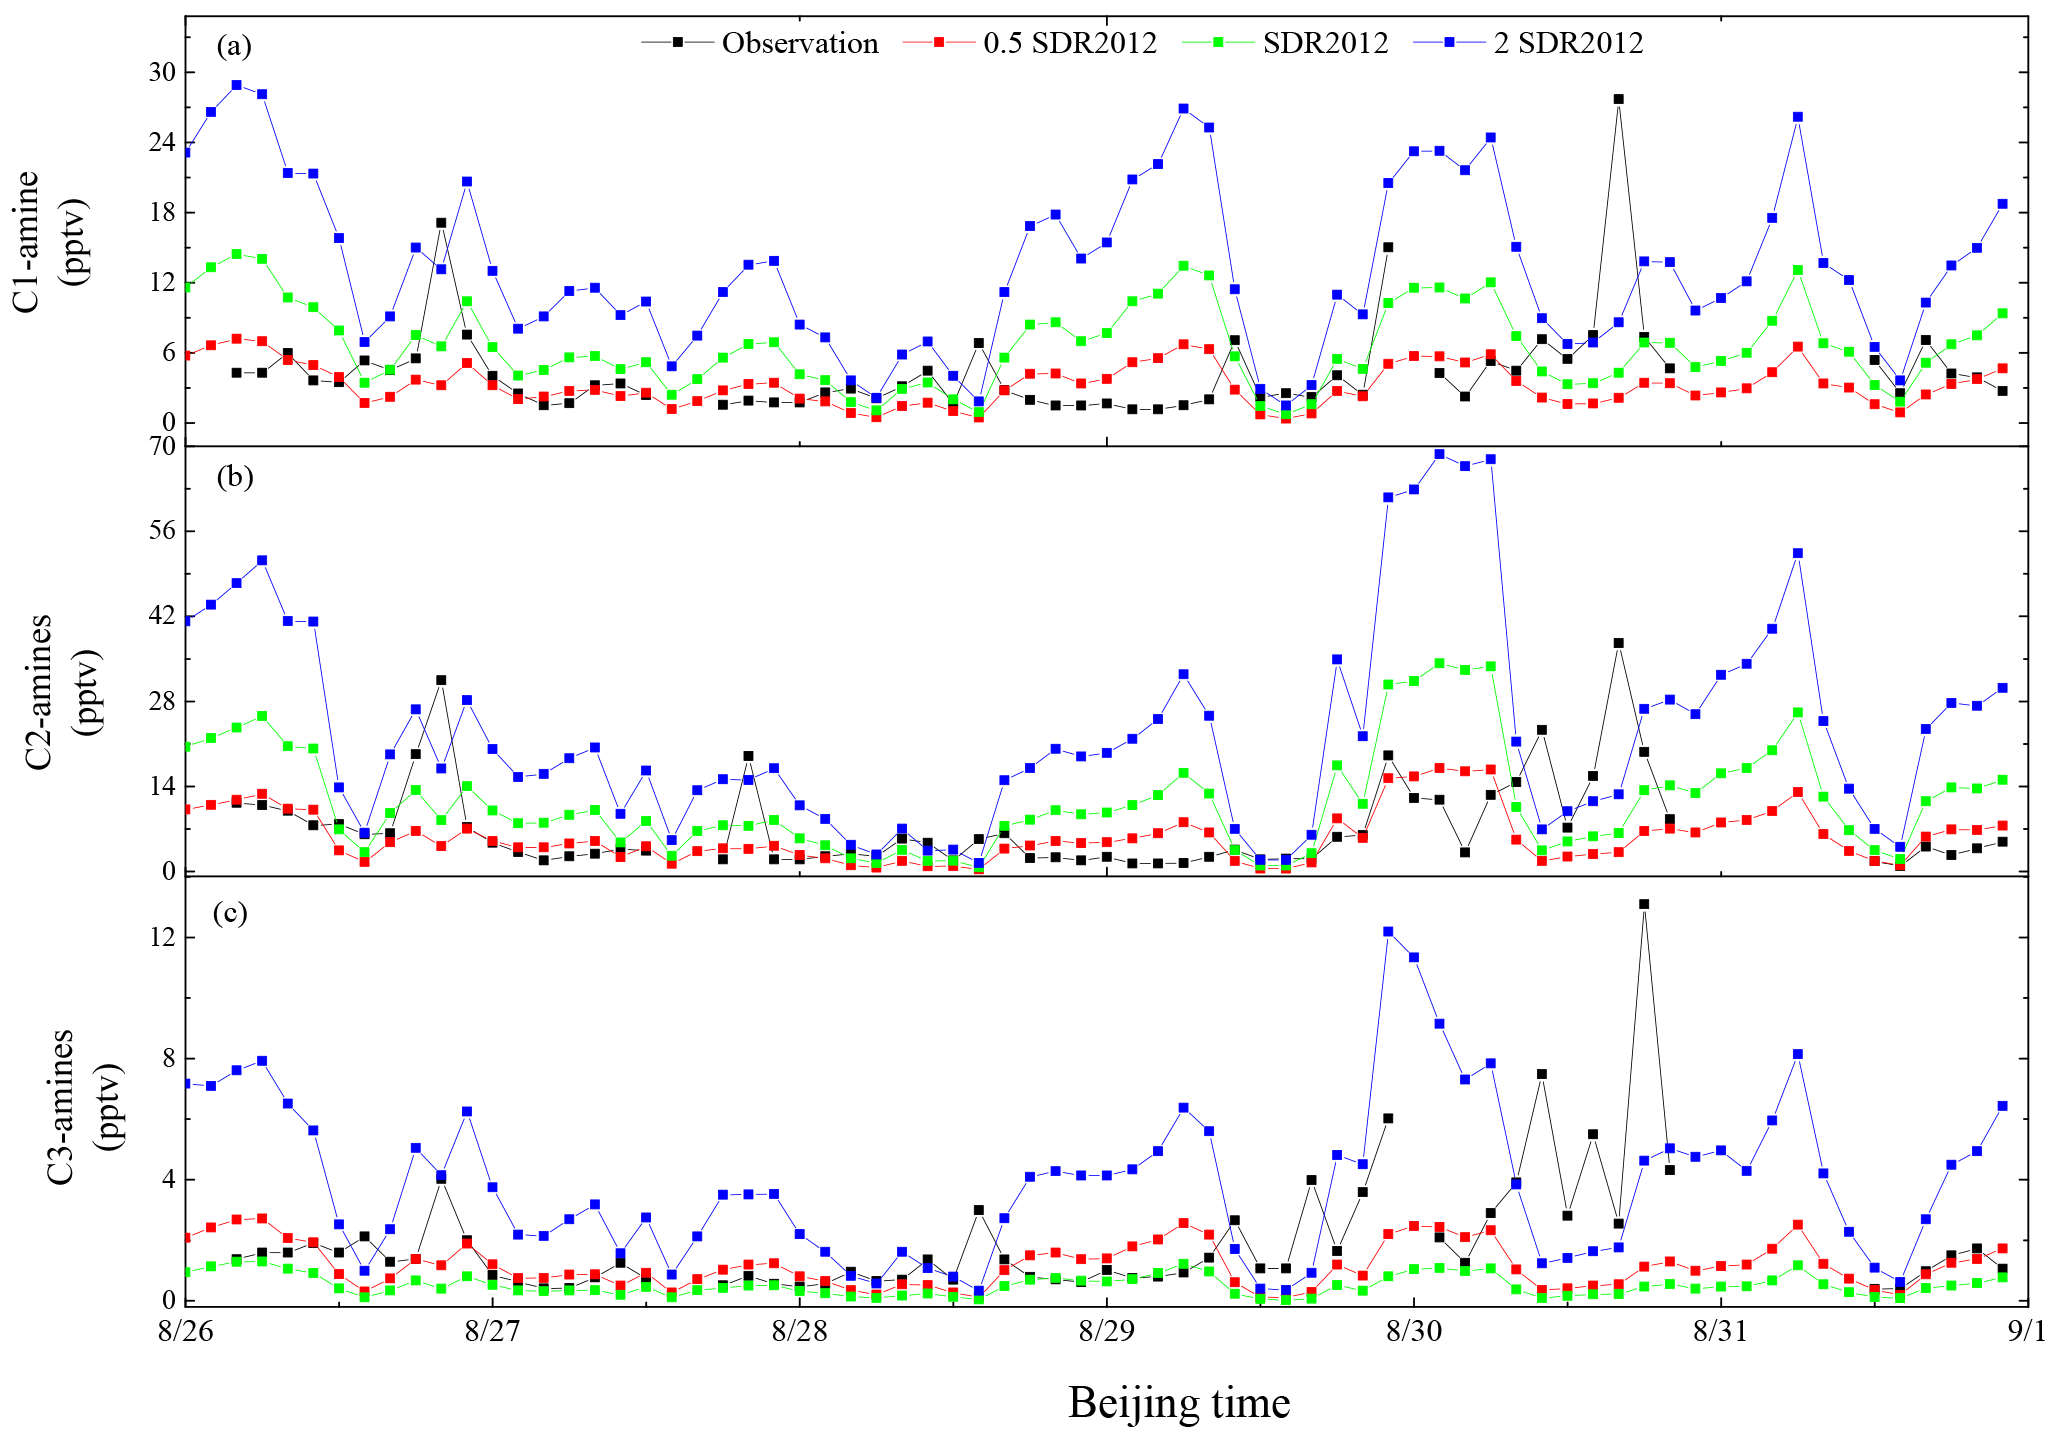
Figure 7Comparisons of simulated concentrations of C1-, C2-, C3-amines in SDR2012, 0.5 SDR2012, and 2 SDR2012 (domain 3) at the NUIST site with measurements from 26 to 31 August 2012. Black, red, green, and blue lines present observations, simulated values in 0.5 SDR2012, SDR2012, and 2 SDR2012, respectively.
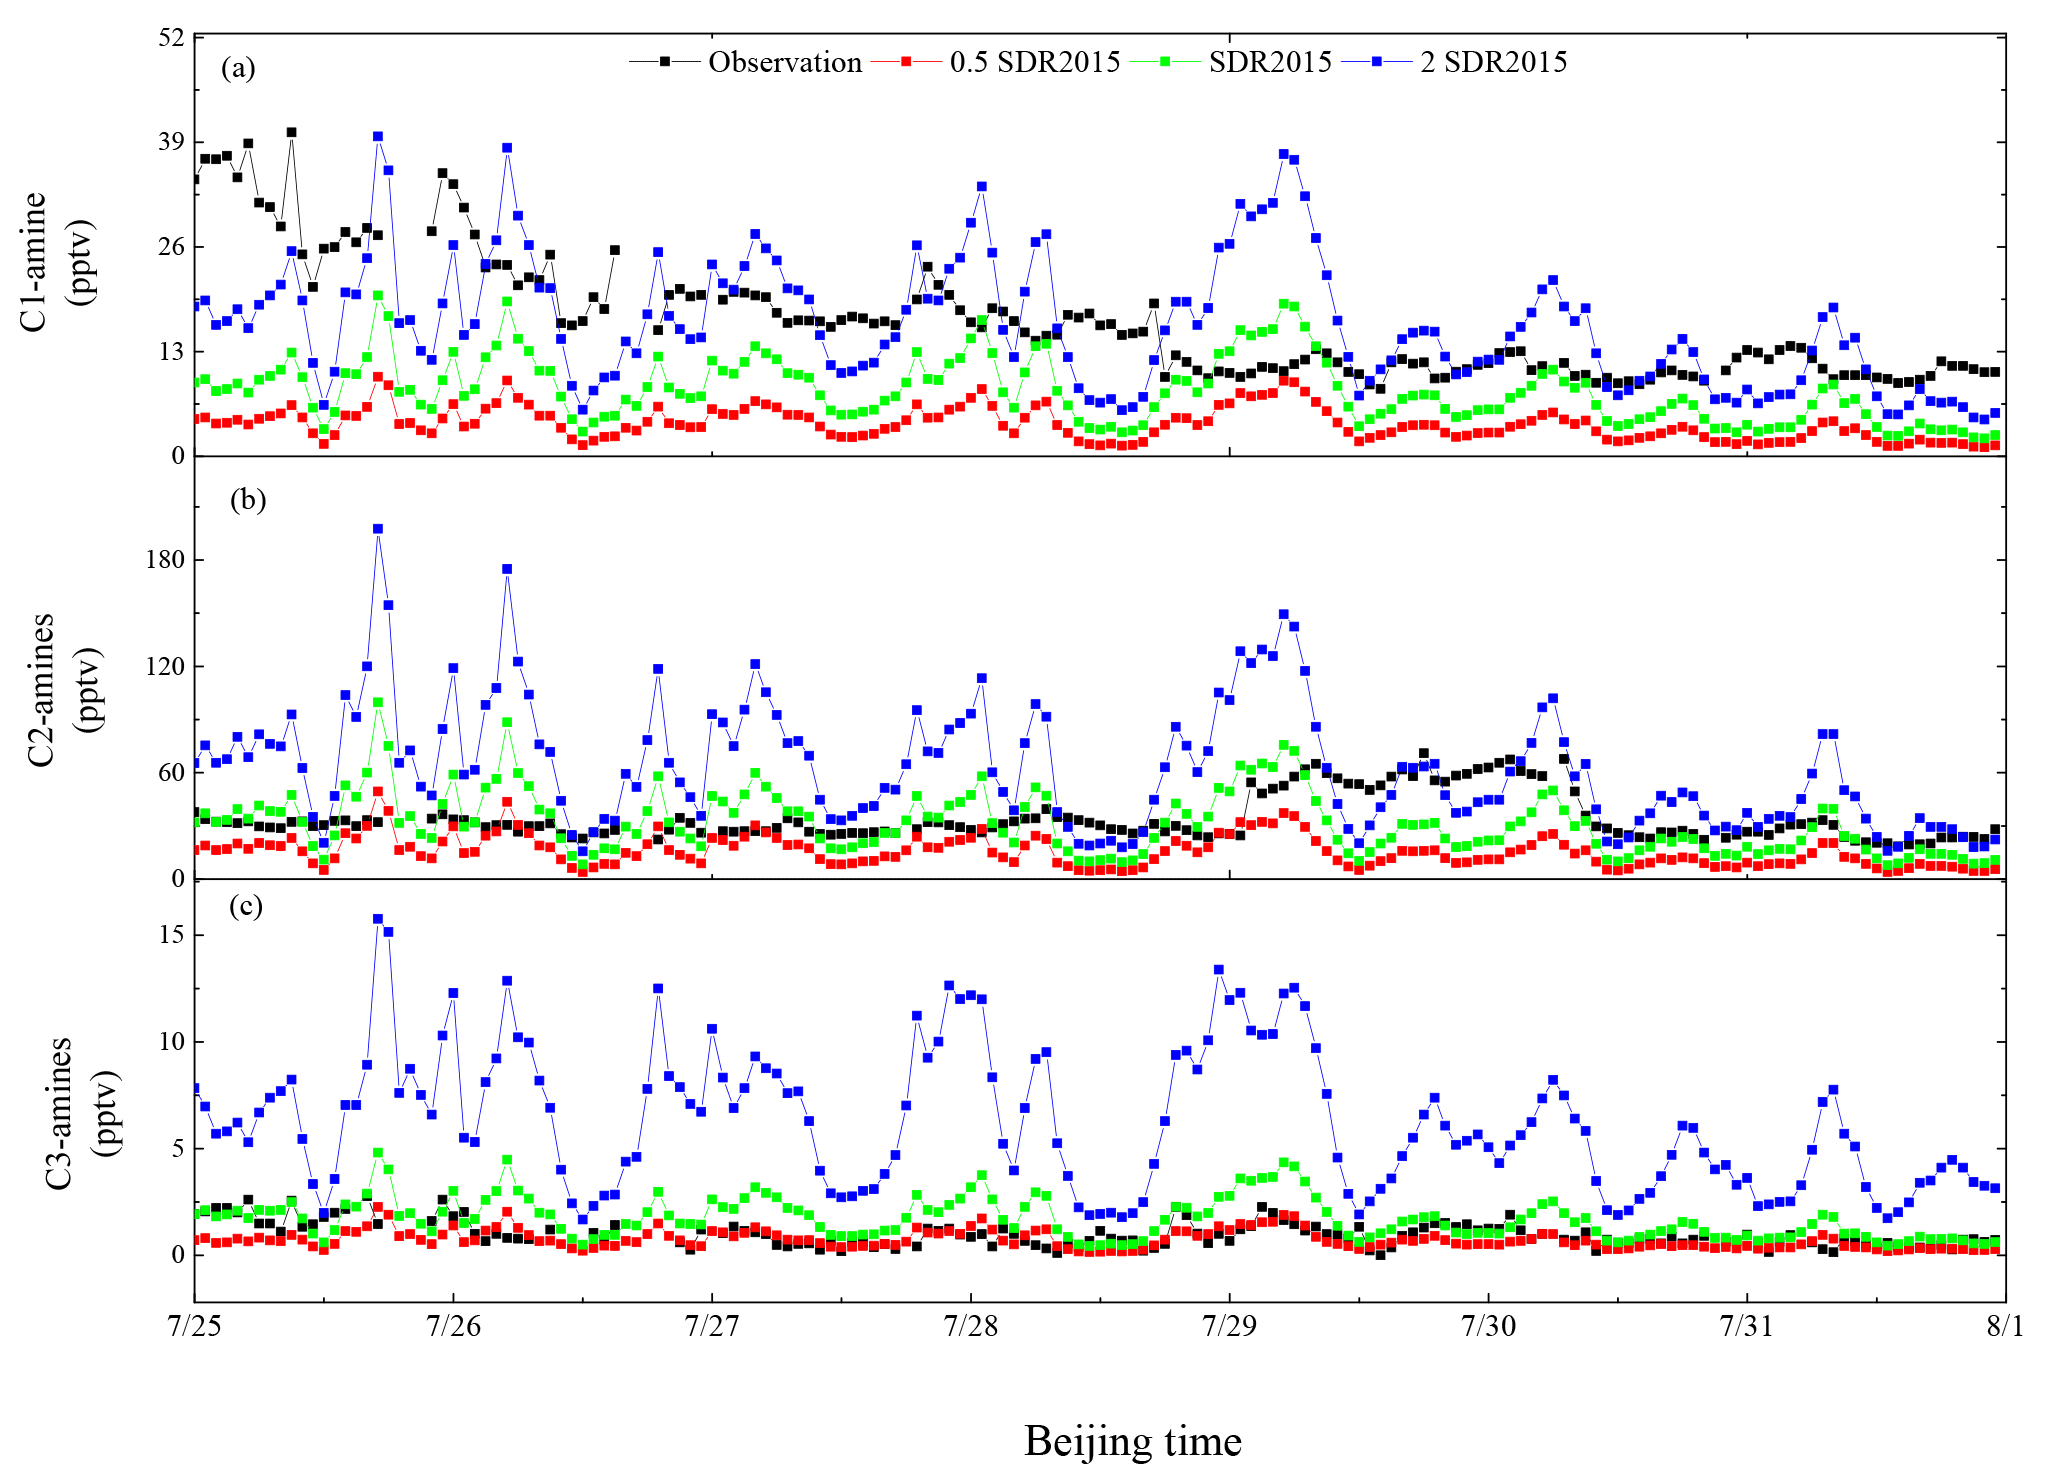
Figure 8Same as Fig. 7 but for 0.5 SDR2015, SDR2015, and 2 SDR2015 (domain 4) at the Fudan site from 25 to 31 July 2015.
Table 4Statistical performance of methylamine simulation at the NUIST site (cases: FR2012 and SDR2012) in domain 3 and the Fudan site (cases: FR2015 and SDR2015) in both domain 3 and domain 4 (values given in parentheses). The details of each case are given in Table 2.
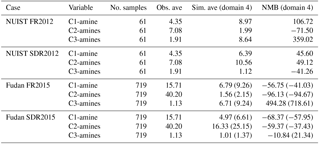
Notes: Obs. ave and Sim. ave are in units of pptv and NMB is in units of %.
As mentioned in Sect. 2.2, there exist large uncertainties in methylamine emissions because of the very limited observations available. To evaluate the effect of uncertainties in emissions on simulated concentrations of amines, we also carry out a sensitivity study for the two SDR cases by halving and doubling the five source ratios simultaneously, defined as 0.5 SDR2012, 2 SDR2012, 0.5 SDR2015, and 2 SDR2015, respectively. In this sensitivity study, only emission ratios were changed, with other processes including deposition, oxidation, and uptake for amines unchanged. For 0.5 SDR2012 and 2 SDR2012, simulations focus on the period from 26 to 31 August 2012 (the same as the SDR2012 case), while for 0.5 SDR2015 and 2 SDR2015 the simulated period is from 25 July to 31 July 2015 when the model reproduced relatively well the wind fields (Fig. 6). Comparisons of simulated concentrations of C1-, C2-, and C3-amines in SDR2012, 0.5 SDR2012, and 2 SDR2012 at the NUIST site (domain 3) and SDR2015, 0.5 SDR2015, and 2 SDR2015 at the Fudan site (domain 4) with measurements are shown in Figs. 7 and 8, with corresponding NMB values summarized in Table 5. As expected, simulated concentrations of amines are sensitive to the assumed emission ratios and it is clear that the uncertainties in emission ratios can account for a large fraction of difference in the simulated and observed concentrations. It should be noted that, as a result of variations in human activities and/or operation conditions of facilities associated with amine emissions in the real atmosphere, the amines to ammonia emission ratios from a given source sector may vary with time, which may lead to the spikes in the observed concentrations of amines that are missed by the model simulations.
Table 5Variations in normalized mean biases (NMBs) of methylamine simulations when amine emission rates are halved or doubled, at the NUIST site (SDR2012, 0.5 SDR2012, 2 SDR2012) in domain 3 and the Fudan site (SDR2015, 0.5 SDR2015, 2 SDR2015) in domain 3 and domain 4 (values given in parentheses).
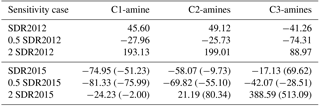
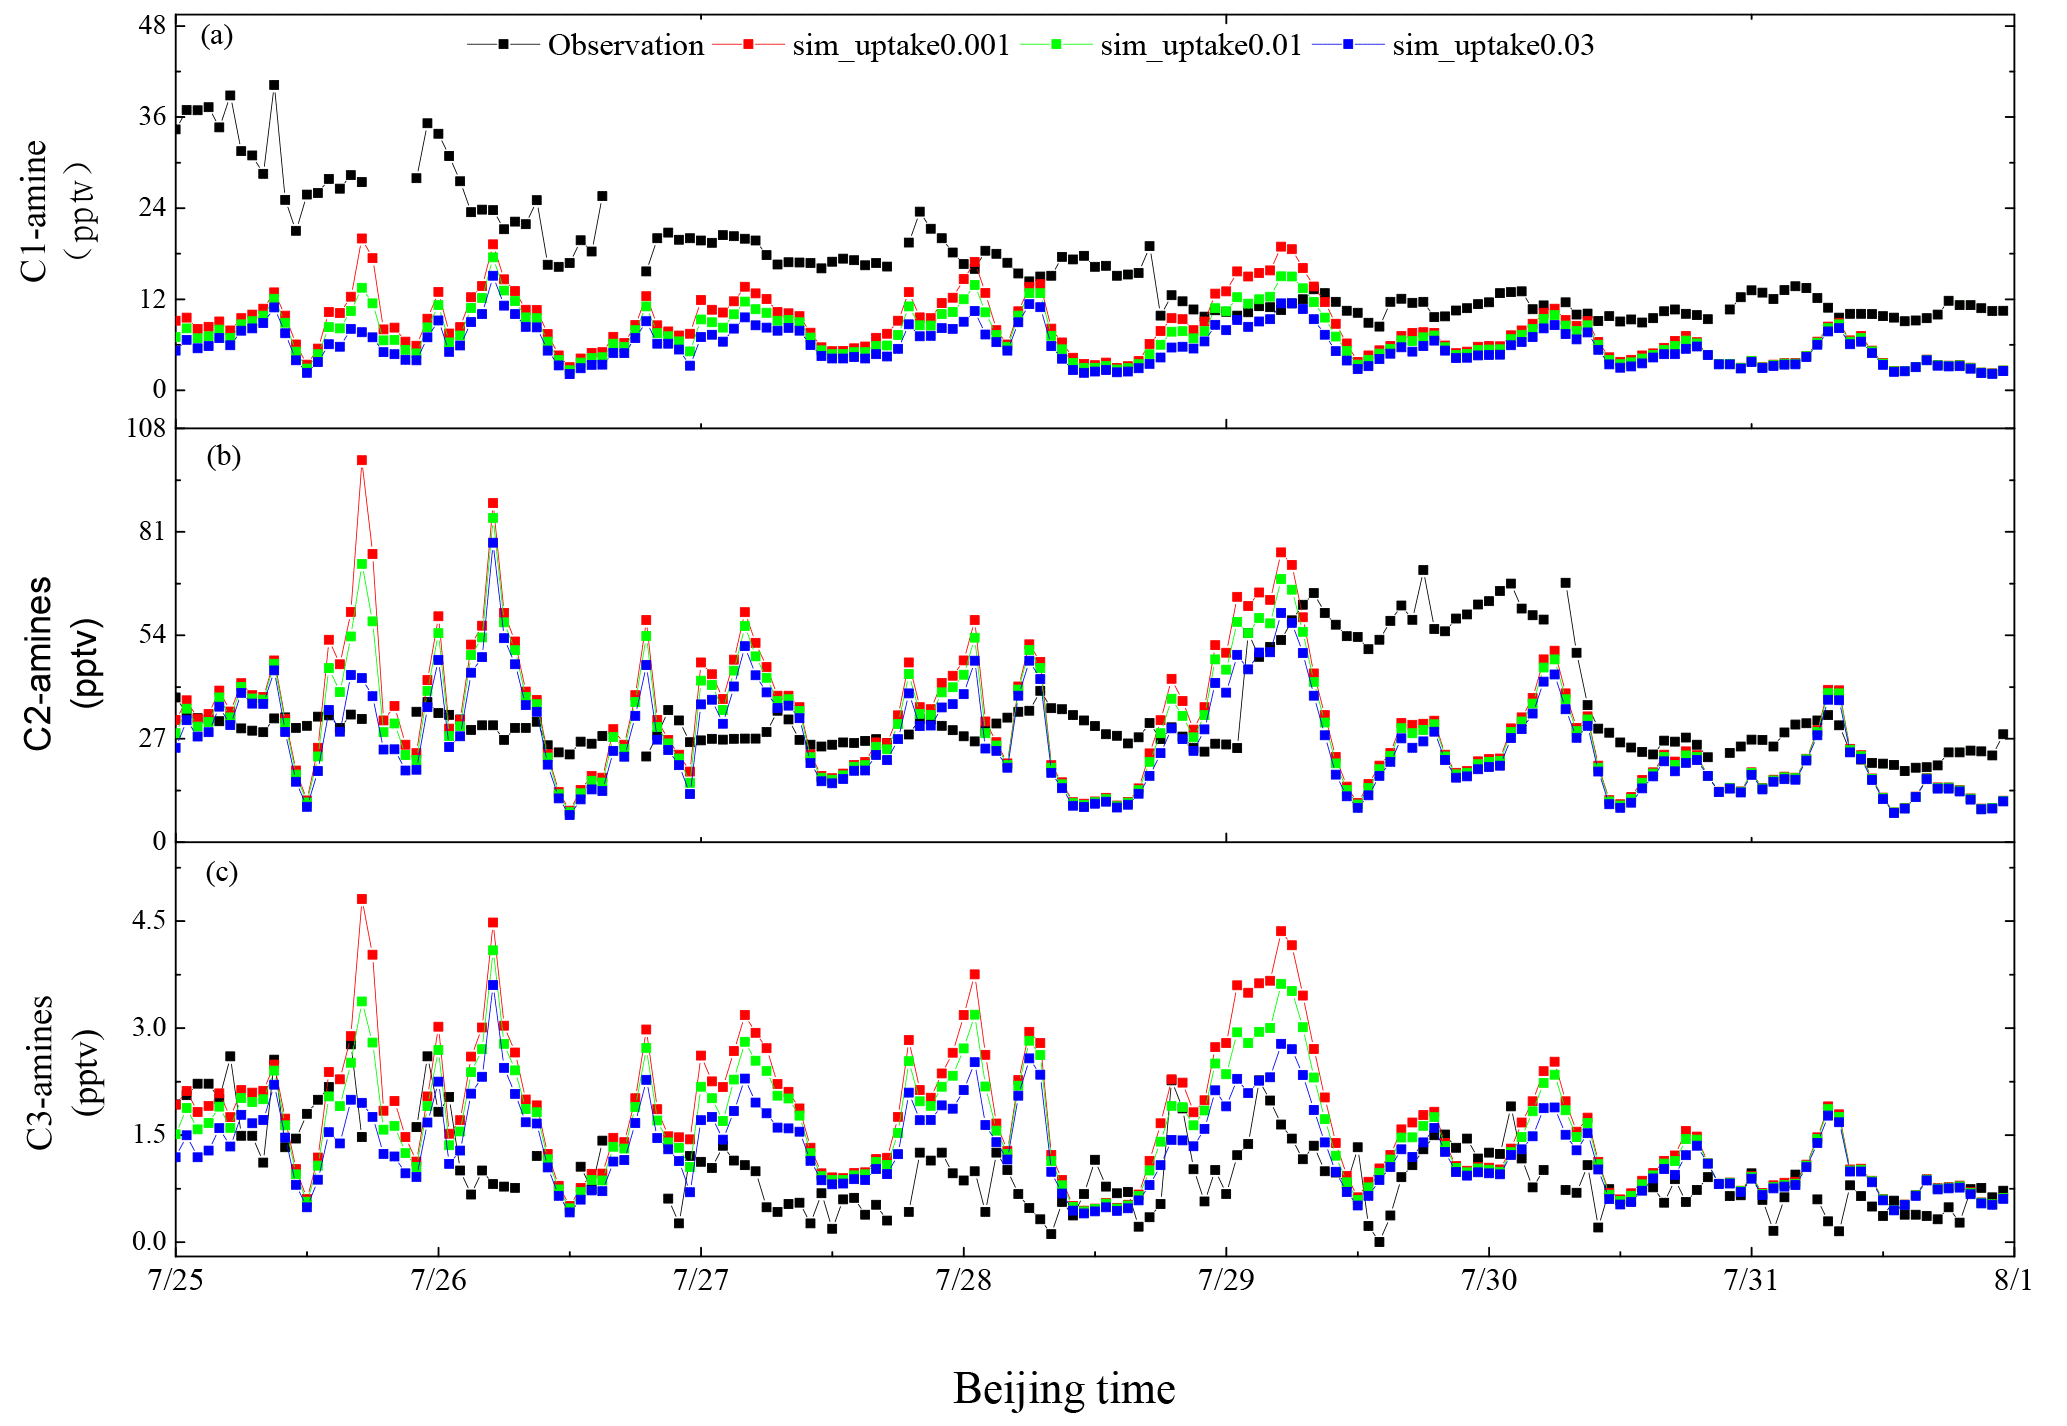
Figure 9Time series of observed and simulated concentrations of C1-, C2-, and C3-amines with γ=0.001, 0.01, and 0.03 from 25 to 31 July 2015 at the Fudan site.
To explore the effect of uncertainty in uptake coefficients on simulated concentrations of amines, we have carried out sensitivity studies using two different uptake coefficients (γ=0.01, 0.03) for SDR2015 from 25 to 31 July 2015. Figure 9 shows time series of observed and simulated concentrations of amines' different γ values (0.001 0.01, 0.03) at the Fudan site from 25 to 31 July 2015, while Table 6 gives the corresponding NMBs. It can be seen from Fig. 9 that the effect of uptake coefficients is larger during the night time when the oxidation sink is small. Simulated C1- and C2-amines are closer to observations with γ=0.001 (NBM , −9.37 %) compared to γ=0.01 (NBM , −14.98 %) and γ=0.03 (NBM , −23.02 %), while C3-amines are in better agreement with measurements when γ=0.03 with NMB of 69.62, 54.79 %, and 31.84 % for γ=0.001, 0.01 and 0.03, respectively. The uncertainty in the uptake coefficient may explain some of the differences between the simulated and observed concentrations.
Table 6Variations in normalized mean biases (NMBs) of methylamines simulations when aerosol uptake coefficients is 0.001, 0.01, and 0.03 at the Fudan site in domain 4 during period from 25 and 31 July 2015.
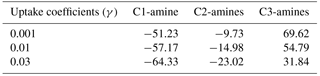

Figure 10Comparisons of simulated and observed C2-amines at the Fudan site for different wind direction zones: (a) wind directions between 175 and 240∘ when the Fudan site is downwind of high residential emissions; (b) other wind directions. NMBd3_SDR, NMBd4_SDR, and NMBd3_FR represent normalized mean bias in domain 3 and domain 4 based on SDR and domain 3 based on FR, respectively.
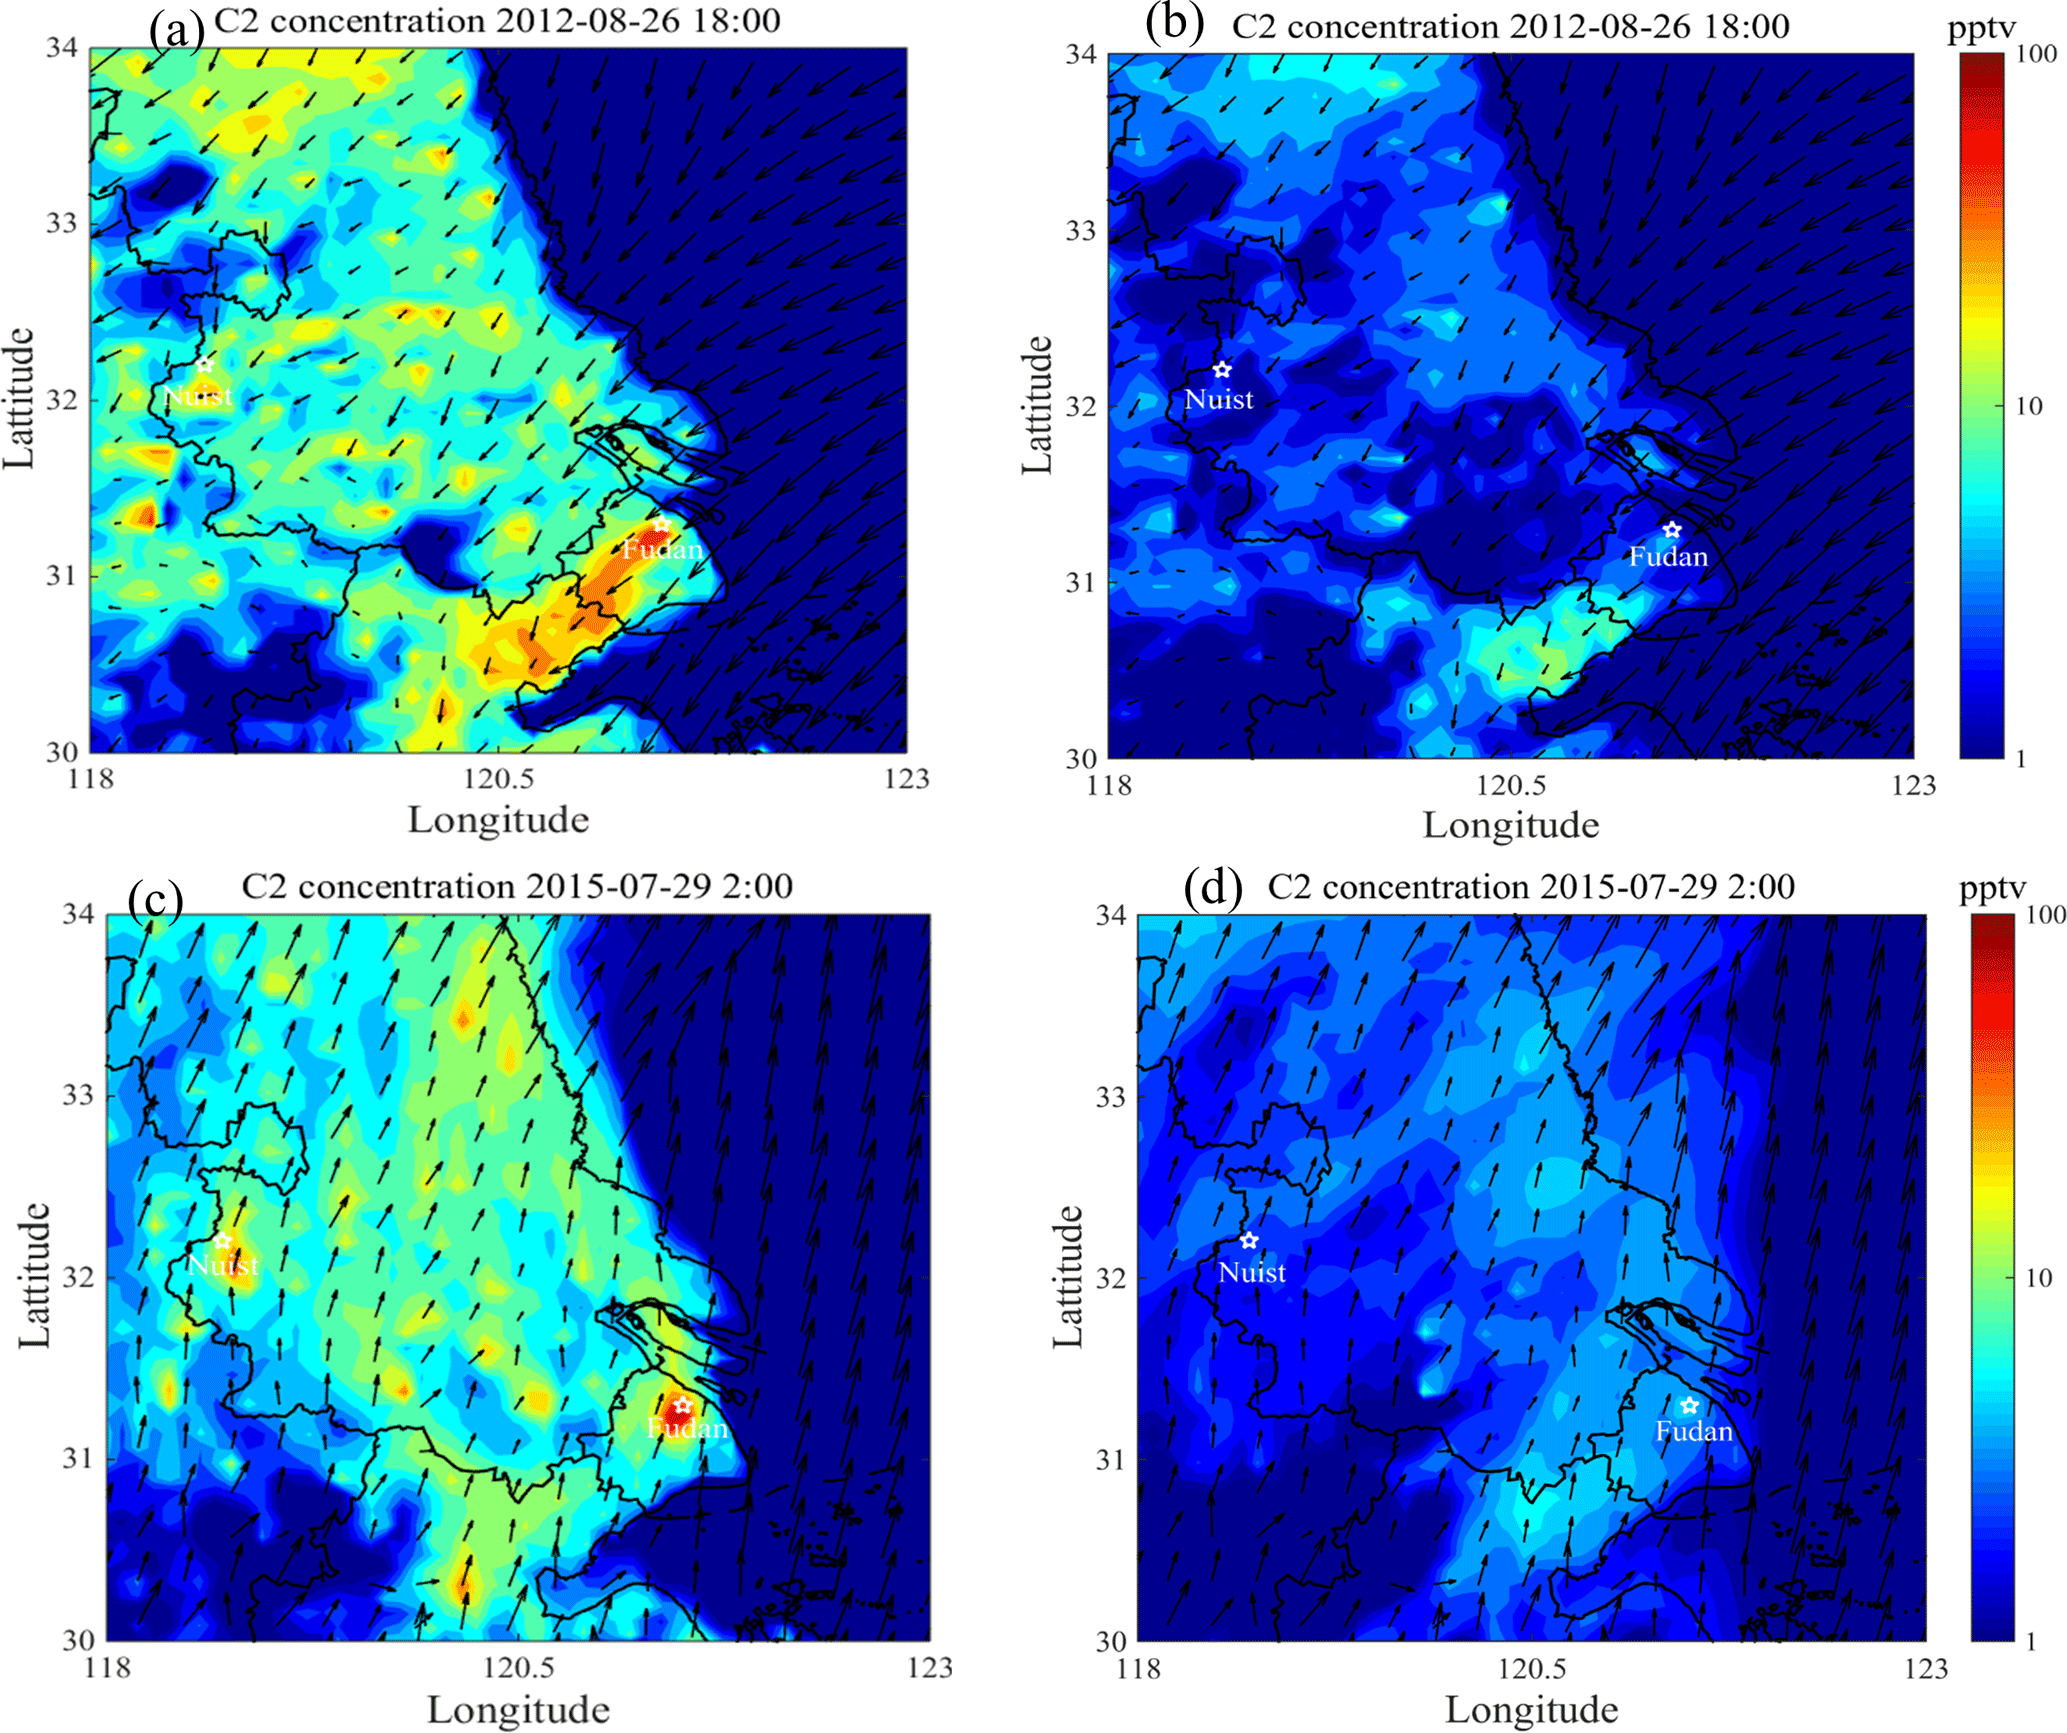
Figure 11Simulated concentrations of C2-amines at 18:00 on 26 August 2012 and 02:00 on 29 July 2015 using SDR (a, c) and FR (b, d) in domain 3 (horizontal resolution at 9 km×9 km).
The performance of simulations with different wind directions are of varying quality at the Fudan site. Periods with difference in simulated and observed wind directions within −30 to 30∘ are selected for further comparisons. Figure 10 shows a close comparison of simulated and observed concentrations of C2-amines with wind direction between 175 and 240∘ (Fig. 10a) and other wind directions (Fig. 10b) at the Fudan site. Figure 10 shows that simulated concentrations of C2-amines with wind direction between 175 and 240∘ where the air mass was coming from residential areas (see Fig. 3a) are more consistent with measurements ( %, NMBd4_SDR=7.03 %) than those from other wind directions ( %, %), indicating that the SDR-based residential emissions for C2-amines may be reasonable. It can also be seen from Fig. 10 that FR assumption underpredicts C2-amines by 1–2 orders of magnitude with NMB of −93.04 and −96.29 % for wind direction between 175 and 240∘ and other wind directions, respectively, highlighting the necessity to use SDR in polluted urban areas such as Shanghai, China.
To illustrate further the difference in simulated amines for SDR and FR cases and the effect of wind directions, we present in Fig. 11 the horizontal distributions of simulated concentrations of C2-amines in domain 3 (horizontal resolution 9 km×9 km) at 18:00 on 26 August and at 02:00 on 29 July 2015. As shown in Fig. 5d, the observed C2-amines concentration at the NUIST site at 18:00 on 26 August is ∼19 pptv, and the corresponding simulated value is slightly lower based on SDR (13.4 pptv), while it is significantly lower (by a factor of ∼8) based on FR (2.5 pptv). A similar difference can also be seen for the Fudan site at 02:00 on 29 July 2015 (Fig. 6d). It can be seen from Fig. 11b and d that the significantly lower predicted concentrations of C2-amines are not limited to the NUIST and Fudan sites but to the whole region. It is noteworthy that concentrations of C2-amines downwind of heavy industrial zones (northeast of the NUIST site) (Fig. 11a) is reproduced well, indicating the contribution of industrial sources to concentrations of C2-amines observed at the NUIST site. For the Fudan site, residential contribution from the highly populated urban center is essential to maintain the relatively higher concentrations of C2-amines.
As we show in this section, the results based on SDR are overall in much better agreement with measurements than those based on FR assumed in previous studies. Nevertheless, there still exist large differences between SDR simulations and observations (Figs. 5–10). The differences can be caused by many factors, including, but not limited to, uncertainties in emission inventories (both ammonia and the derived amines to ammonia ratios), meteorology, oxidation and aerosol uptake of amines, and measurements. Further research is needed to reduce these uncertainties.

Figure 12Simulated horizontal distributions of mean concentrations of C1-, C2-, and C3-amines in domain 3 and domain 4 during the period of 25 July to 25 August 2015 (SDR2015 case).

Figure 13Simulated vertical distributions of mean concentrations of C1-, C2-, and C3-amines in domain 3 during the period of 25 July to 25 August 2015 (SDR2015 case).
3.3 Spatial distribution of methylamines over Yangtze River Delta
Figure 12 presents simulated mean (25 July–25 August) surface layer horizontal distributions of mean C1-, C2-, and C3-amines for the SDR2015 case in the Yangtze River Delta region (left panels) and the Shanghai area (right panels). It can be clearly seen that high concentrations of methylamines are typically confined to source regions, with very low concentrations over oceans. Figure 12a, c, and e show that averaged concentrations of C1-, C2-, and C3-amines in the surface layer in Yangtze River Delta region (based on domain 9 km×9 km resolution results) are, respectively, in the range of 2–20, 5–50, and 0.5–4 pptv, with spatial pattern similar to that of emissions (Figs. 2–4f). Concentrations of C2-amines in urban areas are higher than those in agricultural areas, while concentrations of C1-amine and C3-amines show high values in agricultural areas such as in Zhejiang Province, except for areas of high urbanization. Further measurements in these regimes of high concentrations are needed to constrain the model simulations. Considering the complex underlying surface in urban Shanghai, we apply four-domain-nested simulations to further study the Shanghai urban area. As shown in Sect. 3.2, simulations with higher spatial resolution are in better agreement with measurements. Figure 12b, d, and f, which were based on domain 4 simulations (3 km×3 km resolution), show that the Shanghai urban area are hotspots for C1-, C2-, and C3-amines, with concentrations in Shanghai downtown up to ∼15, 50, and 4 pptv, respectively. It can be seen clearly that the Fudan site is on the edge of the central area such that concentrations of methylamines are affected easily downwind of the city center, especially for C2-amines. Vertically, the concentrations of C1-, C2, and C3-amines decrease quickly with altitude (Fig. 13), dropping by a factor of ∼10 from the surface to ∼900 hPa. The horizontal and vertical distributions of methylamines for the SDR2012 case are similar to that for the SDR2015 case and are not shown. The fact that the high concentrations of methylamines are confined to source regions and the boundary layer are as a result of their short lifetime (Yu and Luo, 2014; Bergman et al., 2015), again highlighting the necessity to better quantify the emissions of amines from different sources and to model with high spatial resolutions to study their spatial distributions and potential impacts.
A few pptv of gaseous amines have been observed to be able to significantly enhance new particle formation in the atmosphere (Almeida et al., 2013; Chen et al., 2014; Jen et al., 2016; Lehtipalo et al., 2016). Recent field measurements (Zheng et al., 2015; Yao et al., 2016) indicate that gaseous amines in the Yangtze River Delta region, China, can reach a few tens of pptv with large temporal variations. To understand the processes controlling the concentrations of amines and their spatio-temporal distribution in the atmosphere, we improve a previous method in estimating amine emissions by distinguishing amine emissions from five different source types and simulating concentrations of amines over the Yangtze River Delta with a regional model (WRF-Chem).
The present study calculates methylamine emissions from five source types, including chemical industry, other industry, agriculture, residential, and transportation. The temporal and spatial variations of methylamine emissions are assumed to follow that of ammonia for different sources. The amines-to-ammonia mass emission ratios, derived from previous measurements reported in Zheng et al. (2015), are 0.026, 0.0015, 0.0011, 0.0011, and 0.0011 for C1-amine, 0.007, 0.0018, 0.0015, 0.01, and 0.0009 for C2-amines, and 0.0004, 0.0005, 0.00043, 0.0006, and 0.0004 for C3-amines for chemical–industrial, other industrial, agricultural, residential, and transportational sources, respectively. Ammonia, C1-, C2-, and C3-amine emission flux in Yangtze River Delta are 919.61 Gg N yr−1, 551.88, 849.11, and 117.78 Mg N yr−1, respectively. The contributions of chemical–industrial, other industrial, agricultural, residential, and transportational sources to domain-average methylamines (C1-amine + C2-amines + C3-amines) are 0.73, 0.81, 66.04, 30.81 and 1.61 %, respectively, which shows that agricultural and residential source types dominate methylamine emissions over the Yangtze River Delta.
Three tracers representing C1-, C2-, and C3-amines have been added into WRF-Chem and simulations with multiple nested domains have been carried out. The simulated concentrations of C1-, C2-, and C3-amines, based on fixed ratios (FR) of amines to ammonia assumed in previous studies and source-dependent ratios (SDR) derived in the present study, have been compared with field measurements at a suburban site in Nanjing, China, and at an urban site in Shanghai, China. We show that SDR substantially improves the ability of the model in capturing the observed concentrations of methylamines. Concentrations of C1-, C2-, and C3-amines are in the range of 2–20, 5–50, and 0.5–4 pptv in the surface layer in the Yangtze River Delta region. Vertically, the concentrations of C1-, C2-, and C3-amines decrease by a factor of ∼10 from the surface to ∼900 hPa. High concentrations of methylamines are generally confined to source regions and the boundary layer as a result of their short lifetime. For the urban Fudan site, simulated concentrations downwind of areas of high residential activities are closer to site measurements than for other wind directions, suggesting that residential sources are important in an urban area and that the present estimation of residential emissions may be reasonable.
It should be pointed out that the uncertainties in emissions (of both ammonia and amines to ammonia ratios), meteorology, aerosol uptake, and chemical processes can all impact the simulated values of amines in this study. The uptake of different amines under different atmospheric conditions is not clearly understood yet. To advance the accuracy of amine emissions, more field observations as well as more accurate source apportionment of amines are needed. This study focuses on the summer season due to limited measurements, but the model approach developed here can be applied to study the seasonal characteristics of methylamines and subsequently the impact of amines on new particle formation and growth in the future.
Observed amines data are available for the NUIST site (Zheng et al., 2015) and the Fudan site (Yao et al., 2016). Observed wind data are available for the NUIST site (Zheng et al., 2015) and the Fudan site at https://www.wunderground.com/history/airport/ZSPD/2018/6/4/DailyHistory.html (last access: 4 June 2018). The modeling data in this study are available from the authors upon request.
The authors declare that they have no conflict of interest.
This work was financially supported by the National Key Research and
Development Program of China (grant no. 2016YFA060130X), the
National Natural Science Foundation of China (21677038, 91644213),
and the National Science Foundation of US (1550816). Lin Wang thanks
the Royal Society Newton Advanced Fellowship (NA140106). Jun Zheng
is grateful for the funding from NSFC 41275142 and 91644213.
Edited by: Leiming Zhang
Reviewed by: Shan-Hu Lee and two anonymous referees
Almeida, J., Schobesberger, S., Kürten, A., Ortega, I. K., Kupiainen-Määttä, O., Praplan, A. P., Adamov, A., Amorim, A., Bianchi, F., Breitenlechner, M., David, A., Dommen, J., Donahue, N. M., Downard, A., Dunne, E., Duplissy, J., Ehrhart, S., Flagan, R. C., Franchin, A., Guida, R., Hakala, J., Hansel, A., Heinritzi, M., Henschel, H., Jokinen, T., Junninen, H., Kajos, M., Kangasluoma, J., Keskinen, H., Kupc, A., Kurtén, T., Kvashin, A. N., Laaksonen, A., Lehtipalo, K., Leiminger, M., Leppä, J., Loukonen, V., Makhmutov, V., Mathot, S., McGrath, M. J., Nieminen, T., Olenius, T., Onnela, A., Petäjä, T., Riccobono, F., Riipinen, I., Rissanen, M., Rondo, L., Ruuskanen, T., Santos, F. D., Sarnela, N., Schallhart, S., Schnitzhofer, R., Seinfeld, J. H., Simon, M., Sipilä, M., Stozhkov, Y., Stratmann, F., Tomé, A., Tröstl, J., Tsagkogeorgas, G., Vaattovaara, P., Viisanen, Y., Virtanen, A., Vrtala, A., Wagner, P. E., Weingartner, E., Wex, H., Williamson, C., Wimmer D., Ye, P., Yli-Juuti, T., Carslaw, K. S., Kulmala, M., Curtius, J., Baltensperger, U., Worsnop, D. R., Vehkamäki, H., and Kirkby, J.:: Molecular understanding of sulphuric acid-amine particle nucleation in the atmosphere, Nature, 502, 359–363, https://doi.org/10.1038/nature12663, 2013.
Bergman, T., Laaksonen, A., Korhonen, H., Malila, J., Dunne, E. M., Mielonen, T., Lehtinen, K. E. J., Kühn, T., Arola, A., and Kokkola, H.: Geographical and diurnal features of amine-enhanced boundary layer nucleation, J. Geophys. Res.-Atmos., 120, 9606–9624, https://doi.org/10.1002/2015JD023181, 2015.
Carl, S. A. and Crowley, J. N.: Sequential two (blue) photon absorption by NO2 in the presence of H2 as a source of OH in pulsed photolysis kinetic studies: rate constants for reaction of OH with CH3NH2, (CH3)2NH, (CH3)3N, and C2H5NH2 at 295 K, J. Phys. Chem. A, 102, 8131–8141, 1998.
Chen, H., Varner, M. E., Gerber, R. B., and Finlayson-Pitts, B. J.: Reactions of Methanesulfonic Acid with Amines and Ammonia as a Source of New Particles in Air, J. Phys. Chem. B, 120, 1526–1536, https://doi.org/10.1021/acs.jpcb.5b07433, 2016.
Chen, M., Titcombe, M., Jiang, J., Kuang, C., Fischer, M. L., Edgerton, E., Eisele, F. L., Siepmann, J. I., Hanson, D. H., Zhao, J., and McMurry, P. H.: Acid-based chemical reaction model for nucleation rates in the polluted boundary layer, P. Natl. Acad. Sci. USA, 109, 18713–18718, 2012.
Clough, S. A., Shephard, M. W., Mlawer, E. J., Delamere, J. S., Iacono, M. J., Cady-Pereira, K., Boukabara, S., and Brown, P. D.: Atmospheric radiative transfer modeling: A summary of the AER codes, J. Quant. Spectrosc. Ra., 91, 233–244, https://doi.org/10.1016/j.jqsrt.2004.05.058, 2005.
Erupe, M. E., Viggiano, A. A., and Lee, S.-H.: The effect of trimethylamine on atmospheric nucleation involving H2SO4, Atmos. Chem. Phys., 11, 4767–4775, https://doi.org/10.5194/acp-11-4767-2011, 2011.
Fan, Q., Zhang, Y., Ma, W., Ma, H., Feng, J., Yu, Q., Yang, X., Ng, S. K. W., Fu, Q., and Chen, L.: Spatial and Seasonal Dynamics of Ship Emissions over the Yangtze River Delta and East China Sea and Their Potential Environmental Influence, Environ. Sci. Technol., 50, 1322–1329, https://doi.org/10.1021/acs.est.5b03965, 2016.
Freshour, N. A., Carlson, K. K., Melka, Y. A., Hinz, S., Panta, B., and Hanson, D. R.: Amine permeation sources characterized with acid neutralization and sensitivities of an amine mass spectrometer, Atmos. Meas. Tech., 7, 3611–3621, https://doi.org/10.5194/amt-7-3611-2014, 2014.
Ge, X. L., Wexler, A. S., and Clegg, S. L.: Atmospheric amines – Part I: A review, Atmos. Environ., 45, 524–546, 2011.
Grell, G. A. and Freitas, S. R.: A scale and aerosol aware stochastic convective parameterization for weather and air quality modeling, Atmos. Chem. Phys., 14, 5233–5250, https://doi.org/10.5194/acp-14-5233-2014, 2014.
Grell, G. A., Peckham, S. E., Schmitz, R., McKeen, S. A., Frost, G., Skamarock, W. C., and Eder, B.: Fully coupled “online” chemistry within the WRF model, Atmos. Environ., 39, 6957–6975, 2005.
Guenther, A., Karl, T., Harley, P., Wiedinmyer, C., Palmer, P. I., and Geron, C.: Estimates of global terrestrial isoprene emissions using MEGAN (Model of Emissions of Gases and Aerosols from Nature), Atmos. Chem. Phys., 6, 3181–3210, https://doi.org/10.5194/acp-6-3181-2006, 2006.
Hanson, D. R., McMurry, P. H., Jiang, J., Tanner, D., and Huey, L. G.: Ambient Pressure Proton Transfer Mass Spectrometry: Detection of Amines and Ammonia, Environ. Sci. Technol., 45, 8881–8888, https://doi.org/10.1021/es201819a, 2011.
Hong, S. Y., Noh, Y., and Dudhia, J.: A new vertical diffusion package with an explicit treatment of entrainment processes, Mon. Weather Rev., 134, 2318–2341, 2006.
Huang, C., Chen, C. H., Li, L., Cheng, Z., Wang, H. L., Huang, H. Y., Streets, D. G., Wang, Y. J., Zhang, G. F., and Chen, Y. R.: Emission inventory of anthropogenic air pollutants and VOC species in the Yangtze River Delta region, China, Atmos. Chem. Phys., 11, 4105–4120, https://doi.org/10.5194/acp-11-4105-2011, 2011.
Jen, C. N., Bachman, R., Zhao, J., McMurry, P. H., and Hanson, D. R., Diamine-sulfuric acid reactions are a potent source of new particle formation, Geophys. Res. Lett., 43, 867–873, https://doi.org/10.1002/2015GL066958, 2016.
Kuhn, U., Sintermann, J., Spirig, C., Jocher, M., Ammann, C., and Neftel, A.: Basic biogenic aerosol precursors: Agricultural source attribution of volatile amines revised, Geophys. Res. Lett., 38, L16811, https://doi.org/10.1029/2011GL047958, 2011.
Kürten, A., Jokinen, T., Simon, M., Sipilää M., Sarnela, N., Junninen, H., Adamov, A., Almeida, J., Amorim, A., Bianchi, F., Breitenlechner, M., Dommen, J., Donahue, N. M., Duplissy, J., Ehrhart, S., Flagan, R. C., Franchin, A., Hakala, J., Hansel, A., Heinritzi, M., Hutterli, M., Kangasluoma, J., Kirkby, J., Laaksonen, A., Lehtipalo, K., Leiminger, M., Makhmutov, V., Mathot, S., Onnela, A., Petäjä, T., Praplan, A. P., Riccobono, F., Rissanen, M. P., Rondo, L., Schobesberger, S., Seinfeld, J. H., Steiner, G., Tomé, A., Tröstl, J., Winkler, P. M., Williamson, C., Wimmer, D., Ye, P., Baltensperger, U., Carslaw, K. S., Kulmala, M., Worsnop, D. R., and Curtius, J.: Neutral molecular cluster formation of sulfuric acid-dimethylamine observed in real time under atmospheric conditions, P. Natl. Acad. Sci. USA, 111, 15019–15024, https://doi.org/10.1073/pnas.1404853111, 2014.
Kurtén, T., Loukonen, V., Vehkamäki, H., and Kulmala, M.: Amines are likely to enhance neutral and ion-induced sulfuric acid-water nucleation in the atmosphere more effectively than ammonia, Atmos. Chem. Phys., 8, 4095–4103, https://doi.org/10.5194/acp-8-4095-2008, 2008.
Lehtipalo, K., Rondo, L., Kontkanen, J., Schobesberger, S., Jokinen, T., Sarnela, N., Kürten, A., Ehrhart, S., Franchin, A., Nieminen, T., Riccobono, F., Sipilä, M., Yli-Juuti, T., Duplissy, J., Adamov, A., Ahlm, L., Almeida, J., Amorim, A., Bianchi, F., Breitenlechner, M., Dommen, J., Downard, A. J., Dunne, E. M., Flagan, R. C., Guida, R., Hakala, J., Hansel, A., Jud, W., Kangasluoma, J., Kerminen, V.-M., Keskinen, H., Kim, J., Kirkby, J., Kupc, A., K upiainen-Määttä, O., Laaksonen, A., Lawler, M. J., Leiminger, M., Mathot, S., Olenius, T., Ortega, I. K., Onnela, A., Petäjä, T., Praplan, A., Rissanen, M. P., Ruuskanen, T., Santos, F. D., Schallhart, S., Schnitzhofer, R., Simon, M., Smith, J. N., Tröstl, J., Tsagkogeorgas, G., Tomé, A., Vaattovaara, P., Vehkamäki, H., Vrtala, A. E., Wagner, P. E., Williamson, C., Wimmer, D., Winkler, P. M., Virtanen, A., Donahue, N. M., Carslaw, K. S., Baltensperger, U., Riipinen, I., Curtius, J., Worsnop, D. R., and Kulmala, M.:: The effect of acid-base clustering and ions on the growth of atmospheric nano-particles, Nat. Commun., 7, 11594, https://doi.org/10.1038/ncomms11594, 2016.
Li, L., Chen, C. H., Fu, J. S., Huang, C., Streets, D. G., Huang, H. Y., Zhang, G. F., Wang, Y. J., Jang, C. J., Wang, H. L., Chen, Y. R., and Fu, J. M.: Air quality and emissions in the Yangtze River Delta, China, Atmos. Chem. Phys., 11, 1621–1639, https://doi.org/10.5194/acp-11-1621-2011, 2011.
Luo, G. and F. Yu, Simulation of particle formation and number concentration over the Eastern United States with the WRF-Chem + APM model, Atmos. Chem. Phys., 11, 11521–11533, https://doi.org/10.5194/acp-11-11521-2011, 2011.
Morrison, H., Thompson, G., and Tatarskii, V.: Impact of Cloud Microphysics on the Development of Trailing Stratiform Precipitation in a Simulated Squall Line: Comparison of One- and Two-Moment Schemes, Mon. Weather Rev., 137, 991–1007, 2009.
Murphy, S. M., Sorooshian, A., Kroll, J. H., Ng, N. L., Chhabra, P., Tong, C., Surratt, J. D., Knipping, E., Flagan, R. C., and Seinfeld, J. H.: Secondary aerosol formation from atmospheric reactions of aliphatic amines, Atmos. Chem. Phys., 7, 2313–2337, https://doi.org/10.5194/acp-7-2313-2007, 2007.
Myriokefalitakis, S., Vignati, E., Tsigaridis, K., Papadimas, C., Sciare, J., Mihalopoulos, N., Facchini, M. C., Rinaldi, M., Dentener, F. J., Ceburnis, D., Hatzianastasiou, N., O'Dowd, C. D., van Weele, M., and Kanakidou, M.: Global modeling of the oceanic source of organic aerosols, Adv. Meteorol., 2010, 1–16, https://doi.org/10.1155/2010/939171, 2010.
Nielsen, C. J., Herrmann, H., and Weller, C.: Atmospheric chemistry and environmental impact of the use of amines in carbon capture and storage (CCS), Chem. Soc. Rev., 41, 6684–6704, 2012.
Olenius, T., Halonen, R., Kurtén, T., Henschel, H., O. Kupiainen-Määttä, Ortega, I. K., Jen, C. N., Vehkamäki, H., and Riipinen, I.: New particle formation from sulfuric acid and amines: Comparison of monomethylamine, dimethylamine, and trimethylamine, J. Geophys. Res.-Atmos., 122, 7103–7118, https://doi.org/10.1002/2017JD026501, 2017.
Qiu, C. and Zhang, R.: Multiphase chemistry of atmospheric amines, Phys. Chem. Chem. Phys., 15, 5738–5752, 2013.
Qiu, Q., Wang, L., Lal, V., Khalizov, A. F., and Zhang, R.: Heterogeneous Chemistry of Alkylamines on Ammonium Sulfate and Ammonium Bisulfate, Environ. Sci. Technol., 45, 4748–4755, 2011.
Schade, G. W. and Crutzen, P. J.: Emission of aliphatic amines from animal husbandry and their reactions: potential source of N2O and HCN, J. Atmos. Chem., 22, 319–346, 1995.
Sellegri, K., Hanke, M., Umann, B., Arnold, F., and Kulmala, M.: Measurements of organic gases during aerosol formation events in the boreal forest atmosphere during QUEST, Atmos. Chem. Phys., 5, 373–384, https://doi.org/10.5194/acp-5-373-2005, 2005.
Tan, J., Zhang, Y., Ma, W., Yu, Q., Wang, J., and Chen, L.: Impact of spatial resolution on air quality simulation: A case study in a highly industrialized area in Shanghai, China, Atmos. Pollut. Res., 6, 322–333, 2015.
Tao, Y., Ye, X., Jiang, S., Yang, X., Chen, J., Xie, Y., and Wang, R.: Effects of amines on particle growth observed in new particle formation events, J. Geophys. Res.-Atmos., 121, 324–335, https://doi.org/10.1002/2015JD024245, 2016.
VandenBoer, T. C., Petroff, A., Markovic, M. Z., and Murphy, J. G.: Size distribution of alkyl amines in continental particulate matter and their online detection in the gas and particle phase, Atmos. Chem. Phys., 11, 4319–4332, https://doi.org/10.5194/acp-11-4319-2011, 2011.
Wang, L., Lal, V., Khalizov, A. F., and Zhang, R.: Heterogeneous chemistry of alkylamines with sulfuric acid: implications for atmospheric formation of alkylaminium sulfates, Environ. Sci. Technol., 44, 2461–2465, 2010.
Yao, L., Wang, M.-Y., Wang, X.-K., Liu, Y.-J., Chen, H.-F., Zheng, J., Nie, W., Ding, A.-J., Geng, F.-H., Wang, D.-F., Chen, J.-M., Worsnop, D. R., and Wang, L.: Detection of atmospheric gaseous amines and amides by a high-resolution time-of-flight chemical ionization mass spectrometer with protonated ethanol reagent ions, Atmos. Chem. Phys., 16, 14527–14543, https://doi.org/10.5194/acp-16-14527-2016, 2016.
Yarwood, G., Rao, S., Yocke, M., and Whitten, G. Z.: Updates to the carbon bond chemical mechanism: CB05, RT-04-00675, Prepared for Deborah Luecken, US Environmental Protection Agency Research Triangle Park, NC 27703, ENVIRON, available at: http://www.camx.com/publ/pdfs/cb05_final_report_120805.pdf (last access: 4 June 2018), 2005.
You, Y., Kanawade, V. P., de Gouw, J. A., Guenther, A. B., Madronich, S., Sierra-Hernández, M. R., Lawler, M., Smith, J. N., Takahama, S., Ruggeri, G., Koss, A., Olson, K., Baumann, K., Weber, R. J., Nenes, A., Guo, H., Edgerton, E. S., Porcelli, L., Brune, W. H., Goldstein, A. H., and Lee, S.-H.: Atmospheric amines and ammonia measured with a chemical ionization mass spectrometer (CIMS), Atmos. Chem. Phys., 14, 12181–12194, https://doi.org/10.5194/acp-14-12181-2014, 2014.
Yu, F. and Luo, G.: Modeling of gaseous methylamines in the global atmosphere: impacts of oxidation and aerosol uptake, Atmos. Chem. Phys., 14, 12455–12464, https://doi.org/10.5194/acp-14-12455-2014, 2014.
Yu, H. and Lee, S.-H.: Chemical ionisation mass spectrometry for the measurement of atmospheric amines, Environ. Chem., 9, 190, https://doi.org/10.1071/en12020, 2012.
Yu, H., McGraw, R., and Lee, S.-H.: Effects of amines on formation of sub-3 nm particles and their subsequent growth, Geophys. Res. Lett., 39, L02807, https://doi.org/10.1029/2011GL050099, 2012.
Zhang, Q., Streets, D. G., Carmichael, G. R., He, K. B., Huo, H., Kannari, A., Klimont, Z., Park, I. S., Reddy, S., Fu, J. S., Chen, D., Duan, L., Lei, Y., Wang, L. T., and Yao, Z. L.: Asian emissions in 2006 for the NASA INTEX-B mission, Atmos. Chem. Phys., 9, 5131–5153, https://doi.org/10.5194/acp-9 5131-2009, 2009.
Zhang, R., Khalizov, A., Wang, L., Hu, M., and Xu, W.: Nucleation and growth of nanoparticles in the atmosphere, Chem. Rev., 112, 1957–2011, https://doi.org/10.1021/cr2001756, 2012.
Zhao, J., Smith, J. N., Eisele, F. L., Chen, M., Kuang, C., and McMurry, P. H.: Observation of neutral sulfuric acid-amine containing clusters in laboratory and ambient measurements, Atmos. Chem. Phys., 11, 10823–10836, https://doi.org/10.5194/acp-11-10823-2011, 2011.
Zheng, J., Ma, Y., Chen, M., Zhang, Q., Wang, L., Khalizov, A. F., Yao, L., Wang, Z., Wang, X., and Chen, L.: Measurement of atmospheric amines and ammonia using the high resolution time-of-flight chemical ionization mass spectrometry, Atmos. Environ., 102, 249–259, https://doi.org/10.1016/j.atmosenv.2014.12.002, 2015.