the Creative Commons Attribution 4.0 License.
the Creative Commons Attribution 4.0 License.
 | 30 May 2018
Impacts of biogenic and anthropogenic emissions on summertime ozone formation in the Guanzhong Basin, China
Nan Li
Qingyang He
Jim Greenberg
Alex Guenther
Jingyi Li
Junji Cao
Hong Liao
Qiyuan Wang
Qiang Zhang
This study is the first attempt to understand the synergistic impact of anthropogenic and biogenic emissions on summertime ozone (O3) formation in the Guanzhong (GZ) Basin where Xi'an, the oldest and the most populous city (with a population of 9 million) in northwestern China, is located. Month-long (August 2011) WRF-Chem simulations with different sensitivity experiments were conducted and compared with near-surface measurements. Biogenic volatile organic compounds (VOCs) concentrations was characterized from six surface sites among the Qinling Mountains, and urban air composition was measured in Xi'an city at a tower 100 The WRF-Chem control experiment reasonably reproduced the magnitudes and variations of observed O3, VOCs, NOx, PM2.5, and meteorological parameters, with normalized mean biases for each parameter within ±21 %. Subsequent analysis employed the factor separation approach (FSA) to quantitatively disentangle the pure and synergistic impacts of anthropogenic and/or biogenic sources on summertime O3 formation. The impact of anthropogenic sources alone was found to be dominant for O3 formation. Although anthropogenic particles reduced NO2 photolysis by up to 60 %, the anthropogenic sources contributed 19.1 ppb O3 formation on average for urban Xi'an. The abundant biogenic VOCs from the nearby forests promoted O3 formation in urban areas by interacting with the anthropogenic NOx. The calculated synergistic contribution (from both biogenic and anthropogenic sources) was up to 14.4 ppb in urban Xi'an, peaking in the afternoon. Our study reveals that the synergistic impact of individual source contributions to O3 formation should be considered in the formation of air pollution control strategies, especially for big cities in the vicinity of forests.
- Article
(13396 KB) -
Supplement
(1898 KB) - BibTeX
- EndNote


Elevated ozone (O3) levels in China have drawn increasing attention in recent years (e.g., Xue et al., 2014; Hu et al., 2016; Wang et al., 2017, 2016). O3, a secondary pollutant, is mainly formed by complex photochemical reactions of nitrogen oxides (NOx = NO + NO2) and volatile organic compounds (VOCs). High O3 concentration at ground level is harmful to human health and ecosystems (WHO, 2005; Feng et al., 2015; Brauer et al., 2016). O3 in the troposphere is an important greenhouse gas that has the third-highest radiative forcing after CO2 and CH4 (Stevenson et al., 2013; IPCC, 2013). In addition, O3 is the primary source of the hydroxyl radical (OH), which has a major influence on the oxidizing capacity of the atmosphere and thus impacts the oxidation chemistry of secondary pollutants (e.g., sulfate and secondary organic aerosol) (Ehhalt et al., 2000; Rohrer et al., 2006). In recent years, the surface O3 level has been increasing in most Chinese cities. For instance, in the highly urbanized areas of China, maximum 8 h O3 concentration increased by 19 % (16.9 ppb) from 2015 to 2017 in the Beijing–Tianjin–Hebei (BTH) region, the growth trend was 14 % (11.3 ppb) for the Pearl River delta (PRD) region and 12 % (10.5 ppb) for the Yangtze River delta (YRD) region (http://106.37.208.233:20035/, last access: 29 May 2018). In the future, the pollution trend is likely to worsen due to potential changes of climate and emissions (Wang et al., 2013; Liu et al., 2013; Zhu et al., 2016, 2017).
On the global scale, VOC emissions from natural vegetation is estimated to be one order greater than that from anthropogenic activities, in spite of large uncertainties in different studies (Guenther et al., 2006; Wu et al., 2007, 2008; Jiang et al., 2013; Zhu et al., 2017). In addition, biogenic VOCs (e.g., isoprene) are highly reactive, reacting more efficiently with OH than most anthropogenic VOC species (Carlo et al., 2004). Previous studies have demonstrated the significant impacts of biogenic VOCs on surface O3 formation under strong solar radiation, high temperature, and NOx level (e.g., Fiore et al., 2005, 2011; Wang et al., 2008; Curci et al., 2009; Geng et al., 2011; Strong et al., 2013; Squire et al., 2014; Lee et al., 2014; Zhang et al., 2017). In China, biogenic VOC emissions are estimated to be 17–44 Tg C yr−1 (Guenther et al., 1995; Lin et al., 2008; Fu et al., 2012, 2104; Li et al., 2014) and are concentrated in the warm summer season. Current studies report that biogenic VOCs contribute to surface O3 concentrations in China (Geng et al., 2011; Qu et al., 2013, 2014) and play an important role in intercontinental transport of O3 (Zhu et al., 2017).
The impacts of biogenic VOCs on O3 formation may vary in different regions and different seasons (Im et al., 2011; Strong et al., 2013; Wagner et al., 2014; Lee et al., 2014). Qu et al. (2013) employed the RAQM model to examine the influence of biogenic emissions on daily maximum surface O3 concentration in China. Their calculations showed that in general the impact from biogenic sources on O3 were more obvious in South China than in North China, but the O3 increments in different regions did not follow the same seasonality. Geng et al. (2011) used the WRF-Chem model to evaluate the effect of biogenic emissions on O3 production in Shanghai in summer, and suggested that the carbonyls produced by the continuous oxidation of isoprene have important impacts on O3 level in the city. In addition, some studies suggest that biogenic emissions may increase due to global warming and land-use change, and the impact on O3 formation could be more significant in the future (Lin et al., 2008; Fiore et al., 2011; Liu et al., 2013; Fu et al., 2015). Fiore et al. (2011) pointed out that the potential increases in biogenic isoprene in North America (NA) could offset the regional and intercontinental surface O3 decreases produced by controls on NA anthropogenic emissions during warm seasons.
The Guanzhong (GZ) Basin is the most developed region in northwestern China. In the past few years, air pollution has grown up to be a severe issue in the GZ Basin (Wang et al., 2012; Feng et al., 2016; Xue et al., 2017), due to its specific basin topography and abundant anthropogenic emissions (Li et al., 2017). According to the data from national environmental monitoring stations in the GZ Basin, 43 % of days in 2013–2017 have AQI > 100 (e.g., unhealthy air quality category), and in summer O3 was regarded as the primary pollutant in 70 % of polluted cases. In this study, we employed a regional chemical model WRF-Chem to simulate O3 concentration in the GZ Basin for summer 2011. Our aim is the source apportionment of urban O3 formation in this city surrounded by forests, specifically quantifying the individual and synergistic contributions of anthropogenic and biogenic sources. The paper is organized as follows. We first describe the sampling campaign, the chemical model and the emission data used for driving the model (Sect. 2). We then evaluate the model performance by comparing the observed urban air quality and biogenic VOCs with the simulated results (Sect. 3). Finally, we analyze the sensitivity of summertime O3 formation to biogenic and anthropogenic sources (Sect. 4).
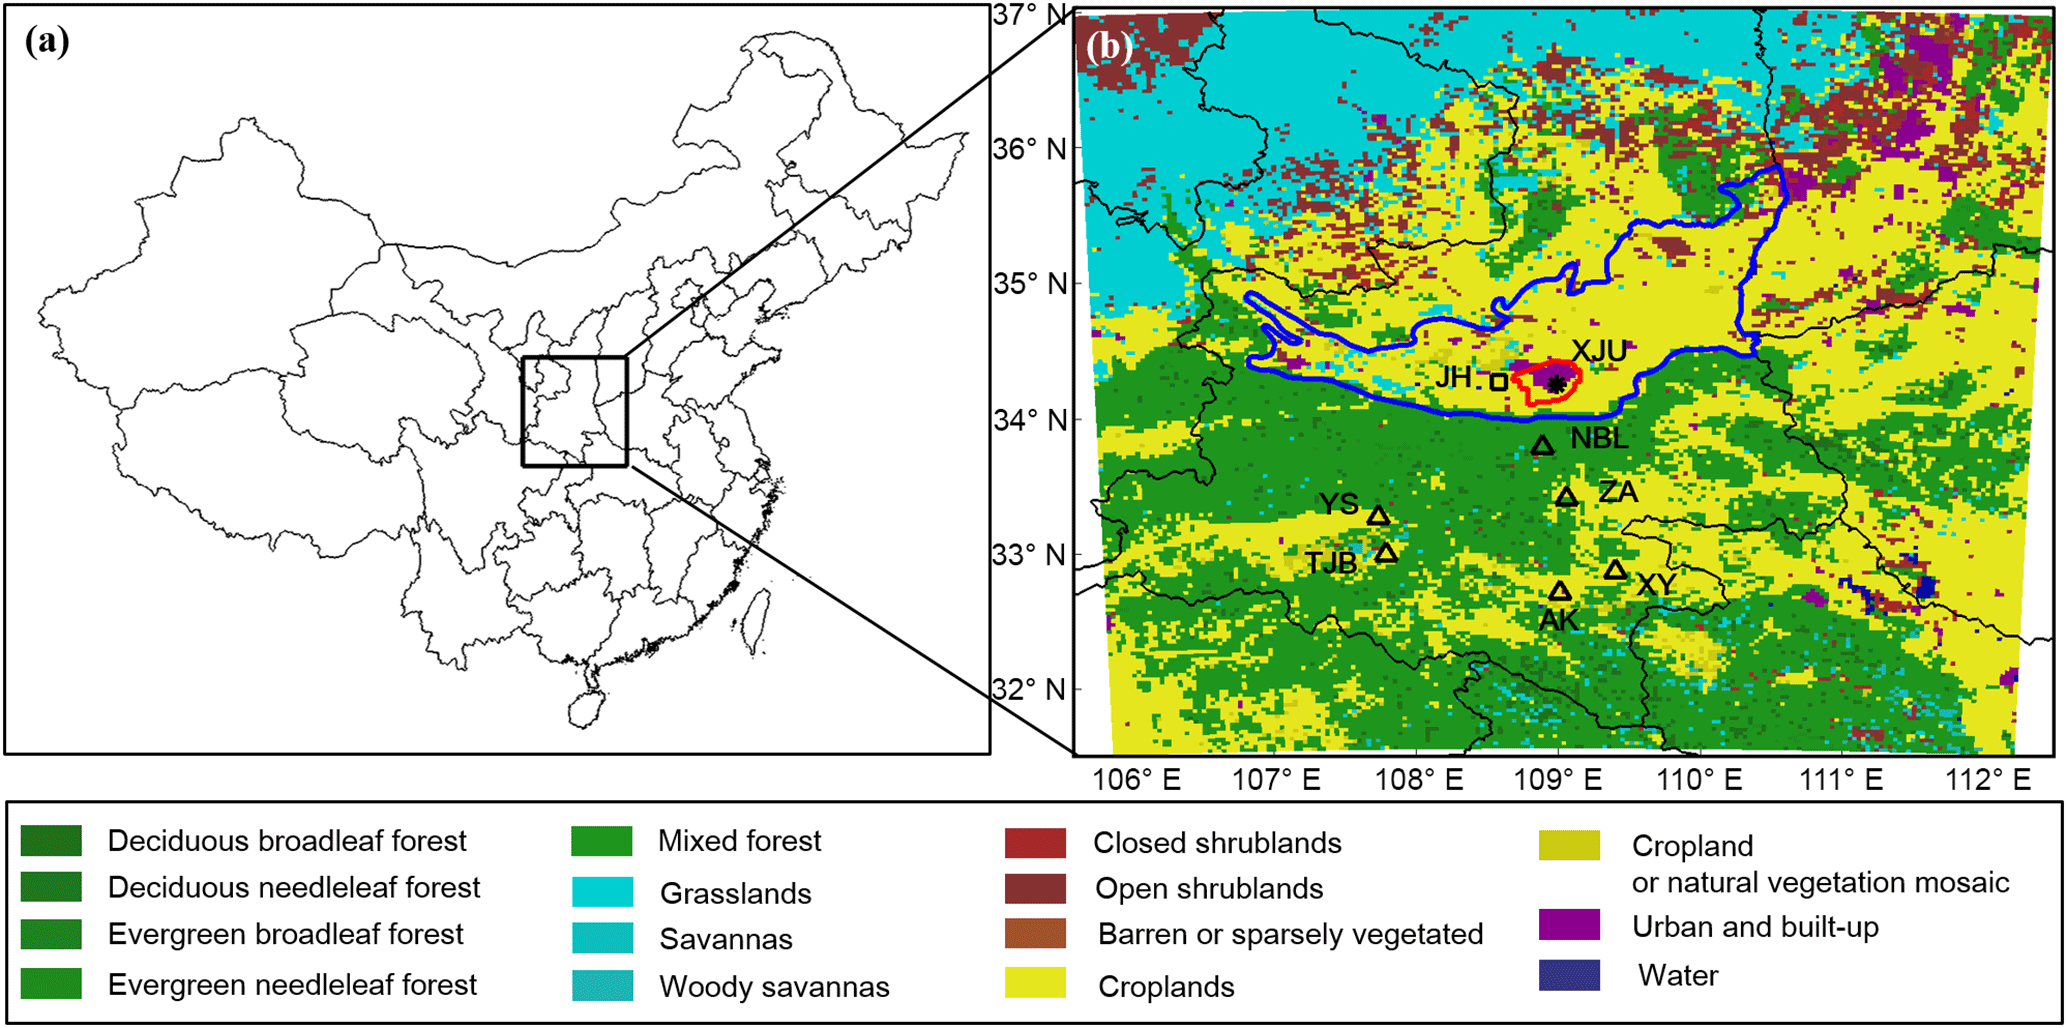
Figure 1The simulation domain and the locations of six biogenic VOCs sites (triangles), one meteorological site (square) and one air quality site (snowflake). Colors indicate land types from MODIS. The area of red line indicates the urban area of Xi'an city. The area of blue line indicates the GZ Basin.
2.1 Sampling sites and descriptions
The study was conducted in Xi'an, one of the oldest cities in the world. Xi'an is the most populous city in the northwest of China, with a population greater than 9 million. It is located in the heartland of the GZ Basin between the Qinling Mountains and the Loess Plateau (Fig. 1). The topographical features result in air pollutants often being trapped in the valley with limited dispersion. The city borders the northern foot of the Qinling Mountains, around a 50 km distance from the city center to the foothills. The Qinling Mountains are an east–west mountain range of 1600 km in length and 300 km in width and are regarded as a natural boundary between northern and southern China. Climate and culture are significantly different from the north to the south. Xi'an city has high temperatures and strong solar intensity in summer, making it an ideal location to assess the importance of biogenic contributions to urban air quality.
Table 1Ambient biogenic VOCs observations in the Qinling Mountains during 6–7 August 2011.
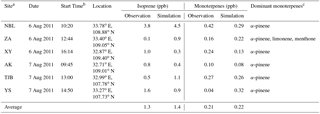
a Site names: NBL (Niubeiliang), ZA (Zhenan), XY
(Xunyang), AK (Ankang), TJB (Tangjiaba), and YS (Youshui).
b The sampling duration is 30 min. c Other
monoterpenes
detected (0.1–9 %) include tricyclene, α-thujene,
camphene, sabinene, myrcene, α-phellandrene, Δ-carene,
o-cymene, β-ocimene, cineole, isopulegol, and isomenthone.
2.1.1 Biogenic VOC measurements in the Qinling Mountains
We selected six field sites in the Qinling Mountains (Fig. 1b, the triangles) and collected one ambient air sample at each site on 6–7 August 2011 under sunny weather conditions (details are presented in Table 1). Sampling was conducted between 9:30 to 16:30 local time (LT; each sampling lasted for 30 min) to target expected daily maximum isoprene concentrations. At each site, ambient air samples were pulled in parallel onto three cartridges filled with Tenax GR and Carbograph 5TD solid adsorbents using a mass flow controlled pump for 30 min. Samples were shipped to the lab at NCAR (Boulder, CO, USA) for chemical analysis. Cartridges were desorbed using an Ultra™ TD auto sampler with a Unity thermal desorption system (MARKES International Series 2, Llantrisant, UK) interfaced with a temperature programmed Agilent 7890A series Gas Chromatograph with a 5975C Electron Impact Mass Spectrometer and a Flame Ionization Detector (GC-MS/FID, Agilent Technologies, Santa Clara, CA, USA). We used nitrogen as a carrier gas at the flow rate of 3 mL min−1. Isoprene and monoterpene identifications were based on the comparison of retention time of authentic standards and mass spectra in the National Institute of Standards and Technologies (NIST) databases. Quantifications were calculated using FID calibrated with a NIST traceable standard.
2.1.2 Air quality monitoring in urban Xi'an
We set up an urban air quality monitoring site (Fig. 1b) at the roof (107 m above ground) of the main building (34.245∘ N, 108.984∘ E) on the campus of Xi'an Jiaotong University to minimize the ground level influences of local emissions. The campus is in the southeastern part of the downtown surrounded by residential areas. We obtained reliable observations of the concentrations of O3, NOx, and PM2.5 during 15–30 August 2011. Gases were measured by Ecotech analyzers (Ecotech Pty Ltd, Australia). O3 were measured by an UV photometric analyzer EC9801. NOx was measured by a gas-phase chemiluminescence detection analyzer EC9841, coupled with a hot molybdenum converter. We collected 24 h PM2.5 filter samples with a mini-volume sampler (Airmetrics, USA) at a flow rate of 5 L min−1 using both 47 mm quartz-fiber (Whatman, Middlesex, UK) and teflon-membrane (Gelman, Ann Arbor, MI) filters. We calculated the PM2.5 mass concentrations gravimetrically by weighing the teflon-membrane filters pre- and post-collection at least 4 times using an electronic microbalance (MC5, Sartorius, Göttingen, Germany) with ±1 µg sensitivity under controlled conditions. EC and OC concentrations were analyzed based on a 0.5 cm2 punch from the quartz-fiber filter following the IMPROVE_A (Interagency Monitoring of Protected Visual Environments) thermal/optical reflectance (TOR) protocol (Chow et al., 2007) using a DRI model 2001 Carbon Analyzer. The concentrations of ions were quantified from a 10.8 cm2 of the teflon-membrane filter by a Dionex DX-600 ion chromatography (Dionex Inc., Sunnyvale, CA, USA) (Zhang et al., 2014).
2.2 The WRF-Chem model
We employed the WRF-Chem model to study biogenic VOC emissions from the Qinling Mountains and their contributions to regional O3 formation in urban Xi'an. WRF-Chem is a 3-D online-coupled meteorology and chemistry model consisting of the components of emission, transport, chemical transformation, photolysis and radiation (Tie et al., 2003; Li et al., 2011), dry and wet deposition (Wesely, 1989), and aerosol interactions (replaced with CMAQ aerosol module, Binkowski and Roselle, 2003; Li et al., 2010). WRF is a non-hydrostatic mesoscale dynamical system with various options for physical parameterizations (Skamarock et al., 2008). The chemical modules were implemented into the WRF framework obeying the same schemes for the simultaneous simulations (Grell et al., 2005).
The simulated domain (Fig. 1) is 600 km × 600 km centered on urban Xi'an with 3 km horizontal grid spacing. We set up 28 vertical layers from the surface up to 50 hPa with 7 layers below 1 km to assure a high near-ground vertical resolution. The National Centers for Environmental Prediction (NCEP) FNL Operational Global Analysis data provided the initial and boundary fields of meteorology. Initial and boundary conditions of chemistry were derived by a global chemical transport model (Model for Ozone and Related chemical Tracers, MOZART) (Emmons et al., 2010). We considered the first 7 days as spin-up period, and the study focused on 6–7 and 15–30 August 2011 because of the available field observation datasets (as described in Sect. 2.1).
We adopted RADM2 (Regional Acid Deposition Model) as the gas phase chemical mechanism to predict O3 formation. RADM2 is an aggregated species type using the reactivity based weighting scheme to adjust for lumping (Stockwell et al., 1990). The mechanism implemented in our WRF-Chem model covers 158 reactions among 36 species, containing the complete reaction paths for isoprene, monoterpenes and the relevant inorganic reactions. As an explicit species, isoprene chemistry is based on an updated CB4 gas-phase mechanism (Carter and Atkinson., 1996). We noted some advances in isoprene chemistry recently. Some studies pointed out that isoprene reacts with OH radical to form hydroperoxy radicals (ISOPO2). Subsequently, in the presence of NOx, ISOPO2 reacts with NO leading to the production of hydroxynitrates (ISOPN) by a minor branch, which sequesters NOx and thus regulates O3 formation. A number of laboratory filed observation and simulation studies (e.g., Paulot et al., 2009a, b, 2012; Horowitz et al., 2007; Hudman et al., 2009; Fisher et al., 2016; Travis et al., 2016) highlighted the importance of isoprene nitrate chemistry and all agreed there were still large uncertainties (for example, the estimates of ISOPN yield (4–15 %)). Horowitz et al. (2007) found a 4 % ISOPN yield, best captured the alkyl and multifunctional nitrates measured by aircraft, and Hudman et al. (2009) pointed out that unreasonably high ISOPN yield (18 %) would let ISOPN be a terminal sink for NOx. In addition, the production of radicals from ISOPO2 is regarded to be important for HOx and further for secondary pollutants (e.g., O3 and secondary organic aerosol (SOA)) (e.g., Squire et al., 2015). Kanaya et al. (2012) quantified the formation of hydroperoxy-aldehydes (HPALDs) from ISOPO2 and subsequent rapid release of HOx. They revised the model by adding detailed reactions of isomerization of ISOPO2 and photolysis of HPALDs, following Peeters and Müller (2010), and found the revision could increase OH and HO2 concentrations by 28–38 % for daytime. However, Kanaya et al. (2012) also pointed out that isomerization of ISOPO2 at the rates proposed by Peeters and Müller (2010) might be overestimated.
Back to our study, these advances in isoprene chemistry were not contained in the standard RADM2 mechanism. To assess the potential uncertainties, we modified the RADM2 mechanism by adding formation pathway of ISOPN from ISOPO2 + NO (the yield of 4 %) following Horowitz et al. (2007) and ISOPO2 isomerization reaction following Li et al. (2018). Details of these updates can be found in Table S1 in the Supplement. We conducted four sensitivity simulations (15–17 August), namely ISO0 (standard RAMD2 mechanism), ISO1 (including the ISOPO2 isomerization reaction), ISO2 (including reactions of isoprene nitrate), and ISO3 (including both revisions in ISO1 and ISO2), to explore the effects on O3 in the GZ Basin. The results show that near surface O3 concentration was decreased by 2.9 ppb (7 %) averaged for urban Xi'an in August after implementing these updates (ISO3-ISO0), and we thought this would not crucially impact conclusions of this study. Details of the sensitivity analysis results can be found in Table S2 and Fig. S1 in the Supplement.
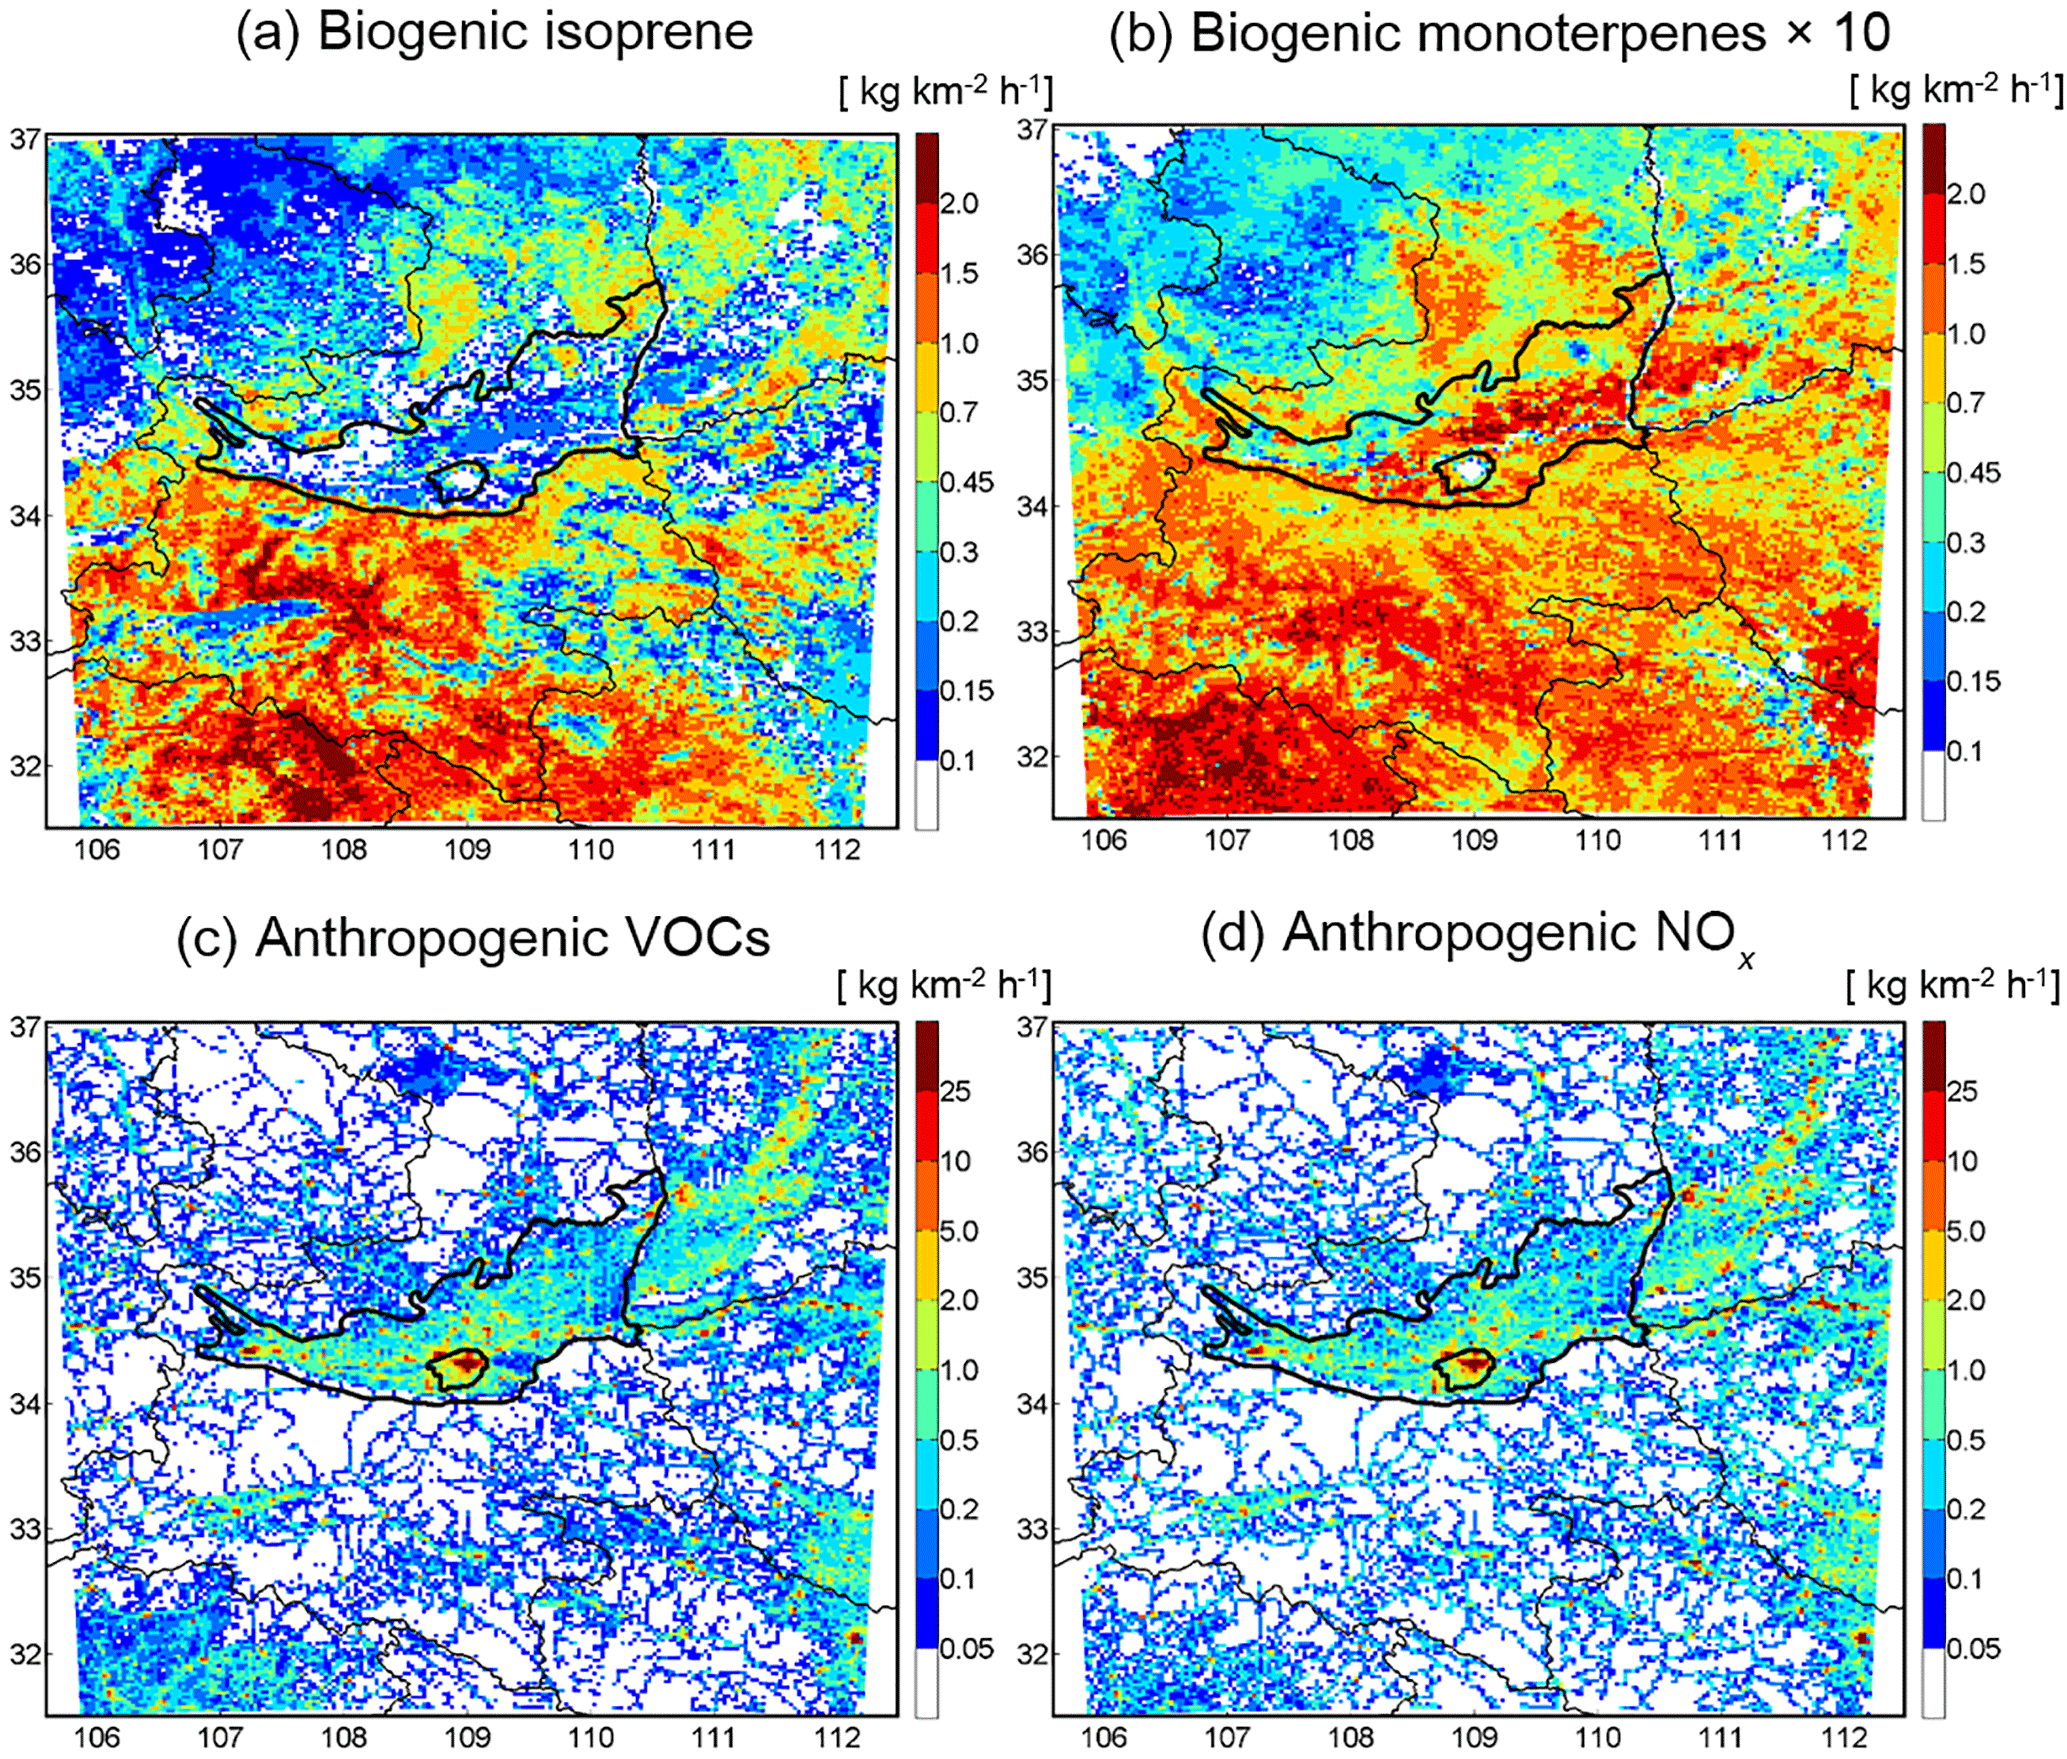
Figure 2Monthly mean emissions of (a) biogenic isoprene, (b) biogenic monoterpenes, (c) anthropogenic VOCs, and (d) anthropogenic NOx in the GZ Basin and surrounding areas in August 2011.
2.3 Biogenic and anthropogenic emissions
Biogenic emissions were quantified by the widely used model MEGAN (Model of Emissions of Gas and Aerosols from Nature) (Guenther et al., 2006). MEGAN coupled into the WRF-Chem model, referred to here as WRF-MEGAN2, provides on-line estimates of the net landscape-averaged biogenic emissions from terrestrial ecosystems into the above-canopy atmosphere. The on-line estimated emissions of isoprene, individual monoterpenes and other biogenic VOCs serve as the inputs for the further chemistry simulation. To drive MEGAN, we need the following inputs: emission factors (EFs), leaf area index (LAI), plant functional types (PFTs), as well as meteorology conditions. The meteorology was obtained from WRF simulations and the LAI and PFT data were extracted from MODIS (Tian et al., 2004). We adopted the canopy-scale emission factors of dominant species from Guenther et al. (2006).
Estimated across the year 2011 by WRF-MEGAN2, the isoprene and monoterpene emissions in the Qinling Mountains were mostly concentrated in summer (71 and 58 %, respectively). During our simulation period, the isoprene emission from the domain is 157 Gg month−1, accounting for ∼ 80 % of total biogenic VOC emissions (Table S3 in the Supplement). The rest are monoterpenes and other biogenic VOCs (e.g., acetone and MBO (2-methyl-3-buten-2-ol)). Figure 2a and b show the spatial distributions of biogenic isoprene and monoterpenes emission fluxes during the simulation period, indicating the high emission zone of isoprene in the Qinling Mountains lying to the south of Xi'an city.
The anthropogenic emissions were obtained from the Multi-resolution Emission Inventory for China (MEIC, Li et al., 2017) for the year of 2010, which was downscaled to a resolution of 3 km using locations of point sources and various spatial proxies (Geng et al., 2017). The upgraded highly resolved emission data were based on a collection of statistics and newly developed emission factors. The emission inventory used in our model includes all major anthropogenic sources, but excluded open biomass burning which occupies a low proportion in the GZ Basin during our simulating period (estimated by Fire Inventory from NCAR, https://www2.acom.ucar.edu/modeling/finn-fire-inventory-ncar, last access: 29 May 2018). The anthropogenic emission sources are composed of power, industry, residential, transportation, and agriculture. The emission estimates and uncertainties of VOCs, SO2, NOx, NH3, and PM2.5 in the domain during the simulation period are summarized in Table S3, and the potential impacts of emission uncertainty on simulation will be discussed in Sect. 3.3. The estimated anthropogenic VOCs emissions are 72.2 Gg, contributing up to ∼ 30 % of total VOC emissions. Figure 2c and d present the spatial distributions of anthropogenic VOC and NOx emissions in the simulation period. The highest emission intensity of anthropogenic VOCs and NOx are in Xi'an city and the GZ Basin due to the frequent vehicle and industrial activities of this area.
2.4 Factor separation technique
O3 is formed by complicated nonlinear reactions of anthropogenic and biogenic precursors (NOx and VOCs) in the presence of sunlight. The approach referred to as the “brute-force” method (sensitivity analysis used to measure the model output response to emission changes) is traditionally used in air quality models to identify source contributions from specific non-reactive species in a linear process, but it cannot straightforwardly apply to secondary species due to the non-linearity in responses. In practice, the actual impact of one factor in a nonlinear process in the presence of others can be separated into (1) pure impact from the factor and (2) interactional impacts from all those factors. In this study, we adopted the factor separation approach (FSA) (Stein and Alpert, 1993) to decompose the pure contribution of a factor from its interaction with other factors.
We considered anthropogenic and biogenic sources as two interactional factors to influence the O3 formation. fanth-bio, fanth, fbio, and f0 are the simulation results including both anthropogenic and biogenic sources, anthropogenic source only, biogenic source only, and neither, respectively. Pure contributions of anthropogenic and biogenic sources are expressed as Eqs. (1) and (1), respectively:
The calculated result including both anthropogenic and biogenic sources should include both pure contributions of the two factors, the synergistic impact, and the impact of background transport (Eq. 3):
Thus, the synergistic effect between anthropogenic and biogenic sources is represented as follows:
Table 2Summary of different simulation settings and definitions of the various contributions from anthropogenic and/or biogenic sources.
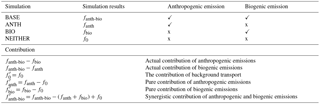
Based on the FSA, we conducted four simulations, namely BASE, ANTH, BIO, and NEITHER, to explore the pure and synergistic impacts of anthropogenic and/or biogenic sources on O3 production in the GZ Basin. Detailed simulation settings and the various contribution definitions are summarized in Table 2.
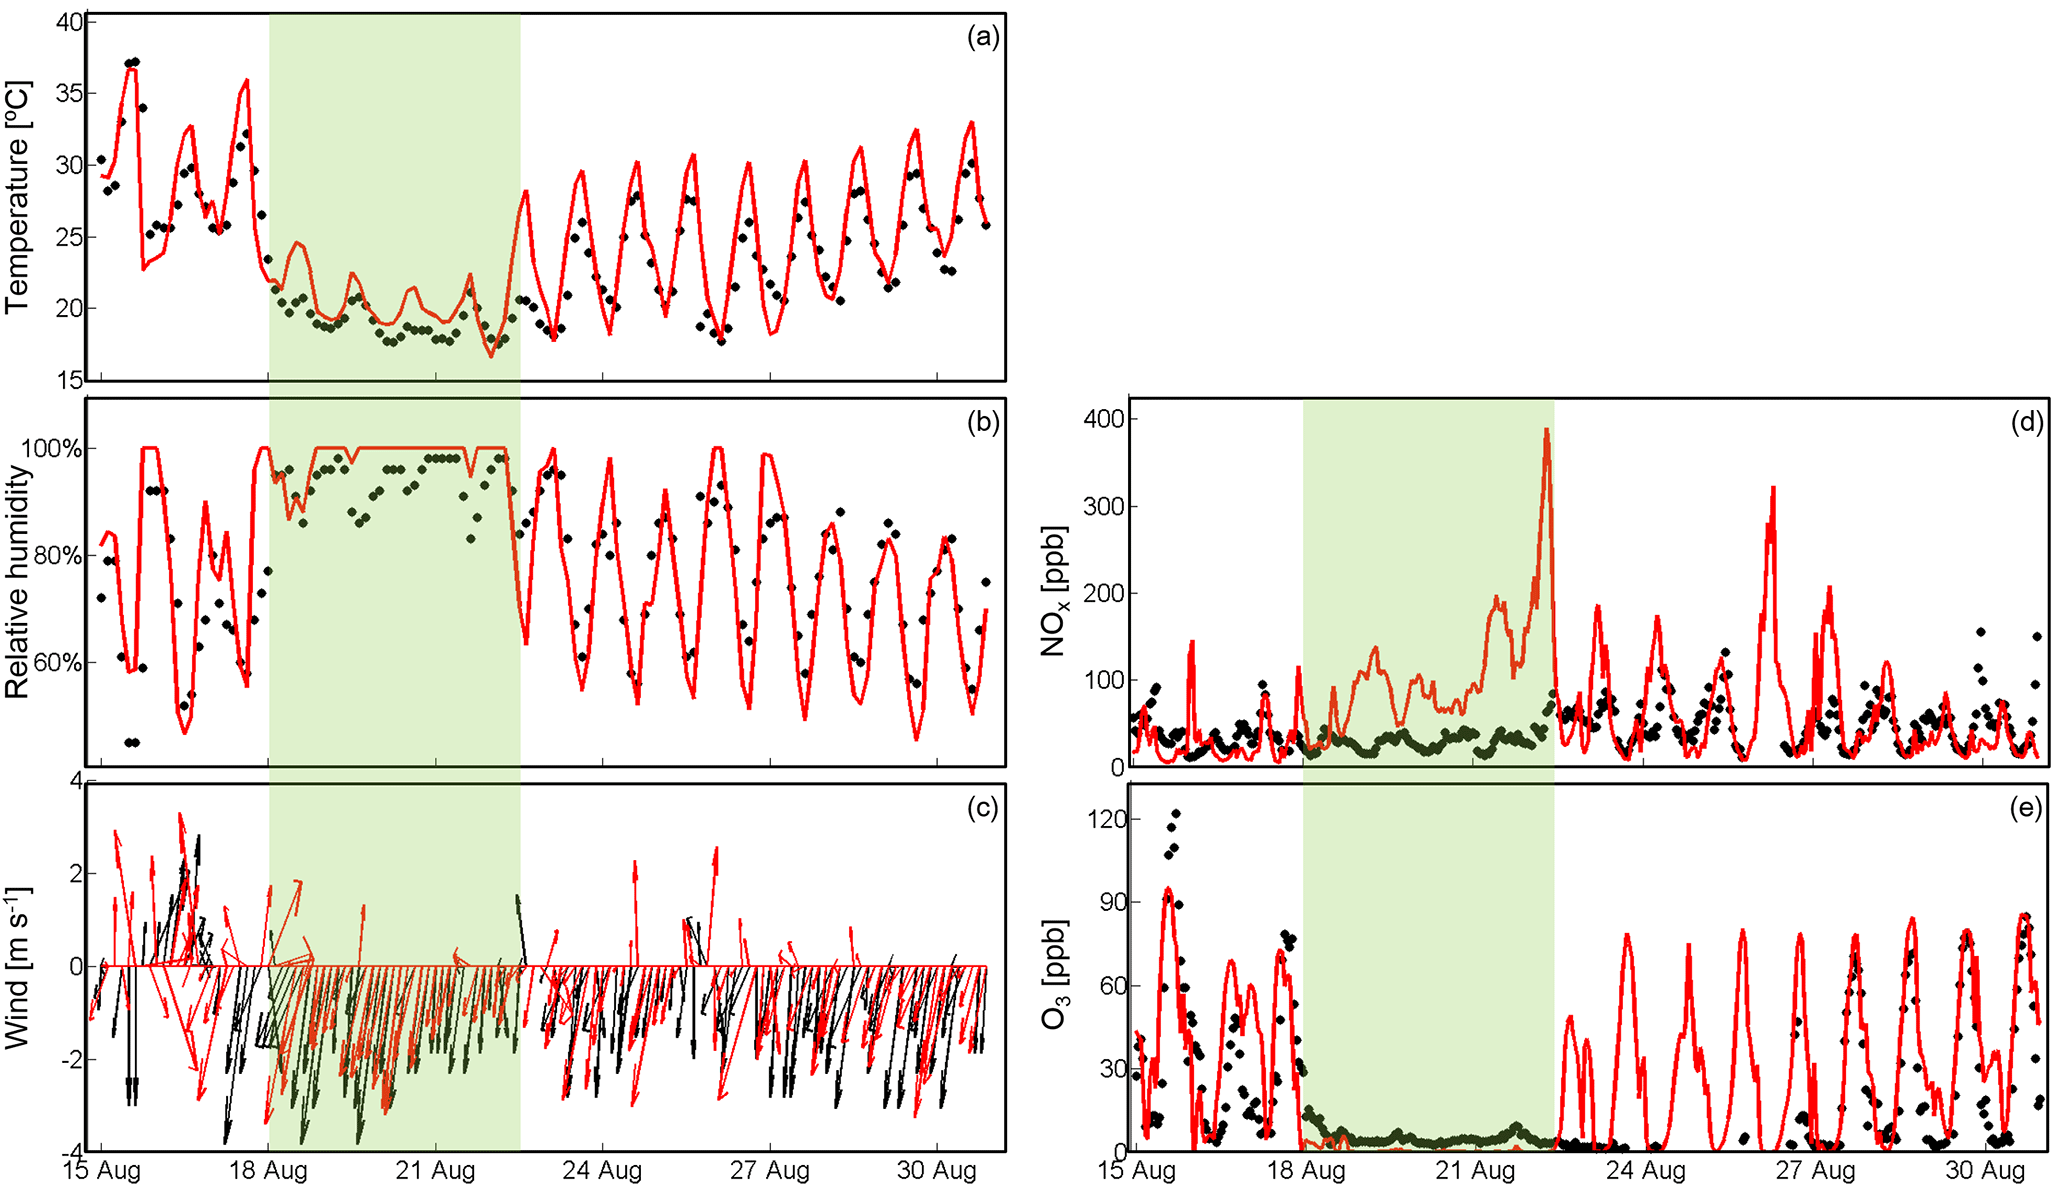
Figure 3Observed (black) and simulated (red) temporal patterns of temperature (a), relative humidity (b), and wind (c) at the Jinghe site and NOx (d) and O3 (e) concentrations at Xi'an Jiaotong University, during the period from 15 to 30 August 2011. The green shadow (18–22 August) indicates rainy days.
3.1 Meteorology
The specific topographical features of Xi'an make the meteorological conditions crucial for the accumulation and dispersion of urban pollutants. To validate our model performance in wind, temperature, and relative humidity, we compared the hourly meteorological data (http://www.meteomanz.com, last access: 29 May 2018) observed at the Jinghe site (34.26∘ N, 108.58∘ E west of Xi'an) with model simulations. Figure 3c illustrates the observed and simulated near-surface wind speed and directions during 15–30 August 2011. The WRF-Chem model successfully captured the prevailing wind direction from north and northeast, consistent with the in situ observations. It should be noted that in our simulation period the prevailing wind blew from south, which enhanced the transport of biogenic emissions from the Qinling Mountains to urban Xi'an. In addition, a continuous rainfall event during 18–22 August (green shadow in Fig. 3) was characterized by lower temperature and near-saturated humidity.
Table 3Statistics of meteorological and air quality variables over the GZ Basin in August 2011a.
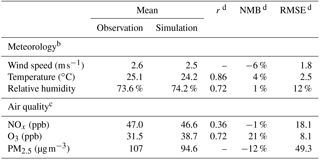
a Averaged for the period from 15 to 30 August 2011, excluding the rainy days. b Meteorological data were obtained from the hourly surface measurements at Jinghe station (34.26∘ N, 108.58∘ E). c Air quality data were measured at the roof (107 m above ground) of the main building (34.25∘ N, 108.98∘ E) on the campus of Xi'an Jiaotong University. d r: correlation coefficient; NMB: normalized mean bias; RMSE: root mean square errors.
We conducted the statistical verification of meteorological variables in Table 3, including the r (correlation coefficient), NMB (normalized mean bias) and RMSE (root mean square errors). Modeled meteorological variables were in good agreement with observations (Fig. 3a–c) with the NMB less than ±6 %.
3.2 Biogenic VOC concentrations in the Qinling Mountains
Samples from the Qinling Mountains show that the dominant VOC species was isoprene, and α-pinene was the main constituent of monoterpenes (Table 1). The ratio of isoprene to monoterpenes varies considerably. In general, different terpene emitters are not homogeneously distributed in a kilometer-scale grid and the point measurements are influenced by the microenvironment and meteorology (Zare et al., 2012; Kota et al., 2015). However, in this study, our goal is to estimate the biogenic effects on urban O3 50 km away from the foothills, which requests more concern on the regional scale VOC level, rather than the microenvironment-scale variability in either the observation or the simulation. Thus, we compared the average of VOC measurements with model simulations to validate whether the calculated results were reasonable. The isoprene mean concentration simulated in the six grids (corresponding to the time of observations) was 1.4 ppb, which is close to the observed average value of 1.3 ppb at the six sampling sites. Monoterpenes performed quite similarly, simulated 0.22 ppb comparing with observed 0.21 ppb. We also analyzed the temporal variation of simulated biogenic VOC during the whole simulation period and found the sub-month variability was relatively small (the SD < 25 %). The evaluation indicates that biogenic VOCs simulations reasonably agreed with the observations in the Qinling Mountains, on average, which provides a basis for us to further evaluate biogenic effects on O3.
3.3 Gaseous and particulate pollutants in urban Xi'an
The sampling campaign was organized in summer. Based on the gaseous and particulate pollutant observations, the daily mean PM2.5 concentration was 90.0 ± 53.5 µg m−3, with 57 % of days exceeding the WHO Interim target-1 (IT-1) 75 µg m−3. The daily mean NOx concentrations were 25.8–63.2 ppb, with 40 % of days exceeding the guideline 48.7 ppb (≈ 100 µg m−3, GB 3095–2012). The maximum 8 h O3 concentration was 3.5–95.6 ppb, with most of the values around the national first grade standard of 46.6 ppb (≈ 100 µg m−3, GB 3095-2012). Summer in Xi'an is monitored as the least polluted season of the year, and the case we picked is regarded as a typical situation in summer Xi'an.
Figure 3 compares the simulated hourly O3 and NOx concentrations with in situ observations. During the rainy episode (the green shadow in Fig. 3), our model overestimated NOx concentration and underestimated O3 concentration. The deviation can be explained by the failure to simulate the precipitation in the WRF model resulting in underestimates in wet deposition. So, we focused our analysis on the period excluding the rainy period. During the non-raining days, our model well reproduced the diurnal variations and magnitudes of O3 and NOx concentrations. The calculated O3 averaged for non-raining periods was 38.7 ppb, ∼ 20 % higher than the observed value of 31.5 ppb. Our simulated O3 also reproduced the temporal variation of the observed O3 (r=0.72). For NOx, the simulated hourly NOx averaged for the non-raining period was 46.6 ppb, close to the observed 47.0 ppb (NMB = −1 %), which suggests no systematic bias in NOx emissions. It is worth noting that the observed NOx were detected by a chemiluminescence analyzer coupled with a hot molybdenum converter (MoO), and this method was recognized to cause higher NO2 concentration, due to the positive interference of other nitrogen-containing components (NOz, e.g., PAN, HNO3 and HONO). Xu et al. (2013) found that the uncertainty caused by the MoO converter was much smaller at urban sites (less than 10 %) than that at suburban and background sites (more than 30 %). In the GZ Basin, to evaluate the uncertainty, we estimated the ratio of from the model. The calculated results indicated that the NOz accounted for 11 % of the total NOx + NOz in urban Xi'an during the non-raining period. We noted the uncertainty in our NOx measurements, but considered this would not crucially impact the model-measurement comparison.
Unfortunately, the anthropogenic VOC was not included in our samples as the observations were primarily targeted at biogenic VOC in the Qinling forest. Alternatively, three sensitivity simulations were conducted (for 15–17 August), namely VOC0 (using standard MEIC emission estimates), VOC1 (with an increase of anthropogenic VOC emission by 50 %) and VOC2 (with a decrease of anthropogenic VOC emission by 33 %) to explore the sensitivity of simulated VOC and O3 concentrations to anthropogenic VOC emissions. We found that 50 % increases of anthropogenic VOC emission could lead to a 22 % increase of urban VOC concentration, while the 33 % emission decrease resulted in a 24 % decrease of concentration (Table S4 in the Supplement). It is worth noting that the concentration of O3 stayed almost the same (because the O3 production regime is NOx-limit). We addressed that the uncertainties of VOC emission obviously affected the VOC concentrations; however, MEIC inventory is the most updated available emission for China so far, and quantifying its uncertainties can be done in future studies (possibly with satellite-based measurement of HCHO, Miller et al., 2008).
We analyzed PM2.5 concentration and composition (sulfate, nitrate, ammonium, EC, organic matter) with the filter-base measurements. The model predicted PM2.5 concentration to be 94.6 ± 28.2 µg m−3, slightly lower (NMB = −12 %) than measured 107 µg m−3 averaged for the non-raining period, but did not perform well in capturing temporal correlation (r=0.17). The simulated PM2.5 showed the similar compositions to the observation (Fig. S2b and c). Sulfate is the dominant constituent of both simulated (32 %) and observed (37 %) PM2.5. High sulfate concentration was mainly attributed to the high SO2 emission in the GZ Basin as well as the humid weather conditions (Wang et al., 2014). The secondary constituent of observed PM2.5 is organic matter, which accounted for 16 % of the total observed PM2.5, close to the simulated result (14 %). Secondary organic matter contributed half to total simulated organic matter, mainly due to the abundant precursor (i.e., VOCs) emissions and the high atmospheric oxidation capacity in summer.
In this section, we analyze the results from the four simulations (BASE, ANTH, BIO and NEITHER; see Table 2) to characterize the fate of O3 and its precursors in the GZ Basin and to quantify the pure and synergistic impacts of anthropogenic and/or biogenic sources on summertime O3 formation.
4.1 Base simulation of O3
Firstly, we discuss the spatial and temporal characteristics of the simulated O3 and the precursors (VOCs and NOx) in the GZ Basin in the BASE simulation.
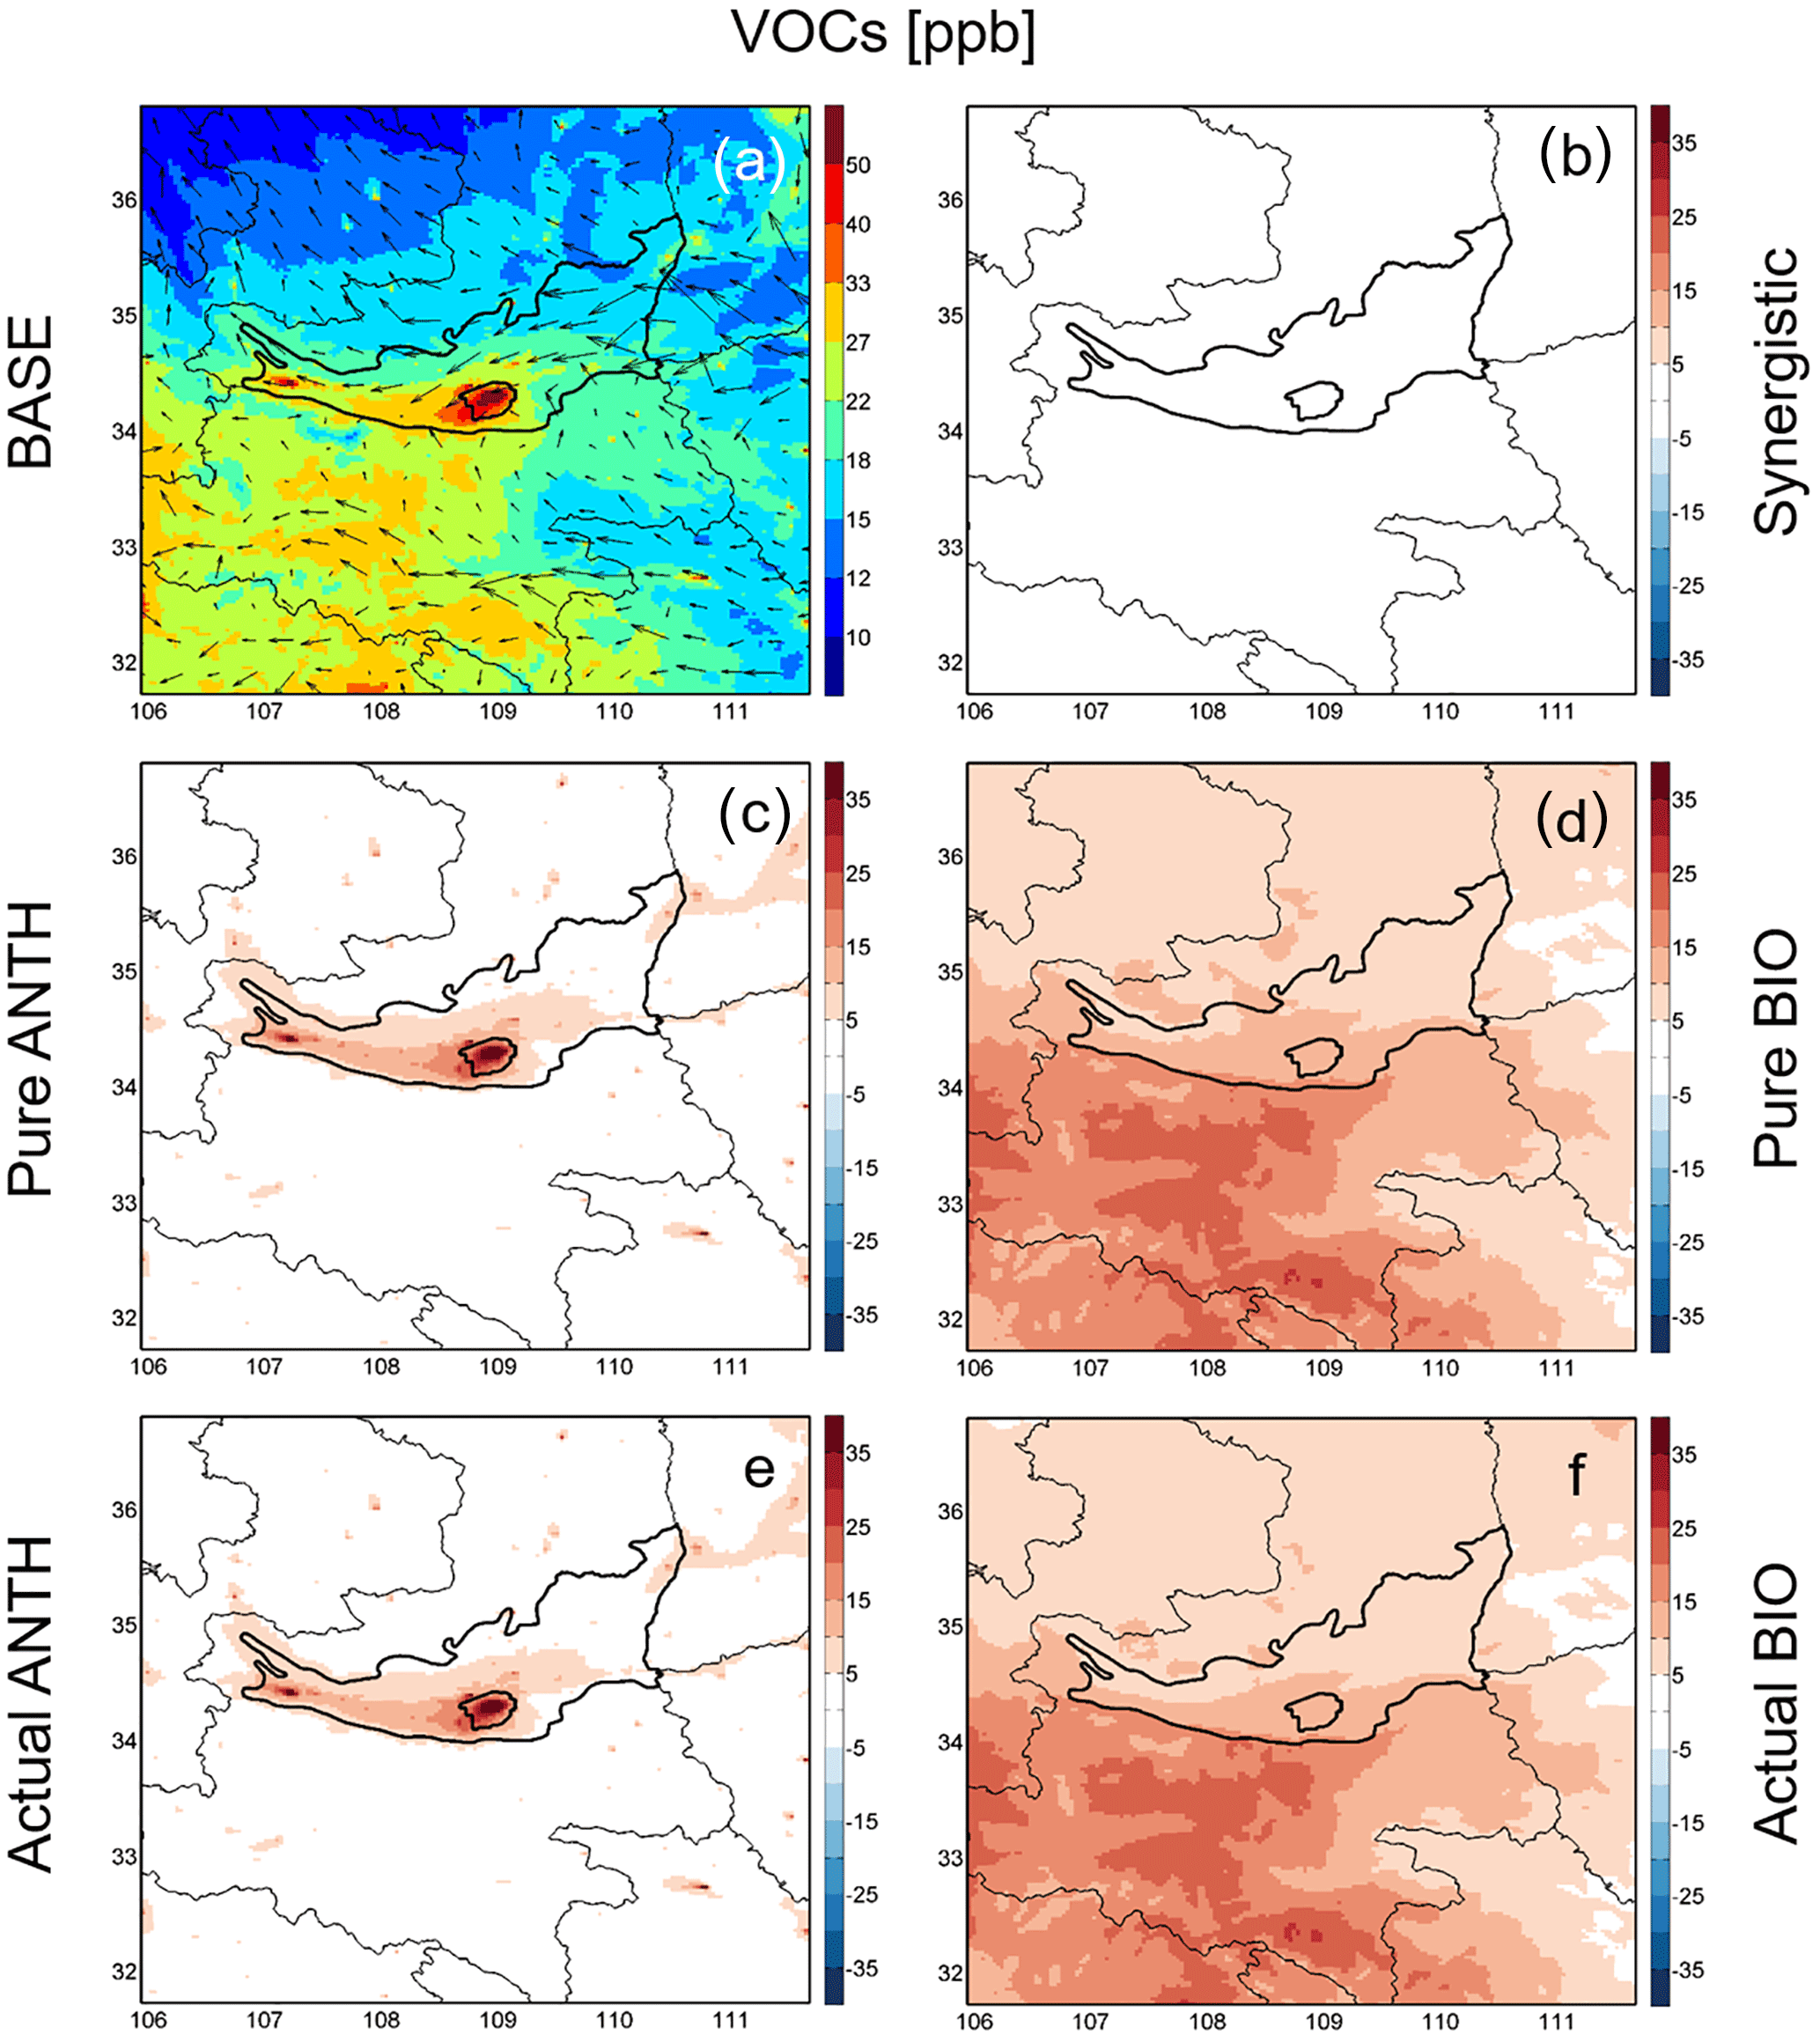
Figure 4Spatial distributions of monthly mean concentrations of VOCs in August 2011. Panel (a) is the result from the BASE simulation, overlaid with simulated wind vectors. Panels (b–f) are simulated VOCs concentrations contributed from synergistic anthropogenic and biogenic, pure anthropogenic, pure biogenic, actual anthropogenic, and actual biogenic sources, respectively.
Figure 4a shows spatial distribution of the simulated VOCs during the non-raining period, overlaid with the simulated wind vectors. The highest concentration (more than 50 ppb, with ethane being the dominant species) was in urban Xi'an and its downwind region (the southwest of urban Xi'an), due to anthropogenic activities. In addition, another high-value area (∼ 30 ppb, with isoprene being the dominant species) was found in the Qinling Mountains, which was probably due to biogenic sources. To better understand the composition of VOCs, we analyzed some typical individual VOC species. Figure S3a in the Supplement shows the spatial distribution of xylenes, representing anthropogenic VOCs, and Fig. S4a and S5a in the Supplement show isoprene and monoterpenes, representing biogenic VOCs. The anthropogenic xylenes were mainly distributed in the GZ Basin, while the high biogenic isoprene and monoterpene concentrations were found over the Qinling Mountains. These results explain the spatial feature of total VOCs and the dominant sources. Detailed discussion of source apportionment is given in Sect. 4.2
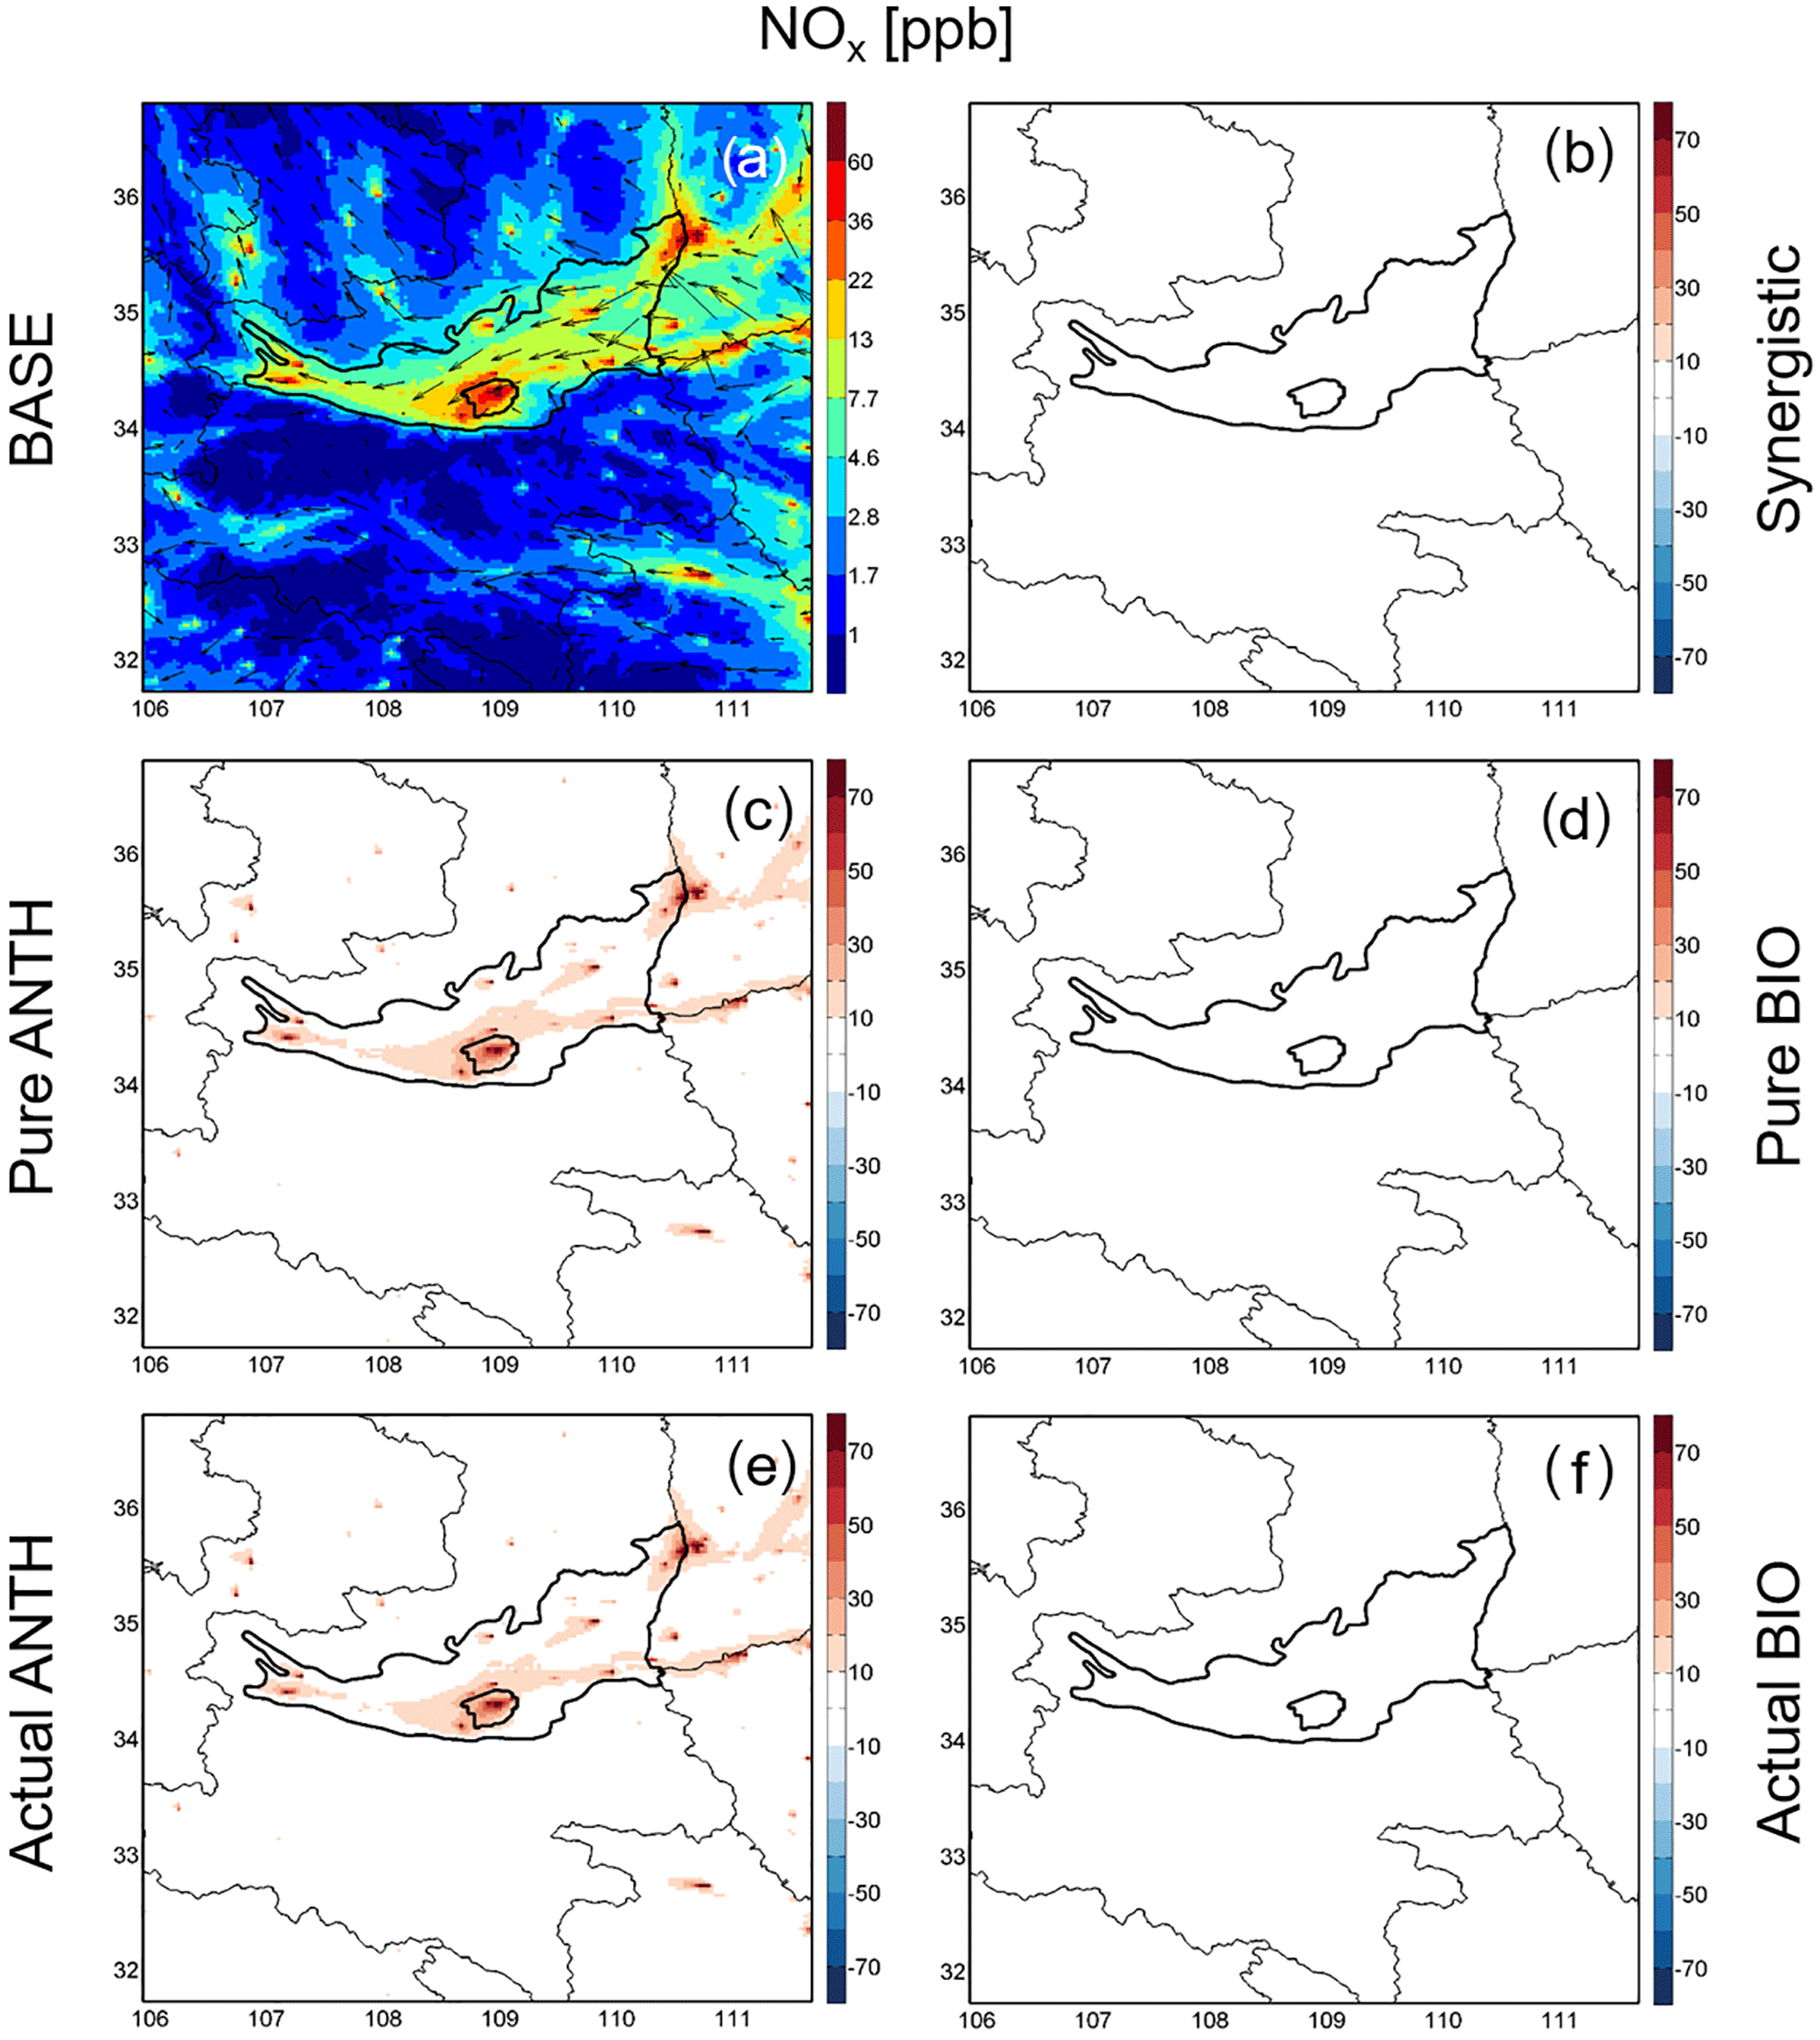
Figure 5Spatial distributions of monthly mean concentrations of NOx in August 2011. Panel (a) is the result from the BASE simulation, overlaid with simulated wind vectors. Panels (b–f) are simulated NOx concentrations contributed from synergistic anthropogenic and biogenic, pure anthropogenic, pure biogenic, actual anthropogenic and actual biogenic sources, respectively.
The spatial distribution of NOx was slightly different (Fig. 5a). The highest concentrations of NOx were in the GZ Basin (average of 11.1 ppb), especially in urban Xi'an (averaged of 30.1 ppb), while among the Qinling Mountains, NOx was low and dominated by biogenic sources.
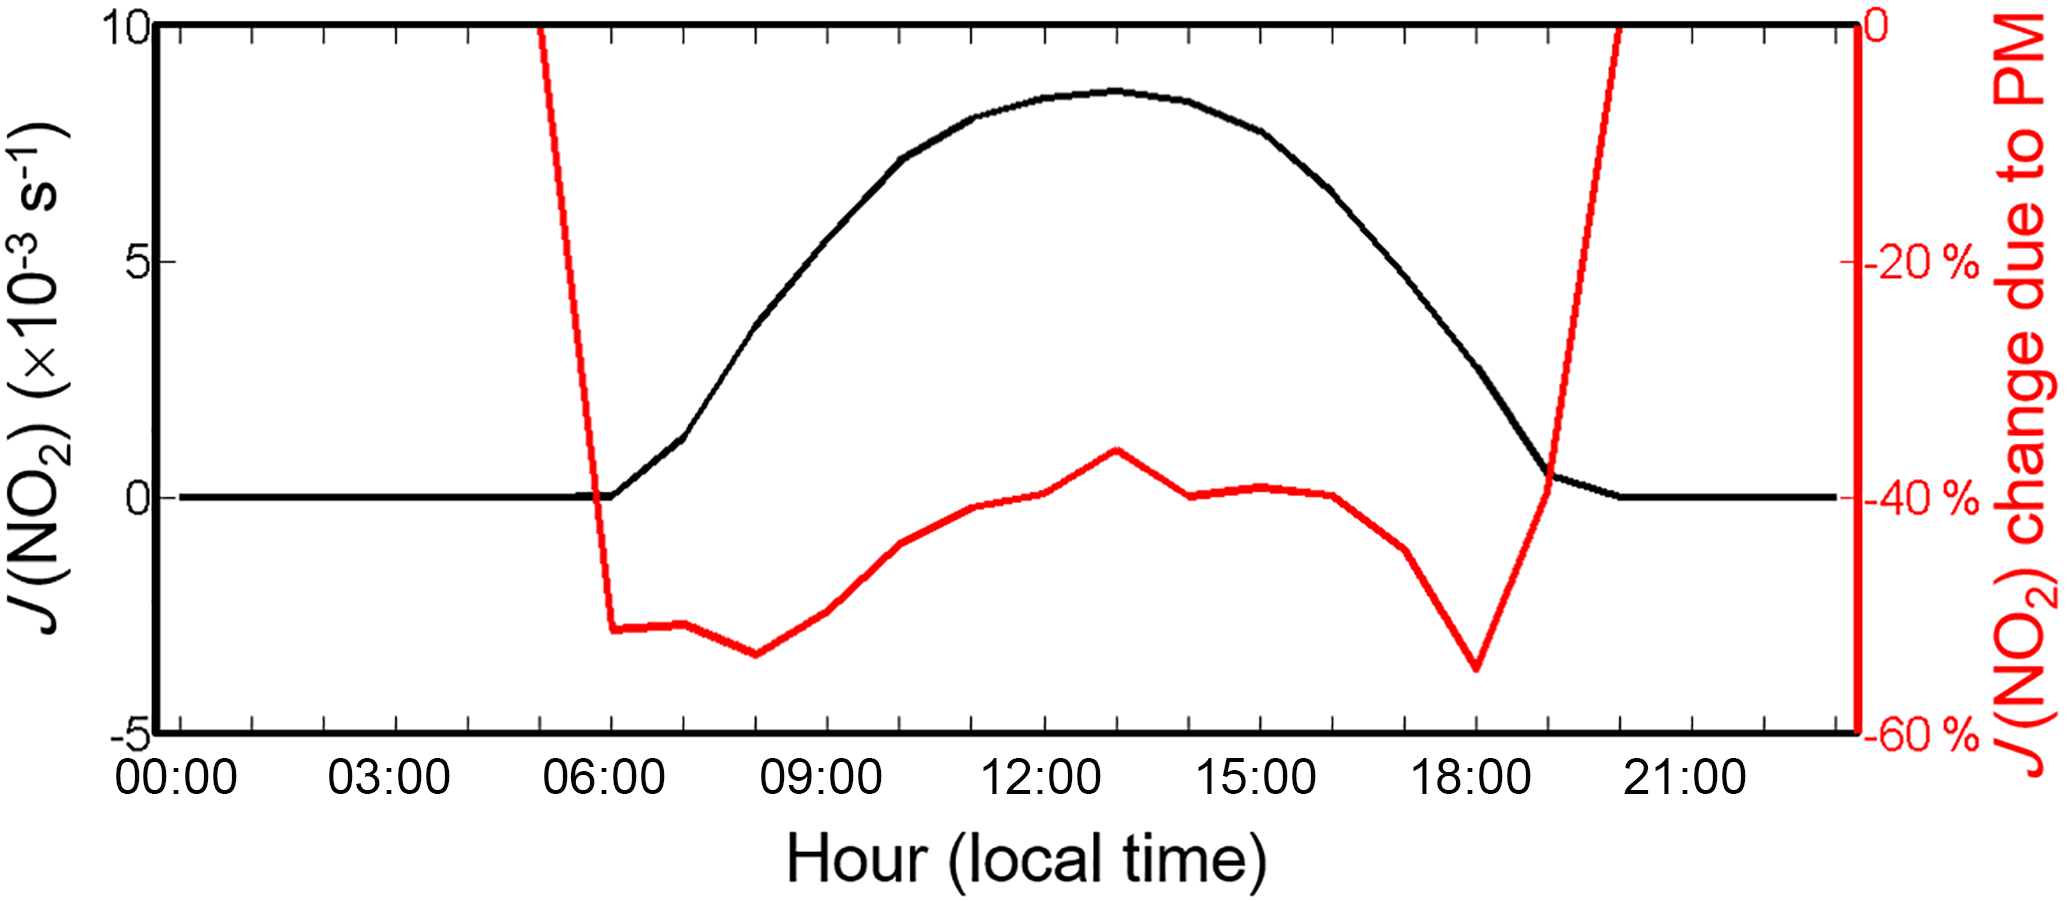
Figure 6Diurnal variations of J (NO2) (black) and the changes in J (NO2) (red) averaged in urban Xi'an due to PM effects in August 2011.
PM, even though not directly involved in the formation pathways of O3, influences the chemical equilibrium indirectly. In the daytime, NO2 photolysis frequency (J (NO2)) is determined by the solar radiation influenced by PM via scattering and absorption. Figure 6 shows the changes of J (NO2) (calculated by model track output photor_no2) with the participation of PM (concentration, 102 µg m−3; aerosol optical depth (AOD) at 550 nm, 1.92; single scattering albedo (SSA) at 550 nm, 0.92) averaged for urban Xi'an. J (NO2) was reduced by 40–60 %, most significantly in morning and evening rush hours. In the night time, PM2.5 can remove N2O5 from the NOx cycle via heterogeneous reactions, as one of the major NOx sinks in the atmosphere (Xue et al., 2014). Figure S6a in the Supplement shows the spatial feature of PM2.5. The densest area was urban Xi'an (averaged for 102 µg m−3) followed by the western part of the GZ Basin. The spatial distribution of high-values of PM2.5 was similar to that of NOx, but covered a wider area mostly in the downwind region of urban Xi'an, which is expected due to longer lifetime of aerosols compared with NOx and the time required for secondary aerosol formation, thus further dispersion.
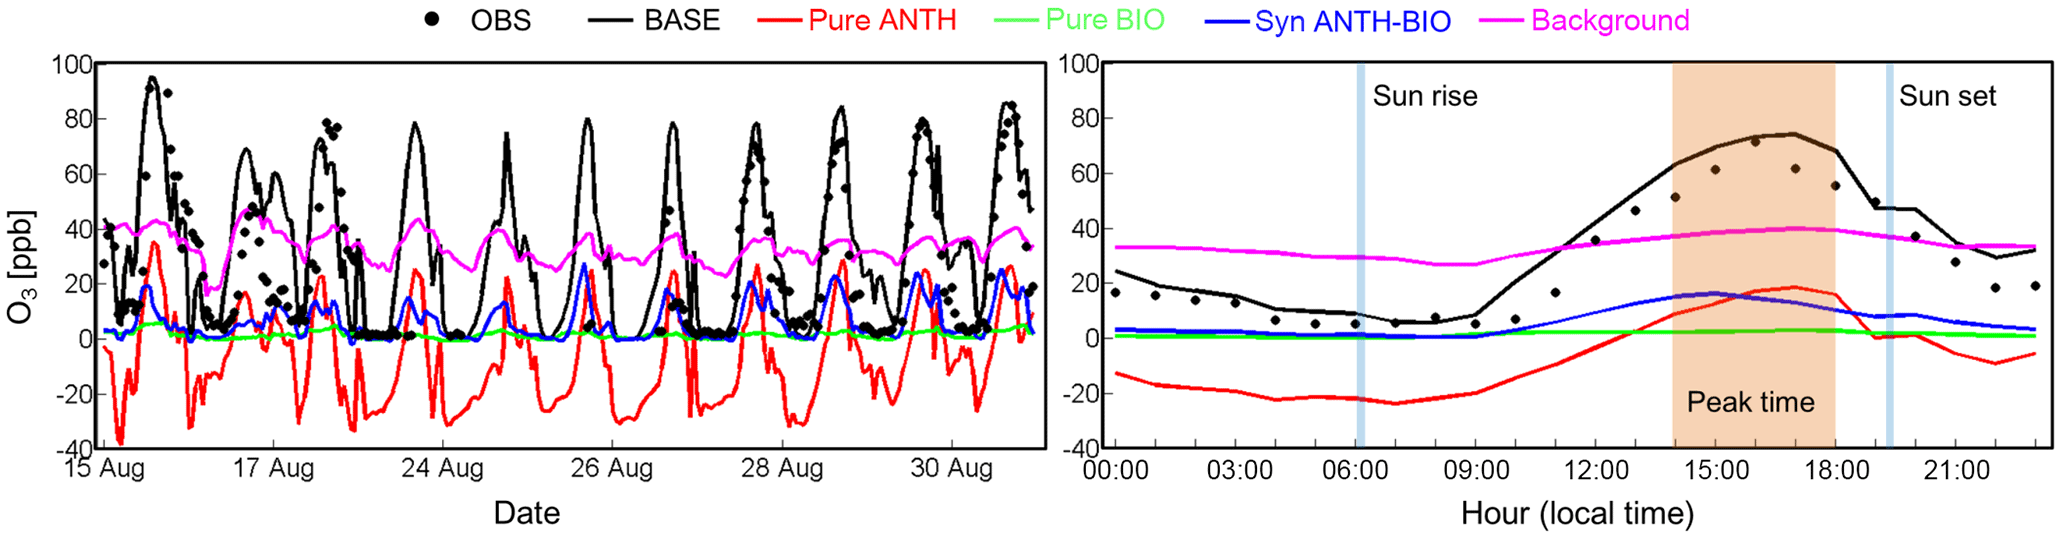
Figure 7Temporal patterns of the simulated O3 concentrations and the tested contributing components during the period from 15 to 30 August 2011, excluding the rainy days (18–22 August). The orange shadow (14:00–18:00 LT) indicates daily O3 peak time.
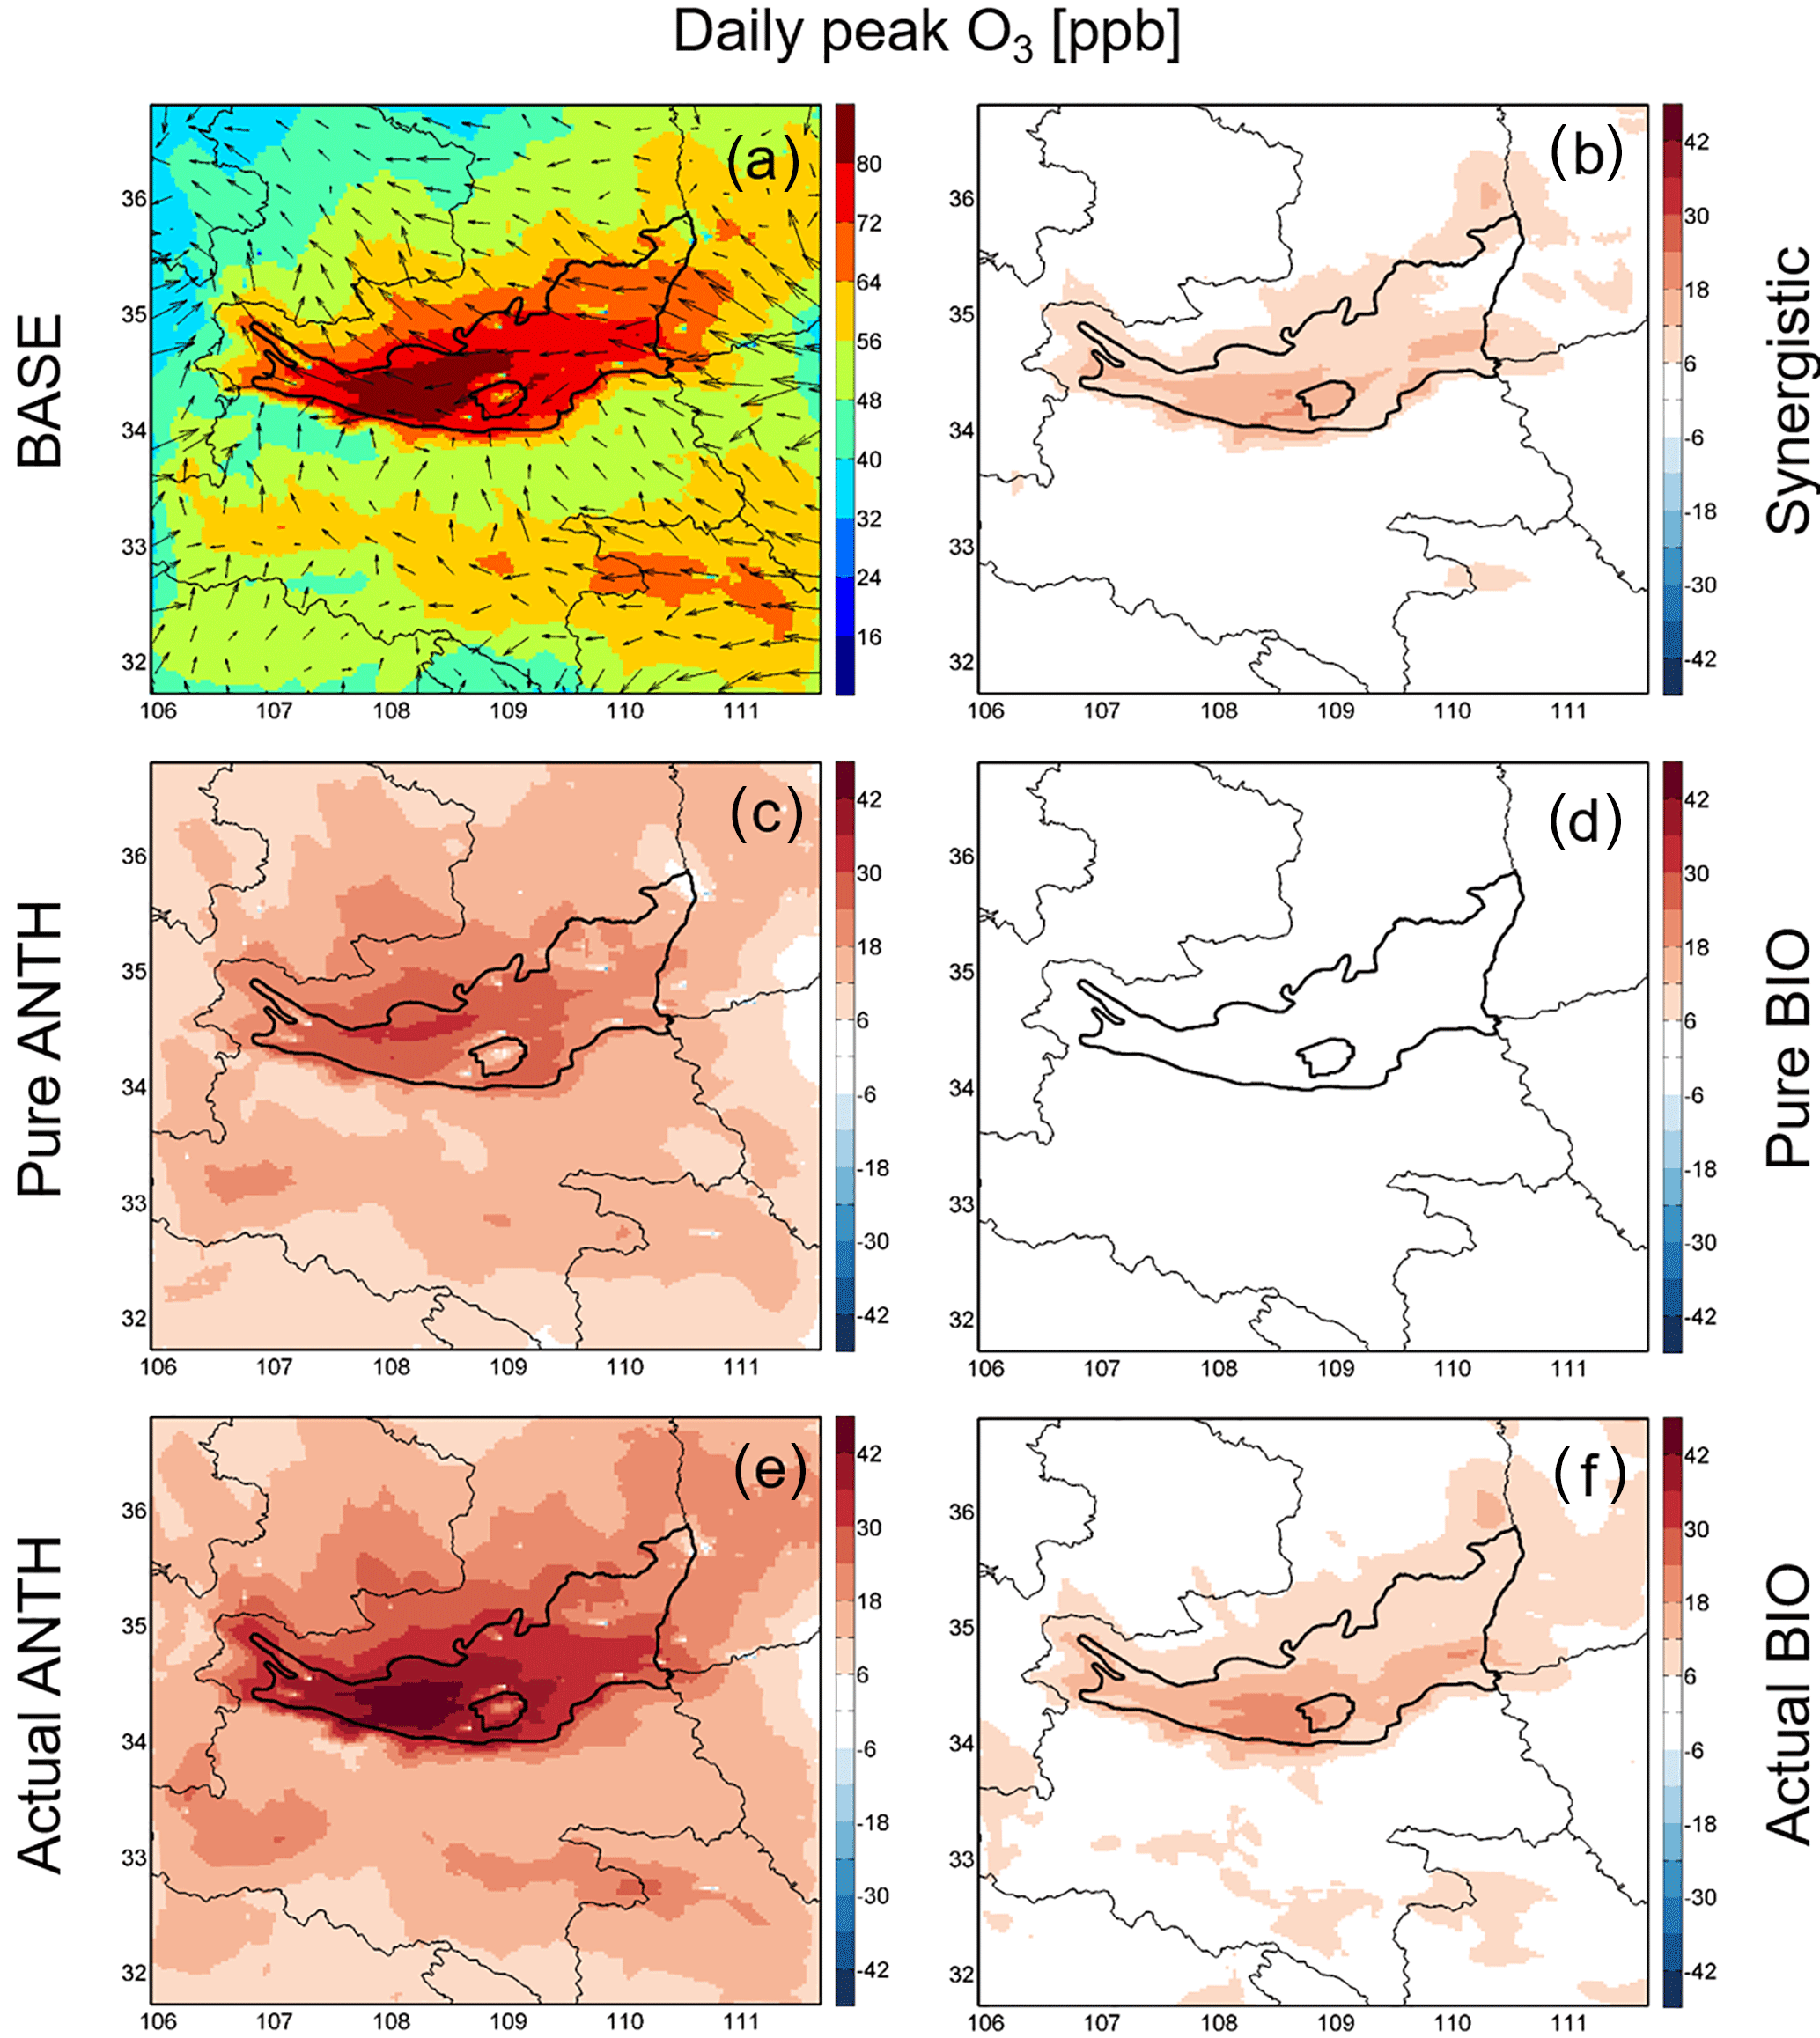
Figure 8Spatial distributions of monthly mean concentrations of daily peak O3 in August 2011. Panel (a) is the result from the BASE simulation, overlaid with simulated wind vectors. Panels (b–f) are simulated daily peak O3 concentrations contributed from synergistic anthropogenic and biogenic, pure anthropogenic, pure biogenic, actual anthropogenic, and actual biogenic sources, respectively.
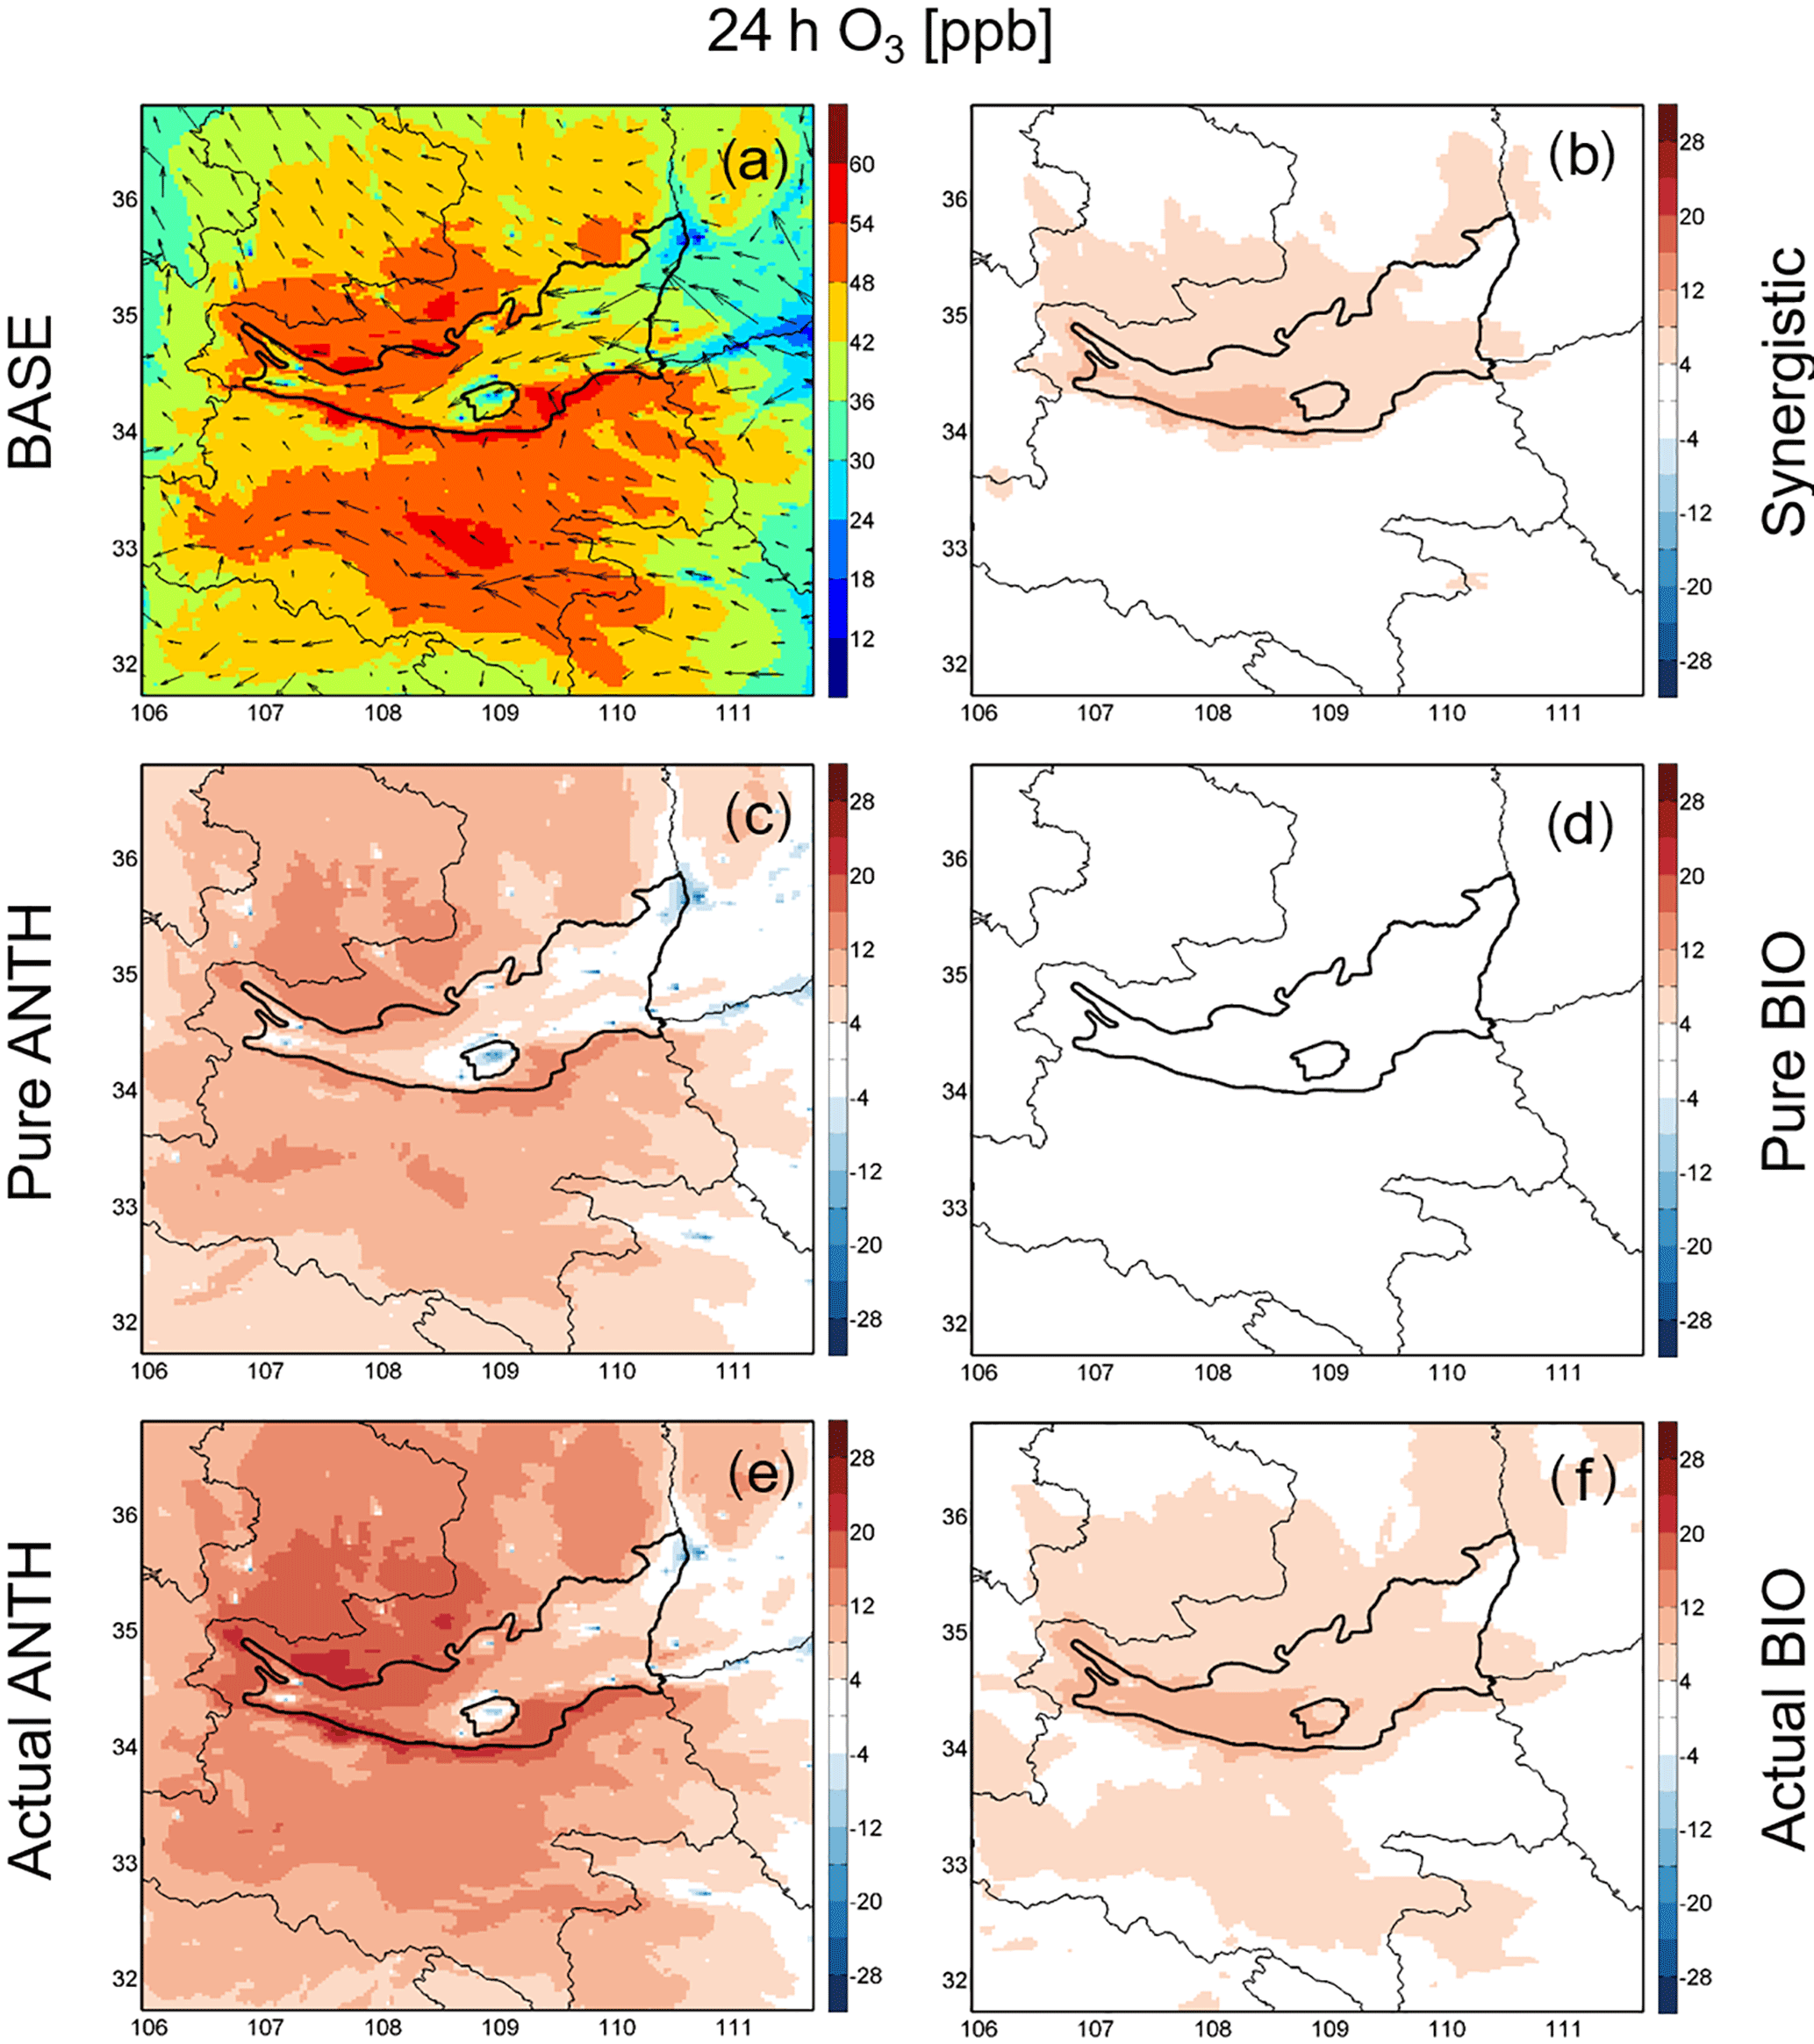
Figure 9Spatial distributions of monthly mean concentrations of 24 h averaged O3 in August 2011. Panel (a) is the result from the BASE simulation, overlaid with simulated wind vectors. Panels (b–f) are simulated 24 h averaged O3 concentrations contributed from synergistic anthropogenic and biogenic, pure anthropogenic, pure biogenic, actual anthropogenic, and actual biogenic sources, respectively.
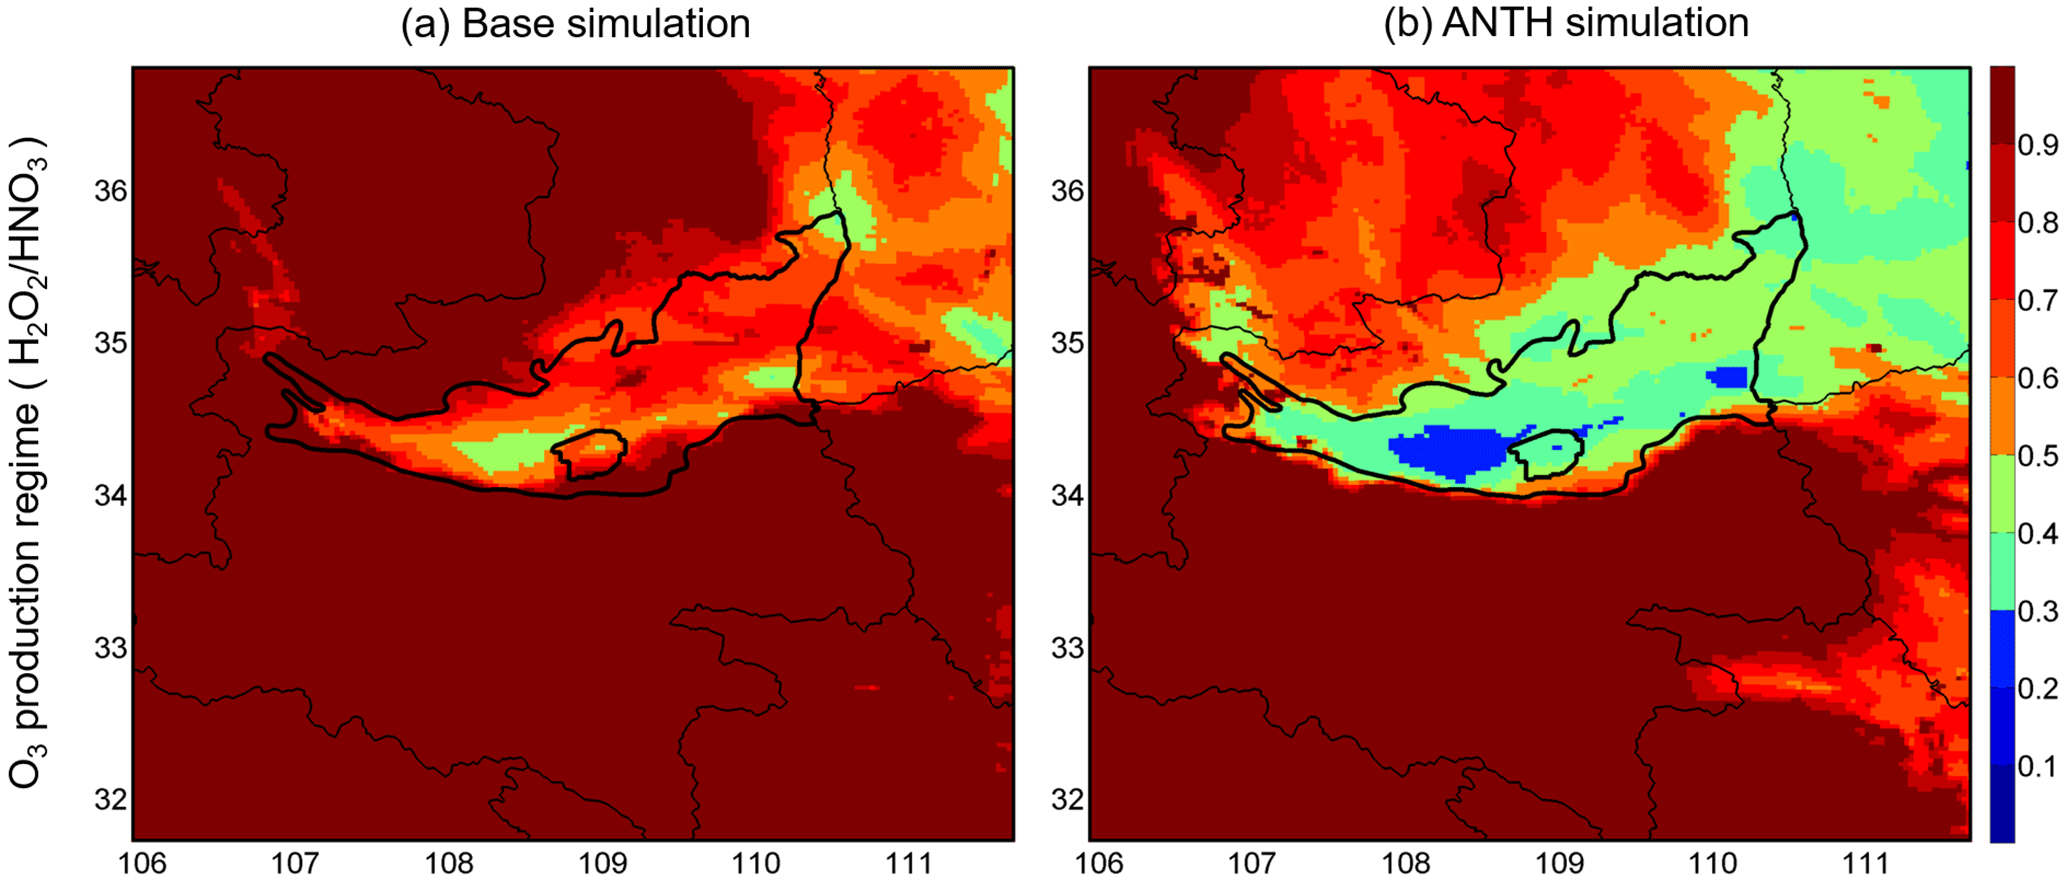
Figure 10The monthly mean ratio of H2O2∕HNO3 during the daily O3 peak time (14:00–18:00 LT) in August 2011 in the (a) base simulation and (b) the simulation without biogenic sources.
The typical diurnal variation of O3 (Fig. 7b) demonstrates there are higher concentrations in the afternoon and lower at night. For better understanding of O3 concentration characteristics and source or sink mechanisms, we discussed two different time scales: (1) O3 peak time (14:00–18:00 LT) (Fig. 8) and (2) O3 24 h average (Fig. 9). During the peak time, simulated near-surface O3 was high in the GZ Basin, with averaged concentration of 75 ppb. In the downwind region of high NOx and VOCs in the west of urban Xi'an, the concentration reached up to 110 ppb. We employed the ratio of H2O2∕HNO3 to investigate the chemistry regime of O3 formation (Sillman, 1995; Wang et al., 2017). If the ratio is greater than 0.5, the O3 production regime is considered NOx-controlled, otherwise VOC-controlled if the ratio less than 0.3. The range between 0.3 and 0.5 is defined as the transition regime from NOx- to VOC-controlled, indicating the competition of both NOx and VOCs in O3 production. Figure 10a shows the spatial distribution of the simulated H2O2∕HNO3 ratio during the O3 peak time. The west and southeast of the GZ Basin were right in the transition regime with a complicated O3 production mechanism sensitive to both NOx and VOCs. Most of the rest of the simulation region was VOC-controlled, excluding the Yuncheng and Hejing cities in the neighboring Shanxi provinces.
On the 24 h average scale, the spatial distribution of O3 presented a different picture (Fig. 9). The original high-value area during the peak time in the GZ city cluster shifted to low-value region due to the consumption of O3 by abundant NOx emissions. At night time, the titration effect of freshly emitted NO dominates, and the O3 concentration tends to drop to a lower level. The high value of 24 h averaged O3 converged in the south and northwest outside of the GZ Basin. Those areas have elevated O3 due to high daytime production, similar to the nearby zone of peak O3, but also have lower emissions of NO resulting in lower loss of O3.
Table 4The various contribution components of the simulated O3 (and the precursors) and PM2.5 in August 2011.
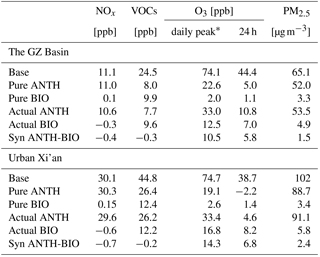
∗ Daily O3 peak time is from 14:00–18:00 LT.
4.2 Pure impact of biogenic or anthropogenic sources
Using the FSA method, we evaluated the pure contribution of anthropogenic or biogenic sources to the summertime O3 formation in the GZ Basin. In the scenario of pure contribution of anthropogenic emissions, the VOC concentrations were mostly distributed over the GZ city cluster (8.0 ppb), especially in urban Xi'an (26.4 ppb) (Fig. 4c). In the scenario of pure contribution of biogenic emissions, the VOCs were widely dispersed over the Qinling Mountains (Fig. 4d), with a calculated 9.9 ppb for the GZ Basin and 12.4 ppb for urban Xi'an. NOx concentration has the similar pattern as VOCs in the scenario of pure contribution of anthropogenic emissions, with averaged concentrations of 11.0 ppb for the GZ Basin and 30.3 ppb for urban Xi'an (Fig. 5c). However, in the GZ Basin and urban Xi'an, biogenic sources contributed less than 0.2 ppb to NOx concentration (Fig. 5d). In the scenario of pure contribution of anthropogenic emissions, PM2.5 spread over a wider area (Fig. S6c), due to the time required for secondary aerosol formation. In the scenario of pure contribution of biogenic emissions, PM2.5 was mostly distributed among the Qinling Mountains (Fig. S6d), but the concentration was lower by one order of magnitude (Table 4, Fig. S7 in the Supplement).
In the scenario of pure contribution of anthropogenic emissions, daily peak O3 accumulated in the downwind region in the central and western GZ due to high VOCs and NOx concentrations. Daily peak O3 concentrations reached 22.6 ppb for GZ and 19.1 ppb for urban Xi'an (Fig. 8c). Lower daily peak O3 concentration was found outside of GZ Basin, where less anthropogenic VOCs and NOx were emitted. In contrast, daily peak O3 was negligible (less than 3 ppb) in the scenario of pure contribution of biogenic emissions (Fig. 8d) due to the low NOx emissions. However, the distribution of 24 h averaged O3 was different from daily peak O3. 24 h averaged O3 concentration in the scenario of pure contribution of anthropogenic emissions was more diluted in the GZ city cluster than for surrounding areas (Fig. 9c). Due to the abundant NO emission and its titration effect on O3, the pure effect of anthropogenic sources was negative, calculated to be −2.2 ppb in urban Xi'an.
4.3 Synergistic impact of the interaction between biogenic and anthropogenic sources
The synergistic impact on O3 formation includes the interactions between anthropogenic and biogenic sources. In other words, it reflects the potential production trend of either “O3-promoted” or “O3-suppressed” under the natural coexistence of all emission sources. In the cases of NOx, VOCs and PM2.5, the synergistic impacts contributed less than ±3 % of total concentrations (Figs. 4b, 5b, and S5b and S6 in the Supplement, as well as Table 4). However, the synergistic impact on O3 played a remarkable role showing positive impacts for both daily peak (Fig. 8b) and 24 h averaged O3 (Fig. 9b). It means that the mixed state of anthropogenic and biogenic sources potentially enhanced the O3 production more than each single source. To make it more specific, we started the discussion from the result of ANTH simulation without the biogenic sources (Table 2). Figure 10b shows the O3 production regime in the ANTH simulation. VOC-controlled O3 production regime covered the west of urban Xi'an and the southeast of the GZ Basin. In the rest of the GZ Basin and the neighboring Shanxi provinces, the O3 production was in the transition regime, controlled by both NOx and VOC. NOx-controlled O3 production regime dominated the rest of the region. After we included biogenic VOC emissions in the simulation, the O3 concentration was significantly enhanced in the VOC-controlled regions, and partly enhanced in the mix-controlled region. However, in the VOC-controlled region, the synergistic impact contributed little.
The synergistic impact is of great importance, approximately the same magnitude as the impact from pure contributions of anthropogenic sources. The synergistic impact contributed daily peak O3 concentrations of 10.5 ppb for the GZ Basin and 14.3 ppb for urban Xi'an, while the pure anthropogenic impact contributed 22.6 ppb for GZ Basin and 19.1 ppb for urban Xi'an. However, the extent was ∼ 50 % smaller on the 24 h averaged scale, but still increased O3 concentration by 5.8 ppb for the GZ Basin and 6.8 ppb for urban Xi'an. Figure 7 shows the diurnal variation of the observed and simulated O3 concentration at Xi'an Jiaotong University, as well as the tested contributing components. Transport dominated O3, constantly contributing 30–40 ppb as background. The impact of pure anthropogenic sources was positive on O3 production during 13:00–19:00 LT but negative during the rest of the time, and the impact of pure biogenic sources was negligible. Synergistic impact of both anthropogenic and biogenic sources resulted in a positive contribution during 10:00–21:00 LT, comparable to the impact of pure anthropogenic sources.
It is worth noting that the biogenic contribution to PM2.5 is not obvious (less than 3 %) in GZ Basin, which might be different from some other regions (e.g., Fu et al., 2012; Li et al., 2013). The main reasons are that (1) organic matter, the most important biogenic PM2.5 component, only accounted for 14–16 % of PM2.5 in GZ Basin in August, (2) undeniably, uncertainties still exist in organic matter simulations in the model.
The GZ Basin is a representative region in the northwest of China, suffering serious air pollution in recent years. Geographically, the GZ Basin borders the northern foot of the Qinling Mountains. For this reason, in addition to the anthropogenic emissions from metropolitan areas, biogenic emissions are of great importance in the region, especially in warm season with active photochemistry. In this study, we used the WRF-Chem model to simulate O3 in the GZ Basin and compared the results to near-surface measurements, with the aim of quantifying the pure and synergistic impacts of anthropogenic and/or biogenic sources on summertime O3 formation. The simulation was driven by the best currently available inventory of anthropogenic emissions and online calculated biogenic emissions. Near-surface measurements were captured from six surface sites among the Qinling Mountains for biogenic VOCs and one 100 m-high site in Xi'an city for air quality (NOx, VOCs, O3 and PM2.5).
Our model successfully reproduced the observed air quality and meteorological parameters. The biogenic VOCs simulation showed a reasonable agreement. Our model also well-reproduced the magnitudes and variations of O3, NOx, and PM2.5 concentrations excluding rainy days, with normalized mean bias less than ±21 %.
We further conducted three scenario simulations to explore the pure and synergistic impacts of anthropogenic and/or biogenic sources on O3 and the precursors, by using the factor separation approach (FSA). The results concluded that, for the precursors, pure impact of anthropogenic source contributed 99 % of NOx, 80 % of PM2.5, and 33 % of VOCs in the GZ Basin, and pure impact of biogenic source contributed 40 % of VOCs but only 1–5 % of PM2.5 and NOx. Meanwhile, synergistic impacts from the combination of anthropogenic and biogenic sources did not bring significant changes on NOx, VOCs and PM2.5 (less than ±4 %). In the case of daily peak O3, the pure impact of anthropogenic source remained the dominant contributor (19.1 ppb for urban Xi'an), even after anthropogenic particles reduced the NO2 photolysis by up to 60 %. The abundant biogenic VOCs from the nearby forests promoted the O3 formation by interaction with anthropogenic NOx, contributing 14.4 ppb to O3 in urban Xi'an. This synergistic impact presented a positive contribution to O3 production throughout the day and the positive effect was much more prominent during 12:00–19:00 LT.
O3 pollution in China has been raising increasing concern in recent years. Some scientists hold the view that excessive concentration of PM2.5 suppressed the formation of O3 in the past, hiding the problem temporally. However, with the effective control of PM2.5, O3 pollution is manifested. The phenomenon can also be demonstrated by the government control action during G20 summit (The Group of Twenty Finance Ministers and Central Bank Governors) in Hangzhou in 2016. The concentration of PM2.5 was depressed sharply under the strict emission control, but O3 concentration was even higher than usual. Better understanding of O3 pollution sources and sinks and formation mechanisms in high PM2.5 exposed area in China will benefit and guide the implementation of PM2.5/O3 cooperative control. Our results suggest that, in big cities geographically close to forest, O3 pollution can be enhanced by the synergistic impact from the combination of biogenic and anthropogenic sources. The synergistic contribution of each single source to O3 formation cannot be neglected when making pollution control strategies.
Observational datasets and modeling results are available upon request to the corresponding author (linan@nuist.edu.cn).
The supplement related to this article is available online at: https://doi.org/10.5194/acp-18-7489-2018-supplement.
The authors declare that they have no conflict of interest.
This work was supported by the National Natural Science Foundation of China (41705128), Opening Project of State Key
Laboratory of Loess and Quaternary Geology (SKLLQG1709), and Opening Project of Shanghai Key Laboratory of Atmospheric
Particle Pollution and Prevention (LAP3) (FDLAP17003).
Edited by: Yugo Kanaya
Reviewed by: two anonymous referees
Binkowski, F. S. and Roselle, S. J.: Models-3 community multiscale air quality (CMAQ) model aerosol component – 1. Model description, J. Geophys. Res., 108, 4183, https://doi.org/10.1029/2001jd001409, 2003.
Brauer, M., Freedman, G., Frostad, J., van Donkelaar, A., Martin, R. V., Dentener, F., van Dingenen, R., Estep, K., Amini, H., Apte, J. S., Balakrishnan, K., Barregard, L., Broday, D., Feigin, V., Ghosh, S., Hopke, P. K., Knibbs, L. D., Kokubo, Y., Liu, Y., Ma, S., Morawska, L., Texcalac Sangrador, J. L., Shaddick, G., Anderson, H. R., Vos, T., Forouzanfar, M. H., Burnett, R. T., and Cohen, A.: Ambient air pollution exposure estimation for the global burden of disease 2013, Environ. Sci. Technol., 50, 79–88, https://doi.org/10.1021/acs.est.5b03709, 2016.
Carlo, P. D., Brune, W. H., Martinez, M., Harder, H., Lesher, R., Ren, X., Thornberry, T., Carroll, M. A., Young, V., and Shepson, P. B.: Missing OH reactivity in a forest: evidence for unknown reactive biogenic VOCs, Science, 304, 722–725, https://doi.org/10.1126/science.1094392, 2004.
Carter, W. P. L. and Atkinson, R.: Development and evaluation of a detailed mechanism for the atmospheric reactions of isoprene and NOx, Int. J. Chem. Kinet., 28, 497–530, 1996.
Chow, J. C., Watson, J. G., Chen, L. W. A., Chang, M. C. O., Robinson, N. F., Trimble, D., and Kohl, S.: The IMPROVE – a temperature protocol for thermal/optical carbon analysis: maintaining consistency with a long-term database, J. Air. Waste. Manage., 57, 1014–1023, https://doi.org/10.3155/1047-3289.57.9.1014, 2007.
Curci, G., Beekmann, M., Vautard, R., Smiatek, G., Steinbrecher, R., Theloke, J., and Friedrich, R.: Modelling study of the impact of isoprene and terpene biogenic emissions on European ozone levels, Atmos. Environ., 43, 1444–1455, https://doi.org/10.1016/j.atmosenv.2008.02.070, 2009.
Ehhalt, D. H. and Rohrer, F.: Dependence of the OH concentration on solar UV, J. Geophys. Res., 105, 3565–3571, 2000.
Emmons, L. K., Walters, S., Hess, P. G., Lamarque, J.-F., Pfister, G. G., Fillmore, D., Granier, C., Guenther, A., Kinnison, D., Laepple, T., Orlando, J., Tie, X., Tyndall, G., Wiedinmyer, C., Baughcum, S. L., and Kloster, S.: Description and evaluation of the Model for Ozone and Related chemical Tracers, version 4 (MOZART-4), Geosci. Model Dev., 3, 43–67, https://doi.org/10.5194/gmd-3-43-2010, 2010.
Feng, T., Bei, N., Huang, R.-J., Cao, J., Zhang, Q., Zhou, W., Tie, X., Liu, S., Zhang, T., Su, X., Lei, W., Molina, L. T., and Li, G.: Summertime ozone formation in Xi'an and surrounding areas, China, Atmos. Chem. Phys., 16, 4323–4342, https://doi.org/10.5194/acp-16-4323-2016, 2016.
Feng, Z., Hu, E., Wang, X., Jiang, L., and Liu, X.: Ground-level O3 pollution and its impacts on food crops in China: a review, Environ. Pollut., 199, 42–48, https://doi.org/10.1016/j.envpol.2015.01.016, 2015.
Fiore, A. M., Horowitz, L. W., Purves, D. W., Levy, H., Evans, M. J., Wang, Y. X., Li, Q. B., and Yantosca, R. M.: Evaluating the contribution of changes in isoprene emissions to surface ozone trends over the eastern United States, J. Geophys. Res., 110, D12303, https://doi.org/10.1029/2004jd005485, 2005.
Fiore, A. M., Levy II, H., and Jaffe, D. A.: North American isoprene influence on intercontinental ozone pollution, Atmos. Chem. Phys., 11, 1697–1710, https://doi.org/10.5194/acp-11-1697-2011, 2011.
Fu, T.-M., Cao, J. J., Zhang, X. Y., Lee, S. C., Zhang, Q., Han, Y. M., Qu, W. J., Han, Z., Zhang, R., Wang, Y. X., Chen, D., and Henze, D. K.: Carbonaceous aerosols in China: top-down constraints on primary sources and estimation of secondary contribution, Atmos. Chem. Phys., 12, 2725–2746, https://doi.org/10.5194/acp-12-2725-2012, 2012.
Fu, T.-M., Zheng, Y., Paulot, F., Mao, J., and Yantosca, R. M.: Positive but variable sensitivity of August surface ozone to large-scale warming in the southeast United States, Nat. Clim. Change, 5, 454–458, https://doi.org/10.1038/nclimate2567, 2015.
Fu, Y. and Liao, H.: Simulation of the interannual variations of biogenic emissions of volatile organic compounds in China: impacts on tropospheric ozone and secondary organic aerosol, Atmos. Environ., 59, 170–185, https://doi.org/10.1016/j.atmosenv.2012.05.053, 2012.
Fu, Y. and Liao, H.: Impacts of land use and land cover changes on biogenic emissions of volatile organic compounds in China from the late 1980s to the mid-2000s: implications for tropospheric ozone and secondary organic aerosol, Tellus B, 66, 24987, https://doi.org/10.3402/tellusb.v66.24987, 2014.
Geng, F., Tie, X., Guenther, A., Li, G., Cao, J., and Harley, P.: Effect of isoprene emissions from major forests on ozone formation in the city of Shanghai, China, Atmos. Chem. Phys., 11, 10449–10459, https://doi.org/10.5194/acp-11-10449-2011, 2011.
Geng, G., Zhang, Q., Martin, R. V., Lin, J., Huo, H., Zheng, B., Wang, S., and He, K.: Impact of spatial proxies on the representation of bottom-up emission inventories: A satellite-based analysis, Atmos. Chem. Phys., 17, 4131–4145, https://doi.org/10.5194/acp-17-4131-2017, 2017.
Giordano, M. R., Kalnajs, L. E., Avery, A., Goetz, J. D., Davis, S. M., and DeCarlo, P. F.: A missing source of aerosols in Antarctica – beyond long-range transport, phytoplankton, and photochemistry, Atmos. Chem. Phys., 17, 1–20, https://doi.org/10.5194/acp-17-1-2017, 2017.
Grell, G. A., Peckham, S. E., Schmitz, R., McKeen, S. A., Frost, G., Skamarock, W. C., and Eder, B.: Fully coupled “online” chemistry within the WRF model, Atmos. Environ., 39, 6957–6975, https://doi.org/10.1016/j.atmosenv.2005.04.027, 2005.
Guenther, A., Hewitt, C. N., Erickson, D., Fall, R., Geron, C., Graedel, T., Harley, P., Klinger, L., Lerdau, M., McKay, W. A., Pierce, T., Scholes, B., Steinbrecher, R., Tallamraju, R., Taylor, J., and Zimmerman, P.: A global-model of natural volatile organic-compound emissions, J. Geophys. Res., 100, 8873–8892, https://doi.org/10.1029/94jd02950, 1995.
Guenther, A., Karl, T., Harley, P., Wiedinmyer, C., Palmer, P. I., and Geron, C.: Estimates of global terrestrial isoprene emissions using MEGAN (Model of Emissions of Gases and Aerosols from Nature), Atmos. Chem. Phys., 6, 3181–3210, https://doi.org/10.5194/acp-6-3181-2006, 2006.
Horowitz, L. W., Fiore, A. M., Milly, G. P., Cohen, R. C., Perring, A., Wooldridge, P. J., Hess, P. G., Emmons, L. K., and Lamarque, J. F.: Observational constraints on the chemistry of isoprene nitrates over the eastern United States, J. Geophys. Res., 112, D12S08, https://doi.org/10.1029/2006JD007747, 2007.
Hu, J., Chen, J., Ying, Q., and Zhang, H.: One-year simulation of ozone and particulate matter in China using WRF/CMAQ modeling system, Atmos. Chem. Phys., 16, 10333–10350, https://doi.org/10.5194/acp-16-10333-2016, 2016.
Hudman, R. C., Murray, L. T., Jacob, D. J., Turquety, S., Wu, S., Millet, D. B., Avery, M., Goldstein, A. H., and Holloway, J.: North American influence on tropospheric ozone and the effects of recent emission reductions: constraints from ICARTT observations, J. Geophys. Res., 114, D07302, https://doi.org/10.1029/2008JD010126, 2009.
Im, U., Poupkou, A., Incecik, S., Markakis, K., Kindap, T., Unal, A., Melas, D., Yenigun, O., Topcu, S., Odman, M. T., Tayanc, M., and Guler, M.: The impact of anthropogenic and biogenic emissions on surface ozone concentrations in Istanbul, Sci. Total Environ., 409, 1255–1265, https://doi.org/10.1016/j.scitotenv.2010.12.026, 2011.
IPCC: Working Group I contribution to the IPCC Fifth Assessment Report Climate Change 2013: the Physical Science Basis, edited by: Stocker, T. F., Qin, D., Plattner, G.-K., Tignor, M., Allen, S. K., Boschung, J., Nauels, A., Xia, Y., Bex, V., and Midgley, P. M., Cambridge University Press, Cambridge, UK, New York, USA, 2013.
Jiang, H., Liao, H., Pye, H. O. T., Wu, S., Mickley, L. J., Seinfeld, J. H., and Zhang, X. Y.: Projected effect of 2000–2050 changes in climate and emissions on aerosol levels in China and associated transboundary transport, Atmos. Chem. Phys., 13, 7937–7960, https://doi.org/10.5194/acp-13-7937-2013, 2013.
Kanaya, Y., Hofzumahaus, A., Dorn, H.-P., Brauers, T., Fuchs, H., Holland, F., Rohrer, F., Bohn, B., Tillmann, R., Wegener, R., Wahner, A., Kajii, Y., Miyamoto, K., Nishida, S., Watanabe, K., Yoshino, A., Kubistin, D., Martinez, M., Rudolf, M., Harder, H., Berresheim, H., Elste, T., Plass-Dülmer, C., Stange, G., Kleffmann, J., Elshorbany, Y., and Schurath, U.: Comparisons of observed and modeled OH and HO2 concentrations during the ambient measurement period of the HOxComp field campaign, Atmos. Chem. Phys., 12, 2567–2585, https://doi.org/10.5194/acp-12-2567-2012, 2012.
Kota, S. H., Schade, G., Estes, M., Boyer, D., and Ying, Q.: Evaluation of MEGAN predicted biogenic isoprene emissions at urban locations in Southeast Texas, Atmos. Environ., 110, 54–64, https://doi.org/10.1016/j.atmosenv.2015.03.027, 2015.
Lee, K.-Y., Kwak, K.-H., Ryu, Y.-H., Lee, S.-H., and Baik, J.-J.: Impacts of biogenic isoprene emission on ozone air quality in the Seoul metropolitan area, Atmos. Environ., 96, 209–219, https://doi.org/10.1016/j.atmosenv.2014.07.036, 2014.
Li, G., Lei, W., Zavala, M., Volkamer, R., Dusanter, S., Stevens, P., and Molina, L. T.: Impacts of HONO sources on the photochemistry in Mexico City during the MCMA-2006/MILAGO Campaign, Atmos. Chem. Phys., 10, 6551–6567, https://doi.org/10.5194/acp-10-6551-2010, 2010.
Li, G., Bei, N., Tie, X., and Molina, L. T.: Aerosol effects on the photochemistry in Mexico City during MCMA-2006/MILAGRO campaign, Atmos. Chem. Phys., 11, 5169–5182, https://doi.org/10.5194/acp-11-5169-2011, 2011.
Li, J., Mao, J., Fiore, A. M., Cohen, R. C., Crounse, J. D., Teng, A. P., Wennberg, P. O., Lee, B. H., Lopez-Hilfiker, F. D., Thornton, J. A., Peischl, J., Pollack, I. B., Ryerson, T. B., Veres, P., Roberts, J. M., Neuman, J. A., Nowak, J. B., Wolfe, G. M., Hanisco, T. F., Fried, A., Singh, H. B., Dibb, J., Paulot, F., and Horowitz, L. W.: Decadal changes in summertime reactive oxidized nitrogen and surface ozone over the Southeast United States, Atmos. Chem. Phys., 18, 2341–2361, https://doi.org/10.5194/acp-18-2341-2018, 2018.
Li, L. Y. and Xie, S. D.: Historical variations of biogenic volatile organic compound emission inventories in China, 1981–2003, Atmos. Environ., 95, 185–196, https://doi.org/10.1016/j.atmosenv.2014.06.033, 2014.
Li, M., Zhang, Q., Kurokawa, J.-I., Woo, J.-H., He, K., Lu, Z., Ohara, T., Song, Y., Streets, D. G., Carmichael, G. R., Cheng, Y., Hong, C., Huo, H., Jiang, X., Kang, S., Liu, F., Su, H., and Zheng, B.: MIX: a mosaic Asian anthropogenic emission inventory under the international collaboration framework of the MICS-Asia and HTAP, Atmos. Chem. Phys., 17, 935–963, https://doi.org/10.5194/acp-17-935-2017, 2017.
Li, N., Fu, T.-M., Cao, J., Lee, S., Huang, X.-F., He, L.-Y., Ho, K.-F., Fu, J. S., and Lam, Y.-F.: Sources of secondary organic aerosols in the Pearl River Delta region in fall: contributions from the aqueous reactive uptake of dicarbonyls, Atmos. Environ., 76, 200–207, https://doi.org/10.1016/j.atmosenv.2012.12.005, 2013.
Lin, J.-T., Patten, K. O., Hayhoe, K., Liang, X.-Z., and Wuebbles, D. J.: Effects of future climate and biogenic emissions changes on surface ozone over the United States and China, J. Appl. Meteorol. Clim., 47, 1888–1909, https://doi.org/10.1175/2007jamc1681.1, 2008.
Liu, Q., Lam, K. S., Jiang, F., Wang, T. J., Xie, M., Zhuang, B. L., and Jiang, X. Y.: A numerical study of the impact of climate and emission changes on surface ozone over South China in autumn time in 2000–2050, Atmos. Environ., 76, 227–237, https://doi.org/10.1016/j.atmosenv.2013.01.030, 2013.
Millet, D. B., Jacob, D. J., Boersma, K. F., Fu, T. M., Kurosu, T. P., Chance, K., Heald, C. L., and Guenther, A.: Spatial distribution of isoprene emissions from North America derived from formaldehyde column measurements by the OMI satellite sensor, J. Geophys. Res., 113, D02307, https://doi.org/10.1029/2007JD008950, 2008.
Paulot, F., Crounse, J. D., Kjaergaard, H. G., Kroll, J. H., Seinfeld, J. H., and Wennberg, P. O.: Isoprene photooxidation: new insights into the production of acids and organic nitrates, Atmos. Chem. Phys., 9, 1479–1501, https://doi.org/10.5194/acp-9-1479-2009, 2009a.
Paulot, F., Crounse, J. D., Kjaergaard, H. G., Kurten, A., St Clair, J. M., Seinfeld, J. H., and Wennberg, P. O.: Unexpected epoxide formation in the gas-phase photooxidation of isoprene, Science, 325, 730–733, https://doi.org/10.1126/science.1172910, 2009b.
Paulot, F., Henze, D. K., and Wennberg, P. O.: Impact of the isoprene photochemical cascade on tropical ozone, Atmos. Chem. Phys., 12, 1307–1325, https://doi.org/10.5194/acp-12-1307-2012, 2012.
Peeters, J. and Müller, J. F.: HOx radical regeneration in isoprene oxidation via peroxy radical isomerisations. II: Experimental evidence and global impact, Phys. Chem. Chem. Phys., 12, 14227, https://doi.org/10.1039/c0cp00811g, 2010.
Qu, Y., An, J., and Li, J.: Synergistic impacts of anthropogenic and biogenic emissions on summer surface O3 in East Asia, J. Environ. Sci., 25, 520–530, https://doi.org/10.1016/s1001-0742(12)60069-2, 2013.
Qu, Y., An, J., Li, J., Chen, Y., Li, Y., Liu, X., and Hu, M.: Effects of NOx and VOCs from five emission sources on summer surface O3 over the Beijing–Tianjin–Hebei region, Adv. Atmos. Sci., 31, 787–800, https://doi.org/10.1007/s00376-013-3132-x, 2014.
Rohrer, F. and Berresheim, H.: Strong correlation between levels of tropospheric hydroxyl radicals and solar ultraviolet radiation, Nature, 442, 184, https://doi.org/10.1038/nature04924, 2006.
Sillman, S.: The use of NOy, H2O2, and HNO3 as indicators for ozone-NOx-hydrocarbon sensitivity in urban locations, J. Geophys. Res., 100, 14175–14188, https://doi.org/10.1029/94jd02953, 1995.
Skamarock, W. C., Klemp, J. B., Dudhia, J., Gill, D. O., Barker, D. M., Duda, M. G., Huang, X. Y., Wang, W., and Powers, J. G.: A Description of the Advanced Research WRF Version 3, Technical Report, National Center for Atmospheric Research, TN-475,+STR, Boulder, Colorado, USA, 2008.
Squire, O. J., Archibald, A. T., Abraham, N. L., Beerling, D. J., Hewitt, C. N., Lathière, J., Pike, R. C., Telford, P. J., and Pyle, J. A.: Influence of future climate and cropland expansion on isoprene emissions and tropospheric ozone, Atmos. Chem. Phys., 14, 1011–1024, https://doi.org/10.5194/acp-14-1011-2014, 2014.
Squire, O. J., Archibald, A. T., Griffiths, P. T., Jenkin, M. E., Smith, D., and Pyle, J. A.: Influence of isoprene chemical mechanism on modelled changes in tropospheric ozone due to climate and land use over the 21st century, Atmos. Chem. Phys., 15, 5123–5143, https://doi.org/10.5194/acp-15-5123-2015, 2015.
Stein, U. and Alpert, P.: Factor separation in numerical simulations, J. Atmos. Sci., 50, 2107–2115, https://doi.org/10.1175/1520-0469(1993)050<2107:fsins>2.0.co;2, 1993.
Stevenson, D. S., Young, P. J., Naik, V., Lamarque, J.-F., Shindell, D. T., Voulgarakis, A., Skeie, R. B., Dalsoren, S. B., Myhre, G., Berntsen, T. K., Folberth, G. A., Rumbold, S. T., Collins, W. J., MacKenzie, I. A., Doherty, R. M., Zeng, G., van Noije, T. P. C., Strunk, A., Bergmann, D., Cameron-Smith, P., Plummer, D. A., Strode, S. A., Horowitz, L., Lee, Y. H., Szopa, S., Sudo, K., Nagashima, T., Josse, B., Cionni, I., Righi, M., Eyring, V., Conley, A., Bowman, K. W., Wild, O., and Archibald, A.: Tropospheric ozone changes, radiative forcing and attribution to emissions in the Atmospheric Chemistry and Climate Model Intercomparison Project (ACCMIP), Atmos. Chem. Phys., 13, 3063–3085, https://doi.org/10.5194/acp-13-3063-2013, 2013.
Stockwell, W. R., Middleton, P., Chang, J. S., and Tang, X.: The second generation regional acid deposition model chemical mechanism for regional air quality modeling, J. Geophys. Res., 95, 16343–16367, https://doi.org/10.1029/JD095iD10p16343, 1990.
Strong, J., Whyatt, J. D., Metcalfe, S. E., Derwent, R. G., and Hewitt, C. N.: Investigating the impacts of anthropogenic and biogenic VOC emissions and elevated temperatures during the 2003 ozone episode in the UK, Atmos. Environ., 74, 393–401, https://doi.org/10.1016/j.atmosenv.2013.04.006, 2013.
Tian, S. L., Pan, Y. P., and Wang, Y. S.: Size-resolved source apportionment of particulate matter in urban Beijing during haze and non-haze episodes, Atmos. Chem. Phys., 16, 1–19, https://doi.org/10.5194/acp-16-1-2016, 2016.
Tian, Y., Dickinson, R. E., Zhou, L., Myneni, R. B., Friedl, M., Schaaf, C. B., Carroll, M., and Gao, F.: Land boundary conditions from MODIS data and consequences for the albedo of a climate model, Geophys. Res. Let., 31, L05504, https://doi.org/10.1029/2003GL019104, 2004.
Tie, X. X., Madronich, S., Walters, S., Zhang, R. Y., Rasch, P., and Collins, W.: Effect of clouds on photolysis and oxidants in the troposphere, J. Geophys. Res., 108, 4642, https://doi.org/10.1029/2003jd003659, 2003.
Travis, K. R., Jacob, D. J., Fisher, J. A., Kim, P. S., Marais, E. A., Zhu, L., Yu, K., Miller, C. C., Yantosca, R. M., Sulprizio, M. P., Thompson, A. M., Wennberg, P. O., Crounse, J. D., St. Clair, J. M., Cohen, R. C., Laughner, J. L., Dibb, J. E., Hall, S. R., Ullmann, K., Wolfe, G. M., Pollack, I. B., Peischl, J., Neuman, J. A., and Zhou, X.: Why do models overestimate surface ozone in the Southeast United States?, Atmos. Chem. Phys., 16, 13561–13577, https://doi.org/10.5194/acp-16-13561-2016, 2016.
Wagner, P. and Kuttler, W.: Biogenic and anthropogenic isoprene in the near-surface urban atmosphere – a case study in Essen, Germany, Sci. Total Environ., 475, 104–115, https://doi.org/10.1016/j.scitotenv.2013.12.026, 2014.
Wang, D., Hu, J., Xu, Y., Lv, D., Xie, X., Kleeman, M., Xing, J., Zhang, H., and Ying, Q.: Source contributions to primary and secondary inorganic particulate matter during a severe wintertime PM2.5 pollution episode in Xi'an, China, Atmos. Environ., 97, 182–194, https://doi.org/10.1016/j.atmosenv.2014.08.020, 2014.
Wang, M., Sampson, P. D., Hu, J., Kleeman, M., Keller, J. P., Olives, C., Szpiro, A. A., Vedal, S., and Kaufman, J. D.: Combining land-use regression and chemical transport modeling in a spatiotemporal geostatistical model for ozone and PM2.5, Environ. Sci. Technol., 50, 5111–5118, https://doi.org/10.1021/acs.est.5b06001, 2016.
Wang, Q., Han, Z., Wang, T., and Zhang, R.: Impacts of biogenic emissions of VOC and NOx on tropospheric ozone during summertime in eastern China, Sci. Total Environ., 395, 41–49, https://doi.org/10.1016/j.scitotenv.2008.01.059, 2008.
Wang, T., Xue, L., Brimblecombe, P., Yun, F. L., Li, L., and Zhang, L.: Ozone pollution in China: a review of concentrations, meteorological influences, chemical precursors, and effects, Sci. Total Environ., 575, 1582–1596, https://doi.org/10.1016/j.scitotenv.2016.10.081, 2017.
Wang, X., Shen, Z., Cao, J., Zhang, L., Liu, L., Li, J., Liu, S., and Sun, Y.: Characteristics of surface ozone at an urban site of Xi'an in Northwest China, J. Environ. Monitor., 14, 116–126, https://doi.org/10.1039/c1em10541h, 2012.
Wang, Y., Shen, L., Wu, S., Mickley, L., He, J., and Hao, J.: Sensitivity of surface ozone over China to 2000–2050 global changes of climate and emissions, Atmos. Environ., 75, 374–382, https://doi.org/10.1016/j.atmosenv.2013.04.045, 2013.
Wesely, M. L.: Parameterization of surface resistances to gaseous dry deposition in regional-scale numerical-models, Atmos. Environ., 23, 1293–1304, https://doi.org/10.1016/0004-6981(89)90153-4, 1989.
World Health Organization (WHO): Air Quality Guidelines for Particulate Matter, Ozone, Nitrogen Dioxide and Sulfur Dioxide. Global update, Geneva, Switzerland, 2005.
Wu, S., Mickley, L. J., Jacob, D. J., Logan, J. A., Yantosca, R. M., and Rind, D.: Why are there large differences between models in global budgets of tropospheric ozone?, J. Geophys. Res., 112, D05302, https://doi.org/10.1029/2006jd007801, 2007.
Wu, S., Mickley, L. J., Leibensperger, E. M., Jacob, D. J., Rind, D., and Streets, D. G.: Effects of 2000–2050 global change on ozone air quality in the United States, J. Geophys. Res., 113, D06302, https://doi.org/10.1029/2007jd008917, 2008.
Xu, Z., Wang, T., Xue, L. K., Louie, P. K. K., Luk, C. W. Y., Gao, J., Wang, S. L., Chai, F. H., and Wang, W. X.: Evaluating the uncertainties of thermal catalytic conversion in measuring atmospheric nitrogen dioxide at four differently polluted sites in China, Atmos. Environ., 76, 221–226, https://doi.org/10.1016/j.atmosenv.2012.09.043, 2013.
Xue, L. K., Wang, T., Gao, J., Ding, A. J., Zhou, X. H., Blake, D. R., Wang, X. F., Saunders, S. M., Fan, S. J., Zuo, H. C., Zhang, Q. Z., and Wang, W. X.: Ground-level ozone in four Chinese cities: precursors, regional transport and heterogeneous processes, Atmos. Chem. Phys., 14, 13175–13188, https://doi.org/10.5194/acp-14-13175-2014, 2014.
Xue, Y., Ho, S., Huang, Y., Li, B., Wang, L., Dai, W., Cao, J., and Lee, S.: Source apportionment of VOCs and their impacts on surface ozone in an industry city of Baoji, Northwestern China, Sci. Rep., 7, 9979, https://doi.org/10.1038/s41598-017-10631-4, 2017.
Zare, A., Christensen, J. H., Irannejad, P., and Brandt, J.: Evaluation of two isoprene emission models for use in a long-range air pollution model, Atmos. Chem. Phys., 12, 7399–7412, https://doi.org/10.5194/acp-12-7399-2012, 2012.
Zhang, R., Cohan, A., Biazar, A. P., and Cohan, D. S.: Source apportionment of biogenic contributions to ozone formation over the United States, Atmos. Environ., 164, 8–19, https://doi.org/10.1016/j.atmosenv.2017.05.044, 2017.
Zhang, T., Cao, J. J., Chow, J. C., Shen, Z. X., Ho, K. F., Ho, S. S. H., Liu, S. X., Han, Y. M., Watson, J. G., and Wang, G. H.: Characterization and seasonal variations of levoglucosan in fine particulate matter in Xi'an, China, J. Air Waste Manage., 64, 1317–1327, https://doi.org/10.1080/10962247.2014.944959, 2014.
Zhu, J. and Liao, H.: Future ozone air quality and radiative forcing over China owing to future changes in emissions under the Representative Concentration Pathways (RCPs), J. Geophys. Res., 121, 1978–2001, https://doi.org/10.1002/2015JD023926, 2016.