the Creative Commons Attribution 4.0 License.
the Creative Commons Attribution 4.0 License.
 | 18 May 2018
Hygroscopic growth study in the framework of EARLINET during the SLOPE I campaign: synergy of remote sensing and in situ instrumentation
Andrés Esteban Bedoya-Velásquez
Francisco Navas-Guzmán
María José Granados-Muñoz
Gloria Titos
Roberto Román
Juan Andrés Casquero-Vera
Pablo Ortiz-Amezcua
Jose Antonio Benavent-Oltra
Gregori de Arruda Moreira
Elena Montilla-Rosero
Carlos David Hoyos
Begoña Artiñano
Esther Coz
Francisco José Olmo-Reyes
Lucas Alados-Arboledas
Juan Luis Guerrero-Rascado
This study focuses on the analysis of aerosol hygroscopic growth during the Sierra Nevada Lidar AerOsol Profiling Experiment (SLOPE I) campaign by using the synergy of active and passive remote sensors at the ACTRIS Granada station and in situ instrumentation at a mountain station (Sierra Nevada, SNS). To this end, a methodology based on simultaneous measurements of aerosol profiles from an EARLINET multi-wavelength Raman lidar (RL) and relative humidity (RH) profiles obtained from a multi-instrumental approach is used. This approach is based on the combination of calibrated water vapor mixing ratio (r) profiles from RL and continuous temperature profiles from a microwave radiometer (MWR) for obtaining RH profiles with a reasonable vertical and temporal resolution. This methodology is validated against the traditional one that uses RH from co-located radiosounding (RS) measurements, obtaining differences in the hygroscopic growth parameter (γ) lower than 5 % between the methodology based on RS and the one presented here. Additionally, during the SLOPE I campaign the remote sensing methodology used for aerosol hygroscopic growth studies has been checked against Mie calculations of aerosol hygroscopic growth using in situ measurements of particle number size distribution and submicron chemical composition measured at SNS. The hygroscopic case observed during SLOPE I showed an increase in the particle backscatter coefficient at 355 and 532 nm with relative humidity (RH ranged between 78 and 98 %), but also a decrease in the backscatter-related Ångström exponent (AE) and particle linear depolarization ratio (PLDR), indicating that the particles became larger and more spherical due to hygroscopic processes. Vertical and horizontal wind analysis is performed by means of a co-located Doppler lidar system, in order to evaluate the horizontal and vertical dynamics of the air masses. Finally, the Hänel parameterization is applied to experimental data for both stations, and we found good agreement on γ measured with remote sensing ( and ) with respect to the values calculated using Mie theory ( and ), with relative differences between measurements and simulations lower than 9 % at 532 nm and 11 % at 355 nm.


Atmospheric aerosol particles play a crucial role in the Earth's climate, principally by means of the radiative effect due to aerosol–radiation and aerosol–cloud interactions, affecting the Earth–atmosphere energy balance and, hence, the Earth's climate. Furthermore, aerosol might also modify optical and microphysical cloud properties, such as albedo and cloud droplet size distribution, that influence cloud lifetime, since the particles could act as cloud condensation nuclei (CCN) and ice nuclei (IN) (Twomey, 1977; Albrecht, 1989; Boucher et al., 2013).
Water vapor plays a major role in the aerosol–radiation interaction due to the ability of some atmospheric aerosol particles to take up water from the environment. In this sense, hygroscopic growth is the process by which aerosol particles uptake water and increase their size under high relative humidity (RH) conditions (Hänel, 1976). Consequently, this process is also related to changes in the optical and microphysical properties of the aerosol particles and, hence, it becomes a crucial factor that modifies the role of aerosols in atmospheric processes and radiative forcing.
Several studies have been carried out over the past years in order to evaluate how water uptake affects aerosol properties. One parameter used to quantify these changes is the so-called aerosol hygroscopic enhancement factor: f (λ, RH), where λ is the wavelength, defined as the ratio between aerosol optical/microphysical properties at wet atmospheric conditions and the corresponding reference value at dry conditions (Hänel, 1976; Ferrare et al., 1998; Feingold et al., 2003; Veselovskii et al., 2009; Granados-Muñoz et al., 2015; Titos et al., 2014, 2016, and references therein). Most of the previous studies investigating aerosol hygroscopicity are based on in situ measurements. One of the most commonly used in situ instruments for measuring aerosol hygroscopicity is the Humidified Tandem Differential Mobility Analyzer (HTDMA) (e.g., Swietlicki et al., 2008) that measures the hygroscopic growth factor, g (RH), that quantifies the change in particle diameter due to water uptake. Humidified tandem nephelometers have been extensively used as well to quantify the effect of the hygroscopic growth in the aerosol optical properties like scattering, backscattering and extinction coefficients (e.g., Pilat and Charlson, 1966; Titos et al., 2016). There are other in situ instruments such as the white-light humidified optical particle spectrometer (WHOPS) (Rosatti et al., 2015) or the Differential Aerosol Sizing and Hygroscopicity Spectrometer Probe (DASH-SP) (Sorooshian et al., 2008) that have been used to determine the impact of enhanced RH on the aerosol properties from airborne platforms.
The effect of RH on the aerosol optical properties can be also determined with Mie model calculations (e.g., Adam et al., 2012; Fierz-Schmidhauser et al., 2010; Zieger et al., 2013) using the measured size distribution and chemical composition as inputs. For this calculation, information on g (RH) is needed a priori. This factor can be determined experimentally (using HTDMA measurements for example) or it can be inferred from the individual growth factors of the different chemical compounds. The assumption of some aerosol properties such as the refractive index or the growth factor based on the chemical composition is the main drawback of this method.
In general terms, most in situ techniques are limited by the fact that they modify the ambient conditions and are also subject to particle losses in the sampling lines, thereby altering the real atmospheric aerosol properties. Remote sensing systems such as lidars have also been used in recent decades for aerosol hygroscopic growth studies performed with co-located radiosounding (RS) measurements (e.g., Ferrare et al., 1998; Feingold et al., 2003; Veselovskii et al., 2009; Granados-Muñoz et al., 2015; Fernández et al., 2015; Lv et al., 2017). These systems have been shown to be robust, with high vertical and temporal resolutions that allow for study of the aerosol hygroscopic growth under unmodified ambient conditions. Recent studies presented by Zieger et al. (2011) and Rosati et al. (2016) show good agreement between in situ and RL extinction coefficients after taking into account the RH effect on the in situ measured extinction coefficient. Also, it is possible to use aerosol extinction coefficient to compare with in situ airborne measures and elastic lidar to study hygroscopic growth in unmodified ambient conditions. In addition, good results were obtained by using automatic lidar and ceilometers (ALCs) to investigate hygroscopic growth and fog formation, mostly for fog event forecasting purposes (Haeffelin et al., 2016).
Up to now, most hygroscopic growth studies using lidar systems have combined lidar measurements with RH data from RS (Granados-Muñoz et al., 2015). The main inconveniences are that RS measurements have low temporal sampling and they could be drifted away from the vertical atmosphere probed by the lidar systems. These inconveniences can be easily overcome by combining calibrated water vapor mixing ratio profiles, r (z) from Raman lidar (RL), with temperature profiles from ancillary instrumentation for obtaining collocated RH and aerosol backscatter profiles, using them simultaneously for hygroscopic growth studies (e.g., Whiteman, 2003; Navas-Guzmán et al., 2014; Barrera-Verdejo et al., 2016). Navas-Guzmán et al. (2014) proposed a methodology for retrieving RH profiles by the combination of calibrated r (z) profiles from a Raman lidar water vapor channel with temperature profiles obtained from microwave radiometer (MWR) measurements. RH profiles obtained using this multi-instrumental approach and aerosol profiles from the lidar are used in this work to study aerosol hygroscopic growth. This methodology allows us to obtain a larger database of potential hygroscopic cases since some of the limitations associated with RS are overcome. Additionally, water vapor and aerosol measurements are performed with the same system and, thus, the same air volume is probed, avoiding the possible radiosonde drift and temporal sampling mismatch.
The main goal of this study is to apply the methodology proposed by Navas-Guzmán et al. (2014), based on the application of the synergy between RL and MWR, for aerosol hygroscopic growth studies. First, this methodology for hygroscopic growth studies is compared with the approach presented in Granados-Muñoz et al. (2015) that uses RS and lidar data. Once the technique is evaluated, an analysis of the aerosol hygroscopic growth case observed during the SLOPE I (Sierra Nevada Lidar AerOsol Profiling Experiment I) campaign is presented. In addition, the results obtained with the remote sensing data are compared with Mie simulations performed using in situ measurements from a high-mountain station located at 2500 m a.s.l.
This paper is organized as follows. The description of the experimental site and instrumentation is presented in Sect. 2. The applied methodology is introduced in Sect. 3. Section 4 presents the results and discussion of the combination of RL and MWR measurements for obtaining RH profiles and the analysis of the aerosol hygroscopic cases based on the remote sensing and in situ measurements. Finally, conclusions are given in Sect. 5.
2.1 SLOPE I field campaign
In summer 2016, the Sierra Nevada Lidar AerOsol Profiling Experiment (SLOPE I) intensive field campaign was carried out in southeastern Spain in the framework of the ACTRIS European infrastructure. The goal of this campaign was to perform a closure study by comparing remote sensing and in situ measurements at different altitudes, taking advantage of a unique experimental setup (Román et al., 2018). This setup consisted of several experimental stations located at different altitude levels on the slope of the Sierra Nevada, located 20 km away in horizontal distance from the remote sensors at IISTA-CEAMA station (urban station at Granada). In the present study, we only make use of the data from the in situ instrumentation of the mountain Sierra Nevada station (SNS) located at 2500 m a.s.l., SNS in Fig. 1. Combined active and passive remote sensing measurements using multiple instrumentation at the Andalusian Institute of Earth System Research (IISTA-CEAMA) station and simultaneous in situ measurements at 2500 m a.s.l. on the northern slope of the Sierra Nevada were performed from May to September 2016 during this campaign. In addition, 25 RS were launched during this period, 6 of them during nighttime, in order to perform regular calibration of the Raman lidar water vapor channel.
2.2 IISTA-CEAMA station
One of the stations where this study has been carried out is IISTA-CEAMA, an urban station managed by the University of Granada (UGR) located at Granada, Spain (37.16∘ N, 3.61∘ W, 680 m a.s.l.). This region is characterized by its complex terrain surrounded by mountains, mainly affected by Mediterranean continental climate conditions with hot summers and cool winters. Navas-Guzmán et al. (2014) analyzed 1 year of measurements of RH profiles at Granada, showing that this location presents low values of RH (below 60 %) in 75 % of the cases studied for altitudes between 1.0 and 2.0 km a.s.l. RH values above 60 % are mostly found in the spring and winter seasons. Regarding the remote aerosol sources, Granada is predominantly affected by aerosol particles coming from Europe and mineral dust particles from the African continent (Lyamani et al., 2006a, b, 2010, 2012; Guerrero-Rascado et al., 2008a, 2009, 2011; Córdoba-Jabonero et al., 2011; Titos et al., 2012; Navas-Guzmán et al., 2013; Valenzuela et al., 2014; Granados-Muñoz et al., 2016; Benavent-Oltra et al., 2017; Cazorla et al., 2017). The main local sources are road traffic, domestic heating (during wintertime), and biomass burning (Titos et al., 2017). Transported smoke principally from North America, northern Africa, and the Iberian Peninsula can also affect the study area (Alados-Arboledas et al., 2011; Navas-Guzmán et al., 2013; Preißler et al., 2013; Pereira et al., 2014; Ortiz-Amezcua et al., 2017). Moreover, the probability of marine particles reaching the city is low despite the short distance to the coast (about 50 km away) due to the orography of the region, with mountains blocking the path from the sea to the city. Additionally, Titos et al. (2014) showed that the contribution of marine aerosols to PM10 mass concentration at IISTA-CEAMA station is almost negligible (< 3 %).
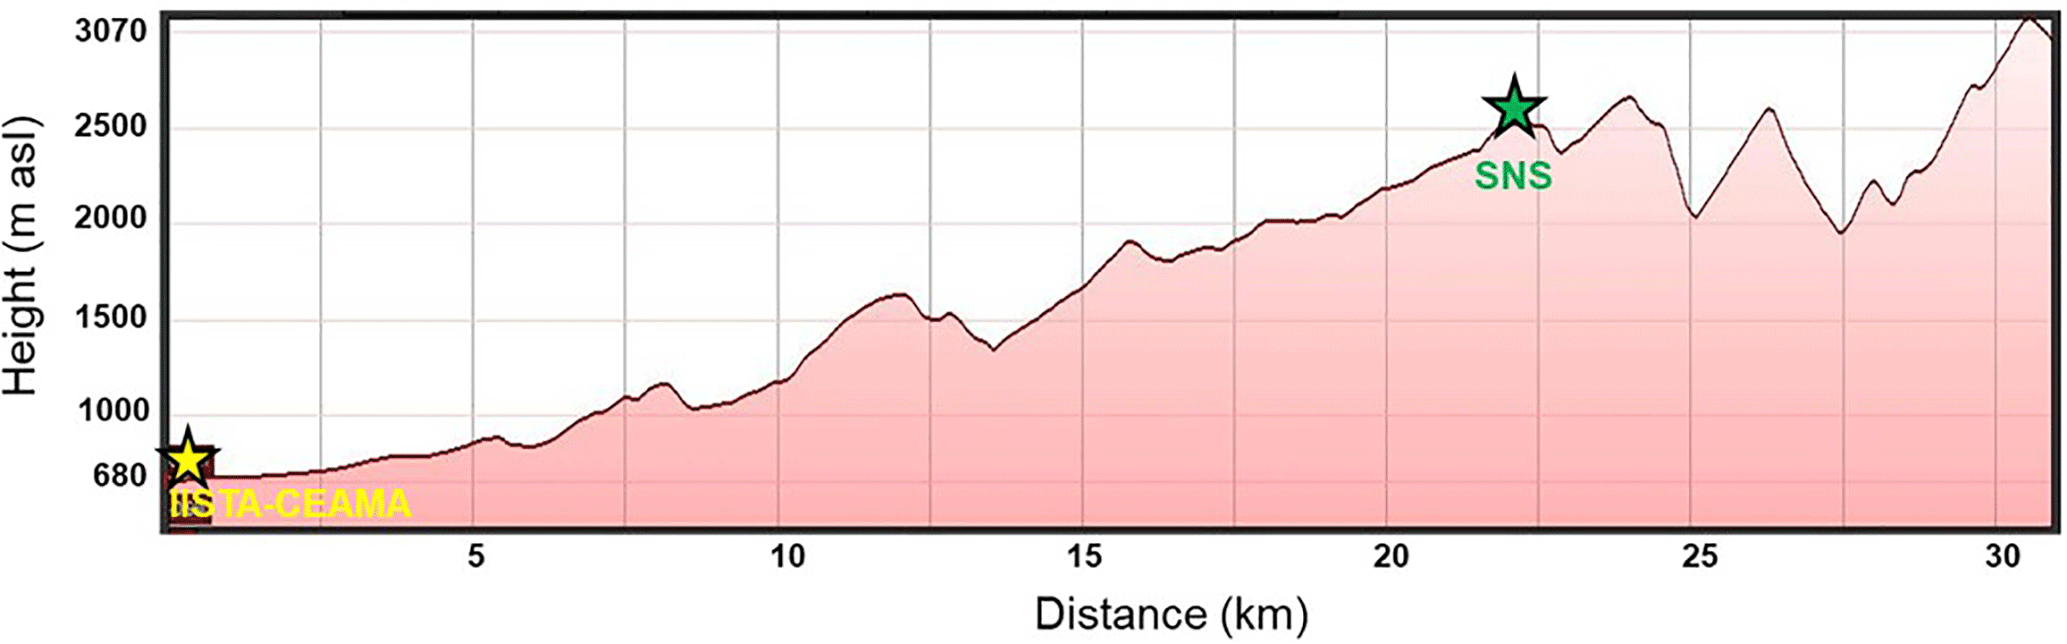
Figure 1Topographic profile of the Granada and Sierra Nevada area. The yellow star refers to IISTA-CEAMA station and the green star refers to SNS in situ station.
The main instrument used in this study and located at IISTA-CEAMA station is the multi-wavelength Raman lidar (RL) MULHACEN (Raymetrics S. A., Greece). MULHACEN is included in EARLINET (European Aerosol Lidar NETwork) (Pappalardo et al., 2014), now operating in the framework of ACTRIS-2 (Aerosols, Clouds and Trace gases Research Infrastructure), and also in SPALINET (Spanish and Portuguese Aerosol Lidar Network) (Sicard et al., 2009). It emits laser pulses at 355 and 532 nm (parallel and perpendicular polarization channels) and 1064 nm, and it receives backscattered photons at 355, 532, and 1064 nm in analog and photon counting modes. It also collects Raman backscattered photons at 607 and 387 nm from molecular nitrogen (N2) and at 408 nm from water vapor (H2O) in photon counting mode during routine nighttime measurements. Such kinds of configurations allow for derivation of not only vertically resolved particle information, but also water vapor mixing ratio profiles. The vertical resolution for lidar backscattered signals is 7.5 m. Atmospheric information retrieved from lower regions is limited by the full overlap height, which is reached above 1.3 km a.s.l. due to the system configuration (Guerrero-Rascado et al., 2010; Navas-Guzmán et al., 2011). A full description of this instrument can be found in Guerrero-Rascado et al. (2008a, 2009). Aerosol particle backscatter coefficient profiles (βpar(z)) are retrieved by the Klett–Fernald method (Fernald, 1984; Klett, 1981, 1985). The total uncertainty for βpar retrieved with this method is usually within 20 % (e.g., Franke et al., 2001; Preißler et al., 2011).
The ground-based MWR (RPG-HATPRO G2, Radiometer physics GmbH), which is also located at IISTA-CEAMA station and belongs to MWRnet (Rose et al., 2005; Caumont et al., 2016), is used here for retrieving temperature profiles. The MWR is a passive remote sensor that performs automatic measurements of sky brightness temperature at two bands: the oxygen V band (51–58 GHz) and water vapor K band (22–31 GHz) associated with temperature and water vapor and liquid water, respectively. The MWR has a radiometric resolution between 0.3 and 0.4 rms errors at 1.0 s integration time. The retrievals of temperature profiles from the measured brightness temperatures are performed using a standard feed forward neural network (Rose et al., 2005). A detailed description of this system can be found in Granados-Muñoz et al. (2012) and Navas-Guzmán et al. (2014). Temperature data are provided at 39 height bins, with variable vertical resolution. The first 25 bins are located below 2 km (mainly within the atmospheric boundary layer, ABL) with a resolution ranging between 10 and 200 m, whereas the vertical resolution is much lower in the free troposphere (between 200 and 2000 m), with only 14 bins between 2 and 10 km. The accuracy and precision of the temperature profiles of this radiometer were evaluated against RS by Bedoya et al. (2017). This study revealed differences between RS and the MWR temperature profiles lower than 0.5 K below 2.5 km and up to 1.7 K at higher altitude levels. Those results are within the accuracy of the temperature profile reported by the manufacturer, which is lower than 0.75 K RMSE (1.2–4.0 km range) and larger than 1.0 K RMSE from 4 to 10 km.
Co-located RS is occasionally launched when Raman lidar measurements are taken. The RS data are obtained with a GRAW DFM-06/09 system (GRAW Radiosondes, Germany), which provides temperature (resolution 0.01∘ C, accuracy 0.2 ∘C), pressure (resolution 0.1 hPa, accuracy 0.5 hPa), and RH (resolution 1 %, accuracy 2 %) profiles with vertical resolution depending on the sonde ascension velocity, usually around 5 m s−1. Data acquisition and processing are performed by the GRAWmet software and GS-E ground station from the same manufacturer.
A co-located Doppler lidar system (HALO photonics Stream Line) has also been operated at IISTA-CEAMA station since May 2016. This system provides range-resolved measurements of attenuated backscatter based on the frequency shift associated with the movement of the particles and clouds in the atmosphere by means of the heterodyne optical detection principle (Pearson et al., 2008). As this movement is linked with wind, the 3-D wind vector can be determined through the Doppler effect. Radial velocity measurements are taken every 2 s, and conical scans are performed every 10 min with a 75∘ elevation angle and at 12 equidistant azimuth angles. The eye-safe laser transmitter vertically pointing to zenith operates at 1.5 mum, with low pulse energy (∼100 µJ) and a high pulse repetition rate (∼15 kHz) on a monostatic coaxial setup. See Päschke et al. (2015) for further information of the system configuration.
2.3 Sierra Nevada station
At SNS (37.09∘ N, 3.38∘ W; 2500 m a.s.l.), state-of-the-art in situ instrumentation was operated to characterize aerosol properties. The inlet at SNS is a whole air inlet located on the rooftop of a three-story building. It is made up of stainless-steel pipes, with dimensions of 10 cm in diameter and 2.5 m in length. Inside the main pipe there is a laminar flow of 100 Lpm and there are several stainless-steel pipes that drive the sampling air to the different instruments. Each one of the stainless-steel pipes extracts the appropriate flow for each instrument. Different diameters of the pipes have been selected in order to optimize the efficiency of the system (Baron and Willeke, 2001). The instrumentation used in this study includes an Aerodyne Aerosol Chemical Speciation Monitor (ACSM, Aerodyne Research Inc.), an Aethalometer (AE33 model, Magee Scientific, Aerosol d.o.o.), an Aerodynamic Particle Sizer (APS, TSI 3321) spectrometer, and a Scanning Mobility Particle Sizer (SMPS, TSI 3938) spectrometer, all of them connected to the main inlet. The ACSM was used to measure online submicron inorganic (nitrate, sulfate, and ammonium) and organic aerosol (OA) concentrations. Equivalent black carbon, eBC, mass concentration was obtained from measurements of Aethalometer AE33 at 880 nm. A mass absorption cross section of 7.77 m2g−1 was used to convert the absorption coefficients at 880 nm in eBC mass concentrations (Drinovec et al., 2015). Particle number size distributions were retrieved by a combination of the measurements performed with the SMPS in the diameter range 13–600 nm and the APS for the range 0.6–20 µm.
3.1 RH profiles by synergy of RL and MWR data
As mentioned in Sect. 2, some RL systems can provide simultaneous aerosol and water vapor profiles with high vertical and temporal resolution. The water vapor mixing ratio r (z) can be obtained from the ratio of Raman lidar signals of water vapor (408 nm) and nitrogen (387 nm) multiplied by a constant C that takes into account the fractional volume of nitrogen, the ratio between molecular masses, some range-independent constants, and the Raman backscatter cross sections for nitrogen and water vapor molecules (Mattis et al., 2002). In the present study, the calibration constant C has been calculated using the simultaneous and collocated radiosondes launched at the EARLINET IISTA-CEAMA station during the analyzed periods. C is obtained as the average value of the ratio between the uncalibrated RL r (z) profile and the r (z) profile from RS over a height range that presents a high good signal-to-noise ratio (Guerrero-Rascado et al., 2008b; Leblanc et al., 2012; Navas-Guzmán et al., 2014; Foth et al., 2015). C remains constant over periods when the lidar setup is not modified and the system presents good alignment, allowing us to retrieve r (z) profiles from the RL even when RS measurements are not available. If several RS launches are available during a certain period, C is obtained as the average between all calibrations performed over that particular period.
Temperature profiles from the MWR are continuously measured every 2 min. These profiles are averaged over 30 min in order to match the temporal sampling of the averaged r (z) profiles, as proposed by Navas-Guzmán et al. (2014); 30 min averaged temperature and r (z) profiles are then used to retrieve the RH profiles required for aerosol hygroscopic growth studies. The following equation is used to calculate the RH profiles:
where r(z) is obtained from the calibrated water vapor channel, P(z) (hPa) is the ground-scaled pressure profile, and ew(z) is the water vapor pressure (hPa), calculated from the temperature profiles (List, 1951). Temperature profiles were scaled to lidar vertical resolution by linear interpolation.
3.2 Selection criteria for hygroscopic cases
A simultaneous increase in aerosol properties, such as particle backscatter (βpar) or extinction (αpar) coefficients, and RH values over a certain atmospheric layer might be an indication of aerosol hygroscopic growth. Moreover, a decreasing Ångström exponent (AE) and particle linear depolarization ratio (PLDR) are related to larger and more spherical particles, which also points to aerosol water uptake (Granados-Muñoz et al., 2015; Fernández et al., 2015; Haarig et al., 2017). However, additional constraints need to be fulfilled when studying the aerosol hygroscopic growth in the atmosphere by remote sensing techniques due to the lack of control over the environmental conditions, as opposed to in situ measurements. These constraints are used for guaranteeing those variations in the aerosol properties are due to water uptake and not to changes in the aerosol load or type.
The first constraint that needs to be satisfied is that the origin and pathways of the air masses arriving at different altitudes within the analyzed layer must be the same in order to avoid transport of different aerosol types from different source regions (Veselovskii et al., 2009; Granados-Muñoz et al., 2015). The evaluation of the aerosol origin and transport is performed here through backward trajectory analysis using the HYSPLIT model (Hybrid Single-Particle Lagrangian Integrated Trajectory) (Draxler and Rolph, 2003) with GDAS data as meteorological input. GDAS data have a horizontal spatial resolution of 0.5∘ × 0.5∘ and a temporal resolution of 3 h. As a second constraint, atmospheric vertical homogeneity must be ensured. In order to evaluate the atmospheric vertical mixing, virtual potential temperature (θv(z)) and r (z) profiles are analyzed. The low vertical variability of those variables suggests atmospheric vertical homogeneity in the layer of study (Veselovskii et al., 2009; Fernández et al., 2015; Granados-Muñoz et al., 2015; Lv et al., 2017). In addition, horizontal and vertical wind velocities and directions retrieved from the lidar Doppler system operated at the Granada station were also considered. Low horizontal wind velocity measured at different altitude levels is used as an indicator of no particle advection into the layer analyzed, taking into account that wind direction must be constant during long time periods (longer than 3 h). The third moment of the frequency distribution of vertical wind velocities (skewness) has also been calculated in order to evaluate convection of air masses within the column studied, keeping in mind that positive values of skewness represent upward wind velocity and negative values the opposite (O'Connor et al., 2010).
3.3 Relative humidity and aerosol properties
Once the requirements described in Sect. 3.2 are fulfilled, the cases of hygroscopic growth can be studied by means of the enhancement factor (fξ(λ, RH)), defined as follows:
where ξ (λ, RH) represents an aerosol optical/microphysical property evaluated at a certain RH. The value of RHref is taken from each profile and corresponds to the lowest RH in the evaluated layer. In this study, the optical property used is βpar at 355 and 532 nm and, thus, the backscatter enhancement factor is denoted as fβ(λ,RH). Estimations of fβ(λ,RH) uncertainty are very scarce because of their high complexity. Some studies (e.g., Adam et al., 2012; Zieger et al., 2013) provided estimations based on sensitivity analysis using Mie model calculations, reporting errors around 20 % on fσ(λ,RH), where σ is the scattering coefficient. Titos et al. (2016) reported uncertainty estimations based on Monte Carlo techniques, concluding that the more hygroscopic the aerosol, the higher the uncertainty in fσ(λ,RH), especially at high RH (RH >80 %). For moderate-hygroscopic aerosol, a lower limit was established for the uncertainty in fσλ,RH of around 30–40 % using nephelometry techniques.
In aerosol hygroscopic growth studies, humidograms are usually parameterized by using fitting equations (e.g., Titos et al., 2016) of varying complexity. One of the most commonly used parameterizations is the one-parameter equation introduced by Hänel et al. (1976):
where γ is a parameter related to the aerosol hygroscopicity. This parameter depends on the aerosol type and wavelength.
3.4 Mie model to calculate the enhancement factor at SNS
In order to validate the results obtained with the remote sensors for (RH) and γ(λ), theoretical calculations based on Mie theory (Mie, 1908) have been performed using data from SNS in situ instrumentation as input for the Mie model. The particle backscatter coefficients under dry and humid conditions have been calculated with a model based on Mie theory where the core Mie routine is based on the code of Bohren and Huffmann (2004). The particles are assumed to be spherical and homogenously internally mixed. For this analysis, the particle number size distribution and the complex refractive index (m) of the measured aerosol are needed as input. We calculated the aerosol complex refractive index using the chemical composition measured with the ACSM combined with the black carbon (eBC) mass concentration from the aethalometer. Then, the refractive index was determined by a volume fraction averaging:
where ρ is the total density of the aerosol, Fi is the mass fraction, ρi is the density, and mi(λ) is the wavelength-dependent complex refractive index of the compound i. The values of ρi and mi(λ) are taken from the literature and are listed in Table 1.
Table 1Aerosol properties of selected compounds used for the model predictions, the refractive index (m) at 355 and 532 nm, density (ρ), and growth factor.
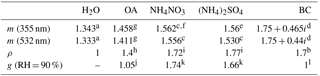
a Hale and Querry (1973); b Nessler et al. (2005); c Fierz-Schmidhauser et al. (2010); d Hess et al. (1998); e Ma and Thompson (2012); f linear interpolation to 355 nm (Kou et al., 1993); g Nakayama et al. (2010); h Alfarra et al. (2006); i Rankin (2009); j Riipinen et al. (2015) for Dp = 100 nm; k Gysel et al. (2007) for Dp = 60 nm; l BC was assumed to be insoluble (e.g., Hung et al., 2015).
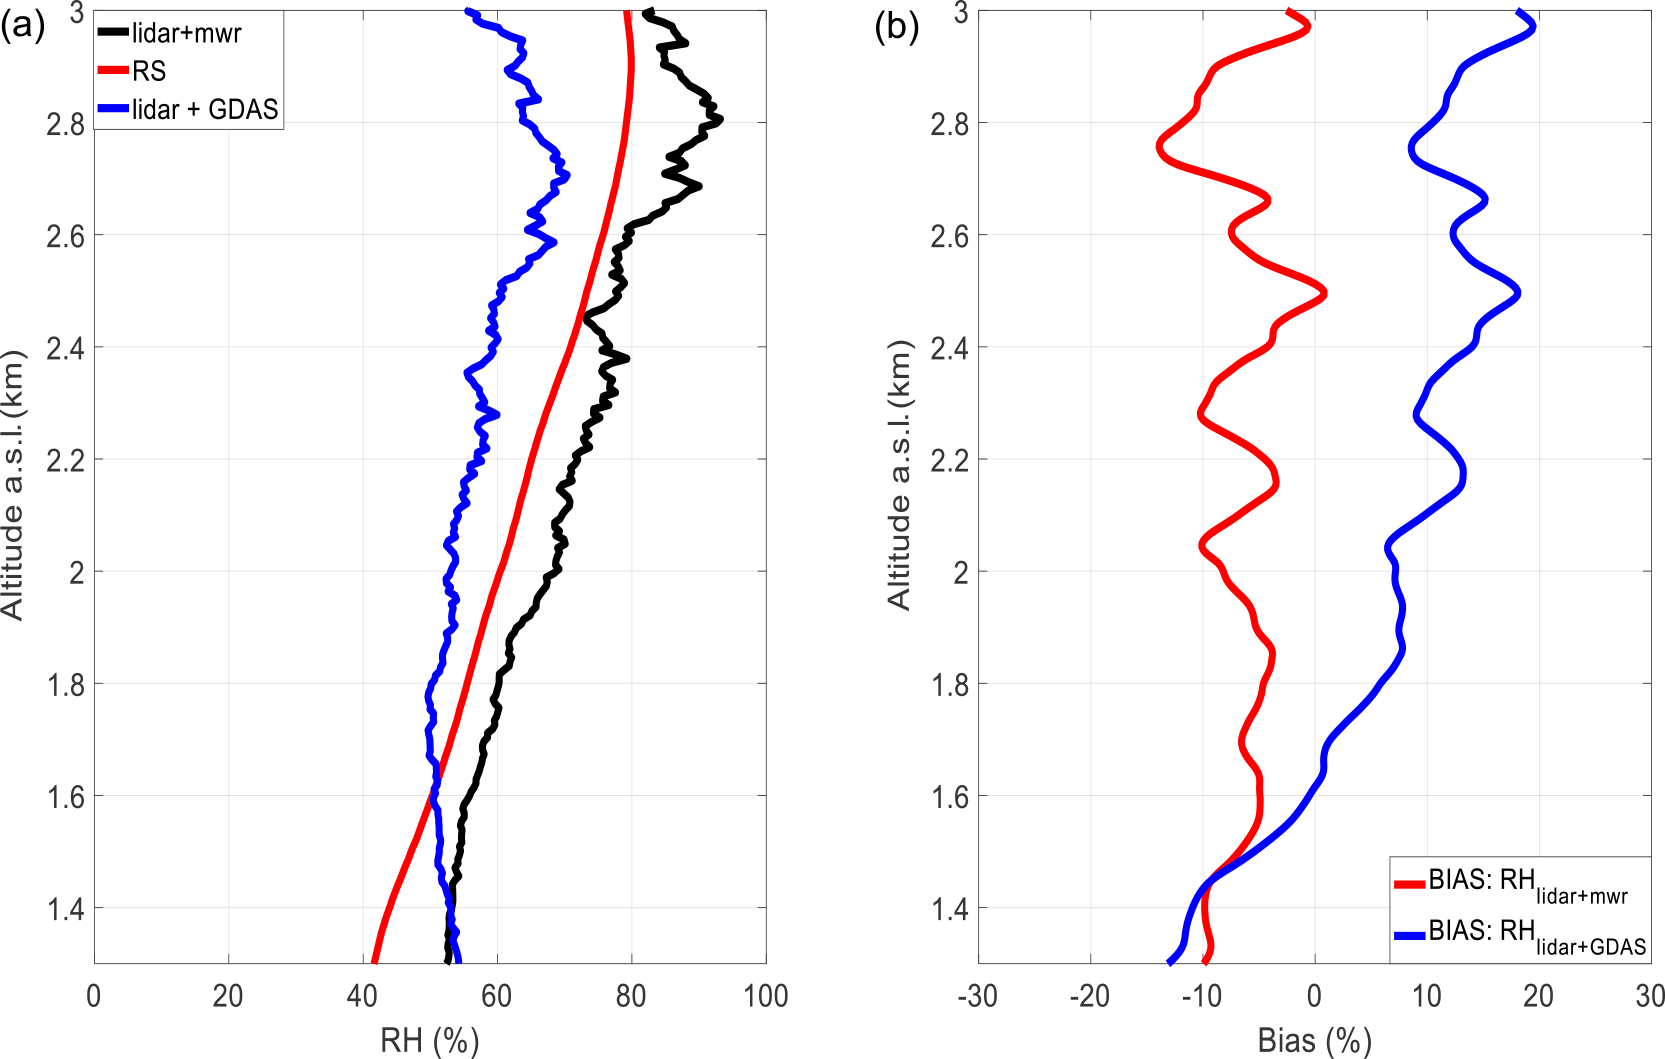
Figure 2RH comparison for 22 July 2013 around 20:00–21:00 UTC. (a) RH profiles retrieved from a combination of lidar + MWR (black line), lidar + GDAS (blue line), and RS (red line); and (b) bias calculation between lidar + MWR (red line) and lidar + GDAS (blue line).
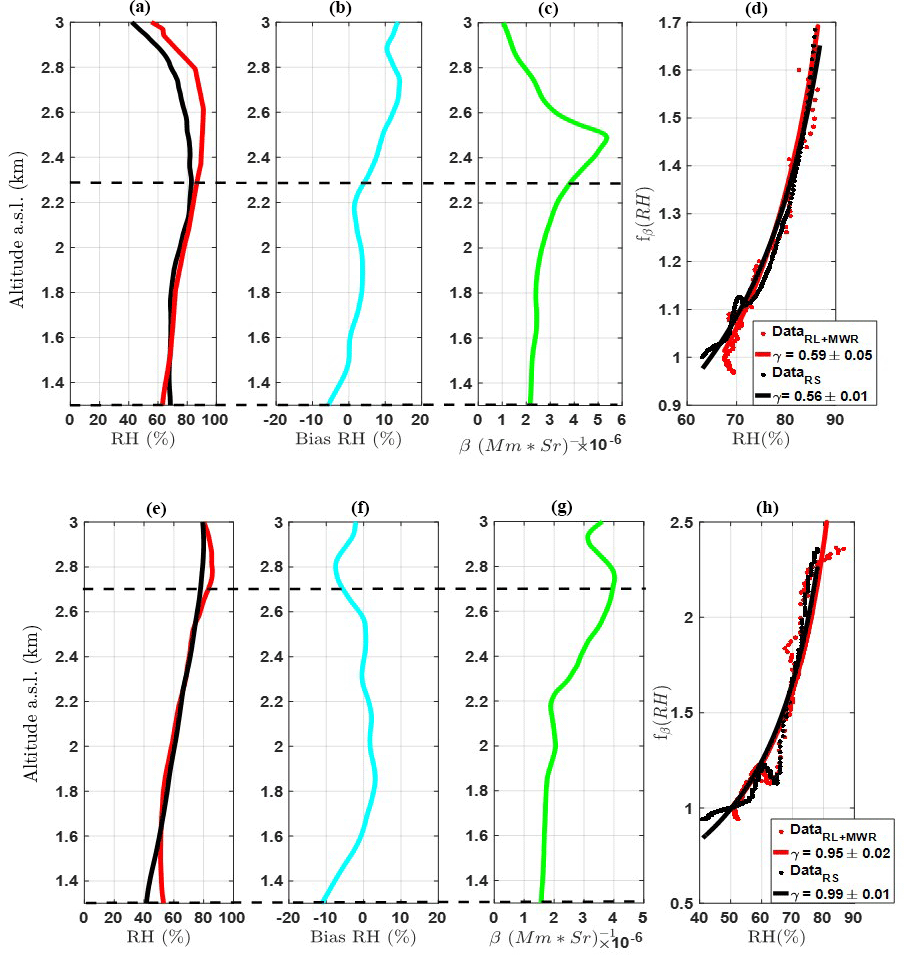
Figure 3(a, e) Profiles of RH retrieved from RS (black line) and by the synergy RL + MWR (red line), (b, f) RH bias profiles (cyan line), (c, g) βpar retrieved by using the Klett–Fernald algorithm and lidar ratio of 65 Sr (green line), and (d, f) fβ (RH) calculated for RS (black dots) and by the synergy RL + MWR (red dots) and the corresponding Hänel parameterizations (solid lines), where the red line refers to the RL + MWR method (case I: , case II: ) and the black line refers to the RS method (case I: , case II: ). The top row corresponds to case I (22 July 2011, 20:30–21:00 UTC) and the bottom row to case II (22 July 2013, 20:00–20:30 UTC). Horizontal dashed lines indicate the altitude range analyzed for each case (1.3 to 2.3 km for case I and 1.3 to 2.7 km for case II). All these profiles were measured at the EARLINET IISTA-CEAMA station.
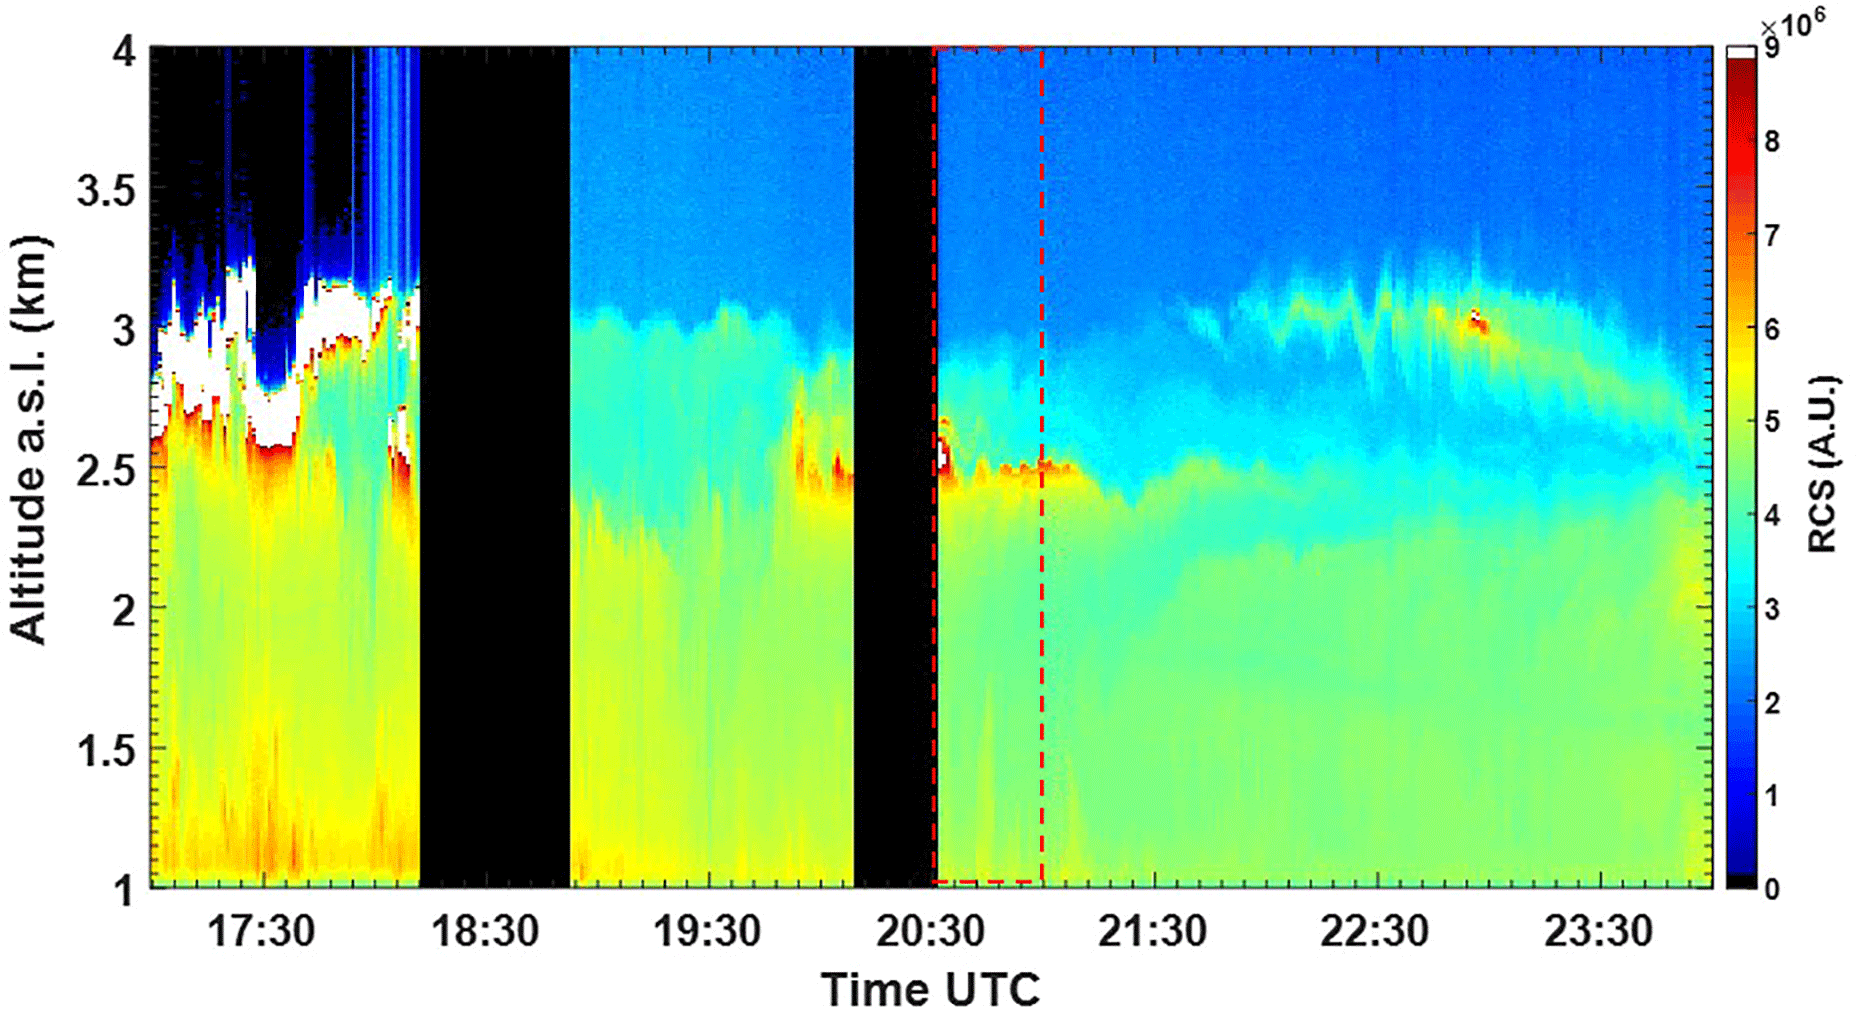
Figure 4EARLINET IISTA-CEAMA lidar RCS time series at 532 nm, 16 June 2016 (17:00 to 00:00 UTC). The sunset estimated for this day was at 21:30 UTC local time.
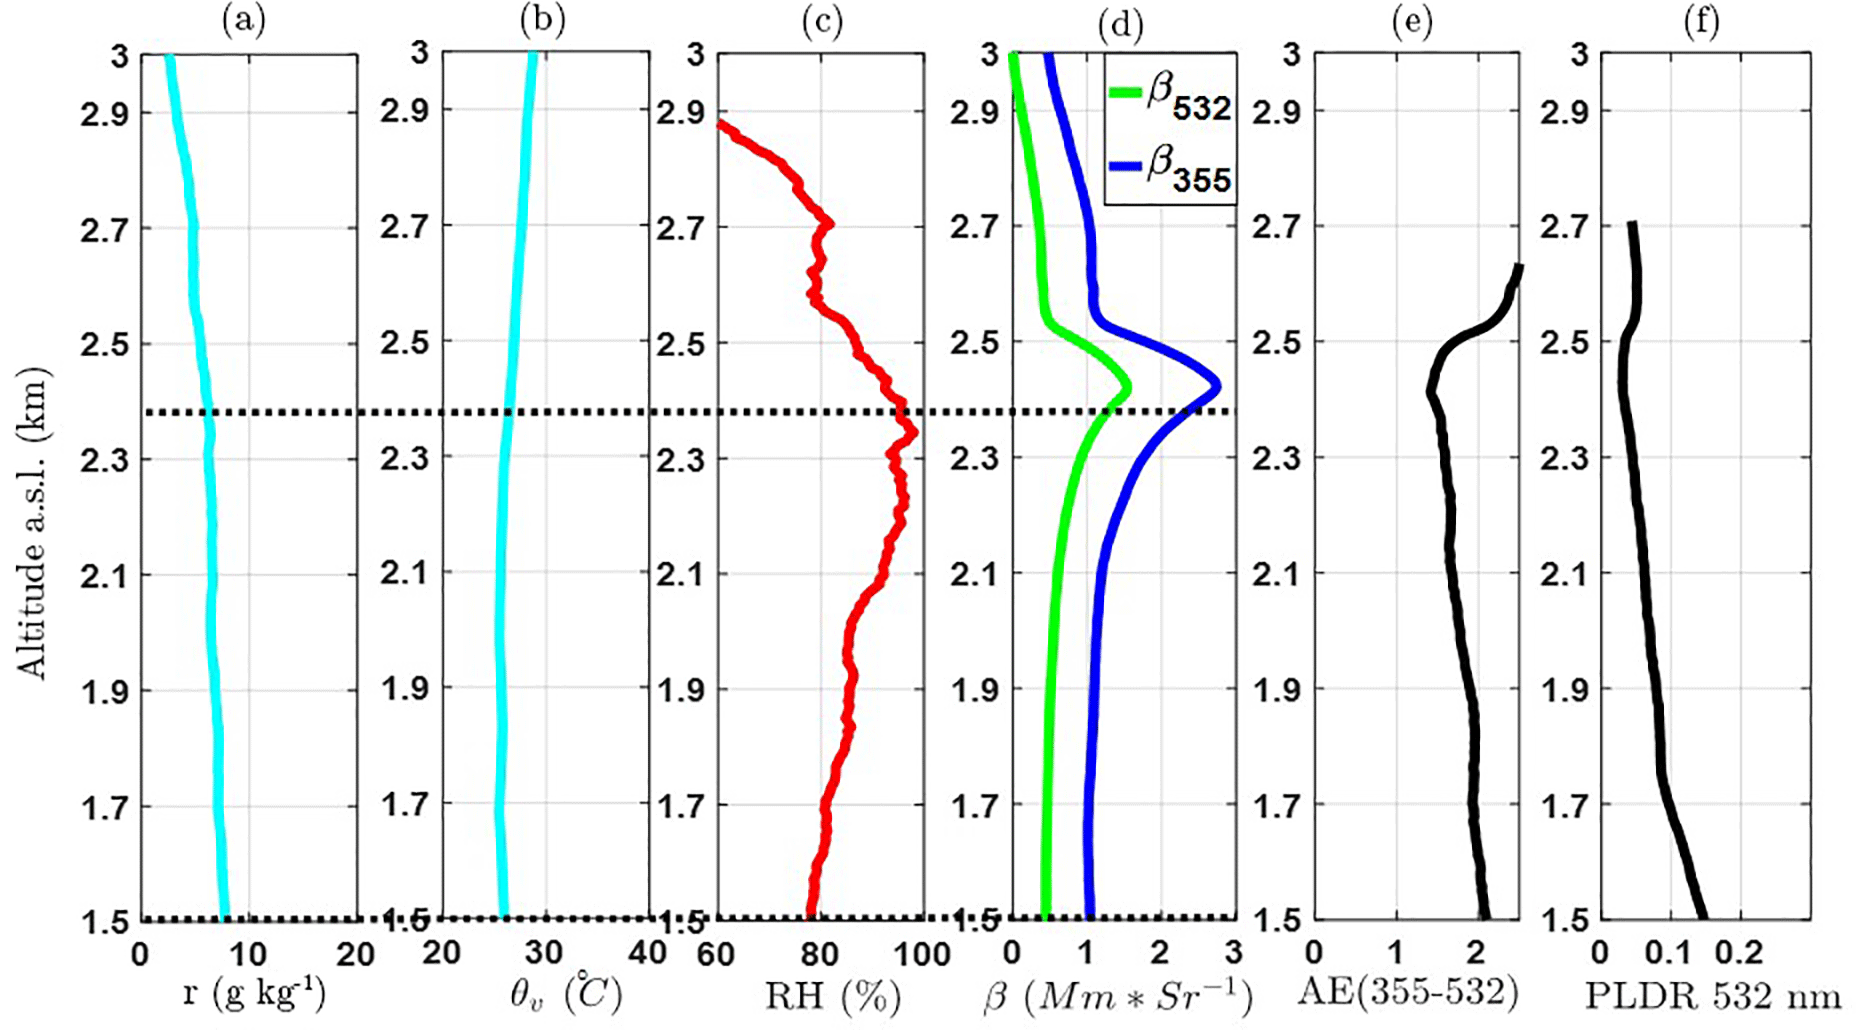
Figure 5(a) Water vapor mixing ratio; (b) virtual potential temperature; (c) relative humidity obtained from synergy RL + MWR; (d) particle backscatter coefficient at 355 and 532 nm; (e) backscatter-related Ångström exponent (355–532 nm); and (f) particle linear depolarization ratio. All profiles correspond to a 30 min average from 20:30 to 21:00 UTC on 16 June 2016 at the EARLINET IISTA-CEAMA station.
Hygroscopic growth was also accounted for by considering the aerosol chemical composition measured with the ACSM and the eBC mass concentrations measured with the Aethalometer. For this, we used the individual growth factor g(RH) as reported in Table 1. These g(RH) were extrapolated to different RH using Eq. (3) from Gysel et al. (2009), which uses the κ-model introduced by Petters and Kreidenweis (2007). A mean g(RH) is then calculated with the Zdanovskii–Stokes–Robinson relationship (Stokes and Robinson, 1966) from the g(RH) of the individual components of the aerosol and their respective volume fractions. For the wet refractive index, a volume weighting between the refractive indices of the dry aerosol and water was used (Hale and Querry, 1973).
4.1 Combination of the RL and MWR method for retrieving RH profiles
The synergetic method proposed by Navas-Guzmán et al. (2014) for retrieving RH profiles is used here for the first time to study aerosol hygroscopic growth. In this section, two particular cases (case I on 22 July 2011 at 20:00–20:30 UTC and case II on 22 July 2013 at 20:30–21:00 UTC) are analyzed with this new methodology. These two cases were already presented in Granados-Muñoz et al. (2015) using the classical approach that combines RH profiles obtained from RS and the lidar aerosol properties. Results obtained here are compared with those in Granados-Muñoz et al. (2015) in order to evaluate the synergetic method proposed here.
In this work, we have also checked the RH calculation (see Eq. 1) for the case of 22 June 2013 by using temperature profiles from MWR and GDAS modeled data which were compared to RS RH profiles. This comparison allows us to investigate the feasibility of the use of GDAS temperature information to compute the RH profiles in combination with RL profiles, in order to increase the database for hygroscopicity studies. However, the results present larger bias when they are compared with the RS HR profiles, up to 20 % for RHLIDAR+GDAS in almost the whole profile instead of the 10 % for the RHLIDAR+MWR (Fig. 2). Thus, the use of GDAS data seems not to be appropriate in this study, mainly for two reasons: (i) the complex terrain where the measurement station is located, surrounded by mountains of high elevation (up to more than 3000 m a.s.l. in a very short horizontal distance of a few tenths of kilometers) that makes it more difficult for models to provide accurate thermodynamics profiles for this location; (ii) GDAS profiles have a lower temporal resolution (3 h) than the MWR, which gives temperature profiles every 2 min.
Figure 3 shows, from left to right, the RH profiles obtained from both the RS (black line) and the synergy RL + MWR (red line), the bias between both profiles (RHRS–RHRL+MWR), and β532 nm profiles retrieved from the lidar system and fβ(RH). The upper panels correspond to case I on 22 July 2011 and the bottom panels to case II on 22 July 2013. Horizontal dashed lines mark the region of interest analyzed for each case, ranging from 1.3 to 2.3 km a.s.l. for case I and 1.3 to 2.7 km a.s.l. for case II.
RH profiles (Fig. 3a and e, red line) calculated by the combination between the RL calibrated r (z) profile and MWR temperature profiles were obtained following the methodology presented in Sect. 3.1 by using Eq. (3) (Navas-Guzmán et al., 2014). Good agreement is observed, with biases (Fig. 3b and f) lower than 10 % within the analyzed region. The differences obtained in the RH profiles might be associated with the discrepancies between the temperature profiles from MWR and RS, due to the lower vertical resolution of the MWR. Additionally, discrepancies are also expected because of the radiosonde drift and the different temporal sampling (the lidar data correspond to a 30 min average, whereas the RS provides instantaneous values that build the profile in the region of interest in less than 5 min).
The discrepancies between the two RH profiles are especially relevant in the lower part of the analyzed data since differences in RH in this region lead to variations in RHref. For case I, RHref=60 % for RS and RHref= 68 % for the RL + MWR combination, whereas for case II, RHref=40 % for RS and RHref=50 % for the RL + MWR methodology. Additionally, the RH discrepancies in the upper region of the profiles (from 2.1 to 2.3 km a.s.l. for case I and from 2.6 to 2.7 km a.s.l. for case II), which can reach up to 5 %, are also relevant since they are associated with the maximum values of RH and may modify the data tendency on Hänel's parameterization, leading to variations in γ(λ) depending on the methodology used for the retrieval of RH. Despite these discrepancies, the differences between γ(λ) parameters obtained from both methodologies are low (Table 2). In case I, obtained from RL + MWR is larger than that obtained from RS (), while in case II the γ obtained with RH from RS ( is larger than the one from RL + MWR (). We have to keep in mind that uncertainties reported on γ are obtained by the polynomial fitting, and they do not include the propagation error result. The relative differences in both cases are below 5 %, which is relatively good compared to the expected uncertainties reported in Titos et al. (2016) and considering the differences between the two methodologies.
The obtained values of fβ (85 %) using both methodologies are presented in Table 2. For case I, fβ (85 %) = 1.50 for RS and fβ (85 %) = 1.46 for RL + MWR, with a relative difference below 3 %. For case II, fβ (85 %) = 2.6 for RS and fβ (85 %) = 2.3 for RL + MWR, showing a relative difference of 11 %. Even though the relative difference is larger for case II, for both cases the discrepancies lie within the uncertainty associated with the calculation of fβ (85 %), which is around 20 % according to Titos et al. (2016). Thus, the RL + MWR methodology presented by Navas-Guzmán et al. (2014) to obtain RH profiles in a continuous time base is a promising technique for hygroscopic growth studies. This methodology will allow for expanding the RH profile database, and it opens new opportunities for the detection of hygroscopic cases during nighttime periods.
4.2 Hygroscopic study during SLOPE I
4.2.1 Conditions for hygroscopic growth
Aerosol hygroscopic growth was observed during the SLOPE I campaign in 2016 by combining the remote sensing instruments and the RS. Figure 4 shows the time series of the range corrected signal (RCS) at 532 nm derived by the EARLINET lidar system at IISTA-CEAMA station on 16 June 2016. The presence of clouds is observed in the late afternoon (∼3.0 km a.s.l.) before 19:00 UTC, with clouds vanishing after that during the remaining measurement period. The red lines in Fig. 3 mark the 30 min set of profiles (from 20:30 to 21:00 UTC) where an intensification of the RCS is observed at 2.5 km a.s.l, which could be an indication of potential aerosol hygroscopic growth.
Table 2Results obtained for each case analyzed by means of the new methodology combining RL + MWR and the classical approach using RS data.
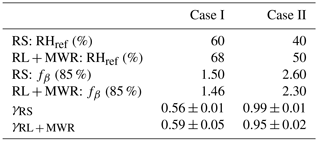
Figure 5 shows profiles of r (z), θv, RH, βpar at 355 and 532 nm, the backscatter-related Ångström exponent between 355 and 532 nm (AE355−532), and PLDR532 (particle linear depolarization ratio at 532 nm) obtained on 16 June 2016 between 20:30 and 21:00 UTC. As we mentioned in Sect. 3.2, for aerosol hygroscopicity analysis it must be ensured that ranges where RH increases correspond to an increase in βpar, which is well seen along the layer between 1.5 and 2.4 km a.s.l. (see Fig. 5). The RH profile was calculated by using the method combining RL + MWR. In this case, the calibration constant for the RL r (z) profile was calculated using the six RSs launched at nighttime during this campaign. A calibration constant of 110±2 g kg−1 was obtained as the mean value of the different calibrations.
In order to fulfill all the requirements discussed in Sects. 3.2 and 3.3 for hygroscopic growth studies, together with the RH and βpar increase within the layer, atmospheric stability must be ensured through the evaluation of thermodynamic variables such as θv and r (z). Here, r (z) shows relatively low vertical variation within the region of interest (1.5 to 2.4 km a.s.l.), decreasing monotonically with altitude at a rate of (Fig. 5a), and θv shows a monotonic increase at a rate of within the same region.
AE355−532 and PLDR532 were also retrieved in order to describe the mean size and shape of the aerosol particles. For this case, we observe a decrease in both parameters in the region of interest. A decrease in AE355−532 nm (∼ 0.4 km−1) means an increase in the predominance of larger particles, and a decrease in the PLDR532 nm (∼ 0.13 km−1) is related to particles becoming more spherical. This correlation between AE355−532 and PLDR has been observed in previous studies associated with hygroscopic growth (Granados-Muñoz et al., 2015; Haarig et al., 2017).
In order to determine the origin of the aerosol particles over the analyzed layer, we present a horizontal wind speed and direction and vertical wind analysis from Doppler lidar data. The 10 min resolved horizontal wind direction time series (Fig. 6b) indicate that from 18:00 to 21:00 UTC the wind over IISTA-CEAMA station mainly came from the northwest, within the region of interest (1.5 to 2.4 km a.s.l.) with relative low horizontal wind velocity (up to 6 m s−1) (Fig. 6a), which means that aerosol particles were being transported from the same direction, likely coming from the same source, at relatively low horizontal velocity.
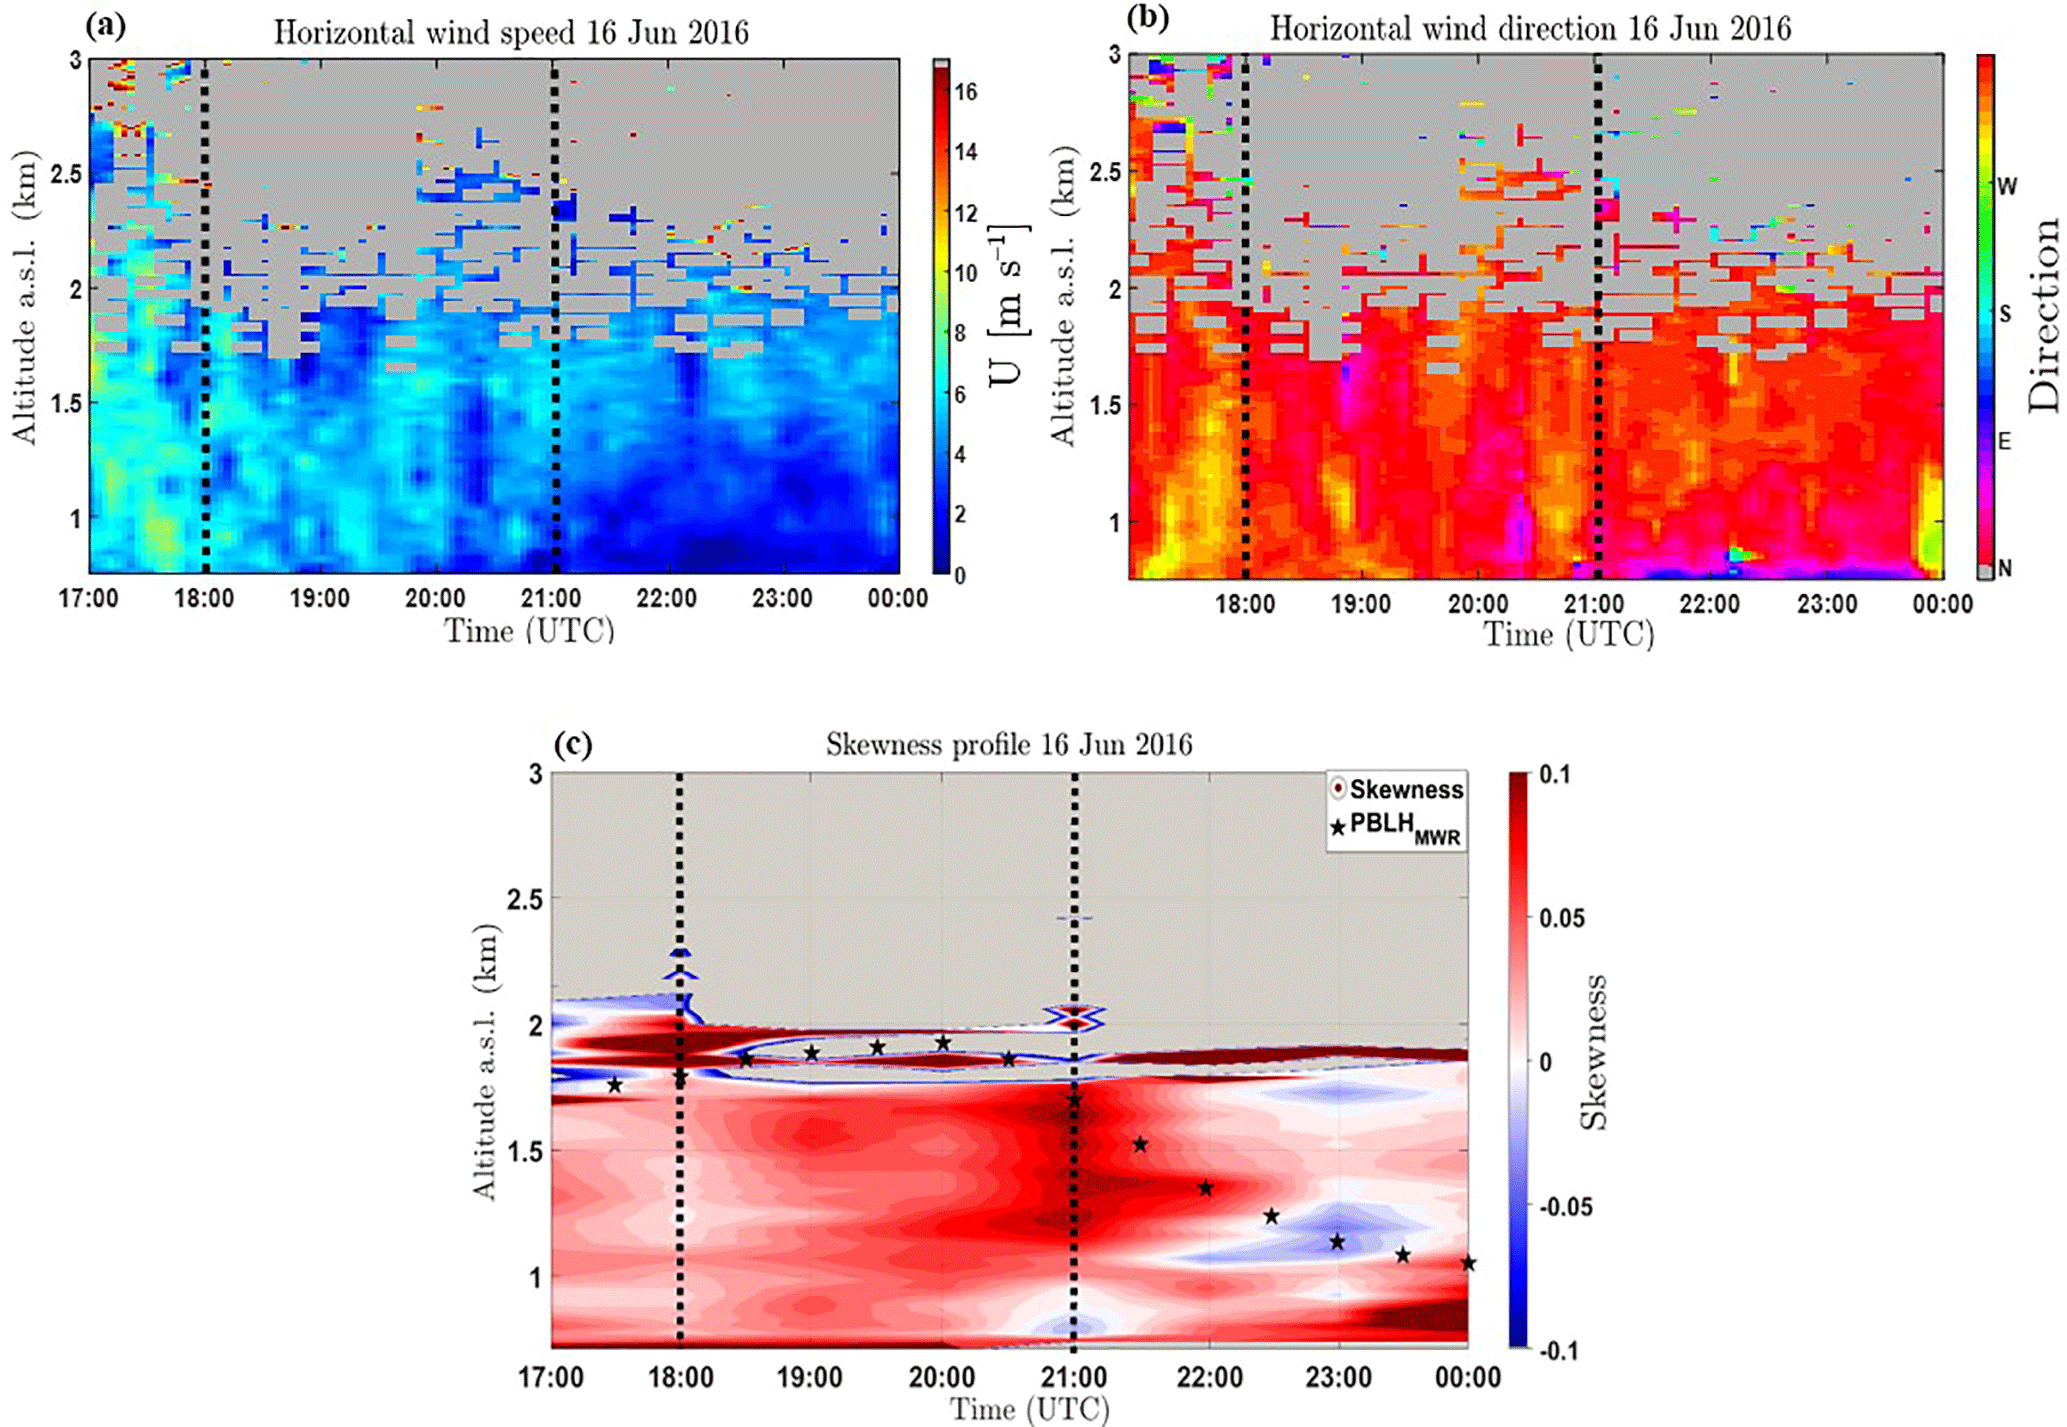
Figure 6Time series of (a) horizontal wind velocity, (b) horizontal wind direction, and (c) skewness retrieved from Doppler turbulence calculations for 16 June 2016 at 20:30 to 21:00 UTC. The PBLH retrieved from MWR is presented in black stars.
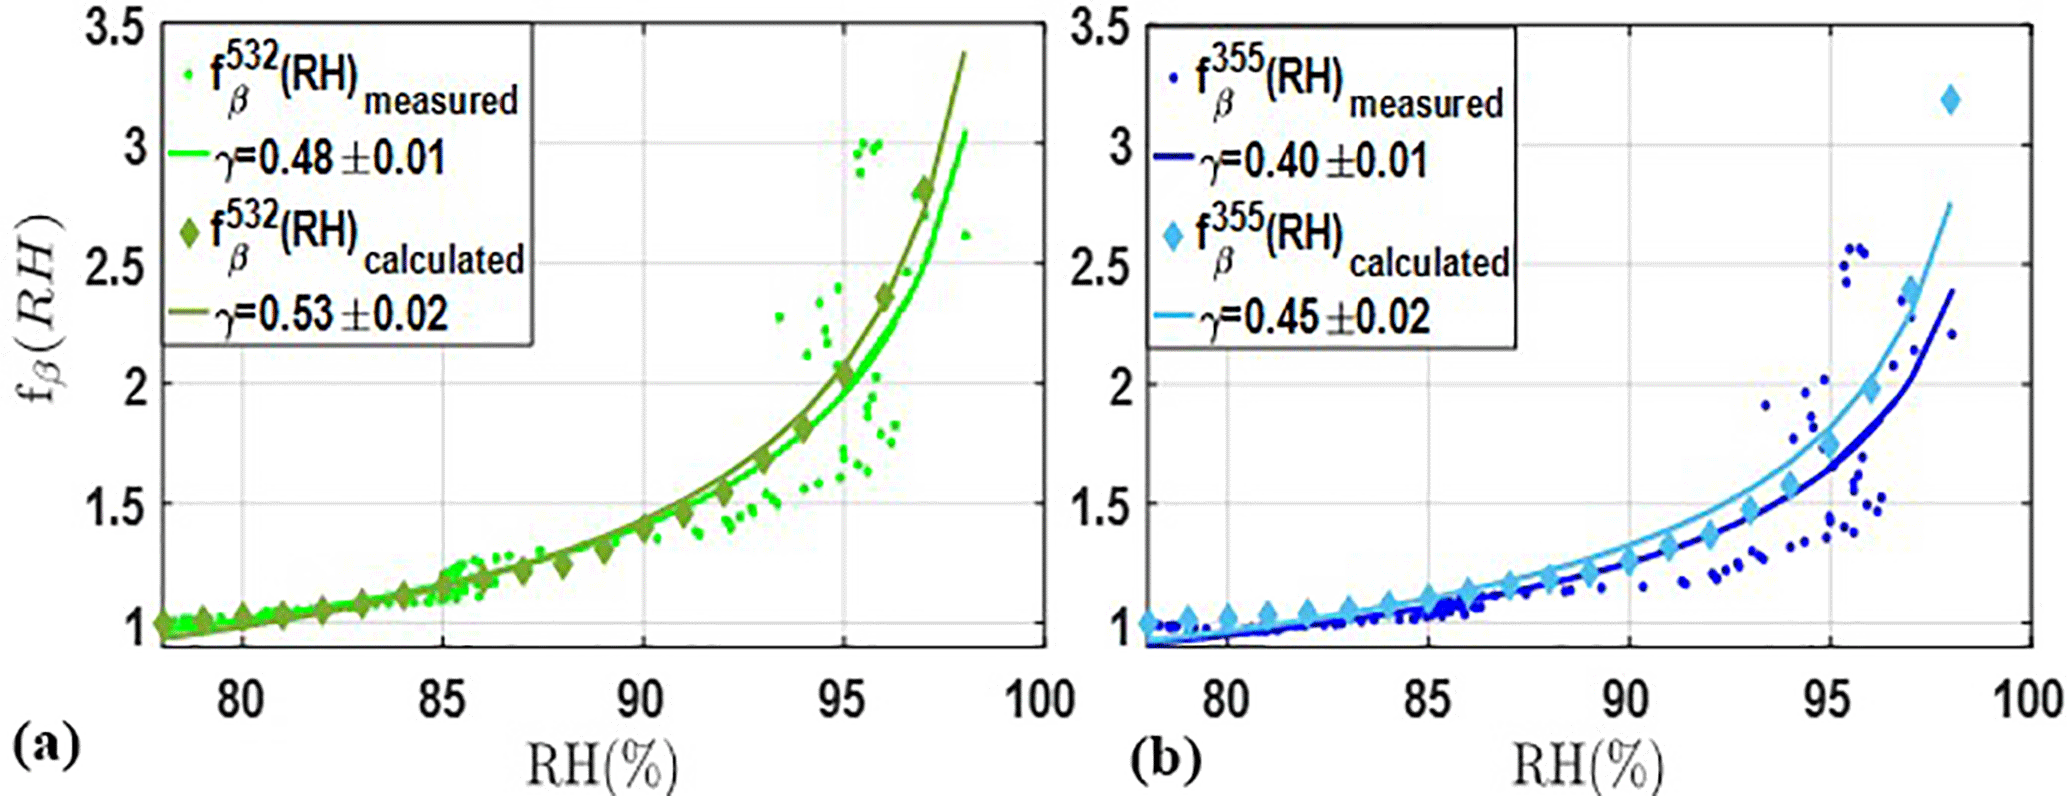
Figure 7Humidograms calculated (a) at 532 nm and (b) at 355 nm, within the 1.5 to 2.4 km a.s.l. aerosol layer from the RL + MWR measurements and calculated using Mie theory and measured chemical composition and size distribution at 2.5 km a.s.l. RHref = 78 % was used for both methods.
A turbulence analysis was also performed to reinforce the fact that vertical fluxes within the aerosol column are associated with increases in RCS observed in Fig. 4. The aerosol RCS increases in a region where RH increases, as we see in Fig. 5; thus, we associate these increases in RCS with water uptake by aerosols inside this atmospheric column. The vertical wind velocity can be statistically studied to obtain the higher moments of the velocity distribution (O'Connor et al., 2010; de Arruda Moreira et al., 2018). This statistical analysis is deeply developed for turbulence studies. Here the third moment of the frequency distribution (skewness) (Fig. 6c) represents the direction of the convection (positive skewness is associated with predominance of upward wind velocity, whereas negative skewness means predominance of downward wind) in the region of interest. Supporting this analysis, the black stars represent the calculation of the atmospheric boundary layer height (PBLH, Fig. 6c) obtained from the MWR data by using the combination of parcel and gradient methods in convective and stable atmospheric conditions (Holzworth, 1964; Moreira et al., 2018). In this case, close to 21:00 UTC (Fig. 6c), the particles tend to ascend into the column, as indicated by positive values reached in the skewness linked with highly convective movement. The PBLH reaches its maximum at 15:00 UTC (2.5 km a.s.l.), but after 16:00 UTC the weakening of convection tends to decrease the ABLH, keeping the ABLH around 2 km a.s.l. until 21:00 UTC. All this wind information might be interpreted as transported particles coming from the same direction at relatively low horizontal velocities, suggesting that the aerosol source is not changing and that new aerosol particles are not being advected into the studied layer. The turbulence analysis allows us to support vertical wind movement within the layer of interest driving well-mixed processes during the analyzed time interval.
The 6-day backward trajectories were calculated at three different heights (0.9, 1.5, and 1.9 km a.g.l.), which were selected within the region of interest in order to guarantee the height independency of the air masses' pathway. The three air masses came from North America, crossing the Atlantic Ocean, reaching the continental platform through Portugal, and then advected to Granada, reaching the station at 21:00 UTC (not shown here). This information supports the horizontal wind analysis performed before.
4.2.2 (RH) measured and retrieved by combining in situ data and Mie theory
The humidogram presented in Fig. 6 shows the measured (RH) at 355 and 532 nm as a function of RH between 1.5 and 2.4 km a.s.l., retrieved by using the lidar data. The calculated (RH) was obtained by using the measured chemical composition and size distribution at SNS station (2.5 km a.s.l.) as inputs to the Mie model (see Table 1 and Fig. 7). The humidogram exhibits a monotonic positive increase at both wavelengths, for RH between 78 and 98 %. The RHref=78 % was selected as the lowest RH value into the evaluated column, and this same RH was used as a reference for the Mie calculation in order to make both calculations comparable.
During the hygroscopic growth event at SNS, the mean aerosol particle number size distribution shows two main peaks at around 35 and 115 nm, with most of the aerosol in fine mode (<1µm). The sub-micron mass concentration measured with ACSM indicates a high concentration of organic particles during daytime (from 12:00 to 17:00 UTC), with values around 7 µg m−3 at 15:00 UTC. OA concentrations decreased slowly to values around 3.0 µg m−3 at 00:00 UTC. In particular, during the hygroscopic growth case under study (from 20:00 to 21:00 UTC) the aerosol composition was mainly made up of organic particles (62 %), followed by sulfate (24 %), nitrate (10 %), ammonia (2 %), and black carbon (2 %). Thus, the predominant aerosol studied during the event is a combination of smoke and urban polluted aerosol. This assumption about the aerosol type is supported by the relatively high sulfate concentration observed at SNS and the results discussed in Sect. 4.2.1 (lidar properties and backward trajectory analyses). This chemical composition with a high predominance of organic particles is consistent with the γ values obtained with the RL + MWR method. Fernández et al. (2015) reported a similar γ532 value of 0.59 in Cabauw (Netherlands) associated with a high concentration of organic particles, while they observed a significantly larger γ532 of 0.88 associated with marine particles. Lower values are reported by Lv et al. (2017) in one of their case studies (γ532=0.24 and γ355=0.12) in Xinzhou (China) associated with the presence of dust particles. Although the behavior of the backscatter coefficient at enhanced RH is expected to differ from the scattering coefficient, a qualitative comparison can be performed due to the scarcity of backscatter-related γ values in the literature. For example, using in situ techniques, Zieger et al. (2015) reported a low scattering enhancement of boreal aerosol in Hyytiälä (Finland) (γ525=0.25) related to the high contribution of organic aerosols at this site that contribute to decreasing the hygroscopic enhancement. At Cape Cod (USA), Titos et al. (2014) reported significantly lower γ values for polluted aerosols () compared with marine aerosols ().
Calculated and measured values of (RH) are compared in Table 3 and Fig. 7. In general, there is a good agreement between measured and calculated hygroscopicity parameters. For both wavelengths, slightly higher values are predicted by the model compared with the measurements, especially at RH > 90 %, where the differences are higher than at RH < 90 %. The values retrieved from the RL measurements are and , and with Mie theory they are and . The good agreement found in this analysis is confirmed by the low relative differences observed (lower than 4 %). The hygroscopic growth parameter (γ) also shows good agreement between the measured ( and and calculated ones using Mie theory ( and , with relative differences of 9 % at 532 nm and 11 % at 355 nm. The good agreement between the measured and theoretical backscatter enhancement factors shows the robustness of the proposed method for hygroscopic studies in a systematic manner.
The principal sources of error in the comparison between calculated and measured data are associated with the method for the retrieval of RH profiles, as well as the errors associated with theoretical Mie calculation mainly by the assumption of g(RH) based on the chemical composition. Finally, the horizontal distance between stations could also lead to differences in the comparison. The uncertainties affecting our study are the result of the contributions of the particle backscatter uncertainties and experimental uncertainties associated with determination of the backscatter enhancement factor; thus, further studies should center their efforts on this research field to constrain the range of uncertainty.
Table 3Results obtained for the hygroscopic case on 16 June 2016, evaluated with RL (IISTA-CEAMA station) and in situ (SNS) stations.
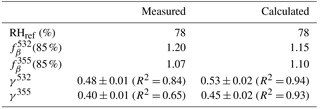
In addition, the multi-wavelength results lead us to see a clear spectral dependence on γ(λ). The efficiency due to changes in (RH) associated with βpar is stronger at 532 than at 355 nm, finding that . This is also seen in the gamma parameter , with correlations of 0.84 and 0.65, respectively). This spectral dependency has also been reported in Kotchenruther et al. (1999) for in situ measurements at 450, 550, and 700 nm, obtaining increasing enhancement factors with wavelength, and in Zieger et al. (2013), where the same behavior is observed for marine aerosols. As is reported in Haarig et al. (2017), the enhancement factor dependency with wavelength suggests that larger wavelengths have an enhancement factor larger than short ones, which in fact was also evidenced in this work.
The methodology proposed for calculating RH profiles by combining calibrated r (z) from RL and temperature profiles from MWR has been used in this work to study aerosol hygroscopicity. With this method, a way to retrieve RH profiles without the necessity for co-located RS is presented at IISTA-CEAMA station. In order to validate this methodology, hygroscopic growth cases which use RS data were selected. The relative differences in the (RH) obtained using the RH profiles from the RS and from the combination of RL and MWR measurements were calculated, finding relative differences below 11 % in fβ(85 %). The relative differences in γ were below 5 %, supporting the fact that this methodology is valid for aerosol hygroscopicity studies.
Aerosol hygroscopic growth observed during the SLOPE I field campaign (16 June 2016, 20:30 to 21:00 UTC) was studied by means of a particle backscatter coefficient retrieved from the EARLINET multi-wavelength RL, backscatter-related Ångström exponent (AE355−532), and particle linear depolarization ratio (PLDR532) as optical properties and the combined RL + MWR RH profiles. Stability analysis confirmed good mixing conditions in the atmospheric layer studied. In addition, Doppler wind lidar data analysis allowed us to evaluate the vertical profiles of horizontal wind velocity and direction. Thus, we concluded that particles came mainly from the northwestern region of Granada at low velocities. Furthermore, the skewness analysis let us infer that particles presented an upward movement during the 30 min evaluated period within the column of interest. These results were confirmed by ABLH calculations from MWR data. From the experimental data from RL, values of and at RHref =78 % were obtained within the evaluated column, and also 0.84) and 0.65), which were in agreement with the literature.
For the case study during SLOPE I the results were validated against Mie simulations with experimental data from SNS data, obtaining a good agreement between the values retrieved with RL ( and and Mie theory ( and , reaching relative differences lower than 4 % when taking the calculated data as a reference. We also found good agreement between the measured hygroscopic growth parameter (γ) ( and and the calculated one ( and , with relative differences of up to 9 % at 532 nm and 11 % at 355 nm, taking the calculated data as a reference. These results show that under favorable atmospheric conditions (vertical homogeneity, consistent aerosol sources, and low horizontal velocity within the analyzed layer) and in the absence of advected air masses into the evaluated column, the hygroscopic behavior of the particles evaluated by remote sensing at IISTA-CEAMA station is in accordance with that evaluated for those particles transported to SNS.
The results obtained here show the potentiality of combining r (z) from RL and temperature from MWR to retrieve RH profiles with high temporal/spatial resolution to analyze aerosol hygroscopic growth. These results will allow us to expand the database of hygroscopic growth cases studied with remote sensing techniques. With the proposed procedure the aerosol properties and RH are obtained within the same atmospheric column, as opposed to the cases when the thermodynamic profiles are retrieved from RS.
All datasets used in this paper are available upon request to the corresponding author.
The authors declare that they have no conflict of interest.
This article is part of the special issue “EARLINET aerosol profiling: contributions to atmospheric and climate research”. It is not associated with a conference.
This work was supported by the Andalusia Regional Government through project
P12-RNM-2409; by the Spanish Ministry of Economy and Competitiveness through
projects CGL2013-45410-R and CGL2016-81092-R, the excelence network
CGL2017-90884-REDT, the FPI grant (BES-2014-068893), and the Juan de la
Cierva grants FJCI-2014-22052 and FJCI-2014-20819; by the University of
Granada trough the Plan Propio Program P9 Call-2013 contract. Andrés
Bedoya has been supported by a grant for PhD studies in Colombia, COLCIENCIAS
(Doctorado Nacional – 647), associated with the Physics Sciences program at
the Universidad Nacional de Colombia, Sede Medellín and Asociación
Universitaria Iberoamericana de Postgrado (AUIP). The study has also been
supported by the Swiss National Science Foundation trough project
PZ00P2_168114. Financial support for EARLINET was through the ACTRIS
Research Infrastructure Project EU H2020 (Grant agreement no. 654109),
particularly trough the TNA GRA-3 HYGROLIRA. We thank the AERO group from
ESRL-GMD at NOAA for providing the CPD software used for routine measurements
at the SNS, and for their technical support. The authors gratefully
acknowledge the FEDER program for the instrumentation used in this
work.
Edited by: Matthias
Tesche
Reviewed by: two anonymous referees
Adam, M., Putaud, J. P., Martins dos Santos, S., Dell'Acqua, A., and Gruening, C.: Aerosol hygroscopicity at a regional background site (Ispra) in Northern Italy, Atmos. Chem. Phys., 12, 5703–5717, https://doi.org/10.5194/acp-12-5703-2012, 2012.
Alados-Arboledas, L., Müller, D., Guerrero-Rascado, J., Navas-Guzmán, F., Pérez-Ramírez, D., and Olmo, F.: Optical and microphysical properties of fresh biomass burning aerosol retrieved by Raman lidar, and star-and sun-photometry, Geophys. Res. Lett. 38, L01807, https://doi.org/10.1029/2010GL045999, 2011.
Albrecht, B. A.: Aerosols, Cloud Microphysics, and Fractional Cloudiness, Science, 245, 1227–1230, 1989.
Alfarra, M. R., Paulsen, D., Gysel, M., Garforth, A. A., Dommen, J., Prévôt, A. S. H., Worsnop, D. R., Baltensperger, U., and Coe, H.: A mass spectrometric study of secondary organic aerosols formed from the photooxidation of anthropogenic and biogenic precursors in a reaction chamber, Atmos. Chem. Phys., 6, 5279–5293, https://doi.org/10.5194/acp-6-5279-2006, 2006.
Baron, P. A. and Willeke, K.: Aerosol Measurement: Principles, Techniques and Applications, John Wiley & Sons: New York, NY, 883 pp., 2001.
Barrera-Verdejo, M., Crewell, S., Löhnert, U., Orlandi, E., and Di Girolamo, P.: Ground-based lidar and microwave radiometry synergy for high vertical resolution absolute humidity profiling, Atmos. Meas. Tech., 9, 4013–4028, https://doi.org/10.5194/amt-9-4013-2016, 2016.
Bedoya-Velásquez, A. E., Navas-Guzman, F., Guerrero-Rascado, J. L., and Alados-Arboledas, L.: Validation and statistical analysis of temperature, humidity profiles and Integrated Water Vapour (IWV) from microwave measurements over Granada (Spain), Geophys. Res. Abstr., Vol. 19, EGU2017-A-10312, EGU General Assembly 2017, Vienna, Austria, 2017
Benavent-Oltra, J. A., Román, R., Granados-Muñoz, M. J., Pérez-Ramírez, D., Ortiz-Amezcua, P., Denjean, C., Lopatin, A., Lyamani, H., Torres, B., Guerrero-Rascado, J. L., Fuertes, D., Dubovik, O., Chaikovsky, A., Olmo, F. J., Mallet, M., and Alados-Arboledas, L.: Comparative assessment of GRASP algorithm for a dust event over Granada (Spain) during ChArMEx-ADRIMED 2013 campaign, Atmos. Meas. Tech., 10, 4439–4457, https://doi.org/10.5194/amt-10-4439-2017, 2017.
Bohren, C. and Huffmann, D.: Absorption and Scattering of Light by Small Particles, Wiley-VCH, New York, USA, 544 pp., 2004.
Boucher, O., Randall, D., Artaxo, P., Bretherton, C., Feingold, G., Forster, P., Kerminen, V.-M., Kondo, Y., Liao, H., Lohmann, U., Rasch, P., Satheesh, S. K., Sherwood, S., Stevens, B., and Zhang, X. Y.: Clouds and Aerosols, in: Climate Change 2013: The Physical Science Basis. Contribution of Working Group I to the Fifth Assessment Report of the Intergovernmental Panel on Climate Change, edited by: Stocker, T. F., Qin, D., Plattner, G.-K., Tignor, M., Allen, S. K., Boschung, J., Nauels, A., Xia, Y., Bex, V., and Midgley, P. M., Cambridge University Press, Cambridge, UK and New York, NY, USA, 2013.
Caumont, O., Cimini, D., Löhnert, U., Alados-Arboledas, L., Bleisch, R., Buffa, F., Ferrario, M. E., Haefele, A., Huet, T., Madonna, F., and Pace, G.: Assimilation of humidity and temperature observations retrieved from ground-based microwave radiometers into a convective-scale NWP model, Q. J. Roy. Meteorol. Soc., 142, 2692–2704, https://doi.org/10.1002/qj.2860, 2016.
Cazorla, A., Casquero-Vera, J. A., Román, R., Guerrero-Rascado, J. L., Toledano, C., Cachorro, V. E., Orza, J. A. G., Cancillo, M. L., Serrano, A., Titos, G., Pandolfi, M., Alastuey, A., Hanrieder, N., and Alados-Arboledas, L.: Near-real-time processing of a ceilometer network assisted with sun-photometer data: monitoring a dust outbreak over the Iberian Peninsula, Atmos. Chem. Phys., 17, 11861–11876, https://doi.org/10.5194/acp-17-11861-2017, 2017.
Córdoba-Jabonero, C., Sorribas, M., Guerrero-Rascado, J. L., Adame, J. A., Hernández, Y., Lyamani, H., Cachorro, V., Gil, M., Alados-Arboledas, L., Cuevas, E., and de la Morena, B.: Synergetic monitoring of Saharan dust plumes and potential impact on surface: a case study of dust transport from Canary Islands to Iberian Peninsula, Atmos. Chem. Phys., 11, 3067–3091, https://doi.org/10.5194/acp-11-3067-2011, 2011.
de Arruda Moreira, G., Guerrero-Rascado, J. L., Benavent-Oltra, J. A., Ortiz-Amezcua, P., Román, R., Esteban Bedoya-Velásquez, A., Bravo-Aranda, J. A., Olmo-Reyes, F. J., Landulfo, E., and Alados-Arboledas, L.: Analyzing the turbulence in the Planetary Boundary Layer by the synergic use of remote sensing systems: Doppler wind lidar and aerosol elastic lidar, Atmos. Chem. Phys. Discuss., https://doi.org/10.5194/acp-2018-276, in review, 2018.
Draxler, R. R. and Rolph, G. D.: HYSPLIT (HYbrid Single-Particle Lagrangian Integrated Trajectory) model, NOAA Air Resources Laboratory, Silver Spring, available at: http://ready.arl.noaa.gov/HYSPLIT.php (last access: July 2017), 2003.
Drinovec, L., Močnik, G., Zotter, P., Prévôt, A. S. H., Ruckstuhl, C., Coz, E., Rupakheti, M., Sciare, J., Müller, T., Wiedensohler, A., and Hansen, A. D. A.: The “dual-spot” Aethalometer: an improved measurement of aerosol black carbon with real-time loading compensation, Atmos. Meas. Tech., 8, 1965–1979, https://doi.org/10.5194/amt-8-1965-2015, 2015.
Feingold, G. and Morley, B.: Aerosol hygroscopic properties as measured by lidar and comparison with in situ measurements, J. Geophys. Res., 108, D11, https://doi.org/10.1029/2002JD002842, 2003.
Fernald, F. G.: Analysis of atmospheric lidar observations – Some comments, Appl. Optics, 23, 652–653, 1984.
Fernández, A. J., Apituley, A., Veselovskii, I., Suvorina, A., Henzing, J., Pujadas, M., and Artiñano., B.: Study of aerosol hygroscopic events over Cabauw experimental site for atmospheric research (CESAR) using the multi-wavelength Raman lidar Caeli, Atmos. Environ., 120, 484–498, 2015.
Ferrare, R. A., Melfi, S. H., Whiteman, D. N., Evans, K. D., and Leifer, R.: Raman lidar measurements of aerosol extinction and backscattering. 1. Methods and comparisons, J. Geophys. Res., 103, 19663–19672, 1998.
Fierz-Schmidhauser, R., Zieger, P., Vaishya, A., Monahan, C., Bialek, J., O'Dowd, C. D., Jennings, S. G., Baltensperger, U., and Weingartner, E.: Light scattering enhancement factors in the marine boundary layer (Mace Head, Ireland), J. Geophys. Res., 115, D20204, https://doi.org/10.1029/2009jd013755, 2010.
Foth, A., Baars, H., Di Girolamo, P., and Pospichal, B.: Water vapour profiles from Raman lidar automatically calibrated by microwave radiometer data during HOPE, Atmos. Chem. Phys., 15, 7753–7763, https://doi.org/10.5194/acp-15-7753-2015, 2015.
Franke, K., Ansmann, A., Müller, D., Althausen, D., Wagner, F., and Scheele, R.: One-year observations of particle lidar over the tropical Indian Ocean with Raman lidar, Geophys. Res. Lett., 28, 4559–4562, 2001.
Granados-Muñoz, M. J., Navas-Guzman, F., Bravo-Aranda, J. A., Guerero-Rascado, J. L., Lyamani, H., Fernández-Gálvez, J., Alados-Arboledas, L.: Autmatic determination of the planetary boundary layer height using lidar: One-Year analysis over southeastern Spain, J. Geophys. Res., 117, D18208, https://doi.org/10.1029/2012JD017524, 2012
Granados-Muñoz, M. J., Navas-Guzmán, F., Bravo-Aranda, J. A., Guerrero-Rascado, J. L., Lyamani, H., Valenzuela, A., Titos, G., Fernández-Gálvez, J., and Alados-Arboledas, L.: Hygroscopic growth of atmospheric aerosol particles based on active remote sensing and radiosounding measurements: selected cases in southeastern Spain, Atmos. Meas. Tech., 8, 705–718, https://doi.org/10.5194/amt-8-705-2015, 2015.
Granados-Muñoz, M. J., Bravo-Aranda, J. A., Baumgardner, D., Guerrero-Rascado, J. L., Pérez-Ramírez, D., Navas-Guzmán, F., Veselovskii, I., Lyamani, H., Valenzuela, A., Olmo, F. J., Titos, G., Andrey, J., Chaikovsky, A., Dubovik, O., Gil-Ojeda, M., and Alados-Arboledas, L.: A comparative study of aerosol microphysical properties retrieved from ground-based remote sensing and aircraft in situ measurements during a Saharan dust event, Atmos. Meas. Tech., 9, 1113–1133, https://doi.org/10.5194/amt-9-1113-2016, 2016.
Guerrero-Rascado, J. L., Ruiz, B., and Alados-Arboledas, L.: Multi-spectral Lidar characterization of the vertical structure of Saharan dust aerosol over southern Spain, Atmos. Environ., 42, 2668–2681, 2008a.
Guerrero-Rascado, J. L., Ruiz, B., Chourdakis, G., Georgoussis, G., and Alados-Arboledas, L.: One year of water vapour Raman lidar measurements at the Andalusian Centre for Environmental Studies (CEAMA), Int. J. Remote Sens., 29, 5437–5453, 2008b.
Guerrero-Rascado, J. L., Olmo, F. J., Avilés-Rodríguez, I., Navas-Guzmán, F., Pérez-Ramírez, D., Lyamani, H., and Alados Arboledas, L.: Extreme Saharan dust event over the southern Iberian Peninsula in september 2007: active and passive remote sensing from surface and satellite, Atmos. Chem. Phys., 9, 8453–8469, https://doi.org/10.5194/acp-9-8453-2009, 2009.
Guerrero-Rascado, J. L., Costa, M. J., Bortoli, D., Silva, D., Lyamani, H., and Alados-Arboledas, L.: Infrared lidar overlap function: An experimental determination, Opt. Express, 18, 20350–20359, 2010.
Guerrero-Rascado, J. L., Müller, D., Navas-Guzmán, F., Pérez-Ramirez, D., and Alados-Arboledas, L..: First results of aerosol microphysical properties by 3 + 2 raman lidar at Earlinet Granada station, Rom. J. Phys., 56, 467–475, 2011.
Gysel, M., Crosier, J., Topping, D. O., Whitehead, J. D., Bower, K. N., Cubison, M. J., Williams, P. I., Flynn, M. J., McFiggans, G. B., and Coe, H.: Closure study between chemical composition and hygroscopic growth of aerosol particles during TORCH2, Atmos. Chem. Phys., 7, 6131–6144, https://doi.org/10.5194/acp-7-6131-2007, 2007.
Gysel, M., McFiggans, G. B., and Coe, H.: Inversion of tandem differential mobility analyser (TDMA) measurements, J. Aerosol Sci., 40, 134–151, 2009.
Haarig, M., Ansmann, A., Gasteiger, J., Kandler, K., Althausen, D., Baars, H., Radenz, M., and Farrell, D. A.: Dry versus wet marine particle optical properties: RH dependence of depolarization ratio, backscatter, and extinction from multiwavelength lidar measurements during SALTRACE, Atmos. Chem. Phys., 17, 14199–14217, https://doi.org/10.5194/acp-17-14199-2017, 2017.
Haeffelin, M., Laffineur, Q., Bravo-Aranda, J.-A., Drouin, M.-A., Casquero-Vera, J.-A., Dupont, J.-C., and De Backer, H.: Radiation fog formation alerts using attenuated backscatter power from automatic lidars and ceilometers, Atmos. Meas. Tech., 9, 5347–5365, https://doi.org/10.5194/amt-9-5347-2016, 2016.
Hale, G. M. and Querry, M. R.: Optical constants of water in the 200-nm to 200-μm wavelength region, Appl. Optics, 12, 555–563, 1973.
Hänel, G.: The Properties of Atmospheric Aerosol Particles as Functions of the Relative Humidity at Thermodynamic Equilibrium with the Surrounding Moist Air, in: Advances in Geophysics, edited by: Landsberg, H. E. and Mieghem, J. V., Elsevier, 73–188, 1976.
Hess, M., Koepke, P., and Schult, I.: Optical properties of aerosols and clouds: The software package OPAC, Scientific Research, B. Am. Meteorol. Soc., 79, 831–844, 1998.
Holzworth, G. C.: Estimates of mean maximum mixing depths in the contiguous United States, Mon. Weather Rev., 92, 235–242, 1964.
Hung, H. M., Wang, K. C., and Chen, J. P.: Adsorption of nitrogen and water vapor by insoluble particles and the implication on cloud condensation nuclei activity, J. Aerosol. Sci., 86, 24–31, 2015.
Klett, J. D.: Stable analytical inversion solution for processing lidar returns, Appl. Optics, 20, 211–220, 1981.
Klett, J. D.: Lidar inversion with variable backscatter/extinction ratios, Appl. Optics, 24, 1638–1643, 1985.
Kotchenruther, R. A., Hobbs, P. V., and Hegg, D. A.: Humidification factors for atmospheric aerosols off the mid-Atlantic coast of the United States, J. Geophys. Res.-Atmos., 104, 2239–2251, https://doi.org/10.1029/98JD01751, 1999.
Kou, L., Labrie, D., and Chylek, P.: Refractive indices of water and ice in the 0.65–2.5 µm spectral range, Appl. Optics, 32, 3531–3540, 1993.
Leblanc, T., McDermid, I. S., and Walsh, T. D.: Ground-based water vapor raman lidar measurements up to the upper troposphere and lower stratosphere for long-term monitoring, Atmos. Meas. Tech., 5, 17–36, https://doi.org/10.5194/amt-5-17-2012, 2012.
List, R. J.: Smithsonian meteorological Tables, 6th rev. Edn., compiled by: List, R. J., Washington D.C., Smithsonian Inst., 527 pp., 1951.
Lv, M., Liu, D., Li, Z., Mao, J., Sun, Y., Wang, Z., Wang, Y., and Chenbo, X.: Hygroscopic growth of atmospheric aerosol particles based on lidar, radiosonde, and in situ measurements: case studies from the Xinzhou field campaign, J. Quant. Spectrosc. Ra.,188, 60–70, 2017.
Lyamani, H., Olmo, F. J., Alcántara, A., and Alados-Arboledas, L.: Atmospheric aerosols during the 2003 heat wave in southeastern Spain I: Spectral optical depth, Atmos. Environ., 40, 6453–6464, 2006a.
Lyamani, H., Olmo, F. J., Alcántara, A., and Alados-Arboledas, L.: Atmospheric aerosols during the 2003 heat wave in southeastern Spain II: microphysical columnar properties and radiative forcing, Atmos. Environ., 40, 6465–6476, 2006b.
Lyamani, H., Olmo, F. J., and Alados-Arboledas, L.: Physical and optical properties of aerosols over an urban location in Spain: seasonal and diurnal variability, Atmos. Chem. Phys., 10, 239–254, https://doi.org/10.5194/acp-10-239-2010, 2010.
Lyamani, H., Fernández-Gálvez, J., Valenzuela, A., Antón, M., Alados, I., Titos, G., Olmo, F. J., and Alados-Arboledas, L.: Aerosol properties over two urban sites in South Spain during an extended stagnation episode in winter season, Atmos. Environ., 62, 424–432, 2012.
Ma, L. and Thompson, J. E.: Optical Properties of Dispersed Aerosols in the Near Ultraviolet (355 nm): Measurement Approach and Initial Data, Anal. Chem., 84, 5611–5617, https://doi.org/10.1021/ac3005814, 2012.
Mattis, I., Ansmann, A., Althausen, D., Jaenisch, V., Wandinger, U., Müller, D., Arshinov, Y. F., Bobrovnikov, S. M., and Serikov, I. B.: Relative-humidity profiling in the troposphere with a Raman lidar, Appl. Optics, 41, 6451–6462, 2002.
Mie, G.: Beiträge zur Optik trüber Medien, speziell kolloidaler Metalllösungen, Ann. Phys., 25, 377–445, 1908.
Moreira, G. A., Guerrero-Rascado, J. L., Bravo-Aranda, J. A., Benavent-Oltra, J. A., Ortiz-Amezcua, P., Román, R., Bedoya-Velásquez, A. E., Landulfo, E., and Alados-Arboledas, L.: Study of the planetary boundary layer by microwave radiometer, elastic lidar and Doppler lidar estimations in Southern Iberian Peninsula, Atmospheric Research, in review, 2018.
Nakayama, T., Matsumi, Y., Sato, K., Imamura, T., Yamazaki, A., and Uchiyama, A.: Laboratory studies on optical properties of secondary organic aerosols generated during the photooxidation of toluene and the ozonolysis of α-pinene, J. Geophys. Res., 115, D24204, https://doi.org/10.1029/2010JD014387, 2010.
Navas-Guzmán, F., Guerrero Rascado, J. L., and Alados Arboledas, L.: Retrieval of the lidar overlap function using Raman signals, Ópt. Pura y Apl., 44, 71–75, 2011.
Navas-Guzmán, F., Bravo-Aranda, J. A., Guerrero-Rascado, J. L., Granados-Muñoz, M. J., and Alados-Arboledas, L.: Statistical analysis of aerosol optical properties retrieved by Raman lidar over Southeastern Spain, Tellus B, 65, 21234, https://doi.org/10.3402/tellusb.v65i0.21234, 2013.
Navas-Guzmán, F., Fernández-Gálvez, J., Granados-Muñoz, M. J., Guerrero-Rascado, J. L., Bravo-Aranda, J. A., and Alados-Arboledas, L.: Tropospheric water vapour and relative humidity profiles from lidar and microwave radiometry, Atmos. Meas. Tech., 7, 1201–1211, https://doi.org/10.5194/amt-7-1201-2014, 2014.
Nessler, R., Weingartner, E., and Baltensperger, U.: Adaptation of dry nephelometer measurements to ambient conditions at the Jungfraujoch, Environ. Sci. Technol., 39, 2219–2228, 2005.
O'Connor, E. J., Illingworth, J., Brooks, I. M., Westbrook, C. D., Hogan, R. J., Davies, F., and Brooks, B. J.: A method for estimating the turbulent kinetic energy dissipation rate from vertical pointing Doppler lidar, and independent evaluation from ballon-borne in situ measurements, J. Atmos. Ocean. Tech., 27, 1652–1664, 2010.
Ortiz-Amezcua, P., Guerrero-Rascado, J. L., Granados-Muñoz, M. J., Benavent-Oltra, J. A., Böckmann, C., Samaras, S., Stachlewska, I. S., Janicka, L., Baars, H., Bohlmann, S., and Alados-Arboledas, L.: Microphysical characterization of long-range transported biomass burning particles from North America at three EARLINET stations, Atmos. Chem. Phys., 17, 5931–5946, https://doi.org/10.5194/acp-17-5931-2017, 2017.
Pappalardo, G., Amodeo, A., Pandolfi, M., Wandinger, U., Ansmann, A., Bösenberg, J., Matthias, V., Amiridis, V., De Tomasi, F., Frioud, M., Iarlori, M., Komguem, L., Papayannis, A., Rocadenbosch, F., and Wang, X.: Aerosol lidar intercomparison in the framework of the EARLINET project. 3. Raman lidar algorithm for aerosol extinction, backscatter, and lidar ratio, Appl. Optics, 43, 5370–5385, 2004.
Pappalardo, G., Amodeo, A., Apituley, A., Comeron, A., Freudenthaler, V., Linné, H., Ansmann, A., Bösenberg, J., D'Amico, G., Mattis, I., Mona, L., Wandinger, U., Amiridis, V., Alados-Arboledas, L., Nicolae, D., and Wiegner, M.: EARLINET: towards an advanced sustainable European aerosol lidar network, Atmos. Meas. Tech., 7, 2389–2409, https://doi.org/10.5194/amt-7-2389-2014, 2014.
Päschke, E., Leinweber, R., and Lehmann, V.: An assessment of the performance of a 1.5 µm Doppler lidar for operational vertical wind profiling based on a 1-year trial, Atmos. Meas. Tech., 8, 2251–2266, https://doi.org/10.5194/amt-8-2251-2015, 2015
Pearson, G., Davies, F., and Collier, C.: An ananlysis of the performance of the UFAM pulsed Doppler lidar for observing the boundary layer, J. Atmos. Ocean. Tech., 26, 240–250, 2008.
Pereira, S., Preißler, J., Guerrero-Rascado, J. L., Silva, A. M., and Wagner, F.: Forest Fire Smoke Layers Observed in the Free Troposphere over Portugal with a Multi-wavelength Raman Lidar: Optical and Microphysical Properties, The Scientific World Journal, 421838, 11 pp., https://doi.org/10.1155/2014/421838, 2014.
Petters, M. D. and Kreidenweis, S. M.: A single parameter representation of hygroscopic growth and cloud condensation nucleus activity, Atmos. Chem. Phys., 7, 1961–1971, https://doi.org/10.5194/acp-7-1961-2007, 2007.
Pilat, M. J. and Charlson, J.: Theoretical and optical studies of humidity effects on the size distribution of a hygroscopic aerosol, Journal de Recherches Atmosphéricques, 1, 165–170, 1966.
Preißler, J., Wagner, F., Pereira, S. N., and Guerrero-Rascado, J. L.: Multi-instrumental observation of an exceptionally strong Saharan dust outbreak over Portugal, J. Geophys. Res., 116, D24204, https://doi.org/10.1029/2011JD016527, 2011.
Preißler, J., Wagner, F., Guerrero-Rascado, J. L., and Silva, A. M.: Two years of free-tropospheric aerosol layers observed over Portugal by lidar, J. Geophys. Res.-Atmos., 118, 3676–3686, 2013.
Rankin, D. W. H.: CRC handbook of chemistry and physics, 89th edition, edited by: Lide, D. R., Crystallogr. Rev., 15, 223–224, 2009.
Riipinen, I., Rastak, N., and Pandis, S. N.: Connecting the solubility and CCN activation of complex organic aerosols: a theoretical study using solubility distributions, Atmos. Chem. Phys., 15, 6305–6322, https://doi.org/10.5194/acp-15-6305-2015, 2015.
Román, R., Benavent-Oltra, J. A., Casquero-Vera, J. A., Lopatin, A., Cazorla, A., Lyamani, H., Denjean, C., Fuertes, D., Pérez-Ramírez, D., Torres, B., Toledano, C., Dubovik, O., Cachorro, V. E., de Frutos, A. M., Olmo, F. J., and Alados-Arboledas, L.: Retrieval of aerosol profiles combining sunphotometer and ceilometer measurements in GRASP, Atmos. Res., 204, 161–167, https://doi.org/10.1016/j.atmosres.2018.01.021, 2018.
Rosati, B., Wehrle, G., Gysel, M., Zieger, P., Baltensperger, U., and Weingartner, E.: The white-light humidified optical particle spectrometer (WHOPS) – a novel airborne system to characterize aerosol hygroscopicity, Atmos. Meas. Tech., 8, 921–939, https://doi.org/10.5194/amt-8-921-2015, 2015.
Rosati, B., Herrmann, E., Bucci, S., Fierli, F., Cairo, F., Gysel, M., Tillmann, R., Größ, J., Gobbi, G. P., Di Liberto, L., Di Donfrancesco, G., Wiedensohler, A., Weingartner, E., Virtanen, A., Mentel, T. F., and Baltensperger, U.: Studying the vertical aerosol extinction coefficient by comparing in situ airborne data and elastic backscatter lidar, Atmos. Chem. Phys., 16, 4539–4554, https://doi.org/10.5194/acp-16-4539-2016, 2016.
Rose, T., Crewell, S., Löhnert, U., and Simmer, C.: A network suitable microwave radiometer for operational monitoring of the cloudy atmosphere, Atmos. Res., 75, 183–200, 2005.
Sicard, M., Molero, F., Guerrero-Rascado, J. L., Pedrós, R., Expósito, F. J., Córdoba-Jabonero, C., Bolarín, J. M., Comerón, A., Rocadenbosh, F., Pujadas, M., Alados-Arboledas, L., Martínez-Lozano, J. A., Díaz, J. P., Gil, M., Requena, A., Navas-Guzman, F., and Moreno, J. M.: Aerosol lidar intercomparison in the framework of SPALINET-The Spanish lidar network: Methodology and results, IEEE T. Geosci. Remote, 47, 3547–3559, 2009.
Sorooshian, A., Hersey, S., Brechtel, F. J., Corless, A., Flagan, R. C., and Seinfeld, J. H.: Size-Resolved Aerosol Hygroscopic Growth Measurements: Differential Aerosol Sizing and Hygroscopicity Spectrometer Probe (DASH-SP), Aerosol. Sci. Tech., 42:6, 445-464, DOI: 10.1080/02786820802178506, 2008.
Stokes, R. H. and Robinson, R. A.: Interactions in aqueous nonelectrolyte solutions, I. Solute-solvent equilibria, J. Phys. Chem., 70, 2126–2130, 1966.
Swietlicki, E., Hansson, H. C., Hämeri, K., Svenningsson, B., Massling, A., Mcfiggans, G., Mcmurry, P. H., Petäjä, T., Tunved, P., Gysel, M., Topping, D., Weingartner, E., Baltensperger, U., Rissler, J., Wiedensohler, A., and Kulmala, M.: Hygroscopic properties of submicrometer atmospheric aerosol particles measured with H-TDMA instruments in various environments – a review, Tellus B, 6, 432–469, 2008.
Titos, G., Foyo-Moreno, I., Lyamani, H., Querol, X., Alastuey, A., and Alados-Arboledas, L.: Optical properties and chemical composition of aerosol particles at an urban location: An estimation of the aerosol mass scattering and absorption efficiencies, J. Geophys. Res.-Atmos., 117, D04206, https://doi.org/10.1029/2011JD016671, 2012.
Titos, G., Jefferson, A., Sheridan, P. J., Andrews, E., Lyamani, H., Alados-Arboledas, L., and Ogren, J. A.: Aerosol light-scattering enhancement due to water uptake during the TCAP campaign, Atmos. Chem. Phys., 14, 7031–7043, https://doi.org/10.5194/acp-14-7031-2014, 2014.
Titos, G., Cazorla, A., Zieger, P., Andrews, E., Lyamani, H., Granados- Muñoz, M. J., Olmo, F. J., and Alados-Arboledas, L.: Effect of hygroscopic growth on the aerosol light-scattering coefficient: A review of measurements, techniques and error sources, Atmos. Environ., 141, 494–507, 2016.
Titos, G., del Águila, A., Cazorla, A., Lyamani, H., Casquero-Vera, J. A., Colombi, C., Cuccia, E., Gianelle, V., Alastuey, A., and Alasdos-Arboledas, L.: Spatial and temporal variability of carbonaceous aerosols: assessing the impact of biomass burning in the urban environment, Sci. Total Environ., 578, 613–625, 2017.
Twomey, J.: the influence of pollution on the shortwave albedo of clouds, Atmos. Sci., 34, 1149–1152, 1977.
Valenzuela, A., Olmo, F. J., Lyamani, H., Granados-Muñoz, M. J., Antón, M., Guerrero-Rascado, J. L., Quirantes, A., Toledano, C., Perez-Ramírez, D., and Alados-Arboledas, L.: Aerosol transport over the western mediterranean basin: Evidence of the contribution of fine particles to desert dust plumes over Alborán island, J. Geophys. Res., 119, 14028–14044, 2014.
Veselovskii, I., Whiteman, D. N., Kolgotin, A., Andrews, E., and Korenskii, M.: Demonstration of aerosol property profiling by multi-wavelength lidar under varying relative humidity conditions, J. Atmos. Ocean. Tech., 26, 1543–1557, 2009.
Whiteman, D. N.: Examination of the traditional Raman lidar technique. II. Evaluating the ratios for water vapor and aerosols, Appl. Optics, 42, 2593–2608, 2003.
Zieger, P., Weingartner, E., Henzing, J., Moerman, M., de Leeuw, G., Mikkilä, J., Ehn, M., Petäjä, T., Clémer, K., van Roozendael, M., Yilmaz, S., Frieß, U., Irie, H., Wagner, T., Shaiganfar, R., Beirle, S., Apituley, A., Wilson, K., and Baltensperger, U.: Comparison of ambient aerosol extinction coefficients obtained from in-situ, MAX-DOAS and LIDAR measurements at Cabauw, Atmos. Chem. Phys., 11, 2603–2624, https://doi.org/10.5194/acp-11-2603-2011, 2011.
Zieger, P., Fierz-Schmidhauser, R., Weingartner, E., and Baltensperger, U.: Effects of relative humidity on aerosol light scattering: results from different European sites, Atmos. Chem. Phys., 13, 10609–10631, https://doi.org/10.5194/acp-13-10609-2013, 2013.
Zieger, P., Aalto, P. P., Aaltonen, V., Äijälä, M., Backman, J., Hong, J., Komppula, M., Krejci, R., Laborde, M., Lampilahti, J., de Leeuw, G., Pfüller, A., Rosati, B., Tesche, M., Tunved, P., Väänänen, R., and Petäjä, T.: Low hygroscopic scattering enhancement of boreal aerosol and the implications for a columnar optical closure study, Atmos. Chem. Phys., 15, 7247–7267, https://doi.org/10.5194/acp-15-7247-2015, 2015.