the Creative Commons Attribution 4.0 License.
the Creative Commons Attribution 4.0 License.
 | 16 May 2018
Intercontinental transport of biomass burning pollutants over the Mediterranean Basin during the summer 2014 ChArMEx-GLAM airborne campaign
Vanessa Brocchi
Gisèle Krysztofiak
Valéry Catoire
Jonathan Guth
Virginie Marécal
Régina Zbinden
Laaziz El Amraoui
François Dulac
Philippe Ricaud
The Gradient in Longitude of Atmospheric constituents above the Mediterranean basin (GLAM) campaign was set up in August 2014, as part of the Chemistry and Aerosol Mediterranean Experiment (ChArMEx) project. This campaign aimed to study the chemical variability of gaseous pollutants and aerosols in the troposphere along a west–east transect above the Mediterranean Basin (MB). In the present work, we focus on two biomass burning events detected at 5.4 and 9.7 km altitude above sea level (a.s.l.) over Sardinia (from 39∘12′ N–9∘15′ E to 35∘35′ N–12∘35′ E and at 39∘30′ N–8∘25′ E, respectively). Concentration variations in trace gas carbon monoxide (CO), ozone (O3) and aerosols were measured thanks to the standard instruments on board the Falcon 20 aircraft operated by the Service des Avions Français Instrumentés pour la Recherche en Environnement (SAFIRE) and the Spectromètre InfraRouge In situ Toute Altitude (SPIRIT) developed by LPC2E. Twenty-day backward trajectories with Lagrangian particle dispersion model FLEXPART (FLEXible PARTicle) help to understand the transport processes and the origin of the emissions that contributed to this pollution detected above Sardinia. Biomass burning emissions came (i) on 10 August from the North American continent with air masses transported during 5 days before arriving over the MB, and (ii) on 6 August from Siberia, with air masses travelling during 12 days and enriched in fire emission products above Canada 5 days before arriving over the MB. In combination with the Global Fire Assimilation System (GFAS) inventory and the Moderate Resolution Imaging Spectroradiometer (MODIS) satellite fire locations, FLEXPART reproduces well the contribution of those fires to CO and aerosols enhancements under adjustments of the injection height to 10 km in both cases and application of an amplification factor of 2 on CO GFAS emissions for the 10 August event. The chemistry transport model (CTM) MOCAGE is used as a complementary tool for the case of 6 August to confirm the origin of the emissions by tracing the CO global atmospheric composition reaching the MB. For this event, both models agree on the origin of air masses with CO concentrations simulated with MOCAGE lower than the observed ones, likely caused by the coarse model horizontal resolution that yields the dilution of the emissions and diffusion during transport. In combination with wind fields, the analysis of the transport of the air mass documented on 6 August suggests the subsidence of CO pollution from Siberia towards North America and then a transport to the MB via fast jet winds located at around 5.5 km in altitude. Finally, using the ratio ΔO3 ∕ ΔCO, the plume age can be estimated and the production of O3 during the transport of the air mass is studied using the MOCAGE model.
- Article
(9266 KB) - Full-text XML
-
Supplement
(1024 KB) - BibTeX
- EndNote


Biomass burning is a significant contributor of trace gas and aerosol content to the atmosphere (e.g. Andreae and Merlet, 2001). It emits large amounts of chemically active trace gases (e.g. carbon monoxide, CO, and nitrogen oxides, NOx) that impact the composition of the atmosphere at regional and global scales, with consequences on ozone (O3) formation. CO, a tracer for biomass burning emissions produced from incomplete combustion, is a precursor of tropospheric O3 and a sink for radical hydroxyl (OH), the main oxidizing species in the atmosphere (Seinfeld and Pandis, 2016). Forest fires are also an important source of tropospheric aerosols that play a significant role on radiative properties of the atmosphere (Liousse et al., 1996) especially in the Mediterranean region (Pace et al., 2005; Bougiatioti et al., 2016).
Long-range transport is now recognized as one of the most important processes affecting the spatial variability of pollutants (Roiger et al., 2012). As a result, air pollution from one continent can alter the chemical composition of the atmosphere above another continent. Compounds from fires or photochemically produced within fire plumes can be transported horizontally, but also vertically and be injected into the middle to upper troposphere–lower stratosphere (e.g. Fromm and Servranckx, 2003; Colarco et al., 2004; Damoah et al., 2004, 2006; Jost et al., 2004; Nedelec et al., 2005; Cammas et al., 2009; Dahlkötter et al., 2014) when the fire activity is strong enough and can thus affect climate and air quality (Val Martin et al., 2006, and references therein).
Looking at the projections of future climate change, the Mediterranean Basin (MB) is considered as highly sensitive and has been identified as one of the most important “hot spots” (Giorgi and Lionello, 2008). It is at the crossroad of different transport processes (Lelieved et al., 2002; Millan et al., 2002; Gerasopoulos et al., 2005; Duncan et al., 2008; Doche et al., 2014; Ricaud et al., 2014) and at the intersection of different sources of pollutants, either natural (e.g. major dust sources from the Sahara and Arabian deserts) or anthropogenic, influencing the variability of aerosols (e.g. Nabat et al., 2013) and trace gases in the MB (Mihalopoulos, 2007). Within this scientific framework, the Chemistry and Aerosol Mediterranean Experiment Gradient in Longitude of Atmospheric constituents above the Mediterranean basin (ChArMEx-GLAM) campaign has been set up in order to document the variability in aerosol and trace gases in the free troposphere over the MB. Several studies have already reported transatlantic transport of boreal forests fire emissions from North America to central Europe (Forster et al., 2001; Petzold et al., 2007) or to the MB (Formenti et al., 2002; Cristofanelli et al., 2013; Ancellet et al., 2016). Those studies were mainly focused on biomass burning aerosols except that of Forster et al. (2001), which also addressed CO emissions, but with measurements made in Germany and, thus, concerning central Europe. Damoah et al. (2004) and Spichtinger et al. (2004) have reported transport of fire emissions from Russia to Europe via eastward circumnavigation, but they were not specifically focused on the MB and did not include in situ measurements at high altitude.
In the present paper, we analyse the intercontinental transport of CO and aerosol biomass burning emissions from North America and Siberia that impacted the MB based on two flights of the ChArMEx-GLAM airborne campaign on 6 and 10 August 2014. Only a limited amount of in situ observations and trace gas distribution are available in the troposphere for the whole Mediterranean region (Di Biagio et al., 2015). The in situ measurements presented here, being direct, local and at high spatial resolution, are thus of interest for the region. First we describe in Sect. 2 the GLAM aircraft campaign with the onboard instruments. The quality of the aircraft SPIRIT CO measurements is checked by comparison to a surface station located close to the Lampedusa airport where the aircraft landed and took off. Then, we explain the modelling work undertaken to characterize this long-range transport of biomass burning pollutants impacting the MB. Backward modelling with the Lagrangian particle dispersion model FLEXPART (FLEXible PARTicle) and chemistry transport modelling with the 3-D chemistry transport model (CTM) MOCAGE (MOdèle de Chimie Atmosphérique à Grande Echelle) are introduced. We address the question of emission inventories as well as the estimation of the injection height since they are sources of uncertainties when using models to determine long-range transport. In Sect. 3, sensitivity tests of the models to the injection height and to the emissions are thus performed to properly simulate the fire products. To characterize the model sensitivity to the injection height, tracers are released at different altitudes, while for sensitivity to the emissions the simulated concentrations are compared to the measurements. Once the emissions and the injection height are set up, model simulations with FLEXPART and MOCAGE are used to trace back the plumes source regions and to estimate the CO biomass burning contribution to the aircraft measurements, i.e. to the middle (5.4 km above sea level (a.s.l.)) and upper (9.7 km a.s.l.) troposphere in the MB. A detailed analysis of the transport of the air mass from Siberia via North America to the MB on 6 August is also provided to conclude this section. Section 4 deals with the production of O3 inside the plume during the air mass transport using the aircraft measurements and MOCAGE model. Section 5 presents the main conclusions.
2.1 Campaign description
The GLAM aircraft campaign set up in the framework of ChArMEx aimed to study the tropospheric chemical variability and trends of pollutants with different lifetimes above the MB during 6–10 August 2014. The campaign and the main results obtained are presented in Ricaud et al. (2018). To sum up, in situ measurements of trace gases and aerosols were performed thanks to the instruments integrated in the Falcon 20 research aircraft operated by the French Instrumented Aircraft Service for Research in Environment (SAFIRE, CNRS and Météo-France). The 5-day campaign consisted in eight flights at various altitudes on the outbound and on the return leg between Toulouse (France) and Larnaca (Cyprus), via Menorca (Spain), Lampedusa (Italy) and Heraklion (Crete Island). During the first transect, from the western to the eastern part of the MB, the aircraft flew at an altitude level of 500 hPa (∼ 5.4 km a.s.l.), also providing vertical profiles up to 12 km around each landing sites mentioned above. As calibrated measurement surface stations belonging to the World Meteorological Organization/Global Atmosphere Watch network (WMO/GAW) are located close to some landing sites, it was possible to compare aircraft and surface measurements. On the way back from the eastern to the western part of the MB, a constant pressure level of 300 hPa (∼ 9.7 km a.s.l.) was held for the cruising altitude. This paper focuses on CO, O3 and aerosol measurements during the flights on 6 August 2014 (flight F2) and on 10 August 2014 (flight F8).
2.2 Airborne payload
The SPIRIT airborne infrared absorption spectrometer for the measurements of trace gases was mounted on board the Falcon 20. A complete description of the instrument principle can be found in Catoire et al. (2017). In brief, it uses continuous-wave distributed-feedback room-temperature quantum cascade lasers (QCLs), allowing rapid scanning (each 1.6 s) of strong fundamental molecular rotational–vibrational lines lying in the mid-infrared, with ultra high spectral resolution (10−3 cm−1). The QCL infrared beams are absorbed by constituents of the ambient air sampled in a multipass cell (with 83.88 m of pathlength) at reduced pressure (33 hPa) and detected using a cooled HgCdTe photodetector. In the present campaign, measurements were carried out at the wave number 2179.772 cm−1 for 12C16O. Total molecule abundance is deduced from a homemade software using the HITRAN 2012 database (Rothman et al., 2013) with a precision of 0.3 ppbv for CO at 1.6 s time resolution. Dry volume mixing ratios (vmr) are deduced using the measured pressure and temperature of the optical cell and using the water vapour mixing ratios measured by a laser absorption spectroscopy hygrometer (WVSS-II from SpectraSensors). Total uncertainties for CO were estimated to be 4.7 ppb using comparisons performed during previous flights with high-altitude instrumented surface stations (Pic du Midi de Bigorre and Puy-de-Dôme, France) belonging to the WMO/GAW network and with a NOAA standard cylinder on board the aircraft (Catoire et al., 2017). They are also checked in the present campaign (see Sect. 2.3).
The Mozart instrument was used for the measurements of O3 concentrations. It is a modified version of a commercial ozone analyser (TEI 49C), an early version of the instrument used in the Measurement of OZone by Airbus In-service airCraft (MOZAIC) program (Marenco et al., 1998). The measurement accuracy of Mozart is identical to the accuracy of MOZAIC instruments, which has been estimated at ± [2 ppbv + 2 %] (Thouret et al., 1998).
The number of aerosol particles per cm3 was provided by a Passive Cavity Aerosol Spectrometer Probe (PCASP-100X from Droplet Measurement Technologies, Inc) measuring the particles within a 0.1–3 µm size range into 30 bins. The principle of measurement is based on the scattering of light by individual particles going through a laser beam (visible wavelength). The particle size is determined from this particle light scattering. The PCASP instrument is thus only able to determine size ranges but does not discriminate the type of aerosol. Thereafter, only the 0.2–1.1 µm size range is considered as this range size is representative of black carbon (BC) particles (Dahlkötter et al., 2014) and corresponds to the sum of the number of particles in 10 bins.
Table 1Comparison of the CO dry volume mixing ratio (vmr) measurements between the WMO/GAW surface station (Picarro instrument) in Lampedusa island (35.52∘ N–12.63∘ E; 45 m a.s.l.) and the aircraft (SPIRIT instrument).
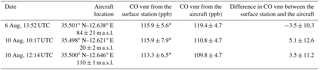
* Uncertainties are standard deviations.
2.3 Comparison between the measurements and a WMO/GAW calibrated surface station
The presence of a calibrated measurement surface station (35.52∘ N, 12.63∘ E; 45 m a.s.l.) located at 2.5 km northwest from the Lampedusa airport represents an opportunity to confirm the quality of GLAM airborne measurements. Surface CO vmr are routinely measured at this station by a WMO/GAW calibrated Picarro instrument. This comparison is possible under the condition the air mass sampled is similar for both the station and the aircraft. Wind fields from ERA-Interim are (1) extracted at 6-hourly intervals (00:00, 06:00, 12:00, 18:00 UTC) and 3 h forecasts (03:00, 09:00, 15:00, 21:00 UTC) with a horizontal resolution of 0.125∘ × 0.125∘, high enough to specify the wind direction at the local scale, and (2) selected at the dates of the presence of the aircraft in the vicinity. Two landings and take-offs were performed on the outbound, on 6 and 7 August, and on the return leg, on 10 August. In the first case, the wind was blowing from northwest; thus the aircraft landed and took off downwind, while it was the contrary on 10 August (aircraft upwind). About 10 s of SPIRIT measurements are selected to respect the down/up wind condition within a band of 1 km width, corresponding to altitudes below 110 m a.s.l., consistently within the maritime boundary layer (600 m a.s.l.). Results are gathered in Table 1 and show the excellent agreement between these CO measurements and those of the surface station: the difference (−3.5 to +5.1 ppb) observed is within the total estimated uncertainties reported for both instruments (4.7 to 7.9 ppb). For the take-off on 7 August, the SPIRIT was not ready to make such a comparison.
2.4 Lagrangian particle dispersion modelling
The Lagrangian transport and diffusion model FLEXPART (Stohl et al., 2005) is used in our study to describe the transport of air masses to the MB. It simulates long-range transport, diffusion, dry and wet deposition of atmospheric tracers by computing trajectories of a large number of particles. It calculates the trajectories of released particles, taking into account advection and turbulent diffusion processes.
Model calculations are based on meteorological data from the European Centre for Medium-Range Weather Forecasts (ECMWF). ERA-Interim (Dee et al., 2011) meteorological reanalysis data provided by ECMWF have been used for all simulations. Data are extracted at 6-hourly intervals (00:00, 06:00, 12:00, 18:00 UTC) and 3 h forecasts (03:00, 09:00, 15:00, 21:00 UTC) with a resolution of 0.5∘ × 0.5∘ in latitude and longitude, a compromise at the global scale between computing cost and the trajectory accuracy. A vertical resolution of 137 model hybrid levels is used with the model top at 0.01 hPa.
Our FLEXPART calculations are performed backward in time (Seibert and Frank, 2004) with the model version 9.0. Possible source contributions to the content of the air mass are determined by releasing particles from points located at the flight track. This backward mode gives access to two products. The first one is a residence time of the particles in the total atmospheric column while the second one, defined as the potential emission sensitivity (PES), indicates the location where the sampled air mass has been impacted by the surface emissions. The emission sensitivity refers to the source–receptor relationship (Seibert and Frank, 2004). It describes the sensitivity of a receptor (here, the aircraft) to a source of emissions. The thickness of the PES layer is chosen consistently with the altitude (vertically integrated values from 0 to 10 km; see below) at which the emissions are injected in order to take into account the injection of fires in the mid- to upper troposphere. Outputs are averaged every 24 h with a horizontal resolution of 0.5∘ × 0.5∘ globally. Retroplume trajectory outputs are condensed into a cluster analysis (Stohl et al., 2002b).
In the present case, the model simulations are run with the CO tracer, only considering reaction with OH radicals (with concentrations monthly-averaged with 3∘ × 5∘ resolution from GEOS-CHEM model; Stohl et al., 2010) and with the aerosol tracer assuming removal by dry and wet depositions with properties similar to BC. Each simulation consists of 20 000 particles released at the aircraft location and time of measurements. They are followed over 20 days backward in time with parameterization of turbulence, activation of the convection and age of air calculation (“lagespectra” option). The convection is based on the Emanuel and Zivkovic-Rothman (1999) scheme that only relies on the ECMWF temperature and humidity fields.
In addition, the Global Fire Assimilation System (GFAS) version 1.2 emission inventory (Kaiser et al., 2012, http://apps.ecmwf.int/datasets/data/cams-gfas/) is used for CO and aerosols for the year 2014 with a 0.1∘ × 0.1∘ grid. GFAS calculates biomass burning emissions by assimilating fire radiative power (FRP) observations from MODIS instruments (MOderate resolution Imaging Spectroradiometer; Giglio et al., 2003; http://modis-fire.umd.edu/pages/ActiveFire.php) on board the Terra and Aqua satellites. This FRP gives quantitative information on the combustion and smoke emission rates (Ichoku and Kaufman, 2005; Wooster et al., 2005). Multiplying the CO emission flux from this inventory with the FLEXPART emission sensitivity gives access to the contribution of biomass burning sources to the total CO abundance (in ppb m−2) present in the air sampled by the aircraft. For aerosol simulations, a multiplicative coefficient of 3.4 is applied to the GFAS emissions as recommended in Kaiser et al. (2012). As for CO, aerosol emission flux multiplied with FLEXPART emission sensitivity gives access to the contribution of biomass burning sources to the total aerosol abundance (in ng m−3).
2.5 Chemistry-transport modelling
MOCAGE (Josse et al., 2004; Sič et al., 2015; Guth et al., 2016), version R2.15.0, is used in this study to simulate the atmospheric composition during July and August 2014. In particular we analyse the CO global atmospheric content in order to trace the biomass burning events and the concentration and production of O3 inside the plume. MOCAGE is a 3-D stratospheric and tropospheric CTM using a semi-Lagrangian transport scheme.
In order to represent both the tropospheric and the stratospheric air composition, two chemical schemes are implemented into MOCAGE. The Regional Atmospheric Chemistry Mechanism (RACM) (Stockwell et al., 1997) is used in the troposphere. For the stratosphere, the REPROBUS scheme (REactive Processes Ruling the Ozone BUdget in the Stratosphere) is implemented (Lefèvre et al., 1994).
MOCAGE is an offline model and thus needs external meteorological forcing based on wind and temperature fields from the analyses of the operational model of Météo-France, ARPEGE (Courtier et al., 1991). MOCAGE can be run with several nested grids. In our configuration, the horizontal resolution for the global domain is 2∘ × 2∘ with 47 vertical levels. A regional nested domain, defined with a horizontal resolution of 0.2∘ × 0.2∘, is centred over the MB. For the global domain, the Global Emissions InitiAtive (GEIA; Guenther et al., 1995) and the MACCity inventories are used (Lamarque et al., 2010; Granier et al., 2011; Diehl et al., 2012) for natural and anthropogenic emissions, respectively. For the regional domain, anthropogenic emissions are taken from the MACC II (Monitoring Atmospheric Composition and Climate – Interim Implementation) inventory (Kuenen et al., 2011), biomass burning emissions are from the GFAS 1.1 product (Kaiser et al., 2012) while natural emissions are from the GEIA inventory. Those emissions can be found at http://eccad.sedoo.fr.
2.6 Remote sensing products
The Cloud-Aerosol Lidar with Orthogonal Polarization (CALIOP) is a two-wavelength, polarization-sensitive lidar that provides high-resolution vertical profiles of clouds and aerosols (Winker et al., 2009). With an imaging infrared radiometer and a wide field camera as well, CALIOP is on board the Cloud-Aerosol Lidar and Infrared Pathfinder Satellite Observations (CALIPSO), a component of the A-Train constellation, launched on 28 April 2006. In our study, we use the 532 nm total (parallel and perpendicular) attenuated backscatter aerosol (https://www-calipso.larc.nasa.gov/products/lidar/) to determine at which maximum altitude smoke is detected.
The Atmospheric Infrared Sounder (AIRS, 2013) instrument was launched aboard the second Earth Observing System (EOS) polar-orbiting platform, Aqua, in May 2002. It is a hyperspectral infrared grating spectrometer. Its goal is to support climate research and improve weather forecasting by observing and characterizing the entire atmospheric column from the surface to the top of the atmosphere. We use CO zonal means (mean area is represented in Fig. 4; https://giovanni.gsfc.nasa.gov/giovanni/) from AIRS instrument with a daily and 1∘ × 1∘ resolution. These data are used to identify the CO injection from fires.
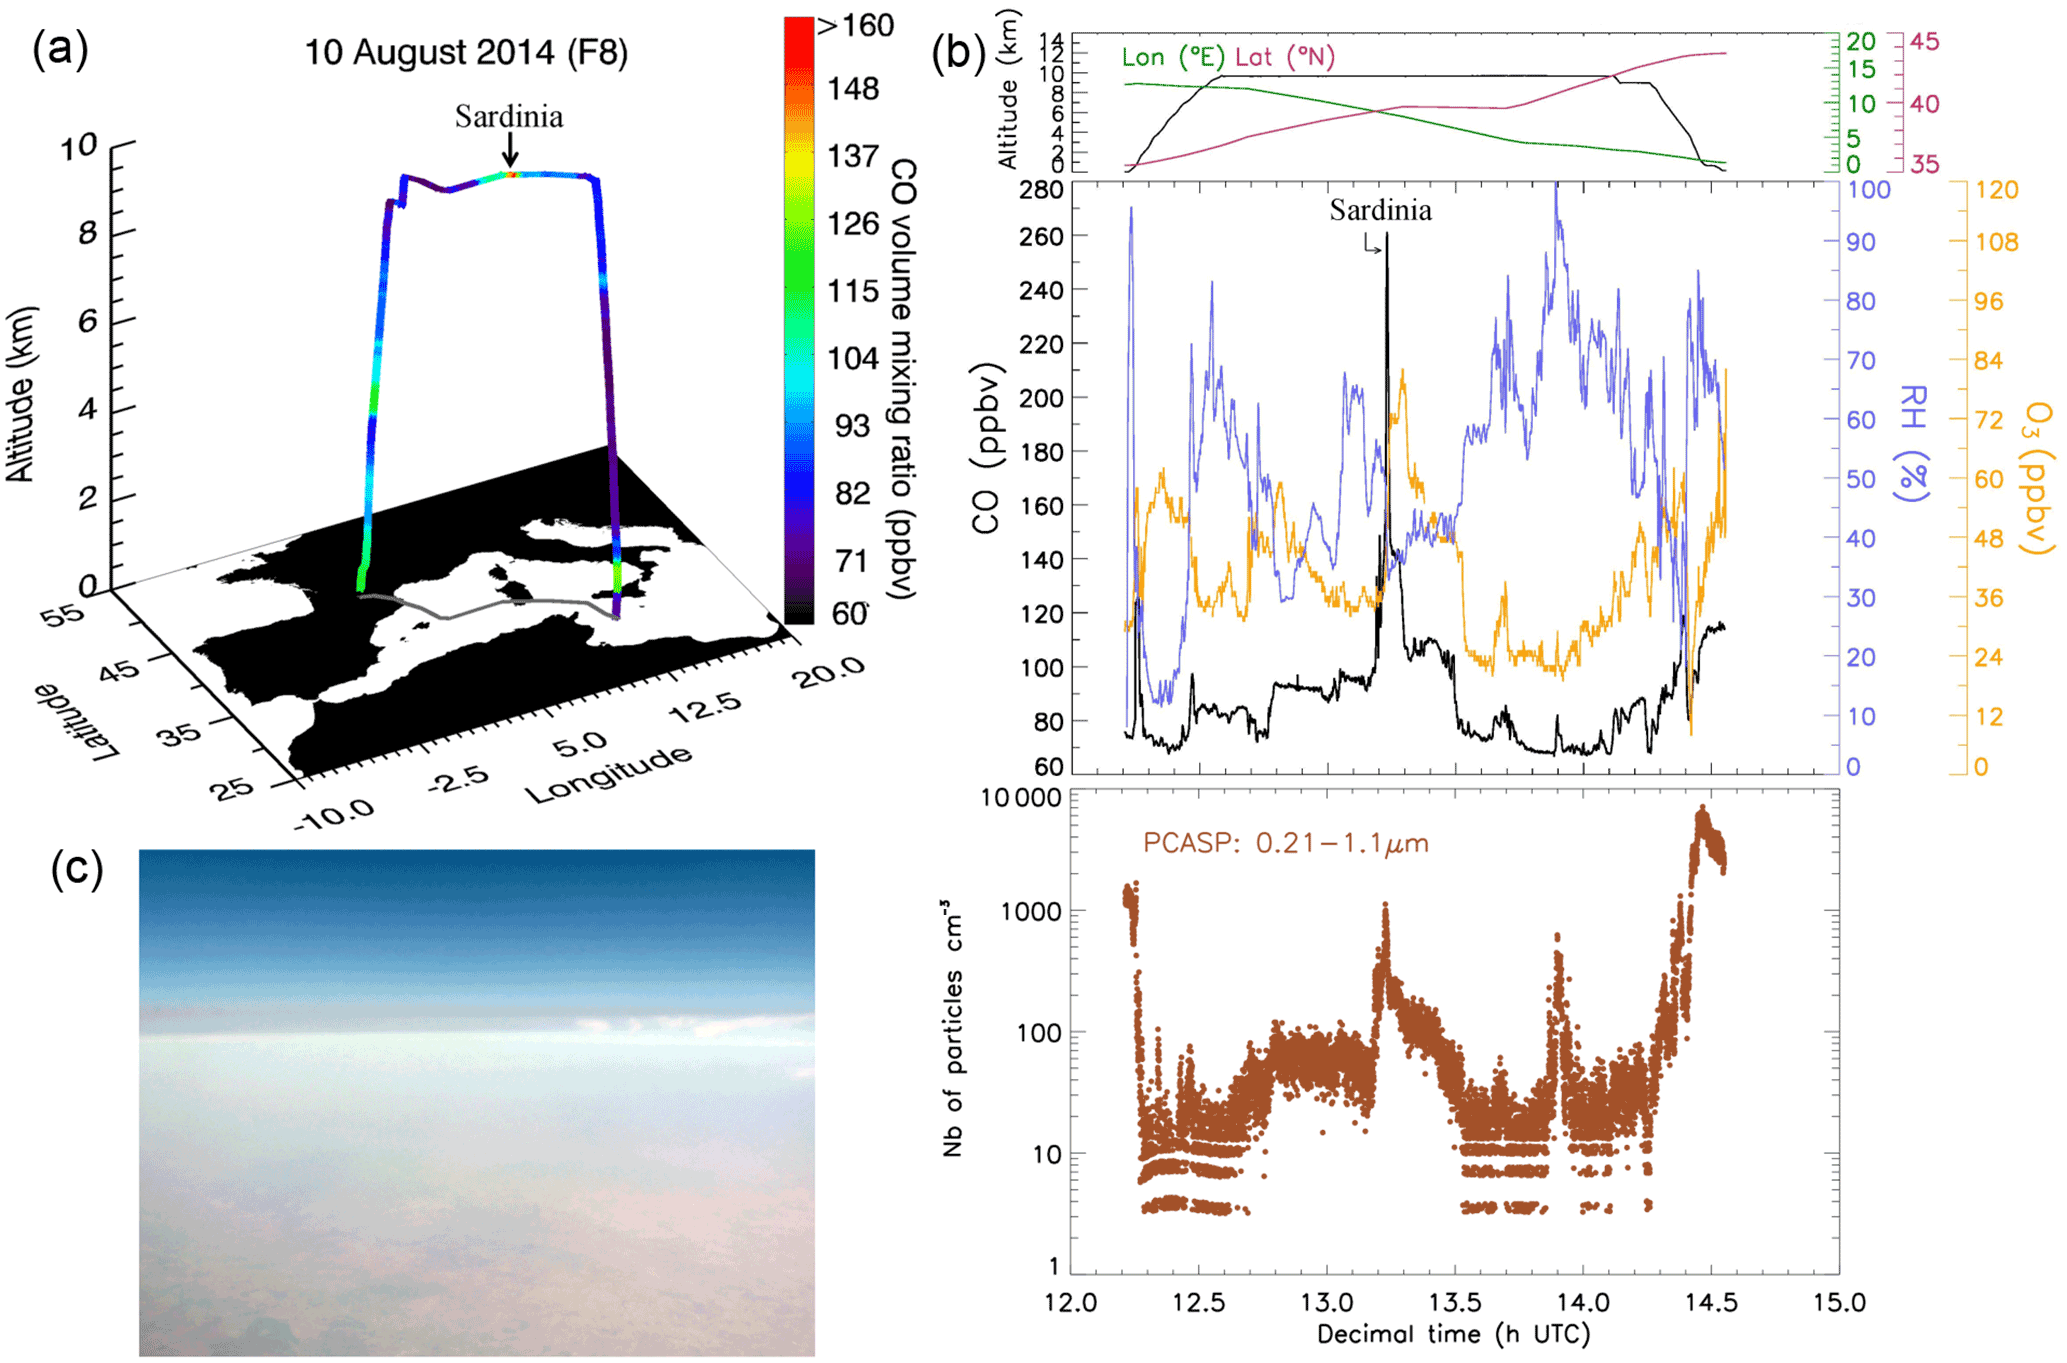
Figure 1Flight F8 (10 August 2014). (a) Three-dimensional trajectory colour-coded according to CO volume mixing ratios (vmr) between Lampedusa and Toulouse. (b) Top – flight altitude, longitude and latitude as a function of time; middle – time series of CO (black) and O3 (orange) vmr and relative humidity (blue); bottom – aerosol total number concentrations (brown). (c) Picture of a dark thin layer from the Falcon 20 at an altitude of 9.7 km at 13:12 UTC.
This section presents the modelling work associated with the aircraft observations. With FLEXPART, the method used to determine the geographic origin of the pollution and the sources of emission is the same in both case studies; i.e. we use 20-day back trajectories in order to have access to the PES (see Sect. 2.4). The PES map indicates the location where the air mass has taken up emissions. We then combine the PES with CO and BC emissions from GFAS inventory and derive the biomass burning contribution to CO and aerosols measured concentrations.
3.1 Case study of 10 August 2014: North American forest fire plume
The F8 flight (eighth flight of the campaign, on 10 August) consists of an east-to-west flight from Lampedusa (Italy) to Toulouse (France) (Fig. 1a and b). During the transect at about 9.7 km a.s.l., an increase of CO vmr up to ∼ 110 ppbv (from a background at ∼ 70 ppbv) has been measured above Sardinia. A very intense and transitory increase of CO up to about 260 ppbv has been measured among this general increase of CO, correlated with a weaker increase in O3 (from ∼ 35 to ∼ 75 ppbv) and aerosols up to about 1000 particles cm−3 in the 0.21–1.1 µm diameter range, and a decrease in relative humidity (RH). A picture taken during the flight shows that the aircraft traversed a thin dark layer of particles (Fig. 1c). This intense peak lasted about 10 min as the aircraft was flying from Lampedusa back to Toulouse, and so passed rapidly through the pollution layer. This event has already been evoked in Ricaud et al. (2018). They used 20-day back-trajectory calculations of Hybrid Single-Particle Lagrangian Integrated Trajectory (HYSPLIT) model with global reanalysis data on a 2.5∘ × 2.5∘ grid to assess the origin of the air parcels. It was shown that air masses originate from the Northwest Territories (Canada) above 7 km and the United States below 7 km, where fires were detected by MODIS. MOCAGE simulations confirmed this result and found elevated amounts of CO and BC over North America. In our study, we use FLEXPART model with a thinner resolution (0.5∘ × 0.5∘) over 20 days backward in time to reproduce this intense peak. FLEXPART allows to assess the origin of the air masses but also to calculate the biomass burning contribution of CO and BC to the measurements by coupling it with GFAS inventory. A direct comparison between the simulated and measured concentrations is thus possible. Thanks to the calculation of the age of air, it is also possible to discriminate the different contributions in terms of dates before the flight.
To determine the origin of this pollution, 20-day backward trajectories are calculated using FLEXPART all along the flight track. Emission sensitivities are stored on a 3-D grid with levels from the surface up to 10 km a.s.l. The representation of the PES is a good indicator of where and for how long the air mass has probably taken up emissions.
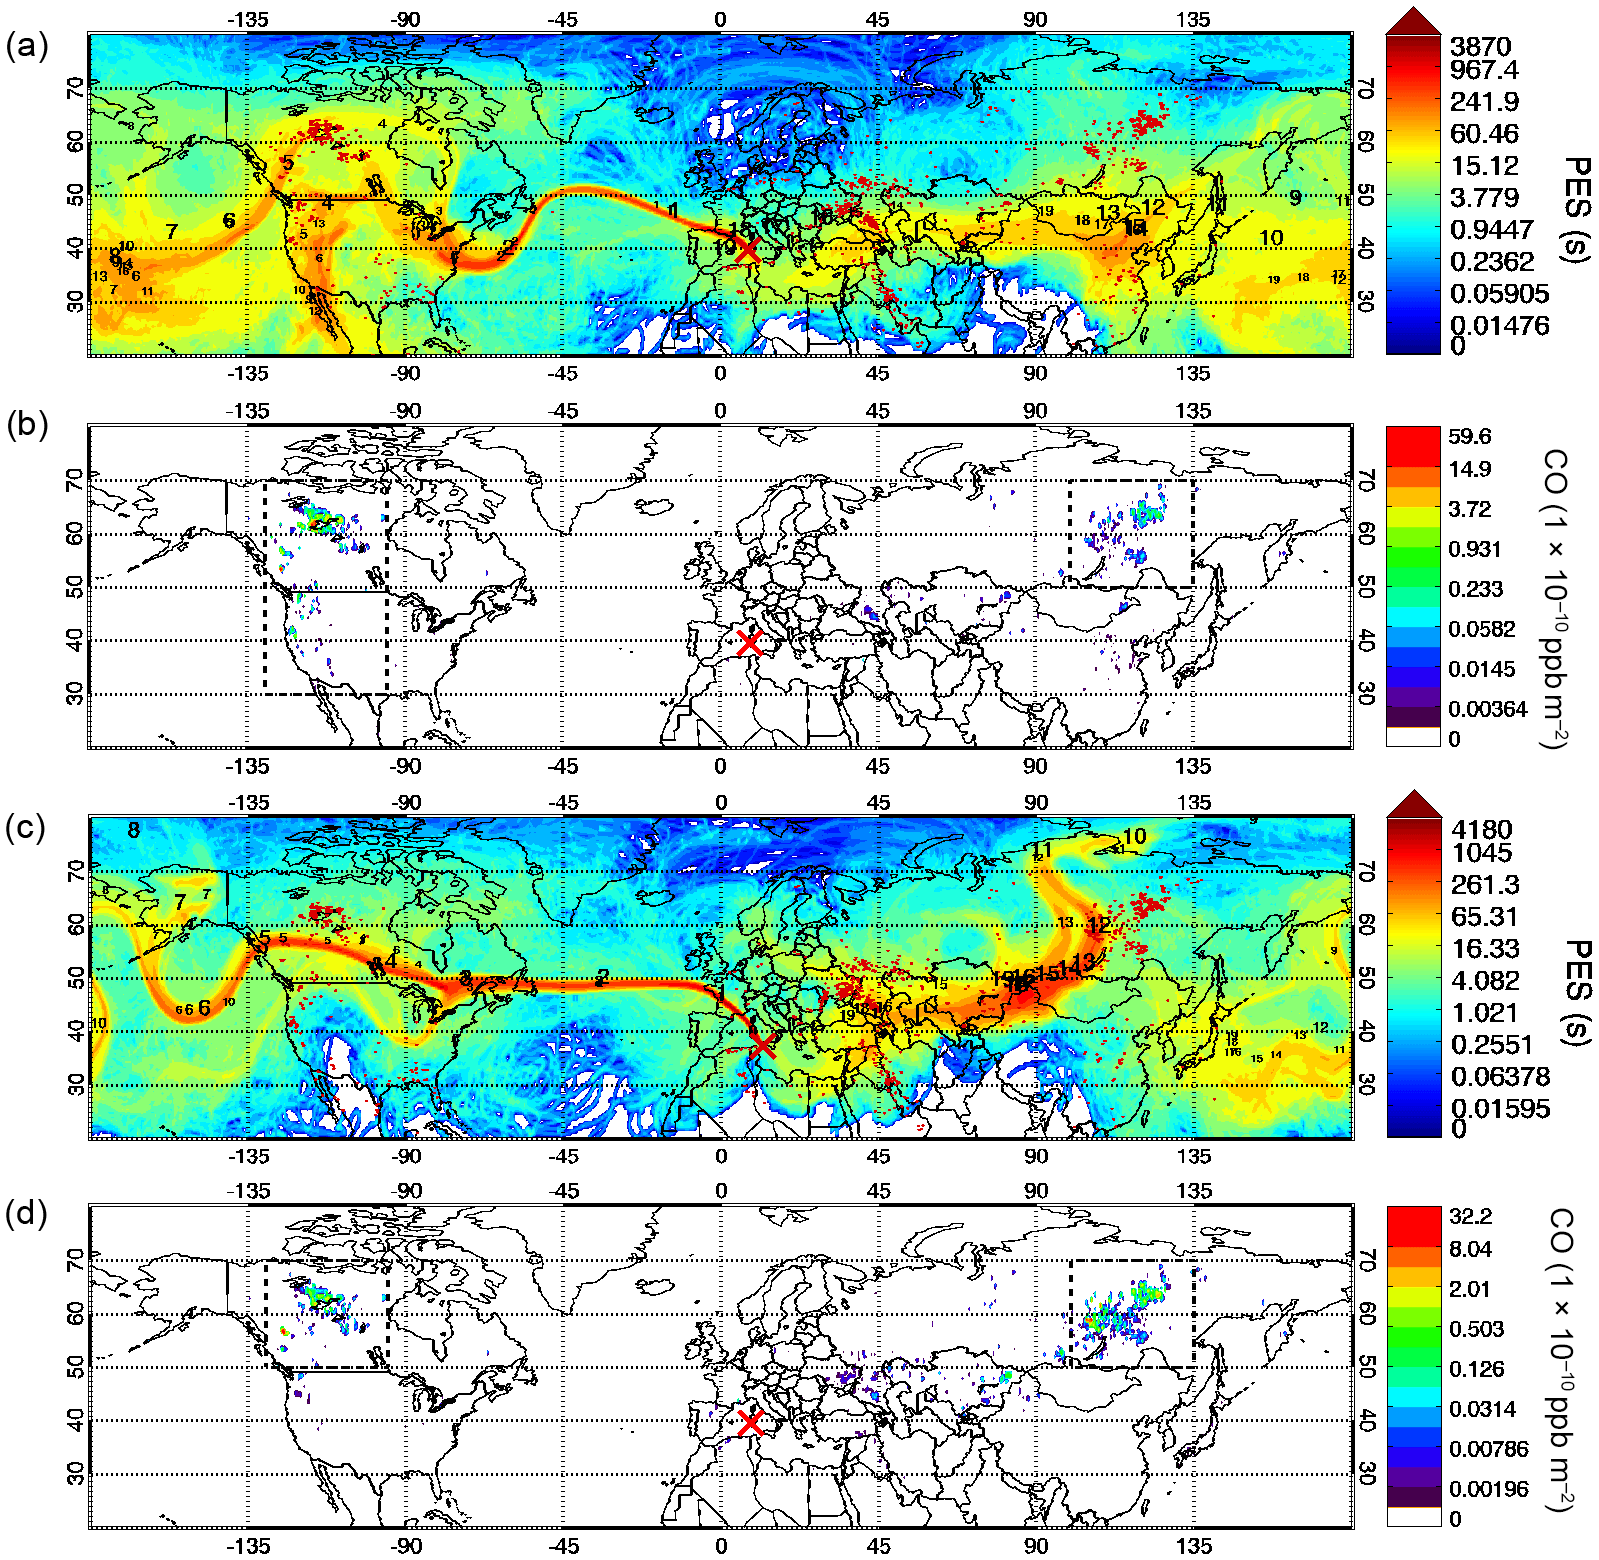
Figure 2(a, c) Potential emission sensitivity (PES) of the particles in the 0–10 km footprint layer for 20-day backward simulations on 10 and 6 August 2014, respectively. Superimposed on panels (a, c) are the MODIS fire detection (dark red dots) and numbers corresponding to the days of back trajectories with label sizes scaled according to the number of particles belonging to each cluster. The red crosses symbolize the location of the aircraft when measuring the peak of pollution. (b, d) CO biomass burning contribution calculated in the 0–10 km PES layer on 10 and 6 August 2014, respectively. The dotted rectangles represent the masks used to see the specific contribution of Siberia and the North American continent in panel (b) and of Siberia and Canada in panel (d).
Twenty-day back trajectories (Fig. 2a) originating above Sardinia where CO is at its maximum (13:23 UTC) reveal that the air masses stayed mostly above Mongolia and North China between 12 and 19 days before the flight (from 22 to 26 July). Then, the air masses travelled eastward where they passed above central Pacific between 6 to 10 days (31 July to 4 August) before the flight and above Canada and the United States 4 to 5 days (5 to 6 August) before reaching Sardinia. As shown in Fig. 2a, numerous fires were detected by MODIS for more than 1 month in northwestern Canada and the United States and especially intense fires triggered by lightning ignition and drought in California and Oregon (see https://earthobservatory.nasa.gov/IOTD). The confidence for every MODIS fire detection is characterized by a number ranging 0–100 %. We only use fire detections with a confidence level greater than 75 %. The map of the CO contribution from biomass burning (Fig. 2b) from FLEXPART reveals that the strongest contribution comes from Siberia, northwestern Canada and the west coast of the United States (the last two gathered for simplicity under one single name, the North American continent), but almost no biomass burning contribution comes from Mongolia and China. To exclude the possibility of anthropogenic contribution by China, we coupled FLEXPART with EDGAR (Emissions Database for Global Atmospheric Research; EC-JRC/PBL, 2011) v4.2 inventory. EDGAR provides country- and sector-specific anthropogenic emissions of greenhouse gases and pollutants (including CO). The CO anthropogenic contribution map (not shown) reveals that Chinese contribution is less than 10 ppbv and thus has a negligible influence on the CO values measured. As illustrated in Fig. 3a, CO contribution simulated by FLEXPART reproduces well the measured CO, with a slight delay of only 3 min. We isolated the CO emissions of the main areas of biomass burning contributions as shown in Fig. 2b. This leads to the conclusions that the North American continent is the only source of CO emission as the contribution of Siberia is close to zero (Fig. 3a). Considering the age of the air mass (Fig. 3b), we note that the maximum of contribution is 4 to 5 days (namely 5 and 6 August) before the flight when the PES was above the North American continent in consistency with the above result.
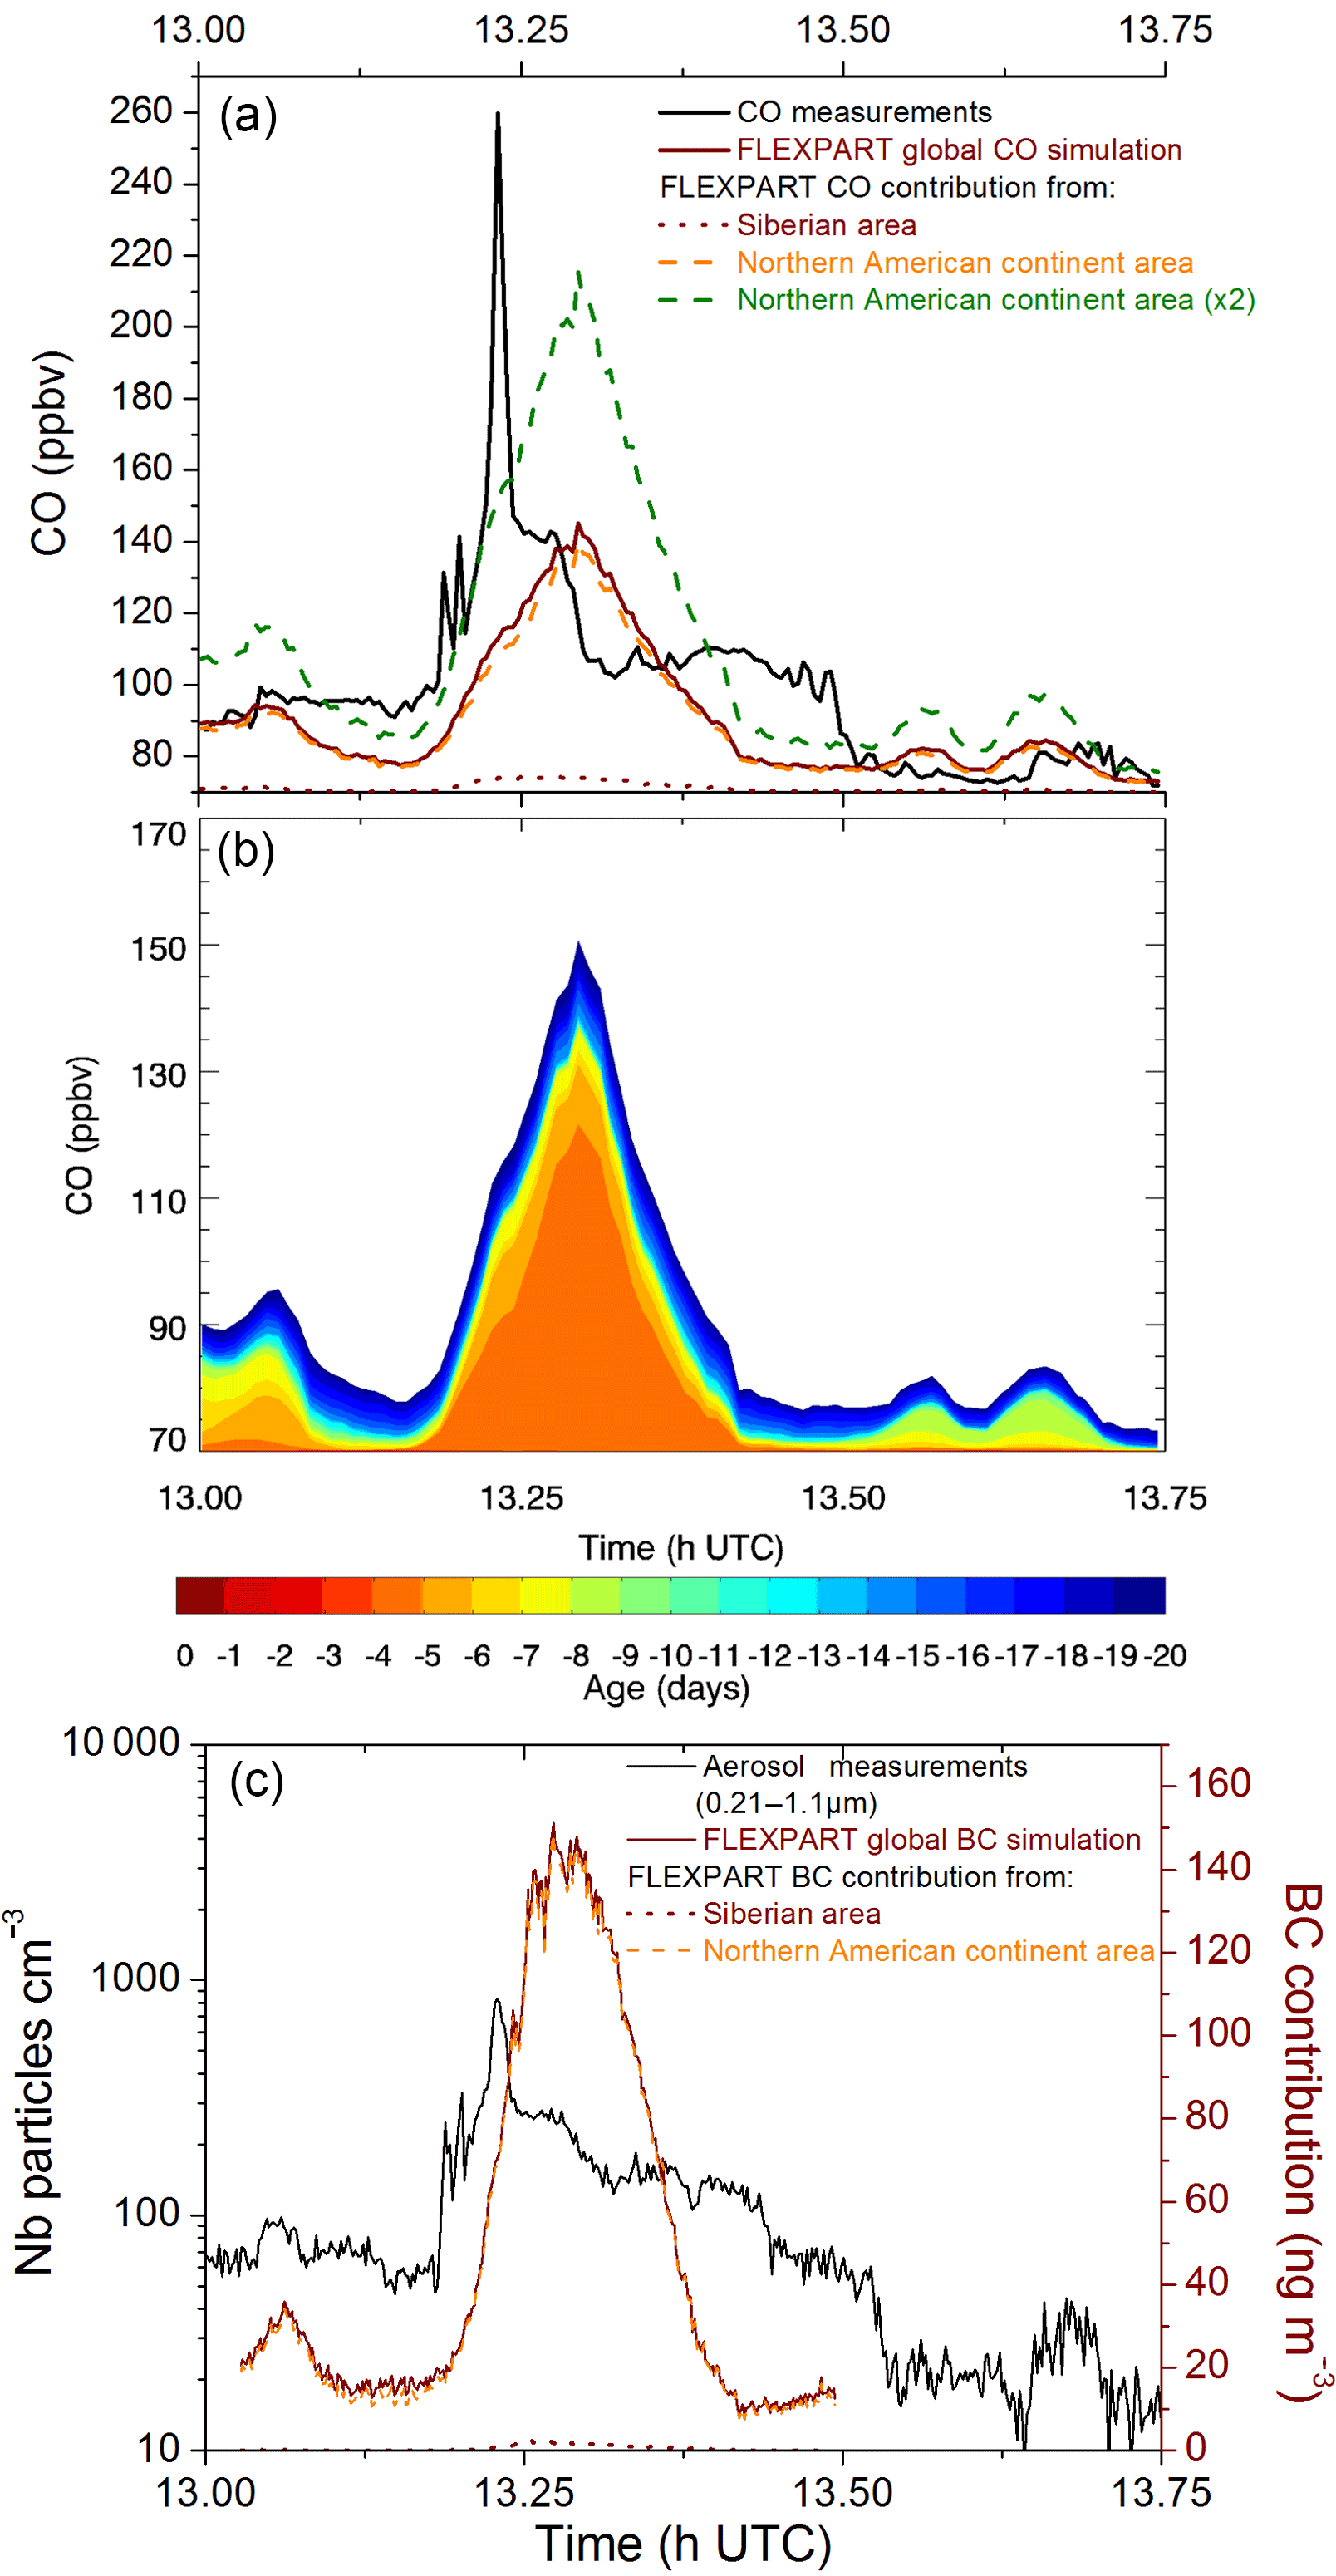
Figure 3Zoom on a part of F8 from 13:00 to 13:45 UTC above Sardinia at 9.7 km a.s.l. with an injection height up to 10 km in FLEXPART. (a) CO time evolution along the flight: SPIRIT measurements (degraded to FLEXPART time resolution) and FLEXPART simulations. (b) CO contributions calculated by FLEXPART, colour-coded according to the age, from 1 to 20 days before F8, of the air mass. (c) BC time evolution along the F8 flight: PCASP measurements (degraded to FLEXPART time resolution) and FLEXPART simulations.
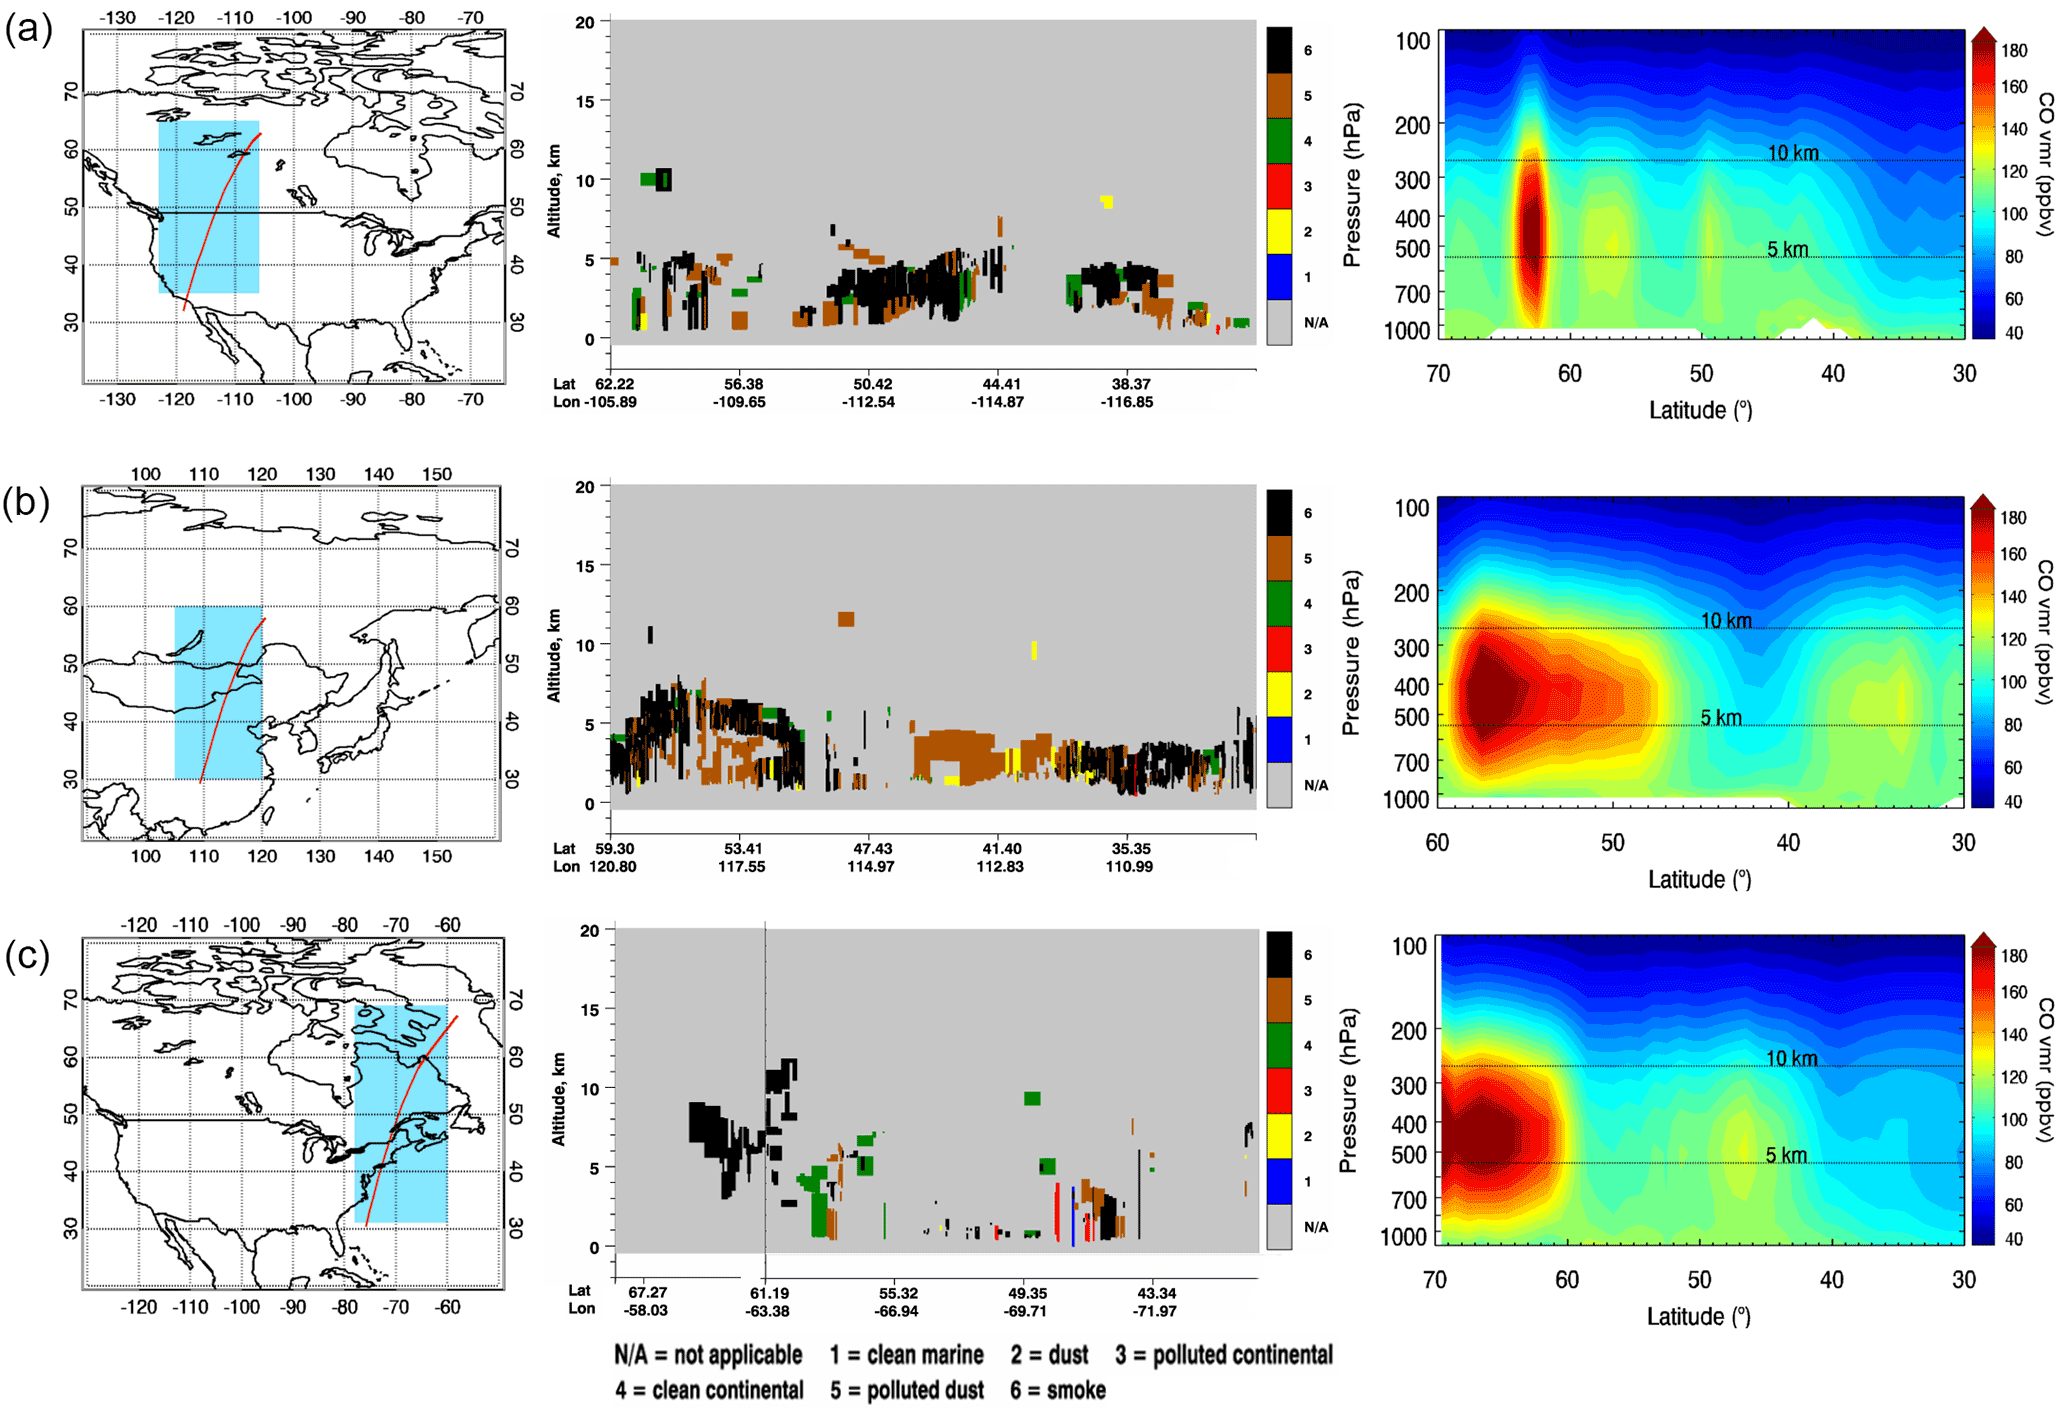
Figure 4(a) 6 August 2014 at 08:51 UTC; (b) 24 July 2014 at 18:37 UTC; (c) 2 August 2014 at 06:58 UTC. (Left) CALIOP overpass (red line) and area of CO vmr averaging (blue box) from AIRS. (Middle) Vertical distribution of aerosol subtypes (smoke in black) associated with the red line of the CALIOP orbit. (Right) CO vertical distribution from AIRS with data averaged according to the location of the blue box.
To quantitatively compare the two CO datasets (simulated by FLEXPART and measured by SPIRIT), a background value of 70 ppbv was added to the FLEXPART data. This added value of 70 ppbv is an average of our measurements during the campaign and is thus representative of the CO background of the mid-troposphere for the western MB at that period. Although FLEXPART is able to simulate the origin of this pollution, we note (Fig. 3a) that the CO calculated vmr are less than the CO measurements. Since the effect of pyroconvection is not included in FLEXPART, different scenarios are tested in order to reproduce the CO impact of those fires. Thus, we adjusted the injection height of the plume as it plays an important role in its long-range transport. As a matter of fact, the consequences on the transport, the deposition and the lifetime depend on whether the plume is below or above the planetary boundary layer. The injection height depends on several variables as the intensity of the fire, as well as on the synoptic conditions. If the meteorological conditions are satisfied, i.e. water vapour condensation and release of latent heat due to an environment cooler than the plume, then pyroconvection can occur (Fromm et al., 2010). To determine the initial injection height, we use data from CALIOP and AIRS instrument. CALIOP and AIRS data are selected for the same day and with close geographical coordinates enabling the comparison between the two datasets. The nighttime CALIOP overpass above North America on 6 August at 09:51 UTC can be used to locate the fire plumes (Fig. 4a left). The aerosol subtypes indicate the presence of smoke up to 10 km a.s.l. from latitudes 38–62∘ N (Fig. 4a middle). For the same day and from latitudes 61–64∘ N, high CO concentrations from AIRS (Fig. 4a right) can be found up to 10 km with maximum concentrations above 5 km. An estimation of injection height derived from MODIS instrument data and meteorological information from ECMWF is also provided by GFAS. GFAS estimations of injection height are on 5 and 6 August at a maximum of 10.9 km above Canada (not shown).
Other studies have already proved that the use of such an altitude of 10 km to inject surface emissions in the atmosphere allows simulating concentrations in good agreement with the measurements (De Gouw et al., 2006; Elguindi et al., 2010). However, the measured CO concentrations are still about twice higher than the simulated ones (Fig. 3a). As FLEXPART has already proved its accuracy in simulating events of long-range transport of fire plumes (Forster et al., 2001; Damoah et al., 2004, 2006; De Gouw et al., 2006; Stohl et al., 2007; Lapina et al., 2008; Cristofanelli, 2013) and the question of convection induced by fires has been solved by applying a higher injection altitude, one hypothesis for those lower concentrations would be an underestimation of the GFAS CO emissions, although Kaiser et al. (2012) do not discuss a correction to be applied to CO emissions. As errors depend on individual fire events because the fire space-borne observations depend on the instrument sampling, as e.g. cloud-free observations (Johannes Kaiser, personal communication, 2017), the underestimation detected in our study cannot be considered as a general statement that has to be applied in every case study using GFAS CO emissions, but rather only in ours. Finally, an amplification factor of 2 has to be applied to get similar CO quantities during the event, derived from the calculated surface under the CO enhancement (Fig. 3a).
The FLEXPART simulations for the biomass burning contribution to the total BC use the same parameters as for CO simulations, in particular an injection height up to 10 km. In Fig. 3c, FLEXPART is able to qualitatively reproduce the fine aerosol concentration peak measured by the PCASP, delayed by ∼ 3 min as for CO. The contribution map gives the same regions, i.e. North American continent and Siberia, to the aerosol loading (not shown). To distinguish which region contributes the most to the peak of pollution, we isolate the BC contribution to the measurements in each of these areas. It appears that the North American continent is the main source of BC emissions and that Siberia contributes for less than 3 ng m−3 (Fig. 3c).
Table 2List of the biomass burning layers coming from the North American continent that impacted the MB reported in the literature. The altitude refers to the measurement location.
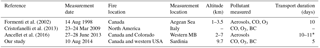
* 10–11-day backward trajectories simulations with FLEXPART.

Figure 5Flight F2 (6 August 2014). (a) Three-dimensional trajectory colour-coded according to CO vmr between Menorca and Lampedusa. (b) Top – Flight altitude, longitude and latitude as a function of time; middle – time series of CO (black) and O3 (orange) vmr and relative humidity (blue); bottom – aerosol total number concentrations (brown).
The injection of such a quantity of CO and aerosol particles measured at high altitude (> 9 km) is therefore due to a pyroconvective lifting that has uplifted pollutants at high altitude, which subsequently travelled over the North Atlantic. Fire products in North America transported to Europe and more specifically to the MB seem to be recurrent but of variable intensity. Pu et al. (2007) found, thanks to satellite data, that most of the fires occur in June–July in North America. Stohl et al. (2002a), also using FLEXPART simulations, found that the MB is the location where the highest surface concentrations of the North America tracers are detected in summer. Different corridors of pollution impacting the MB, including the one from North America, have been identified in Ricaud et al. (2018), without discriminating the biomass burning contribution to CO concentrations. Transatlantic transport is well documented and comparable transport durations between North America and Europe are found in other studies: about 6 days in Petzold et al. (2007) and 7 days in Forster et al. (2001). Transport between North America and the MB in Formenti et al. (2002) and Ancellet et al. (2016) lasts about 10 days (Table 2). A hypothesis of Forster et al. (2001) is that those biomass burning emissions coming from North America might have an influence on European pollutant concentration levels during the summer period almost every year, but with variable intensity each year. Over central Europe, Forster et al. (2001) and Petzold et al. (2007) have found a fire plume layer up to 6 km and 8 km a.s.l., respectively. Over the MB, Formenti et al. (2002) have found a forest fire haze layer up to 3.5 km coming from Canadian forest fires over the eastern Mediterranean. Ancellet et al. (2016) have reported aerosol layers up to 7 km coming from North America over the western MB. The published cases we know of transatlantic transport to MB in the recent years are gathered in Table 2. Fromm et al. (2005) and Damoah et al. (2006) also report pollution from pyroconvective fires over North America. Moreover, they indicate that the fire activity was strong enough to inject smoke up into the lower stratosphere.
3.2 Case study of 6 August 2014: Siberian biomass burning
The flight F2 (2nd flight of the campaign, on 6 August) consists of a west-to-east flight from Menorca (Spain) to Lampedusa (Italy), as shown in Fig. 5a. It is characterized by a transect at about 5.4 km a.s.l. with a vertical profile above Lampedusa up to 12 km. During this transect (Fig. 5b), we measured above Sardinia an enhancement of CO from ∼ 70 to ∼ 120–140 ppbv at 12:00 UTC, synchronized with enhancements of O3 from ∼ 30 to ∼ 60 ppbv, of aerosols up to about 100 particles cm−3 in the 0.21–1.1 µm size range and a decrease in RH, that lasted more than 40 min (∼ 509 km travelled). The background concentrations are rather similar to the ones measured during F8, but the peak intensity of CO is lower. The aircraft was flying in the same direction as the air mass motion (see Sect. 3.2.2 below), which could explain why it stayed so long in the polluted air mass. After that, the aircraft performed an ascending vertical profile and crossed this layer again at the same altitude and with the same features more than 30 min later (just before 13:30 UTC) when descending for landing on Lampedusa island. The measurements performed during this vertical profile help us determining that the thickness of the layer is 2.9 km.
3.2.1 Analysis of the origin of the air mass using FLEXPART
The PES map shown in Fig. 2c reveals that the majority of the air masses were above western Canada about 5 days before (1 August) and close to Siberia, northwestern China and western Mongolia about 12 to 16 days (21 to 25 July) before the flight. Along these trajectories, MODIS on Terra and Aqua satellites detected fires on those dates mostly in northwestern Canada and Siberia (Fig. 2c). The contribution map presented in Fig. 2d indicates that source contributions to CO are located mainly in northwestern Canada and in Siberia.
As in the previous case (see Sect. 3.1), we have to inject forest fire emissions at high altitudes in FLEXPART simulations in order to mimic the vertical transport of fire plumes. CALIOP overpasses above Siberia and North America are used to estimate this injection height. The first CALIOP profile, shown in Fig. 4b, taken above Siberia on 24 July at 18:37 UTC, indicates smoke detected up to 10 km altitude for latitudes from 47 to 59∘ N, with most of the aerosols around 5 km. The second profile (Fig. 4c) above the eastern coast of North America on 2 August at 06:58 UTC shows smoke detected up to 11 km at latitudes from 59 to 65∘ N with most of the aerosols detected above 5 km. AIRS data are also used to identify the CO injection from fires. On 24 July (Fig. 4b), high CO concentrations are detected up to 10 km, with maximum concentrations above 5 km from latitudes 50 to 60∘ N. On 2 August (Fig. 4c), CO concentrations are also detected up to 10 km with maximum values above 5 km from latitudes 60 to 70∘ N. CALIOP and AIRS are both in agreement to estimate the injection height of the plume. GFAS estimations of injection height on 24 and 25 July are 7.9 km above Siberia, 10.4 km on 1 August and 9 km on 2 August above Canada (not shown). Two injection heights are tested in the model above Siberia and Canada for this case: at 6 and 10 km. For Siberia, the difference between the two simulations at 12:00–12:48 UTC is 7 %, meaning that most of the emissions emitted by fires are at altitudes between 0 and 6 km even though some can reach higher altitudes. For Canada, the difference for the same period of time is much higher (27 %), with the altitude of 10 km giving the strongest contributions. By using an injection height of 10 km for both regions, the GFAS global contribution to CO vmr calculated by FLEXPART simulates well the measured peak of pollution between 12:00 and 12:48 UTC, as illustrated in Fig. 6a. In order to verify that the global CO anthropogenic contribution does not affect our results, a coupling between FLEXPART and EDGAR v4.2 inventory is performed. The contribution map (not shown) shows that CO anthropogenic contribution accounts for less than 10 ppbv. Selecting each area to find where the biomass burning contribution dominates shows that, in the case of CO, Siberia and Canada contribute approximately in the same manner but with a slightly higher contribution from Siberia (Fig. 6a). The biomass burning contribution in southern Russia (north of the Black Sea) has also been studied but leads to a contribution close to zero (not shown). Looking at the age of the air mass (Fig. 6b), two main contributions are emphasized between 12:00 and 12:48 UTC: the first maximum is between 1 and 2 August (i.e. 5 and 4 days before the flight) when the PES was above Canada and the second maximum is between 24 and 25 July (i.e. 13 and 12 days before the flight) when the PES was above Siberia.
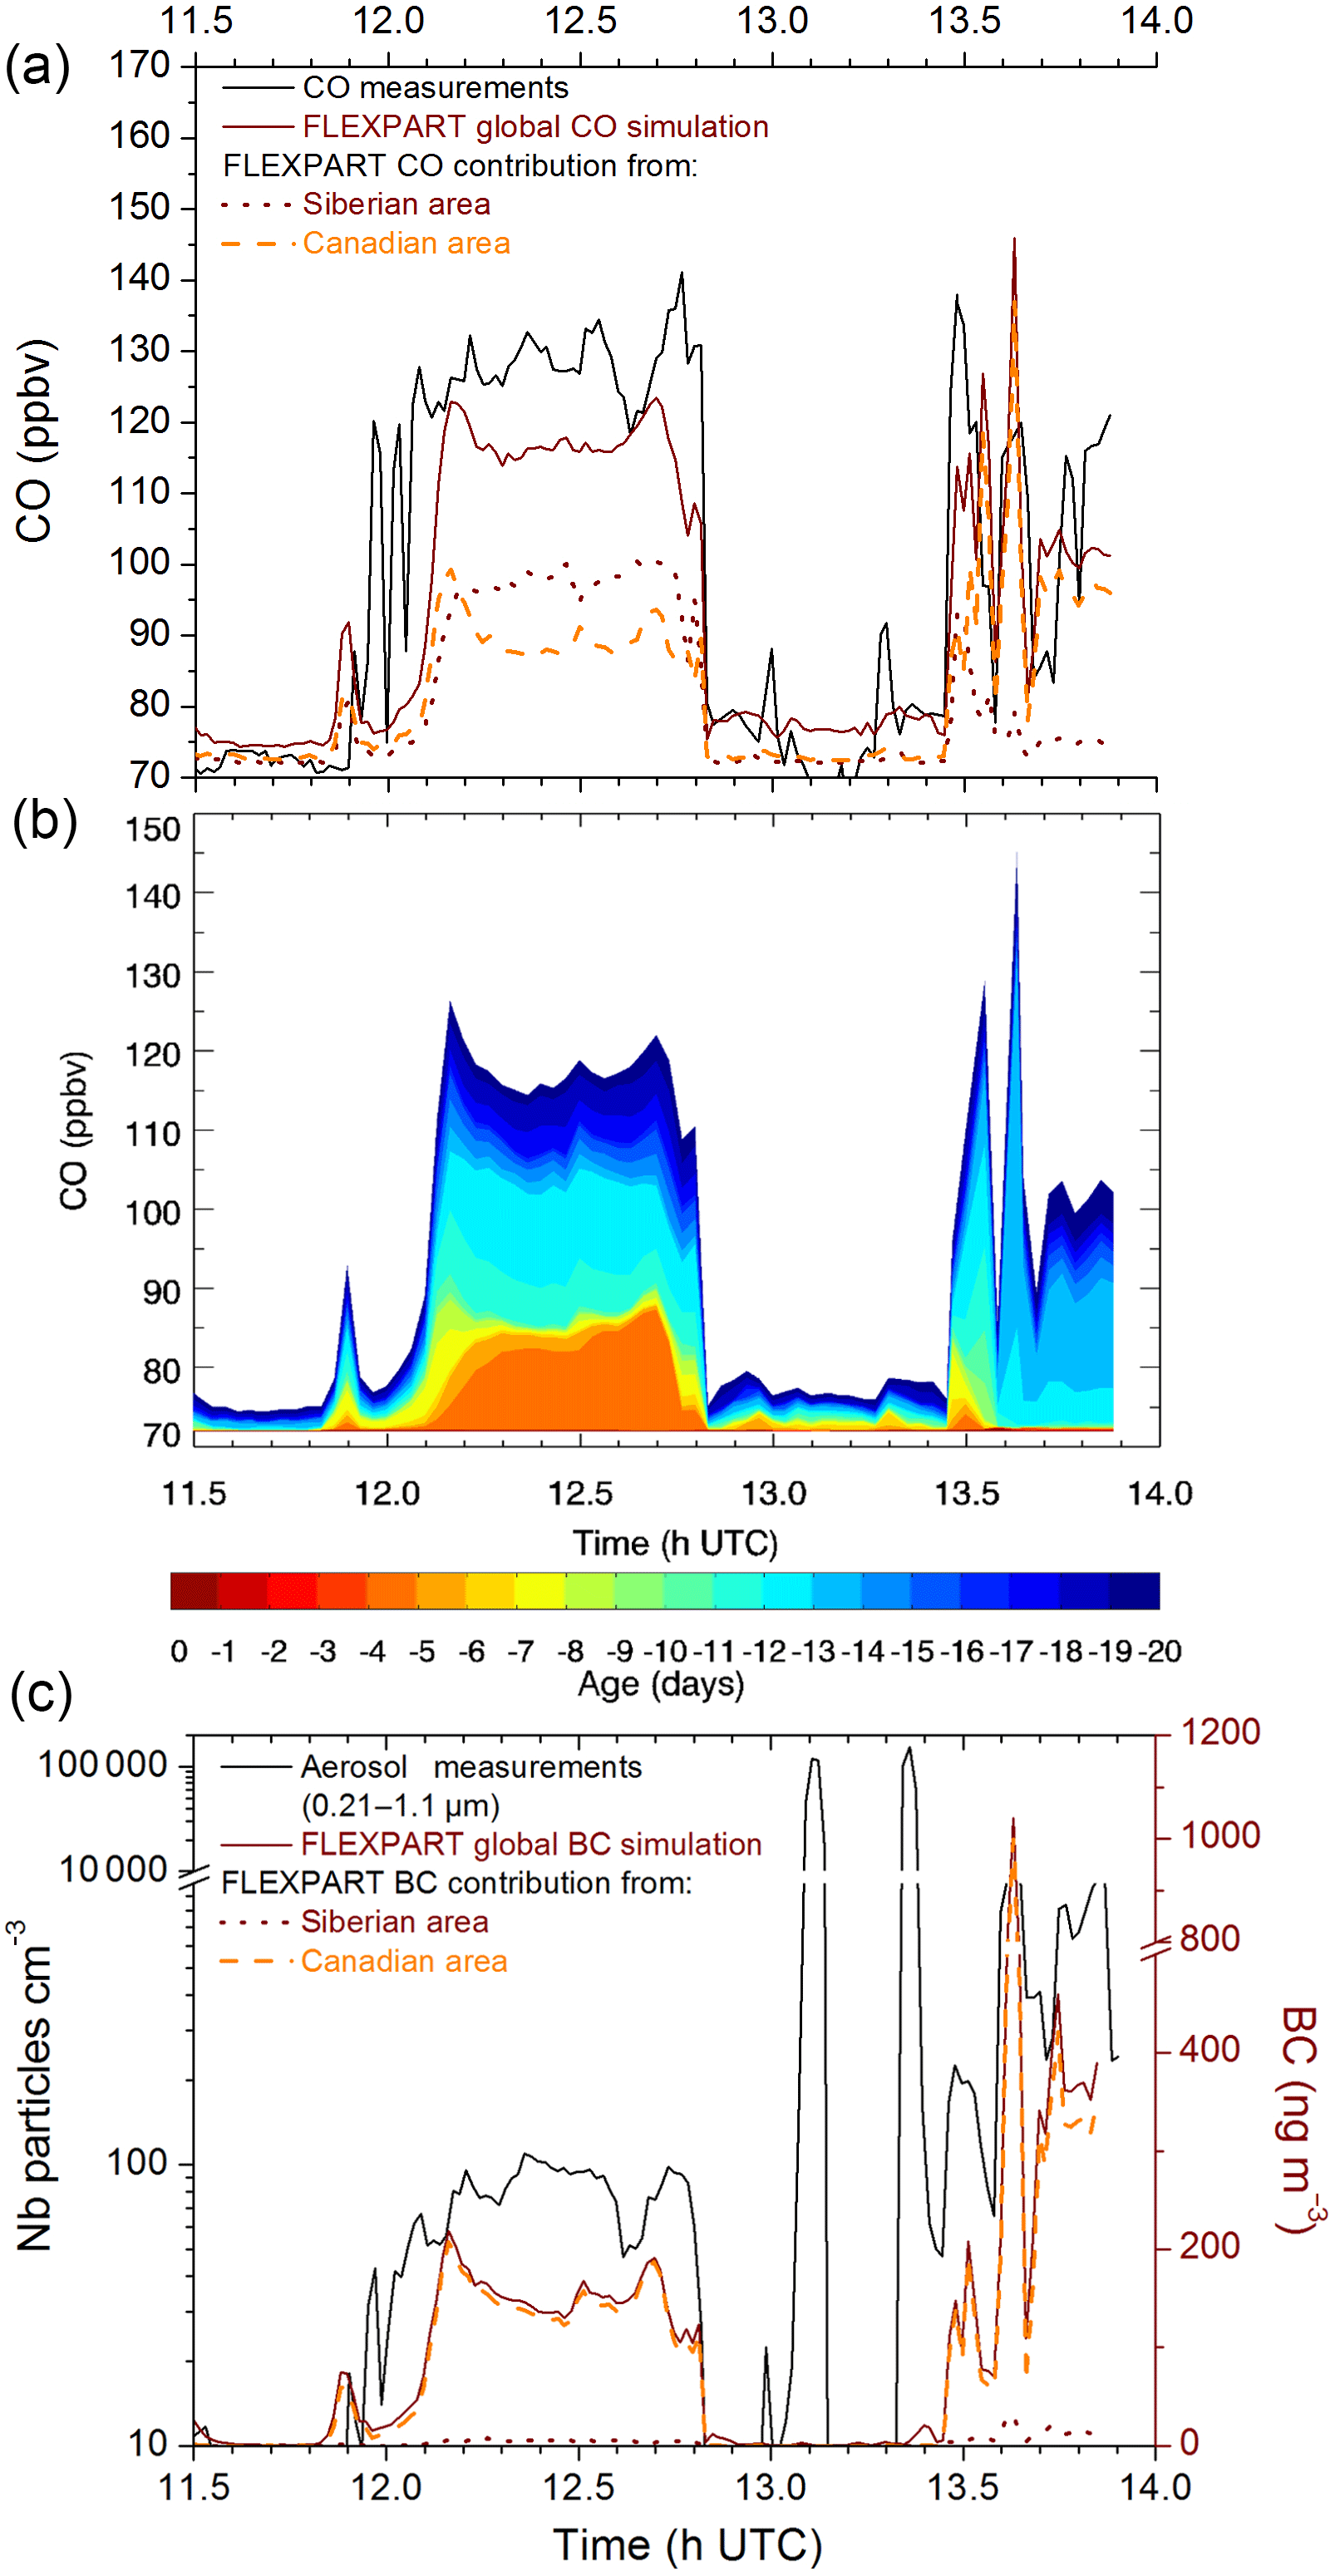
Figure 6Zoom on a part of F2 from 11:30 to 14:00 UTC above Sardinia at 5.4 km with an injection height up to 10 km in FLEXPART. (a) CO time evolution along the flight: SPIRIT vmr (degraded to FLEXPART time resolution) and FLEXPART simulations. (b) CO vmr calculated by FLEXPART, colour-coded according to the age, from 1 to 20 days before F2, of the air mass. (c) BC time evolution along the flight: PCASP measurements (degraded to FLEXPART time resolution) and FLEXPART simulations.
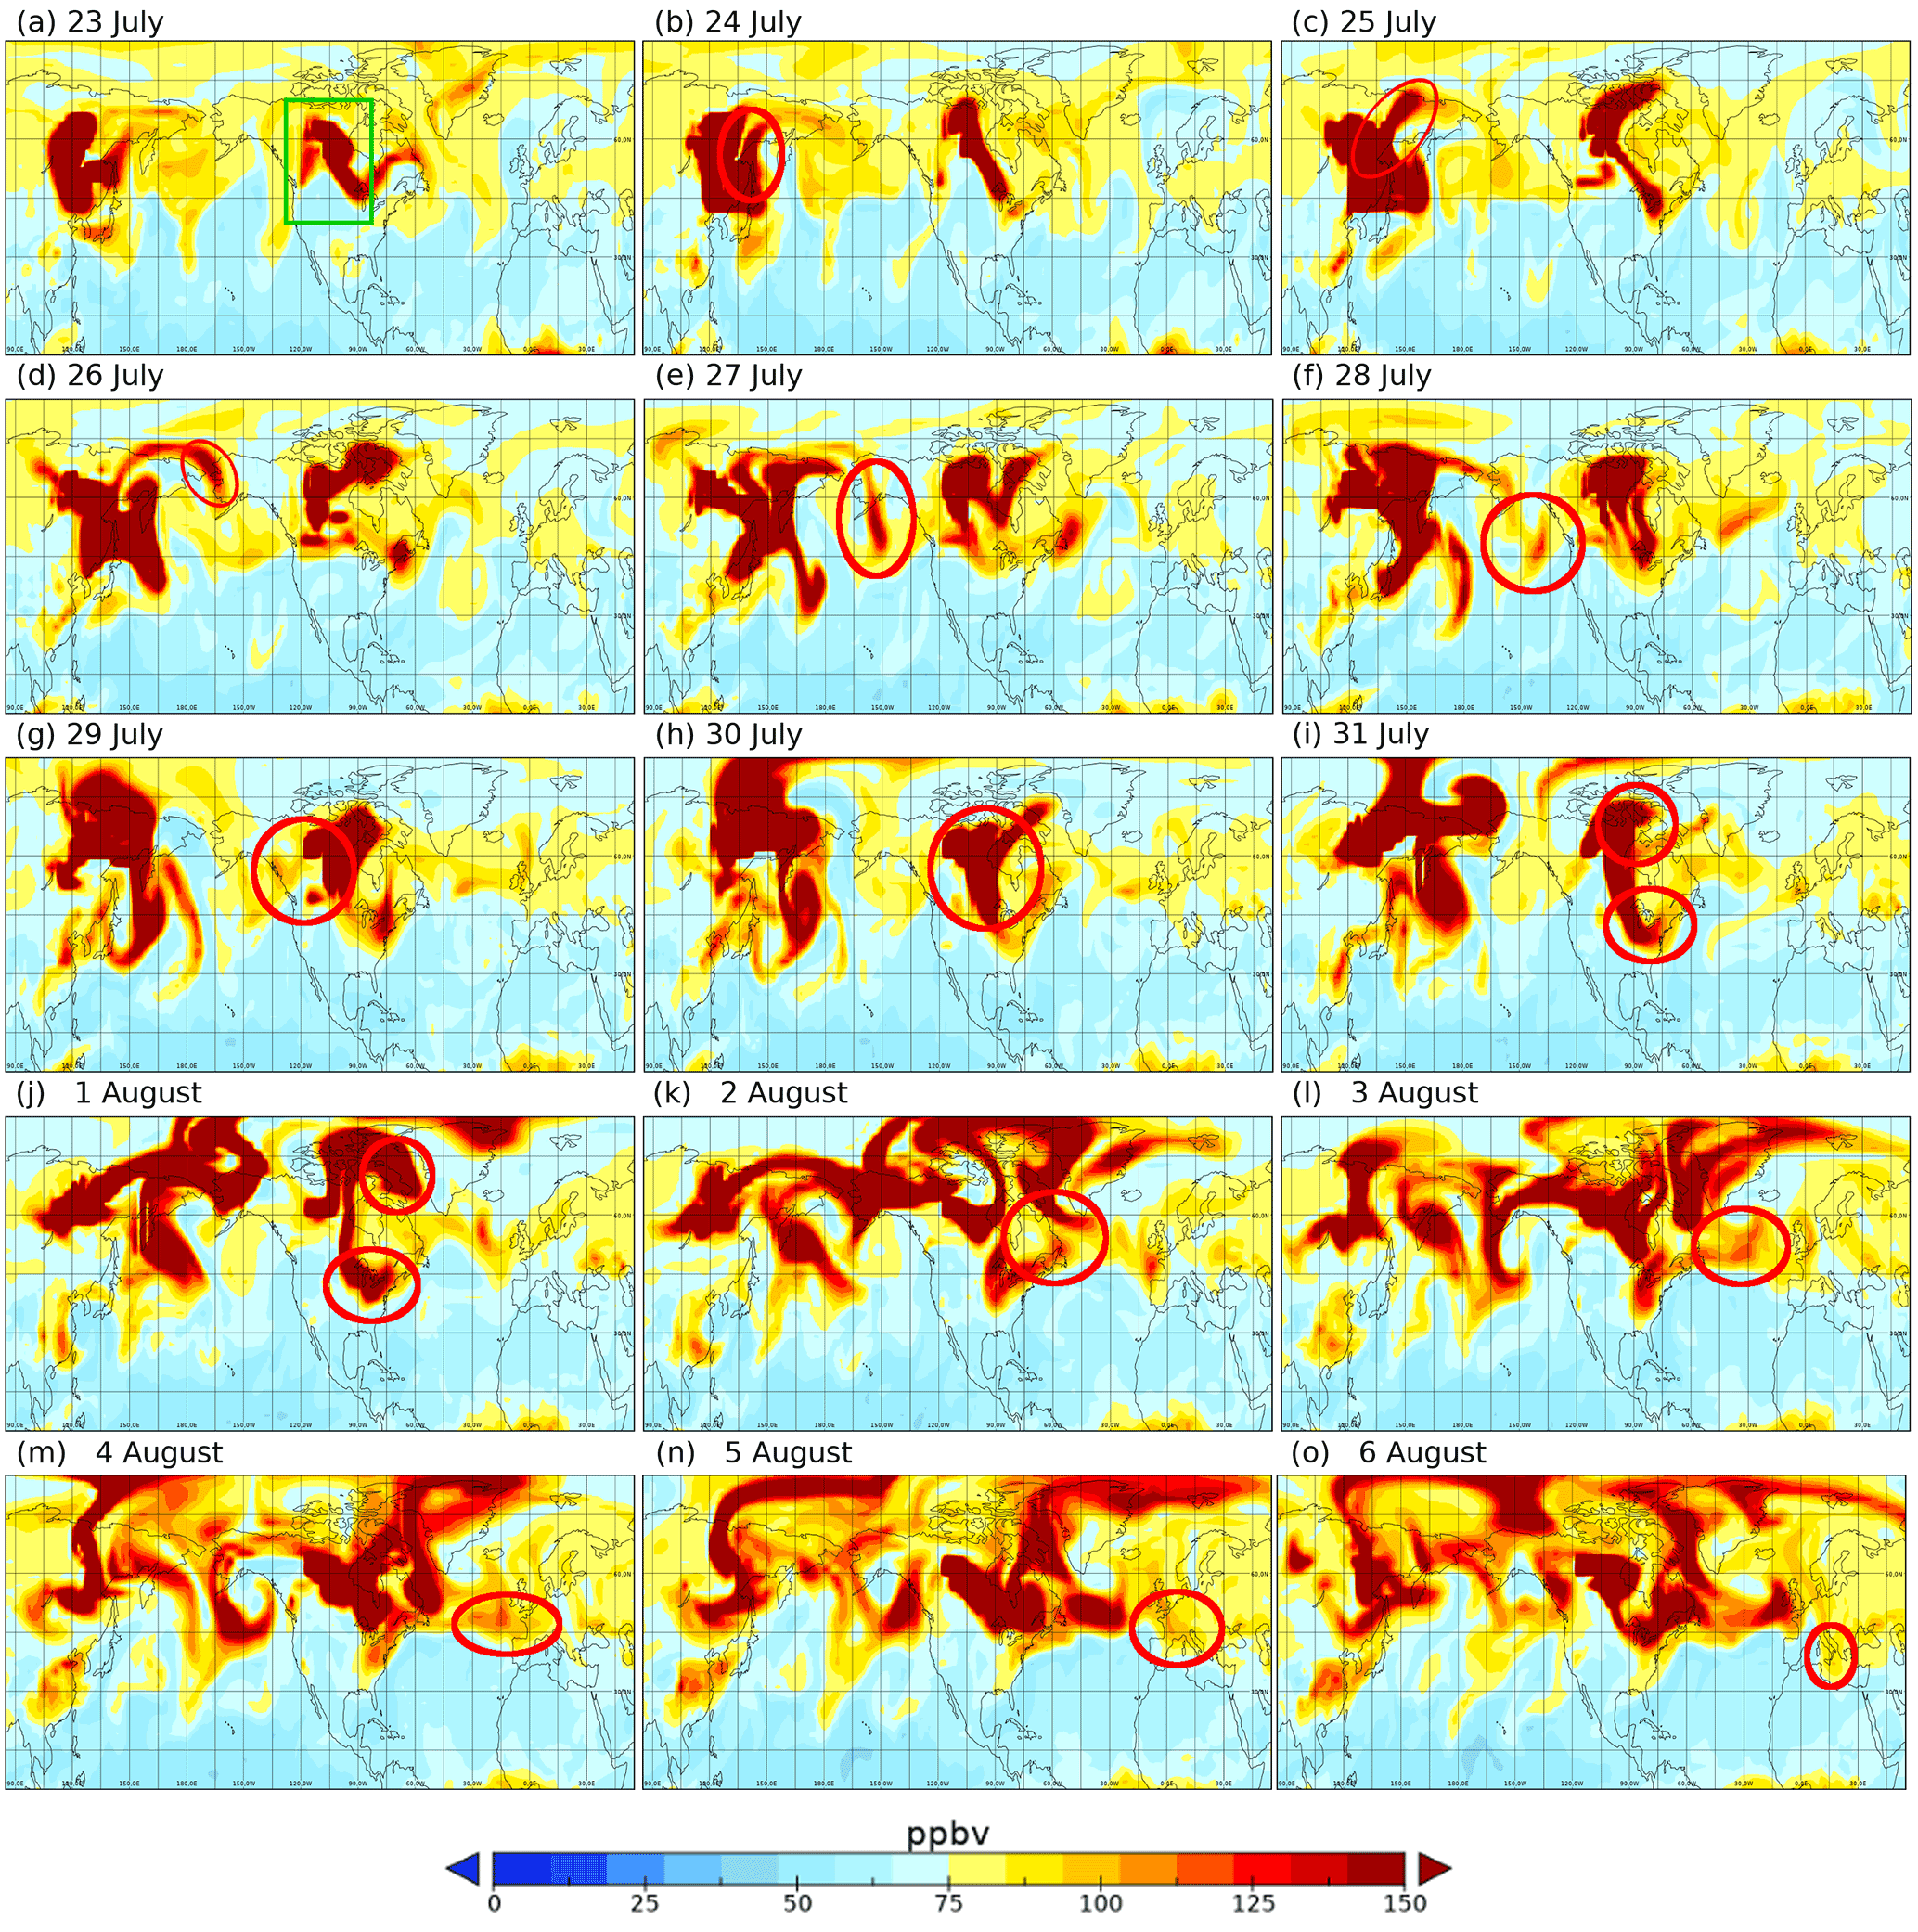
Figure 7CO concentrations at 12:00 UTC between 23 July and 6 August 2014 at 5.5 km in altitude simulated by the MOCAGE model. The red ellipses are used to follow the biomass burning trace in CO along the trajectory. The green square in panel (a) corresponds to the box used for Fig. 8.
For the simulations of BC, the contribution map for an injection height of 10 km shows that Canada and Siberia are the main sources of emissions as well (not shown). The loading of aerosols from 12:00 to 12:48 UTC simulated by FLEXPART is correlated to the measurements, as illustrated in Fig. 6c. Two peaks of aerosols, not concomitant with CO, are also measured around 13:06 and 13:24 UTC (Fig. 5). FLEXPART simulation shows that these peaks are not related to biomass burning as it is not reproduced by the model (Fig. 6c). These two spikes of aerosols could be considered as being dust particles as they also appear in the 1.1–3.1 µm size range measured by the PCASP instrument (not shown). Concerning the BC contribution from 12:00 to 12:48 UTC for each area, Canada is the main contributor for the whole peak (Fig. 6c). BC emitted by the Siberian fires 13 to 12 days before the flight travelled longer than the BC emitted by Canadian fires. Wet and dry removal is activated in FLEXPART simulations. Both phenomena closely depend on the particle size and on humidity and temperature from the meteorological input data for the wet deposition. These phenomena induce short lifetime for the particles from a few hours to a few days (Bond et al., 2013) and explain why Siberia does not contribute significantly to the aerosol content sampled by the aircraft for F2.
Transpacific transport of CO and particles from the Asian continent to the northeast Pacific is well documented (e.g. Bertschi et al., 2004 and references therein; Jaffe et al., 2004; Spichtinger et al., 2004; Heald et al., 2003, 2006, and references therein; Bertschi and Jaffe, 2005; Holzer et al., 2005) with a transport within 5 to 8 days and with plumes at altitudes ranging from the middle to the upper troposphere. Boreal forest fires, most frequent in Canada and Siberia (Spichtinger et al., 2004), occur mainly from May to October (Lavoué et al., 2000). The location of Siberian emissions is in agreement with Liang et al. (2004), who indicate that summertime emissions from boreal forest fires are exported at latitudes higher than 55∘ N, which is confirmed by Spichtinger et al. (2004) with the highest concentrations above Siberia found at latitudes up to 70∘ N. Extreme CO concentrations (as high as 800 ppbv) were measured around Lake Baikal at 8.0–12.5 km altitude (Nedelec et al., 2005). Such an event with eastward circumnavigation starting from Russia to Europe is reported in Damoah et al. (2004). In this study, the plume simulated by FLEXPART over Alaska was found at altitudes between 2 and 5 km and a little higher above Canada, between 4 and 7 km. In Spichtinger et al. (2004), eastward transport of Siberian fire emissions in 1998 towards Canada followed by transport towards Europe is reported. There, again, the plume over Canada was found at higher altitude (2–8 km) than the one above the Siberian source region (0–6 km).

Figure 8(a) Longitude-altitude cross section of the mean CO concentrations from MOCAGE on 1 August, 12:00 UTC, between 40 and 70∘ N. (b) Vertical wind between 40 and 70∘ N (box represented by the green square on Fig. 7a) on 1 August 12:00 UTC. (c) Mean wind field at 5.5 km a.s.l. between 3 and 6 August.
To conclude, about 12 to 13 days before our flight F2, the air masses originated from Siberia, where they have been loaded in CO and aerosols because of boreal forest fires. The smoke plume travelled eastward to Canada where the air masses have been loaded again in pollutants because of fires in this region. They then crossed the Atlantic at 50∘ N and went southeastward off European coasts up to the western MB where they were detected by our aircraft instruments on 6 August at ∼ 5.4 km altitude above Sardinia.
3.2.2 Analysis of the transport of the air mass to the MB using MOCAGE
To complete the analysis performed with back trajectories from FLEXPART simulations, 3-D MOCAGE CTM simulations of the global atmospheric composition for the biomass burning event reaching the MB on 6 August (F2) are performed. This allows us to confirm the origin of the pollution using a complementary tool. As in the FLEXPART simulations, the biomass burning emissions, taken from the GFAS inventory, are set up to an injection height of 10 km. Meteorological fields are taken from the operational analysis of the ARPEGE numerical weather prediction model used at Météo-France. The dynamics is then slightly different from the one used in FLEXPART simulations. Figure 7 presents the CO concentration (in ppbv) at 5.5 km altitude between 23 July (a) and 6 August (o) at 12:00 UTC. The red ellipses correspond to the position of the air mass from 23 July to 6 August reaching the MB at the time of the observations during F2 above Sardinia. This figure is to be compared with Fig. 2c, representing the footprint for the 20-day backward simulation made with FLEXPART relative to this episode.
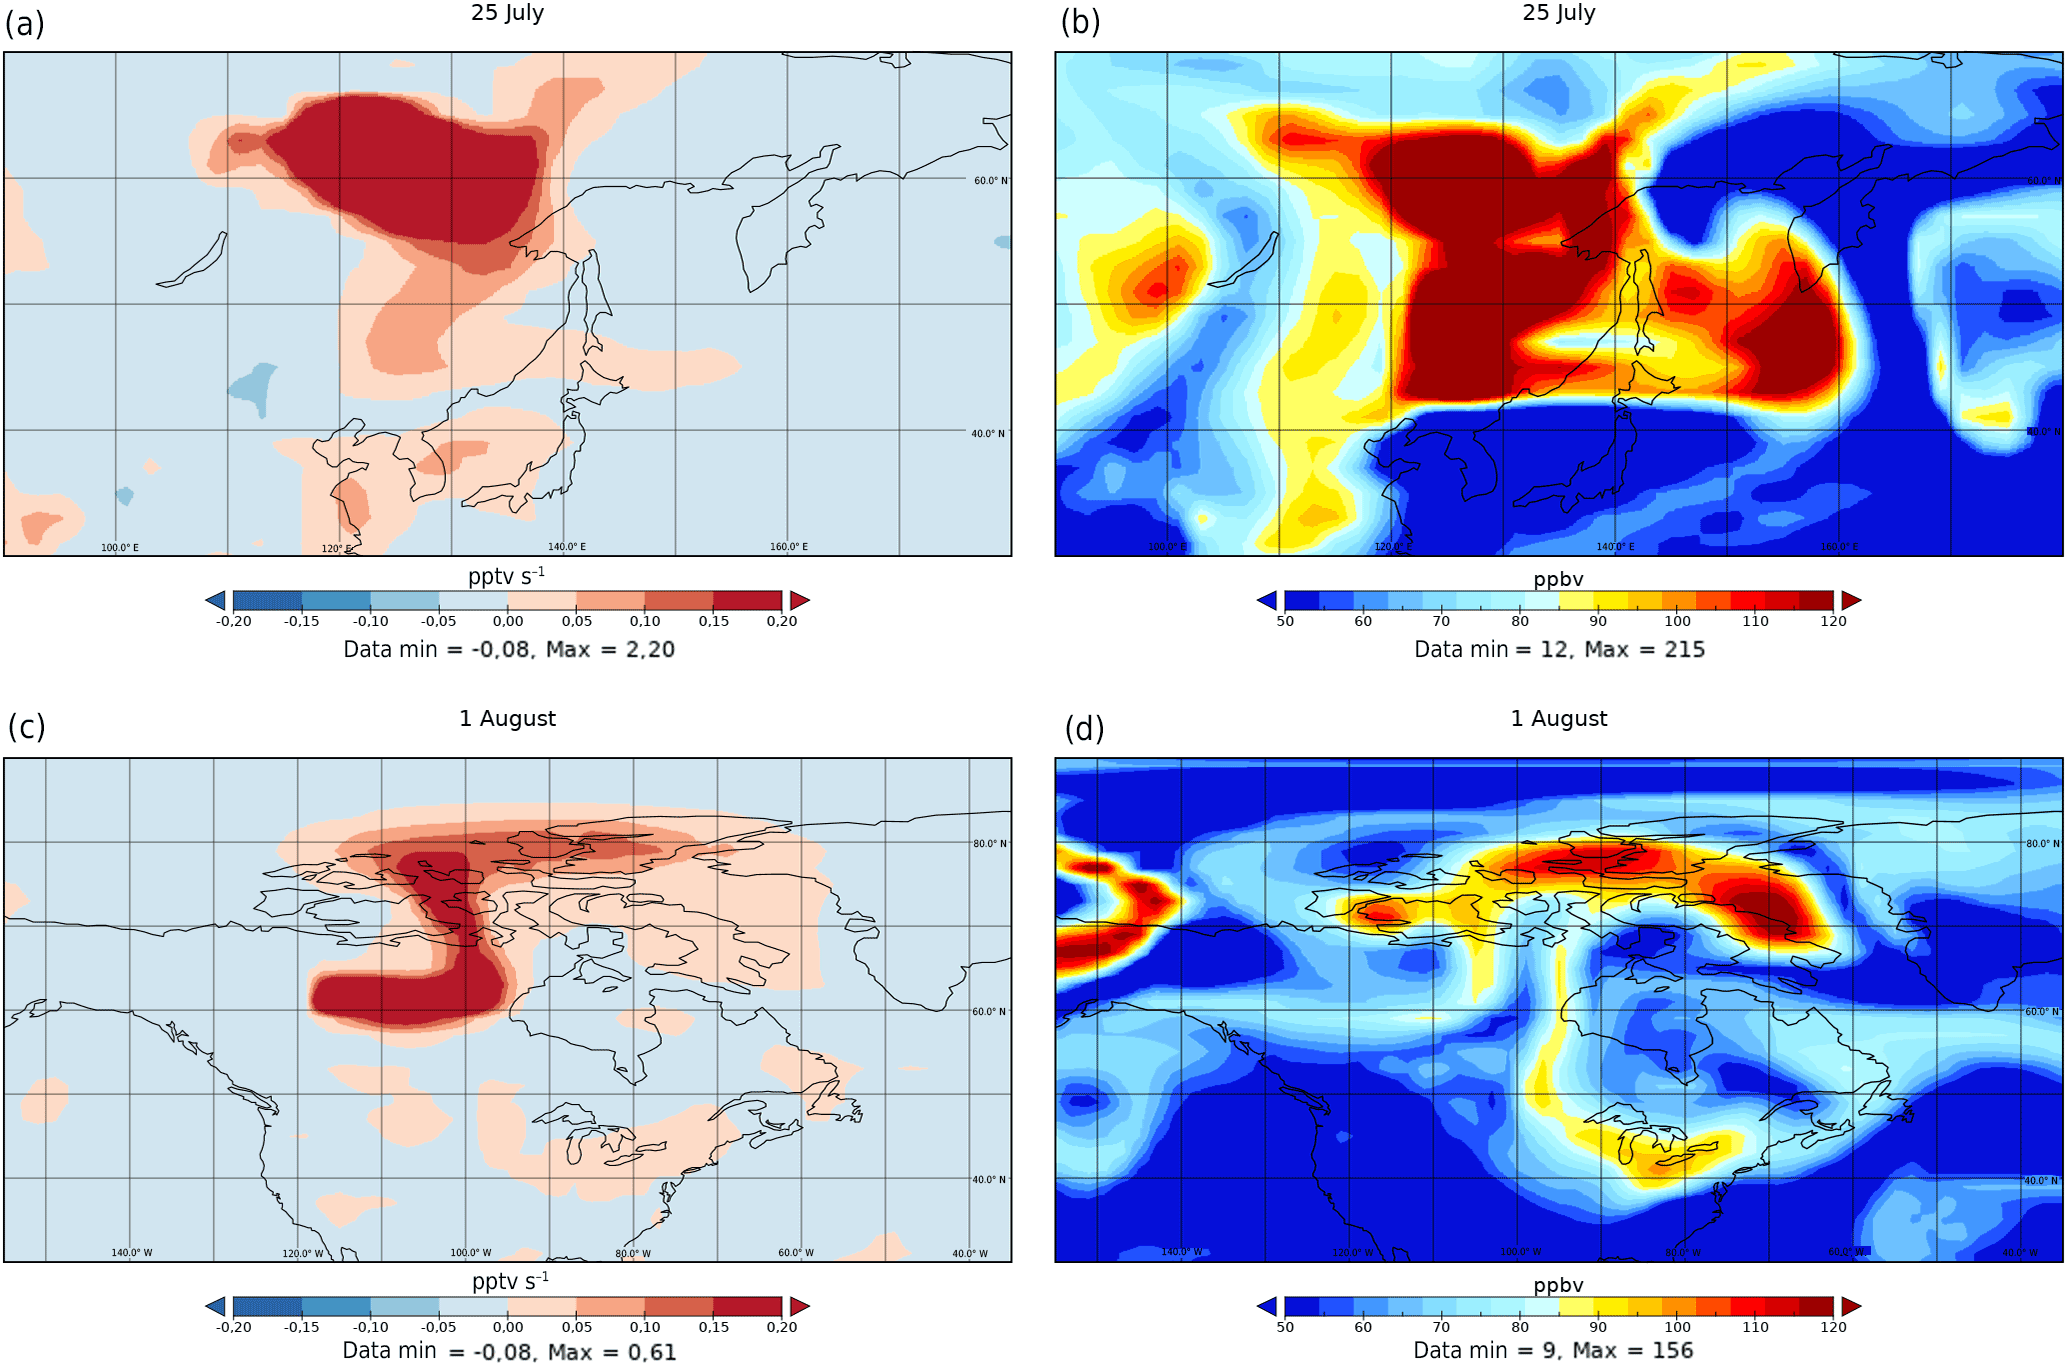
Figure 9(a, c) Production of O3 (in pptv s−1) and (b, d) concentrations of O3 (in ppbv) on 25 July over Siberia (a, b) and 1 August 2014 over North America (c, d) at 5.5 km in altitude simulated by the MOCAGE model.
There are biomass burning emissions between 23 and 26 July (Fig. 7a to d) over Siberia. A part of these emissions is transported towards the North American continent. This transport starts with a branch going north over the Bering Strait before doing a curl over the Pacific Ocean off the coast of Canada between 26 and 30 July (Fig. 7d to h). This behaviour is consistent with the FLEXPART footprint in Fig. 2c showing a curl over the Pacific Ocean.
Between 31 July and 3 August (Fig. 7i to l), there are biomass burning emissions over North America which get mixed with the biomass burning plume coming from Siberia. Figure 8a and b present cross sections of the mean CO concentration and the vertical wind in a box between 40 and 70∘ N for 1 August 12:00 UTC (the area is represented in green in Fig. 7a), respectively. Figure 8a shows the track of the CO coming from Siberia (between 130 and 100∘ W) mixing with the fresh emissions over North America (around 95∘ W). This figure suggests a descent of the air mass including CO transported from Siberia towards North America where biomass burning fires occur. This idea is supported by the vertical wind speed represented in Fig. 8b where positive values are a sign of subsidence. During this period (Fig. 7i–k), one can see a separation over the North American continent with a branch passing over northern Canada and a second one over the United States. This is also consistent with the FLEXPART footprint, which shows a preferential trajectory for the northern branch.
Between 3 and 6 August (Fig. 7l to o), the pollution measured during F2 travelled around 5.5 km height from the east coast of the North American continent to the MB via the fast jet winds (Fig. 8c), which represent the mean wind field at 5.5 km between 3 and 6 August. These strong winds at 5.5 km correspond to the lower part of a high-altitude jet located around 10 km height (not shown). This travel of the plume over the Atlantic Ocean is similarly found by the FLEXPART backward simulation (Fig. 2c).
At the time and location of the measurements, the simulation made with the model MOCAGE gives CO vmr around 90 ppbv in the plume and 60 ppbv in the area around (Fig. 7o). Even if these values are lower than the measured ones, MOCAGE reproduces the variation of CO inside and outside the plume. The horizontal resolution of the model, being 2∘ × 2∘, induces a dilution of the emissions and then a diffusion during the transport of the plume over several days. The FLEXPART simulation shows a slightly dominant contribution for the Siberian part of the fire emissions compared to North America (Fig. 6a). The numerical estimation of the contribution from the Siberian and the North American fire emissions was not directly calculated by MOCAGE. However, according to the modelled concentrations, the contribution of the Siberian part seems to be less than the contribution of the North American part. The different dynamical fields used for the simulations (ARPEGE for MOCAGE and ERA-Interim for FLEXPART) can produce differences in the results. These can also be explained by the model configuration, since FLEXPART is a Lagrangian model, while MOCAGE is a 3-D CTM using a semi-Lagrangian transport. The geometry of MOCAGE with coarse resolution along with the model diffusion makes the longer transport of the Siberian emissions more diluted than the North American emissions.
4.1 Plume age calculation by the aircraft measurements
The simultaneous increase of CO and O3 measurements shows the production of O3 inside the plume (Figs. 1 and 5). The ratio ΔO3 ∕ ΔCO for the increase of the species with respect to their background values averaged over 20 min before and after these increases for F2 and F8, respectively, is about 0.25 for flight 8 and about 0.50 for flight 2. It has been shown that this ratio increases with the age of the plume (Jaffe and Widger, 2012). For our two flights and for boreal regions, these ratios correspond to a plume age ≥ 5 days (Jaffe and Widger, 2012; Parrington et al., 2013; Arnold et al., 2015). More precisely, the ratio gives an approximate plume age of 6–10 days for F8 and of 13–15 days for F2 (Jaffe and Widger, 2012), in agreement with the age of the air mass calculated with FLEXPART.
4.2 Analysis of O3 production with MOCAGE
In this section, MOCAGE simulation is used to analyse the O3 production inside the biomass burning plume during long-range transport. For flight F2, the emissions are set up to an injection height of 10 km without any coefficient applied to the emissions. MOCAGE simulates fairly well the O3 background, which is ∼ 40 ppbv compared to ∼ 32 ppbv for the measurements (not shown). The simulation reproduces the variability of O3 in good agreement with the measurements. For the first period of interest, between 12:00 and 12:48 UTC, MOCAGE simulates an increase of ∼ 25 ppbv O3 compared to ∼ 35 ppbv for the measurements. For the second period of interest, at about 13:30 UTC, MOCAGE simulates an increase of ∼ 30 ppbv compared to ∼ 50 ppbv for the measurements. Note that MOCAGE provides smoother peaks than the observations because of the finer resolution of the observations compared to the model. Considering this, MOCAGE reproduces well the measurements of flight F2 and is thus used to study the production of O3 along the transport.
Figure 9 shows both the O3 vmr and O3 production on 25 July and 1 August at 5.5 km in altitude. The complete panels of maps from 23 July to 6 August are provided as a Supplement to follow the production (Fig. S1 in the Supplement) and the concentrations (Fig. S2) of O3 during the travel of the air mass from Siberia to the MB. It shows high O3 production in the biomass burning plume up to 3 days after the emission (Fig. S1). After that, the ozone production is lowered, indicating an aging of the air mass. On 25 July, the production of O3 is visible above Siberia between 40 and 70∘ N (Fig. 9a). Figure 9b shows this production of O3 with concentrations of O3 greater than 110 ppbv in the same area. Then, the air mass crosses the Pacific Ocean before arriving above Canada. On 1 August, the simulation shows the production of O3 between 30 and 90∘ N (Fig. 9c). The concentrations of O3 in Fig. 9d are more important in this area, especially around 45∘ N with concentrations up to ∼ 100 ppbv and around 70∘ N with concentrations up to more than 120 ppbv.
This study describes two remarkable events of long-range transport of biomass burning above Sardinia in the western Mediterranean during the ChArMEx-GLAM airborne campaign in August 2014. The in situ measurements of the campaign contribute to expand the few available in situ observations needed to better describe the trace gas distribution over the MB. In one case (F8, 10 August) a very intense peak of CO of about 260 ppbv was measured at about 9.7 km a.s.l., correlated to an O3 and aerosol peak and a decrease in RH. In the other case (F2, 6 August) an enhancement of CO, O3 and aerosols as well as a decrease in RH were measured at about 5.4 km a.s.l. and lasted for more than 40 min along the flight. We make use of in situ measurements of CO and aerosols that we combined with models to analyse the intercontinental transport. The origin of those events is studied thanks to the Lagrangian transport model FLEXPART. Using the potential emission sensitivity maps and selecting specific areas applied to the contribution maps show that, in the 10 August episode, emissions from the North American continent travelled during about 5 days before being measured in the MB and that, in the 6 August episode, biomass burning emissions from Siberia circumnavigated eastward over the globe before arriving above Canada, where the air mass was loaded again in biomass burning emissions and finally impacted the MB free troposphere. In this last case, the 3-D CTM MOCAGE confirms this transport from Siberia towards North America and then towards the MB. FLEXPART was able to reproduce BC and CO biomass burning contribution after having adjusted the two following parameters: the injection height and the amplification of the CO emissions from GFAS inventory. The change in injection height can be explained by the fact that pyroconvection is not taken into account in the model. The choice of this altitude of injection is validated with CALIOP and AIRS data and GFAS estimations of injection height. Finally, a height of 10 km is set in both cases. MOCAGE, with an injection height set at 10 km as well, qualitatively reproduces CO and O3 concentration variations. A detailed study of the transport of the air mass for the 6 August case reveals a subsidence leading to a descent of CO from Siberia towards North America. Then, this pollution travels from the East coast of the North American continent to the MB at an altitude of about 5.5 km, in the lower part of a high-altitude jet. Throughout of this transport, MOCAGE simulates fairly well the production of O3 inside the plume and in particular in the vicinity of the fire emission sources.
It would be interesting in the future to perform specific simulations in order to quantify the frequency of occurrence of those long-range transport events of high-latitude summer forest fires.
All the GLAM airborne data are freely available online at https://doi.org/10.6096/MISTRALS-ChArMEx.1267 (Catoire, 2016) and https://doi.org/10.6096/MISTRALS-ChArMEx.1317 (Piguet and Ricaud, 2015).
The supplement related to this article is available online at: https://doi.org/10.5194/acp-18-6887-2018-supplement.
FD coordinated the ChArMEx program and PR was the initiator and coordinator of the GLAM campaign. PR, RZ and VC participated in the SPIRIT measurements on board the Falcon 20 and performed flight data analyses. FLEXPART simulations were performed by GK and VB. The study of air mass transport and regional chemistry modelling was conducted by JGuth, VM and LEA. VB wrote the manuscript with contribution from all co-authors.
The authors declare that they have no conflict of interest.
This article is part of the special issue “CHemistry and AeRosols Mediterranean EXperiments (ChArMEx) (ACP/AMT inter-journal SI)”. It is not associated with a conference.
The authors thank Stéphane Chevrier and Claude Robert for conducting SPIRIT
measurements and for their instrumental support during the campaign. The
SAFIRE (Service des Avions Français Instrumentés pour la Recherche en
Environnement) crew is acknowledged for flying operations and Bruno Piguet for the
aircraft instrumental data processing. Measurements at Lampedusa by ENEA were
partly supported by the Italian Ministry for University and Research through
the NextData and Ritmare projects. We thank Sferlazzo di Sarra and
Piacentino di Ioro for providing the dataset used in this study. The AIRS
project is supported by the NASA Earth Observing System Program. CO from AIRS
data were obtained from the NASA Giovanni system. We would like to thank the
Centre National de la Recherche Scientifique – Institut National des
Sciences de l'Univers (CNRS-INSU), Centre National des Etudes Spatiales
(CNES), Agence de l'Environnement et de la Maîtrise de l'Energie
(ADEME), Météo-France, and the Commissariat à l'Energie Atomique
et aux Energies Alternatives (CEA) that funded the Chemistry-Aerosol
Mediterranean Experiment (ChArMEx) as part of the programme Mediterranean
Integrated STudies at Regional And Local Scales (MISTRALS). This work was
funded by the Labex VOLTAIRE (ANR-10-LABX-100-01) and the PIVOTS project
provided by the Région Centre – Val de Loire (ARD 2020 program and CPER
2015–2020).
Edited by: Matthias
Beekmann
Reviewed by: two anonymous referees
AIRS Science Team/Joao Texeira: AIRS/Aqua L3 Daily Standard Physical Retrieval (AIRS+AMSU) 1 degree × 1 degree V006, Greenbelt, MD, USA, Goddard Earth Sciences Data and Information Services Center (GES DISC), Accessed July 2017, https://doi.org/10.5067/AQUA/AIRS/DATA301, 2013.
Ancellet, G., Pelon, J., Totems, J., Chazette, P., Bazureau, A., Sicard, M., Di Iorio, T., Dulac, F., and Mallet, M.: Long-range transport and mixing of aerosol sources during the 2013 North American biomass burning episode: analysis of multiple lidar observations in the western Mediterranean basin, Atmos. Chem. Phys., 16, 4725–4742, https://doi.org/10.5194/acp-16-4725-2016, 2016.
Andreae, M. O. and Merlet, P.: Emission of trace gases and aerosols from biomass burning, Global Biogeochem. Cy., 15, 955–966, https://doi.org/10.1029/2000GB001382, 2001.
Arnold, S. R., Emmons, L. K., Monks, S. A., Law, K. S., Ridley, D. A., Turquety, S., Tilmes, S., Thomas, J. L., Bouarar, I., Flemming, J., Huijnen, V., Mao, J., Duncan, B. N., Steenrod, S., Yoshida, Y., Langner, J., and Long, Y.: Biomass burning influence on high-latitude tropospheric ozone and reactive nitrogen in summer 2008: a multi-model analysis based on POLMIP simulations, Atmos. Chem. Phys., 15, 6047–6068, https://doi.org/10.5194/acp-15-6047-2015, 2015.
Bertschi, I. T. and Jaffe, D. A.: Long-range transport of ozone, carbon monoxide, and aerosols to the NE Pacific troposphere during the summer of 2003: Observations of smoke plumes from Asian boreal fires, J. Geophys. Res., 110, D05303, https://doi.org/10.1029/2004JD005135, 2005.
Bertschi, I. T., Jaffe, D. A., Jaeglé, L., Price, H. U., and Dennison, J. B.: PHOBEA/ITCT 2002 airborne observations of transpacific transport of ozone, CO, volatile organic compounds, and aerosols to the northeast Pacific: Impacts of Asian anthropogenic and Siberian boreal fire emissions, J. Geophys. Res., 109, D23S12, https://doi.org/10.1029/2003JD004328, 2004.
Bond, T. C., Doherty, S. J., Fahey, D. W., Forster, P. M., Berntsen, T., DeAngelo, B. J., Flanner, M. G., Ghan, S., Kärcher, B., Koch, D., Kinne, S., Kondo, Y., Quinn, P. K., Sarofim, M. C., Schultz, M. G., Schulz, M., Venkataraman, C., Zhang, H., Zhang, S., Bellouin, N., Guttikunda, S. K., Hopke, P. K., Jacobson, M. Z., Kaiser, J. W., Klimont, Z., Lohmann, U., Schwarz, J. P., Shindell, D., Storelvmo, T., Warren, S. G., and Zender, C. S.: Bounding the role of black carbon in the climate system: A scientific assessment, J. Geophys. Res.-Atmos., 118, 5380–5552, https://doi.org/10.1002/jgrd.50171, 2013.
Bougiatioti, A., Bezantakos, S., Stavroulas, I., Kalivitis, N., Kokkalis, P., Biskos, G., Mihalopoulos, N., Papayannis, A., and Nenes, A.: Biomass-burning impact on CCN number, hygroscopicity and cloud formation during summertime in the eastern Mediterranean, Atmos. Chem. Phys., 16, 7389–7409, https://doi.org/10.5194/acp-16-7389-2016, 2016.
Cammas, J.-P., Brioude, J., Chaboureau, J.-P., Duron, J., Mari, C., Mascart, P., Nédélec, P., Smit, H., Pätz, H.-W., Volz-Thomas, A., Stohl, A., and Fromm, M.: Injection in the lower stratosphere of biomass fire emissions followed by long-range transport: a MOZAIC case study, Atmos. Chem. Phys., 9, 5829–5846, https://doi.org/10.5194/acp-9-5829-2009, 2009.
Catoire, V.: FALCON20 SPIRIT – LPC2E – SOP2 – GLAM, SEDOO OMP, https://doi.org/10.6096/mistrals-charmex.1267, 2016.
Catoire, V., Robert, C., Chartier, M., Jacquet, P., Guimbaud, C., and Krysztofiak, G.: The SPIRIT airborne instrument: a three-channel infrared absorption spectrometer with quantum cascade lasers for in-situ atmospheric trace-gas measurements, Appl. Phys. B., 123, 244, https://doi.org/10.1007/s00340-017-6820-x, 2017.
Colarco, P. R., Schoeberl, M. R., Doddridge, B. G., Marufu, L. T., Torres, O., and Welton, E. J.: Transport of smoke from Canadian forest fires to the surface near Washington, D.C.: Injection height, entrainment, and optical properties, J. Geophys. Res., 109, D06203, https://doi.org/10.1029/2003JD004248, 2004.
Courtier, P., Freydier, C., Geleyn, J. F., Rabier, F., and Rochas, M.: The ARPEGE project at METEO-FRANCE. In: Proc ECMWF Workshop. Numerical methods in atmospheric modelling, 2, 193–231, ECMWF, Shinfield Park, Reading, UK, 1991.
Cristofanelli, P., Fierli, F., Marinoni, A., Calzolari, F., Duchi, R., Burkhart, J., Stohl, A., Maione, M., Arduini, J., and Bonasoni, P.: Influence of biomass burning and anthropogenic emissions on ozone, carbon monoxide and black carbon at the Mt. Cimone GAW-WMO global station (Italy, 2165 m a.s.l.), Atmos. Chem. Phys., 13, 15–30, https://doi.org/10.5194/acp-13-15-2013, 2013.
Dahlkötter, F., Gysel, M., Sauer, D., Minikin, A., Baumann, R., Seifert, P., Ansmann, A., Fromm, M., Voigt, C., and Weinzierl, B.: The Pagami Creek smoke plume after long-range transport to the upper troposphere over Europe – aerosol properties and black carbon mixing state, Atmos. Chem. Phys., 14, 6111–6137, https://doi.org/10.5194/acp-14-6111-2014, 2014.
Damoah, R., Spichtinger, N., Forster, C., James, P., Mattis, I., Wandinger, U., Beirle, S., Wagner, T., and Stohl, A.: Around the world in 17 days – hemispheric-scale transport of forest fire smoke from Russia in May 2003, Atmos. Chem. Phys., 4, 1311–1321, https://doi.org/10.5194/acp-4-1311-2004, 2004.
Damoah, R., Spichtinger, N., Servranckx, R., Fromm, M., Eloranta, E. W., Razenkov, I. A., James, P., Shulski, M., Forster, C., and Stohl, A.: A case study of pyro-convection using transport model and remote sensing data, Atmos. Chem. Phys., 6, 173–185, https://doi.org/10.5194/acp-6-173-2006, 2006.
Dee, D. P., Uppala, S. M., Simmons, A. J., Berrisford, P., Poli, P., Kobayashi, S., Andrae, U., Balmaseda, M. A., Balsamo, G., Bauer, P., Bechtold, P., Beljaars, A. C. M., van de Berg, L., Bidlot, J., Bormann, N., Delsol, C., Dragani, R., Fuentes, M., Geer, A. J., Haimberger, L., Healy, S. B., Hersbach, H., Hólm, E. V., Isaksen, L., Kållberg, P., Köhler, M., Matricardi, M., McNally, A. P., Monge-Sanz, B. M., Morcrette, J.-J., Park, B.-K., Peubey, C., de Rosnay, P., Tavolato, C., Thépaut, J.-N., and Vitart, F.: The ERA-Interim reanalysis: configuration and performance of the data assimilation system, Q. J. Roy. Meteor. Soc., 137, 553–597, https://doi.org/10.1002/qj.828, 2011.
de Gouw, J. A., Warneke, C., Stohl, A., Wollny, A. G., Brock, C. A., Cooper, O. R., Holloway, J. S., Trainer, M., Fehsenfeld, F. C., Atlas, E. L., Donnellly, S. G., Stroud, V., and Lueb, A.: Volatile organic compounds composition of merged and aged forest fire plumes from Alaska and western Canada, J. Geophys. Res., 111, D10303, https://doi.org/10.1029/2005JD006175, 2006.
Di Biagio, C., Doppler, L., Gaimoz, C., Grand, N., Ancellet, G., Raut, J.-C., Beekmann, M., Borbon, A., Sartelet, K., Attié, J.-L., Ravetta, F., and Formenti, P.: Continental pollution in the western Mediterranean basin: vertical profiles of aerosol and trace gases measured over the sea during TRAQA 2012 and SAFMED 2013, Atmos. Chem. Phys., 15, 9611–9630, https://doi.org/10.5194/acp-15-9611-2015, 2015.
Diehl, T., Heil, A., Chin, M., Pan, X., Streets, D., Schultz, M., and Kinne, S.: Anthropogenic, biomass burning, and volcanic emissions of black carbon, organic carbon, and SO2 from 1980 to 2010 for hindcast model experiments, Atmos. Chem. Phys. Discuss., 12, 24895–24954, https://doi.org/10.5194/acpd-12-24895-2012, 2012.
Doche, C., Dufour, G., Foret, G., Eremenko, M., Cuesta, J., Beekmann, M., and Kalabokas, P.: Summertime tropospheric-ozone variability over the Mediterranean basin observed with IASI, Atmos. Chem. Phys., 14, 10589–10600, https://doi.org/10.5194/acp-14-10589-2014, 2014.
Duncan, B. N., West, J. J., Yoshida, Y., Fiore, A. M., and Ziemke, J. R.: The influence of European pollution on ozone in the Near East and northern Africa, Atmos. Chem. Phys., 8, 2267–2283, https://doi.org/10.5194/acp-8-2267-2008, 2008.
EC-JRC/PBL: Emission Database for Global Atmospheric Research (EDGAR), release version 4.2. European Commission, Joint Research Centre (JRC)/Netherlands Environmental Assessment Agency (PBL), available at: http://edgar.jrc.ec.europa.eu (last access: May 2017), 2011.
Elguindi, N., Clark, H., Ordóñez, C., Thouret, V., Flemming, J., Stein, O., Huijnen, V., Moinat, P., Inness, A., Peuch, V.-H., Stohl, A., Turquety, S., Athier, G., Cammas, J.-P., and Schultz, M.: Current status of the ability of the GEMS/MACC models to reproduce the tropospheric CO vertical distribution as measured by MOZAIC, Geosci. Model Dev., 3, 501–518, https://doi.org/10.5194/gmd-3-501-2010, 2010.
Emanuel, K. A. and Zivkovic-Rothman, M.: Development and evaluation of a convection scheme for use in climate models, J. Atmos. Sci., 56, 1766–1782, https://doi.org/10.1175/1520-0469(1999)056<1766:DAEOAC>2.0.CO;2, 1999.
Formenti, P., Reiner, T., Sprung, D., Andreae, M. O., Wendisch, M., Wex, H., Kindred, D., Dewey, K., Kent, J., Tzortziou, M., Vasaras, A., and Zerefos, C.: STAAARTE-MED 1998 summer airborne measurements over the Aegean Sea 1. Aerosol particles and trace gases, J. Geophys. Res., 107, 4450, https://doi.org/10.1029/2001JD001337, 2002.
Forster, C., Wandinger, U., Wotawa, G., James, P., Mattis, I., Althausen, D. Simmonds, P., O'Doherty, S., Jennings, S. G., Kleefeld, C., Schneider, J., Trickl, T., Kreipl, S., Jäger, H., and Stohl, A.: Transport of boreal forest fire emissions from Canada to Europe, J. Geophys. Res., 106, 22887–22906, https://doi.org/10.1029/2001JD900115, 2001.
Fromm, M., Bevilacqua, R., Servranckx, R., Rosen, J., Thayer, J. P., Herman, J., and Larko, D.: Pyro-cumulonimbus injection of smoke to the stratosphere: Observations and impact of a super blowup in northwestern Canada on 3–4 August 1998, J. Geophys. Res., 110, D08205, https://doi.org/10.1029/2004JD005350, 2005.
Fromm, M., Lindsey, D. T., Servranckx, R., Yue, G., Trickl, T., Sica, R., Doucet, E., and Godin-Beekmann, S. E.: The Untold Story of Pyrocumulonimbus, B. Am. Meteorol. Soc., 91, 1193–1209, https://doi.org/10.1175/2010bams3004.1, 2010.
Fromm, M. D. and Servranckx, R.: Transport of forest fire smoke above the tropopause by supercell convection, Geophys. Res. Lett., 30, 1542, https://doi.org/10.1029/2002GL016820, 2003.
Gerasopoulos, E., Kouvarakis, G., Vrekoussis, M., Kanakidou, M., and Mihalopoulos, N.: Ozone variability in the marine boundary layer of the eastern Mediterranean based on 7-year observations, J. Geophys. Res., 110, D15309, https://doi.org/10.1029/2005JD005991, 2005.
Giglio, L., Descloitres, J., Justice, C. O., and Kaufman, Y. J.: An enhanced contextual fire detection algorithm for MODIS, Remote Sens. Environ., 87, 273–282, 2003.
Giorgi, F. and Lionello, P.: Climate change projections for the Mediterranean region, Global Planet. Change, 63, 90–104, https://doi.org/10.1016/j.gloplacha.2007.09.005, 2008.
Granier, C., Bessagnet, B., Bond, T., D'Angiola, A., Denier van der Gon, H., Frost, G. J., Heil, A., Kaiser, J. W., Kinne, S., Klimont, Z., Kloster, S., Lamarque, J.-F., Liousse, C., Masui, T., Meleux, F., Mieville, A., Ohara, T., Raut, J.-C., Riahi, K., Schultz, M. G., Smith, S. J., Thompson, A., van Ardenne, J., van der Werf, G. R., and van Vuuren, D. P.: Evolution of anthropogenic and biomass burning emissions of air pollutants at global and regional scales during the 1980–2010 period, Climatic Change, 109, 163–190, 2011.
Guenther, A., Hewitt, N. C., Erickson, D., Fall, R., Geron, C., Graedel, T., Harley, P., Klinger, L., Lerdau, M., Mckay, W. A., Pierce, T., Scholes, B., Steinbrecher, R., Tallamraju, R., Taylor, J., and Zimmerman, P.: A global model of natural volatile organic compound emissions, J. Geophys. Res.-Atmos., 100, 8873–8892, 1995.
Guth, J., Josse, B., Marécal, V., Joly, M., and Hamer, P.: First implementation of secondary inorganic aerosols in the MOCAGE version R2.15.0 chemistry transport model, Geosci. Model Dev., 9, 137–160, https://doi.org/10.5194/gmd-9-137-2016, 2016.
Heald, C. L., Jacob, D. J., Fiore, A. M., Emmons, L. K., Gille, J. C., Deeter, M. N., Warner, J., Edwards, D. P., Crawford, J. H., Hamlin A. J., Sachse, G. W., Browell, E. V., Avery, M. A., Vay, S. A., Westberg, D. J., Blake, D. R., Singh, H. B., Sandholm, S. T., Talbot, R. W., and Fuelberg, H. E.: Asian outflow and trans-Pacific transport of carbon monoxide and ozone pollution: An integrated satellite, aircraft, and model perspective, J. Geophys. Res., 108, 4804, https://doi.org/10.1029/2003JD003507, 2003.
Heald, C. L., Jacob, D. J., Park, R. J., Alexander, B., Fairlie, T. D., Yantosca, R. M., and Chu, D. A.: Transpacific transport of Asian anthropogenic aerosols and its impact on surface air quality in the United States, J. Geophys. Res., 111, D14310, https://doi.org/10.1029/2005JD006847, 2006.
Holzer, M., Hall, T. M., and Stull, R. B.: Seasonality and weather-driven variability of transpacific transport, J. Geophys. Res., 110, D23103, https://doi.org/10.1029/2005JD006261, 2005.
Ichoku, C. and Kaufman, Y. J.: A method to derive smoke emission rates from MODIS fire radiative energy measurements, IEEE T. Geosci. Remote Sens., 43, 2636–2649, 2005.
Jaffe, D., Bertschi, I., Jaeglé, L., Novelli, P., Reid, J. S., Tanimoto, H., Vingarzan, R., and Westphal, D. L.: Long-range transport of Siberian biomass burning emissions and impact on surface ozone in western North America, Geophys. Res. Lett., 31, L16106, https://doi.org/10.1029/2004GL020093, 2004.
Jaffe, D. A. and Wigder, N. L.: Ozone production from wildfires: A critical review, Atmos. Environ., 51, 1–10, https://doi.org/10.1016/j.atmosenv.2011.11.063, 2012.
Josse, B., Simon, P., and Peuch, V.-H.: Radon global simulations with the multiscale chemistry and transport model MOCAGE, Tellus B, 56, 339–356, https://doi.org/10.1111/j.1600-0889.2004.00112.x, 2004.
Jost, H.-J., Drdla, K., Stohl, A., Pfister, L., Loewenstein, M., Lopez J. P., Hudson, P. K., Murphy, D. M., Cziczo, D. J., Fromm, M., Bui, T. P., Dean-Day, J., Gerbig, C., Mahoney, M. J., Richard, C. K., Spichtinger, N., Pittman, J. V., Weinstock, E. M., Wilson, J. C., and Xueref, I.: In-situ observations of mid-latitude forest fire plumes deep in the stratosphere, Geophys. Res. Lett., 31, L11101, https://doi.org/10.1029/2003GL019253, 2004.
Kaiser, J. W., Heil, A., Andreae, M. O., Benedetti, A., Chubarova, N., Jones, L., Morcrette, J.-J., Razinger, M., Schultz, M. G., Suttie, M., and van der Werf, G. R.: Biomass burning emissions estimated with a global fire assimilation system based on observed fire radiative power, Biogeosciences, 9, 527–554, https://doi.org/10.5194/bg-9-527-2012, 2012.
Kuenen, J. J. P., Denier van der Gon, H. A. C., Visschedijk, A., Van der Brugh, H., and Van Gijlswijk, R.: MACC European emission inventory for the years 2003–2007, TNO report TNO-060-UT-2011-00588, Utrecht, 2011.
Lamarque, J.-F., Bond, T. C., Eyring, V., Granier, C., Heil, A., Klimont, Z., Lee, D., Liousse, C., Mieville, A., Owen, B., Schultz, M. G., Shindell, D., Smith, S. J., Stehfest, E., Van Aardenne, J., Cooper, O. R., Kainuma, M., Mahowald, N., McConnell, J. R., Naik, V., Riahi, K., and van Vuuren, D. P.: Historical (1850–2000) gridded anthropogenic and biomass burning emissions of reactive gases and aerosols: methodology and application, Atmos. Chem. Phys., 10, 7017–7039, https://doi.org/10.5194/acp-10-7017-2010, 2010.
Lapina, K., Honrath, R. E., Owen, R. C., Val Martin, M., Hyer, E. J., and Fialho, P.: Late summer changes in burning conditions in the boreal regions and their implications for NOX and CO emissions from boreal fires, J. Geophys. Res., 113, D11304, https://doi.org/10.1029/2007JD009421, 2008.
Lavoué, D., Liousse, C., Cachier, H., Stocks, B. J., and Goldammer, J. G.: Modeling of carbonaceous particles emitted by boreal and temperate wildfires at northern latitudes, J. Geophys. Res., 105, 26871–26890, https://doi.org/10.1029/2000JD900180, 2000.
Lefèvre, F., Brasseur, G. P., Folkins, I., Smith, A. K., and Simon, P.: Chemistry of the 1991–1992 stratospheric winter: Three-dimensional model simulations, J. Geophys. Res., 99, 8183–8195, https://doi.org/10.1029/93JD03476, 1994.
Lelieveld, J., Berresheim, H., Borrmann, S., Crutzen, P. J., Dentener, F. J., Fischer, H., Feichter, J., Flatau, P. J., Heland, J., Holzinger, R., Korrmann, R., Lawrence, M. G., Levin, Z., Markowicz, K. M., Mihalopoulos, N., Minikin, A., Ramanathan, V., De Reus, M., Roelofs, G. J., Scheeren, H. A., Sciare, J., Schlager, H., Schultz, M., Siegmund, P., Steil, B., Stephanou, E. G., Stier, P., Traub, M., Warneke, C., Williams, J., and Ziereis, H.: Global air pollution crossroads over the Mediterranean, Science, 298, 5594, 794–799, https://doi.org/10.1126/science.1075457, 2002.
Liang, Q., Jaeglé, L., Jaffe, D. A., Weiss-Penzias, P., Heckman, A., and Snow, J. A.: Long-range transport of Asian pollution to the northeast Pacific: Seasonal variations and transport pathways of carbon monoxide, J. Geophys. Res., 109, D23S07, https://doi.org/10.1029/2003JD004402, 2004.
Liousse, C., Penner, J. E., Chuang, C., Walton, J. J., Eddleman, H., and Cachier, H.: A global three-dimensional model study of carbonaceous aerosols, J. Geophys. Res., 101, 19411–19432, https://doi.org/10.1029/95JD03426, 1996.
Marenco, A., Thouret, V., Nédélec, P., Smit, H., Helten, M., Kley, D., Karcher, F., Simon, P., Law, K., Pyle, J., Poschmann, G., Von Wrede, R., Hume, C., and Cook, T.: Measurement of ozone and water vapor by Airbus in-service aircraft: The MOZAIC airborne program, an overview, J. Geophys. Res., 103, 25631–25642, https://doi.org/10.1029/98JD00977, 1998.
Mihalopoulos, N.: Long-range transport of pollutants above the Eastern Mediterranean: implications for air quality and regional climate, in: Regional Climate Variability and its Impacts in The Mediterranean Area, edited by: Mellouki, A. and Ravishankara, A. R., NATO Science Series: IV: Earth and Environmental Sciences, Springer, Dordrecht, 1–13, 2007.
Millán, M., José Sanz, M., Salvador, R., and Mantilla, E.: Atmospheric dynamics and ozone cycles related to nitrogen deposition in the western Mediterranean, Environmental Pollution, 118, 167–186, https://doi.org/10.1016/S0269-7491(01)00311-6, 2002.
MODIS: available at: http://modis-fire.umd.edu/pages/ActiveFire.php?target=GetData (last access: April 2017), 2017.
Nabat, P., Somot, S., Mallet, M., Chiapello, I., Morcrette, J. J., Solmon, F., Szopa, S., Dulac, F., Collins, W., Ghan, S., Horowitz, L. W., Lamarque, J. F., Lee, Y. H., Naik, V., Nagashima, T., Shindell, D., and Skeie, R.: A 4-D climatology (1979–2009) of the monthly tropospheric aerosol optical depth distribution over the Mediterranean region from a comparative evaluation and blending of remote sensing and model products, Atmos. Meas. Tech., 6, 1287-1314, https://doi.org/10.5194/amt-6-1287-2013, 2013.
Nedelec, P., Thouret, V., Brioude, J., Sauvage, B., Cammas, J.-P., and Stohl, A.: Extreme CO concentrations in the upper troposphere over northeast Asia in June 2003 from the in situ MOZAIC aircraft data, Geophys. Res. Lett., 32, L14807, https://doi.org/10.1029/2005GL023141, 2005.
Pace, G., Meloni, D., and di Sarra, A.: Forest fire aerosol over the Mediterranean basin during summer 2003, J. Geophys. Res., 110, D21202, https://doi.org/10.1029/2005JD005986, 2005.
Parrington, M., Palmer, P. I., Lewis, A. C., Lee, J. D., Rickard, A. R., Di Carlo, P., Taylor, J. W., Hopkins, J. R., Punjabi, S., Oram, D. E., Forster, G., Aruffo, E., Moller, S. J., Bauguitte, S. J.-B., Allan, J. D., Coe, H., and Leigh, R. J.: Ozone photochemistry in boreal biomass burning plumes, Atmos. Chem. Phys., 13, 7321–7341, https://doi.org/10.5194/acp-13-7321-2013, 2013.
Petzold, A., Weinzierl, B., Huntrieser, H., Stohl, A., Real, E., Cozic, J., Fiebig, M., Hendricks, J., Lauer, A., Law, K., Roiger, A., Schlager, H., and Weingartner, E.: Perturbation of the European free troposphere aerosol by North American forest fire plumes during the ICARTT-ITOP experiment in summer 2004, Atmos. Chem. Phys., 7, 5105–5127, https://doi.org/10.5194/acp-7-5105-2007, 2007.
Piguet, B. and Ricaud, P.: F20 Core in-situ measurements – GLAM, SEDOO OMP, https://doi.org/10.6096/mistrals-charmex.1317, 2015.
Pu, R., Li, Z., Gong, P., Csiszar, I., Fraser, R., Hao, W.-M., Kondragunt, S., and Weng, F.: Development and analysis of a 12-year daily 1-km forest fire dataset across North America from NOAA/AVHRR, Remote Sens. Environ., 108, 198–208, 2007.
Ricaud, P., Sič, B., El Amraoui, L., Attié, J.-L., Zbinden, R., Huszar, P., Szopa, S., Parmentier, J., Jaidan, N., Michou, M., Abida, R., Carminati, F., Hauglustaine, D., August, T., Warner, J., Imasu, R., Saitoh, N., and Peuch, V.-H.: Impact of the Asian monsoon anticyclone on the variability of mid-to-upper tropospheric methane above the Mediterranean Basin, Atmos. Chem. Phys., 14, 11427–11446, https://doi.org/10.5194/acp-14-11427-2014, 2014.
Ricaud, P., Zbinden, R., Catoire, V., Brocchi, V., Dulac, F., Hamonou, E., Canonici, J.-C., El Amraoui, L., Massart, S., Piguet, B., Dayan, U., Nabat, P., Sciare, J., Ramonet, M., Delmotte, M., di Sarra, A., Sferlazzo, D., Di Iorio, T., Piacentino, S., Cristofanelli, P., Mihalopoulos, N., Kouvarakis, G., Pikridas, M., Savvides, C., Mamouri, R., Nisantzi, A., Hadjimitsis, D., Attié, J.-L., Ferré, H., Kangah, Y., Jaidan, N., Guth, J., Jacquet, P., Chevrier, S., Robert, C., Bourdon, A., Bourdinot, J.-F., Etienne, J.-C., Krysztofiak, G., and Theron, P.: The GLAM airborne campaign across the Mediterranean Basin, B. Am. Meteorol. Soc., 99, 361–380, https://doi.org/10.1175/BAMS-D-16-0226.1, 2018.
Roiger, A., Huntrieser, H., and Schlager, H.: Long-range transport of air pollutants, in: Research Topics in Aerospace, edited by: Schumann, U., Springer, 185–201, https://doi.org/10.1007/978-3-642-30183-4_12, 2012.
Rothman, L. S., Gordon, I. E., Babikov, Y., Barbe, A., Chris Benner, D., Bernath, P. F., Birk, M., Bizzocchi, L., Boudon, V., Brown, L. R., Campargue, A., Chance, K., Cohen, E. A., Coudert, L. H., Devi, V.M., Drouin, B. J., Fayt, A., Flaud, J.-M., Gamache, R. R., Harrison, J. J., Hartmann, J.-M., Hill, C., Hodges, J. T., Jacquemart, D., Jolly, A., Lamouroux, J., Le Roy, R. J., Li, G., Long, D. A., Lyulin, O. M., Mackie, C. J., Massie, S. T., Mikhailenko, S., Müller, H. S. P., Naumenko, O. V., Nikitin, A. V., Orphal, J., Perevalov, V., Perrin, A., Polovtseva, E. R., Richard, C., Smith, M. A. H., Starikova, E., Sung, K., Tashkun, S., Tennyson, J., Toon, G. C., Tyuterev, Vl. G., and Wagner, G.: The HITRAN2012 molecular spectroscopic database, J. Quant. Spectrosc. Ra., 130, 4–50, https://doi.org/10.1016/j.jqsrt.2013.07.002, 2013.
Seibert, P. and Frank, A.: Source-receptor matrix calculation with a Lagrangian particle dispersion model in backward mode, Atmos. Chem. Phys., 4, 51–63, https://doi.org/10.5194/acp-4-51-2004, 2004.
Seinfeld, J. H. and Pandis, S. N.: Atmospheric Chemistry and Physics: From Air Pollution to Climate Change, 3rd Edn., Wiley, 2016.
Sič, B., El Amraoui, L., Marécal, V., Josse, B., Arteta, J., Guth, J., Joly, M., and Hamer, P. D.: Modelling of primary aerosols in the chemical transport model MOCAGE: development and evaluation of aerosol physical parameterizations, Geosci. Model Dev., 8, 381–408, https://doi.org/10.5194/gmd-8-381-2015, 2015.
Spichtinger, N., Damoah, R., Eckhardt, S., Forster, C., James, P., Beirle, S., Marbach, T., Wagner, T., Novelli, P. C., and Stohl, A.: Boreal forest fires in 1997 and 1998: a seasonal comparison using transport model simulations and measurement data, Atmos. Chem. Phys., 4, 1857–1868, https://doi.org/10.5194/acp-4-1857-2004, 2004.
Stockwell, W. R., Kirchner, F., Kuhn, K., and Seefeld, S.: A new mechanism for regional atmospheric chemistry modeling, J. Geophys. Res., 102, 25847–25879, https://doi.org/10.1029/97JD00849, 1997.
Stohl, A., Eckhardt, S., Forster, C., James, P., and Spichtinger, N.: On the pathways and timescales of intercontinental air pollution transport, J. Geophys. Res., 107, 4684, https://doi.org/10.1029/2001JD001396, 2002a.
Stohl, A., Eckhardt, S., Forster, C., James, P., Spichtinger, N., and Seibert, P.: A replacement for simple back trajectory calculations in the interpretation of atmospheric trace substance measurements, Atmos. Environ., 36, 4635–4648, https://doi.org/10.1016/S1352-2310(02)00416-8, 2002b.
Stohl, A., Forster, C., Frank, A., Seibert, P., and Wotawa, G.: Technical note: The Lagrangian particle dispersion model FLEXPART version 6.2, Atmos. Chem. Phys., 5, 2461–2474, https://doi.org/10.5194/acp-5-2461-2005, 2005.
Stohl, A., Berg, T., Burkhart, J. F., Fjǽraa, A. M., Forster, C., Herber, A., Hov, Ø., Lunder, C., McMillan, W. W., Oltmans, S., Shiobara, M., Simpson, D., Solberg, S., Stebel, K., Ström, J., Tørseth, K., Treffeisen, R., Virkkunen, K., and Yttri, K. E.: Arctic smoke – record high air pollution levels in the European Arctic due to agricultural fires in Eastern Europe in spring 2006, Atmos. Chem. Phys., 7, 511–534, https://doi.org/10.5194/acp-7-511-2007, 2007.
Stohl, A., Sodemann, H., Eckhardt, S., Franck, A., Seibert, P., and Wotawa, G.: The Lagrangian particle dispersion model FLEXPART version 8.2, available at: https://flexpart.eu/downloads/26 (last access: February 2017), 2010.
Thouret, V., Marenco, A., Logan, J. A., Nédélec, P., and Grouhel, C.: Comparisons of ozone measurements from the MOZAIC airborne program and the ozone sounding network at eight locations. J. Geophys. Res., 103, 25695–25720, https://doi.org/10.1029/98JD02243, 1998.
Val Martin, M., Honrath, R. E., Owen, R. C., Pfister, G., Fialho, P., and Barata, F.: Significant enhancements of nitrogen oxides, black carbon, and ozone in the North Atlantic lower free troposphere resulting from North American boreal wildfires, J. Geophys. Res., 111, D23S60, https://doi.org/10.1029/2006JD007530, 2006.
Winker, D. M., Vaughan, M. A., Omar, A., Hu, Y., Powell, K. A., Liu, Z., Hunt, W. H., and Young, S. A.: Overview of the CALIPSO mission and CALIOP data processing algorithms, J. Atmos. Ocean. Tech., 26, 2310–2323, 2009.
Wooster, M. J., Roberts, G., Perry, G. L. W., and Kaufman, Y.: Retrieval of biomass combustion rates and totals from fire radiative power observations: FRP derivation and calibration relationships between biomass consumption and fire radiative energy release, J. Geophys. Res., 110, D24311, https://doi.org/10.1029/2005JD006318, 2005.
- Abstract
- Introduction
- Methodology
- Analysis of the long-range transport of biomass burning encountered over the MB during the GLAM flights
- Analysis of O3 production during long-range transport
- Conclusions
- Data availability
- Author contributions
- Competing interests
- Special issue statement
- Acknowledgements
- References
- Supplement