the Creative Commons Attribution 4.0 License.
the Creative Commons Attribution 4.0 License.
 | 04 May 2018
Predicting the glass transition temperature and viscosity of secondary organic material using molecular composition
Wing-Sy Wong DeRieux
Julia Laskin
Alexander Laskin
Allan K. Bertram
Sergey A. Nizkorodov
Secondary organic aerosol (SOA) accounts for a large fraction of submicron particles in the atmosphere. SOA can occur in amorphous solid or semi-solid phase states depending on chemical composition, relative humidity (RH), and temperature. The phase transition between amorphous solid and semi-solid states occurs at the glass transition temperature (Tg). We have recently developed a method to estimate Tg of pure compounds containing carbon, hydrogen, and oxygen atoms (CHO compounds) with molar mass less than 450 g mol−1 based on their molar mass and atomic O : C ratio. In this study, we refine and extend this method for CH and CHO compounds with molar mass up to ∼ 1100 g mol−1 using the number of carbon, hydrogen, and oxygen atoms. We predict viscosity from the Tg-scaled Arrhenius plot of fragility (viscosity vs. Tg∕T) as a function of the fragility parameter D. We compiled D values of organic compounds from the literature and found that D approaches a lower limit of ∼ 10 (±1.7) as the molar mass increases. We estimated the viscosity of α-pinene and isoprene SOA as a function of RH by accounting for the hygroscopic growth of SOA and applying the Gordon–Taylor mixing rule, reproducing previously published experimental measurements very well. Sensitivity studies were conducted to evaluate impacts of Tg, D, the hygroscopicity parameter (κ), and the Gordon–Taylor constant on viscosity predictions. The viscosity of toluene SOA was predicted using the elemental composition obtained by high-resolution mass spectrometry (HRMS), resulting in a good agreement with the measured viscosity. We also estimated the viscosity of biomass burning particles using the chemical composition measured by HRMS with two different ionization techniques: electrospray ionization (ESI) and atmospheric pressure photoionization (APPI). Due to differences in detected organic compounds and signal intensity, predicted viscosities at low RH based on ESI and APPI measurements differ by 2–5 orders of magnitude. Complementary measurements of viscosity and chemical composition are desired to further constrain RH-dependent viscosity in future studies.


Secondary organic aerosol (SOA) accounts for a large fraction of submicron particles in the atmosphere and plays an important role in climate, air quality, and public health (Goldstein and Galbally, 2007; Jimenez et al., 2009). Traditionally, SOA particles were assumed to be liquid with dynamic viscosity η below 102 Pa s, but a number of recent studies have shown that they can also adopt amorphous semi-solid (10 Pa s) or glassy solid (η>1012 Pa s) states depending on chemical composition and temperature (Zobrist et al., 2008; Koop et al., 2011; Huang et al., 2018; Reid et al., 2018). The phase state is also strongly affected by relative humidity, as water can act as a plasticizer to lower viscosity (Mikhailov et al., 2009). Ambient and laboratory-generated SOA particles have been observed to bounce off the smooth hard surface of an inertial impactor at low RH, implying a non-liquid state (Virtanen et al., 2010; Saukko et al., 2012; Bateman et al., 2015; Jain and Petrucci, 2015), whereas predominantly biogenic SOA particles in the Amazon basin did not bounce off the impactor surface at high RH, implying that they are primarily liquid (Bateman et al., 2016). Upon dilution or heating, SOA particles were observed to evaporate unexpectedly slowly (Cappa and Wilson, 2011; Vaden et al., 2011), and recent modeling studies have evaluated the contributions of low diffusivity and volatility to slow evaporation rates (Roldin et al., 2014; Yli-Juuti et al., 2017). Measurements of the viscosity of SOA bulk material derived from the oxidation of α-pinene (Renbaum-Wolff et al., 2013; Zhang et al., 2015; Hosny et al., 2016), limonene (Hinks et al., 2016), isoprene (Song et al., 2015), and toluene (Song et al., 2016a) have confirmed that SOA particles adopt a wide range of viscosities.
Viscosity can be directly converted to bulk diffusivity in organic molecules using the Stokes–Einstein equation (Einstein, 1905; Atkins, 1998; Seinfeld and Pandis, 2006; Schmelzer and Gutzow, 2011). This equation has been shown to work well for organic molecules diffusing through materials with η below ∼ 103 Pa s (Price et al., 2016; Chenyakin et al., 2017). Note that this relation is not accurate for predicting the bulk diffusivity of water and small molecules and it may also underestimate the diffusivity of organic molecules in a highly viscous matrix by a few orders of magnitudes (Champion et al., 2000; Shiraiwa et al., 2011; Power et al., 2013; Marshall et al., 2016; Bastelberger et al., 2017; Reid et al., 2018). The particle phase state, viscosity, and bulk diffusivity have been shown to affect the gas uptake and chemical transformation of organic compounds due to the kinetic limitations of bulk diffusion (Shiraiwa et al., 2011; Abbatt et al., 2012; Kuwata and Martin, 2012; Zhou et al., 2013; Slade and Knopf, 2014; Arangio et al., 2015; Davies and Wilson, 2015; Wang et al., 2015; Berkemeier et al., 2016; Marshall et al., 2016; Liu et al., 2018; Pratap et al., 2018; Zhang et al., 2018), which may facilitate the long-range transport of organic compounds embedded in viscous or glassy particles (Shrivastava et al., 2017b; Mu et al., 2018). Molecular motion can be hindered in a highly viscous matrix, slowing down photochemical reactions in particles (Lignell et al., 2014; Hinks et al., 2016). Water diffusion can still be fast even in an amorphous solid matrix under room temperature, but it can be hindered significantly under low temperatures (Mikhailov et al., 2009; Zobrist et al., 2011; Bones et al., 2012; Berkemeier et al., 2014; Price et al., 2014), affecting homogeneous vs. heterogeneous ice nucleation pathways (Murray et al., 2010; Wagner et al., 2012; Wang et al., 2012a, b; Wilson et al., 2012; Baustian et al., 2013; Schill and Tolbert, 2013; Berkemeier et al., 2014; Schill et al., 2014; Lienhard et al., 2015; Ignatius et al., 2016; Knopf et al., 2018). Despite the substantial implications of the SOA particle phase state, its effects on gas–particle interactions have not yet been considered explicitly in current climate and air quality models (Shrivastava et al., 2017a).
The partitioning of semi-volatile compounds into viscous particles may result in kinetically limited growth in contrast to quasi-equilibrium growth (Perraud et al., 2012; Booth et al., 2014; Zaveri et al., 2014), which also affects the evolution of particle size distribution upon SOA growth (Shiraiwa et al., 2013; Zaveri et al., 2018). Note that the equilibration timescale of SOA partitioning is determined by bulk diffusivity or viscosity, but is also affected by other factors such as volatility, accommodation coefficient, particle size, and mass loadings (Shiraiwa and Seinfeld, 2012; Mai et al., 2015; Liu et al., 2016). Chamber experiments probing the mixing timescales of SOA particles derived by the oxidation of various precursors such as isoprene, terpene, and toluene have observed strong kinetic limitations at low RH, but not at moderate and high RH (Loza et al., 2013; Ye et al., 2016, 2018). Several studies have observed the kinetic limitations of the bulk diffusion of organic molecules including polycyclic aromatic hydrocarbons (Abramson et al., 2013; Zhou et al., 2013) and isoprene-derived epoxydiols (Zhang et al., 2018) in SOA, while Gorkowski et al. (2017) did not observe significant diffusion limitations for glycerol and squalene in α-pinene SOA. Quasi-equilibrium versus kinetically limited or non-equilibrium SOA growth remains an open issue and warrants further investigations.
Group contribution methods have been used to predict the viscosities of pure compounds when the functionality and molecular structure are known (Sastri and Rao, 1992; Rothfuss and Petters, 2017a). Song et al. (2016b) showed that estimations from group contribution approaches combined with either non-ideal or ideal mixing reproduced the RH-dependent trends particularly well for the alcohol, dicarboxylic, and tricarboxylic acid systems with viscosities of up to 104 Pa s. In contrast, model calculations overestimated the viscosity of more viscous compounds including monosaccharides, disaccharides, and trisaccharides by many orders of magnitude (Song et al., 2016b). A recent study compiled the viscosity of organic compounds with atmospherically relevant functional groups, investigating the influence of the number and location of functional groups on viscosity (Rothfuss and Petters, 2017a). These studies provide important insights into estimating the viscosity of individual organic compounds.
The particle phase state can be characterized by a glass transition temperature (Tg), which is a characteristic temperature representing a non-equilibrium phase transition from a glassy solid state to a semi-solid state as the temperature increases (Koop et al., 2011). Recently, we have developed a parameterization to estimate Tg of pure organic compounds comprised of carbon, hydrogen, and oxygen (CHO compounds) with molar mass less than 450 g mol−1 based on their molar mass and atomic O : C ratio (Shiraiwa et al., 2017). It has been applied successfully in a global chemistry–climate model to predict Tg and the phase state of atmospheric SOA, which indicated that SOA particles are mostly liquid or semi-solid in the planetary boundary layer, while they should be glassy in the middle and upper troposphere (Shiraiwa et al., 2017). A recent study provided a consistent result, suggesting that the mixing timescales of organic molecules within SOA are often < 1 h in a global planetary boundary layer (Maclean et al., 2017).
It has been shown that SOA particles contain oligomeric compounds with molar masses higher than 450 g mol−1 (Gao et al., 2004; Tolocka et al., 2004; Nizkorodov et al., 2011; Nozière et al., 2015), which makes the previously developed parameterization incomplete. In this study, we extend the parameterization of Tg to higher-molar-mass compounds and apply it to high-resolution mass spectrometry data for toluene SOA and biomass burning particles. The Arrhenius approach and the Gordon–Taylor mixing rules were applied to estimate the viscosity of SOA bulk materials to compare with the literature-reported viscosity measurements. This method will be useful for estimations of viscosity of organic particles, for which high-resolution mass spectra are available. It can also be applied in global or regional models to evaluate the impacts of the particle phase state on the role of SOA in climate and air quality.
2.1 Glass transition temperature
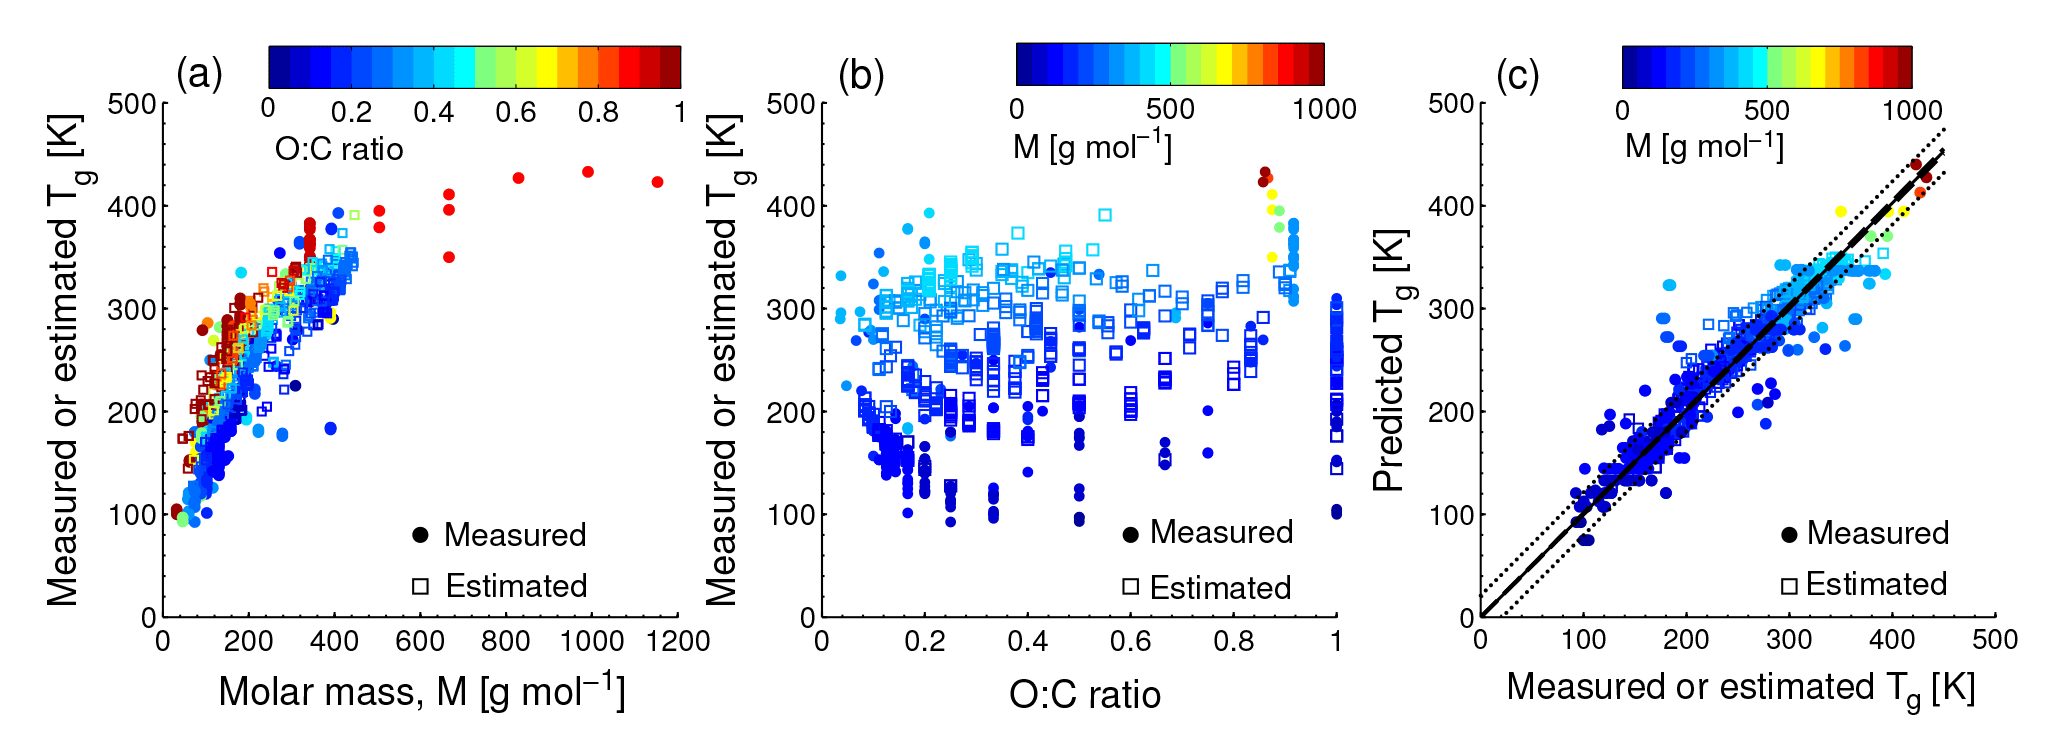
Figure 1Characteristic relationships between molecular properties and the glass transition temperature (Tg) of organic compounds. (a) Tg of organic compounds as measured (circles) and estimated with the Boyer–Kauzmann rule (squares) plotted against molar mass. The markers are color coded by atomic O : C ratio. (b) Measured (circles) and estimated (squares) Tg of organic compounds plotted against the O : C ratio. The markers are color coded by molar mass. (c) Predicted Tg for CHO compounds using a parameterization (Eq. 2) developed in this study compared to measured (circles) and estimated Tg by the Boyer–Kauzmann rule (squares). The solid line shows the 1:1 line and the dashed and dotted lines show 68 % confidence and prediction bands, respectively.
Figure 1a shows the dependence of Tg on the molar mass (M) of organic compounds. Solid markers represent measured Tg of 258 CHO compounds (Koop et al., 2011; Dette et al., 2014; Rothfuss and Petters, 2017a), while open markers represent 654 CHO compounds in SOA (Shiraiwa et al., 2014). Markers are color coded by atomic O : C ratio. Their melting points (Tm) were estimated by the Estimation Programs Interface (EPI) Suite software version 4.1 (US-EPA, 2015) and their Tg values were estimated using the Boyer–Kauzmann rule: with g=0.7 (Koop et al., 2011; Shiraiwa et al., 2017). This rule can provide good estimates of Tg, as has been validated in previous work (Koop et al., 2011) and is also shown in Fig. A2a. A subset of data shown in Fig. 1 was originally published in Shiraiwa et al. (2017) for compounds with M<450 g mol−1. This version of the figure has been updated to include a number of experimentally measured Tg values of larger compounds with M up to 1153 g mol−1, including aliphatic compounds containing OH and/or COOH groups. Specifically, data for 76 aliphatic alcohols, 39 carbohydrates and their derivatives, 4 carboxylic acids, and 4 hydroxy acids, as compiled by Rothfuss and Petters (2017a), have been added to Fig. 1. Eight of these compounds are carbohydrates with M>450 g mol−1. These updates are critical for reliable parameterization of Tg based on M. When M increases above ∼ 500 g mol−1, the slope of Tg decreases, making it challenging to extrapolate the low-M data from the original Shiraiwa et al. (2017) study to higher M values. When M increases to ∼ 1000 g mol−1, the corresponding Tg appears to level at around 420 K.
Such dependence on M has been described for polymers with the Fox–Flory equation: (Fox Jr. and Flory, 1950), where Km is a constant and Tg,∞ is the asymptotic value of Tg specific to the polymer. We conducted a literature search and found that most of the reported Tg,∞ values fell below ∼ 500 K (Brandrup et al., 1999; Fox Jr. and Flory, 1950; Onder et al., 1972; Montserrat and Colomer, 1984; Papadopoulos et al., 2004; Matsushima et al., 2017). The Fox–Flory equation works very well for high-molar-mass compounds and is also generally applicable to smaller compounds (Koop et al., 2011), as supported by an approximately linear dependence of Tg on the inverse molar mass in Fig. A1a. Figure 1b plots the values of Tg as a function of the atomic O : C ratio of organic molecules. Figure 1a and b clearly demonstrate that Tg depends primarily on the molar mass with a weak dependence on the atomic O : C ratio.
A parameterization for Tg calculation based on the molar mass and atomic O : C ratio was developed in our recent work, which is applicable to CH and CHO compounds with M<450 g mol−1 (Shiraiwa et al., 2017):
where .57 (±13.47) [K], B=1.51 (±0.14) [K mol g−1], (±3. [K mol2 g−2], D=131.4 (±16.01) [K], and .25 (±0.085) [K mol g−1]. These values were obtained by fitting the measured Tg of 179 CH and CHO compounds with M<450 g mol−1 with multi-linear least squares analysis. Note that the application of Eq. (1) may provide unreasonable Tg values for compounds with M>500 g mol−1 because it does not account for the strong curvature in the Tg vs. M dependence shown in Fig. 1a.
In this study we have developed an improved parameterization to predict Tg of CH and CHO compounds using the number of carbon (nC), hydrogen (nH), and oxygen (nO) that can also be applied to higher-molar-mass compounds. Motivated by a good correlation between Tg and volatility (Fig. 1a in Shiraiwa et al., 2017), we use an equation with a similar formulation to the equation used to predict the saturation mass concentration or volatility (Donahue et al., 2011; Li et al., 2016):
where is the reference carbon number, bC, bH and bO denote the contribution of each atom to Tg, and bCH and bCO are coefficients that reflect contributions from carbon–hydrogen and carbon–oxygen bonds, respectively. These values were obtained by fitting the measured Tg of 42 CH compounds and 258 CHO compounds with multi-linear least squares analysis with 68 % prediction and confidence intervals. The best-fit parameters are summarized in Table 1.
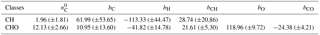
Table 1Composition classes and the and b values (K) for glass transition temperature parameterizations obtained by least-squares optimization using the measurements compiled in Koop et al. (2011), Dette et al. (2014), and Rothfuss and Petters (2017a).
Note that the evaluation dataset used to derive Eq. (2) contains CH compounds with M<260 g mol−1 (see Fig. A2b for comparison of measured and predicted Tg). Thus, the application of Eq. (2) to higher-molar-mass compounds may require further refinement of the method when measured Tg for higher-molar-mass CH compounds becomes available. Figure 1c shows that the Tg values predicted using Eq. (2) are in good agreement with the Tg values measured in experiments (see also Fig. A1b) or estimated by the Boyer–Kauzmann rule as indicated by the high correlation coefficient of 0.95. Tg of individual compounds can be predicted within ±21 K as indicated by the prediction band (dotted lines in Fig. 1c); however, this uncertainty may be much smaller for multicomponent SOA mixtures under ideal mixing conditions as indicated in the confidence band (dashed lines, almost overlapping with the 1:1 line).
These results are noteworthy given that the parameterization (Eq. 2) does not consider either explicit molecular structures or functional groups. Previous studies have shown that Tg can be especially sensitive to the number of OH groups, which interact strongly through hydrogen bonding. For example, Nakanishi and Nozaki (2011) found a direct relationship between Tg and the number of hydroxyl groups in a molecule for sugar alcohols; Tg increases as the number of OH groups increases. They reported that the correlation between Tg and the number of OH groups was much stronger than the correlation between Tg and the number of carbons in a molecule. Such a trend is implicitly included in Eqs. (1) and (2), which contain the O : C ratio and number of oxygen atoms as parameters, respectively. Recently, Rothfuss and Petters (2017a) showed an approximately linear relationship between the number of OH groups and Tg for compounds with up to eight OH groups. Grayson et al. (2017) showed that the addition of hydroxyl functional groups increases viscosity, a conclusion supported by both the experimental data and quantitative structure–property relationship model. The correlation between Tg and the number of carbon atoms is consistent with the free volume theory, in which molecular motion is restricted by the difference between the space required for a molecule to vibrate versus the space in which the molecule resides (i.e., the free volume; White and Lipson, 2016). The correlation between Tg and the number of OH groups is more consistent with the topological constraint theory, in which the primary influence is the three-dimensional structure of the molecule as determined by molecular bonds and hydrogen-bonding networks (Nakanishi and Nozaki, 2011; van der Sman, 2013). Future experiments targeting more comprehensive Tg data, especially for high-molar-mass compounds, would lead to further refinements of our Tg parameterizations.
Comparing Eqs. (1) and (2), the two parameterizations give a similar performance for compounds with M<450 g mol−1 as shown in Fig. A2c. The statistical measures of correlation coefficient (R), mean bias (MB), and root mean square error (RMSE) are 0.93, −6.45, and 25.64 K, respectively, for the performance of Eq. (1), while for Eq. (2), they are 0.95, 3.15, and 21.11 K, respectively. It should be noted again that Eq. (1) cannot be used to predict Tg for compounds with M>450 g mol−1. For example, Tg of stachyose (M=667 g mol−1) predicted by Eq. (1) is 198 K, while that by Eq. (2) is 394 K, which agrees much better with the measured mean Tg of 396 K (Rothfuss and Petters, 2017a). Equation (2) is more flexible than Eq. (1) and can be potentially expanded to include compounds containing hetero-atoms (e.g., nitrogen or sulfur) once substantial sets of experimental values of Tg for such compounds become available. Regarding the applications to air quality and climate models, Eq. (1) can be applied in the volatility basis set (VBS; Donahue et al., 2006, 2011) and the molecular corridor approach (Shiraiwa et al., 2014; Li et al., 2016) to predict the Tg of SOA particles (Shiraiwa et al., 2017), while the new parameterization may be suitable for coupling with the statistical oxidation model, which characterizes the SOA evolution as a function of nC and nO (Cappa and Wilson, 2012; Jathar et al., 2015).
These parameterizations (Eqs. 1, 2) calculate Tg based on the elemental composition of organic compounds. SOA particles contain a number of organic compounds and a variable amount of liquid water, which has low Tg (136 K) and can act as a plasticizer (Mikhailov et al., 2009; Koop et al., 2011). Under humid conditions, SOA particles take up water by hygroscopic growth in response to RH, lowering Tg and the viscosity of SOA particles. Estimations of Tg for SOA–water mixtures were discussed by Shiraiwa et al. (2017), who applied the Gordon–Taylor equation validated for a wide range of mixtures of organics, polymers, and water (Roos, 1993; Hancock and Zografi, 1994; Zobrist et al., 2008; Dette et al., 2014; Dette and Koop, 2015). Briefly, Tg of mixtures of SOA compounds under dry conditions (Tg,org) were calculated assuming the Gordon–Taylor constant (kGT) of 1 (Dette et al., 2014): , where wi is the mass fraction of organic compound i, which can be derived using mass concentrations of SOA products. The Gordon–Taylor equation can also be applied to calculate Tg of organic–water mixtures considering the mass fraction of organics (worg) in SOA particles (Koop et al., 2011):
worg can be calculated using the mass concentrations of water ( and SOA (mSOA) as , and can be estimated using the effective hygroscopicity parameter (κ) (Petters and Kreidenweis, 2007):
The density of water (ρw) is 1 g cm−3, the density of SOA particles (ρSOA) is assumed to be 1.2 g cm−3 (Kuwata et al., 2012), mSOA is the total mass concentrations of SOA, and aw is the water activity calculated as . Pajunoja et al. (2015) found that water uptake in subsaturated conditions is inhibited until RH is high enough for the dissolution of water in SOA particles with relatively low O : C ratios. As the oxidation of SOA increases, the solubility of water increases and dissolution occurs at lower RH values. In both cases, the use of subsaturated hygroscopicity measurements was supported.
2.2 Viscosity
The temperature dependence of viscosity (η) can be predicted using the modified Vogel–Tammann–Fulcher (VTF) equation (Angell, 1991):
where η∞ is viscosity at infinite temperature; T0 is the Vogel temperature; and T is the ambient temperature. The fragility parameter, D, characterizes how rapidly the dynamics of a material slow down as T approaches Tg, reflecting to what degree the temperature dependence of the viscosity deviates from Arrhenius behavior. When T is close to Tg (), smaller D values indicate that viscosity is sensitive to temperature change (fragile behavior), while larger D values indicate that viscosity is less sensitive to temperature change (strong or Arrhenius behavior).
Assuming Pa s (Angell, 1991),
When T=Tg, η=1012 Pa s, which leads to (Angell, 1991, 2002)
As can be seen in Eq. (7), both Tg and D are required to calculate η from Eq. (6) at a given temperature.
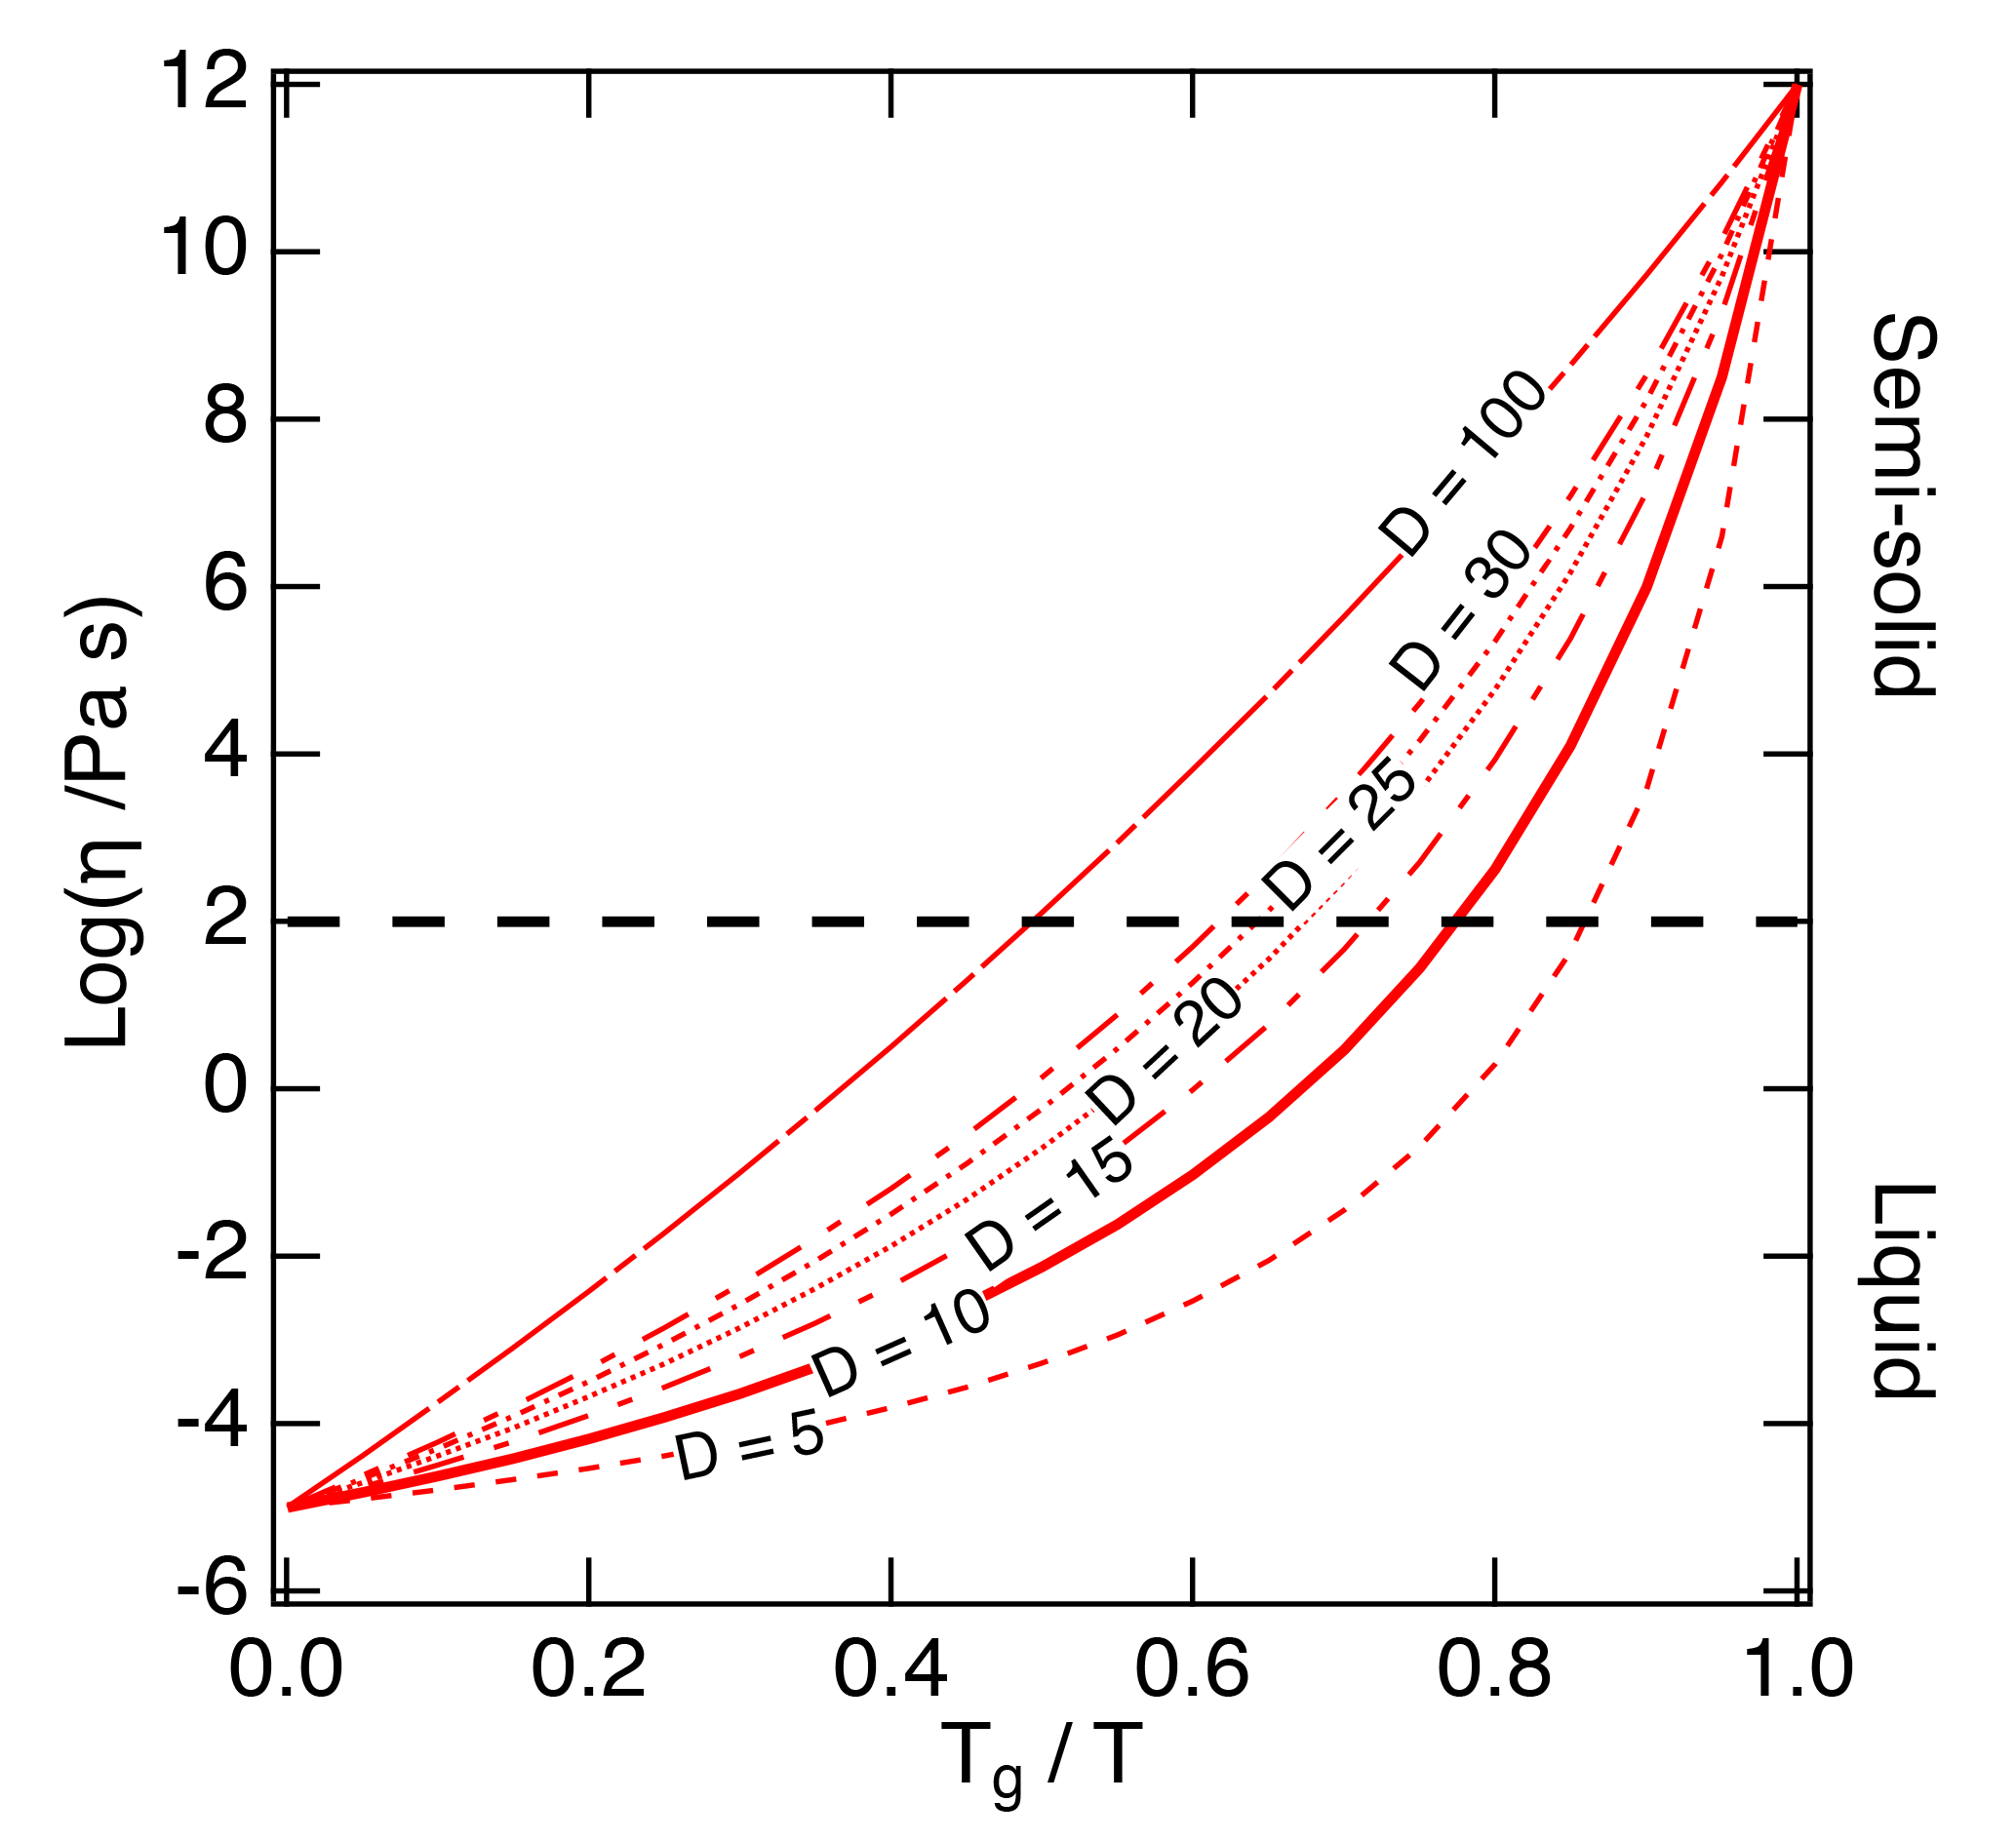
Figure 2The Angell plot of viscosity (η) vs. Tg∕T. The lines represent different fragility parameter (D) values in the range of 5–100, with D=10 (the solid line) used as a base case for this study. A large fragility parameter value is associated with a strong glass former, while fragile materials are associated with lower values. The black dashed line at a viscosity of 102 Pa s indicates the approximate threshold between liquid and semi-solid states.
Figure 2 shows the Tg-scaled Arrhenius plot of fragility (viscosity versus Tg∕T) referred to as an Angell plot (Angell, 1995). D values of organic compounds are typically in the range of ∼ 5–30 (Angell, 1997). To estimate D values that could be applied to SOA compounds, we compiled measured fragility values. Fragility was often measured in the form of the fragility steepness index (m), which represents the slope of the Arrhenius plot at the point where T=Tg (Boehmer et al., 1993). Compounds with lower m exhibit higher D values, indicating stronger glass formers. The measured m values of 95 organic compounds are included in the Supplement; m can be converted to D using the following equation (see the full derivation of this equation in Appendix A):
Figure 3 shows the measured D as a function of (a) molar mass and (b) the atomic O : C ratio of organic molecules. The molar mass exerts a stronger effect on fragility, while there is little dependence of D on the O : C ratio. As molar mass increases, D approaches a lower limit of 10.3 (±1.7), consistent with the value of 10 used in our recent study (Shiraiwa et al., 2017). To evaluate the impact of the variations in D on viscosity prediction, sensitivity calculations were conducted as described in Sect. 3.
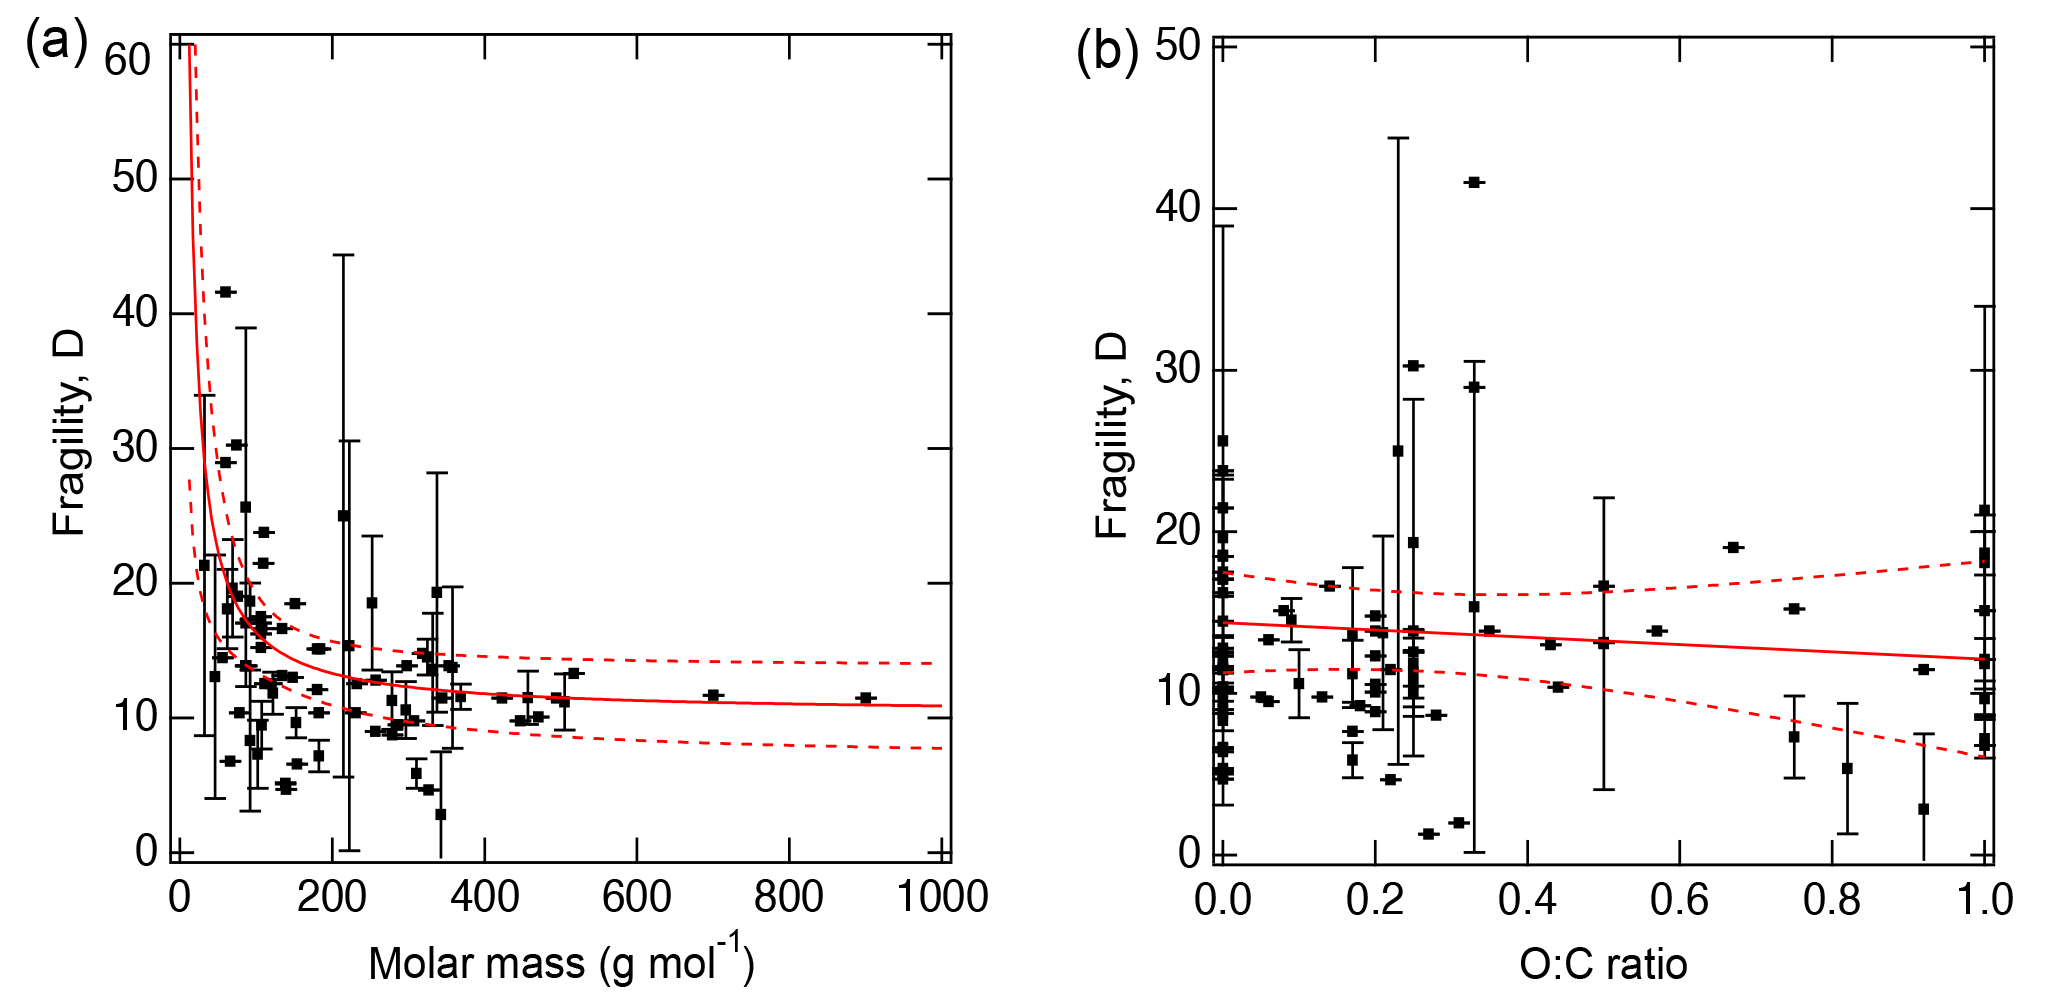
Figure 3Fragility parameter of organic compounds (D) plotted against (a) molar mass and (b) atomic O : C ratio. Error bars are standard deviations. The solid red lines represent the fitted curves with fitted equations for (a) .3 and (b) D=14.4–2.3 (O : C). Dashed red lines indicate the 95 % confidence band.
Besides the VTF equation, another commonly used equation for describing the temperature dependence of viscosity is the Williams–Landel–Ferry (WLF) equation: , where empirical parameters C1 and C2 are adopted as 17.44 and 51.6 K, respectively (Williams et al., 1955; Schill and Tolbert, 2013; Wang et al., 2015). The two equations are mathematically equivalent; both are defined with respect to a reference temperature, and their parameters are related through and . For the WLF equation, Tg is the reference temperature and there is a linear dependence assumed between temperature and free volume (O'Connell and McKenna, 1999; Huang and McKenna, 2001; Metatla and Soldera, 2007). For the VTF equation, the reference is the Vogel temperature (T0), a hypothetical temperature at which all non-vibrational motion ceases and viscosity becomes infinite, and the theoretical foundation of the VTF equation includes both thermodynamic and kinetic considerations (O'Connell and McKenna, 1999; Huang and McKenna, 2001; Metatla and Soldera, 2007). Recently, Rothfuss and Petters (2017b) applied a similar approach to model viscosity for sucrose particles by applying the VTF and Gordon–Taylor approaches. The calculations of the viscosity of multi-component SOA mixtures in this study are based mainly on the VTF equation, and the difference between calculated results from the two equations will be briefly discussed in the following section.
3.1 SOA formed from α-pinene and isoprene
The purpose of this section is to demonstrate that the viscosity of SOA material can be predicted over a broad range of RH values from four parameters: Tg of dry SOA (Tg,org), fragility (D), hygroscopicity (κ), and the Gordon–Taylor constant for mixing SOA and water (kGT). The viscosity of α-pinene SOA has been measured or estimated as a function of RH by several groups using multiple experimental techniques as shown in Fig. 4a (Abramson et al., 2013; Renbaum-Wolff et al., 2013; Kidd et al., 2014; Pajunoja et al., 2014; Bateman et al., 2015; Zhang et al., 2015; Grayson et al., 2016). The wide range of experimentally measured viscosities reported for α-pinene SOA, particularly from 30–60 % RH, is most likely a consequence of the different experimental approaches, mass loadings, and O : C ratios for each experiment. For instance, Grayson et al. (2016) used mass loadings of 121 to 14 000 µg m−3 and observed that viscosity decreased as mass loading increased. Higher mass loadings would lead to greater partitioning of semi-volatile and lower-molar-mass compounds into the particle phase, which would lead to the decrease in Tg and the viscosity of the resulting SOA mixture, as very recently demonstrated experimentally by Jain et al. (2018). Grayson et al. (2016) concluded that their results should be considered a lower limit for the viscosity of α-pinene SOA in the atmosphere. It should also be noted that the viscosity measurements from Renbaum-Wolff et al. (2013) were for the water-soluble portion of the SOA. These datasets suggest that the viscosity of α-pinene SOA approaches very high values (∼ > 108 Pa s) below 20–30 % RH and decreases with an increase in RH, reaching a value of ∼ 10 Pa s at 80 % RH. As can be seen in Fig. 4b, PAM-generated isoprene SOA is less viscous with η<106 Pa s even under dry conditions, undergoing a phase transition from a semi-solid phase to a liquid phase at ∼ 55 % RH (Bateman et al., 2015; Song et al., 2015).

Figure 4Comparison of the measured and predicted viscosity of (a) α-pinene SOA and (b) isoprene SOA at 295 K as a function of RH. The solid lines represent base simulations with the VTF equation, while the dotted line represents viscosity predicted using the WLF equation. Parameters are the glass transition temperature of dry SOA (Tg,org), fragility (D), hygroscopicity (κ), and the Gordon–Taylor constant (kGT): (a) 278.5 K, 0.1, 10, and 2.5; (b) 255 K, 0.1, 10, and 2.5. The shaded regions were determined by varying these parameters. (a) Upper (lower) limit: K (278.5 K), κ=0.1 (0.1), D=20 (10), kGT=2.5 (2.0); (b) upper (lower limit): K (255 K), κ=0.10 (0.15), D=15 (8), kGT=2.5 (4.0). Panel (a): Renbaum-Wolff et al. (2013) data represent viscosity for the water-soluble portion of SOA; Grayson et al. (2016) data in panel (a) represent two different mass loadings (121 µg m−3; 520 µg m−3). Panel (b): the gray box represents estimated viscosity for isoprene SOA based on the bounce measurements of Bateman et al. (2015).
The solid lines with the shaded areas in Fig. 4 are viscosity values predicted using Tg,org, D, κ, and kGT. Tg,org values were adopted by Berkemeier et al. (2014), who estimated Tg,org with the Boyer–Kauzmann rule using the melting point of representative SOA oxidation products. Note that Eqs. (1) and (2) were not used to estimate Tg,org, which should be done in future studies by obtaining their elemental composition using high-resolution mass spectrometry. For α-pinene, Tg,org was assumed to be 278 K, corresponding to an O : C ratio of 0.5 (Berkemeier et al., 2014), which is a typical O : C ratio of α-pinene SOA (Aiken et al., 2008; Chen et al., 2011; Putman et al., 2012).
The Tg,org selected for isoprene SOA was 255 K, corresponding to the O : C ratio of 0.6. Although no measurements of the O : C ratio for the experimental isoprene SOA data were reported, Song et al. (2015) estimated O : C of 0.64–1.1 based on literature values. As O : C ratios are useful in estimating Tg,org, we encourage the measurement of the O : C ratio of SOA when conducting viscosity measurements. In contrast to α-pinene SOA, there are limited viscosity measurements for isoprene SOA. While the predicted viscosity is consistent with the experimental data, comparison of our model predictions to additional measurements is strongly recommended. Song et al. (2015) prepared isoprene SOA in a potential aerosol mass (PAM) reactor, while the data produced by Bateman et al. (2015) were for isoprene SOA generated in a smog chamber. It has been suggested that under ambient conditions, the majority of isoprene-derived SOA can be derived through heterogeneous interactions with acidic sulfate particles forming oligomers (Surratt et al., 2010; Lin et al., 2013; Gaston et al., 2014), which may increase viscosity compared to the model SOA generated in PAM or a chamber. Further studies are warranted to compare laboratory-generated and ambient isoprene SOA and to investigate the effect of the acidic seed on the viscosity.
For both α-pinene and isoprene SOA, D was set to 10 based on the analysis presented in Fig. 3a. κ was set to 0.1 based on field and laboratory measurements (Gunthe et al., 2009; Lambe et al., 2011b; Pajunoja et al., 2014; Petters et al., 2017) and kGT was assumed to be 2.5 (Zobrist et al., 2008; Koop et al., 2011). Using these parameters, the predicted viscosities match the magnitude and the RH-dependence of the measured viscosity of α-pinene and isoprene SOA. Figure 4 also shows predicted viscosities (dotted lines) using the WLF equation, which shows similar values as the VTF equation, but slightly underestimates the viscosity of α-pinene SOA at low RH and overestimates the viscosity of isoprene SOA at high RH.
Sensitivity studies were conducted to examine the effects of Tg,org, D, κ, and kGT on the calculated viscosity. In these studies, Tg,org values of α-pinene and isoprene SOA were varied within 229–328 and 255–316 K, respectively, representing Tg,org of different oxidation states (Berkemeier et al., 2014). D was varied between 5 and 30, which is the range characteristic for organic compounds (see Fig. 3a). κ values of 0.05–0.15 were used for α-pinene and isoprene SOA (Lambe et al., 2011b; Pajunoja et al., 2015). For the Gordon–Taylor constant, values of 2.5 ± 1.5 were considered (Zobrist et al., 2008; Koop et al., 2011; Dette et al., 2014; Dette and Koop, 2015).
The effect of varying each parameter on the calculated viscosity of α-pinene SOA is illustrated in Fig. 5. Variations of ±50 K in Tg,org result in 3–6 order of magnitude differences in calculated values at dry conditions, indicating that Tg,org is a critical parameter for viscosity estimations. Decreasing D from 10 to 5 led to a decrease in calculated values by more than 1 order of magnitude. The calculated results were within the upper limit of measurements when increasing D from 10 to 20, and the predicted values were only slightly enhanced when further increasing D from 20 to 30. Calculated values with variations in κ from 0.05 to 0.15 and kGT from 1.0 to 4.0 were all within the measured ranges.
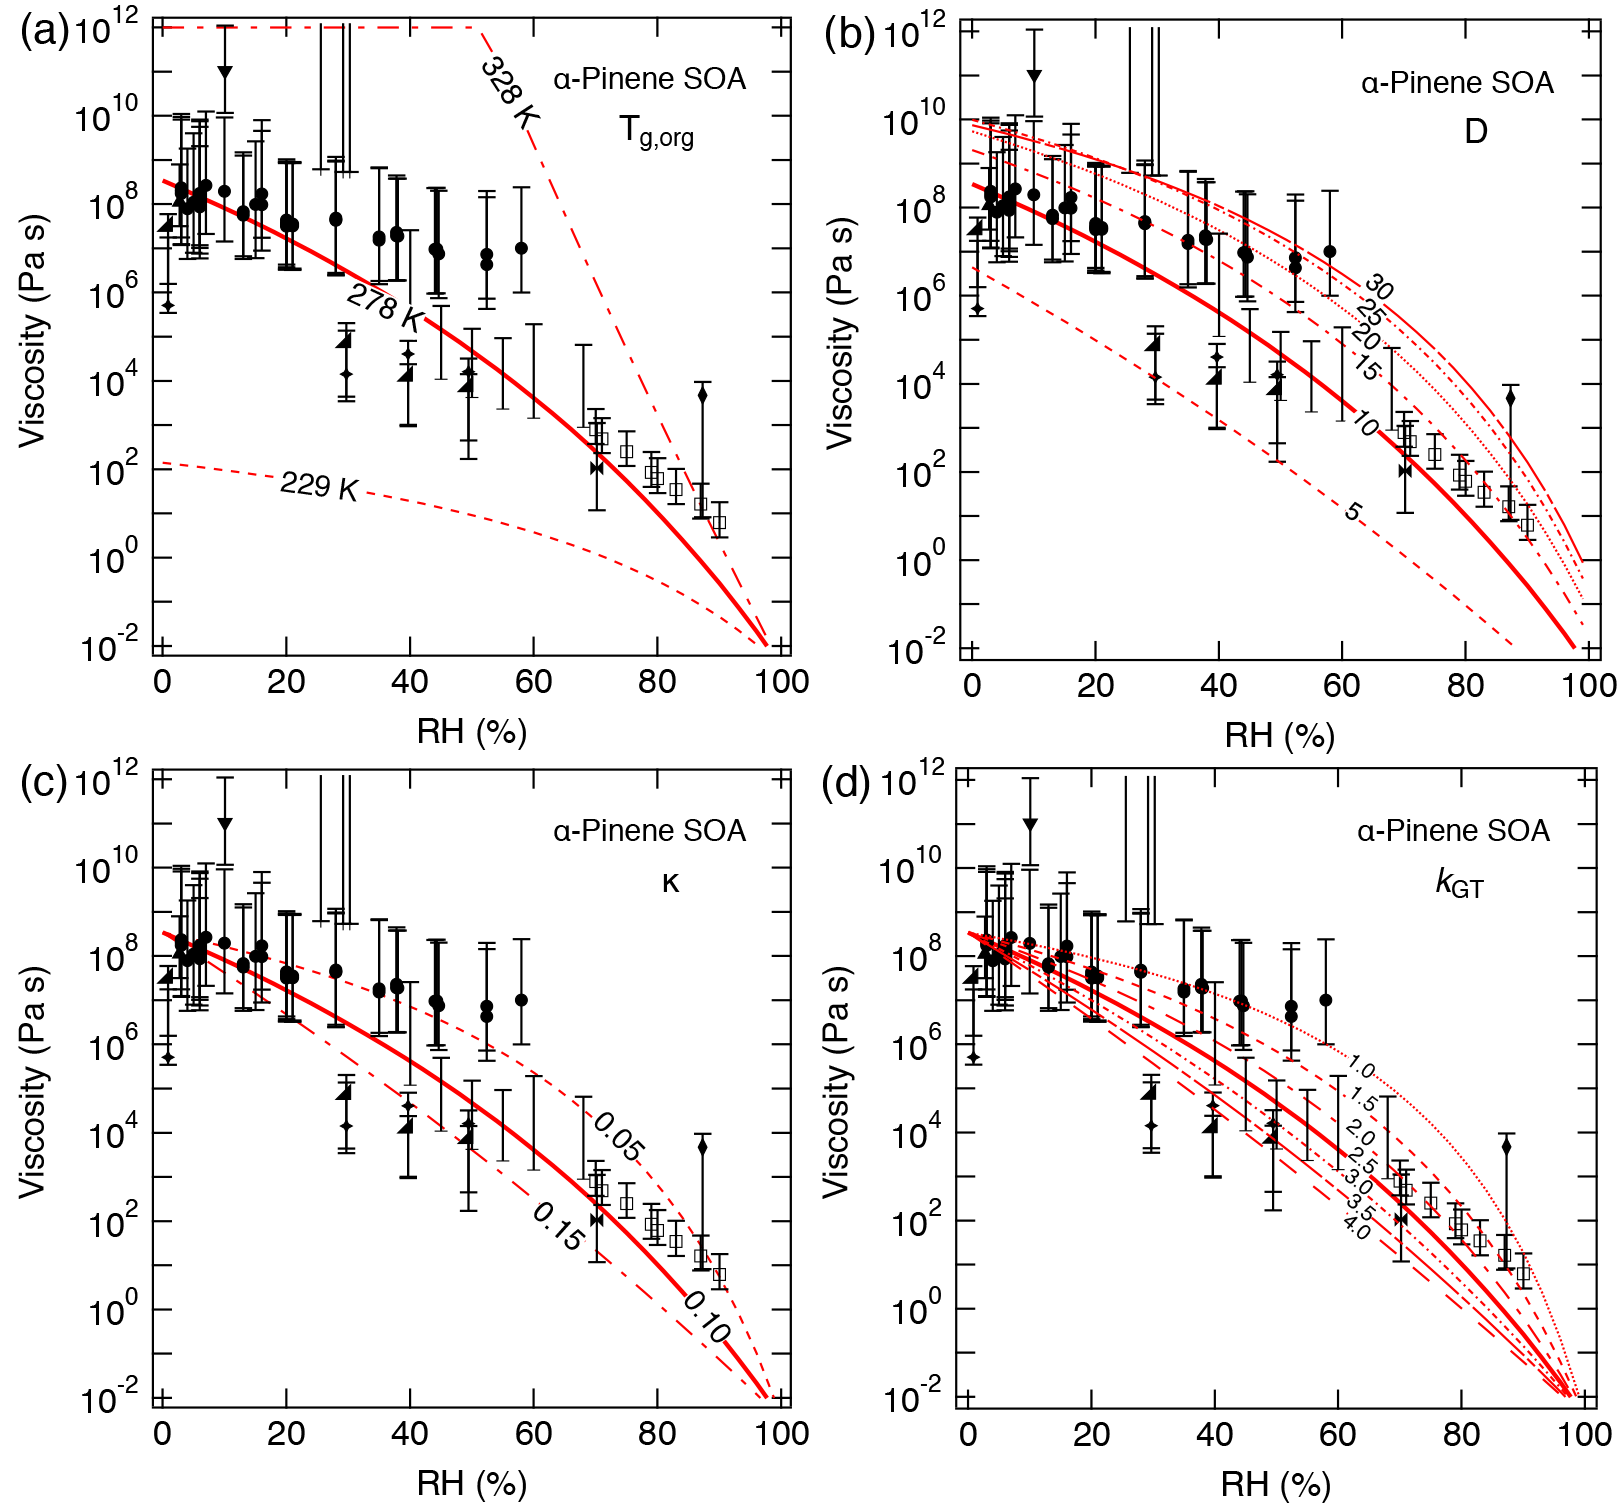
Figure 5Sensitivity calculations for the viscosity of α-pinene SOA at 295 K as a function of RH by varying (a) the glass transition temperature of dry SOA (Tg,org), (b) fragility (D), (c) hygroscopicity (κ), and (d) the Gordon–Taylor constant (kGT).
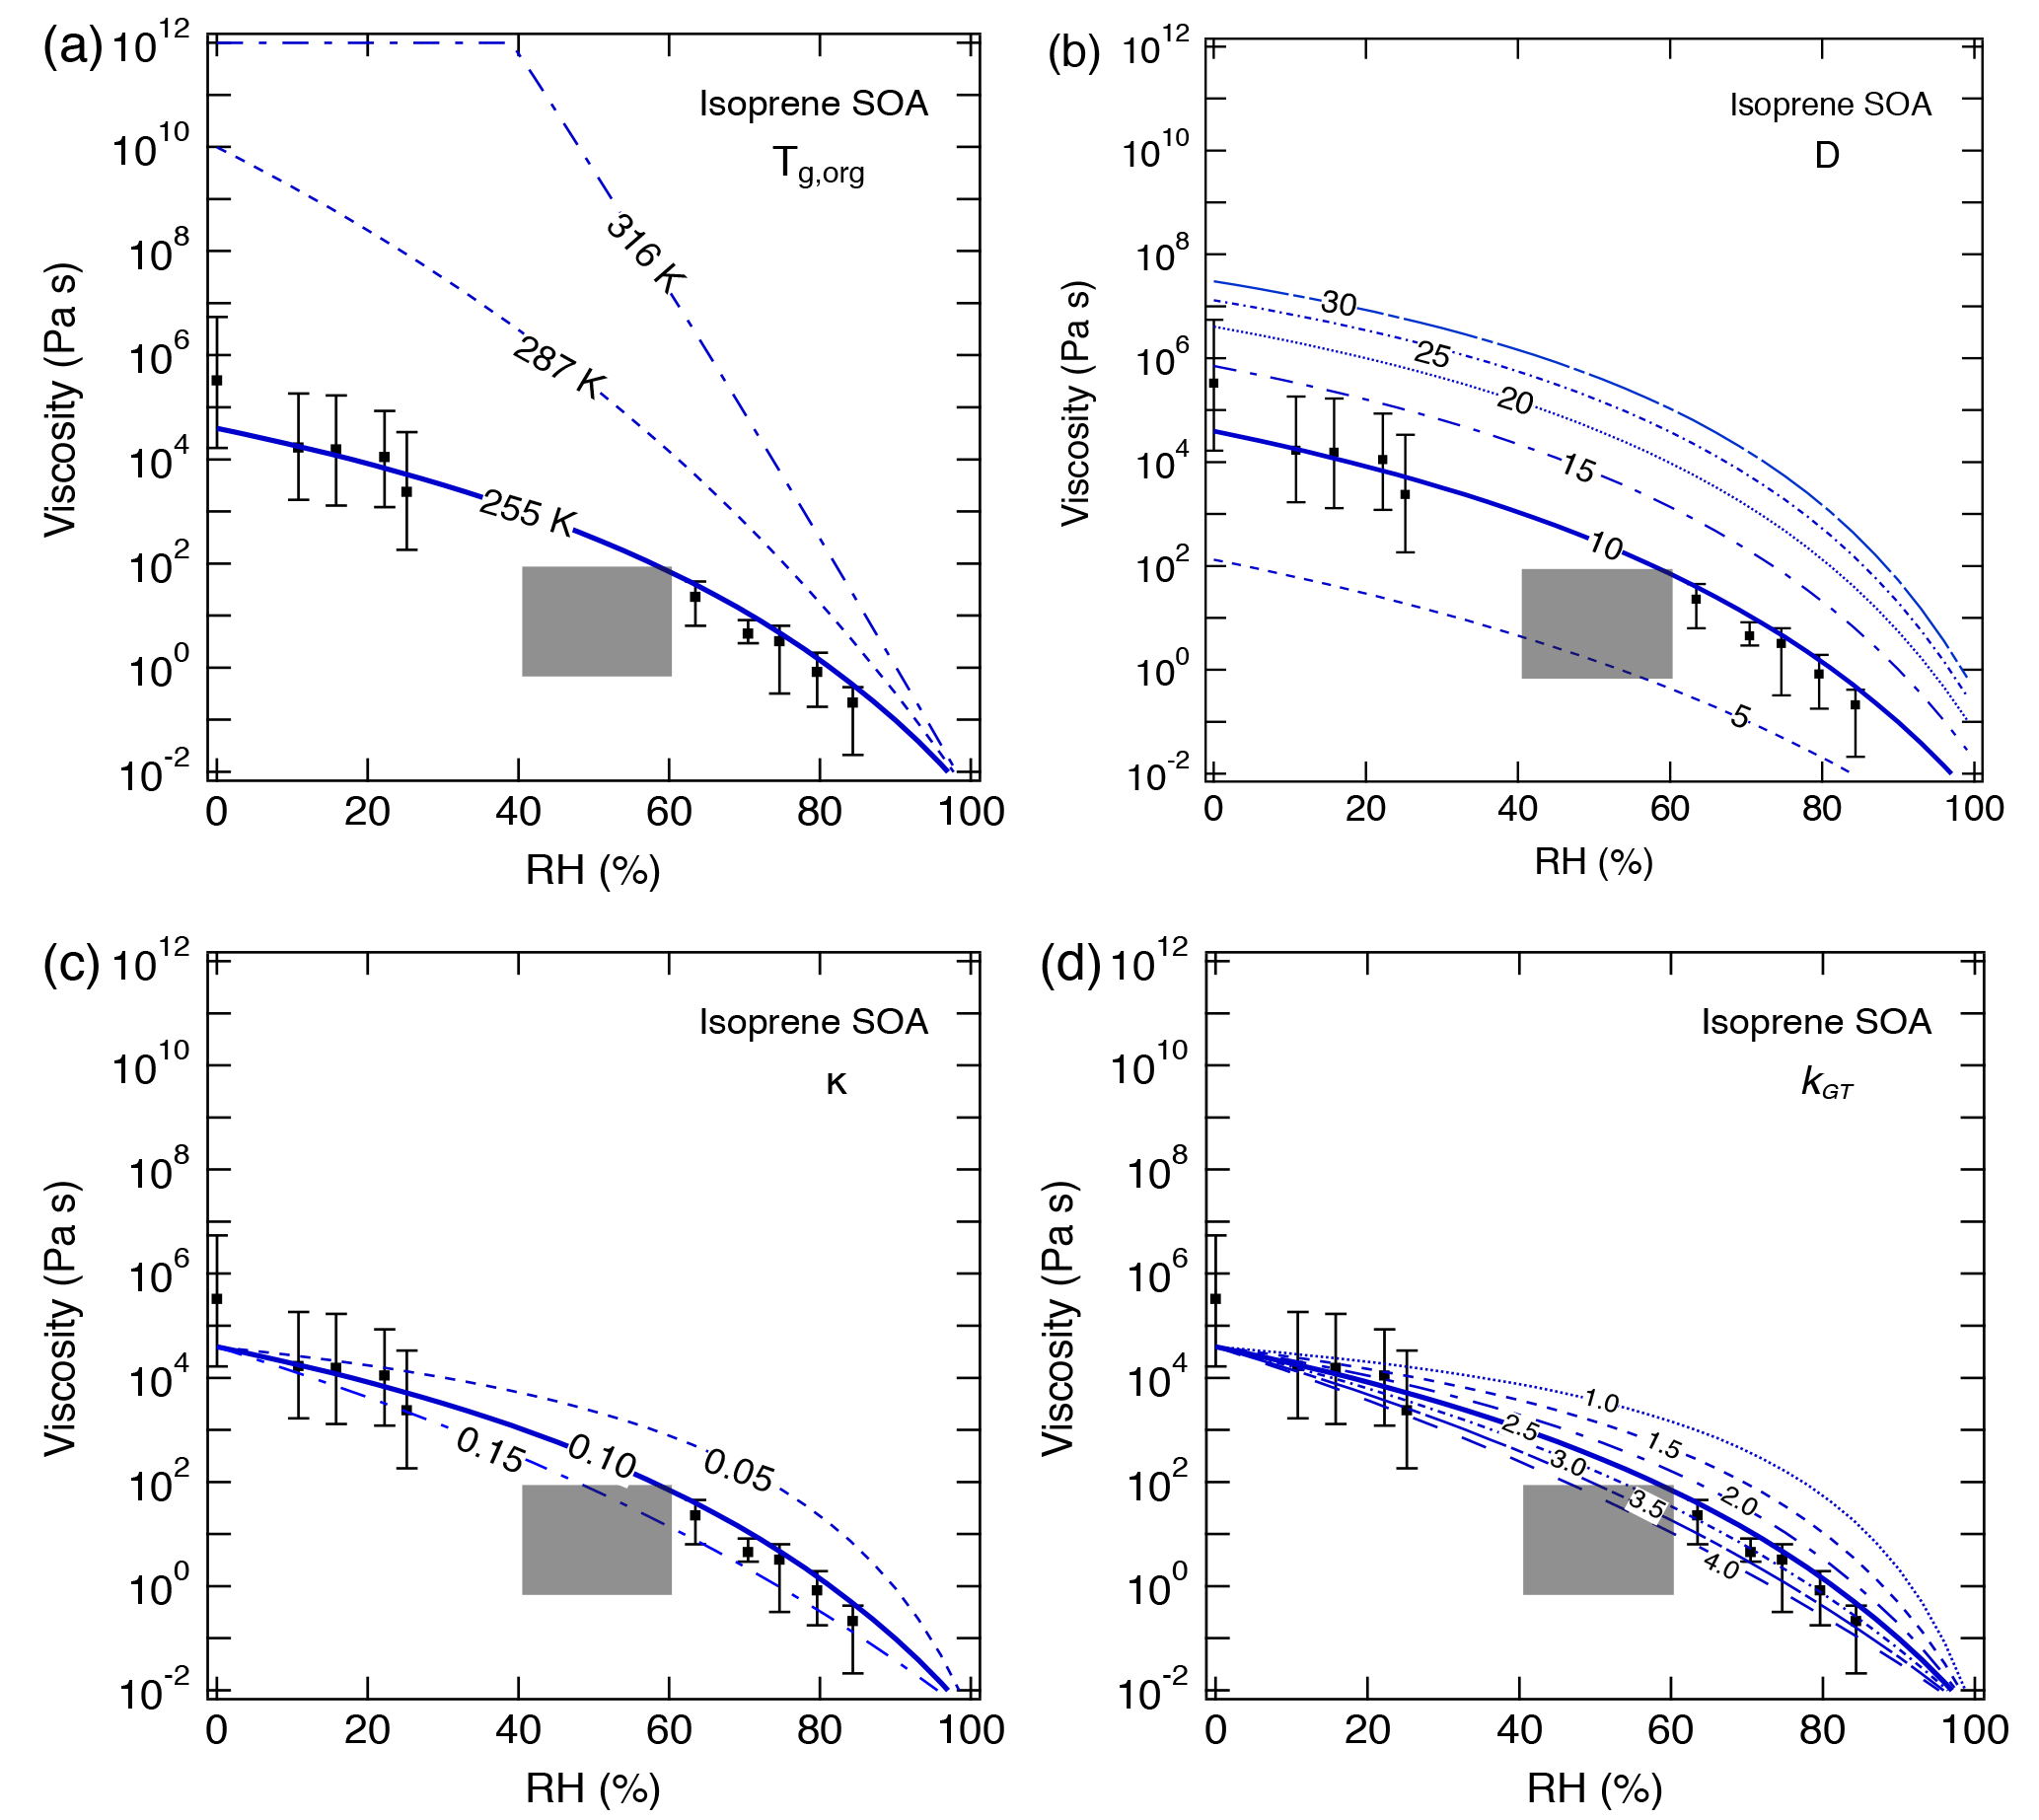
Figure 6Sensitivity calculations for the viscosity of isoprene SOA at 295 K as a function of RH by varying (a) the glass transition temperature of dry SOA (Tg,org), (b) fragility (D), (c) hygroscopicity (κ), and (d) the Gordon–Taylor constant (kGT). Data points are measured viscosity by Song et al. (2015) and the gray box represents estimated viscosity based on the bounce measurements of Bateman et al. (2015).
For isoprene SOA, an increase in Tg,org to 287 K, which represents a higher oxidation state (Berkemeier et al., 2014), led calculated values to be several orders of magnitude higher than the upper limit of measurements (Fig. 6a). When Tg,org reaches 316 K, isoprene SOA can occur as a solid for RH lower than ∼ 40 %. Compared to α-pinene SOA, a variation in D has a larger effect on the calculated viscosity (Fig. 6b). For a range of 5–30 for D, calculations with the D value of 10 agreed well with the measurements, while other D values resulted in calculated viscosity outside of the measured ranges. Figure 6c and d show that by decreasing κ and kGT below the reference values, the predictions overestimate the measured η by 1 or 2 orders of magnitude. The latter is most evident at RH > 60 %, at which the calculated values were higher than the upper limit of measurements. Modeling results with κ and kGT increasing to 0.15 and 4.0, respectively, were within the lower limit of measurements.
The above comparison between the measured and predicted viscosity demonstrates that the method described in this study can reproduce reasonably well the measured RH-dependent viscosity of SOA formed from α-pinene and isoprene. The sensitivity calculations showed that Tg,org contributed the most to the uncertainty in the viscosity estimates. Previous studies have shown that the experimental conditions such as particle mass concentrations (Grayson et al., 2016; Jain et al., 2018) and RH upon SOA formation (Kidd et al., 2014; Hinks et al., 2018) can impact the chemical composition of SOA and hence the phase state and viscosity. Further efforts to constrain the uncertainties are needed both in experiments and parameterizations.
3.2 SOA formed from toluene
In this and the following sections, we examine the feasibility of calculating the value of Tg,org from mass spectrometry data on SOA. Hinks et al. (2018) measured the elemental composition of toluene SOA using nanospray desorption electrospray ionization high-resolution mass spectrometry (nano-DESI-HRMS; Roach et al., 2010a, b). Toluene SOA was formed by OH photooxidation in an aerosol smog chamber at < 2 % RH (mass loading = 23 µg m−3) and 75 % RH (mass loading = 8 µg m−3) to investigate the effect of RH on the chemical composition of toluene SOA formed under low-NOx conditions. Measurements revealed a significant reduction in the fraction of oligomers present in toluene SOA generated under high RH conditions compared to SOA generated under low RH conditions (Hinks et al., 2018). The detected molar mass of individual oxidation products spanned a range of 102–570 g mol−1 at high RH, which increased up to 726 g mol−1 at low RH.

Figure 7(a) Molecular corridor of molar mass plotted against the volatility of toluene SOA formed under dry conditions (Hinks et al., 2018) color coded by the glass transition temperature (Tg) estimated using Eq. (2). The upper dashed line indicates the low O : C bound of the molecular corridor (linear alkanes CnH2n+2 with O : C = 0), and the lower dotted line indicates the high O : C bound (sugar alcohols CnH2n+2On with O : C = 1). (b) Comparison of the measured (markers) and modeled (lines) viscosity of toluene SOA at 295 K as a function of RH. Viscosities were calculated using a fragility (D) of 13, hygroscopicity (κ) of 0.25, and a Gordon–Taylor constant (kGT) of 3.0 with different glass transition temperatures of dry SOA (Tg,org) as estimated using Eqs. (1) or (2) under low and high RH conditions. The shaded regions were calculated by varying those parameters: K (295 K), κ=0.20 (0.25), D=13 (10), kGT=2.5 (3.5) for the upper (lower) limit. Mass loadings were 23 µg m−3 for low RH and 8 µg m−3 for high RH (Hinks et al., 2018).
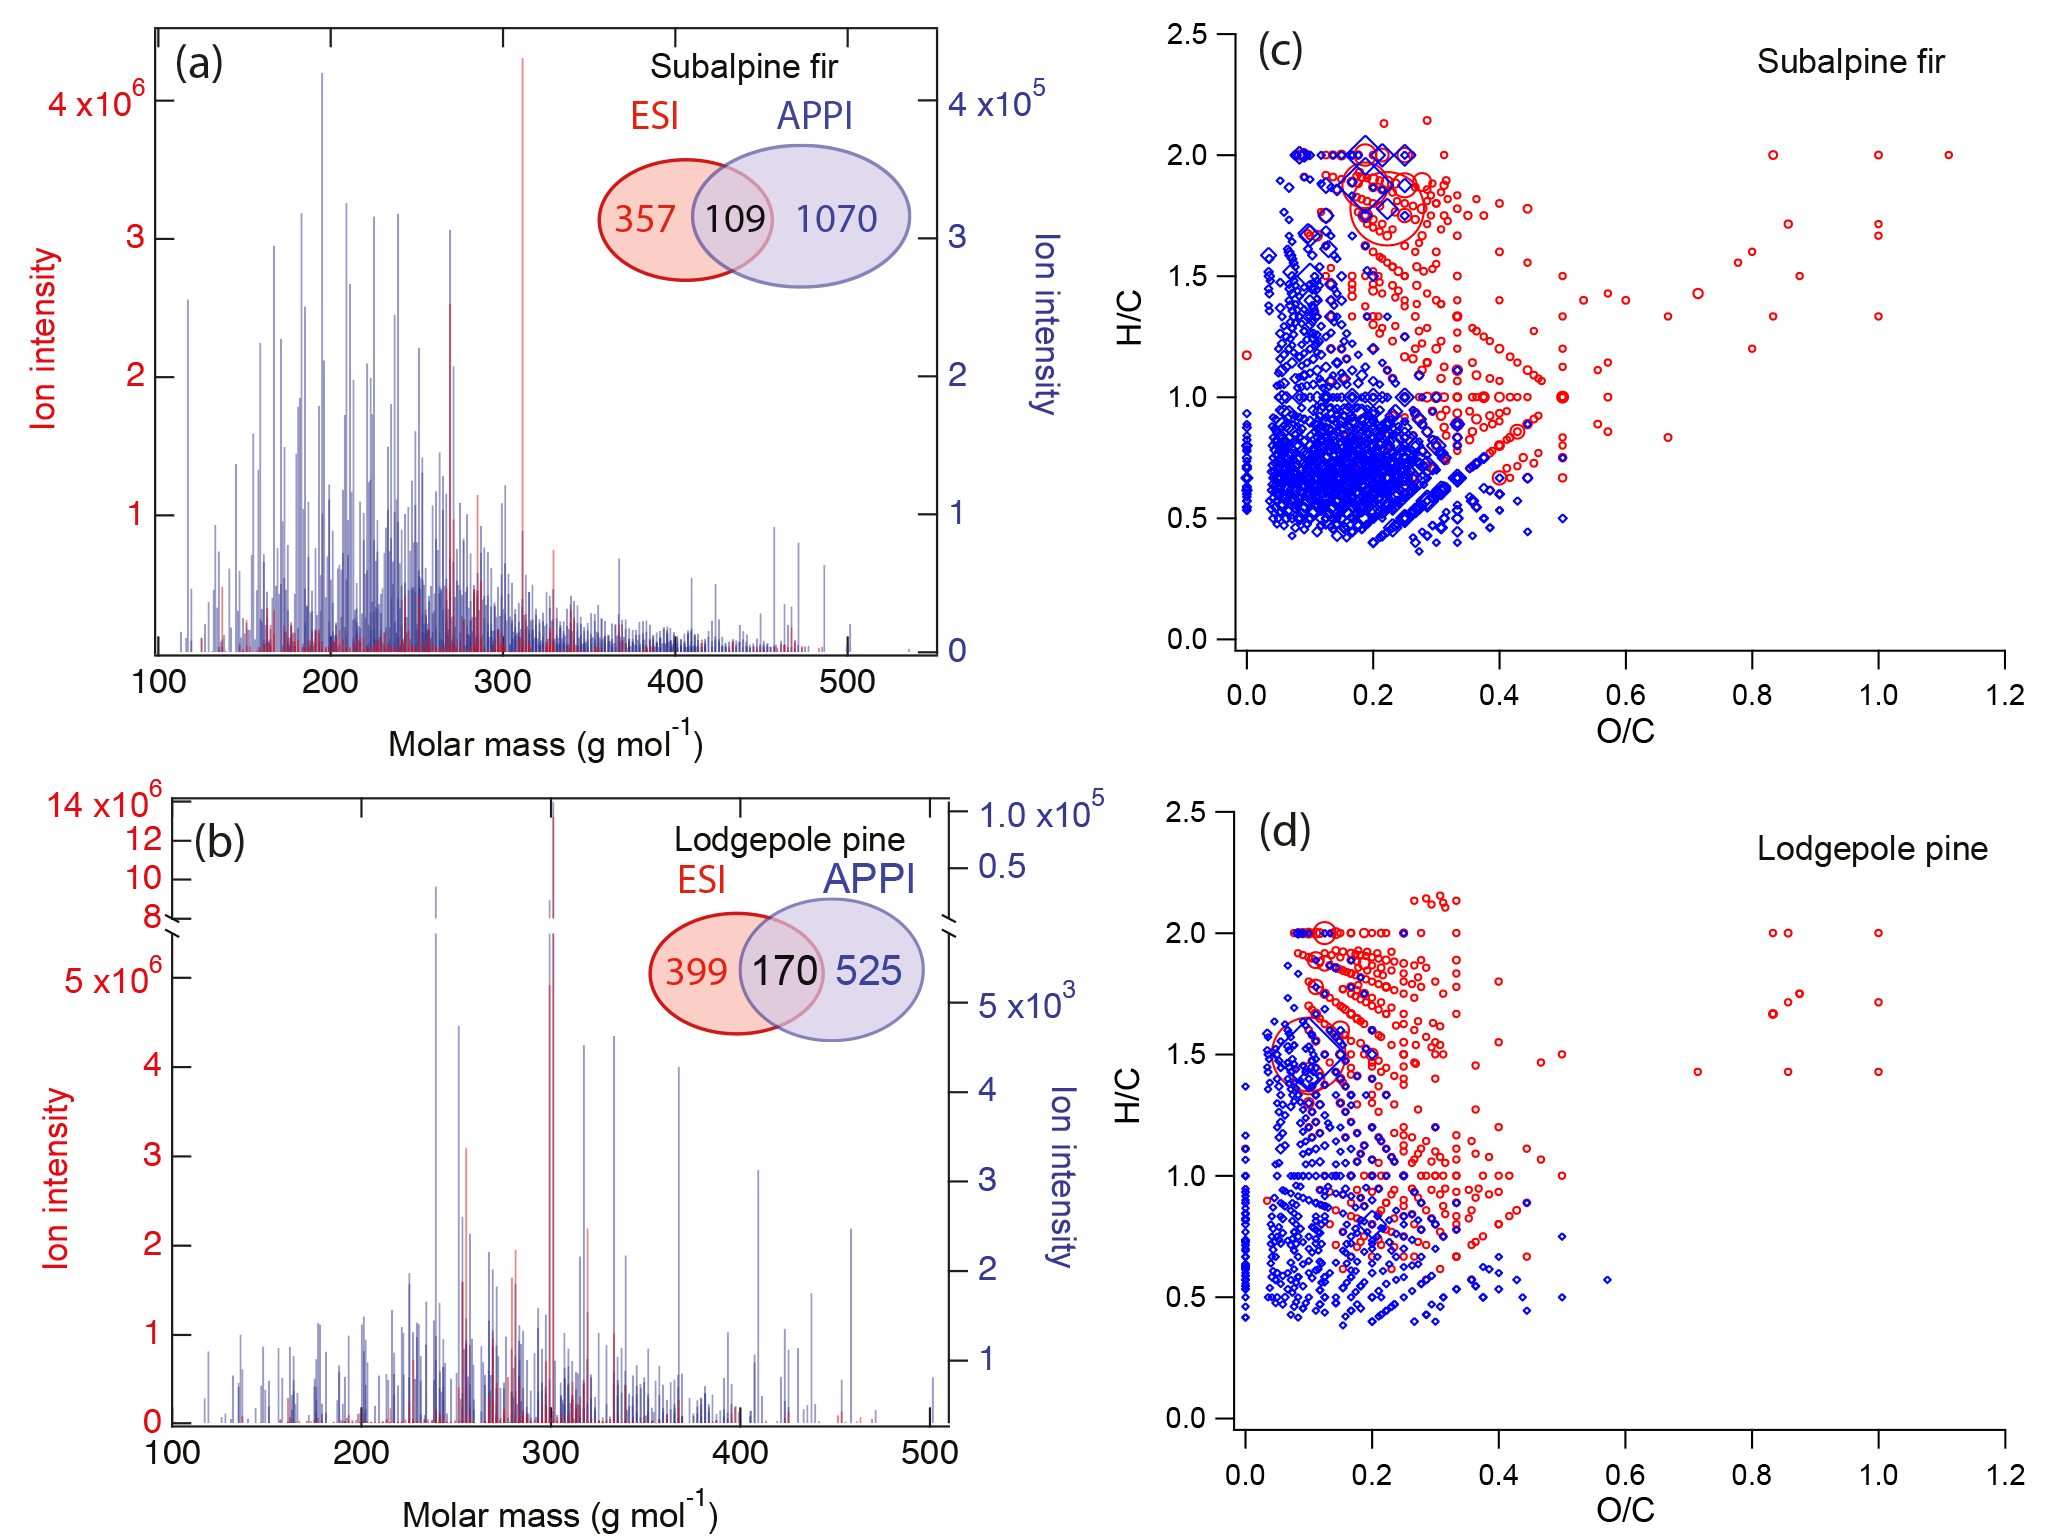
Figure 8Mass spectra of biomass burning organic particles collected from test burns of (a) subalpine fir and (b) lodgepole pine as measured by high-resolution mass spectrometry with two ionization techniques: electron spray ionization (ESI, red) and atmospheric pressure photoionization (APPI; blue). The numbers of elemental formulas identified by ESI (red), APPI (blue), and both modes (black) are also specified. Van Krevelen plots of the compounds identified by ESI (red) and APPI (blue) mode in BBOA from the burning of (c) subalpine fir and (d) lodgepole pine.
Figure 7a shows the interdependence of glass transition temperature, volatility, and the molar mass of the detected toluene SOA compounds. Glass transition temperatures were calculated using Eq. (2). The saturation mass concentrations or volatilities of detected compounds were estimated from the elemental composition by using the parameterization of Li et al. (2016). The analysis is based on the molecular corridor approach – a two-dimensional framework of volatility and molar mass of SOA components constrained by boundary lines of low and high atomic O : C ratios corresponding to n-alkanes (CnH2n+2, O : C = 0) and sugar alcohols (CnH2n+2On, O : C = 1), respectively (Shiraiwa et al., 2014; Li et al., 2016). The toluene SOA constituents are well constrained by the molecular corridor and Tg values are higher for compounds with a higher molar mass and lower volatility.
Equation (1) was used to calculate Tg for individual compounds with M<450 g mol−1, while excluding compounds with a molar mass higher than 450 g mol−1. This approach was deemed reasonable as such high-molar-mass compounds account for < 10 % of all toluene SOA products formed at low RH and for < 2 % formed at high RH. Equation (2) was used to calculate Tg for all the detected compounds. Tg of dry toluene SOA (Tg,org) was then computed using the Gordon–Taylor approach with kGT=1 (Sect. 2.1). The relative mass concentrations of individual components were assumed to be proportional to their relative abundance in the nano-DESI-HRMS spectrum. This assumption has a number of caveats (Bateman et al., 2012; Nguyen et al., 2013), and as we will see below, it results in deviations between the predicted and measured viscosity. Table 2 summarizes the results of such calculations, showing that the Tg,org by Eq. (1) – excluding high-molar-mass compounds – is about 10 K lower compared to Tg,org by Eq. (2). Tg,org at low RH is predicted to be higher than Tg,org at high RH, which results from a lower abundance of high-molar-mass compounds observed at high RH. This trend is consistent with Kidd et al. (2014), who showed that SOA material formed under dry conditions is more viscous than that formed under wet conditions.
Table 2Glass transition temperatures calculated using Eqs. (1) and (2) for toluene SOA produced at low relative humidity (< 2 %) and high relative humidity (75 %) conditions.
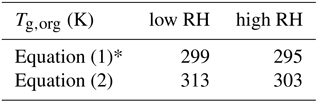
* Compounds with M>450 g mol−1 were excluded from the analysis.
Figure 7b shows the predicted viscosity of toluene SOA as a function of RH compared to the measured viscosity of toluene SOA formed in an oxidation flow reactor at 13 % RH (Song et al., 2016a). Indirect viscosity measurements are also included in shaded boxes for toluene-derived SOA (Bateman et al., 2015; Li et al., 2015). Lines with shaded areas are calculated viscosities using Tg,org as described above. κ was assumed to be 0.25 based on laboratory measurements (Lambe et al., 2011a; Hildebrandt Ruiz et al., 2015). To achieve good fit, D was set to 13 and kGT was assumed to be 3.0 (Dette et al., 2014). Estimations with Eq. (1) match the measured viscosity values very well over the entire RH range. Predictions with Eq. (2) overestimated the measurements by 1 or 2 orders of magnitude at moderate RH between 30 and 50 %, while they agreed with the measurements derived at RH ≥ 60 % and at dry conditions.
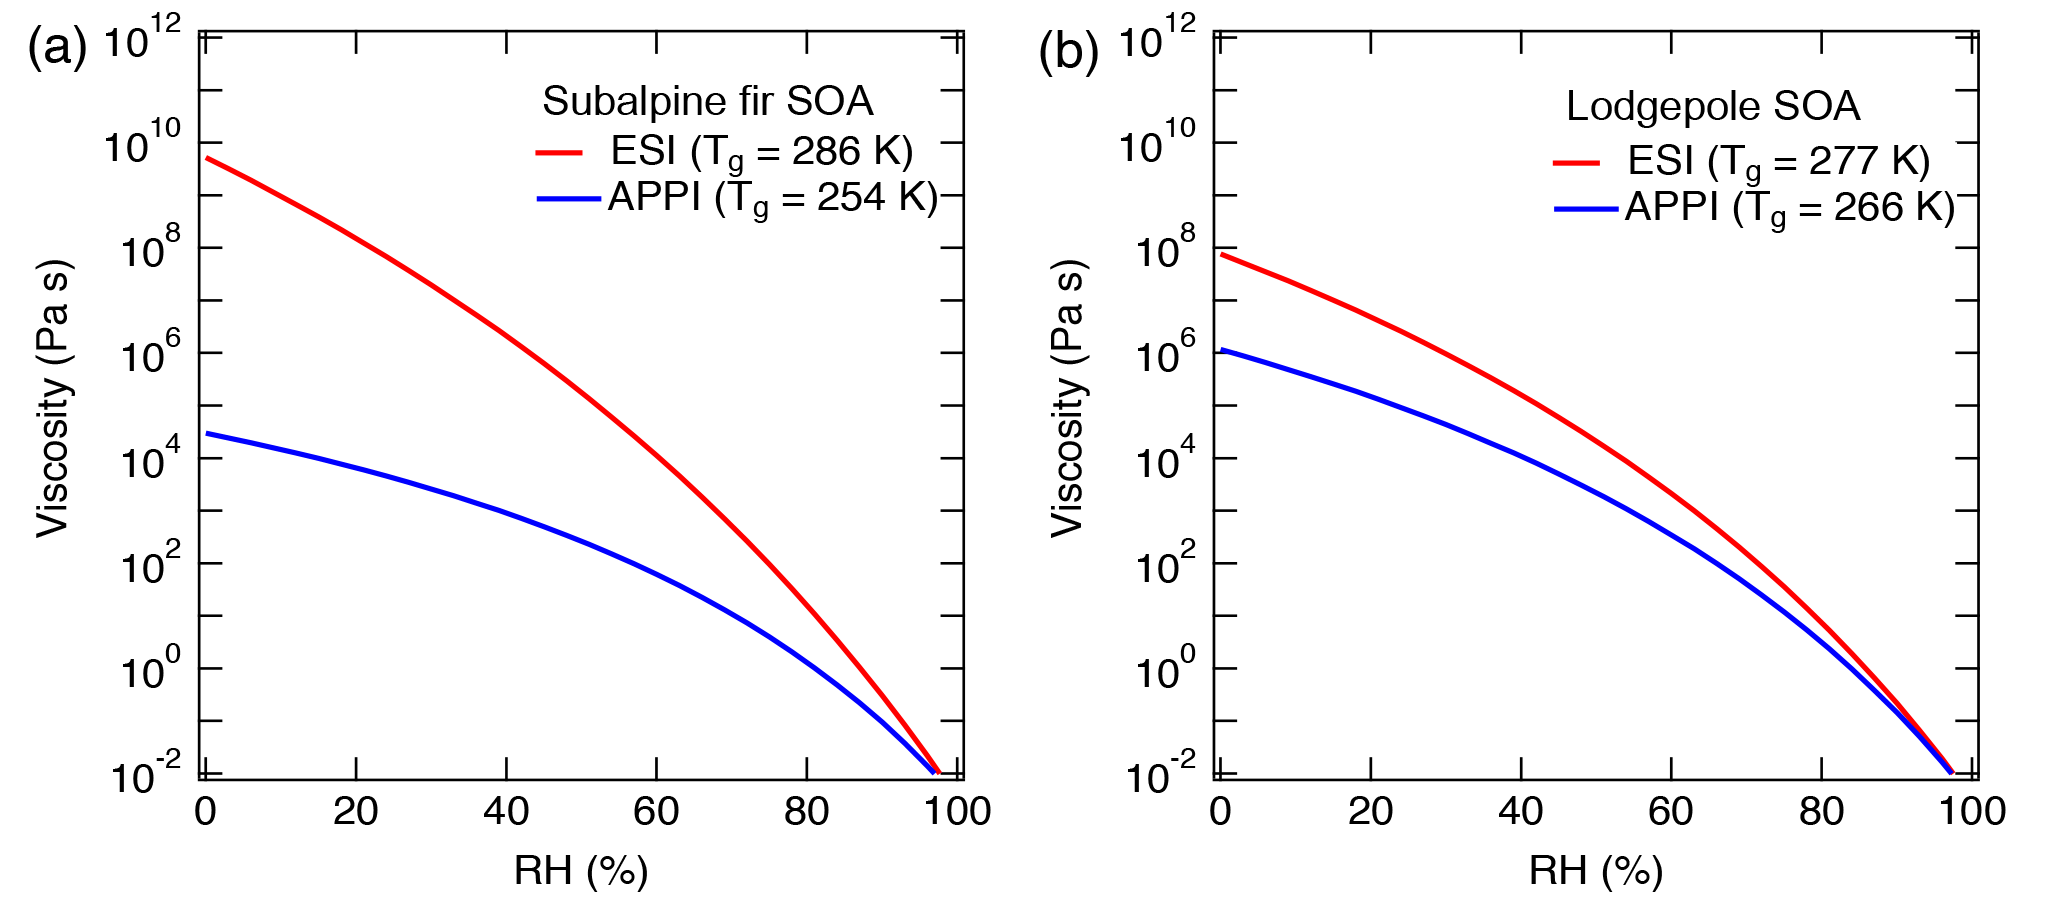
Figure 9Sensitivity of the predicted viscosity for biomass burning particles of (a) subalpine fir and (b) lodgepole pine trees as measured by high-resolution mass spectrometry to the ionization technique: electrospray ionization (ESI, red) and atmospheric pressure photoionization (APPI; blue). Tg,org values are specified in the figure legend and the other parameters used are fixed to κ=0.1, D=10, and kGT=2.5. Different results are obtained for the same sample because ESI and APPI probe a different subset of compounds (Fig. 8).
There are several possible reasons for the difference between the measurements and predictions. First, the relative abundance of high-molar-mass compounds observed in HRMS measurements may be overestimated, as high-molar-mass compounds tend to have higher (yet generally unknown) ionization efficiencies compared to lower-molar-mass compounds. Second, the nano-DESI-HRMS analysis of toluene SOA was limited to an m∕z range of 100–1000 (Hinks et al., 2018). It is possible that some SOA products with lower molar mass were present in particles but not detected, which would lead to an overestimation of Tg. Third, the chemical composition of toluene SOA is likely different between Hinks et al. (2018) and Song et al. (2016a) because of the differences in the experimental conditions. Specifically, toluene SOA was formed in a Teflon chamber in Hinks et al., while Song et al. used an oxidation flow reactor to generate toluene SOA. The O : C ratios are 0.71 at low RH and 0.63 at high RH based on nano-DESI-HRMS measurements in Hinks et al. (2018), while the O : C ratio was 1.06 in Song et al. (2016a) based on the aerosol mass spectrometry (AMS) measurements.
In addition, different mass loadings may have affected viscosity. Song et al. (2016a) measured viscosity at two different mass loadings (60–100 and 600–1000 µg m−3) and compared their results to the toluene SOA data in Bateman et al. (2015; 30–50 µg m−3) and Li et al. (2015; 44–125 µg m−3), observing little impact of mass loadings on viscosity. We carried out a sensitivity study of mass loadings on viscosity using a set of compounds detected by HRMS. The saturation mass concentration was predicted for each component using the molecular corridor approach (Li et al., 2016). Assuming that the mass signal intensity is proportional to the total mass concentration of the compound in the mixture and applying the absorptive partitioning theory (Pankow, 1994), the particle-phase concentrations of each compound were predicted to estimate Tg at different organic aerosol mass loading values (1–1000 µg m−3). The glass transition temperature of the SOA mixture decreases as mass loading increases. Viscosity decreases up to 2 orders of magnitude at low RH, while at high RH there is little difference as shown in Fig. A3. Simultaneous measurements of viscosity and chemical composition with different mass loadings should be performed in future studies.
3.3 Biomass burning particles
To further explore the applicability of our viscosity prediction method using elemental composition as measured by HRMS, we performed similar calculations for biomass burning organic particles emitted from test facility burns of subalpine fir and lodgepole pine trees, which were conducted as a part of the FIREX 2016 campaign (Selimovic et al., 2018). These samples were analyzed by HRMS using two different ionization sources: electrospray ionization (ESI) and atmospheric pressure photoionization (APPI). The mass spectra shown in Fig. 8a and b indicate that a substantial number of compounds were detected by both methods (109 and 170 compounds for subalpine fur and lodgepole pine, respectively). However, pronounced differences are also observed between the ESI and APPI spectra both in terms of the identity and signal intensities of the detected compounds.
Glass transition temperatures for the assigned CH and CHO compounds were computed using Eq. (2). Nitrogen- and sulfur-containing compounds (CHON and CHOS) are not yet covered by Eq. (2) and were therefore excluded from the analysis. CHON and CHOS compounds comprised less than 10 % of the detected ion intensity and < 15 % of the assigned compounds. Note that we do not intend to provide accurate estimates of the viscosity of ambient biomass burning particles (as inorganic components are also not included in this analysis), but we investigate how the use of different ionization methods would lead to variations in our viscosity predictions. Tg values of organic mixtures (Tg,org) were then calculated using the Gordon–Taylor approach with kGT= 1, assuming that the relative concentration of each compound is proportional to its MS signal intensity. The calculated Tg,org values for the mixtures are specified in the legend of Fig. 9. For both types of mixtures, the calculated Tg,org for the APPI MS data is lower than the value calculated based on the ESI MS data with a difference of 32 K for subalpine fir and 11 K for the lodgepole pine. Figure 9 shows the predicted viscosity as a function of RH, assuming D=10, κ=0.10, and kGT=2.5. The difference in Tg,org derived from ESI and APPI results in a variation of predicted viscosity at low RH by up to 5 and 2 orders of magnitude for subalpine fir and lodgepole pine, respectively.
The difference in the calculated Tg,org values is attributed to the chemical profile of the species detected using different ionization techniques as shown in the mass spectra in Fig. 8a and b. The van Krevelen diagrams in Fig. 8c and d illustrate these compositional differences between chemical species detected by ESI and APPI. ESI is more efficient at detection of polar compounds (Kiontke et al., 2016), which typically have higher O : C ratios and therefore would result in higher predicted values of glass transition temperature (Koop et al., 2011; Saukko et al., 2012). APPI enables the detecting nonpolar compounds with lower O : C ratios, in particular polycyclic aromatic hydrocarbons (PAHs) that have low ionization efficiencies when analyzed by ESI MS (Raffaelli and Saba, 2003; Itoh et al., 2006). Due to the complementary nature of these ionization methods, it is most likely that the actual glass transition temperature and viscosity of each type of organic components in biomass burning aerosols are somewhere in between the values inferred from ESI and APPI datasets: ESI MS may be viewed as providing the upper limit of viscosity, while APPI MS gives the lower limit. Our results indicate that the use of complementary ionization techniques may help evaluate the associated uncertainty for the prediction of viscosity values based on elemental composition as measured by HRMS.
We have developed a parameterization for the calculation of the glass transition temperature of individual SOA compounds with molar mass up to ∼ 1100 g mol−1 using the number of carbon, oxygen, and hydrogen atoms. The viscosity of SOA was estimated using the Tg-scaled Arrhenius plot of viscosity versus Tg∕T and the Gordon–Taylor approach to account for mixtures of SOA and water. The fragility parameter D was compiled for organic compounds and we found that D approaches a lower limit of ∼ 10 (±1.7) as the molar mass increases. The resulting viscosity estimations agree well with the measured viscosity of α-pinene and isoprene SOA, validating our method. Using HRMS data, the glass transition temperatures of individual components and the viscosity of toluene SOA were predicted, also resulting in a good agreement with measurements. However, we note that the predicted viscosities were higher than the measured values, suggesting that additional considerations may need to be taken into account. For example, the ionization efficiency of both low- and high-molar-mass compounds may have a pronounced effect on the relative abundance of different classes of compounds in HRMS data. The viscosity prediction method was also applied to biomass burning particles whose elemental composition was measured using HRMS with two different ionization techniques. Substantial differences in viscosity estimations were obtained using ESI and APPI mass spectra because these two ionization methods probe different subsets of compounds.
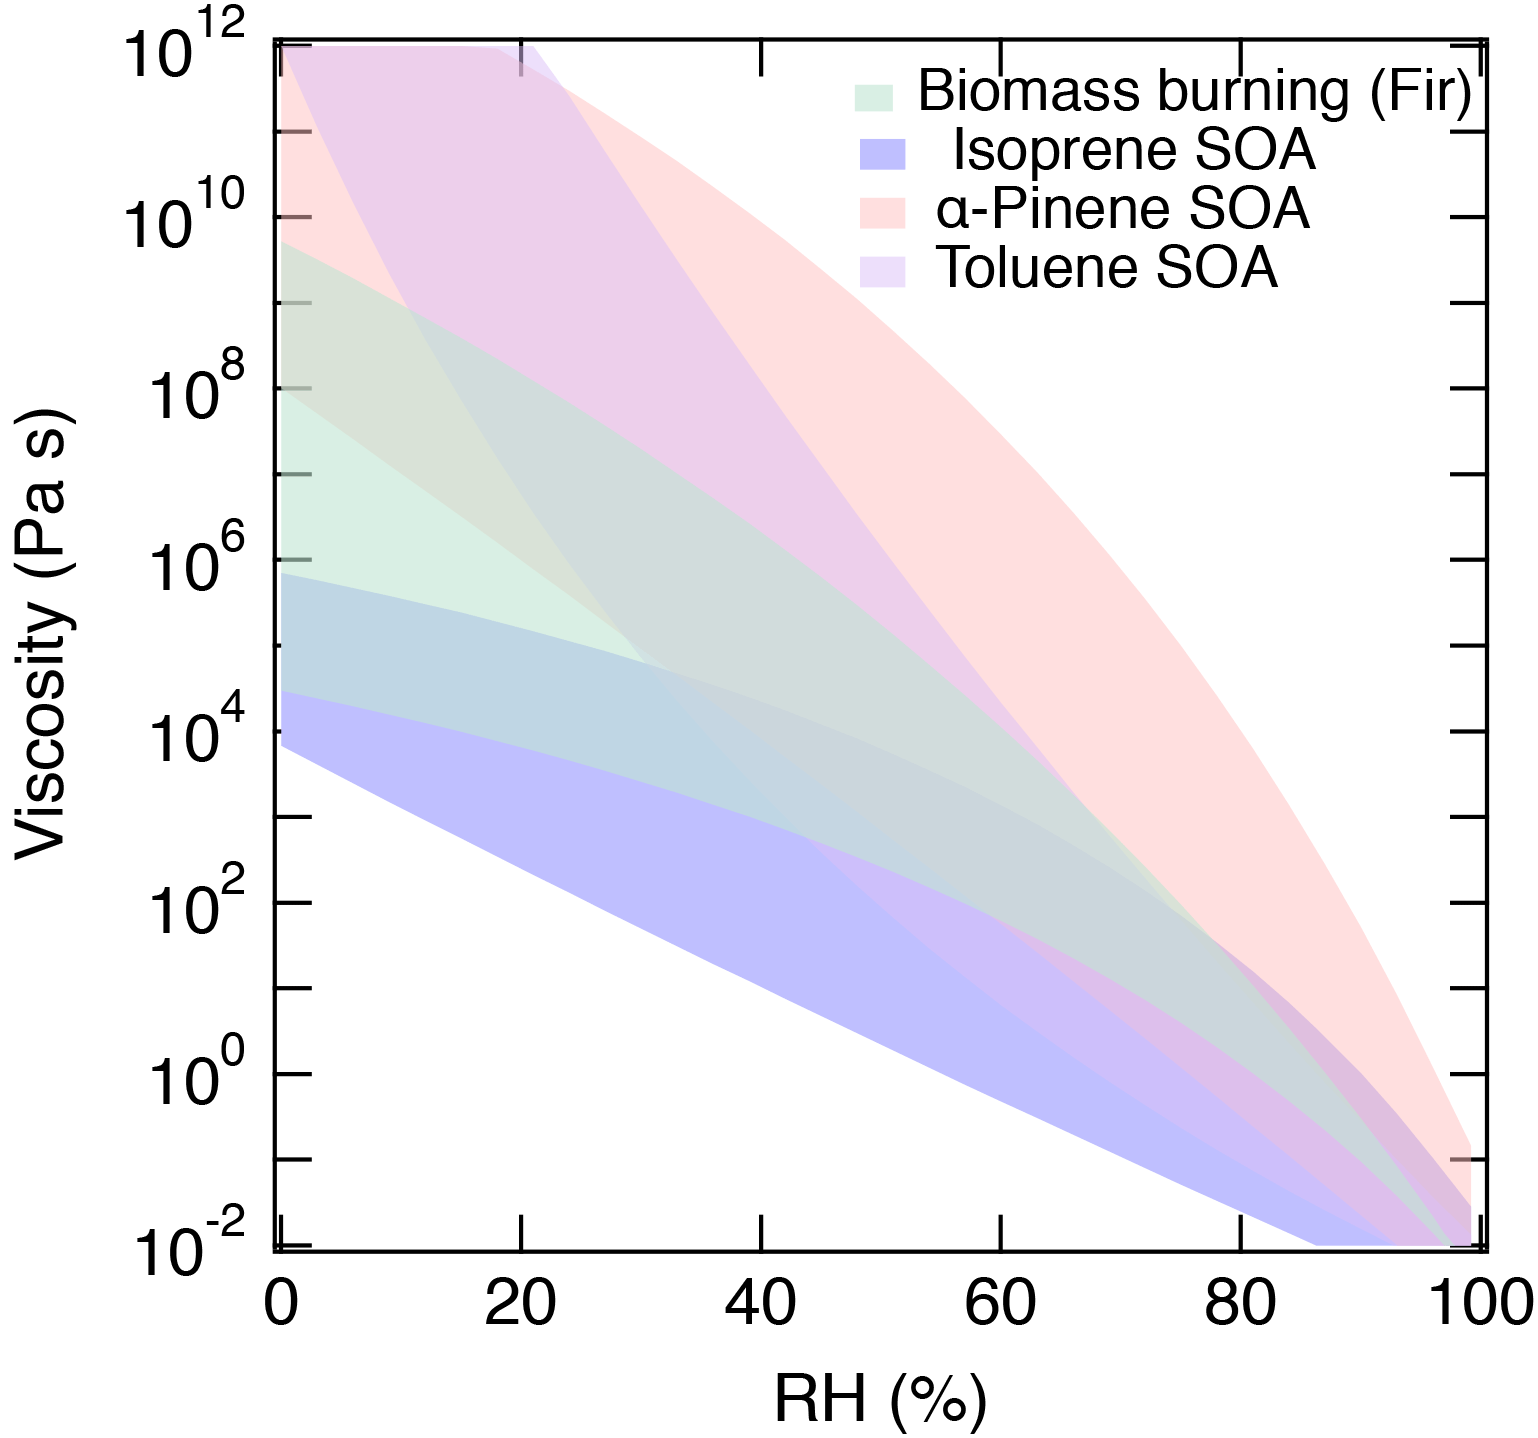
Figure 10Summary of the predicted range of viscosity for α-pinene SOA (red), isoprene SOA (blue), toluene SOA (purple), and biomass burning particles (green).
Figure 10 summarizes the predicted range of the viscosity of α-pinene SOA, isoprene SOA (generated by PAM), toluene SOA, and biomass burning particles. Isoprene SOA has lower viscosity, reflecting a lower glass transition temperature due to the relatively low molar mass of isoprene oxidation products. α-Pinene and toluene SOA have much higher viscosity with a different shape of the RH dependence due to differences in glass transition temperatures and hygroscopicity. Biomass burning particles have moderate viscosity between the two extreme cases. Currently, both predictions and measurements are subject to large uncertainties and variations. Complementary measurements of viscosity and chemical composition employing different ionization techniques are desired to further constrain RH-dependent viscosity in future studies. Current Tg parameterizations do not consider functionality or molecular structure explicitly and further measurements of Tg and viscosity of SOA would allow us to refine the method presented in this study. Nevertheless, the current results offer a promising starting point and such simple parameterizations are practical for predicting the viscosity of particles as measured by HRMS. The developed viscosity prediction method should also be useful in recent efforts to simulate the distribution of SOA phase state and related properties in regional or global air quality models (e.g., Maclean et al., 2017; Shiraiwa et al., 2017).
Data are available upon request to the corresponding author.
The fragility steepness index (m) is defined as
Combining Eq. (A1) with Eq. (6) gives
Considering that η=1012 Pa s at T=Tg (Angell, 1991) and by defining , a combination with Eq. (7) leads to
Note that Eq. (A3) is derived assuming that the high temperature limit of viscosity η∞ is equal to 10−5 Pa s (Angell, 1991) in the VTF equation (Eq. 5). Similar equations for the relation between m and D were given by previous studies using different η∞ and units (Angell et al., 1994; Angell, 2002; Bones et al., 2012) and applying those gave very similar results in our study.
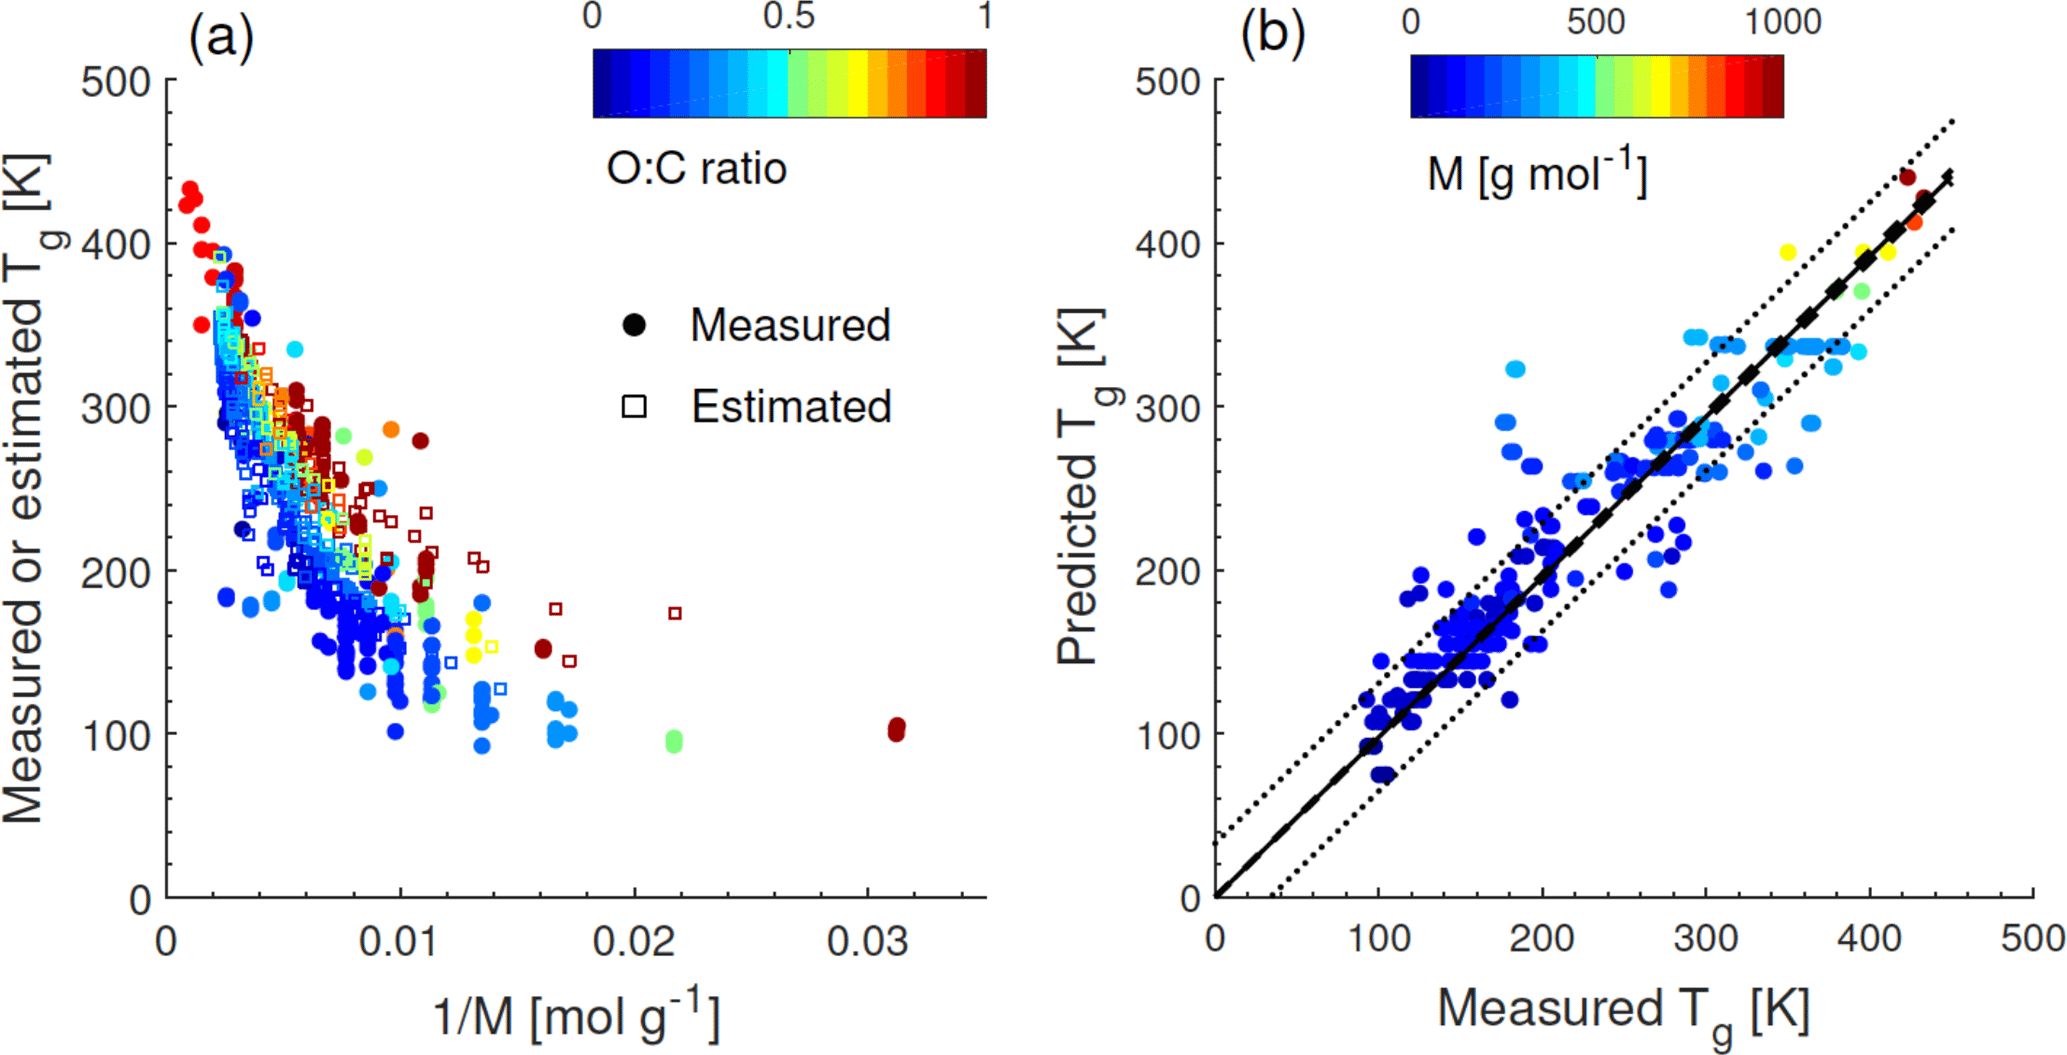
Figure A1(a) Tg of organic compounds as measured (circles) and estimated with the Boyer–Kauzmann rule (squares) plotted against the inverse molar mass. The markers are color coded by atomic O : C ratio. (b) Predicted Tg for CHO compounds using a parameterization (Eq. 2) developed in this study compared to measured Tg (circles). The solid line shows the 1:1 line and the dashed and dotted lines show 68 % confidence and prediction bands, respectively.

Figure A2(a) Comparison of measured and estimated Tg by the Boyer–Kauzmann rule for 251 organic compounds (Koop et al., 2011; Dette et al., 2014; Rothfuss and Petters, 2017a) with their measured Tm available. The markers are color coded by molar mass. (b, c) Predicted Tg using Eq. (2) compared with (b) measured Tg for CH compounds and (c) predicted Tg using Eq. (1) for CHO compounds. The solid line shows the 1:1 line. Solid circle markers represent organic compounds as compiled in Koop et al. (2011) and open square markers represent SOA oxidation products in Shiraiwa et al. (2014) in panel (c).
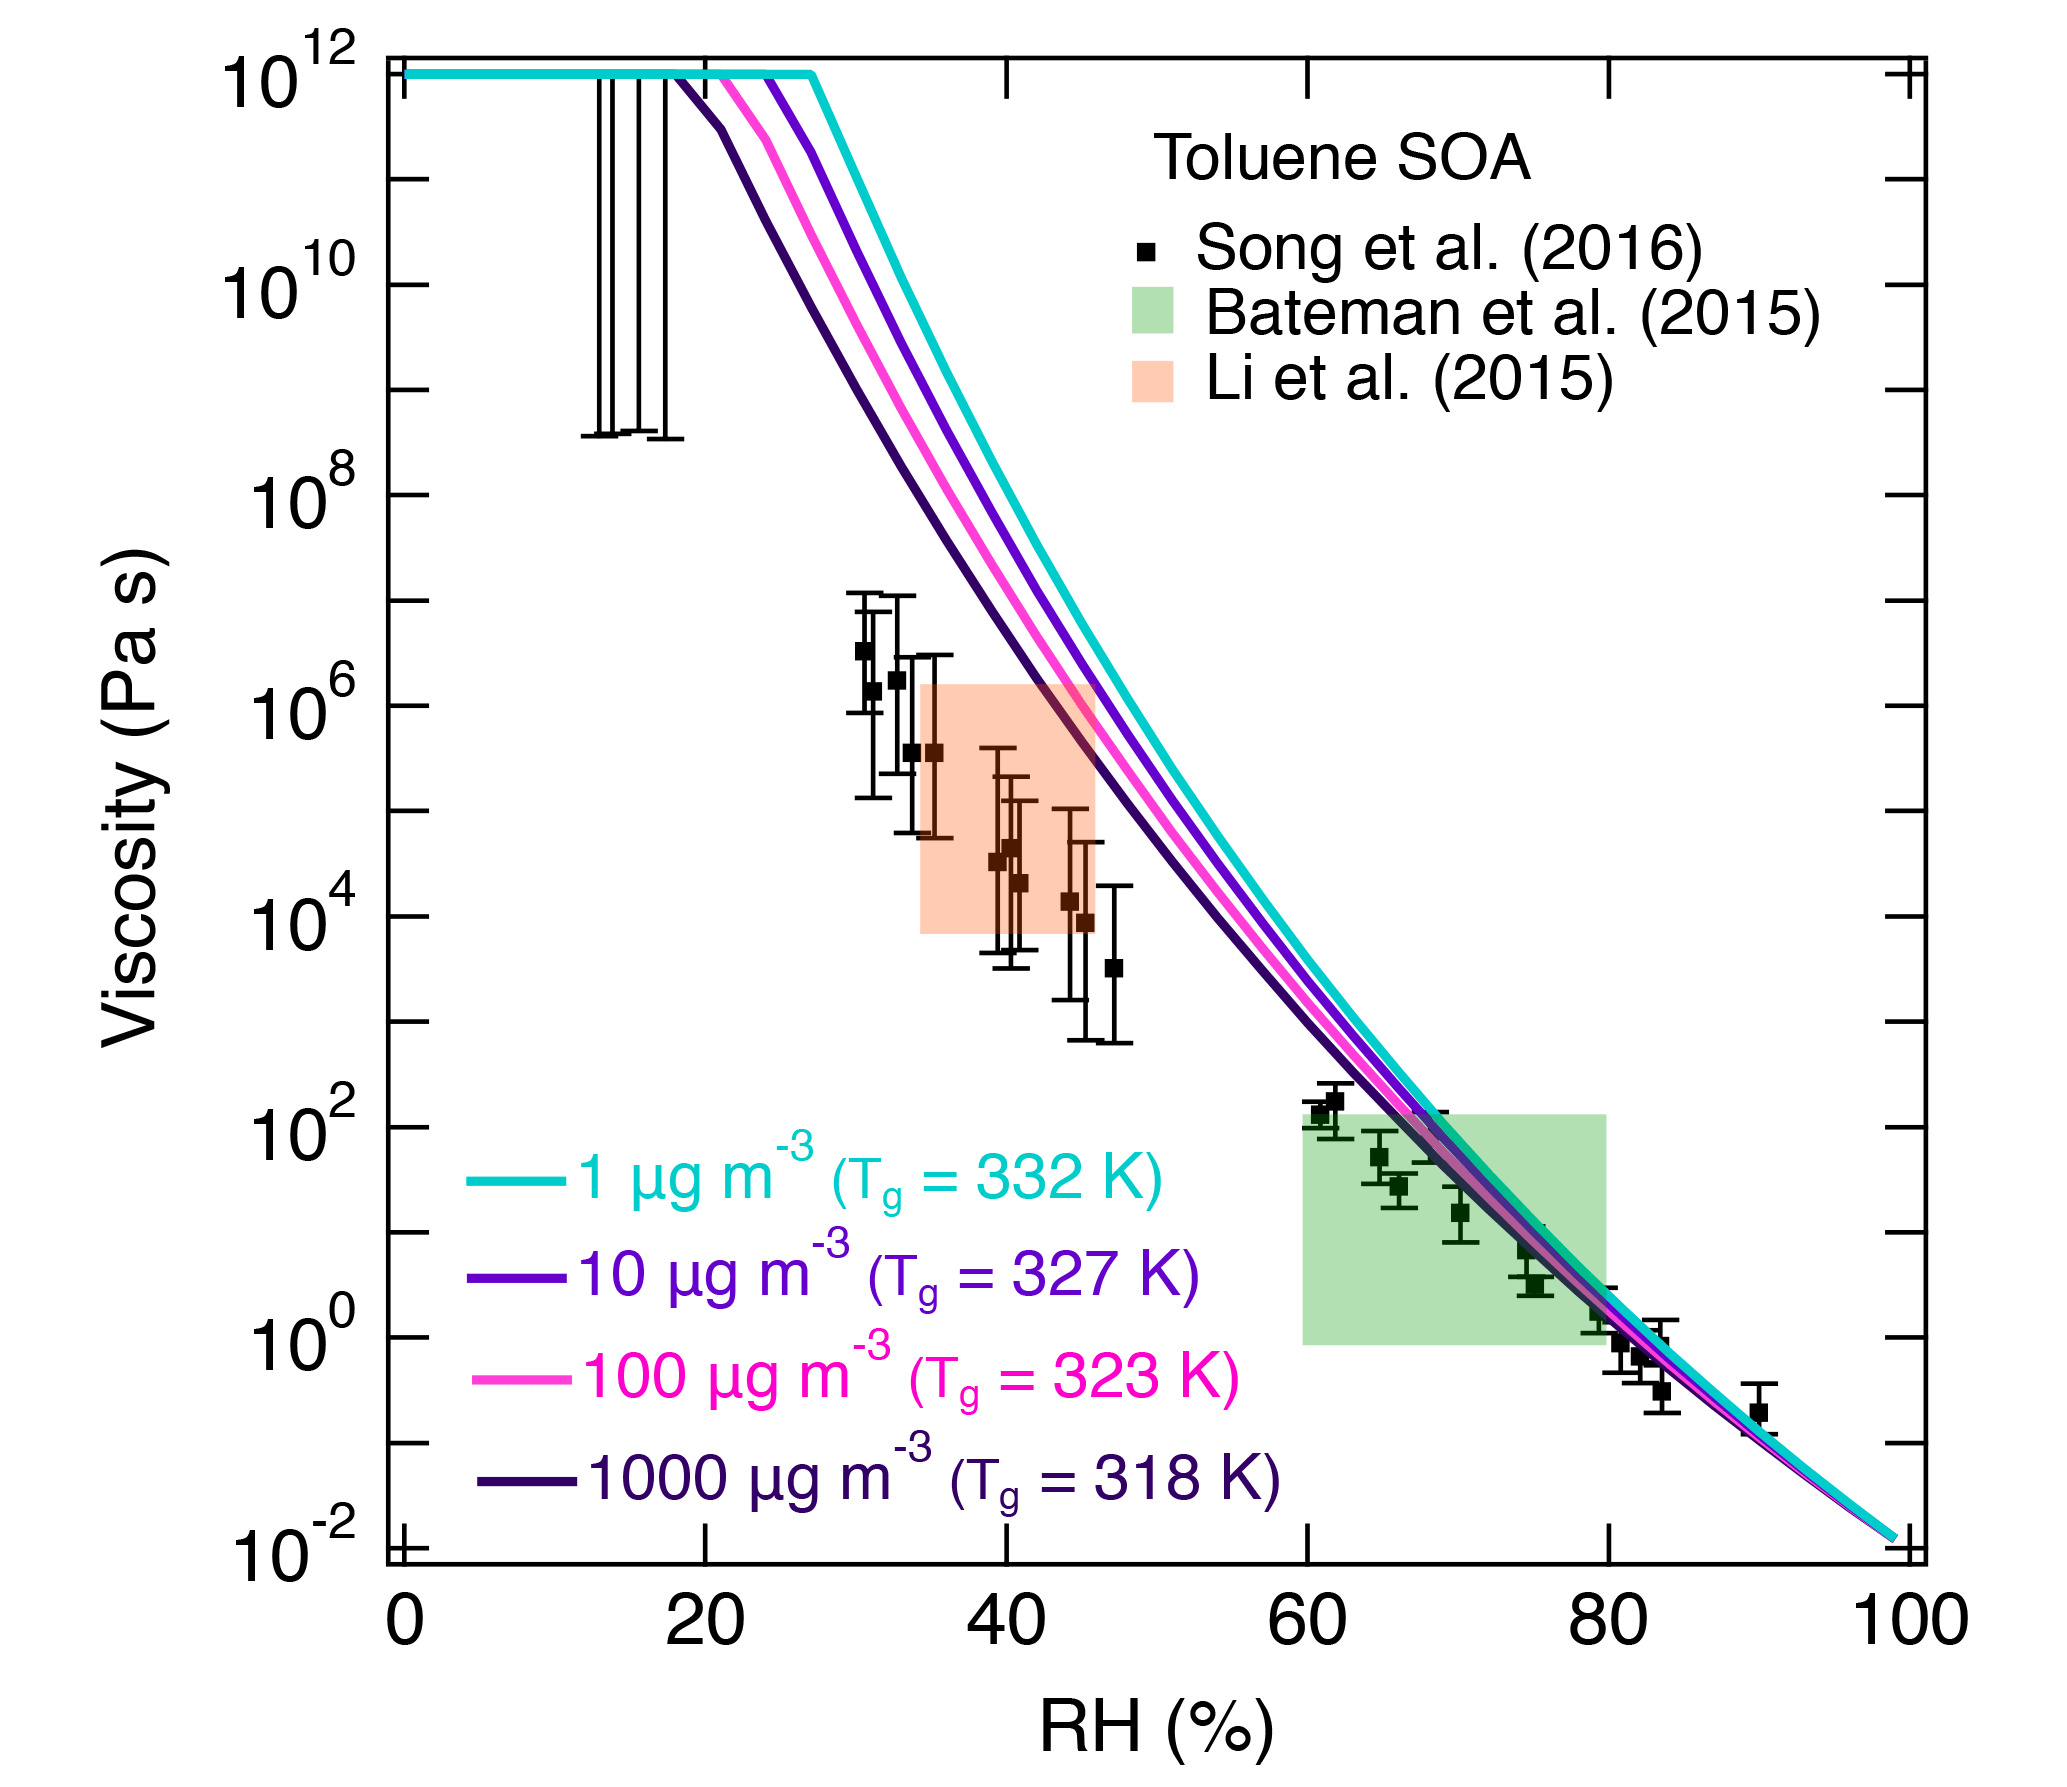
Figure A3Effect of mass loading on predicted viscosity for toluene SOA. Solid lines represent the predicted viscosity with Eq. (2) using the chemical composition of toluene SOA formed at low RH. Viscosity was predicted with different mass loadings ranging from 1–1000 µg m−3. Markers and shaded boxes represent experimentally measured viscosity values. The Song et al. (2016a) mass loadings were 60–100 and 600–1000 µg m−3. The Bateman et al. (2015) and Li et al. (2015) mass loadings were 30–50 and 44–125 µg m−3, respectively.
The authors declare that they have no conflict of interest.
This work was funded by the National Science Foundation (AGS-1654104) and the
Department of Energy (DE-SC0018349). The Purdue group and Sergey A.
Nizkorodov acknowledge additional support by the US Department of Commerce
and the
National Oceanic and Atmospheric Administration through the Climate Program
Office AC4 program, awards NA16OAR4310101 and NA16OAR4310102. We thank
Ulrich Pöschl and Thomas Koop for stimulating
discussions.
Edited by: Jason Surratt
Reviewed by: two anonymous referees
Abbatt, J. P. D., Lee, A. K. Y., and Thornton, J. A.: Quantifying trace gas uptake to tropospheric aerosol: recent advances and remaining challenges, Chem. Soc. Rev., 41, 6555–6581, 2012.
Abramson, E., Imre, D., Beranek, J., Wilson, J. M., and Zelenyuk, A.: Experimental determination of chemical diffusion within secondary organic aerosol particles, Phys. Chem. Chem. Phys., 15, 2983–2991, 2013.
Aiken, A. C., DeCarlo, P. F., Kroll, J. H., Worsnop, D. R., Huffman, J. A., Docherty, K. S., Ulbrich, I. M., Mohr, C., Kimmel, J. R., Sueper, D., Sun, Y., Zhang, Q., Trimborn, A., Northway, M., Ziemann, P. J., Canagaratna, M. R., Onasch, T. B., Alfarra, M. R., Prevot, A. S. H., Dommen, J., Duplissy, J., Metzger, A., Baltensperger, U., and Jimenez, J. L.: O/C and OM/OC Ratios of Primary, Secondary, and Ambient Organic Aerosols with High-Resolution Time-of-Flight Aerosol Mass Spectrometry, Environ. Sci. Technol., 42, 4478–4485, 2008.
Angell, C.: Relaxation in liquids, polymers and plastic crystals – strong/fragile patterns and problems, J. Non-Cryst. Solids, 131, 13–31, 1991.
Angell, C. A.: Formation of glasses from liquids and biopolymers, Science, 267, 1924–1935, 1995.
Angell, C. A.: Entropy and fragility in supercooling liquids, National Institute of Standards and Technology, J. Res., 102, 171–185, 1997.
Angell, C. A.: Liquid Fragility and the Glass Transition in Water and Aqueous Solutions, Chem. Rev., 102, 2627–2650, 2002.
Angell, C. A., Bressel, R. D., Green, J. L., Kanno, H., Oguni, M., and Sare, E. J.: Liquid fragility and the glass transition in water and aqueous solutions, J. Food Eng., 22, 115–142, 1994.
Arangio, A. M., Slade, J. H., Berkemeier, T., Pöschl, U., Knopf, D. A., and Shiraiwa, M.: Multiphase Chemical Kinetics of OH Radical Uptake by Molecular Organic Markers of Biomass Burning Aerosols: Humidity and Temperature Dependence, Surface Reaction and Bulk Diffusion, J. Phys. Chem. A, 119, 4533–4544, 2015.
Atkins, P. W.: Physical Chemistry, Oxford University Press, Oxford, 1998.
Bastelberger, S., Krieger, U. K., Luo, B., and Peter, T.: Diffusivity measurements of volatile organics in levitated viscous aerosol particles, Atmos. Chem. Phys., 17, 8453–8471, https://doi.org/10.5194/acp-17-8453-2017, 2017.
Bateman, A. P., Laskin, J., Laskin, A., and Nizkorodov, S. A.: Applications of High-Resolution Electrospray Ionization Mass Spectrometry to Measurements of Average Oxygen to Carbon Ratios in Secondary Organic Aerosols, Environ. Sci. Technol., 46, 8315–8324, 2012.
Bateman, A. P., Bertram, A. K., and Martin, S. T.: Hygroscopic Influence on the Semisolid-to-Liquid Transition of Secondary Organic Materials, J. Phys. Chem. A, 119, 4386–4395, 2015.
Bateman, A. P., Laskin, J., Laskin, A., and Nizkorodov, S. A.: Sub-micrometre particulate matter is primarily in liquid form over Amazon rainforest, Nat. Geosci., 9, 34–37, 2016.
Baustian, K. J., Wise, M. E., Jensen, E. J., Schill, G. P., Freedman, M. A., and Tolbert, M. A.: State transformations and ice nucleation in amorphous (semi-)solid organic aerosol, Atmos. Chem. Phys., 13, 5615–5628, https://doi.org/10.5194/acp-13-5615-2013, 2013.
Berkemeier, T., Shiraiwa, M., Pöschl, U., and Koop, T.: Competition between water uptake and ice nucleation by glassy organic aerosol particles, Atmos. Chem. Phys., 14, 12513–12531, https://doi.org/10.5194/acp-14-12513-2014, 2014.
Berkemeier, T., Steimer, S., Krieger, U. K., Peter, T., Poschl, U., Ammann, M., and Shiraiwa, M.: Ozone uptake on glassy, semi-solid and liquid organic matter and the role of reactive oxygen intermediates in atmospheric aerosol chemistry, Phys. Chem. Chem. Phys., 18, 12662–12674, 2016.
Boehmer, R., Ngai, K. L., Angell, C. A., and Plazek, D. J.: Nonexponential relaxations in strong and fragile glass formers, J. Chem. Phys., 99, 4201–4209, 1993.
Bones, D. L., Reid, J. P., Lienhard, D. M., and Krieger, U. K.: Comparing the mechanism of water condensation and evaporation in glassy aerosol, P. Natl. Acad. Sci. USA, 109, 11613–11618, 2012.
Booth, A. M., Murphy, B., Riipinen, I., Percival, C. J., and Topping, D. O.: Connecting Bulk Viscosity Measurements to Kinetic Limitations on Attaining Equilibrium for a Model Aerosol Composition, Environ. Sci. Technol., 48, 9298–9305, 2014.
Cappa, C. D. and Wilson, K. R.: Evolution of organic aerosol mass spectra upon heating: implications for OA phase and partitioning behavior, Atmos. Chem. Phys., 11, 1895–1911, https://doi.org/10.5194/acp-11-1895-2011, 2011.
Cappa, C. D. and Wilson, K. R.: Multi-generation gas-phase oxidation, equilibrium partitioning, and the formation and evolution of secondary organic aerosol, Atmos. Chem. Phys., 12, 9505–9528, https://doi.org/10.5194/acp-12-9505-2012, 2012.
Champion, D., Le Meste, M., and Simatos, D.: Towards an improved understanding of glass transition and relaxations in foods: molecular mobility in the glass transition range, Trends Food Sci. Technol., 11, 41–55, 2000.
Chen, Q., Liu, Y., Donahue, N. M., Shilling, J. E., and Martin, S. T.: Particle-Phase Chemistry of Secondary Organic Material: Modeled Compared to Measured O:C and H:C Elemental Ratios Provide Constraints, Environ. Sci. Technol., 45, 4763–4770, 2011.
Chenyakin, Y., Ullmann, D. A., Evoy, E., Renbaum-Wolff, L., Kamal, S., and Bertram, A. K.: Diffusion coefficients of organic molecules in sucrose–water solutions and comparison with Stokes–Einstein predictions, Atmos. Chem. Phys., 17, 2423–2435, https://doi.org/10.5194/acp-17-2423-2017, 2017.
Davies, J. F. and Wilson, K. R.: Nanoscale interfacial gradients formed by the reactive uptake of OH radicals onto viscous aerosol surfaces, Chem. Sci., 6, 7020–7027, 2015.
Dette, H. P. and Koop, T.: Glass Formation Processes in Mixed Inorganic/Organic Aerosol Particles, J. Phys. Chem. A, 119, 4552–4561, 2015.
Dette, H. P., Qi, M., Schröder, D. C., Godt, A., and Koop, T.: Glass-forming properties of 3-Methylbutane-1,2,3-tricarboxylic acid and its mixtures with water and pinonic acid, J. Phys. Chem. A, 118, 7024–7033, 2014.
Donahue, N. M., Robinson, A. L., Stanier, C. O., and Pandis, S. N.: Coupled partitioning, dilution, and chemical aging of semivolatile organics, Environ. Sci. Technol., 40, 2635–2643, 2006.
Donahue, N. M., Epstein, S. A., Pandis, S. N., and Robinson, A. L.: A two-dimensional volatility basis set: 1. organic-aerosol mixing thermodynamics, Atmos. Chem. Phys., 11, 3303–3318, https://doi.org/10.5194/acp-11-3303-2011, 2011.
Einstein, A.: The motion of elements suspended in static liquids as claimed in the molecular kinetic theory of heat, Ann. Phys., 17, 549–560, 1905.
Fox Jr., T. G. and Flory, P. J.: Second order transition temperatures and related properties of polystyrene. I. Influence of molecular weight, J. Appl. Phys., 21, 581–591, 1950.
Gao, S., Ng, N. L., Keywood, M., Varutbangkul, V., Bahreini, R., Nenes, A., He, J. W., Yoo, K. Y., Beauchamp, J. L., Hodyss, R. P., Flagan, R. C., and Seinfeld, J. H.: Particle phase acidity and oligomer formation in secondary organic aerosol, Environ. Sci. Technol., 38, 6582–6589, 2004.
Gaston, C. J., Riedel, T. P., Zhang, Z., Gold, A., Surratt, J. D., and Thornton, J. A.: Reactive Uptake of an Isoprene-Derived Epoxydiol to Submicron Aerosol Particles, Environ. Sci. Technol., 48, 11178–11186, 2014.
Goldstein, A. H. and Galbally, I. E.: Known and unexplored organic constituents in the earth's atmosphere, Environ. Sci. Technol., 41, 1514–1521, 2007.
Gorkowski, K., Donahue, N. M., and Sullivan, R. C.: Emulsified and Liquid–Liquid Phase-Separated States of α-Pinene Secondary Organic Aerosol Determined Using Aerosol Optical Tweezers, Environ. Sci. Technol., 51, 12154–12163, 2017.
Grayson, J. W., Zhang, Y., Mutzel, A., Renbaum-Wolff, L., Böge, O., Kamal, S., Herrmann, H., Martin, S. T., and Bertram, A. K.: Effect of varying experimental conditions on the viscosity of α-pinene derived secondary organic material, Atmos. Chem. Phys., 16, 6027–6040, https://doi.org/10.5194/acp-16-6027-2016, 2016.
Grayson, J. W., Evoy, E., Song, M., Chu, Y., Maclean, A., Nguyen, A., Upshur, M. A., Ebrahimi, M., Chan, C. K., Geiger, F. M., Thomson, R. J., and Bertram, A. K.: The effect of hydroxyl functional groups and molar mass on the viscosity of non-crystalline organic and organic–water particles, Atmos. Chem. Phys., 17, 8509–8524, https://doi.org/10.5194/acp-17-8509-2017, 2017.
Gunthe, S. S., King, S. M., Rose, D., Chen, Q., Roldin, P., Farmer, D. K., Jimenez, J. L., Artaxo, P., Andreae, M. O., Martin, S. T., and Pöschl, U.: Cloud condensation nuclei in pristine tropical rainforest air of Amazonia: size-resolved measurements and modeling of atmospheric aerosol composition and CCN activity, Atmos. Chem. Phys., 9, 7551–7575, https://doi.org/10.5194/acp-9-7551-2009, 2009.
Hancock, B. C. and Zografi, G.: The relationship between the glass transition temperature and the water content of amorphous pharmaceutical solids, Pharm. Res., 11, 471–477, 1994.
Hildebrandt Ruiz, L., Paciga, A. L., Cerully, K. M., Nenes, A., Donahue, N. M., and Pandis, S. N.: Formation and aging of secondary organic aerosol from toluene: changes in chemical composition, volatility, and hygroscopicity, Atmos. Chem. Phys., 15, 8301–8313, https://doi.org/10.5194/acp-15-8301-2015, 2015.
Hinks, M. L., Brady, M. V., Lignell, H., Song, M., Grayson, J. W., Bertram, A. K., Lin, P., Laskin, A., Laskin, J., and Nizkorodov, S. A.: Effect of viscosity on photodegradation rates in complex secondary organic aerosol materials, Phys. Chem. Chem. Phys., 18, 8785–8793, 2016.
Hinks, M. L., Montoya-Aguilera, J., Ellison, L., Lin, P., Laskin, A., Laskin, J., Shiraiwa, M., Dabdub, D., and Nizkorodov, S. A.: Effect of relative humidity on the composition of secondary organic aerosol from the oxidation of toluene, Atmos. Chem. Phys., 18, 1643–1652, https://doi.org/10.5194/acp-18-1643-2018, 2018.
Hosny, N. A., Fitzgerald, C., Vysniauskas, A., Athanasiadis, A., Berkemeier, T., Uygur, N., Poschl, U., Shiraiwa, M., Kalberer, M., Pope, F. D., and Kuimova, M. K.: Direct imaging of changes in aerosol particle viscosity upon hydration and chemical aging, Chem. Sci., 7, 1357–1367, 2016.
Huang, D. and McKenna, G. B.: New insights into the fragility dilemma in liquids, J. Chem. Phys., 114, 5621–5630, 2001.
Huang, W., Saathoff, H., Pajunoja, A., Shen, X., Naumann, K.-H., Wagner, R., Virtanen, A., Leisner, T., and Mohr, C.: α-Pinene secondary organic aerosol at low temperature: chemical composition and implications for particle viscosity, Atmos. Chem. Phys., 18, 2883–2898, https://doi.org/10.5194/acp-18-2883-2018, 2018.
Ignatius, K., Kristensen, T. B., Järvinen, E., Nichman, L., Fuchs, C., Gordon, H., Herenz, P., Hoyle, C. R., Duplissy, J., Garimella, S., Dias, A., Frege, C., Höppel, N., Tröstl, J., Wagner, R., Yan, C., Amorim, A., Baltensperger, U., Curtius, J., Donahue, N. M., Gallagher, M. W., Kirkby, J., Kulmala, M., Möhler, O., Saathoff, H., Schnaiter, M., Tomé, A., Virtanen, A., Worsnop, D., and Stratmann, F.: Heterogeneous ice nucleation of viscous secondary organic aerosol produced from ozonolysis of a-pinene, Atmos. Chem. Phys., 16, 6495–6509, https://doi.org/10.5194/acp-16-6495-2016, 2016.
Itoh, N., Aoyagi, Y., and Yarita, T.: Optimization of the dopant for the trace determination of polycyclic aromatic hydrocarbons by liquid chromatography/dopant-assisted atmospheric-pressure photoionization/mass spectrometry, J. Chromatogr. A, 1131, 285–288, 2006.
Jain, S. and Petrucci, G. A.: A New Method to Measure Aerosol Particle Bounce Using a Cascade Electrical Low Pressure Impactor, Aerosol Sci. Tech., 49, 390–399, 2015.
Jain, S., Fischer, B. K., and Petrucci, A. G.: The Influence of Absolute Mass Loading of Secondary Organic Aerosols on Their Phase State, Atmosphere, 9, 131, https://doi.org/10.3390/atmos9040131, 2018.
Jathar, S. H., Cappa, C. D., Wexler, A. S., Seinfeld, J. H., and Kleeman, M. J.: Multi-generational oxidation model to simulate secondary organic aerosol in a 3-D air quality model, Geosci. Model Dev., 8, 2553–2567, https://doi.org/10.5194/gmd-8-2553-2015, 2015.
Jimenez, J. L., Canagaratna, M. R., Donahue, N. M., Prevot, A. S. H., Zhang, Q., Kroll, J. H., DeCarlo, P. F., Allan, J. D., Coe, H., Ng, N. L., Aiken, A. C., Docherty, K. S., Ulbrich, I. M., Grieshop, A. P., Robinson, A. L., Duplissy, J., Smith, J. D., Wilson, K. R., Lanz, V. A., Hueglin, C., Sun, Y. L., Tian, J., Laaksonen, A., Raatikainen, T., Rautiainen, J., Vaattovaara, P., Ehn, M., Kulmala, M., Tomlinson, J. M., Collins, D. R., Cubison, M. J., Dunlea, E. J., Huffman, J. A., Onasch, T. B., Alfarra, M. R., Williams, P. I., Bower, K., Kondo, Y., Schneider, J., Drewnick, F., Borrmann, S., Weimer, S., Demerjian, K., Salcedo, D., Cottrell, L., Griffin, R., Takami, A., Miyoshi, T., Hatakeyama, S., Shimono, A., Sun, J. Y., Zhang, Y. M., Dzepina, K., Kimmel, J. R., Sueper, D., Jayne, J. T., Herndon, S. C., Trimborn, A. M., Williams, L. R., Wood, E. C., Middlebrook, A. M., Kolb, C. E., Baltensperger, U., and Worsnop, D. R.: Evolution of organic aerosols in the atmosphere, Science, 326, 1525–1529, 2009.
Kidd, C., Perraud, V., Wingen, L. M., and Finlayson-Pitts, B. J.: Integrating phase and composition of secondary organic aerosol from the ozonolysis of alpha-pinene, P. Natl. Acad. Sci. USA, 111, 7552–7557, 2014.
Kiontke, A., Oliveira-Birkmeier, A., Opitz, A., and Birkemeyer, C.: Electrospray ionization efficiency is dependent on different molecular descriptors with respect to solvent ph and instrumental configuration, PLoS One, 11, e0167502/0167501–e0167502/0167516, 2016.
Knopf, D. A., Alpert, P. A., and Wang, B.: The Role of Organic Aerosol in Atmospheric Ice Nucleation: A Review, ACS Earth and Space Chemistry, https://doi.org/10.1021/acsearthspacechem.7b00120, 2018.
Koop, T., Bookhold, J., Shiraiwa, M., and Pöschl, U.: Glass transition and phase state of organic compounds: dependency on molecular properties and implications for secondary organic aerosols in the atmosphere, Phys. Chem. Chem. Phys., 13, 19238–19255, 2011.
Kuwata, M. and Martin, S. T.: Phase of atmospheric secondary organic material affects its reactivity, P. Natl. Acad. Sci. USA, 109, 17354–17359, 2012.
Kuwata, M., Zorn, S. R., and Martin, S. T.: Using elemental ratios to predict the density of organic material composed of carbon, hydrogen, and oxygen, Environ. Sci. Technol., 46, 787–794, 2012.
Lambe, A. T., Ahern, A. T., Williams, L. R., Slowik, J. G., Wong, J. P. S., Abbatt, J. P. D., Brune, W. H., Ng, N. L., Wright, J. P., Croasdale, D. R., Worsnop, D. R., Davidovits, P., and Onasch, T. B.: Characterization of aerosol photooxidation flow reactors: heterogeneous oxidation, secondary organic aerosol formation and cloud condensation nuclei activity measurements, Atmos. Meas. Tech., 4, 445–461, https://doi.org/10.5194/amt-4-445-2011, 2011a.
Lambe, A. T., Onasch, T. B., Massoli, P., Croasdale, D. R., Wright, J. P., Ahern, A. T., Williams, L. R., Worsnop, D. R., Brune, W. H., and Davidovits, P.: Laboratory studies of the chemical composition and cloud condensation nuclei (CCN) activity of secondary organic aerosol (SOA) and oxidized primary organic aerosol (OPOA), Atmos. Chem. Phys., 11, 8913–8928, https://doi.org/10.5194/acp-11-8913-2011, 2011b.
Li, Y., Pöschl, U., and Shiraiwa, M.: Molecular corridors and parameterizations of volatility in the chemical evolution of organic aerosols, Atmos. Chem. Phys., 16, 3327–3344, https://doi.org/10.5194/acp-16-3327-2016, 2016.
Li, Y. J., Liu, P., Gong, Z., Wang, Y., Bateman, A. P., Bergoend, C., Bertram, A. K., and Martin, S. T.: Chemical Reactivity and Liquid/Nonliquid States of Secondary Organic Material, Environ. Sci. Technol., 49, 13264–13274, 2015.
Lienhard, D. M., Huisman, A. J., Krieger, U. K., Rudich, Y., Marcolli, C., Luo, B. P., Bones, D. L., Reid, J. P., Lambe, A. T., Canagaratna, M. R., Davidovits, P., Onasch, T. B., Worsnop, D. R., Steimer, S. S., Koop, T., and Peter, T.: Viscous organic aerosol particles in the upper troposphere: diffusivity-controlled water uptake and ice nucleation?, Atmos. Chem. Phys., 15, 13599–13613, https://doi.org/10.5194/acp-15-13599-2015, 2015.
Lignell, H., Hinks, M. L., and Nizkorodov, S. A.: Exploring matrix effects on photochemistry of organic aerosols, P. Natl. Acad. Sci. USA, 111, 13780–13785, 2014.
Lin, Y.-H., Zhang, H., Pye, H. O. T., Zhang, Z., Marth, W. J., Park, S., Arashiro, M., Cui, T., Budisulistiorini, S. H., Sexton, K. G., Vizuete, W., Xie, Y., Luecken, D. J., Piletic, I. R., Edney, E. O., Bartolotti, L. J., Gold, A., and Surratt, J. D.: Epoxide as a precursor to secondary organic aerosol formation from isoprene photooxidation in the presence of nitrogen oxides, P. Natl. Acad. Sci. USA, 110, 6718–6723, 2013.
Liu, P., Li, Y. J., Wang, Y., Gilles, M. K., Zaveri, R. A., Bertram, A. K., and Martin, S. T.: Lability of secondary organic particulate matter, P. Natl. Acad. Sci. USA, 113, 12643–12648, 2016.
Liu, P., Li, Y. J., Wang, Y., Bateman, A. P., Zhang, Y., Gong, Z., Bertram, A. K., and Martin, S. T.: Highly Viscous States Affect the Browning of Atmospheric Organic Particulate Matter, ACS Central Science, 4, 207–215, 2018.
Loza, C. L., Coggon, M. M., Nguyen, T. B., Zuend, A., Flagan, R. C., and Seinfeld, J. H.: On the mixing and evaporation of secondary organic aerosol components, Environ. Sci. Technol., 47, 6173–6180, 2013.
Maclean, A. M., Butenhoff, C. L., Grayson, J. W., Barsanti, K., Jimenez, J. L., and Bertram, A. K.: Mixing times of organic molecules within secondary organic aerosol particles: a global planetary boundary layer perspective, Atmos. Chem. Phys., 17, 13037–13048, https://doi.org/10.5194/acp-17-13037-2017, 2017.
Mai, H., Shiraiwa, M., Flagan, R. C., and Seinfeld, J. H.: Under What Conditions Can Equilibrium Gas–Particle Partitioning Be Expected to Hold in the Atmosphere?, Environ. Sci. Technol., 49, 11485–11491, 2015.
Marshall, F. H., Miles, R. E. H., Song, Y.-C., Ohm, P. B., Power, R. M., Reid, J. P., and Dutcher, C. S.: Diffusion and reactivity in ultraviscous aerosol and the correlation with particle viscosity, Chem. Sci., 7, 1298–1308, 2016.
Matsushima, S., Takano, A., Takahashi, Y., and Matsushita, Y.: Precise synthesis of a series of poly(4-n-alkylstyrene)s and their glass transition temperatures, J. Polym. Sci. Pol. Phys., 55, 757–763, 2017.
Metatla, N. and Soldera, A.: The Vogel- Fulcher- Tamman Equation Investigated by Atomistic Simulation with Regard to the Adam- Gibbs Model, Macromolecules, 40, 9680–9685, 2007.
Mikhailov, E., Vlasenko, S., Martin, S. T., Koop, T., and Pöschl, U.: Amorphous and crystalline aerosol particles interacting with water vapor: conceptual framework and experimental evidence for restructuring, phase transitions and kinetic limitations, Atmos. Chem. Phys., 9, 9491–9522, https://doi.org/10.5194/acp-9-9491-2009, 2009.
Montserrat, S. and Colomer, P.: The effect of the molecular weight on the glass transition temperature in amorphous poly(ethylene terephthalate), Polym. Bull., 12, 173–180, 1984.
Mu, Q., Shiraiwa, M., Octaviani, M., Ma, N., Ding, A., Su, H., Lammel, G., Pöschl, U., and Cheng, Y.: Temperature effect on phase state and reactivity controls atmospheric multiphase chemistry and transport of PAHs, Science Advances, 4, eaap7314, https://doi.org/10.1126/sciadv.aap7314, 2018.
Murray, B. J., Wilson, T. W., Dobbie, S., Cui, Z. Q., Al-Jumur, S., Mohler, O., Schnaiter, M., Wagner, R., Benz, S., Niemand, M., Saathoff, H., Ebert, V., Wagner, S., and Karcher, B.: Heterogeneous nucleation of ice particles on glassy aerosols under cirrus conditions, Nat. Geosci., 3, 233–237, 2010.
Nakanishi, M. and Nozaki, R.: Systematic study of the glass transition in polyhydric alcohols, Phys. Rev. E, 83, 051503, https://doi.org/10.1103/PhysRevE.83.051503, 2011.
Nguyen, T. B., Nizkorodov, S. A., Laskin, A., and Laskin, J.: An approach toward quantification of organic compounds in complex environmental samples using high-resolution electrospray ionization mass spectrometry, Anal. Methods, 5, 72–80, 2013.
Nizkorodov, S. A., Laskin, J., and Laskin, A.: Molecular chemistry of organic aerosols through the application of high resolution mass spectrometry, Phys. Chem. Chem. Phys., 13, 3612–3629, 2011.
Nozière, B., Kalberer, M., Claeys, M., Allan, J., D'Anna, B., Decesari, S., Finessi, E., Glasius, M., Grgić, I., Hamilton, J. F., Hoffmann, T., Iinuma, Y., Jaoui, M., Kahnt, A., Kampf, C. J., Kourtchev, I., Maenhaut, W., Marsden, N., Saarikoski, S., Schnelle-Kreis, J., Surratt, J. D., Szidat, S., Szmigielski, R., and Wisthaler, A.: The Molecular Identification of Organic Compounds in the Atmosphere: State of the Art and Challenges, Chem. Rev., 115, 3919–3983, 2015.
O'Connell, P. A. and McKenna, G. B.: Arrhenius-type temperature dependence of the segmental relaxation below T g, J. Chem. Phys., 110, 11054–11060, 1999.
Onder, K., Peters, R. H., and Spark, L. C.: Melting and transition phenomena in some polyester-urethanes, Polymer, 13, 133–139, 1972.
Pajunoja, A., Malila, J., Hao, L., Joutsensaari, J., Lehtinen, K. E. J., and Virtanen, A.: Estimating the viscosity range of SOA particles based on their coalescence time, Aerosol Sci. Tech., 48, https://doi.org/10.1080/02786826.2013.870325, 2014.
Pajunoja, A., Lambe, A. T., Hakala, J., Rastak, N., Cummings, M. J., Brogan, J. F., Hao, L., Paramonov, M., Hong, J., and Prisle, N. L.: Adsorptive uptake of water by semisolid secondary organic aerosols, Geophys. Res. Lett., 42, 3063–3068, 2015.
Pankow, J. F.: An absorption model of gas-particle partitioning of organic-compounds in the atmosphere, Atmos. Environ., 28, 185–188, 1994.
Papadopoulos, P., Floudas, G., Chi, C., and Wegner, G.: Molecular dynamics of oligofluorenes: A dielectric spectroscopy investigation, J. Chem. Phys., 120, 2368–2374, 2004.
Perraud, V., Bruns, E. A., Ezell, M. J., Johnson, S. N., Yu, Y., Alexander, M. L., Zelenyuk, A., Imre, D., Chang, W. L., Dabdub, D., Pankow, J. F., and Finlayson-Pitts, B. J.: Nonequilibrium atmospheric secondary organic aerosol formation and growth, P. Natl. Acad. Sci. USA, 109, 2836–2841, 2012.
Petters, M. D. and Kreidenweis, S. M.: A single parameter representation of hygroscopic growth and cloud condensation nucleus activity, Atmos. Chem. Phys., 7, 1961–1971, https://doi.org/10.5194/acp-7-1961-2007, 2007.
Petters, S. S., Pagonis, D., Claflin, M. S., Levin, E. J. T., Petters, M. D., Ziemann, P. J., and Kreidenweis, S. M.: Hygroscopicity of Organic Compounds as a Function of Carbon Chain Length and Carboxyl, Hydroperoxy, and Carbonyl Functional Groups, J. Phys. Chem. A, 121, 5164–5174, 2017.
Power, R. M., Simpson, S. H., Reid, J. P., and Hudson, A. J.: The transition from liquid to solid-like behaviour in ultrahigh viscosity aerosol particles, Chem. Sci., 4, 2597–2604, 2013.
Pratap, V., Chen, Y., Yao, G., and Nakao, S.: Temperature effects on multiphase reactions of organic molecular markers: A modeling study, Atmos. Environ., 179, 40–48, 2018.
Price, H. C., Murray, B. J., Mattsson, J., O'Sullivan, D., Wilson, T. W., Baustian, K. J., and Benning, L. G.: Quantifying water diffusion in high-viscosity and glassy aqueous solutions using a Raman isotope tracer method, Atmos. Chem. Phys., 14, 3817–3830, https://doi.org/10.5194/acp-14-3817-2014, 2014.
Price, H. C., Mattsson, J., and Murray, B. J.: Sucrose diffusion in aqueous solution, Phys. Chem. Chem. Phys., 18, 19207–19216, 2016.
Putman, A. L., Offenberg, J. H., Fisseha, R., Kundu, S., Rahn, T. A., and Mazzoleni, L. R.: Ultrahigh-resolution FT-ICR mass spectrometry characterization of α-pinene ozonolysis SOA, Atmos. Environ., 46, 164–172, 2012.
Raffaelli, A. and Saba, A.: Atmospheric pressure photoionization mass spectrometry, Mass Spectrom. Rev., 22, 318–331, 2003.
Reid, J. P., Bertram, A. K., Topping, D. O., Laskin, A., Martin, S. T., Petters, M. D., Pope, F. D., and Rovelli, G.: The viscosity of atmospherically relevant organic particles, Nat. Commun., 9, 956, https://doi.org/10.1038/s41467-018-03027-z, 2018.
Renbaum-Wolff, L., Grayson, J. W., Bateman, A. P., Kuwata, K., Sellier, M., Murray, B. J., Schilling, J. E., Martin, S. T., and Bertram, A. K.: Viscosity of α-pinene secondary organic material and implications for particle growth and reactivity, P. Natl. Acad. Sci. USA, 110, 8014–8019, 2013.
Roach, P. J., Laskin, J., and Laskin, A.: Molecular Characterization of Organic Aerosols Using Nanospray-Desorption/Electrospray Ionization-Mass Spectrometry, Anal. Chem., 82, 7979–7986, 2010a.
Roach, P. J., Laskin, J., and Laskin, A.: Nanospray desorption electrospray ionization: an ambient method for liquid-extraction surface sampling in mass spectrometry, Analyst, 135, 2233–2236, 2010b.
Roldin, P., Eriksson, A. C., Nordin, E. Z., Hermansson, E., Mogensen, D., Rusanen, A., Boy, M., Swietlicki, E., Svenningsson, B., Zelenyuk, A., and Pagels, J.: Modelling non-equilibrium secondary organic aerosol formation and evaporation with the aerosol dynamics, gas- and particle-phase chemistry kinetic multilayer model ADCHAM, Atmos. Chem. Phys., 14, 7953–7993, https://doi.org/10.5194/acp-14-7953-2014, 2014.
Roos, Y.: Melting and glass transitions of low molecular weight carbohydrates, Carbohyd. Res., 238, 39–48, 1993.
Rothfuss, N. E. and Petters, M. D.: Influence of Functional Groups on the Viscosity of Organic Aerosol, Environ. Sci. Technol., 51, 271–279, 2017a.
Rothfuss, N. E. and Petters, M. D.: Characterization of the temperature and humidity-dependent phase diagram of amorphous nanoscale organic aerosols, Phys. Chem. Chem. Phys., 19, 6532–6545, 2017b.
Sastri, S. R. S. and Rao, K. K.: A new group contribution method for predicting viscosity of organic liquids, Chem. Eng. J., 50, 9–25, 1992.
Saukko, E., Lambe, A. T., Massoli, P., Koop, T., Wright, J. P., Croasdale, D. R., Pedernera, D. A., Onasch, T. B., Laaksonen, A., Davidovits, P., Worsnop, D. R., and Virtanen, A.: Humidity-dependent phase state of SOA particles from biogenic and anthropogenic precursors, Atmos. Chem. Phys., 12, 7517–7529, https://doi.org/10.5194/acp-12-7517-2012, 2012.
Schill, G. P. and Tolbert, M. A.: Heterogeneous ice nucleation on phase-separated organic-sulfate particles: effect of liquid vs. glassy coatings, Atmos. Chem. Phys., 13, 4681–4695, https://doi.org/10.5194/acp-13-4681-2013, 2013.
Schill, G. P., De Haan, D. O., and Tolbert, M. A.: Heterogeneous Ice Nucleation on Simulated Secondary Organic Aerosol, Environ. Sci. Technol., 48, 1675–1682, 2014.
Schmelzer, J. W. P. and Gutzow, I. S.: Glasses and the Glass Transition, Wiley-VCH, Weinheim, Germany, 2011.
Seinfeld, J. H. and Pandis, S. N.: Atmospheric chemistry and physics – From air pollution to climate change, John Wiley & Sons, Inc., New York, 2006.
Selimovic, V., Yokelson, R. J., Warneke, C., Roberts, J. M., de Gouw, J., Reardon, J., and Griffith, D. W. T.: Aerosol optical properties and trace gas emissions by PAX and OP-FTIR for laboratory-simulated western US wildfires during FIREX, Atmos. Chem. Phys., 18, 2929–2948, https://doi.org/10.5194/acp-18-2929-2018, 2018.
Shiraiwa, M. and Seinfeld, J. H.: Equilibration timescale of atmospheric secondary organic aerosol partitioning, Geophys. Res. Lett., 39, L24801, https://doi.org/10.1029/2012GL054008, 2012.
Shiraiwa, M., Ammann, M., Koop, T., and Pöschl, U.: Gas uptake and chemical aging of semisolid organic aerosol particles, P. Natl. Acad. Sci. USA, 108, 11003–11008, 2011.
Shiraiwa, M., Yee, L. D., Schilling, K. A., Loza, C. L., Craven, J. S., Zuend, A., Ziemann, P. J., and Seinfeld, J. H.: Size distribution dynamics reveal particle-phase chemistry in organic aerosol formation, P. Natl. Acad. Sci. USA, 110, 11746–11750, 2013.
Shiraiwa, M., Berkemeier, T., Schilling-Fahnestock, K. A., Seinfeld, J. H., and Pöschl, U.: Molecular corridors and kinetic regimes in the multiphase chemical evolution of secondary organic aerosol, Atmos. Chem. Phys., 14, 8323–8341, https://doi.org/10.5194/acp-14-8323-2014, 2014.
Shiraiwa, M., Li, Y., Tsimpidi, A. P., Karydis, V. A., Berkemeier, T., Pandis, S. N., Lelieveld, J., Koop, T., and Pöschl, U.: Global distribution of particle phase state in atmospheric secondary organic aerosols, Nat. Commun., 8, 15002, https://doi.org/10.1038/ncomms15002, 2017.
Shrivastava, M., Cappa, C. D., Fan, J., Goldstein, A. H., Guenther, A. B., Jimenez, J. L., Kuang, C., Laskin, A., Martin, S. T., Ng, N. L., Petaja, T., Pierce, J. R., Rasch, P. J., Roldin, P., Seinfeld, J. H., Shilling, J., Smith, J. N., Thornton, J. A., Volkamer, R., Wang, J., Worsnop, D. R., Zaveri, R. A., Zelenyuk, A., and Zhang, Q.: Recent advances in understanding secondary organic aerosol: Implications for global climate forcing, Rev. Geophys., 55, 509–559, https://doi.org/10.1002/2016RG000540, 2017a.
Shrivastava, M., Lou, S., Zelenyuk, A., Easter, R. C., Corley, R. A., Thrall, B. D., Rasch, P. J., Fast, J. D., Massey Simonich, S. L., Shen, H., and Tao, S.: Global long-range transport and lung cancer risk from polycyclic aromatic hydrocarbons shielded by coatings of organic aerosol, P. Natl. Acad. Sci. USA, 114, 1246–1251, 2017b.
Slade, J. H. and Knopf, D. A.: Multiphase OH Oxidation Kinetics of Organic Aerosol: The Role of Particle Phase State and Relative Humidity, Geophys. Res. Lett., 41, 2014GL060582, https://doi.org/10.1002/2014GL060582, 2014.
Song, M., Liu, P. F., Hanna, S. J., Li, Y. J., Martin, S. T., and Bertram, A. K.: Relative humidity-dependent viscosities of isoprene-derived secondary organic material and atmospheric implications for isoprene-dominant forests, Atmos. Chem. Phys., 15, 5145–5159, https://doi.org/10.5194/acp-15-5145-2015, 2015.
Song, M., Liu, P. F., Hanna, S. J., Zaveri, R. A., Potter, K., You, Y., Martin, S. T., and Bertram, A. K.: Relative humidity-dependent viscosity of secondary organic material from toluene photo-oxidation and possible implications for organic particulate matter over megacities, Atmos. Chem. Phys., 16, 8817–8830, https://doi.org/10.5194/acp-16-8817-2016, 2016a.
Song, Y. C., Haddrell, A. E., Bzdek, B. R., Reid, J. P., Bannan, T., Topping, D. O., Percival, C., and Cai, C.: Measurements and Predictions of Binary Component Aerosol Particle Viscosity, J. Phys. Chem. A, 120, 8123–8137, 2016b.
Surratt, J. D., Chan, A. W. H., Eddingsaas, N. C., Chan, M. N., Loza, C. L., Kwan, A. J., Hersey, S. P., Flagan, R. C., Wennberg, P. O., and Seinfeld, J. H.: Reactive intermediates revealed in secondary organic aerosol formation from isoprene, P. Natl. Acad. Sci. USA, 107, 6640–6645, 2010.
Tolocka, M. P., Jang, M., Ginter, J. M., Cox, F. J., Kamens, R. M., and Johnston, M. V.: Formation of oligomers in secondary organic aerosol, Environ. Sci. Technol., 38, 1428–1434, 2004.
US-EPA: Estimation programs interface suite for microsoft windows, 2012.
Vaden, T. D., Imre, D., Beranek, J., Shrivastava, M., and Zelenyuk, A.: Evaporation kinetics and phase of laboratory and ambient secondary organic aerosol, P. Natl. Acad. Sci. USA, 108, 2190–2195, 2011.
van der Sman, R. G. M.: Predictions of Glass Transition Temperature for Hydrogen Bonding Biomaterials, J. Phys. Chem. B, 117, 16303–16313, 2013.
Virtanen, A., Joutsensaari, J., Koop, T., Kannosto, J., Yli-Pirilä, P., Leskinen, J., Mäkelä, J. M., Holopainen, J. K., Pöschl, U. and Kulmala, M.: An amorphous solid state of biogenic secondary organic aerosol particles, Nature, 467, 824–827, 2010.
Wagner, R., Möhler, O., Saathoff, H., Schnaiter, M., Skrotzki, J., Leisner, T., Wilson, T. W., Malkin, T. L., and Murray, B. J.: Ice cloud processing of ultra-viscous/glassy aerosol particles leads to enhanced ice nucleation ability, Atmos. Chem. Phys., 12, 8589–8610, https://doi.org/10.5194/acp-12-8589-2012, 2012.
Wang, B., O'Brien, R. E., Kelly, S. T., Shilling, J. E., Moffet, R. C., Gilles, M. K., and Laskin, A.: Reactivity of Liquid and Semisolid Secondary Organic Carbon with Chloride and Nitrate in Atmospheric Aerosols, J. Phys. Chem. A, 119, 4498–4508, 2015.
Wang, B. B., Lambe, A. T., Massoli, P., Onasch, T. B., Davidovits, P., Worsnop, D. R., and Knopf, D. A.: The deposition ice nucleation and immersion freezing potential of amorphous secondary organic aerosol: Pathways for ice and mixed-phase cloud formation, J. Geophys. Res.-Atmos., 117, D16209, https://doi.org/10.1029/2012jd018063, 2012a.
Wang, B. B., Laskin, A., Roedel, T., Gilles, M. K., Moffet, R. C., Tivanski, A. V., and Knopf, D. A.: Heterogeneous ice nucleation and water uptake by field-collected atmospheric particles below 273 K, J. Geophys. Res.-Atmos., 117, D00v19, https://doi.org/10.1029/2012jd017446, 2012b.
White, R. P. and Lipson, J. E. G.: Polymer free volume and its connection to the glass transition, Macromolecules, 49, 3987–4007, 2016.
Williams, M. L., Landel, R. F., and Ferry, J. D.: The temperature dependence of relaxation mechanisms in amorphous polymers and other glass-forming liquids, J. Am. Chem. Soc., 77, 3701–3707, 1955.
Wilson, T. W., Murray, B. J., Wagner, R., Möhler, O., Saathoff, H., Schnaiter, M., Skrotzki, J., Price, H. C., Malkin, T. L., Dobbie, S., and Al-Jumur, S. M. R. K.: Glassy aerosols with a range of compositions nucleate ice heterogeneously at cirrus temperatures, Atmos. Chem. Phys., 12, 8611–8632, https://doi.org/10.5194/acp-12-8611-2012, 2012.
Ye, Q., Robinson, E. S., Ding, X., Ye, P., Sullivan, R. C., and Donahue, N. M.: Mixing of secondary organic aerosols versus relative humidity, P. Natl. Acad. Sci. USA, 113, 12649–12654, 2016.
Ye, Q., Upshur, M. A., Robinson, E. S., Geiger, F. M., Sullivan, R. C., Thomson, R. J., and Donahue, N. M.: Following Particle-Particle Mixing in Atmospheric Secondary Organic Aerosols by Using Isotopically Labeled Terpenes, Chem, 4, 318–333, 2018.
Yli-Juuti, T., Pajunoja, A., Tikkanen, O.-P., Buchholz, A., Faiola, C., Väisänen, O., Hao, L., Kari, E., Peräkylä, O., Garmash, O., Shiraiwa, M., Ehn, M., Lehtinen, K., and Virtanen, A.: Factors controlling the evaporation of secondary organic aerosol from α-pinene ozonolysis, Geophys. Res. Lett., 44, 2562–2570, 2017.
Zaveri, R. A., Easter, R. C., Shilling, J. E., and Seinfeld, J. H.: Modeling kinetic partitioning of secondary organic aerosol and size distribution dynamics: representing effects of volatility, phase state, and particle-phase reaction, Atmos. Chem. Phys., 14, 5153–5181, https://doi.org/10.5194/acp-14-5153-2014, 2014.
Zaveri, R. A., Shilling, J. E., Zelenyuk, A., Liu, J., Bell, D. M., D'Ambro, E. L., Gaston, C. J., Thornton, J. A., Laskin, A., Lin, P., Wilson, J., Easter, R. C., Wang, J., Bertram, A. K., Martin, S. T., Seinfeld, J. H., and Worsnop, D. R.: Growth Kinetics and Size Distribution Dynamics of Viscous Secondary Organic Aerosol, Environ. Sci. Technol., 52, 1191–1199, 2018.
Zhang, Y., Sanchez, M. S., Douet, C., Wang, Y., Bateman, A. P., Gong, Z., Kuwata, M., Renbaum-Wolff, L., Sato, B. B., Liu, P. F., Bertram, A. K., Geiger, F. M., and Martin, S. T.: Changing shapes and implied viscosities of suspended submicron particles, Atmos. Chem. Phys., 15, 7819–7829, https://doi.org/10.5194/acp-15-7819-2015, 2015.
Zhang, Y., Chen, Y., Lambe, A. T., Olson, N. E., Lei, Z., Craig, R. L., Zhang, Z., Gold, A., Onasch, T. B., Jayne, J. T., Worsnop, D. R., Gaston, C. J., Thornton, J. A., Vizuete, W., Ault, A. P., and Surratt, J. D.: Effect of the Aerosol-Phase State on Secondary Organic Aerosol Formation from the Reactive Uptake of Isoprene-Derived Epoxydiols (IEPOX), Environ. Sci. Tech. Let., https://doi.org/10.1021/acs.estlett.8b00044, 2018.
Zhou, S., Shiraiwa, M., McWhinney, R., Pöschl, U., and Abbatt, J. P. D.: Kinetic limitations in gas-particle reactions arising from slow diffusion in secondary organic aerosol, Faraday Discuss., 165, 391–406, 2013.
Zobrist, B., Marcolli, C., Pedernera, D. A., and Koop, T.: Do atmospheric aerosols form glasses?, Atmos. Chem. Phys., 8, 5221–5244, https://doi.org/10.5194/acp-8-5221-2008, 2008.
Zobrist, B., Soonsin, V., Luo, B. P., Krieger, U. K., Marcolli, C., Peter, T., and Koop, T.: Ultra-slow water diffusion in aqueous sucrose glasses, Phys. Chem. Chem. Phys., 13, 3514–3526, 2011.