the Creative Commons Attribution 4.0 License.
the Creative Commons Attribution 4.0 License.
 | 03 May 2018
Sources of reactive nitrogen in marine aerosol over the Northwest Pacific Ocean in spring
Li Luo
Shuh-Ji Kao
Hongyan Bao
Huayun Xiao
Hongwei Xiao
Xiaohong Yao
Huiwang Gao
Jiawei Li
Yangyang Lu
Atmospheric deposition of long-range transport of anthropogenic reactive nitrogen (Nr, mainly comprised of NHx, NOy and water-soluble organic nitrogen, WSON) from continents may have profound impact on marine biogeochemistry. In addition, surface ocean dissolved organic nitrogen (DON) may also contribute to aerosol WSON in the overlying atmosphere. Despite the importance of off-continent dispersion and Nr interactions at the atmosphere–ocean boundary, our knowledge of the sources of various nitrogen species in the atmosphere over the open ocean remains limited due to insufficient observations. We conducted two cruises in the spring of 2014 and 2015 from the coast of China through the East China seas (ECSs, i.e. the Yellow Sea and East China Sea) to the open ocean (i.e. the Northwest Pacific Ocean, NWPO). Concentrations of water-soluble total nitrogen (WSTN), NO and NH, as well as the δ15N of WSTN and NO in marine aerosol, were measured during both cruises. In the spring of 2015, we also analysed the concentrations and δ15N of NO and the DON of surface seawater (SSW; at a depth of 5 m) along the cruise track. Aerosol NO, NH and WSON decreased logarithmically (1–2 orders of magnitude) with distance from the shore, reflecting strong anthropogenic emission sources of NO, NH and WSON in China. Average aerosol NO and NH concentrations were significantly higher in 2014 (even in the remote NWOP) than in 2015 due to the stronger wind field in 2014, underscoring the role of the Asian winter monsoon in the seaward transport of anthropogenic NO and NH. However, the background aerosol WSON over the NWPO in 2015 (13.3 ± 8.5 nmol m−3) was similar to that in 2014 (12.2 ± 6.3 nmol m−3), suggesting an additional non-anthropogenic WSON source in the open ocean. Obviously, marine DON emissions should be considered in model and field assessments of net atmospheric WSON deposition in the open ocean. This study contributes information on parallel isotopic marine DON composition and aerosol Nr datasets, but more research is required to explore complex Nr sources and deposition processes in order to advance our understanding of anthropogenic influences on the marine nitrogen cycle and nitrogen exchange at land–ocean and atmosphere–ocean interfaces.
- Article
(4675 KB) -
Supplement
(1780 KB) - BibTeX
- EndNote


Atmospheric transport and deposition of anthropogenic reactive nitrogen (Nr) to global oceans have increased considerably since the industrial revolution (Duce et al., 2008). Due to accumulated atmospheric Nr deposition, the stoichiometric relationship between nitrogen and phosphorus in the upper North Pacific Ocean (where nitrogen is the limiting nutrient in surface ocean) has been significantly altered (Kim et al., 2011). Such alterations may in turn impact pristine oceanic ecosystems and biogeochemical cycles. The Nr species deposited in the ocean include inorganic reduced nitrogen species (NH3 and NH), oxidized nitrogen species (HNO3 and NO and organic nitrogen compounds (Erisman et al., 2002). The depositional fluxes (both dry and wet) of atmospheric Nr to global oceans have been studied previously through models (Duce et al., 2008; Doney, 2010). Recent model (Kanakidou et al., 2012) and observational (Altieri et al., 2014, 2016) studies have also reported that the ocean may be a source of atmospheric water-soluble organic nitrogen (WSON) and NH3. Nevertheless, field observations in the open ocean remain scarce; thus, more observations and new approaches, such as stable nitrogen isotopic composition studies, are urgently needed to trace the sources of Nr and investigate Nr exchange at the atmosphere–ocean interface.
Using organic nitrogen compounds, Cape et al. (2011) revealed several possible sources of WSON in the atmosphere, including livestock and animal husbandry, fertilizers, vehicle exhausts, biomass burning, secondary pollutants, and marine biological sources. Cape et al. (2011) also explicitly noted that complex atmospheric chemical processes may obscure source identification for individual organic nitrogen compounds in atmospheric WSON. Stochastic analysis coupled with molecular characterization using Fourier-transform ion cyclotron resonance mass spectrometry revealed that biological organic nitrogen in surface seawater can be a source of atmospheric WSON over the open ocean (Wozniak et al., 2014; Altieri et al., 2016). Similar conclusions have been drawn from the positive correlation between marine aerosol WSON concentration and wind speed during a cruise in the Northwest Pacific Ocean (Luo et al., 2016).
The stable nitrogen isotopic composition (δ15N, δ15N(‰)sample= ((15N ∕ 14N)sample ∕ (15N ∕ 14N) 1000) may be used to discriminate the sources of atmospheric NOx and NHx. This approach (i.e. the use of δ15N-NOx) has successfully distinguished fossil-fuel-burning NOx from soil biogenic-activity NOx (Felix and Elliott, 2014), as well as coal combustion emissions (Felix et al., 2012) from vehicle exhausts (Walters et al., 2015). Similarly, atmospheric NHx can be measured and traced using δ15N-NHx (Freyer, 1978; Heaton, 1987; Jickells, 2003; Altieri et al., 2014). However, direct measurements of atmospheric δ15N-WSON are currently highly impractical due to difficulties in completely separating organic and inorganic nitrogen. Via isotope mass conservation, a few previous studies have reported δ15N-WSON values in precipitation collected from urban, rural and remote regions ranging from −7.3 to +7.3 ‰ (Cornell et al., 1995), which is consistent with values from precipitation sampled in a metropolis surrounded by agricultural areas in southern South Korea(−7.9 to +3.8 ‰ , with annual means of +0.3 ‰ and +0.2 ‰ in 2007 and 2008, respectively; Lee et al., 2012), but lower than the δ15N-WSON values (−0.5 to +14.7 ‰, with a median of +5 ‰ and non-significant seasonal variation) reported in precipitation over the United states East Coast area (Russell et al., 1998). Compared with those for precipitation, aerosol δ15N-WSON values reported in various rural regions in the United Kingdom cover a wider range (mainly caused by low values; the range covers −14.6 to +12.5 ‰, with medians of −2 and −5 ‰ for the fine and coarse mode, respectively; Kelly et al., 2005) (Fig. S1 in the Supplement). Using δ15N, it is more difficult to identify the sources of atmospheric WSON than it is to identify NOx and NHx sources. However, the relatively uniform δ15N values (+2.2 to +5.4 ‰) of dissolved organic nitrogen (DON) in surface seawater worldwide (Knapp et al., 2005, 2011) enable the use of the isotope endmember mixing approach for primary WSON aerosol; unfortunately, no cruises to date have undertaken parallel marine aerosol sampling and SSW δ15N identification.
In terms of the hemispheric wind field, the East Asian monsoon transition from winter (October to April) to summer (May to September) influences the entire East Asian region. During the East Asian winter monsoon period, strong cold air masses mobilize rapidly through north-eastern China to the NWPO; in contrast, summer monsoon air masses arise primarily from the tropical Pacific Ocean (Wang et al., 2003). Air masses originating from China in winter have been reported to contain higher concentrations of NO and NH than air masses arising from remote Pacific Ocean regions in summer (Kunwar and Kawamura, 2014). Monitoring over the NWPO at Hedo Island and Ogasawara-shotō island also shows that the dry deposition of aerosol NO and NH varies inter-annually by a factor of 2–5 due to variable monsoon intensity (http://www.eanet.asia/, last access: 13 April 2018). Moreover, dust storms occur frequently during monsoonal transition periods, and during long-range transport in the upper and mid-troposphere through northern China to the remote Pacific Ocean (Yang et al., 2013); these dust plumes contain abundant crustal elements in addition to NOx and NHx (Duce et al., 1980; Kang et al., 2009). In order to evaluate the seaward gradient of atmospheric Nr concentrations and explore the sources and fates of atmospheric NO, NH and WSON from China (which features the largest emissions of such species worldwide), we conducted cruises from China to the NWPO during spring, when the East Asian monsoon transition period occurs; cruises were complete during two different years to allow comparison.
In this study, we measured water-soluble total nitrogen (WSTN), NO and NH concentrations, as well as δ15N-WSTN and δ15N-NO in marine aerosols collected over the ECSs and the NWPO during the spring of 2014 and 2015. The concentrations and δ15N of DON and NO in SSW (surface seawater, collected at a depth of 5 m) were analysed in parallel along the cruise track in 2015. The purposes of this study were (1) to investigate the spatial distributions of concentrations of various Nr species in marine aerosol from the ECSs to the NWPO, (2) to explore possible sources of atmospheric WSON in marine environments and (3) to advance our understanding of atmospheric Nr transport at the land–ocean boundary and potential Nr exchanges between the atmosphere and the ocean.
2.1 Sampling and background weather during cruises
Total suspended particulate (TSP) samples were collected using a high-volume sampler (TE-5170D; Tisch Environmental, Inc.) with Whatman®41 cellulose filters during two research cruises (Fig. 1) aboard the R/V Dongfanghong II. The first cruise (Fig. 1a) spanned from 17 March to 22 April 2014 (44 samples were collected in total; detailed sampling information can be found in Luo et al., 2016), and the second cruise (Fig. 1b) lasted from 30 March to 3 May 2015 (38 samples were collected in total; detailed sampling information, including the date, time period and location for each sample are listed in Table S1 in the Supplement). To avoid self-contamination from the research vessel, the TSP sampler was installed on the top of the tower at the ship head, and aerosols were sampled only during travel. More information about self-contamination from the ship exhaust can be found in Luo et al. (2016). Both cruises were undertaken during the East Asian monsoon transition period. The 2-month average (March and April) wind streamlines at 1000 hPa over the NWPO show that the wind speed ranged from 2 to 6 m s−1 in 2014 (Fig. 1a) and from 1 to 3 m s−1 in 2015 (Fig. 1b). In general, the wind was stronger in 2014 than in 2015 over the open ocean during the sampling periods.

Figure 1Regional wind streamlines (in m s−1) at 1000 hPa during the Asian winter monsoon period (a, March and April in 2014 and b, March and April in 2015) based on an NCEP dataset. Cruise tracks are also shown (orange, pink and black indicate sea fog, dust and background aerosol, respectively). The aerosol number and collection range are shown in orange, pink and black for sea-fog modified, dust and background aerosol, respectively. The blue open circles in (b) indicate the locations of surface seawater sample (at a depth of 5 m) during the 2015 cruise. Hereafter, the Bgd. is the abbreviation of background aerosol in all the figures and tables.
Meteorological data, including wind speed, direction, relative humidity (RH) and ambient temperature, are shown in Fig. S2 for the 2015 cruise (data for the 2014 cruise are reported in Luo et al., 2016). In the ECSs, both cruises encountered sea fog, which inevitably influenced aerosol sampling and aerosol chemistry. Because of the analogous weather conditions experienced during the two cruises, we used the techniques of Luo et al. (2016) to classify the 2015 marine aerosol samples into three types (namely, sea-fog-modified aerosol (orange triangles) collected in the ECSs, dust aerosol (pink circles) and background aerosol (black squares) sampled in the NWPO; Fig. 1) based on the meteorological conditions (Fig. S2), concentrations of aluminium (data not shown) and the lidar browse images from NASA (Fig. S3). Compared with the ECSs, which were strongly influenced by anthropogenic emissions, the NWPO (open ocean) was relatively clear. Hereafter, we define “background aerosol” as aerosol collected in the NWPO without influence from dust and sea fog during the investigation period.
To examine the relationships between the isotopic compositions of WSON in marine aerosol and DON in SSW, we collected SSW at a depth of 5 m (sampling locations are shown in Fig. 1b as open blue circles) using Niskin bottles during the 2015 cruise. The SSW samples were filtered using a 0.22 µm MILLEX®-GP filter and kept frozen at −20 ∘C in 50 mL 450 ∘C pre-combusted brown glass tubes until analysis.
2.2 Chemical analyses
2.2.1 NO and NH in marine aerosol
The marine aerosol samples were extracted in Milli-Q water (with specific resistivity of 18.2 MΩ cm−1) following Luo et al. (2016). The aerosol extracts were analysed using an ion chromatograph (model ICS-1100 for anions and model ICS-900 for cations) equipped with a conductivity detector (ASRS-ULTRA) and suppressor (ASRS-300 for the ICS-1100 and CSRS-300 for the ICS-900). The precision was better than 5 % for all ionic species. Details of the analytical processes can be found in Hsu et al. (2014). Only five of the aerosol samples contained detectable NO, and these accounted for < 1 % of the WSTN. A total of eight filters of the same type as those used to collect samples were taken as blanks. Before storage, the blank filter was placed on the filter holder, then the filter holder with the blank filter was subsequently installed in the TSP sampler on the top of the ship under the vacuum motor power-off for 5 min, after which the blank filter was retrieved. All blank filters and aerosol samples were stored at −20 ∘C during the sampling periods and underwent the same extraction procedures. The data presented here have been corrected for blanks.
2.2.2 NO in SSW
The SSW NO concentration was measured using a chemiluminescence method (Braman and Hendrix, 1989). Briefly, the solution containing NO was injected into a heated solution of acidic Vanadium (III), in which the NO was reduced to nitric oxide (NO) to be measured by a NOx analyser (MODEL T200U, Teledyne Technologies Incorporated, USA). Working standards were injected after every 10 samples. The relative standard deviation for the standard replicate was < 5 %. The concentration of NO in the SSW was below the 0.1 µmol L−1 detection limit throughout the cruise, as reported previously (Adornato et al., 2005).
2.2.3 WSTN in marine aerosol and total dissolved nitrogen in SSW
Aerosol WSTN and SSW total dissolved nitrogen (TDN, i.e. NO + NH + DON) were measured using the alkaline potassium persulfate oxidation method to convert WSTN and TDN to NO (Luo et al., 2016; Knapp et al., 2005). The NO content of the digested solution was then measured via chemiluminescent detection (Braman and Hendrix, 1989). To verify the WSTN and TDN oxidation efficiency, N-containing organic and inorganic compound standards (specifically, glycine, urea, ethylene diamine tetraacetic acid and ammonium sulfate) were prepared in solution at a concentration of 800 µM of N for oxidation analysis. The recoveries of the N-containing compound standards under oxidation by alkaline potassium persulfate were within 95–105 % (n= 6).
2.2.4 Stable nitrogen isotope
The δ15N-NO was analysed using the denitrifier method described by Sigman et al. (2001) and Casciotti et al. (2002), which has been widely used to analyse the δ15N in NO in aerosol, rainwater and seawater (Buffam and McGlathery, 2003; Hastings et al., 2003; Sigman et al., 2005; Altieri et al., 2013; Gobel et al., 2013), as well as that in NO in solutions digested with alkaline potassium persulfate (Knapp et al., 2005, 2010, 2011, 2012). Detailed stable nitrogen isotope analysis procedures can be found in Archana et al. (2016) and Yang et al. (2014). Briefly, NO was reduced to N2O by the denitrifying bacteria Pseudomonas aureofaciens (ATCC 13985); then, the stable nitrogen isotope of N2O was analysed using a GasBench II connected to a continuous flow isotope ratio mass spectrometer (IRMS, Thermo Delta V Advantage). Two international standards, namely USGS34 and IAEA-N3 (Böhlke et al., 2003), and two NO laboratory working standards were used to verify instrument stability. After the WSTN and TDN were oxidized to NO, the δ15N-WSTN and δ15N-TDN were analysed using the same procedures employed for NO. The pooled standard deviations for replicates were ±0.2, ±0.5 and ±0.5 ‰ for δ15N-NO, δ15N-WSTN and δ15N-TDN, respectively.
2.3 Data analysis
The concentrations of WSON in marine aerosol, which could not be measured directly (as mentioned previously), were calculated using the following equation:
where [WSON], [WSTN], [NO] and [NH] are the molar concentrations (nmol N m−3) of the given water-soluble nitrogen species in marine aerosol. The calculated WSON was subject to relatively large and variable uncertainties by error propagation since [NO] and [NH] were generally much higher than WSON concentrations in most observations. Such error propagation was a common and unavoidable problem (Mace and Duce, 2002; Cornell et al., 2003; Cape et al., 2011; Lesworth et al., 2010; Zamora et al., 2011). In previous studies, data points with high relative uncertainties were excluded (> 100 %, Lesworth et al., 2010; Zamora et al., 2011) and the negative values were taken as zero (Mace and Duce, 2002; Cornell et al., 2003; Violaki et al., 2015). Following previous studies, we excluded both the negative data and those with high relative uncertainties to reduce the uncertainty of mean WSON.
Reduced nitrogen (RN, i.e. NH WSON) and the δ15N-RN in the aerosol were calculated via mass balance:
where [WSTN] and [NO] are the molar concentrations (nmol N m−3) of the given water-soluble nitrogen species in the marine aerosol. The average propagated standard error for RN was 9 % for both 2014 and 2015, and the propagated error for the calculation of δ15N-RN was ±0.6 ‰.
Similar to aerosol WSON, the SSW DON concentration and δ15N-DON were calculated using the following equations:
where [TDN] and [NO] are the molar concentrations (µmol N L−1) of the given species in SSW. The standard error propagated through the DON calculation was 5.3 %. Since the average [NH] in SSW at the selected sites during the 2015 cruise (12 sites and 23 samples) was 0.05 µM, which is much less than DON at µM level, [NH] was neglected in Eqs. (4) and (5). Unfortunately, most of the NO concentrations in the SSW samples were < 0.5 µmol L−1, which is too low for the measurement of δ15N-NO. We attempted to evaluate the interference from nitrate in the δ15N-DON calculations. For all the SSW samples on average, NO comprised 5.7 % of the total NO plus DON; the δ15N-NO in SSW ranged from +8.2 to +16.4 ‰ in our measurements, and the bias of the calculated δ15N-DON varied from +0.5 to +0.9 ‰ .
The dry deposition nitrogen fluxes were calculated as follows:
where Ci is the concentration of a given water-soluble nitrogen species in the aerosol, and Vi is the given dry deposition velocity of the given nitrogen species. In addition to particle size, Vi was controlled by the meteorological conditions (wind speed and relative humidity; Duce et al., 1991; Hoppel et al., 2002) and underlying surface (smooth or rough; Piskunov, 2009). The Vi simulated by the model varied from 0.01 to 10 cm s−1 under wind speeds from 5 to 30 m s−1 and particle size from 0.1 to 100 µm (Hoppel et al., 2002). In our observations, wind speed ranged from 0.1 to 18 m s−1, with relative humidity ranging from 40 to 100 % (for 2014 data, see Luo et al. (2016) and for 2015 data see Fig. S2), which was variable, thus prohibiting an accurate deposition estimate. Moreover, we did not obtain information about the size distribution. Previous studies showed that most of the NO is distributed in supermicron size (ranging from 1 to 10 µm) in marine aerosol, with a small fraction in submicron size (ranging from 0.1 to 1 µm). However, NH is mainly distributed in submicron size and only partly in supermicron size (Nakamura et al., 2005; Baker et al., 2010; Jung et al., 2013), except in coastal areas with mixed pollution and marine aerosols, where NH was present in the coarse mode and NO in the fine mode (Yeatman et al., 2001). In our case, the weather conditions, such as fog and dust, further affected the size distribution of aerosol Nr (Mori et al., 2003; Yao and Zhang, 2012; Hsu et al., 2014). Therefore, in this study, the deposition velocities of water-soluble nitrogen species were set to 2 cm s−1 for NO, 0.1 cm s−1 for NH and 1.0 cm s−1 for WSON, which have also been widely used to estimate the marine aerosol Nr dry deposition (Nakamura et al., 2005; Jung et al., 2013; Luo et al., 2016). However, bearing in mind, that any use of fixed deposition velocities to calculate the depositional flux of aerosol Nr may cause under- or over-estimation.
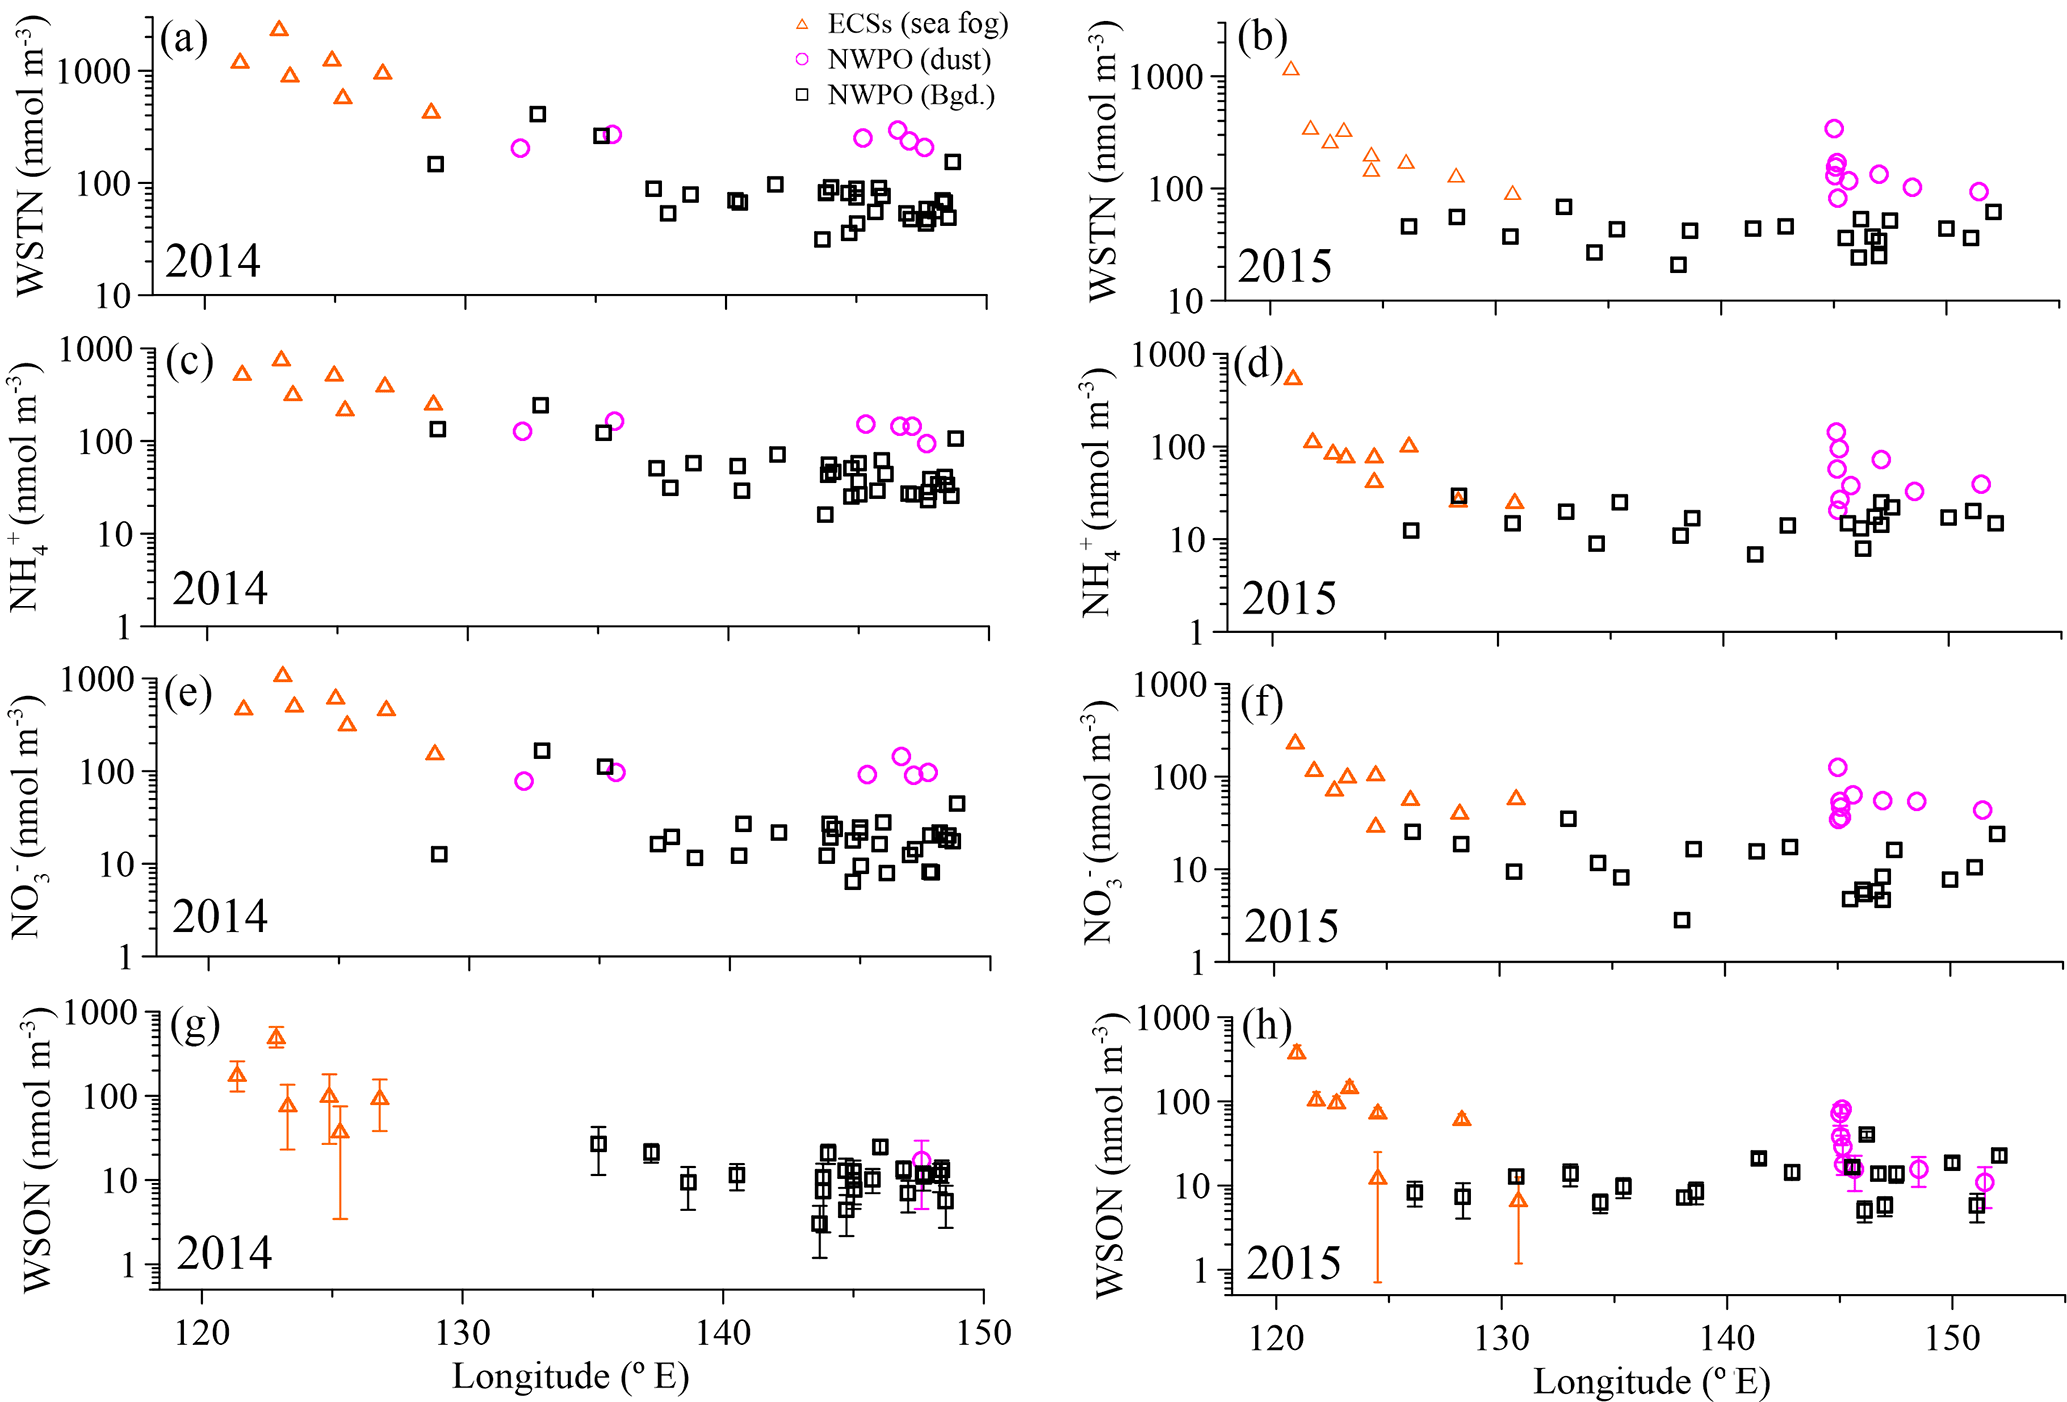
Figure 2Concentrations of aerosol WSTN (a, b), NH (c, d), NO (e, f) and WSON (g, h) with longitude for the 2014 and 2015 cruises. The orange open triangles denote sea-fog-modified aerosol in the ECSs, the pink circles denote dust aerosol, and the black open squares denote background aerosol in the NWPO. The error bars in (g) and (h) were the uncertainties of WSON caused by error propagation during the calculation.
3.1 Spatial and temporal variations of water-soluble nitrogen species in the aerosol
Overall, significant logarithmic decreases occurred from the shore seaward for all water-soluble nitrogen species and WSTN in both 2014 and 2015 (Fig. 2). The seaward gradient was caused primarily by continental emissions influenced by sea fog (Luo et al., 2016); thus, concentrations were high in the ECSs (orange triangles in Fig. 2) and low offshore in the NWPO background aerosol (black squares in Fig. 2). Dust aerosol (pink circles in Fig. 2) appeared sporadically in the NWPO and generally featured higher NH and NO (but not WSON) values (Table 1 and Fig. 2).
The measured WSTN concentrations in TSP varied from 21 to 2411 nmol m−3 (Table 1 and Fig. 2a and b), lower than those in PM10 sampled during spring in Xi'an, China (which ranged from 786 to 3000 nmol m−3; Wang et al., 2013), but higher than those in TSP sampled in Sapporo, Japan (which ranged from 20.9 to 108.6 nmol m−3; Pavuluri et al., 2015); Okinawa Island (which ranged from 5 to 216 nmol m−3; Kunwar and Kawamura, 2014); and the North Pacific (which ranged from 1.4 to 64.3 nmol m−3 in May–July; Hoque et al., 2015). This wide range of aerosol WSTN content illustrates the influence of the distance between sampling locations and emission sources (Matsumoto et al., 2014), seasonality (Kunwar and Kawamura, 2014) and meteorological conditions, such as sea fog (Luo et al., 2016).
Table 1Concentration ranges and means for WSTN, NH, NO, WSON and RN in aerosols.
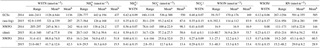
a Arithmetic mean. b Volume-weighted mean.
The concentrations of marine aerosol WSTN in the ECSs ranged from 444 to 2411 nmol m−3 in 2014 (with a volume-weighted mean of 1136 nmol m−3) and from 92.9 to 1195 nmol m−3 in 2015 (with a volume-weighted mean of 287 nmol m−3), which were clearly higher than those in dust aerosol (with volume-weighted means of 242 nmol m−3 in 2014 and 154 nmol m−3 in 2015) and background aerosol (with volume-weighted means of 85.6 nmol m−3 in 2014 and 42.3 nmol m−3 in 2015) collected in the NWPO (Table 1). The air mass backward trajectories (see Fig. S5 for 2015 and Luo et al. (2016) for 2014) reveal that the high aerosol water-soluble nitrogen species in the ECSs arose from anthropogenic Nr emissions from eastern China (Gu et al., 2012). In addition, frequent formation of sea fog in the ECSs in spring (Zhang et al., 2009) may also enrich the amount of water-soluble nitrogen in sea-fog-modified aerosol via chemical processing (Luo et al., 2016). The much higher concentrations of water-soluble nitrogen species in the ECSs marine aerosol (compared to that in the NWPO aerosol) indicate that continental and/or anthropogenic Nr strongly affected the marine aerosol. The amounts of sea-salt ions (such as Na+) in the ECSs aerosols sampled in both 2014 (123 ± 98 nmol m−3; Luo et al., 2016) and 2015 (151 ± 164 nmol m−3; Luo et al., unpublished data) were higher than those in land aerosol sampled during spring (23 ± 7.8 nmol m−3 in Beijing; Zhang et al., 2013), which implies that those aerosols sampled in the ECSs were also significantly influenced by sea salt. Thus, we define the aerosol collected by ship over the ECSs as marine aerosol.
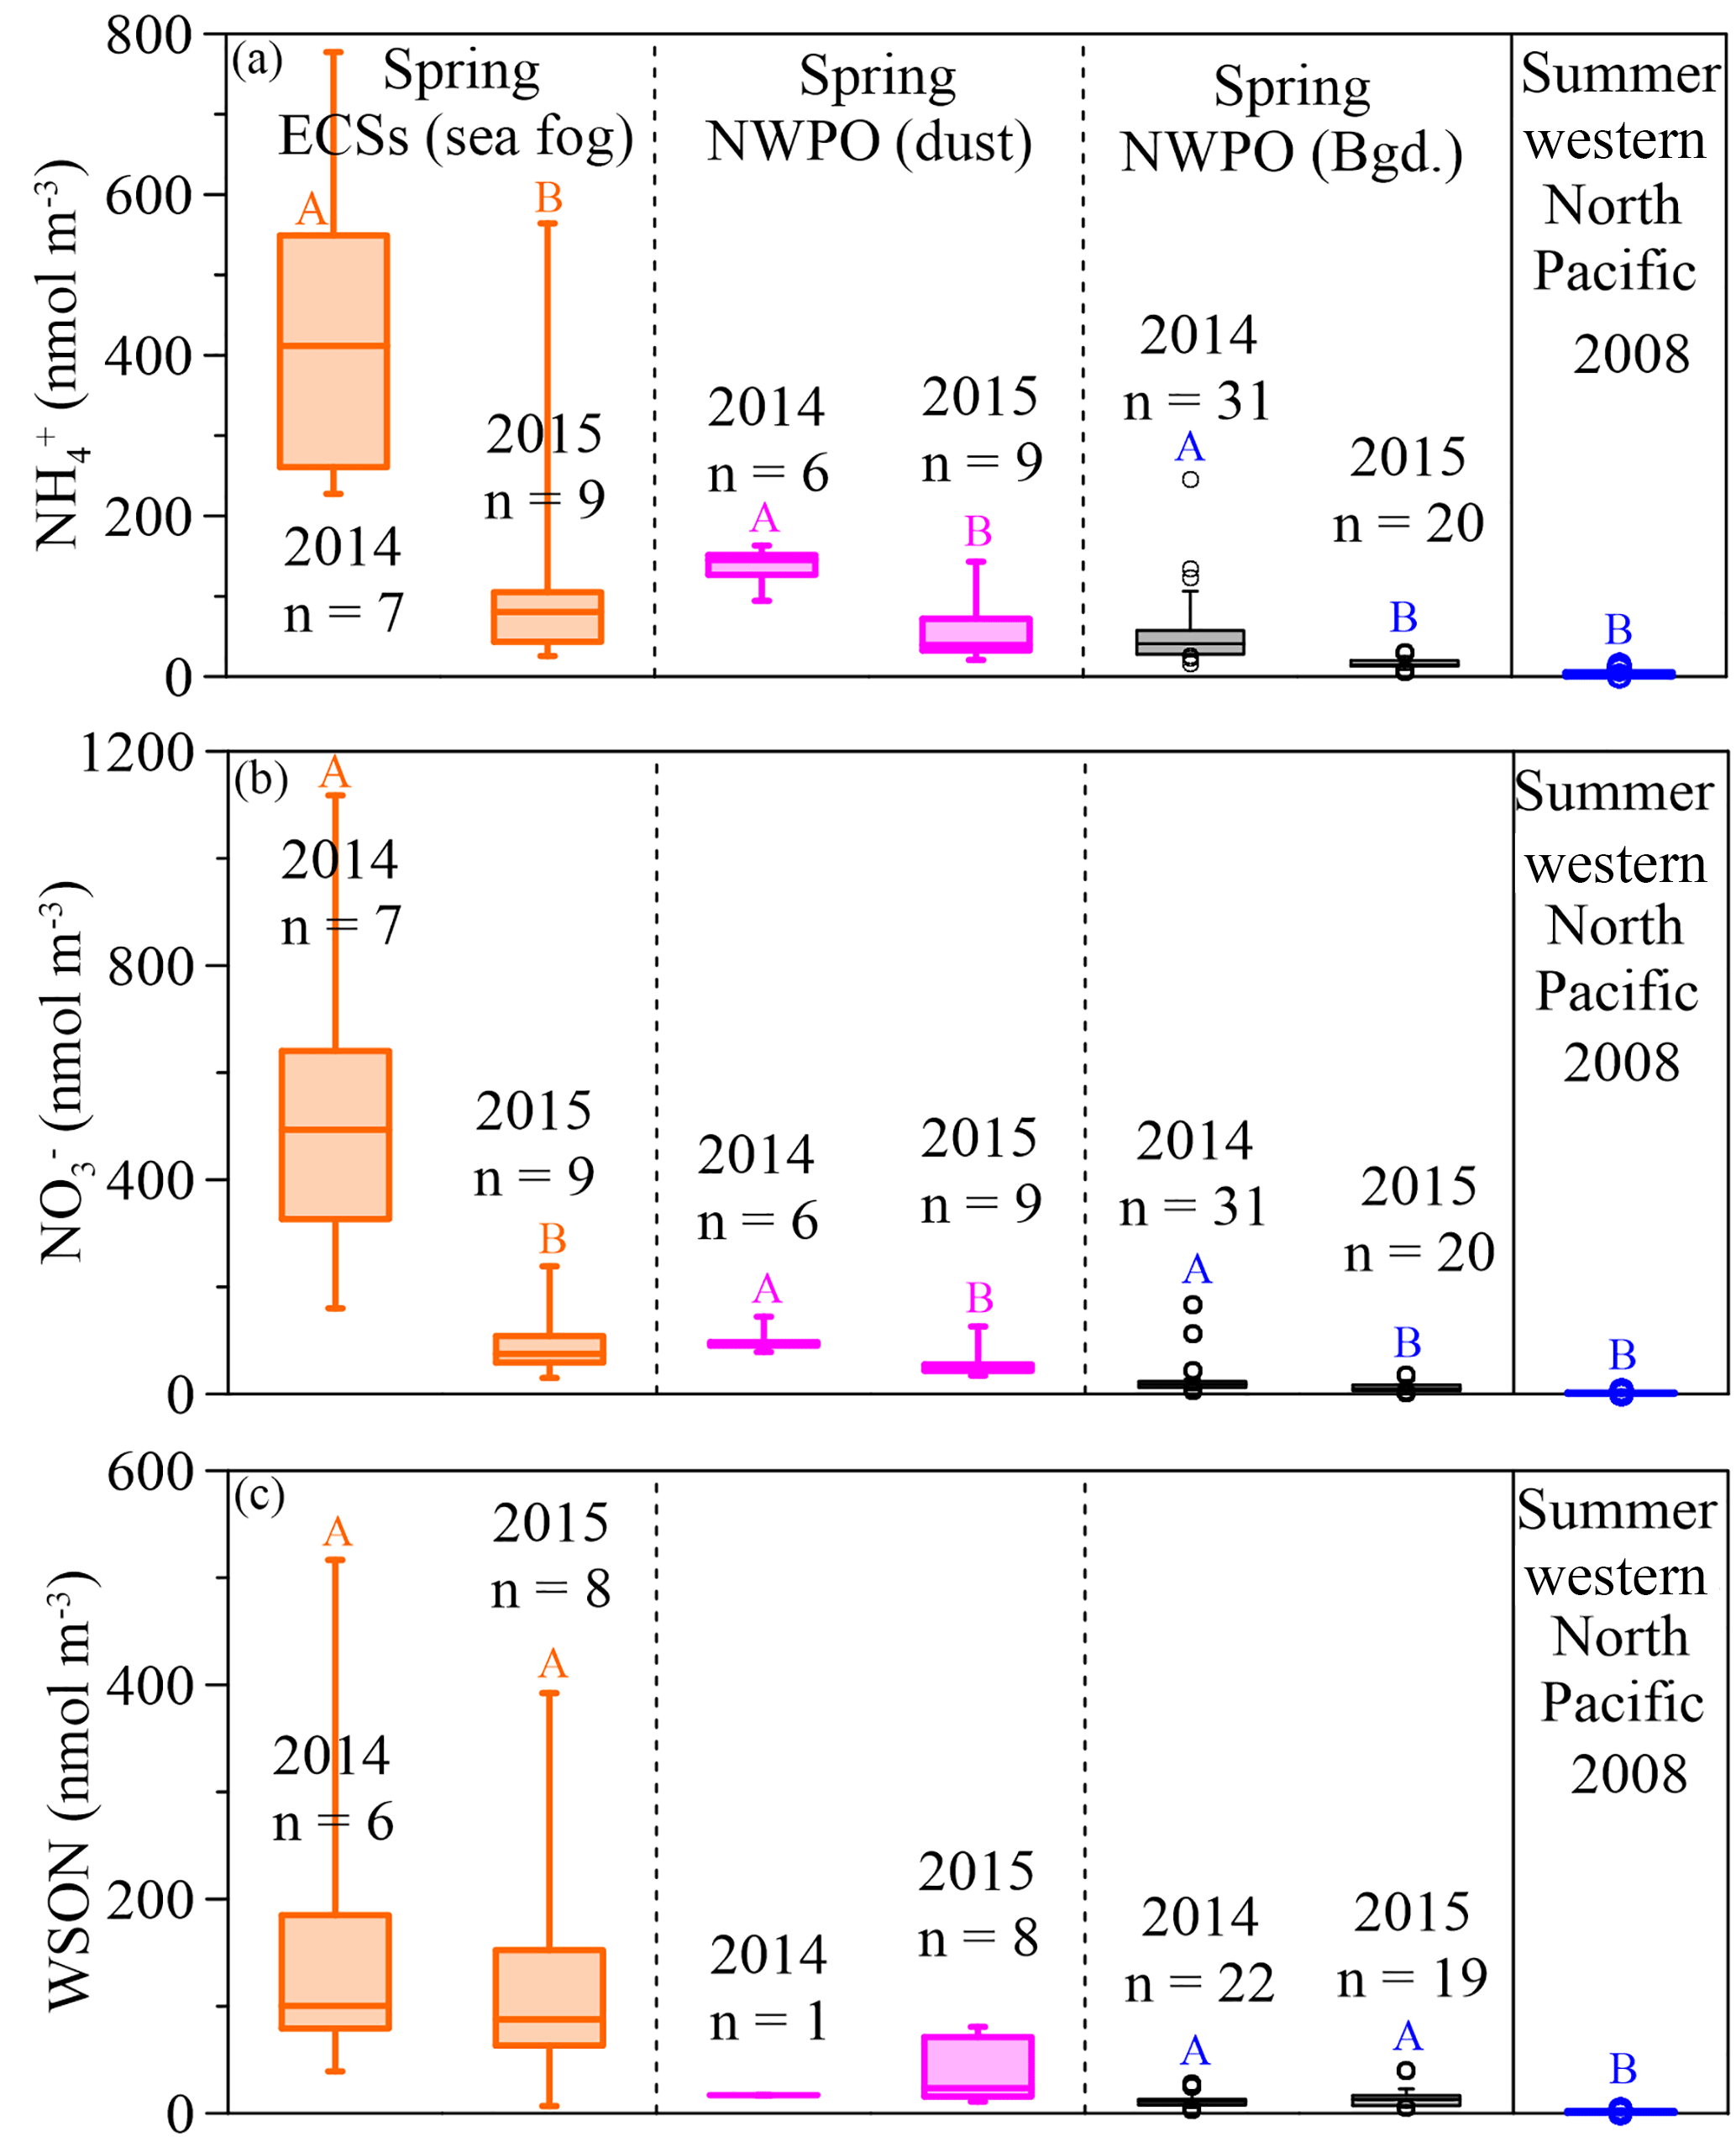
Figure 3Box plots for spring concentrations of aerosol NH (a), NO (b) and WSON (c) in the ECSs (the orange boxes denote sea-fog-modified aerosol) and NWPO (the pink boxes denote dust aerosol and the black boxes denote background aerosol), and summer aerosol (the blue box denotes NH and NO from Miyazaki et al. (2011) and Jung et al. (2013) and the WSON from Miyazaki et al., 2011). The large boxes represented the interquartile range from the 25th to 75th percentile, the line inside the box indicates the median value, and the whiskers extend upward to the 90th and downward to the 10th percentiles. Significant differences at the p < 0.05 level between different years are marked with coloured uppercase letters.
In the NWPO, higher WSTN values were observed in dust aerosol than in background aerosol in both 2014 and 2015; the dust aerosol WSTN consisted predominantly of NH and NO rather than WSON (Table 1, pink circles in Fig. 2), which implies that dust can carry more NH and NO during long-range transport from East Asia to the NWPO during the Asian winter monsoon in spring. The air mass back trajectories of those dust aerosols arose mainly from high-Nr regions, as evidenced by dust plumes captured by lidar browse images from NASA (Fig. S3 for 2015 and Luo et al., 2016 for 2014).
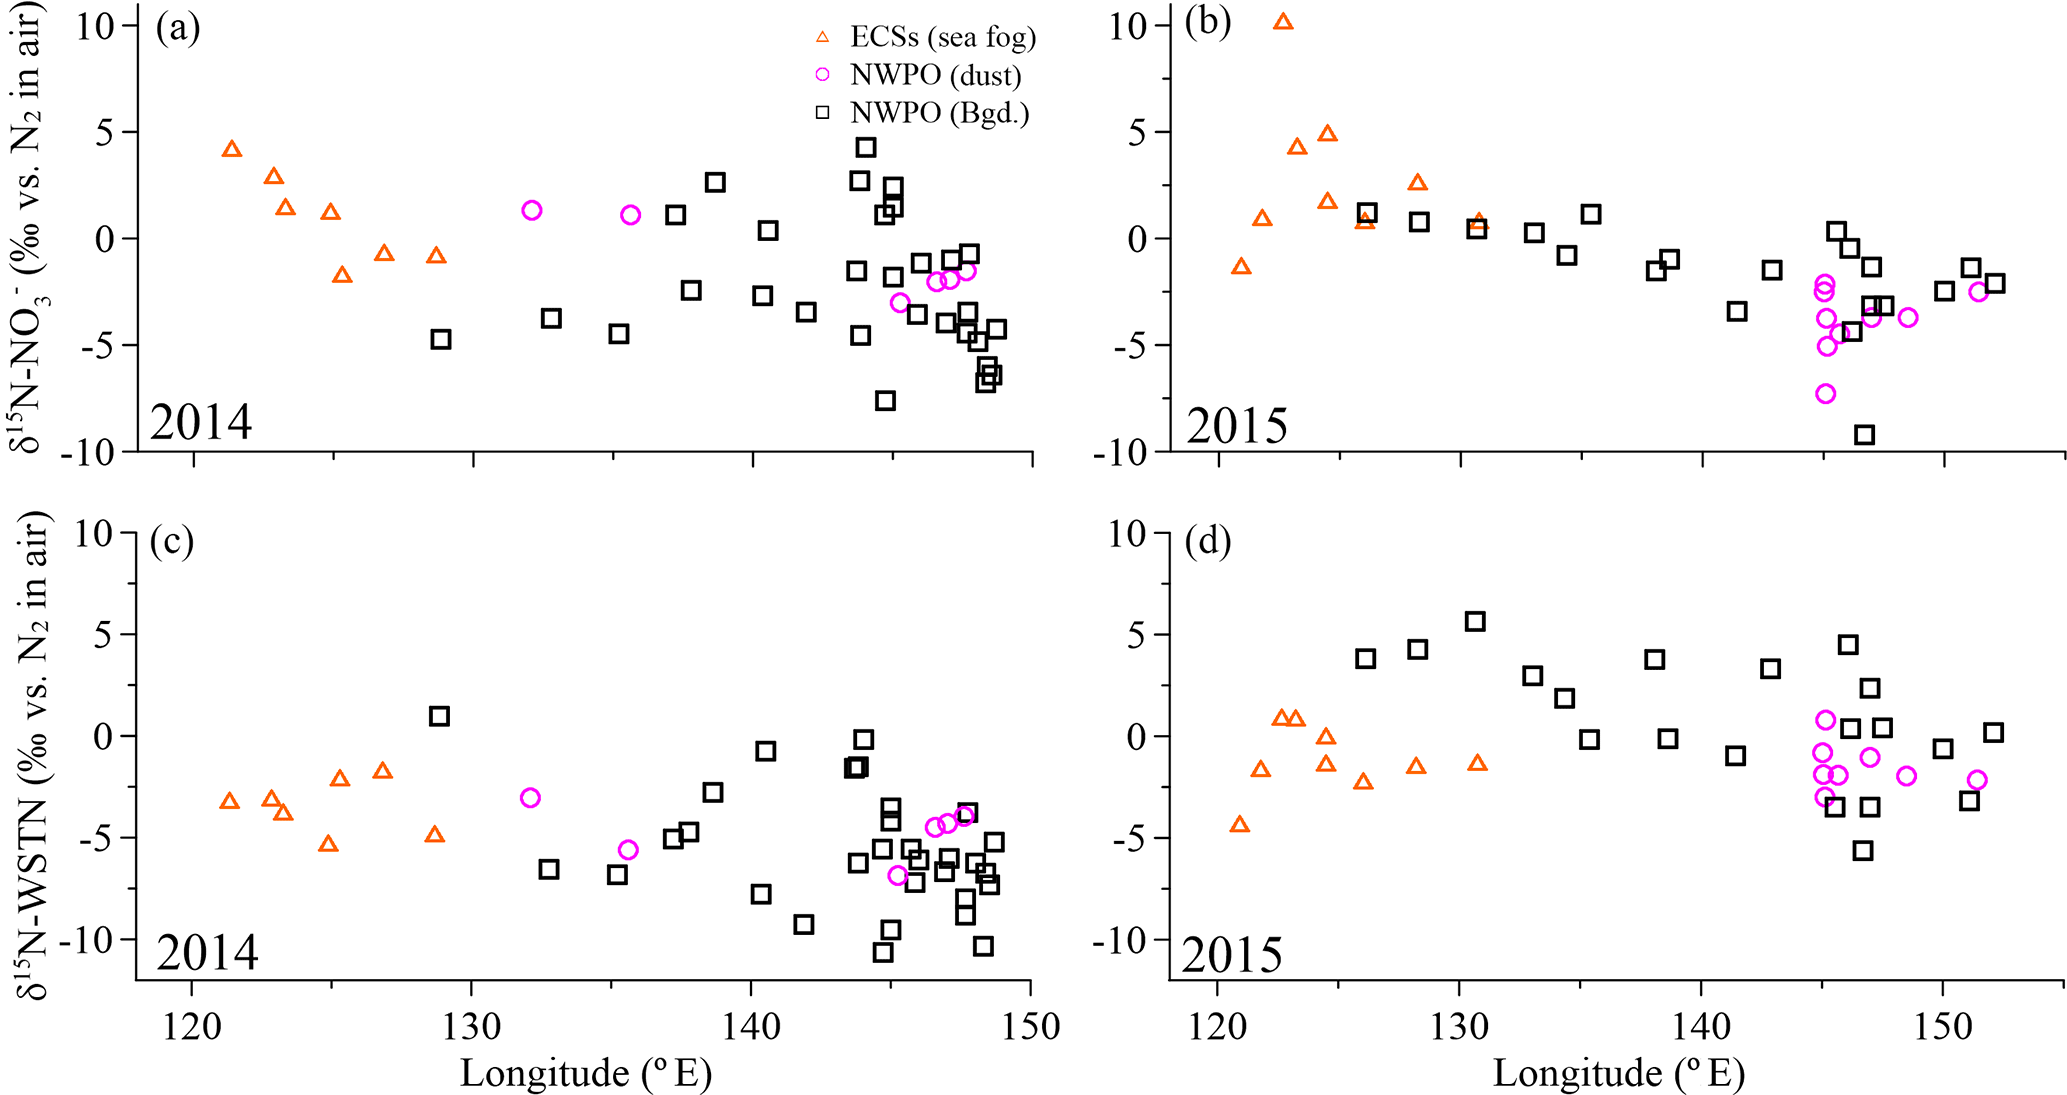
Figure 4Aerosol δ15N-NO (a, b) and δ15N-WSTN (c, d) in the ECSs (the orange open triangles denote for sea-fog-modified aerosol), and in the NWPO (the pink open circles denote dust aerosol and the black open squares denote background aerosol) with longitude during the 2014 and 2015 cruise, respectively.
In our observations, the concentrations of NH and NO were higher in all aerosols in 2014 than they were in 2015 (Fig. 3a and b; Table 1). The difference between the two years was caused by a stronger Asian winter monsoon in 2014. Additionally, the cruise in 2014 (17 March to 22 April) occurred during a period of intensive fossil fuel combustion for heat supply in northern China; in contrast, the 2015 cruise started on 30 March and finished on 3 May, during a decrease in heating demand. The influence of heating on aerosol emissions can be seen in the atmospheric aerosol optical depth over heat-generating areas in China; for example, Xiao et al. (2015) reported that the aerosol optical depth was 5 times higher during heat generation periods than during non-generation periods. The consistent variations between heat supply in northern China and higher NO in marine aerosol sampled in 2014 than 2015 underscore the influence of anthropogenic NOx emissions on marine aerosol NO. Our spring observations in 2014 and 2015 showed average concentrations of NH and NO in background aerosol (black boxes in Fig. 3a and b; Table 1) higher than the average concentrations (3.5 ± 3.3 nmol m−3 for NH and 2.1 ± 1.5 nmol m−3 for NO reported in the western Pacific Ocean in summer (blue boxes in Fig. 3a and b, data from Miyazaki et al., 2011 and Jung et al., 2013), which suggests the far-reaching influence of anthropogenic emissions during the monsoon transition. Moreover, concentrations of NH and NO were higher in 2014 due to the stronger Asian winter monsoon, which further supports the idea that the monsoon exerts an important role in annual and seasonal variations in marine aerosol Nr via atmospheric long-range transport.
Table 2Ranges and means for stable nitrogen isotopes of WSTN, NO and RN in aerosols.
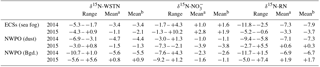
a Arithmetic mean. b Volume-weighted mean.
Unlike NH and NO, WSON concentrations in the background aerosol sampled in the NWPO in 2014 (average = 12.2 ± 6.3 nmol m−3) were similar to those in 2015 (average = 13.3 ± 8.5 nmol m−3; black boxes in Fig. 3c). In the open ocean, apart from terrestrial and anthropogenic WSON long-range transport (Mace et al., 2003; Lesworth et al., 2010), the ocean itself is the most likely source of marine aerosol WSON. For instance, in situ observations in the subtropical North Atlantic found that aerosol WSON had strong positive relationships with surface ocean primary productivity and wind speed (Altieri et al., 2016). Another study in the South Atlantic Ocean showed that the WSON in marine aerosol associated with high SSW chlorophyll a was 9 times higher than that associated with low SSW chlorophyll a (Violaki et al., 2015). In our observations, the WSON in the background aerosol (black bar in Fig. 3c) was significantly higher in spring than in summer (blue bar in Fig. 3c), which is consistent with the higher SSW chlorophyll a concentration over the NWPO in spring relative to that in summer (Fig. S6). However, the sources of marine aerosol WSON are a complex mixture composed of primary marine organic N and secondary N-containing organic aerosol. Biogenic organic material in SSW can be injected into the atmosphere to form an ice cloud via bubble bursting at the atmosphere–ocean interface (Wilson et al., 2015); this is probably the primary WSON aerosol source. Volatile organic compounds emitted from the surface ocean can react with NOx and NHx in the atmosphere to form secondary N-containing organic aerosol (Fischer et al., 2014; Liu et al., 2015).
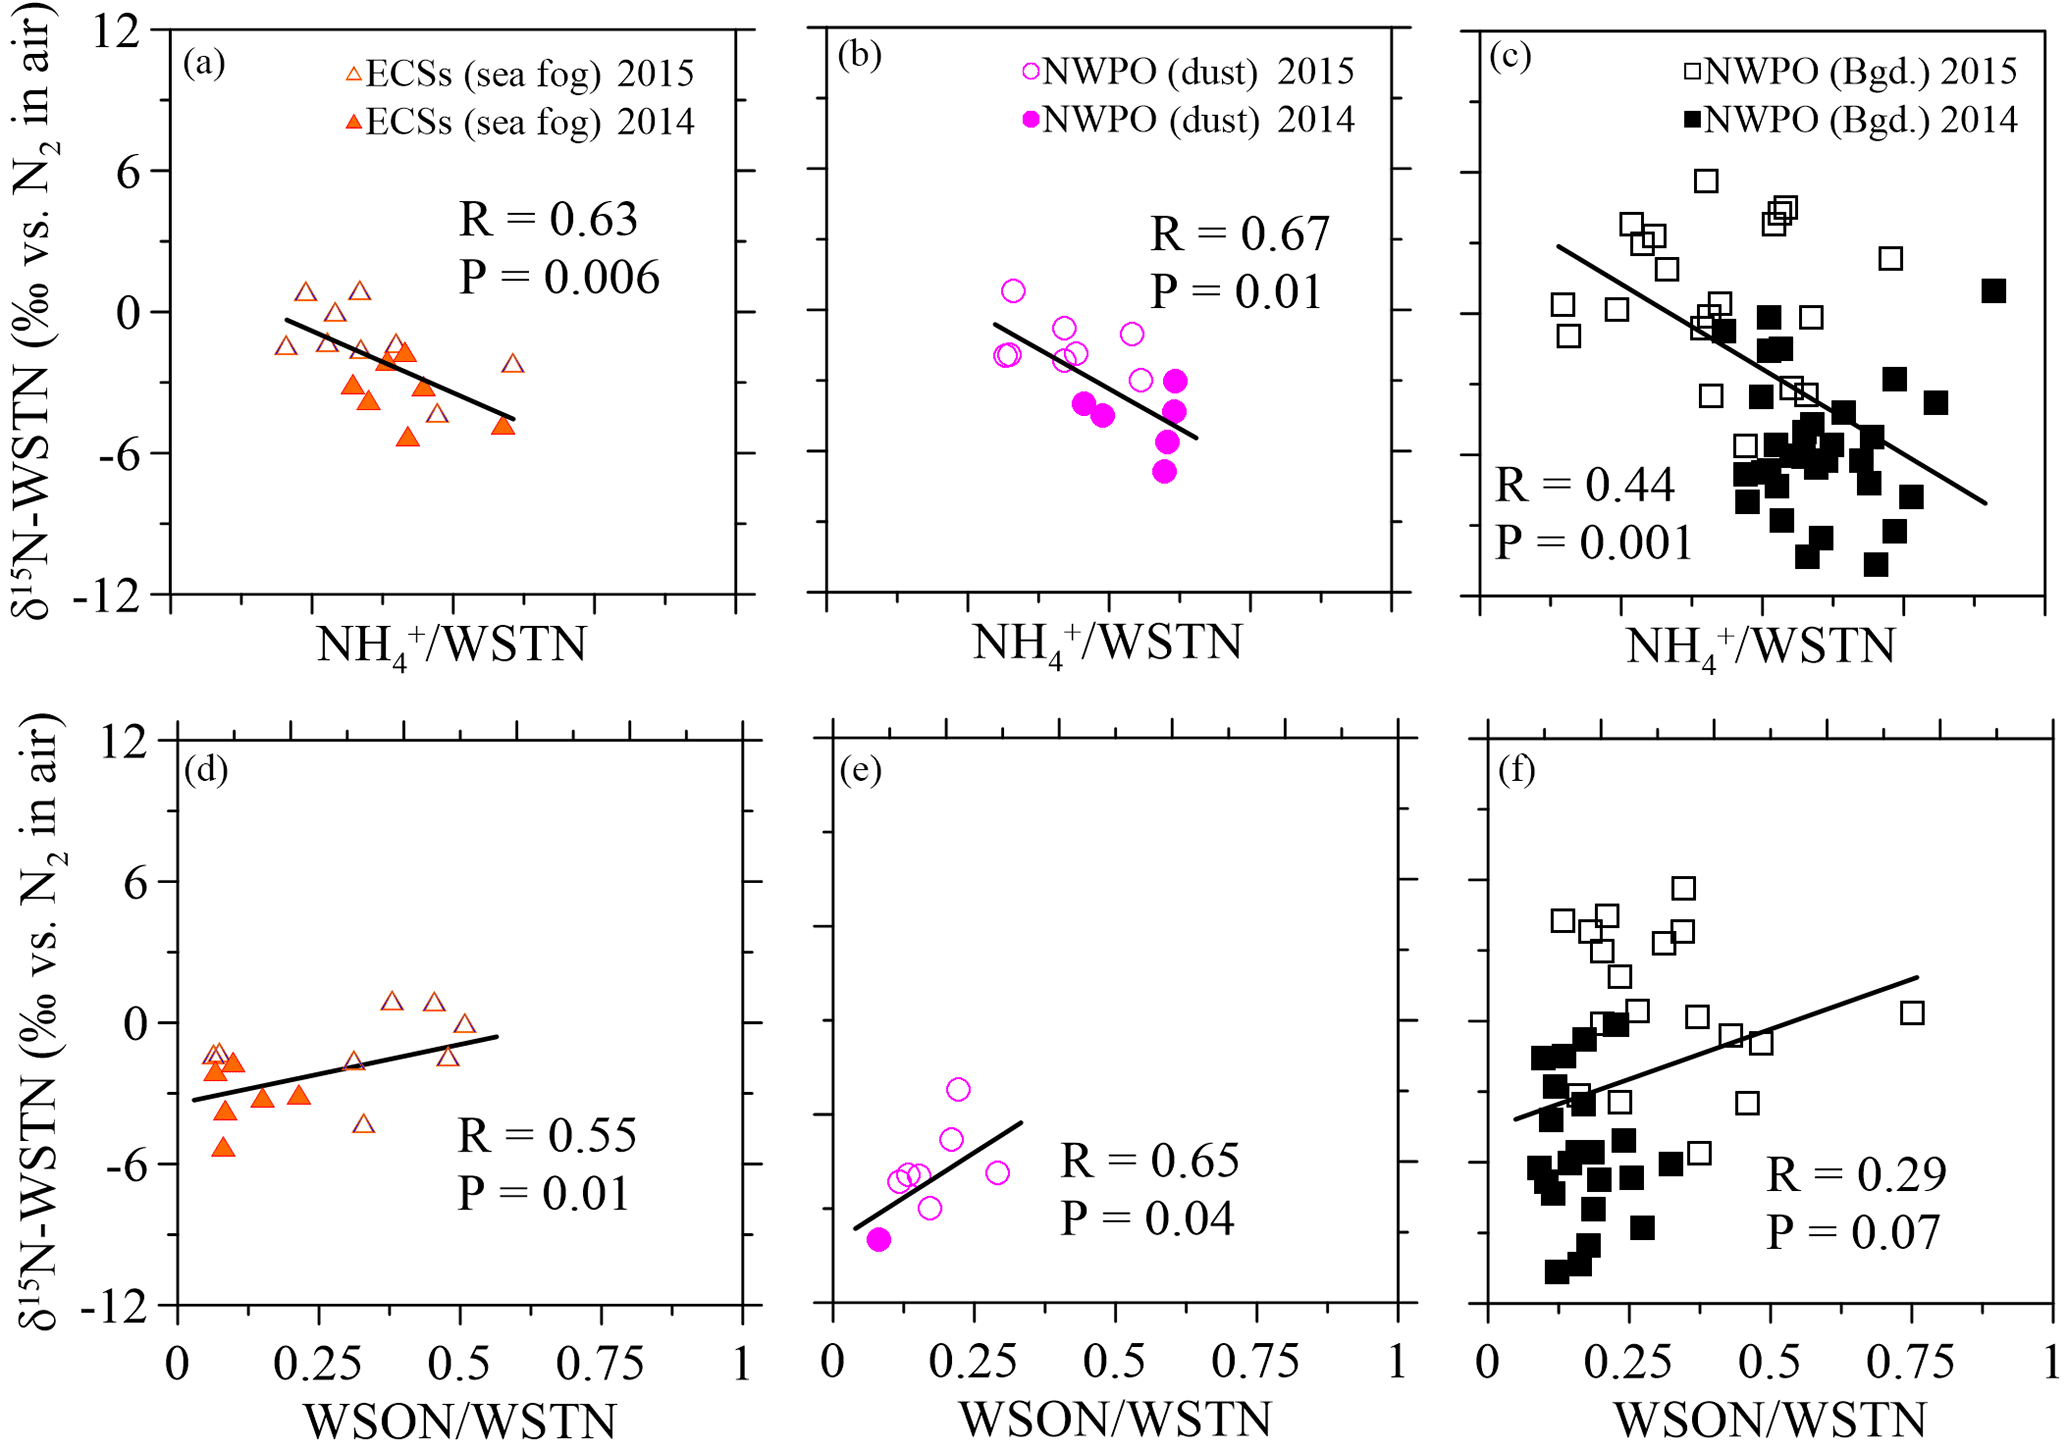
Figure 5Scatter plots of δ15N-WSTN against the NH ∕ WSTN ratio in (a) aerosol sampled in the ECSs, (b) dust aerosol and (c) background aerosol collected in the NWPO. Scatter plots of aerosol δ15N-WSTN against the WSON ∕ WSTN ratio in the (d) ECSs, (e) dust aerosol and (f) background aerosol in the NWPO. The solid and open symbols indicate aerosol sampled in 2014 and 2015, respectively.
3.2 Isotopic composition of nitrogen species
Aerosol δ15N-NO values over the ECSs and NWPO in 2014 and 2015 ranged from −9.2 to +10.2 ‰ (Table 2 and Fig. 4a and b). All the observed δ15N-NO values fell within the ranges previously reported for atmospheric δ15N-NO over land (Elliott et al., 2009; Fang et al., 2011; Felix and Elliott, 2014) and in the marine boundary layer (Hastings et al., 2003; Morin et al., 2009; Altieri et al., 2013; Gobel et al., 2013; Savarino et al., 2013). The mass-weighted mean aerosol δ15N-NO values in 2014 (+1.6 ‰ in the ECSs, −1.1 ‰ for dust aerosol and −2.6 ‰ for background aerosol sampled in the NWPO) were similar to those in 2015 (+1.9 ‰ in the ECSs, −3.8 ‰ for dust aerosol and −1.1 ‰ for background aerosol sampled in the NWPO; Table 2) for all the aerosols, suggesting that the aerosol NO arose from similar origins and atmospheric chemical pathways in both 2014 and 2015.
The δ15N-WSTN values for all the aerosols ranged from −10.7 to +5.6 ‰ (Table 2, Fig. 4c and d), which is consistent with the δ15N-WSTN ranges reported in precipitation, namely −4.2 to +12.3 ‰ in the Baltic Sea (Rolff et al., 2008); −8 to +8 ‰ in Bermuda (Knapp et al., 2010); −4.9 to +3.2 ‰ in a forest in southern China (Koba et al., 2012); and −12.1 to +2.9 ‰ in Cheju, Korea (Lee et al., 2012). In contrast, our results were lower than the δ15N-WSTN in TSP sampled in Sapporo, Japan (+12.2 to +39.1 ‰ ; Pavuluri et al., 2015) and the Sapporo Forest (+9.0 to +26.0 ‰; Miyazaki et al., 2014). These authors attributed higher isotopic values to biogenic sources, nitrogenous aerosol ageing and fossil fuel combustion. However, WSTN is, in fact, composed of various nitrogen species, and the relative proportions of NH, NO and WSON to WSTN, coupled with their isotopic compositions (i.e. δ15N-NH, δ15N-NO and δ15N-WSON), jointly mediate variations in aerosol δ15N-WSTN (where δ15N-WSTN ⋅ [WSTN] =δ15N-NO ⋅ [NO] +δ15N-NH ⋅ [NH] +δ15N-WSON ⋅ [WSON]). Taking our study as an example, the inconsistent trends in both the positive relationships between δ15N-WSTN and δ15N-NO in the ECSs aerosols and NWPO background aerosols (Fig. S7a and c) and the negative relationship between δ15N-WSTN and the NO concentration (Fig. S7d and f) imply that the δ15N of other species (NH and WSON) in WSTN affected the δ15N-WSTN.
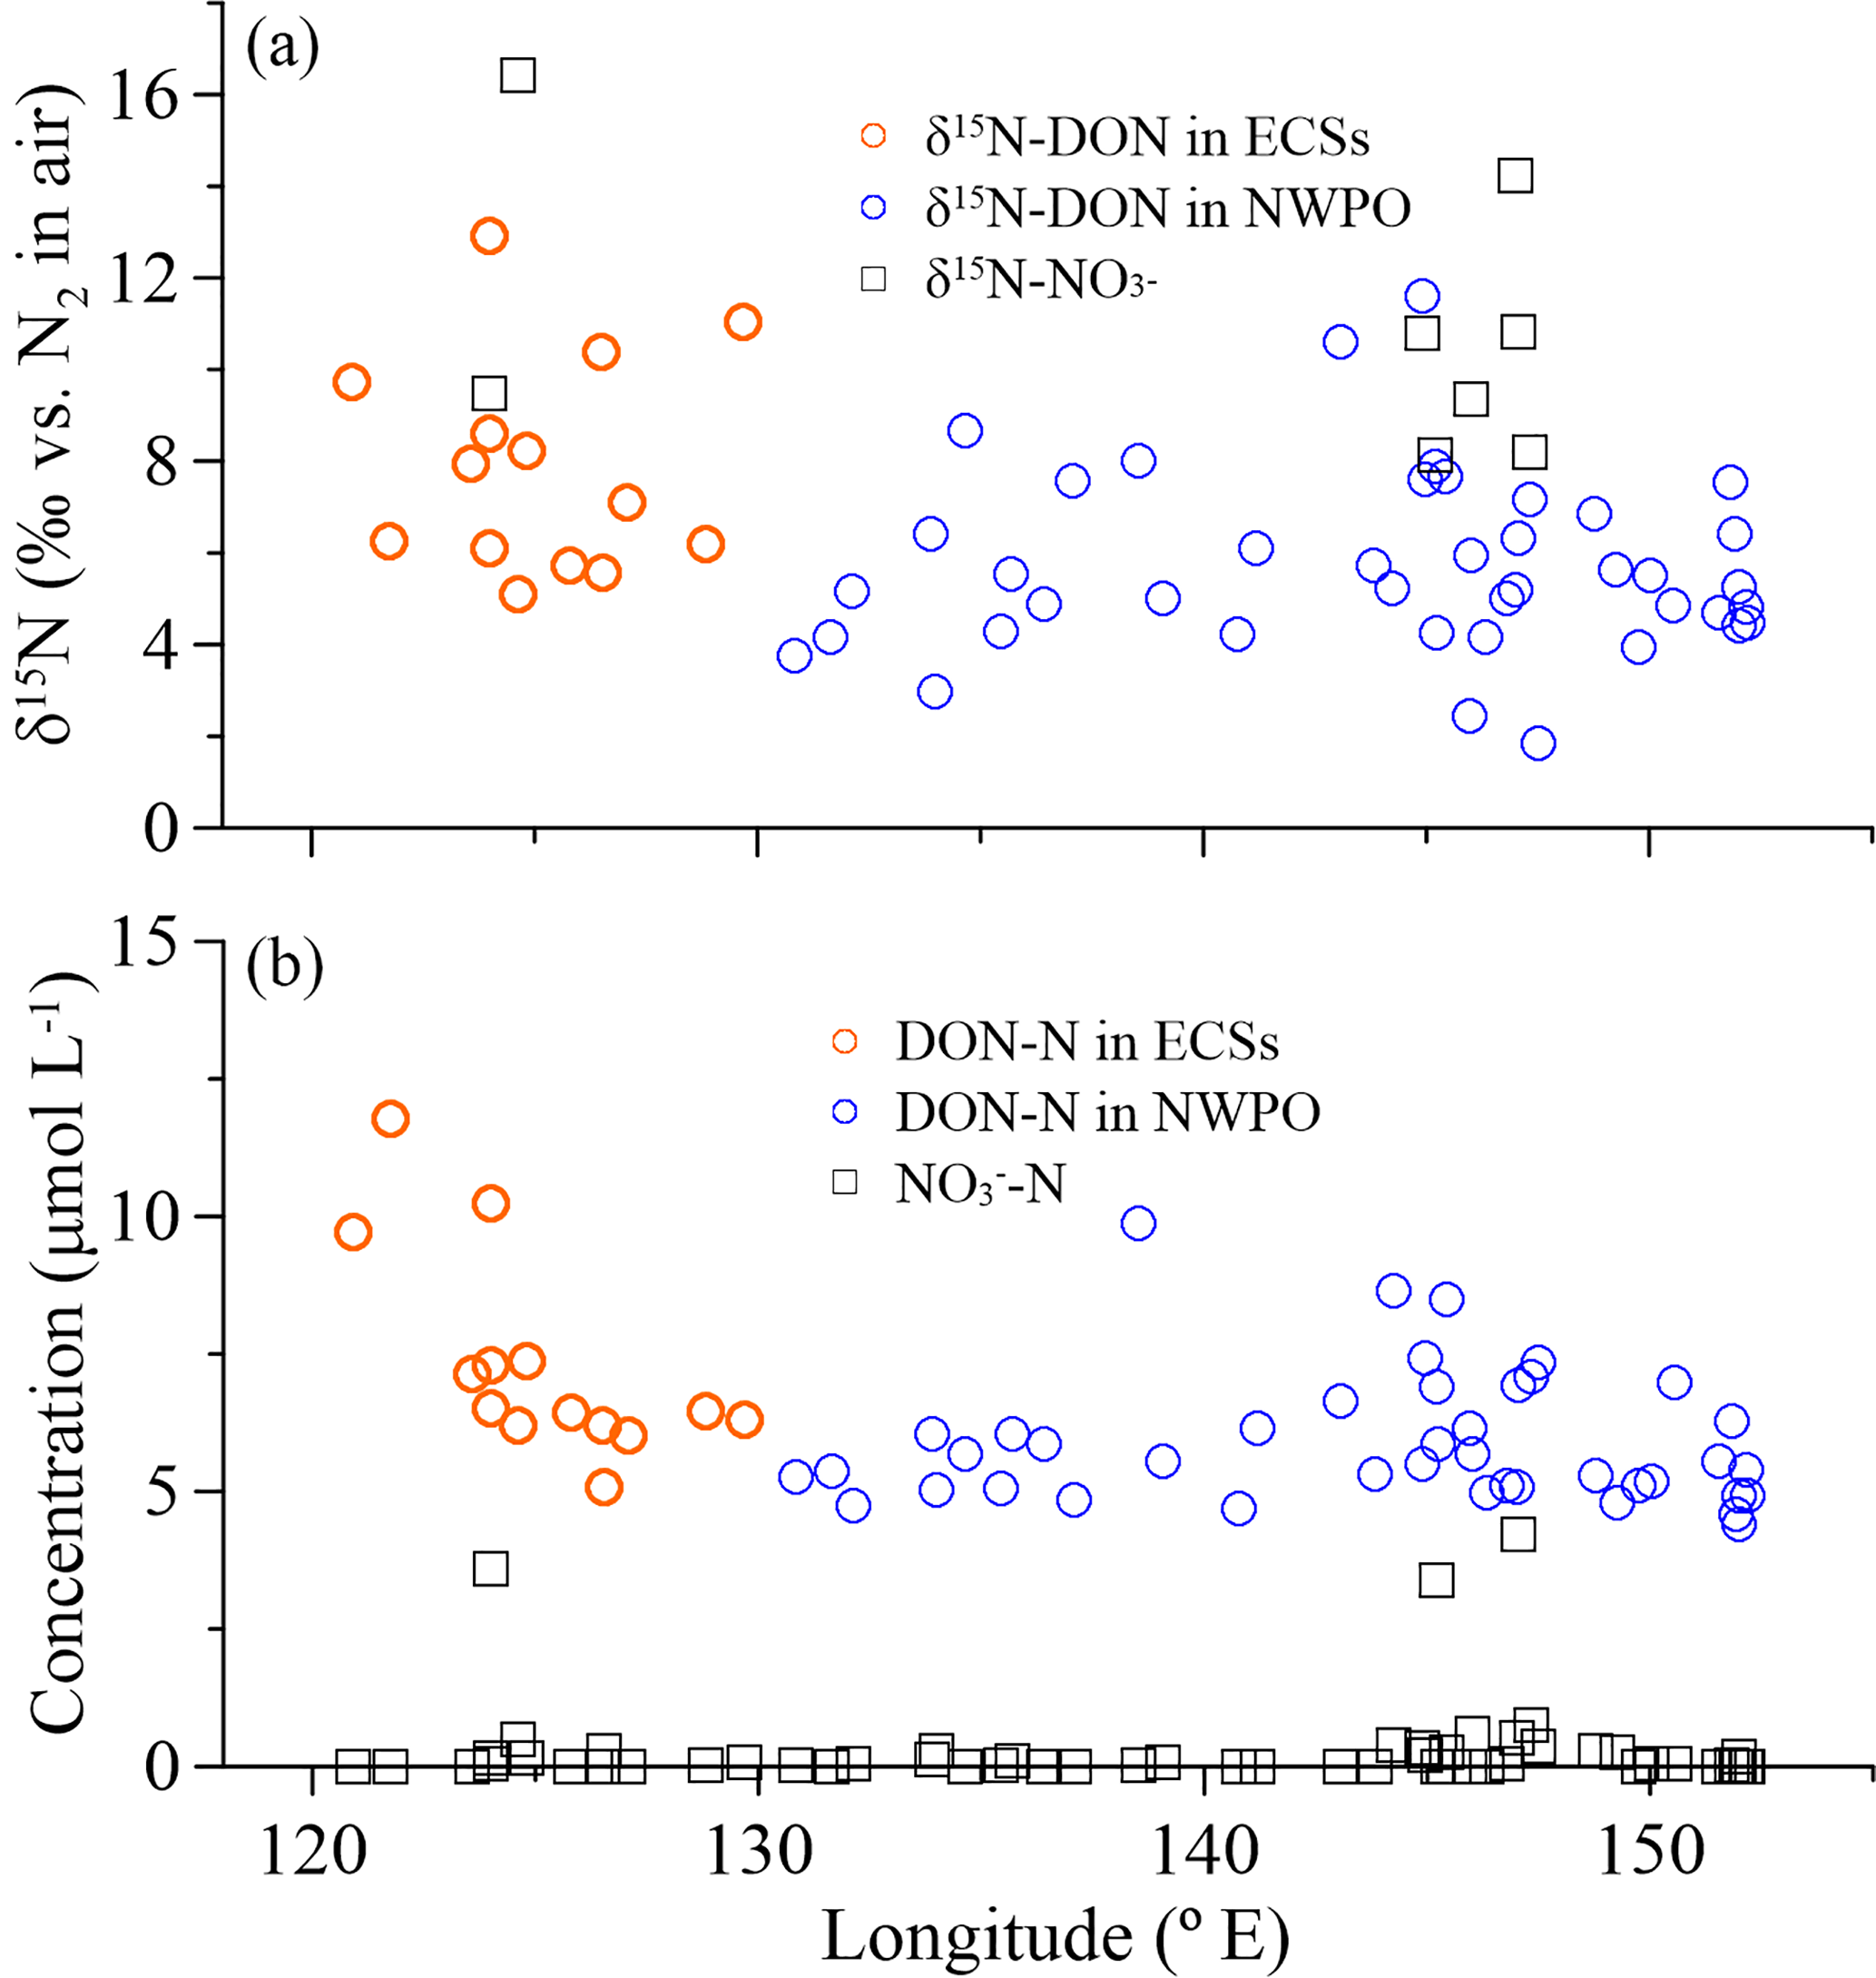
Figure 6(a) δ15N-DON (open circles) and δ15N-NO (black squares), and (b) concentrations of DON (open circles) and NO (black squares) in SSW with longitude during the 2015 cruise.
The δ15N-WSTN values in 2014 (−10.7 to +1.0 ‰) were lower than those in 2015 (−5.6 to +5.6 ‰; Table 2), whereas the NH ∕ WSTN ratios were higher in 2014 than in 2015 (Table 1) for all aerosol types. The negative linear relationships between NH ∕ WSTN and δ15N-WSTN for all aerosol types (Fig. 5a–c) may be attributed to higher proportions of NH in WSTN and negative δ15N-NH values, which originated from the anthropogenic and marine emissions (Yeatman et al., 2001; Jickells, 2003; Altieri et al., 2014; Koba et al., 2012; Xiao et al., 2012; Liu et al., 2014). In fact, low δ15N-NH values have been reported in precipitation in many places, such as Beijing (−33.0 to +14.0 ‰ with an arithmetic mean of −10.8 ‰; Liu et al., 2014); Guiyang City in south-western China (−38.0 to +5.0 ‰ with an average of −15.9 ‰; Xiao et al., 2012); Gwangju, Korea (−15.9 to +2.9 ‰ with volume-weighted means of −6.0 ‰ in 2007 and −6.8 ‰ in 2008; Lee et al., 2012); and a forest in southern China (−18.0 to +0.0 ‰ with a concentration-weighted mean of −7.7 ‰; Koba et al., 2012). Low atmospheric δ15N-NH has also been associated with marine air masses (e.g. −8 to −5 ‰, Jickells et al. 2003; −9 ± 8 ‰, Yeatman et al., 2001; and −4.1 ± 2.6 ‰, Altieri et al., 2014). Together, this low atmospheric average δ15N-NH (−15.9 to −4.1 ‰) supports our findings of higher NH ∕ WSTN and lower δ15N-WSTN in aerosol.
There were positive linear relationships between the WSON ∕ WSTN ratio and δ15N-WSTN for all the aerosols types (Fig. 5d–f). This implies that the aerosol δ15N-WSON may be positive. The WSON in the marine aerosol either originated from terrestrial long-range transport or the DON from SSW and N-containing secondary organic marine aerosol as discussed in Sect. 3.1. Terrestrial aerosol δ15N-WSON was reported in a wide range (−15.0 to +14.7 ‰) with mean values from −3.7 to +5.0 ‰, and δ15N-WSON in marine aerosol with more positive δ15N (Fig. S1). In addition, our own observations for δ15N-DON in SSW showed positive δ15N in the ECSs (varying from +5.1 to +12.9 ‰, with an average of +7.9 ± 2.3 ‰) and NWPO (ranging from +1.9 to +11.6 ‰, with an average of +5.7 ± 2.0 ‰; Fig. 6a). At the same time, DON concentration in our observations ranged from 4.4 to 11.8 µmol L−1 (Fig. 6b), which is within the DON concentration range reported in global SSW (Li et al., 2009; Van Engeland et al., 2010; Knapp et al., 2011; Letscher et al., 2013; Lønborg et al., 2015). This high DON concentration in SSW may be ejected into the atmosphere during bubble-bursting (Wilson et al., 2015).
To better clarify the sources of aerosol WSON, we removed the aerosol NO and its δ15N effect from the WSTN and its δ15N-WSTN, respectively, by mass balance. The remaining NH and WSON was defined as reduced nitrogen (RN WSON). The δ15N-RN ranged from −11.8 to +7.4 ‰ for all aerosol types in both 2014 and 2015 (Table 2), which is consistent with the reported δ15N-RN in precipitation (−12.6 to +7.8 ‰) collected in Bermuda, in the Atlantic Ocean (Knapp et al., 2010). The negative relationships between δ15N-RN and NH concentration (Fig. S8a, S8b and S8c), as well as between δ15N-RN and the ratios of NH ∕ RN (Fig. S8d–f) for all aerosol types, further support the low values of δ15N-NH in marine aerosol. Three important endmembers, compiled from atmospheric δ15N-NH (−15.9 to −4.1 ‰, green bars in Fig. 7) and continental δ15N-WSON (−3.7 to +5.0 ‰, grey bars) versus the δ15N-DON observed in SSW in our cruise (+7.9 ± 2.3 ‰ in the ECSs and +5.7 ± 2.0 ‰ in the NWPO, red dots with error bars), were added to Figure 7 to facilitate discussion. Note that nearly all the aerosol δ15N-RN values in 2014 were lower than those in 2015, which may be attributed to higher NH concentrations in 2014 than in 2015 (Table 1). Moreover, higher values of δ15N-RN can be seen with higher WSON ∕ RN ratios for all aerosol types in Fig. 7. The high values of δ15N in continental WSON and marine DON in SSW may cause these positive relationships. Thus, although higher WSON ∕ RN values accompany higher δ15N-RN, we may still not conclude a significant DON in SSW contribution to aerosol WSON. In the open ocean, to some extent, background aerosol WSON was more likely influenced by DON in surface seawater, judging by nitrogen isotopic information.
Note that some data points collected in 2015 for the open-ocean case in Fig. 7b and c fell outside the mixing field, deviating toward higher δ15N-RN values; these high δ15N-RN values may be attributable to δ15N fractionation and 15N enrichment in the WSON during processes such as secondary N-containing organic aerosol formation by the reaction of NHx or NOx with organic aerosol (Fischer et al., 2014; Liu et al., 2015), complex atmospheric chemical reactions (i.e. the photolysis of organic nitrogen into ammonium; Paulot et al., 2015), the aerosol WSON ageing process and in-cloud scavenging (Altieri et al., 2016). More studies are needed to explore nitrogen transformation processes, especially those focusing on secondary N-containing organic aerosol in the atmosphere from an isotopic perspective.
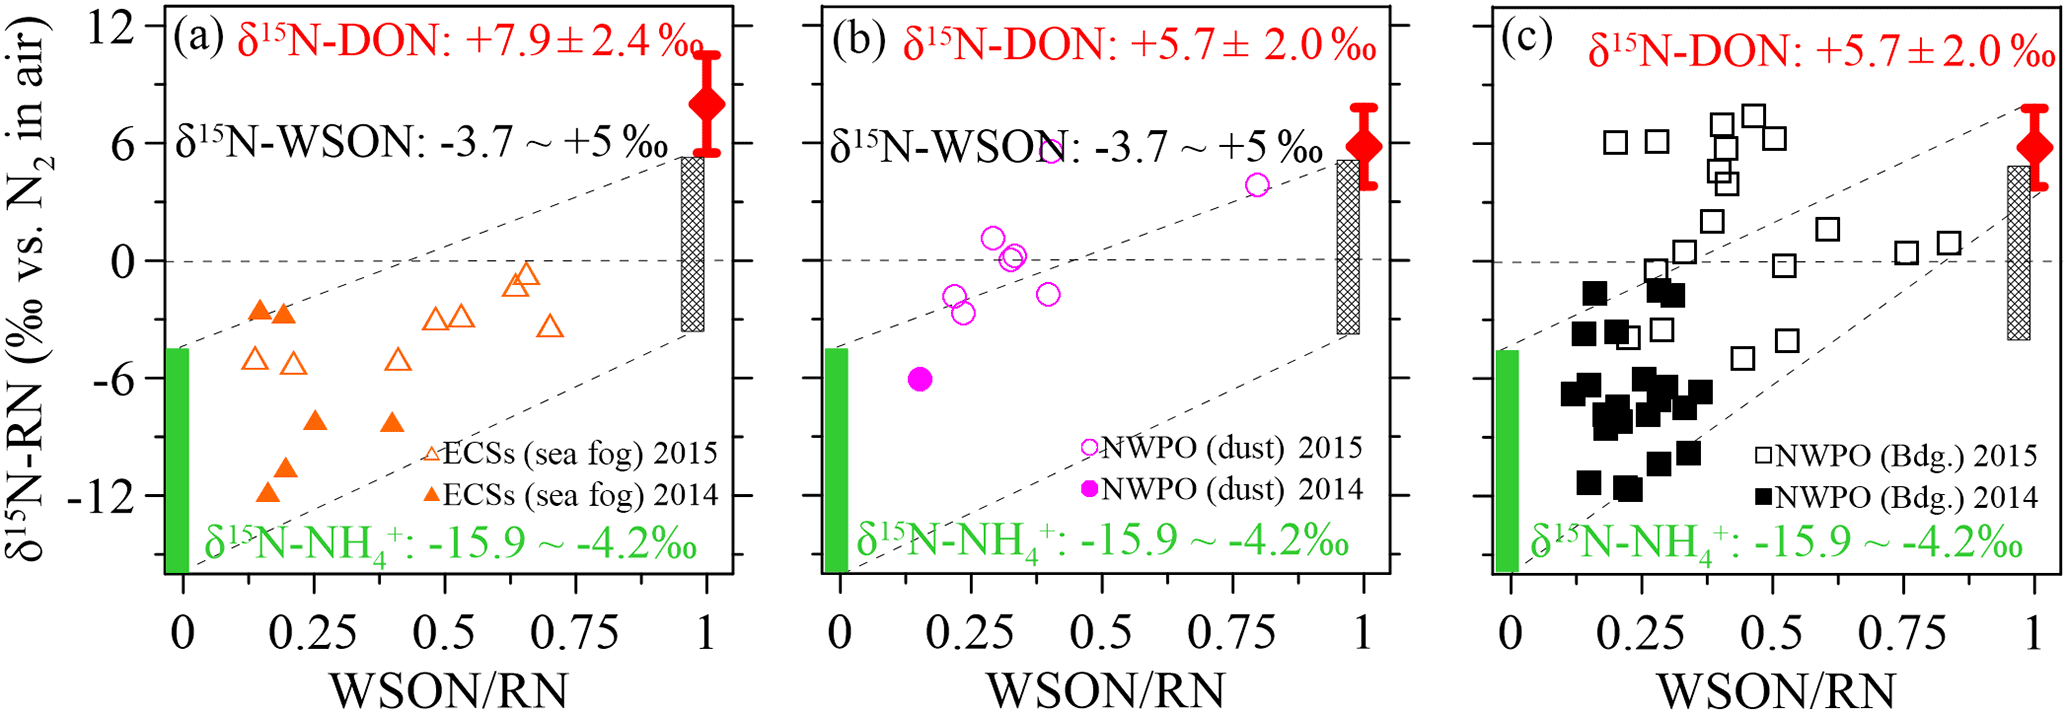
Figure 7Scatter plots of aerosol δ15N-RN against the WSON ∕ RN ratio in the (a) ECSs, (b) dust aerosol in the NWPO and (c) background aerosol in the NWPO. The green bar indicates the sources of anthropogenic, terrestrial and oceanic δ15N-NH, the grey bar indicates the sources of terrestrial and anthropogenic δ15N-WSON, and the red bar indicates the δ15N-DON in SSW.
Table 3Dry deposition fluxes of water-soluble nitrogen species.
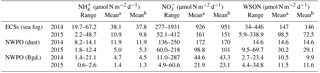
a Arithmetic mean. b Volume-weighted mean.
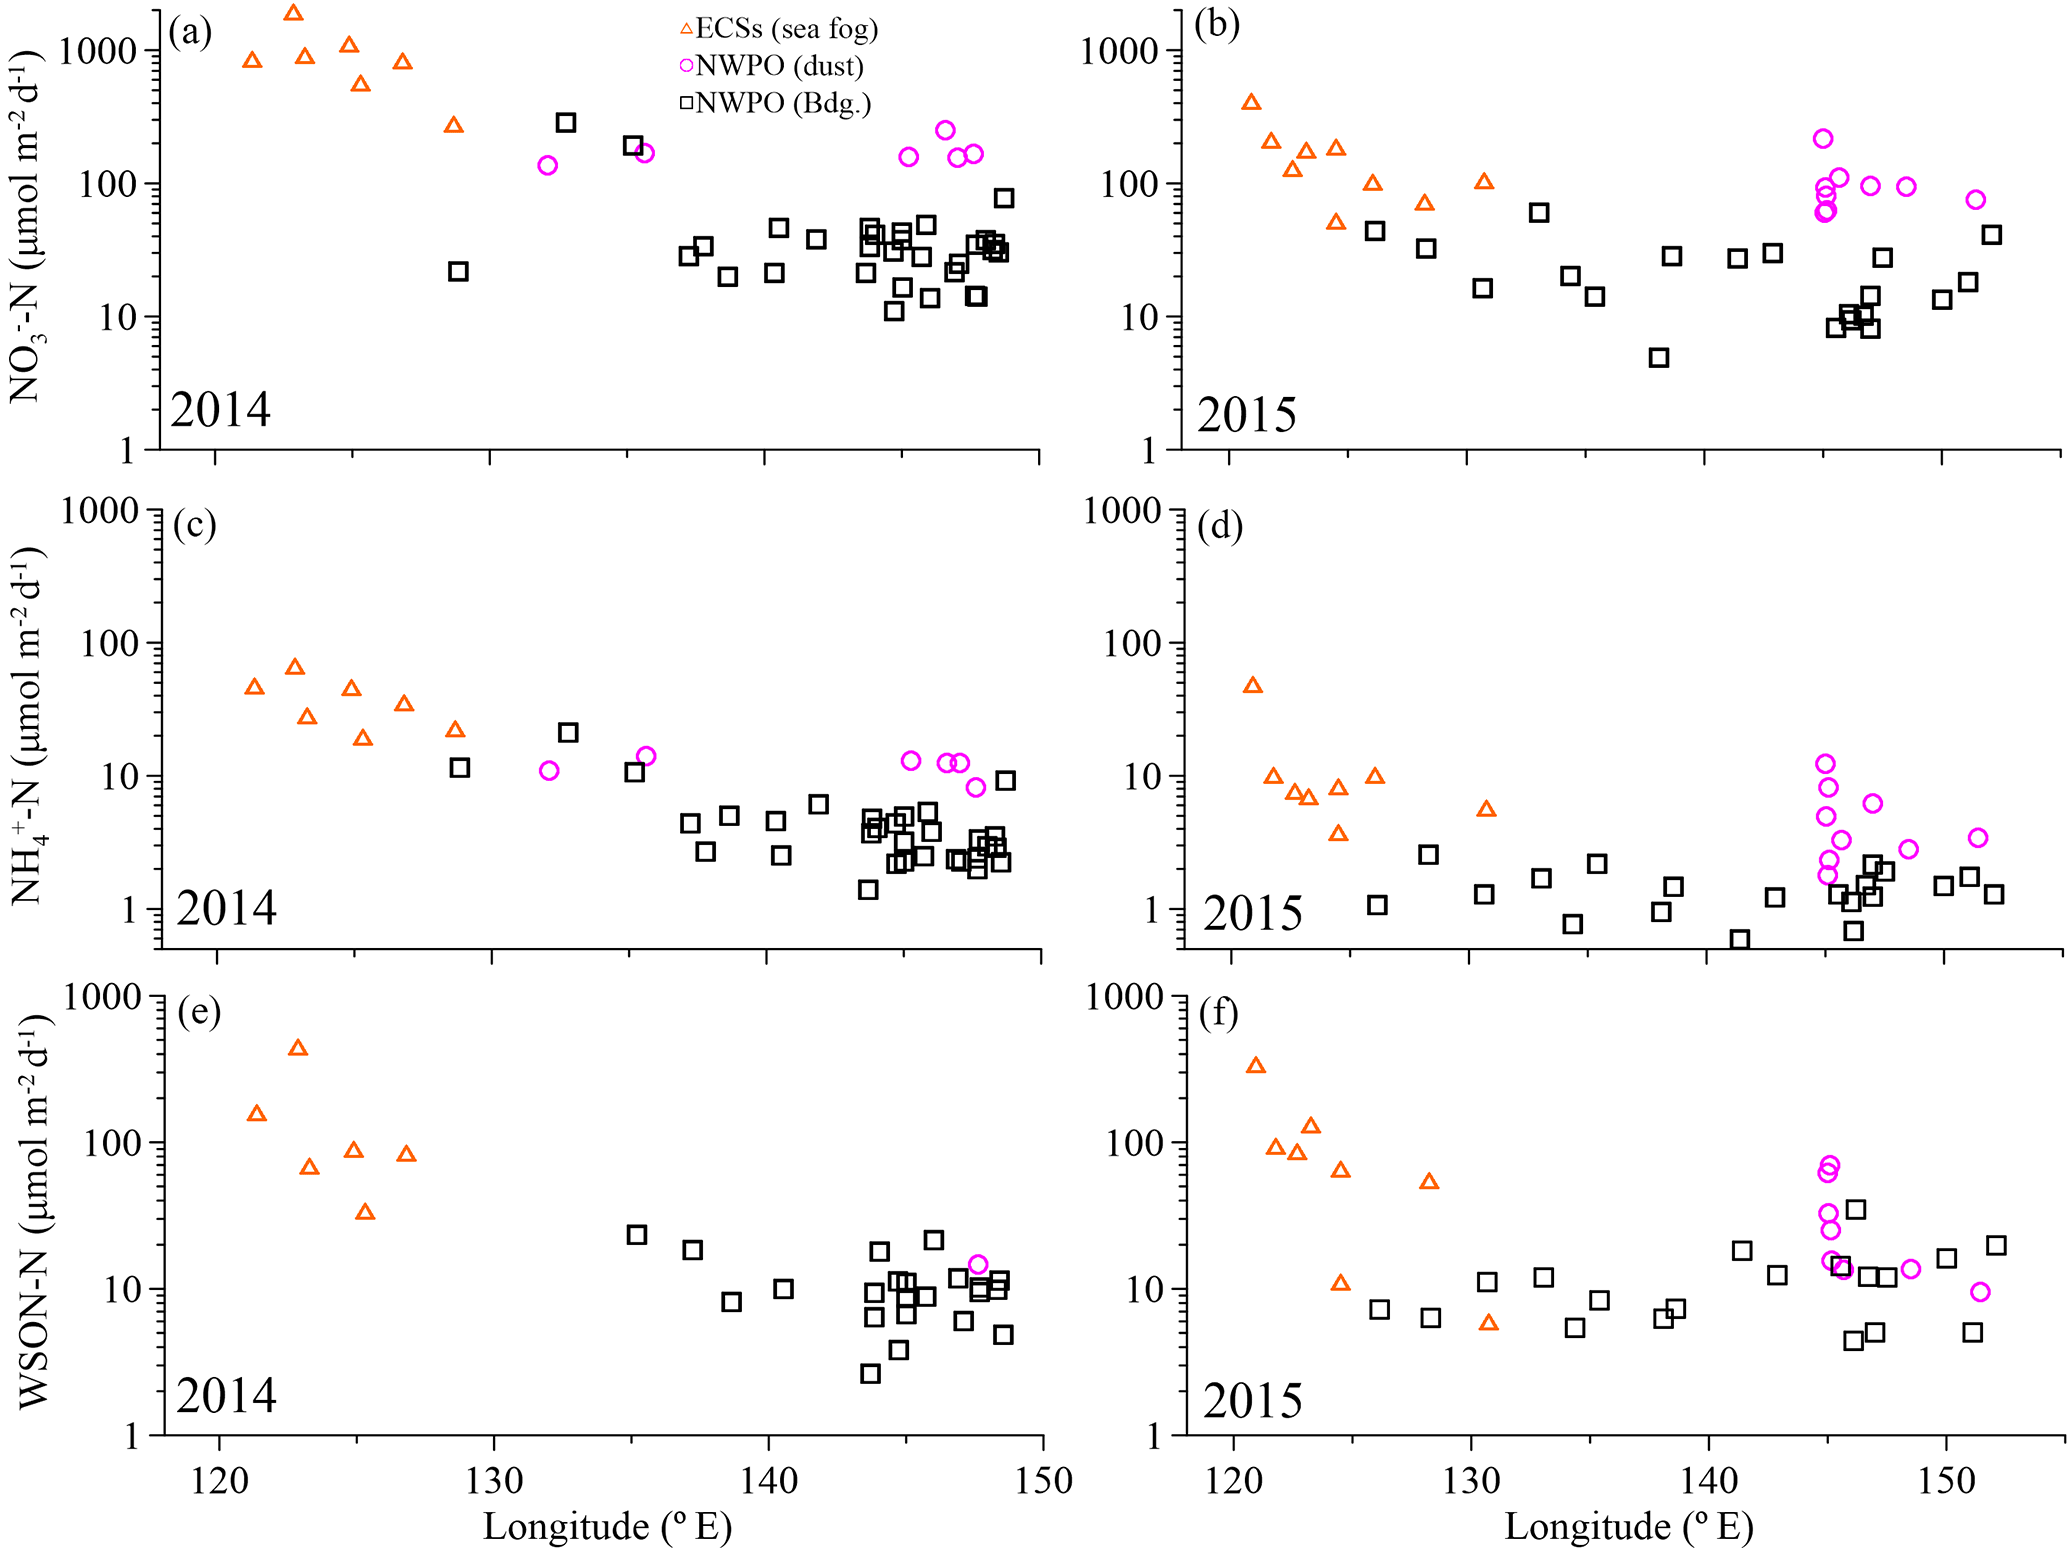
Figure 8Dry deposition of aerosol NO-N (a, b), NH-N (c, d) and WSON-N (e, f) in the ECSs (orange open triangles) and in the NWPO (pink open circles for dust aerosol and black open squares for background aerosol) along longitude during the 2014 and 2015 cruise, respectively.
3.3 Nr dry deposition and its biogeochemical role
The dry deposition of aerosol NH, NO and WSON is summarized in Table 3. The calculated depositional fluxes of water-soluble nitrogen species in the ECSs were significantly higher than those in the NWPO (Fig. 8). The averaged dry depositional fluxes of NH and NO in 2014 were 2 to 5 times higher than those in 2015 for all aerosol types (Table 3). The dry depositional fluxes of NH and NO in dust aerosol were clearly higher than those in background aerosol in the NWPO (Table 3, Fig. 8a–d). Comparisons of these dry fluxes with other similar studies and estimations of the contribution of atmospheric Nr deposition to primary production in the NWPO are discussed in Luo et al. (2016), specifically for 2014; here, we focus on the influence of atmospheric Nr deposition on the nitrogen cycle in the ocean.
The influences of atmospheric Nr deposition on the marine nitrogen cycle are obvious over long timescales. For example, by analysing concentrations of NO and phosphorus in seawater over the NWPO from 1980 to 2010, Kim et al. (2011) reported that the higher N ∕ P ratio in the upper ocean (in contrast to the deep ocean) in the NWPO was caused primarily by the accumulation of atmospheric anthropogenic Nr deposition. Another recent study found higher atmospheric anthropogenic Nr deposition to be associated with lower δ15N in surface sediment over the NWPO (Kim et al., 2017), the authors also posited that atmospheric anthropogenic Nr deposition can reach as far down as the deep ocean through biological action and lower the δ15N in surface sediment. The atmospheric δ15N values for water-soluble nitrogen species in our observations (Table 2) are lower than the δ15N-NO in deep ocean water (+5.6 ‰; unpublished data from Kao); thus, it is possible that atmospheric δ15N-Nr can lower δ15N-NO in the thermocline, as mentioned in previous studies (Knapp et al., 2010; Yang et al., 2014). However, it is hard to quantify the contribution of atmospheric δ15N-Nr to δ15N-NO in the thermocline from the perspective of 15N for the following reasons: first, there are large spatial and temporal uncertainties in the dry and wet depositional fluxes of atmospheric Nr. For example, the dry depositional fluxes of NH and NO (23.1–43.3 µmol N m−2 d−1; Table 3) in our observations are significantly higher than those in summer (4.9 µmol N m−2 d−1; Jung et al., 2013). Moreover, according to a previous study, wet Nr deposition is 2–3 times higher than dry deposition (Jung et al., 2013), and Nr wet deposition in spring over the NWPO is unknown. Second, the δ15N of N fixation (−2 to 0 ‰; summarized by Knapp et al., 2010) is similar to the atmospheric δ15N-Nr (Table 2), but the fluxes of N fixation in the global ocean also vary considerably both spatially and temporally (Mulholland and Bernhardt, 2005; Needoba et al., 2007; Karl et al., 1997). Third, 15N fractionation occurs in the complicated marine nitrogen cycle (Knapp et al., 2005, 2010, 2011, 2012), which hampers the use of 15N in estimating the influence of atmospheric deposition Nr on marine δ15N under our limited current understanding.
Concentrations of water-soluble total nitrogen, nitrate and ammonium, as well as the stable nitrogen isotopes of δ15N-WSTN and δ15N-NO, were measured in marine aerosols sampled between the ECSs and the NWPO in spring 2014 and 2015. Dissolved organic nitrogen and δ15N-DON were also analysed in SSW, collected at a depth of 5 m along the cruise route in the spring of 2015. The highest concentrations of water-soluble nitrogen species were found in aerosol sampled in the ECSs, which suggests significant influence from anthropogenic emissions on aerosol Nr. The higher NO and NH in all aerosol types in 2014 (relative to 2015) may be attributed to the stronger Asian winter monsoon in 2014, as well as the intensity of residential heating in spring in northern China.
Negative linear relationships were found between the NH ∕ WSTN ratios and δ15N-WSTN for all aerosol types. In contrast, positive linear relationships were observed between the WSON ∕ WSTN ratios and δ15N-WSTN. The distinctive nitrogen species compositions and isotopic compositions suggest that aerosol δ15N-WSTN values were mediated synergistically by NO, NH and WSON in our observations. Meanwhile, our isotope mixing model indicates that DON in SSW is likely to be a source of primary WSON in aerosol, especially over the open ocean. Many uncertainties remain concerning Nr in the marine boundary layer and SSW, let alone Nr exchange at the atmosphere–ocean interface; further study of Nr exchange between the lower atmosphere and upper ocean is needed in the future.
The underlying data for this study have been reposited at the PANGAEA database Data Publisher for Earth & Environmental Science (https://doi.pangaea.de/10.1594/PANGAEA.889124, Luo et al., 2018).
The supplement related to this article is available online at: https://doi.org/10.5194/acp-18-6207-2018-supplement.
The authors declare that they have no conflict of interest.
This research was funded by the National Natural Science Foundation of China
(NSFC U1305233), Major State Basic Research Development Program of China (973
program) (no. 2014CB953702 and 2015CB954003), National Natural Science
Foundation Committee and Hong Kong Research Grants Council Joint Foundation
(NSFC-RGC 41561164019), National Natural Science Foundation of China (NSFC
41763001), Doctoral Scientific Research Foundation of East China University
of Technology (no. DHBK2016105), Science and technology project of the
Jiangxi Provincial Department of Education (no. GJJ160580), and Scientific
Research Foundation of the East China University of Technology for the
Science and Technology Innovation Team (no. DHKT2015101). The MEL (State Key
Laboratory of Marine Environmental Science) publication number for this paper
is no. 2017209.
Edited by: Maria Cristina Facchini
Reviewed
by: two anonymous referees
Adornato, L. R., Kaltenbacher, E. A., Villareal, T. A., and Byrne, R. H.: Continuous in situ determinations of nitrite at nanomolar concentrations, Deep-Sea Res. Pt. I, 52, 543–551, https://doi.org/10.1016/j.dsr.2004.11.008, 2005.
Altieri, K. E., Hastings, M. G., Gobel, A. R., Peters, A. J., and Sigman, D. M.: Isotopic composition of rainwater nitrate at Bermuda: The influence of air mass source and chemistry in the marine boundary layer, J. Geophys. Res.-Atmos., 118, 304–311, https://doi.org/10.1002/jgrd.50829, 2013.
Altieri, K. E., Hastings, M. G., Peters, A. J., Oleynik, S., and Sigman, D. M.: Isotopic evidence for a marine ammonium source in rainwater at Bermuda, Global Biogeochem. Cy., 28, 1066–1080, https://doi.org/10.1002/2014gb004809, 2014.
Altieri, K. E., Fawcett, S. E., Peters, A. J., Sigman, D. M., and Hastings, M. G.: Marine biogenic source of atmospheric organic nitrogen in the subtropical North Atlantic, P. Natl. Acad. Sci. USA, 113, 925–930, https://doi.org/10.1073/pnas.1516847113, 2016.
Archana, A., Luo L., Kao S. J., Thibodeau, B., and Baker, D. M.: Variations in nitrate isotope composition of wastewater effluents by treatment type in Hong Kong, Mar. Pollut. Bull., 111, 143–152, 2016.
Baker, A., Lesworth, T., Adams, C., Jickells, T., and Ganzeveld, L.: Estimation of atmospheric nutrient inputs to the Atlantic Ocean from 50∘ N to 50∘ S based on large-scale field sampling: fixed nitrogen and dry deposition of phosphorus, Global Biogeochem. Cy., 24, GB3006, https://doi.org/10.1029/2009GB003634, 2010.
Böhlke, J., Mroczkowski, S., and Coplen, T.: Oxygen isotopes in nitrate: New reference materials for 18O: 17O: 16O measurements and observations on nitrate-water equilibration, Rapid Commun. Mass Sp., 17, 1835–1846, 2003.
Braman, R. S. and Hendrix, S. A.: Nanogram nitrite and nitrate determination in environmental and biological materials by vanadium (III) reduction with chemiluminescence detection, Anal. Chem., 61, 2715–2718, 1989.
Buffam, I. and McGlathery, K. J.: Effect of ultraviolet light on dissolved nitrogen transformations in coastal lagoon water, Limnology Oceanogr., 48, 723–734, 2003.
Cape, J. N., Cornell, S. E., Jickells, T. D., and Nemitz, E.: Organic nitrogen in the atmosphere – Where does it come from? A review of sources and methods, Atmos. Res., 102, 30–48, https://doi.org/10.1016/j.atmosres.2011.07.009, 2011.
Casciotti, K., Sigman, D., Hastings, M. G., Böhlke, J., and Hilkert, A.: Measurement of the oxygen isotopic composition of nitrate in seawater and freshwater using the denitrifier method, Anal. Chemi., 74, 4905–4912, 2002.
Cornell, S., Randell, A., and Jickells, T.: Atmospheric inputs of dissolved organic nitrogen to the oceans, Nature, 376, 243–246, 1995.
Cornell, S. E., Jickells, T. D., Cape, J. N., Rowland, A. P., and Duce, R. A.: Organic nitrogen deposition on land and coastal environments: a review of methods and data, Atmos. Environ., 37, 2173–2191, 2003.
Doney, S. C.: The growing human footprint on coastal and open-ocean biogeochemistry, Science, 328, 1512–1516, 2010.
Duce, R., Unni, C., Ray, B., Prospero, J., and Merrill, J.: Long-rangeatmosp heric transport of soil dust from Asia to the tropical NorthPacific: temporal variability, Science, 209, 1522–1524, 1980.
Duce, R., Liss, P., Merrill, J., Atlas, E., Buat-Menard, P., Hicks, B., Miller, J., Prospero, J., Arimoto, R., and Church, T.: The atmospheric input of trace species to the world ocean, Global Biogeochem. Cy., 5, 193–259, 1991.
Duce, R., LaRoche, J., Altieri, K., Arrigo, K. R., Baker, A. R., Capone, D. G., Cornell, S., Dentener, F., Galloway, J., Ganeshram, R. S., Geider, R. J., Jickells, T., Kuypers, M. M., Langlois, R., Liss, P. S., Liu, S. M., Middelburg, J. J., Moore, C. M., Nickovic, S., Oschlies, A., Pedersen, T., Prospero, J., Schlitzer, R., Seitzinger, S., Sorensen, L. L., Uematsu, M., Ulloa, O., Voss, M., Ward, B., and Zamora, L.: Impacts of atmospheric anthropogenic nitrogen on the open ocean, Science, 320, 893–897, https://doi.org/10.1126/science.1150369, 2008.
Elliott, E. M., Kendall, C., Boyer, E. W., Burns, D. A., Lear, G. G., Golden, H. E., Harlin, K., Bytnerowicz, A., Butler, T. J., and Glatz, R.: Dual nitrate isotopes in dry deposition: Utility for partitioning NOx source contributions to landscape nitrogen deposition, J. Geophys. Res., 114, G04020, https://doi.org/10.1029/2008jg000889, 2009.
Erisman, J. W., Hensen, A., de Vries, W., Kros, H., van de Wal, 95 T., de Winter, W., Wien, J., van Elswijk, M., Maat, M., and Sanders, K.: The nitrogen decision support system: NitroGenius, Energy research Centre of the Netherlands ECN, Petten, 2002.
Fang, Y. T., Koba, K., Wang, X. M., Wen, D. Z., Li, J., Takebayashi, Y., Liu, X. Y., and Yoh, M.: Anthropogenic imprints on nitrogen and oxygen isotopic composition of precipitation nitrate in a nitrogen-polluted city in southern China, Atmos. Chem. Phys., 11, 1313–1325, https://doi.org/10.5194/acp-11-1313-2011, 2011.
Felix, J. D. and Elliott, E. M.: Isotopic composition of passively collected nitrogen dioxide emissions: Vehicle, soil and livestock source signatures, Atmos. Environ., 92, 359–366, 2014.
Felix, J. D., Elliott, E. M., and Shaw, S. L.: Nitrogen isotopic composition of coal-fired power plant NOx: influence of emission controls and implications for global emission inventories, Environ. Sci. Technol., 46, 3528–3535, https://doi.org/10.1021/es203355v, 2012.
Fischer, E. V., Jacob, D. J., Yantosca, R. M., Sulprizio, M. P., Millet, D. B., Mao, J., Paulot, F., Singh, H. B., Roiger, A., Ries, L., Talbot, R. W., Dzepina, K., and Pandey Deolal, S.: Atmospheric peroxyacetyl nitrate (PAN): a global budget and source attribution, Atmos. Chem. Phys., 14, 2679–2698, https://doi.org/10.5194/acp-14-2679-2014, 2014.
Freyer, H.: Seasonal trends of NH and NO nitrogen isotope composition in rain collected at Jülich, Germany, Tellus A, 30, 83–92, https://doi.org/10.1111/j.2153-3490.1978.tb00820.x , 1978.
Gobel, A. R., Altieri, K. E., Peters, A. J., Hastings, M. G., and Sigman, D. M.: Insights into anthropogenic nitrogen deposition to the North Atlantic investigated using the isotopic composition of aerosol and rainwater nitrate, Geophys. Res. Lett., 40, 5977–5982, 2013.
Gu, B., Ge, Y., Ren, Y., Xu, B., Luo, W., Jiang, H., Gu, B., and Chang J.: Atmospheric reactive nitrogen in China: sources, recent trends, and damage costs, Environ. Sci. Technol., 46, 9420–9427, 2012.
Hastings, M. G., Sigman, D. M., and Lipschultz, F.: Isotopic evidence for source changes of nitrate in rain at Bermuda, J. Geophys. Res.-Atmos., 108, D244790, https://doi.org/10.1029/2003JD003789, 2003.
Heaton, T. H. E.: 15N14N ratios of nitrate and ammonium in rain at Pretoria, South Africa, Atmos. Environ., 21, 843–852, 1987.
Hoppel, W., Frick, G., and Fitzgerald, J.: Surface source function for sea-salt aerosol and aerosol dry deposition to the ocean surface, J. Geophys. Res.-Atmos., 107, AAC7.1–AAC7.17, https://doi.org/10.1029/2001JD002014, 2002.
Hoque, M., Kawamura, K., Seki, O., and Hoshi, N.: Spatial distributions of dicarboxylic acids, ω-oxoacids, pyruvic acid and α-dicarbonyls in the remote marine aerosols over the North Pacific, Mar. Chem., 172, 1–11, https://doi.org/10.1016/j.marchem.2015.03.003, 2015.
Hsu, S. C., Lee, C. S. L., Huh, C. A., Shaheen, R., Lin, F. J., Liu, S. C., Liang, M. C., and Tao, J.: Ammonium deficiency caused by heterogeneous reactions during a super Asian dust episode, J. Geophys. Res.-Atmos., 119, 6803–6817, 2014.
Jickells, T. D., Kelly, S. D., Baker, A. R., Biswas, K., Dennis, P. F., Spokes, L. J., Witt, M., and Yeatman, S. G.: Isotopic evidence for a marine ammonia source, Geophys. Res. Lett., 30, 359–376, 2003.
Jung, J., Furutani, H., Uematsu, M., Kim, S., and Yoon, S.: Atmospheric inorganic nitrogen input via dry, wet, and sea fog deposition to the subarctic western North Pacific Ocean, Atmos. Chem. Phys., 13, 411–428, https://doi.org/10.5194/acp-13-411-2013, 2013.
Kanakidou, M., Duce, R. A., Prospero, J. M., Baker, A. R., Benitez-Nelson, C., and Dentener, F. J.: Atmospheric fluxes of organic N and P to the global ocean, Global Biogeochem. Cy., 26, GB3026, https://doi.org/10.1029/2011GB004277, 2012.
Kang, C.-H., Kim, W.-H., Ko, H.-J., and Hong, S.-B.: Asian dust effects on total suspended particulate (TSP) compositions at Gosanin Jeju Island, Korea, Atmos. Res., 94, 345–355, 2009.
Karl, D., Letelier, R., Tupas, L., Dore, J., Christian, J., and Hebel, D.: The role of nitrogen fixation in biogeochemical cycling in the subtropical North Pacific Ocean, Nature, 388, 533–538, 1997.
Kelly, S. D., Stein, C., and Jickells, T. D.: Carbon and nitrogen isotopic analysis of atmospheric organic matter, Atmos. Environ., 39, 6007–6011, https://doi.org/10.1016/j.atmosenv.2005.05.030, 2005.
Kim, T. W., Lee, K., Najjar, R. G., Jeong, H. D., and Jeong, H. J.: Increasing N abundance in the northwestern Pacific Ocean due to atmospheric nitrogen deposition, Science, 334, 505–509, https://doi.org/10.1126/science.1206583, 2011.
Knapp, A. N., Sigman, D. M., and Lipschultz, F.: N isotopic composition of dissolved organic nitrogen and nitrate at the Bermuda Atlantic Time-series Study site, Global Biogeochem. Cy., 19, https://doi.org/10.1029/2004GB002320, 2005.
Knapp, A. N., Hastings, M. G., Sigman, D. M., Lipschultz, F., and Galloway, J. N.: The flux and isotopic composition of reduced and total nitrogen in Bermuda rain, Mar. Chem., 120, 83–89, https://doi.org/10.1016/j.marchem.2008.08.007, 2010.
Knapp, A. N., Sigman, D. M., Lipschultz, F., Kustka, A. B., and Capone, D. G.: Interbasin isotopic correspondence between upper-ocean bulk DON and subsurface nitrate and its implications for marine nitrogen cycling, Global Biogeochem. Cy., 25, GB4004, https://doi.org/10.1029/2010GB003878, 2011.
Knapp, A. N., Sigman, D. M., Kustka, A. B., Sañudo-Wilhelmy, S. A., and Capone, D. G.: The distinct nitrogen isotopic compositions of low and high molecular weight marine DON, Mar. Chem., 136, 24–33, 2012.
Koba, K., Fang, Y., Mo, J., Zhang, W., Lu, X., Liu, L., Zhang, T., Takebayashi, Y., Toyoda, S., Yoshida, N., Suzuki, K., Yoh, M., and Senoo, K.: The15N natural abundance of the N lost from an N-saturated subtropical forest in southern China, J. Geophys. Res.-Biogeo., 117, G02015, https://doi.org/10.1029/2010jg001615, 2012.
Kunwar, B. and Kawamura, K.: One-year observations of carbonaceous and nitrogenous components and major ions in the aerosols from subtropical Okinawa Island, an outflow region of Asian dusts, Atmos. Chem. Phys., 14, 1819–1836, https://doi.org/10.5194/acp-14-1819-2014, 2014.
Lee, K.-S., Lee, D.-S., Lim, S.-S., Kwak, J.-H., Jeon, B.-J., Lee, S.-I., Lee, S.-M., and Choi, W.-J.: Nitrogen isotope ratios of dissolved organic nitrogen in wet precipitation in a metropolis surrounded by agricultural areas in southern Korea, Agr. Ecosyst. Environ., 159, 161–169, https://doi.org/10.1016/j.agee.2012.07.010, 2012.
Lesworth, T., Baker, A. R., and Jickells, T.: Aerosol organic nitrogen over the remote Atlantic Ocean, Atmos. Environ., 44, 1887–1893, https://doi.org/10.1016/j.atmosenv.2010.02.021, 2010.
Letscher, R. T., Hansell, D. A., Carlson, C. A., Lumpkin, R., and Knapp, A. N.: Dissolved organic nitrogen in the global surface ocean: Distribution and fate, Global Biogeochem. Cy., 27, 141–153, 2013.
Li, J., Glibert, P. M., Zhou, M., Lu, S., and Lu, D.: Relationships between nitrogen and phosphorus forms and ratios and the development of dinoflagellate blooms in the East China Sea, Mar. Ecol. Prog. Ser., 383, 11–26, https://doi.org/10.3354/meps07975, 2009.
Liu, D., Fang, Y., Tu, Y., and Pan, Y.: Chemical method for nitrogen isotopic analysis of ammonium at natural abundance, Anal. Chem., 86, 3787–3792, https://doi.org/10.1021/ac403756u, 2014.
Liu, Y., Liggio, J., Staebler, R., and Li, S.-M.: Reactive uptake of ammonia to secondary organic aerosols: kinetics of organonitrogen formation, Atmos. Chem. Phys., 15, 13569–13584, https://doi.org/10.5194/acp-15-13569-2015, 2015.
Lønborg, C., Yokokawa, T., Herndl, G. J., and Álvarez-Salgado, X. A.: Production and degradation of fluorescent dissolved organic matter in surface waters of the eastern north Atlantic ocean, Deep-Sea Res. Pt. I, 96, 28–37, 2015.
Luo, L., Yao, X. H., Gao, H. W., Hsu, S. C., Li, J. W., and Kao, S. J.: Nitrogen speciation in various types of aerosols in spring over the northwestern Pacific Ocean, Atmos. Chem. Phys., 16, 325–341, https://doi.org/10.5194/acp-16-325-2016, 2016.
Luo, L., Kao, S.-J., Bao, H., Xiao, H., Xiao, H., Yao, X., Gao, H., Li, J., and Lu, Y.: Nitrogen in marine aerosol and surface seawater over the Northwest Pacific Ocean in spring, https://doi.pangaea.de/10.1594/PANGAEA.889124, last access: 27 April 2018
Mace, K. A. and Duce, R. A.: On the use of UV photo-oxidation for the determination of total nitrogen in rainwater and water-extracted atmospheric aerosol, Atmos. Environ., 36, 5937–5946, 2002.
Mace, K. A., Kubilay, N., and Duce, R. A.: Organic nitrogen in rain and aerosol in the eastern Mediterranean atmosphere: an association with atmospheric dust, J. Geophys. Res.-Atmos., 108, 4320, https://doi.org/10.1029/2002JD002997, 2003
Matsumoto, K., Yamamoto, Y., Kobayashi, H., Kaneyasu, N., and Nakano, T.: Water-soluble organic nitrogen in the ambient aerosols and its contribution to the dry deposition of fixed nitrogen species in Japan, Atmos. Environ., 95, 334–343, https://doi.org/10.1016/j.atmosenv.2014.06.037, 2014.
Miyazaki, Y., Kawamura, K., Jung, J., Furutani, H., and Uematsu, M.: Latitudinal distributions of organic nitrogen and organic carbon in marine aerosols over the western North Pacific, Atmos. Chem. Phys., 11, 3037–3049, https://doi.org/10.5194/acp-11-3037-2011, 2011.
Miyazaki, Y., Fu, P., Ono, K., Tachibana, E., and Kawamura, K.: Seasonal cycles of water-soluble organic nitrogen aerosols in a deciduous broadleaf forest in northern Japan, J. Geophys. Res.-Atmos., 119, 1440–1454, https://doi.org/10.1002/2013jd020713, 2014.
Mori, I., Nishikawa, M., Tanimura, T., and Quan, H.: Change in size distribution and chemical composition of kosa (Asian dust) aerosol during long-range transport, Atmos. Environ., 37, 4253–4263, 2003.
Morin, S., Savarino, J., Frey, M. M., Domine, F., Jacobi, H. W., Kaleschke, L., and Martins, J. M. F.: Comprehensive isotopic composition of atmospheric nitrate in the Atlantic Ocean boundary layer from 65∘ S to 79∘ N, J. Geophys. Res., 114, D05303, https://doi.org/10.1029/2008jd010696, 2009.
Mulholland, M. R. and Bernhardt, P. W.: The effect of growth rate, phosphorus concentration, and temperature on N2 fixation, carbon fixation, and nitrogen release in continuous cultures of Trichodesmium IMS101, Limnol. Oceanogr, 50, 839–849, 2005.
Nakamura, T., Matsumoto, K., and Uematsu, M.: Chemical characteristics of aerosols transported from Asia to the East China Sea: an evaluation of anthropogenic combined nitrogen deposition in autumn, Atmos. Environ., 39, 1749–1758, 2005.
Needoba, J. A., Foster, R. A., Sakamoto, C., Zehr, J. P., and Johnson, K. S.: Nitrogen fixation by unicellular diazotrophic cyanobacteria in the temperate oligotrophic North Pacific Ocean, Limnol. Oceanogr., 52, 1317–1327, 2007.
Paulot, F., Jacob, D. J., Johnson, M. T., Bell, T. G., Baker, A. R., Keene, W. C., Lima, I. D., Doney, S. C., and Stock, C. A.: Global oceanic emission of ammonia: Constraints from seawater and atmospheric observations, Global Biogeochem. Cy., 29, 1165–1178, https://doi.org/10.1002/2015gb005106, 2015.
Pavuluri, C. M., Kawamura, K., and Fu, P. Q.: Atmospheric chemistry of nitrogenous aerosols in northeastern Asia: biological sources and secondary formation, Atmos. Chem. Phys., 15, 9883–9896, https://doi.org/10.5194/acp-15-9883-2015, 2015.
Piskunov, V. N.: Parameterization of aerosol dry deposition velocities onto smooth and rough surfaces, J. Aero. Sci., 40, 664–679, 2009.
Rolff, C., Elmgren, R., and Voss, M.: Deposition of nitrogen and phosphorus on the Baltic Sea: seasonal patterns and nitrogen isotope composition, Biogeosciences, 5, 1657–1667, https://doi.org/10.5194/bg-5-1657-2008, 2008.
Russell, K. M., Galloway, J. N., Macko, S. A., Moody, J. L., and Scudlark, J. R.: Sources of nitrogen in wet deposition to the Chesapeake Bay region, Atmos. Environ., 32, 2453–2465, https://doi.org/10.1016/S1352-2310(98)00044-2, 1998.
Savarino, J., Morin, S., Erbland, J., Grannec, F., Patey, M. D., Vicars, W., Alexander, B., and Achterberg, E. P.: Isotopic composition of atmospheric nitrate in a tropical marine boundary layer, P. Natl. Acad. Sci. USA, 110, 17668–17673, https://doi.org/10.1073/pnas.1216639110, 2013.
Sigman, D., Casciotti, K., Andreani, M., Barford, C., Galanter, M., and Böhlke, J.: A bacterial method for the nitrogen isotopic analysis of nitrate in seawater and freshwater, Anal. Chem., 73, 4145–4153, https://doi.org/10.1021/ac010088e, 2001.
Sigman, D. M., Granger, J., DiFiore, P. J., Lehmann, M. M., Ho, R., Cane, G., and van Geen, A.: Coupled nitrogen and oxygen isotope measurements of nitrate along the eastern North Pacific margin, Global Biogeochem. Cy., 19, GB4022, https://doi.org/10.1029/2005gb002458, 2005.
Van Engeland, T., Soetaert, K., Knuijt, A., Laane, R., and Middelburg, J.: Dissolved organic nitrogen dynamics in the North Sea: A time series analysis, Estuarine, Coastal and Shelf Science, 89, 31–42, https://doi.org/10.1016/j.ecss.2010.05.009, 2010.
Violaki, K., Sciare, J., Williams, J., Baker, A. R., Martino, M., and Mihalopoulos, N.: Atmospheric water-soluble organic nitrogen (WSON) over marine environments: a global perspective, Biogeosciences, 12, 3131–3140, https://doi.org/10.5194/bg-12-3131-2015, 2015.
Walters, W. W., Goodwin, S. R., and Michalski, G.: Nitrogen Stable Isotope Composition (δ15N) of Vehicle Emitted NOx, Environ. Sci. Technol., 49, 2278–2285, https://doi.org/10.1021/es505580v, 2015.
Wang, B., Clemens, S. C., Liu, P.: Contrasting the Indian and East Asian monsoons: implications on geologic timescales, Mar Geol., 201, 5–21, 2003.
Wang, G. H., Zhou, B. H., Cheng, C. L., Cao, J. J., Li, J. J., Meng, J. J., Tao, J., Zhang, R. J., and Fu, P. Q.: Impact of Gobi desert dust on aerosol chemistry of Xi'an, inland China during spring 2009: differences in composition and size distribution between the urban ground surface and the mountain atmosphere, Atmos. Chem. Phys., 13, 819–835, https://doi.org/10.5194/acp-13-819-2013, 2013.
Wilson, T. W., Ladino, L. A., Alpert, P. A., Breckels, M. N., Brooks, I. M., Browse, J., Burrows, S. M., Carslaw, K. S., Huffman, J. A., Judd, C., Kilthau, W. P., Mason, R. H., McFiggans, G., Miller, L. A., Najera, J. J., Polishchuk, E., Rae, S., Schiller, C. L., Si, M., Temprado, J. V., Whale, T. F., Wong, J. P., Wurl, O., Yakobi-Hancock, J. D., Abbatt, J. P., Aller, J. Y., Bertram, A. K., Knopf, D. A., and Murray, B. J.: A marine biogenic source of atmospheric ice-nucleating particles, Nature, 525, 234–238, https://doi.org/10.1038/nature14986, 2015.
Wozniak, A. S., Willoughby, A. S., Gurganus, S. C., and Hatcher, P. G.: Distinguishing molecular characteristics of aerosol water soluble organic matter from the 2011 trans-North Atlantic US GEOTRACES cruise, Atmos. Chem. Phys., 14, 8419–8434, https://doi.org/10.5194/acp-14-8419-2014, 2014.
Xiao, H.-W., Xiao, H.-Y., Long, A.-M., and Wang, Y.-L.: Who controls the monthly variations of NH nitrogen isotope composition in precipitation?, Atmos. Environ., 54, 201–206, https://doi.org/10.1016/j.atmosenv.2012.02.035, 2012.
Xiao, Q., Ma, Z., Li, S., and Liu, Y.: The impact of winter heating on air pollution in China, PloS one, 10, e011731, https://doi.org/10.1371/journal.pone.0117311, 2015.
Yang, J.-Y. T., Hsu, S.-C., Dai, M. H., Hsiao, S. S.-Y., and Kao, S.-J.: Isotopic composition of water-soluble nitrate in bulk atmospheric deposition at Dongsha Island: sources and implications of external N supply to the northern South China Sea, Biogeosciences, 11, 1833–1846, https://doi.org/10.5194/bg-11-1833-2014, 2014.
Yang, Y. Q., Wang, J. Z., Niu T., Zhou, C., Chen, M., and Liu, J.: The Variability of Spring Sand-Dust Storm Frequency in Northeast Asia from 1980 to 2011. J. Meteorol. Res.-PRC, 27, 119–127, 2013.
Yao, X. H. and Zhang, L.: Supermicron modes of ammonium ions related to fog in rural atmosphere, Atmos. Chem. Phys., 12, 11165–11178, https://doi.org/10.5194/acp-12-11165-2012, 2012.
Yeatman, S., Spokes, L., Dennis, P., and Jickells, T.: Comparisons of aerosol nitrogen isotopic composition at two polluted coastal sites, Atmos. Environ., 35, 1307–1320, https://doi.org/10.1016/S1352-2310(00)00408-8, 2001.
Zamora, L. M., Prospero, J. M., and Hansell, D. A.: Organic nitrogen in aerosols and precipitation at Barbados and Miami: Implications regarding sources, transport and deposition to the western subtropical North Atlantic, J. Geophys. Res.-Atmos., 116, D20309, https://doi.org/10.1029/2011JD015660, 2011.
Zhang, R., Jing, J., Tao, J., Hsu, S.-C., Wang, G., Cao, J., Lee, C. S. L., Zhu, L., Chen, Z., Zhao, Y., and Shen, Z.: Chemical characterization and source apportionment of PM2.5 in Beijing: seasonal perspective, Atmos. Chem. Phys., 13, 7053–7074, https://doi.org/10.5194/acp-13-7053-2013, 2013.
Zhang, S.-P., Xie, S.-P., Liu, Q.-Y., Yang, Y.-Q., Wang, X.-G., and Ren, Z.-P.: Seasonal variations of Yellow Sea fog: observations and Mechanisms, J. Climate, 22, 6758–6772, https://doi.org/10.1175/2009jcli2806.1, 2009.