the Creative Commons Attribution 4.0 License.
the Creative Commons Attribution 4.0 License.
 | 23 Apr 2018
Impacts of aerosols on seasonal precipitation and snowpack in California based on convection-permitting WRF-Chem simulations
Longtao Wu
Jonathan H. Jiang
Hui Su
Nanpeng Yu
Chun Zhao
Yun Qian
Kuo-Nan Liou
Yong-Sang Choi
A version of the WRF-Chem model with fully coupled aerosol–meteorology–snowpack is employed to investigate the impacts of various aerosol sources on precipitation and snowpack in California. In particular, the impacts of locally emitted anthropogenic and dust aerosols, and aerosols transported from outside California are studied. We differentiate three pathways of aerosol effects: aerosol–radiation interaction (ARI), aerosol–snow interaction (ASI), and aerosol–cloud interaction (ACI). The convection-permitting model simulations show that precipitation, snow water equivalent (SWE), and surface air temperature averaged over the whole domain (34–42∘ N, 117–124∘ W, not including ocean points) are reduced when aerosols are included, therefore reducing large biases in these variables due to the absence of aerosol effects in the model. Aerosols affect California water resources through the warming of mountaintops and the reduction of precipitation; however, different aerosol sources play different roles in changing surface temperature, precipitation, and snowpack in California by means of various weights of the three pathways. ARI by all aerosols mainly cools the surface, leading to slightly increased SWE over the mountains. Locally emitted dust aerosols warm the surface of mountaintops through ASI, in which the reduced snow albedo associated with dusty snow leads to more surface absorption of solar radiation and reduced SWE. Transported aerosols and local anthropogenic aerosols play a dominant role in increasing nonprecipitating clouds but reducing precipitation through ACI, leading to reduced SWE and runoff on the Sierra Nevada, as well as the warming of mountaintops associated with decreased SWE and hence lower surface albedo. The average changes in surface temperature from October 2012 to June 2013 are about −0.19 and 0.22 K for the whole domain and over mountaintops, respectively. Overall, the averaged reduction during October to June is about 7 % for precipitation, 3 % for SWE, and 7 % for surface runoff for the whole domain, while the corresponding numbers are 12, 10, and 10 % for the mountaintops. The reduction in SWE is more significant in a dry year, with 9 % for the whole domain and 16 % for the mountaintops. The maximum reduction of ∼ 20 % in precipitation occurs in May and is associated with the maximum aerosol loading, leading to the largest decrease in SWE and surface runoff over that period. It is also found that dust aerosols can cause early snowmelt on the mountaintops and reduced surface runoff after April.
- Article
(7352 KB) -
Supplement
(704 KB) - BibTeX
- EndNote


Water resources in California are derived predominantly from precipitation (mostly during the wintertime) and storage in the snowpack in the Sierra Nevada. Snowpack provides about one-third of the water used by California's cities and farms. The fresh water stored in the snowpack is gradually released through runoff into river flows during the warm and dry season. The amount and timing of snowmelt are critical factors in determining water resources in this region. It is important to understand the factors influencing precipitation and snowpack on a seasonal timescale for water management and hydropower operation.
The 2012–2014 California drought has been attributed to both warming and anomalously low precipitation (Griffin and Anchukaitis, 2014). Previous studies suggested that warming trends are amplified in mountains compared to lowlands (Pepin et al., 2015). The amplified warming in mountain areas, also referred to as elevation-dependent warming, is generally attributed to a few important processes (Pepin et al., 2015) such as water vapor changes and latent heat release, surface water vapor changes, radiative flux changes associated with three-dimensional rugged topography (Gu et al., 2012a; Liou et al., 2013; Lee et al., 2015; Zhao et al., 2016), and snow–albedo feedback (Leung et al., 2004). A review and assessment of the mechanisms contributing to an enhanced warming over mountain areas is given in Pepin et al. (2015).
In addition to the warming effects of greenhouse gases, aerosols may have substantial impacts on water resources in California. Recent observational and numerical modeling studies have shown that aerosol pollutants can substantially change precipitation and snowpack in California (e.g., Rosenfeld et al., 2008a; Qian et al., 2009a; Hadley et al., 2010; Ault et al., 2011; Creamean et al., 2013, 2015; Fan et al., 2014; Oaida et al., 2015). Lee and Liou (2012) illustrated that approximately 26 % of snow albedo reduction from March to April over the Sierra Nevada is caused by an increase in aerosol optical depth (AOD).
In California, aerosols can be generated locally or transported from remote sources. Among local aerosol types, dust comprises a significant fraction over California (Wu et al., 2017). Based on a 4-month, high-intensity record of size-segregated particulate matter (PM) samples collected from a high-elevation site, Vicars and Sickman (2011) found that the mass concentration of coarse atmospheric PM in the southern Sierra Nevada, California, was dominated by a contribution from dust (50–80 %) throughout the study period. Dust aerosols can exert a significant impact on radiative forcing and regional climate in California through their interaction with radiation (e.g., Zhao et al., 2013a) as well as their role as cloud condensation nuclei (CCN) for cloud formation (e.g., Fan et al., 2014). Anthropogenic aerosols are geographically distributed because of localized emission sources, the short atmospheric residence time, and regional topography. With valleys and surrounding mountain barriers, dispersion of air pollutants is more difficult for locally emitted anthropogenic air pollution. The anthropogenic aerosols can cause changes in atmospheric circulation and regional climate, especially where aerosol concentrations are high and the synoptic atmospheric systems are not prominent (e.g., Qian et al., 2003; Fast et al., 2006; Rosenfeld et al., 2008a; Zhao et al., 2013a).
Besides the local aerosol sources, the atmospheric transport of aerosol pollutants from the Asian continent (e.g., Jiang et al., 2007; Wang et al., 2015; Hu et al., 2016) is also a significant contributor to aerosol loading throughout the Pacific basin. Asian aerosols can reach relatively high concentrations above the marine boundary layer in the western US, representing as much as 85 % of the total atmospheric burden of PM at some sites (VanCuren, 2003). Trans-Pacific dust transport has been found to be particularly relevant in high-elevation regions such as the Sierra Nevada, which typically represents free-tropospheric conditions due to the limited transport of lowland air pollutants and predominance of upper-air subsidence (VanCuren et al., 2005). Observations from the CalWater campaign demonstrated that dust and biological aerosols transported from northern Asia and the Sahara were present in glaciated high-altitude clouds in the Sierra Nevada, coincident with elevated ice nuclei (IN) particle concentrations and ice-induced precipitation (Ault et al., 2011; Creamean et al., 2013).
Aerosols can influence precipitation, snowpack, and regional climate through three pathways: (1) aerosol–radiation interaction (ARI, also known as aerosol direct effect), which can warm the atmosphere but cool the surface, resulting in changes in thermodynamic environment for cloud and precipitation and the delay of the snowmelt (Charlson et al., 1992; Kiehl and Briegleb, 1993; Hansen et al., 1997; Koren et al., 2004; Gu et al., 2006, 2016, 2017); (2) aerosol–cloud interaction (ACI, also known as aerosol indirect effect), which is related to aerosols serving as CCN and IN. By changing the size distribution of cloud droplets and ice particles, aerosols may affect cloud microphysics, radiative properties and precipitation efficiency and thus affect the atmospheric hydrological cycle and energy balance (Twomey, 1977; Jiang and Feingold, 2006; Rosenfeld et al., 2008b; Qian et al., 2009b; Gu et al., 2012b). (3) Aerosol–snow interaction (ASI) occurs when aerosols (mainly absorbing aerosols, such as dust and black carbon) are deposited on snowpack. They can reduce snow albedo and affect snowmelt (Warren and Wiscombe, 1985; Jacobson, 2004; Flanner et al., 2007; Qian et al., 2011, 2015; Zhao et al., 2014). Numerical experiments have shown that ARI reduces the surface downward radiation fluxes, cools the surface, and warms the atmosphere over California (Kim et al., 2006; Zhao et al., 2013a), which could subsequently impact clouds, precipitation, and snowpack. In a 2-D simulation, Lynn et al. (2007) shows that ACI decreases orographic precipitation by 30 % over the length of the mountain slope. Fan et al. (2014) showed that ACI increases the accumulated precipitation of an atmospheric river event by 10–20 % from the Central Valley to the Sierra Nevada due to a ∼ 40 % increase in snow formation. Snow impurities (ASI) increase ground temperature, decrease snow water, shorten snow duration, and cause earlier runoff (Jacobson, 2004; Painter et al., 2007, 2010; Qian et al., 2009a; Waliser et al., 2011; Oaida et al., 2015).
Although recent studies showed that aerosols can substantially influence precipitation and snowpack in California, they focused only on one of the aerosol sources or on a single event or pathway. A complete account of the aerosol impacts from different sources through three pathways on regional climate in California has not been presented yet. The objective of this study is to investigate the impacts of various aerosol sources on seasonal precipitation and snowpack in California. A fully coupled high-resolution aerosol–meteorology–snowpack model will be used. We will distinguish and quantify the impacts of aerosols from local emissions and transport, and the roles of different prevailing aerosol types in California, particularly dust and anthropogenic aerosols. In Sect. 2, we describe the WRF-Chem model employed and experiments designed to understand the impact of aerosols on precipitation and snowpack in California. Results from model simulations are discussed in Sect. 3. Concluding remarks are given in Sect. 4.
This study uses a version of the Weather Research and Forecasting (WRF) model with chemistry (WRF-Chem; Grell et al., 2005) improved by the University of Science and Technology of China based on the publicly released version 3.5.1 (Zhao et al., 2014). ASI is implemented in this WRF-Chem version by considering aerosol deposition on snowpack and the subsequent radiative impacts through the SNow, ICe, and Aerosol Radiative (SNICAR) model (Zhao et al., 2014). The SNICAR model is a multilayer model that accounts for vertically heterogeneous snow properties and heating and influence of the ground underlying snow (Flanner and Zender, 2005; Flanner et al., 2007, 2009, 2012). The SNICAR model uses the theory from Wiscombe and Warren (1980) and the two-stream, multilayer radiative approximation of Toon et al. (1989). SNICAR simulates snow surface albedo as well as the radiative absorption within each snow layer. It can also simulate aerosol content and radiative effect in snow, and was first used to study the aerosol heating and snow aging in a global climate model by Flanner et al. (2007). Simulated change in snow albedo by SNICAR for a given black carbon concentration in snow has been validated with recent laboratory and field measurements (Brandt et al., 2011; Hadley and Kirchstetter, 2012). A more detailed description of the SNICAR model can be found in Flanner and Zender (2005) and Flanner et al. (2007, 2012).
The MOSAIC (Model for Simulating Aerosol Interactions and Chemistry) aerosol model (Zaveri et al., 2008) with the CBM-Z (carbon bond mechanism) photochemical mechanism (Zaveri and Peters, 1999) is used and coupled with the SNICAR model. The MOSAIC aerosol scheme uses the sectional approach to represent aerosol size distributions with a number of discrete size bins, either four or eight bins in the current version of WRF-Chem (Fast et al., 2006). In this study, aerosol particles are partitioned into four sectional bins with a dry diameter within 0.039–0.156, 0.156–0.625, 0.625–2.5, and 2.5–10.0 µm. The 4-bin approach has been examined in dust simulations and proved to reasonably produce dust mass loading and AOD compared with the 8-bin approach (Zhao et al., 2013b). All major aerosol components including sulfate, nitrate, ammonium, black carbon, organic matter, sea salt, and mineral dust are simulated in the model. The MOSAIC aerosol scheme includes physical and chemical processes of nucleation, condensation, coagulation, aqueous phase chemistry, and water uptake by aerosols. Dry deposition of aerosol mass and number is simulated following the approach by Binkowski and Shankar (1995), which includes both particle diffusion and gravitational effects. Wet removal of aerosols by grid-resolved stratiform clouds/precipitation includes in-cloud removal (rainout) and below-cloud removal (washout) by impaction and interception, following Easter et al. (2004) and Chapman et al. (2009). In this study, ice-borne aerosols are not explicitly treated in the model but the removal of aerosols by the droplet freezing process is considered. Aerosol optical properties such as extinction, single-scattering albedo (SSA), and asymmetry factor for scattering are computed as a function of wavelength for each model grid box. Aerosols are assumed internally mixed in each bin, i.e., a complex refractive index is calculated by volume averaging for each bin for each chemical constituent of aerosols (Barnard et al., 2010; Zhao et al., 2013a). The Optical Properties of Aerosols and Clouds data set (Hess et al., 1998) is used for the shortwave (SW) and longwave (LW) refractive indices of aerosols, except that a constant value of 1.53 + 0.003i is used for the SW refractive index of dust following Zhao et al. (2010, 2011). A detailed description of the computation of aerosol optical properties in WRF-Chem can be found in Fast et al. (2006) and Barnard et al. (2010).
ARI is included in the radiation scheme as implemented by Zhao et al. (2011). The optical properties and direct radiative forcing of individual aerosol species in the atmosphere are diagnosed following the methodology described in Zhao et al. (2013a). The activation and resuspension between dry aerosols and cloud droplets are included in the model as shown in Gustafson et al. (2007). By linking the simulated cloud droplet number with shortwave radiation and microphysics schemes, ACI is effectively simulated in the model (Chapman et al., 2009).
The model setups (Table 1), including the physical schemes used, follow Wu et al. (2017), which showed that the model simulations reasonably captured the distribution and variation in aerosols in the San Joaquin Valley. The model domain covers the western US centered at 38∘ N and 121∘ W, as shown in Fig. 1. The horizontal resolution is 4 km × 4 km together with a vertical resolution of 40 model levels. Model integrations with time steps of 20 s have been performed for 10 months (with the first month used for the model spinup) from 1 September, 2012, at 00:00 UTC to the end of June 2013 to cover the major precipitation and snow seasons. To test the robustness of the results, simulations are also conducted for 2013–2014, and similar results are found. In the following section, our analysis focuses on 2012–2013, while quantitative information on the aerosol impacts for 2013–2014 is provided for comparison.
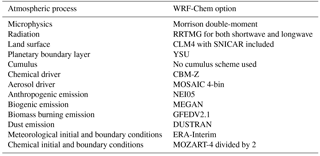

Figure 1Model domain and terrain height (m). 991 DWR sites are represented by black dots; 138 CIMIS stations are represented by red dots; 32 SNOTEL sites are represented by magenta dots.
Note that convective processes are resolved in the 4 km simulations. One important subgrid process in climate models is the representation of deep convection. Parameterizing deep convection is challenging and the use of convection parameterization schemes leads to common errors such as misrepresentation of the diurnal cycle of convective precipitation (e.g., Dai et al., 1999; Brockhaus et al., 2008), underestimation of dry days (e.g., Bergetal., 2013) and precipitation intensity (e.g., Prein et al., 2013; Fosser et al., 2014; Ban et al., 2014), and overestimation of low-precipitation frequency (e.g., Berg et al., 2013). Although recently developed parameterization schemes lead to improvements in the simulation of precipitation intensity (Donner et al., 2011), intraseasonal variability (Benedict et al., 2013), and diurnal cycles (Bechtold et al., 2014), a promising remedy to the error-prone model simulations using convective parameterizations is the use of convection-permitting horizontal resolution with grid spacing of about 4 km or less (e.g., Satoh et al., 2008; Prein et al., 2013; Ban et al., 2014). Advances in high-performance computing allowed the refinement of the model grids well below 10 km. At these scales, convection parameterization schemes may be switched off as deep convection starts to be resolved explicitly (e.g., Weisman et al., 1997). According to Prein et al. (2015), it seems prudent to use horizontal grid spacing of 4 km or less for convection-permitting model simulations. The 4 km simulation can also represent topography and inhomogeneous distribution of anthropogenic emission and precipitation better, leading to a better representation of aerosol distribution compared to the 20 km simulation (Wu et al., 2017).
Since the model explicitly considers different sources and types of aerosols and contains the physical processes to represent various aerosol effects (ARI, ASI, and ACI), it is useful to decompose the aerosol effects based on aerosol sources, types and pathways. Note that the overall aerosols effects are not a simple sum of different aerosol sources and types, nor a linear combination of the ARI, ASI, and ACI effects. Differences between various simulations, however, help to identify the effect of a single source or pathway and the decomposition approach is common practice in the experimental design of modeling studies. To examine the overall aerosol effects and the roles of locally generated and transported aerosols, the following five experiments have been designed (Table 2):
-
CTRL is the control experiment with all aerosol emissions and transport included in the simulation.
-
NoLocDust is performed without any local dust emission. Differences between the CTRL and NoLocDust experiments illustrate the effect of locally emitted dust aerosols.
-
NoLocAnth is similar to NoLocDust, except that emissions of local anthropogenic aerosols are turned off. A comparison between CTRL and this experiment will elucidate the effect of local anthropogenic aerosols.
-
In NoTran the initial and boundary chemical conditions in the CTRL simulation are taken from the global Model for Ozone and Related Chemical Tracers, version 4 (MOZART-4; Emmons et al., 2010). The chemical species transported into the model domain include organic carbon, black carbon, sulfate, nitrate, ammonium, sea salt, dust, etc. In the NoTran experiment, aerosols transported from outside the model domain, including those from East Asia and other regions, are not considered by setting the lateral boundary conditions for aerosols to zero. Differences between CTRL and NoTran will show the effect of transported aerosols.
-
CLEAN is performed without any local aerosol emissions or transport from outside the model domain, while all the transported chemical species are kept, and therefore represents a clean condition scenario. Aerosols are low in the simulation, but not zero, possibly due to aerosol chemistry. The CCN concentration at supersaturation of 0.1 % is on the order of 10 cm−3 during most of the CLEAN simulation. The distribution of liquid water path and ice water path in the CLEAN simulation is also similar to that in the CTRL simulation, with differences in magnitude. Differences between the CTRL and CLEAN experiments would illustrate the effects of all primary aerosol types, including those locally emitted and transported from outside the domain.
In order to distinguish the pathways through which the aerosols influence precipitation and snowpack, we also conducted a few other experiments (Table 3):
-
NARI is similar to the CTRL run, except that ARI is not included. A comparison between CTRL and this experiment will elucidate the effect of ARI.
-
NASI is similar to the CTRL run, except that ASI is not included. A comparison between CTRL and this experiment will show the effect of ASI.
-
NARS is similar to the CTRL run, except that both ARI and ASI are not included. By comparing this experiment and CLEAN, the effect due to ACI can be examined.
Table 3Experimental design for various aerosol pathways using the CTRL aerosol emissions.
3.1 Validation of model results
Since our focus is on the changes in precipitation and snowpack due to aerosol effects, we first show the spatial distribution of the averaged results over the period from October 2012 to June 2013 when snow is normally present on the Sierra Nevada. Figure 2 illustrates a few important and relevant variables that the model simulates in the CTRL experiment, including liquid water path (LWP), ice water path (IWP), precipitation, snow water equivalent (SWE), and temperature at 2 m (T2) above the ground. SWE is a common snowpack measurement. It is the amount of water contained within the snowpack and can be regarded as the depth of water over a unit of flat surface that would theoretically result if the entire snowpack melted instantaneously. Here, the model-simulated SWE is the mean value of the accumulated SWE from 3 h model outputs. It is shown that clouds (Fig. 2a, b), precipitation (Fig. 2c), snowpack (Fig. 2d), and surface runoff (Fig. S1 in the Supplement) mostly occur over the Sierra Nevada and Klamath Mountains in northern California. For temperature (Fig. 2e), the Central Valley area appears to be relatively warm with two maxima over the northern and southern parts of the Central Valley, while colder temperatures are found over the mountain ranges. The model-simulated precipitation is compared with corresponding observations from the Parameter elevation Regression on Independent Slopes Model (PRISM, 2004) gridded data product at 4 km resolution (Fig. 2f). Note that the precipitation rate here is for total precipitation, including rainfall and ice-phase particles. The model successfully captures the precipitation pattern observed by the PRISM data set, including the locations of the major precipitation centers, but slightly overestimates the magnitude over the Sierra Nevada.
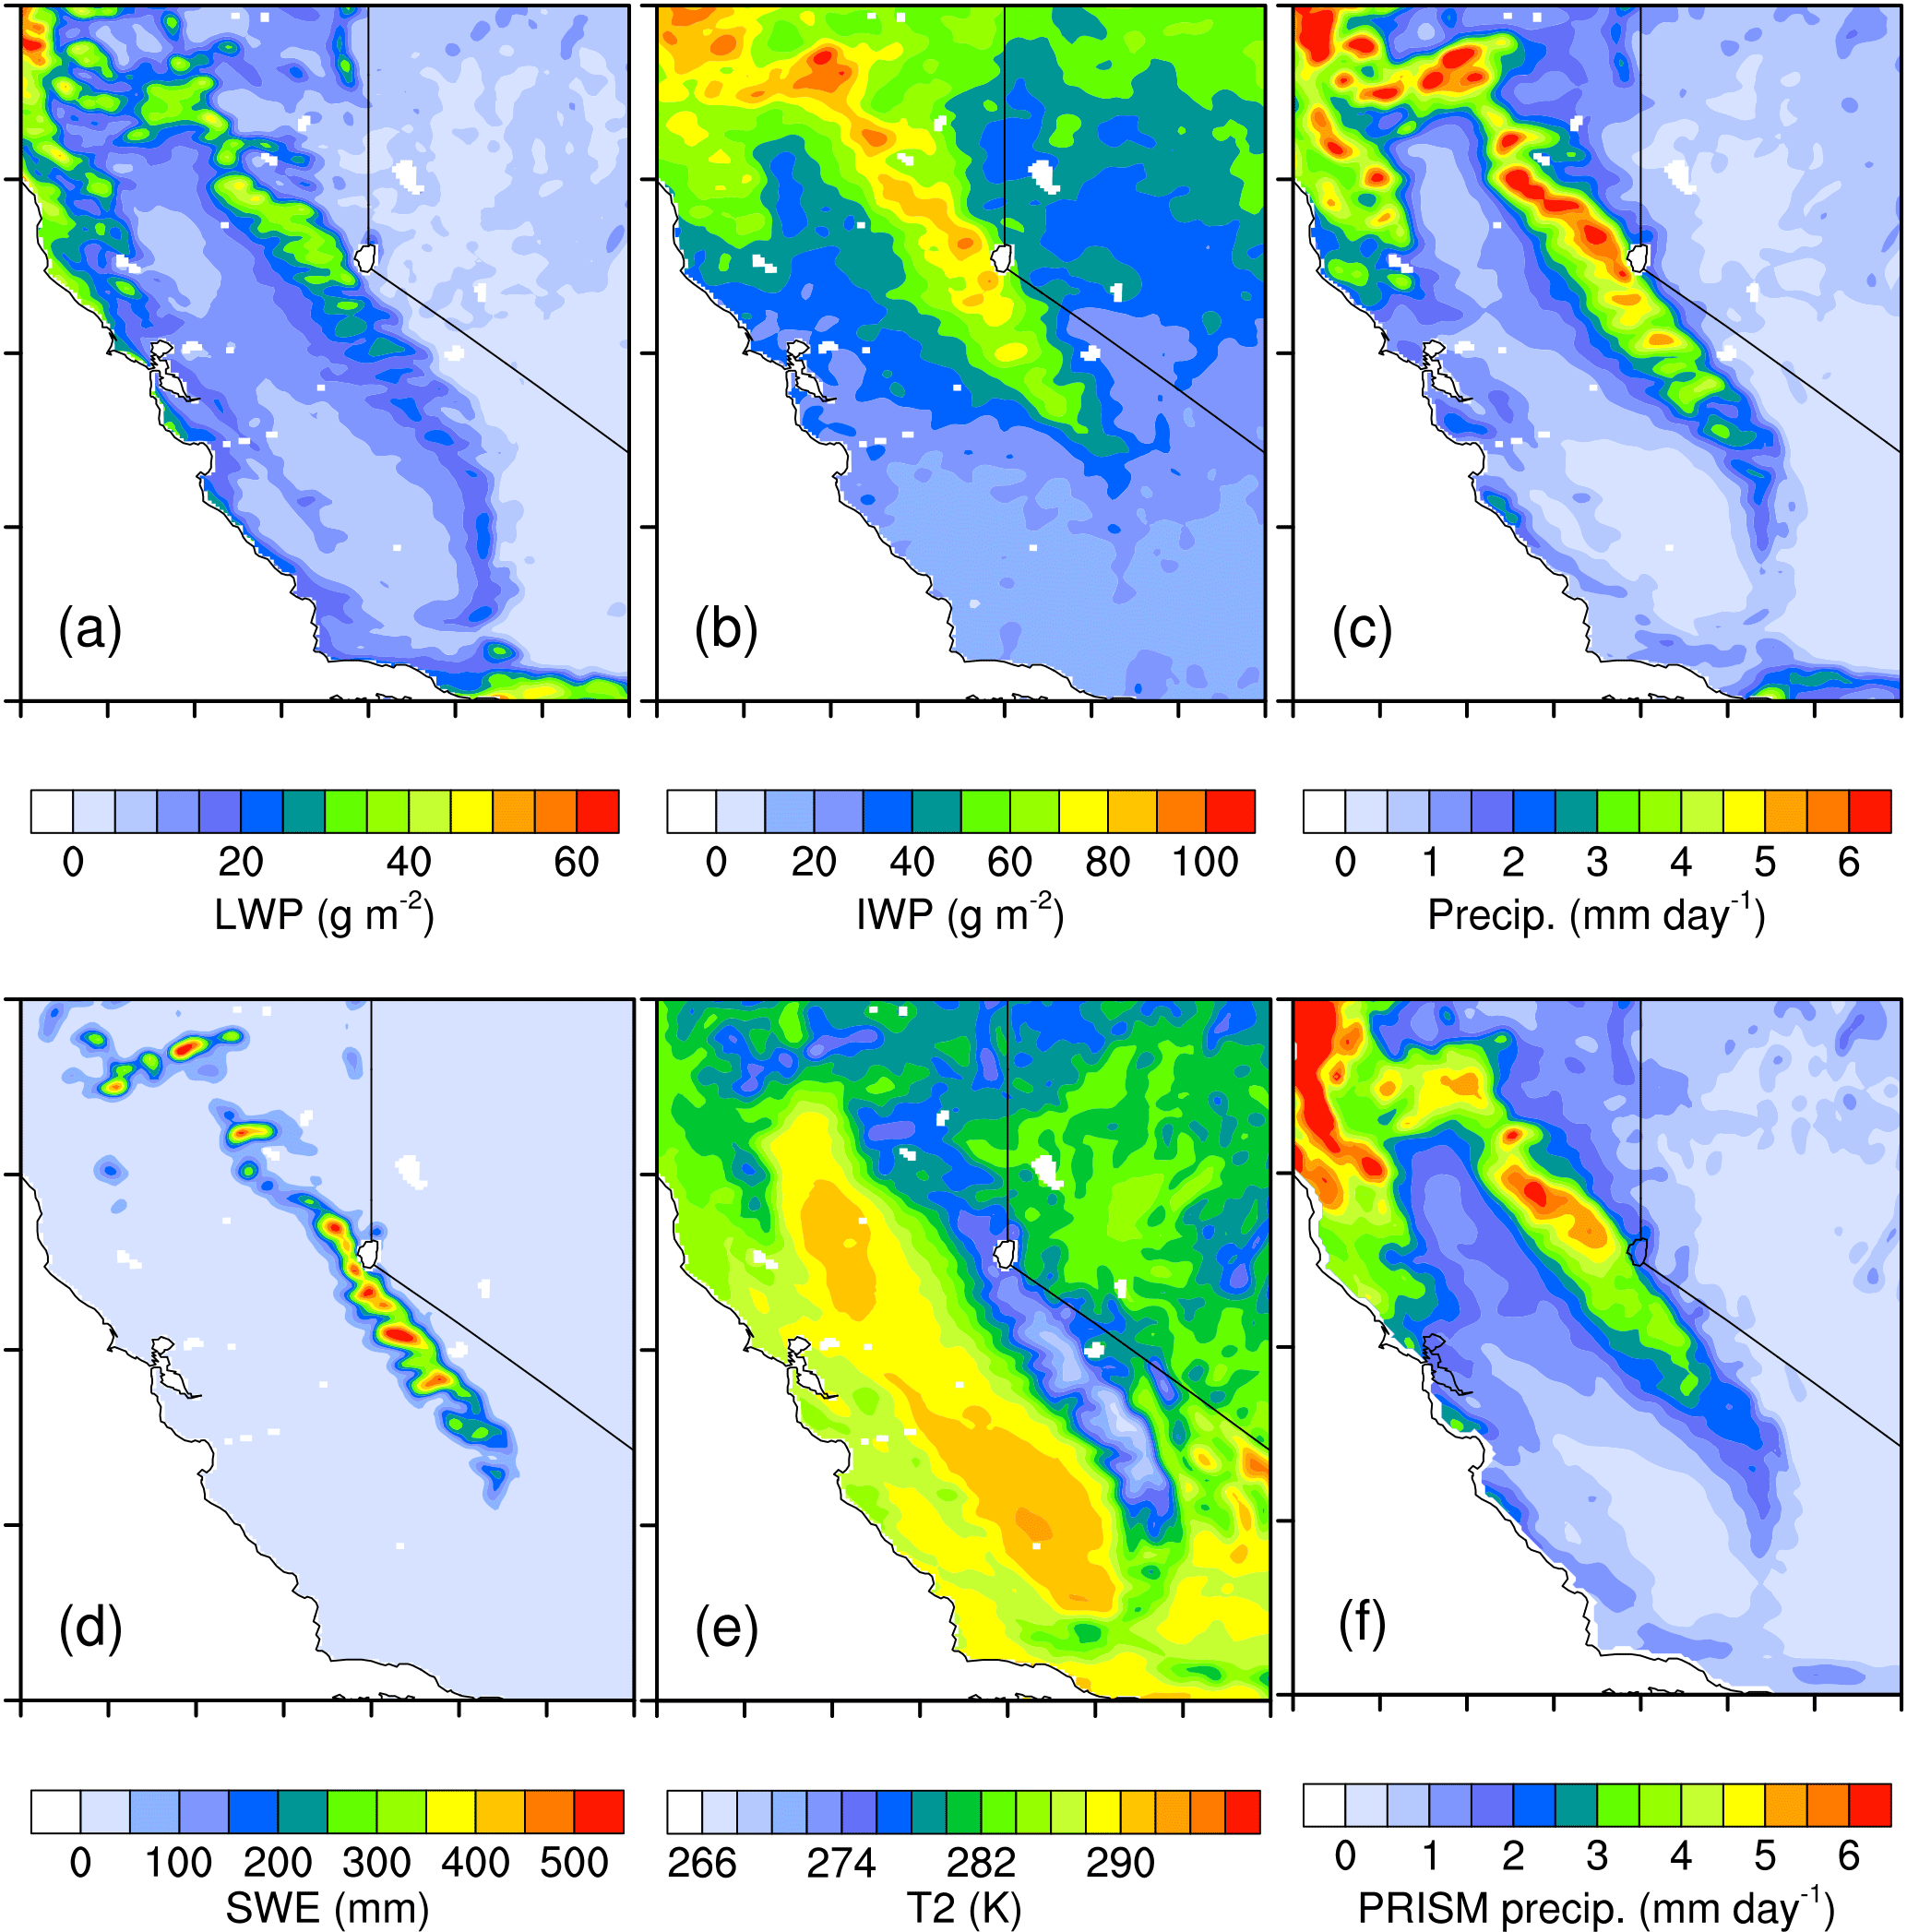
Figure 2Model-simulated (a) LWP (g m−2), (b) IWP (g m−2), (c) precipitation (mm day−1), (d) SWE (mm), and (e) temperature at 2 m, T2 (K) from the CTRL simulation, and (f) PRISM observed precipitation (mm day−1), averaged from October 2012 to June 2013.
In order to validate the simulated seasonal variations, the monthly mean model-simulated precipitation and T2 are compared with the observations (Fig. 3a, c). Model data are sampled onto observational sites before the comparison is conducted. For precipitation observations, besides the PRISM product, we employ the Climate Prediction Center (CPC) Unified Gauge-Based Analysis of Daily Precipitation product (Chen et al., 2008) at resolution and the gauge measurements from Department of Water Resources (DWR). Observed air temperatures are obtained from the California Irrigation Management Information System (Snyder, 1984). For SWE, daily accumulated SWE simulations are compared with measurements collected at Snow Telemetry (SNOTEL) stations. SNOTEL SWE is measured using a snow pillow sensor and biases in SWE measurement could occur when temperature differences between surrounding ground cover and the pillow sensor creates an uneven distribution of snow (Meyer et al., 2012). Both under- and overestimation could happen, depending on the snowmelt conditions and the snow density rate of change (Serreze et al., 1999, 2001; Johnson and Marks, 2004).
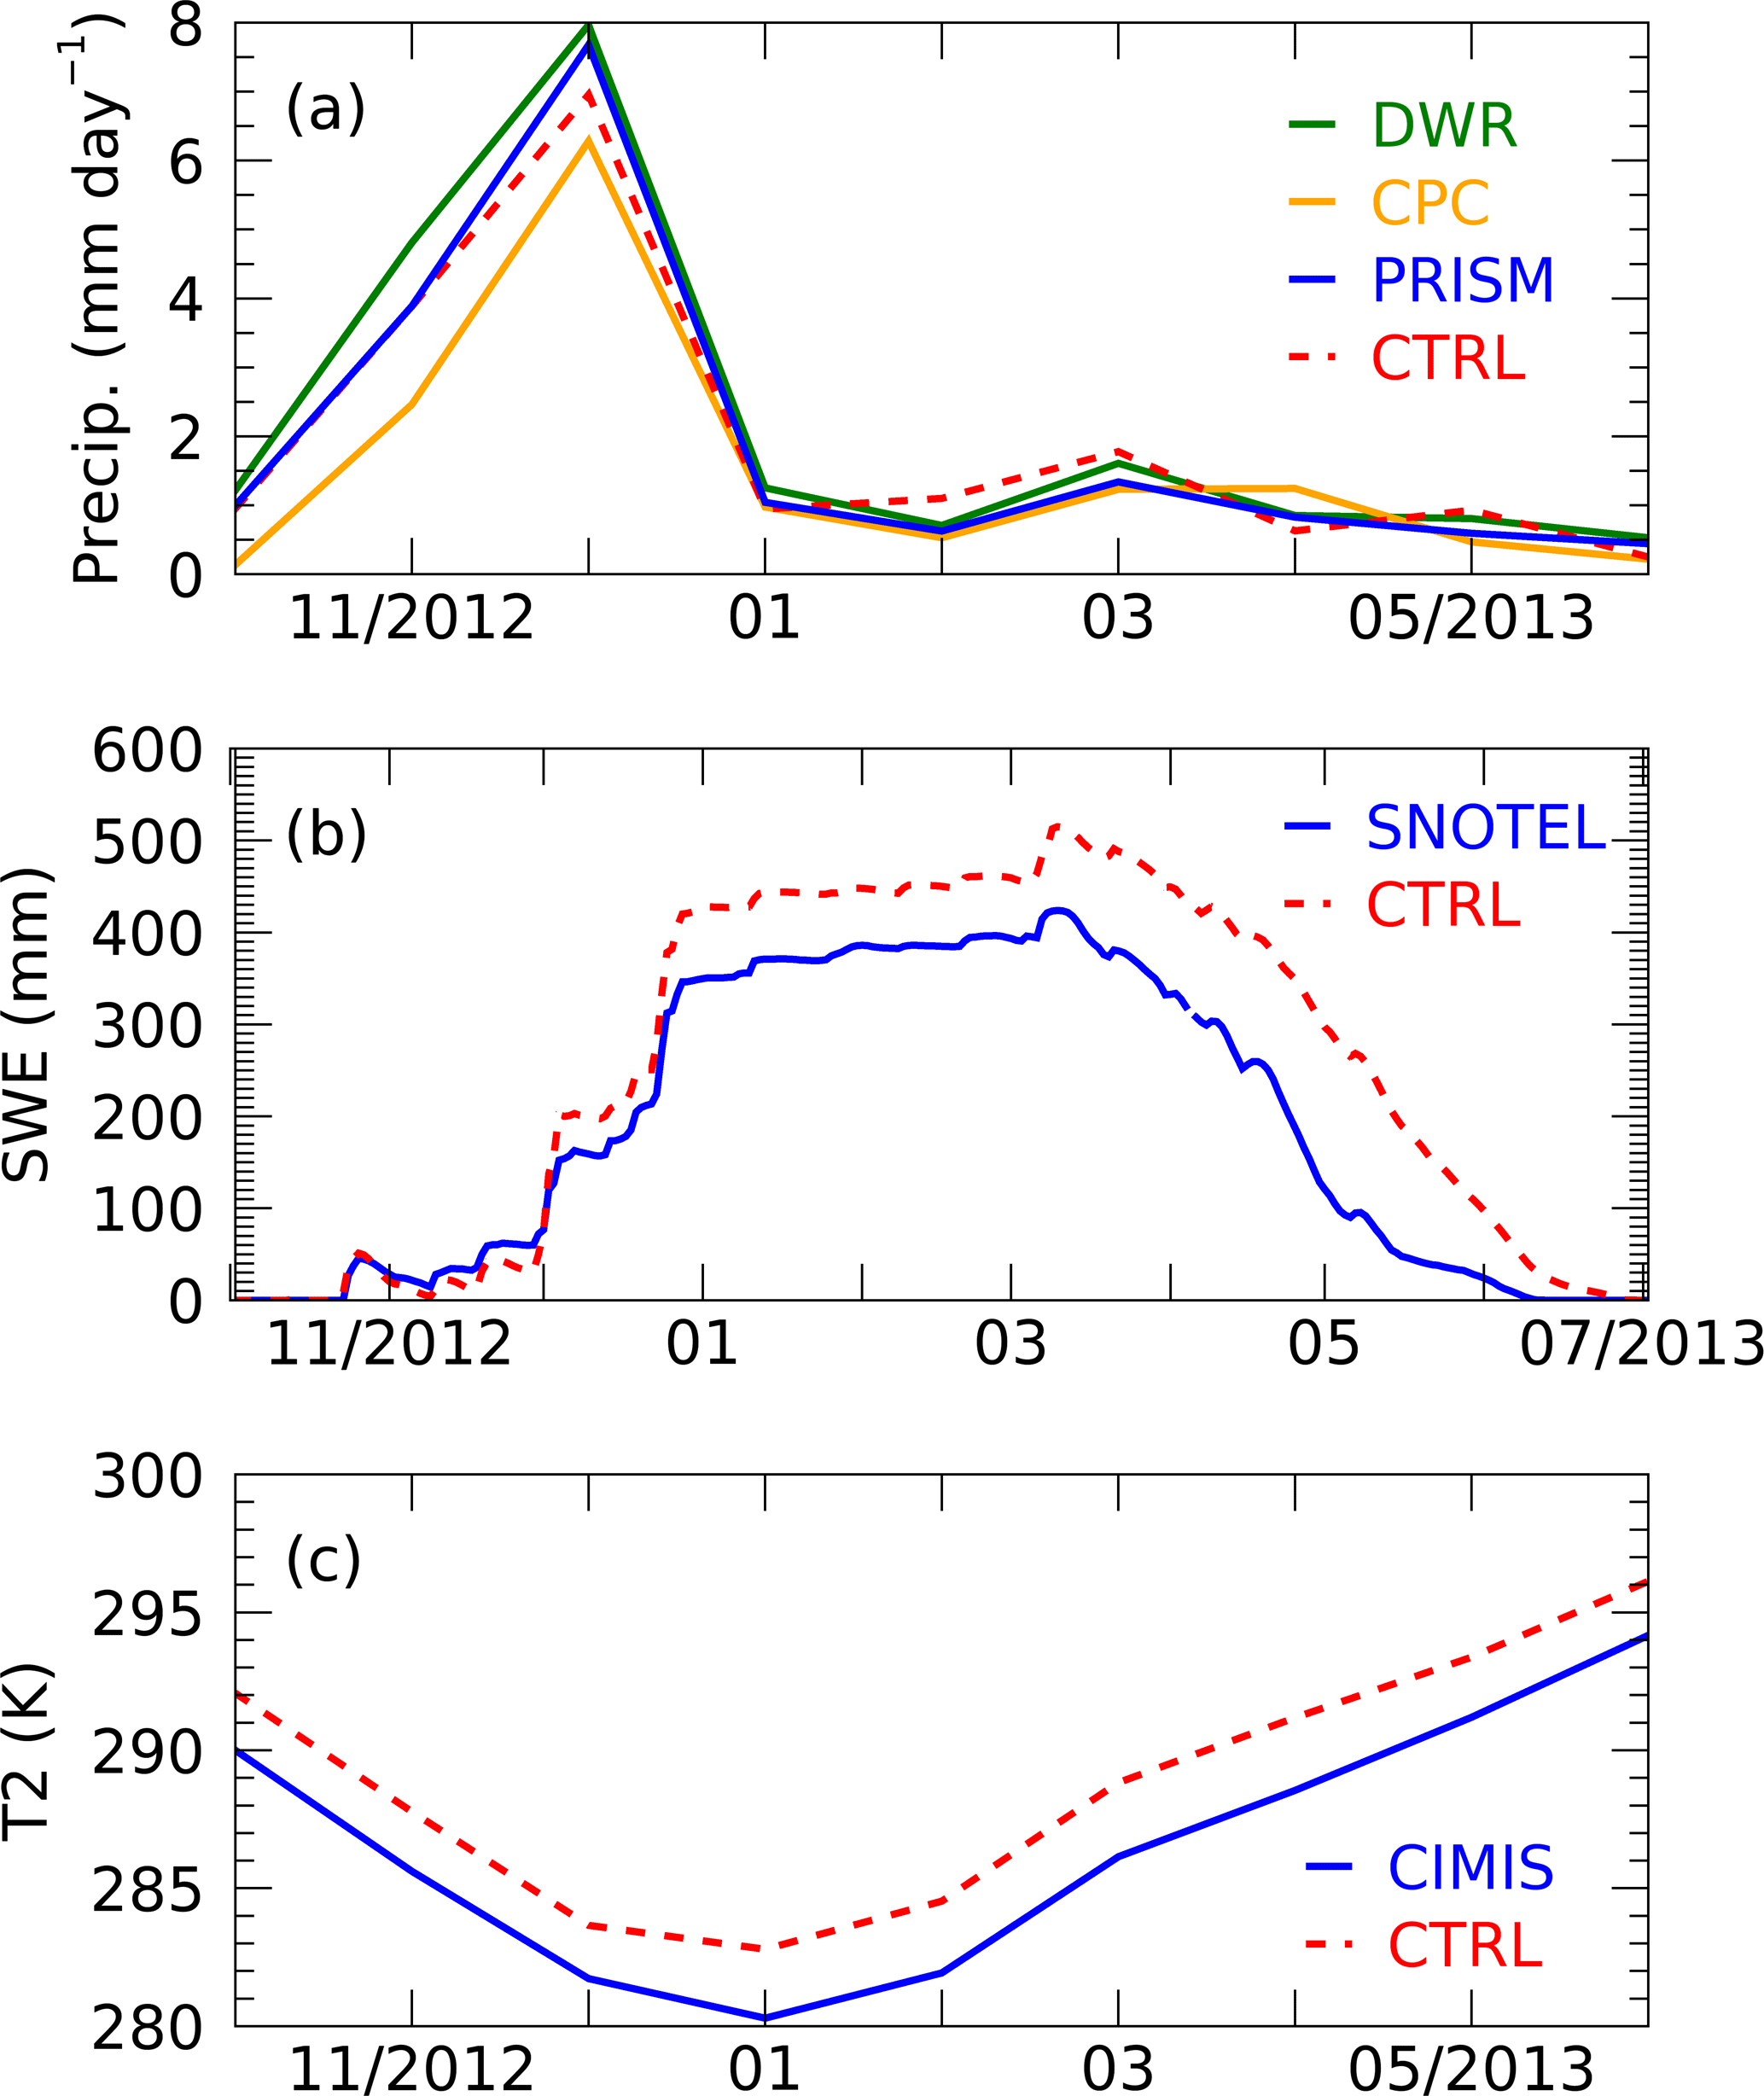
Figure 3(a) Monthly mean precipitation (mm day−1) from the CTRL simulation (red dashed) and PRISM (blue), CPC (orange), and DWR (green) observations. (b) Daily accumulated SWE (mm) from the CTRL simulation (red dashed) and SNOTEL observation (blue). (c) Monthly mean T2 (K) from the CTRL simulation (red) and CIMIS observation (blue). Model data are sampled onto observational sites before the comparison is conducted.
It is shown that the model captures the maximum precipitation in December, with the magnitude falling between the observations from CPC and PRISM/DWR during winter, which is the rainy season in California (Fig. 3a). In the relatively dry months from February to June, the simulated precipitation has a similar magnitude to the observations, with a slight overestimation or underestimation in different months. For SWE, the model simulations represent seasonal variations of SWE with the maximum between March and April (Fig. 3b), but the model overestimates the SWE amount compared to SNOTEL. While the model overestimates the surface temperature in magnitude, it captures the seasonal variations well, including the highest and lowest temperatures in July and January, respectively (Fig. 3c).
The aerosols simulated over California using this model have been validated extensively in Wu et al. (2017) by comparing them to observations, such as MISR (Multiangle Imaging Spectroradiometer), AERONET (AErosol RObotic NEtwork) AOD, CALIPSO (Cloud-Aerosol Lidar and Infrared pathfinder Satellite Observation) aerosol extinction, IMPROVE (Interagency Monitoring of Protected Visual Environments) and EPA CSN (National Chemical Speciation Network operated by Environmental Protection Agency) aerosol speciation. It has been shown than the model simulation used in this study reasonably captures the distribution and seasonal variation in aerosols during the cold season from October to March. The simulation of aerosols in the warm season from April to September (especially from July to September) has larger low biases than in the cold season, mainly due to poor simulations of dust emission and vertical mixing. Because precipitation and snow mainly occur in October–June, we focus on the simulations from October to June which have relatively good performance for aerosol simulations in this study.
Here, we present the distributions of AOD averaged from October 2012 to June 2013 for the MISR (Diner et al., 1998) observation and all aerosols in the CTRL simulation. We also present locally emitted aerosols and those transported from outside the model domain, derived from the difference between the CTRL simulation and the corresponding experiment (NoLocAnth, NoLocDust, and NoTran). This will facilitate the understanding of the aerosol effects in different regions and from different sources (Fig. 4). It is shown that the model simulation captures the spatial distribution of AOD in California well, including the maximum over the southern part of the valley area and larger AODs over the lower lands to the southeast of the Sierra Nevada (Fig. 4a, b). Note that the smoother contour in MISR is due to the coarser horizontal resolution (0.5∘) of the MISR data. The distribution of the locally emitted anthropogenic aerosols (Fig. 4c), which are mostly located over the Central Valley and associated with the emissions from local industries and farms, presents a similar pattern to the total AOD and substantially contributes to the maxima AOD over the region. Local dust aerosols mainly reside over the lower lands to the southeast of the Sierra Nevada, while substantial amounts are also seen over the Central Valley (Fig. 4d). Transported aerosols are carried into the domain by atmospheric circulation and widely distributed, with more over the Central Valley due to the trapping of aerosols by the surrounding mountains (Fig. 4e).

Figure 4Spatial distribution of aerosol optical depth (AOD) averaged from October 2012 to June 2013 for (a) MISR observations, (b) all aerosols in the CTRL simulation, (c) local anthropogenic aerosols, (d) local dust aerosols, and (e) transported aerosols from outside the domain, derived from the difference between the CTRL simulation and the corresponding experiment (NoLocAnth, NoLocDust, and NoTran); 10 m wind vectors from the CTRL simulation are shown in (b).
Since the observations on aerosol-in-snow concentrations are rather limited both spatially and temporally, it is very difficult to conduct direct comparisons with model simulations. Here we evaluate the model simulations of snow albedo which is directly affected by the ASI (Fig. S2). The model-simulated snow albedo is compared with the product from NASA Land Data Assimilation Systems (NLDAS; Sheffield et al., 2003) Mosaic (MOS). It is shown that the model simulation provides a rather reasonable estimate of the snow albedo when ASI is included. Overall, the WRF-Chem model that we employ in this study is a reliable tool for examining the impact of aerosols on the seasonal variations of precipitation and snowpack in California, especially over the Sierra Nevada.
3.2 Aerosol effects on precipitation and snowpack
The overall aerosol effects from all aerosol types and sources (including locally emitted and transported) through the three pathways (ARI, ASI, and ACI) can be examined from the differences between the experiments CTRL and CLEAN. The two-tailed Student's t test, in which deviations of the estimated parameter in either direction are considered theoretically possible, is applied to the 3 h data for each experiment in this study to measure the statistical significance of the simulations. Figure 5 shows the differences averaged from October 2012 to June 2013 for precipitation, SWE, and T2, where the dots represent differences in the 3 h data that are statistically significant at above the 90 % level. Due to the aerosol effects, temperature decreases over the Central Valley, where most aerosols are located, while significant warming occurs over the mountaintops (Fig. 5c). Precipitation decreases over the Sierra Nevada (Fig. 5a), consequently leading to decreased SWE (Fig. 5b).
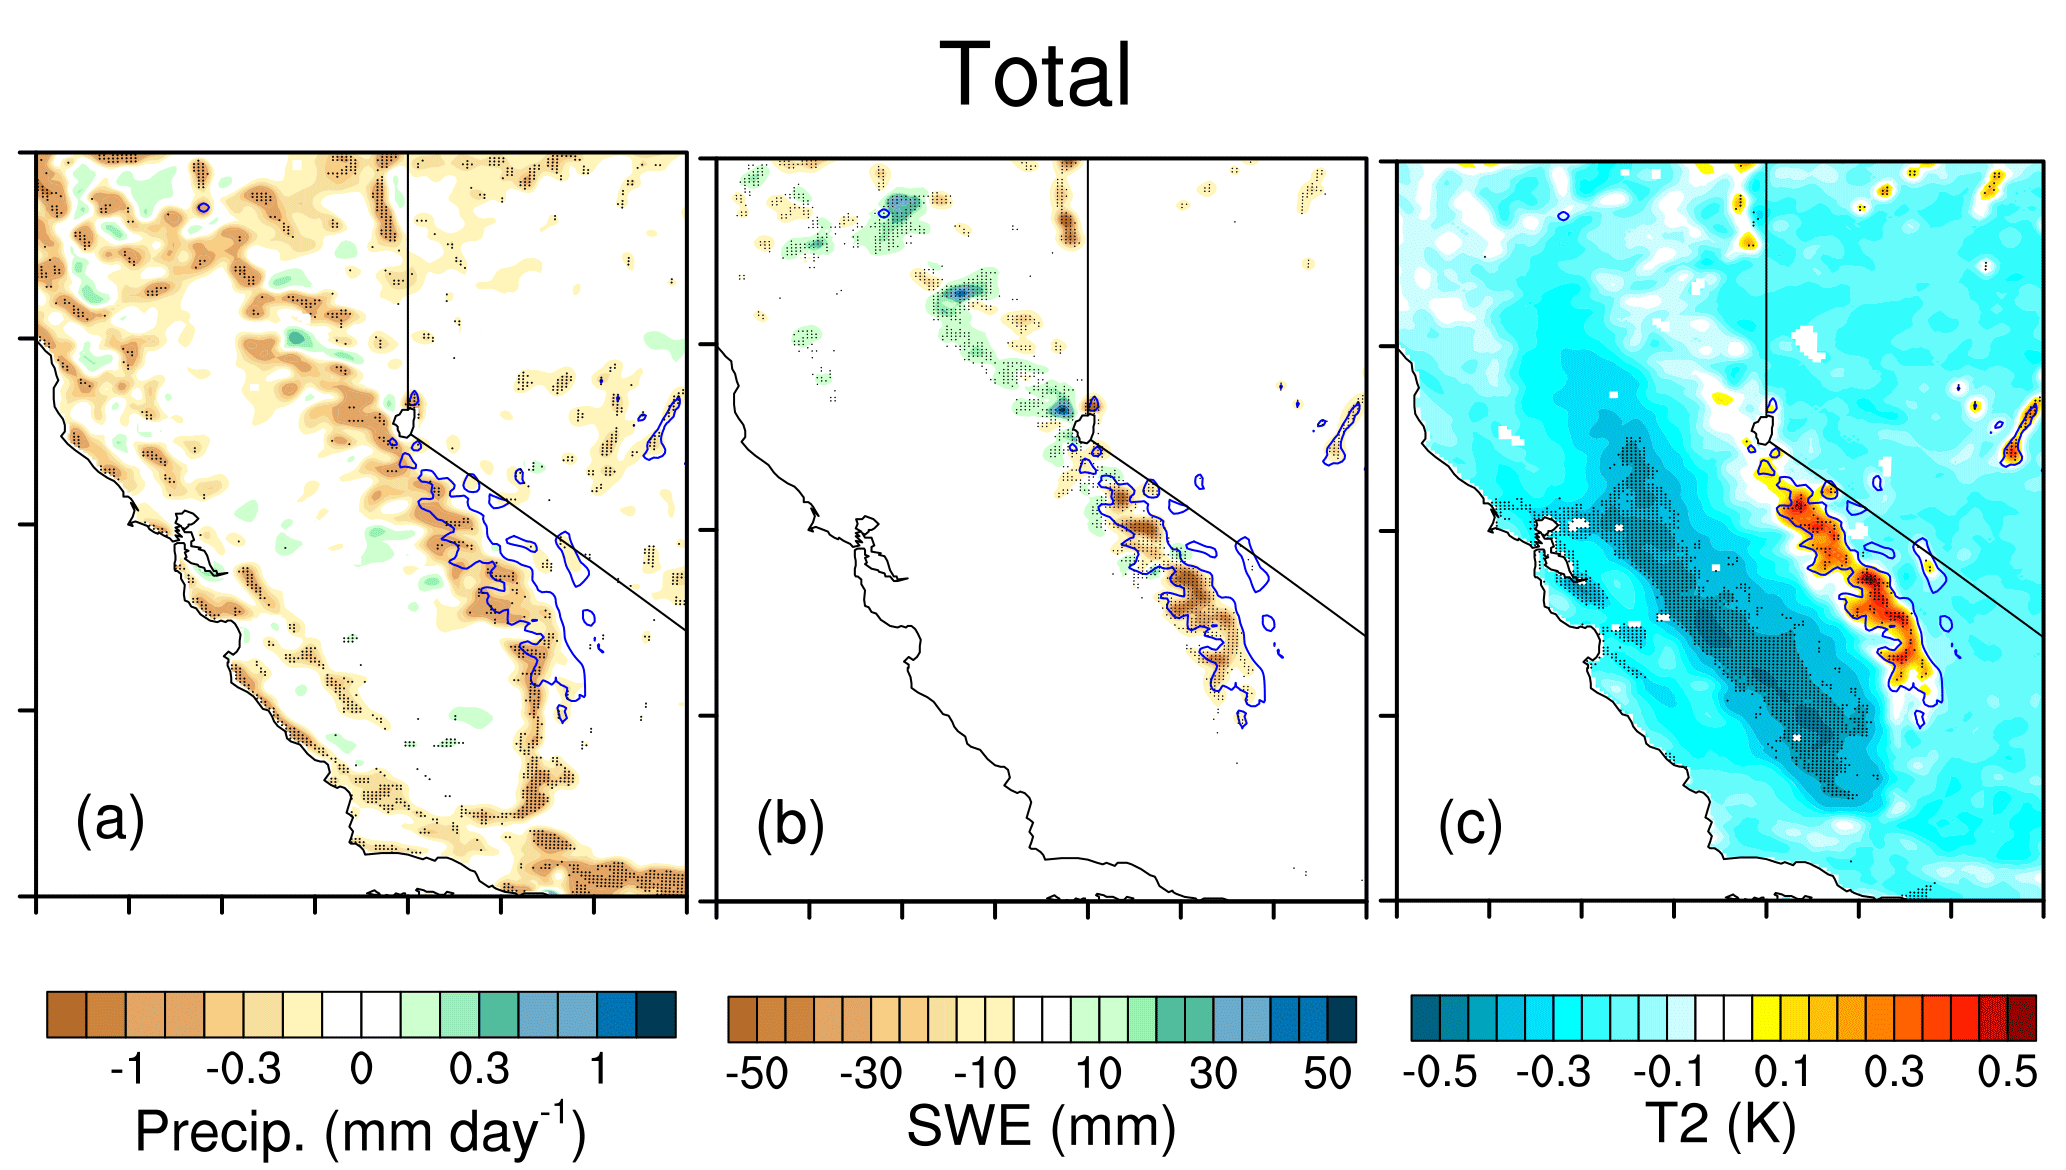
Figure 5Total aerosol effects (CTRL – CLEAN) on spatial distributions of (a) precipitation (mm day−1), (b) SWE (mm), and (c) T2 (K). The dotted area denotes statistical significance above the 90 % confidence level. Blue lines represent the mountaintops with elevation ≥ 2.5 km.
In order to understand how the aerosols affect these important variables, we examine the effects of ARI, ASI, and ACI separately. In the following figures (Figs. 6–12), the differences are statistically significant at the 70 % level. It is seen that the major effect of ARI is to decrease the surface temperature over the whole domain through the scattering and absorption of solar radiation, with the maxima over the Central Valley where the aerosols are mostly located, contributing to the surface cooling caused by the total aerosol effect in that region (Fig. 6c). The ARI induced surface cooling over the Sierra Nevada, although not as strong as over the Central Valley, leads to reduced snowmelt and hence a slight increase in SWE, in contrast to the overall aerosol effect on SWE (Fig. 6b). The effect of ARI on rainfall is not very significant (Fig. 6a). The main effect of ASI is to increase the temperature (Fig. 7c) over the snowy area of the Sierra Nevada through the reduction of snow albedo (Fig. 7d). Hence there is more absorption of solar radiation at the surface, contributing to the reduced SWE over the Sierra Nevada (Fig. 7b). The effect of ASI on precipitation is also minimal.
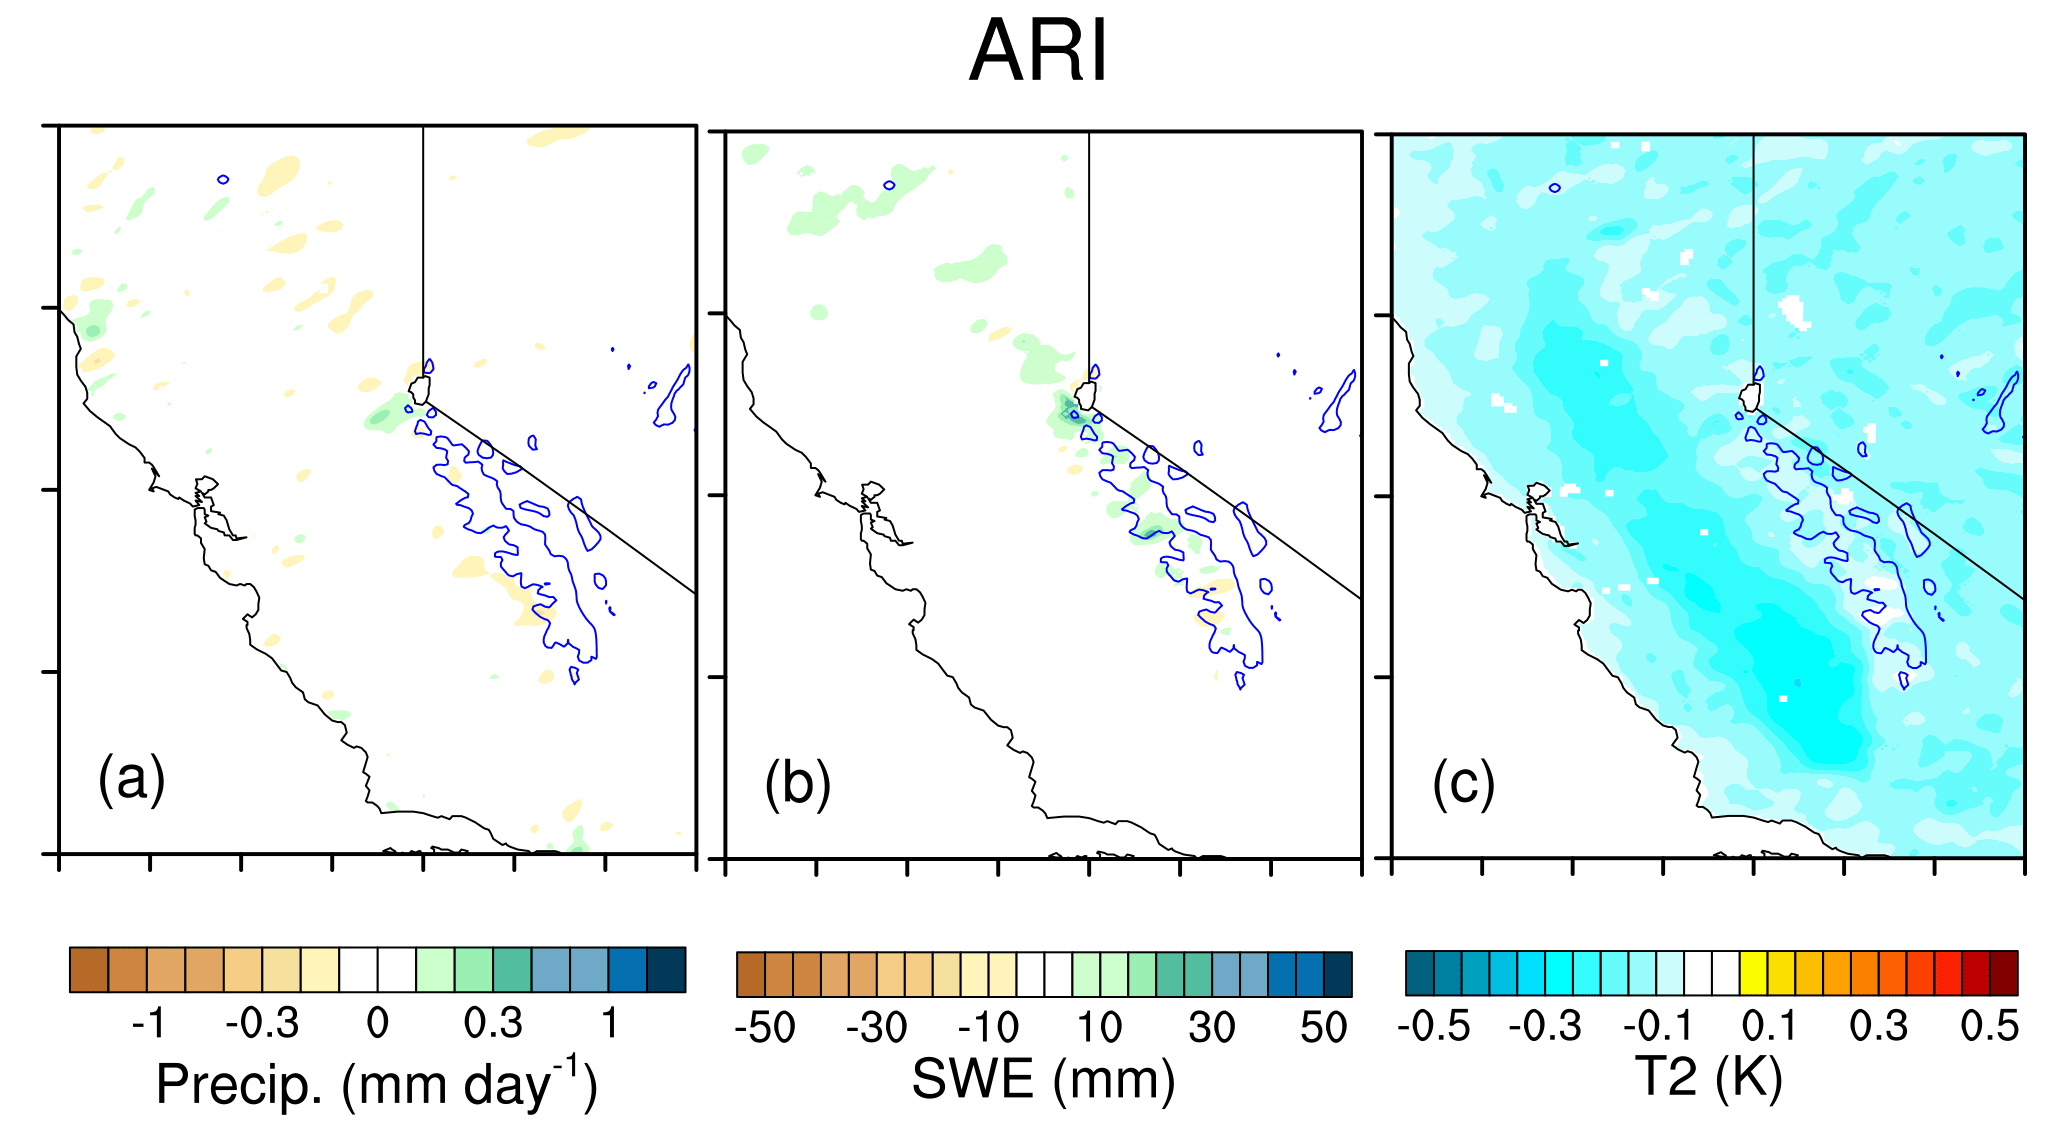
Figure 6ARI effects (CTRL – NARI) on spatial distributions of (a) precipitation (mm day−1), (b) SWE (mm), and (c) T2 (K). Blue lines represent the mountaintops with elevation ≥ 2.5 km.
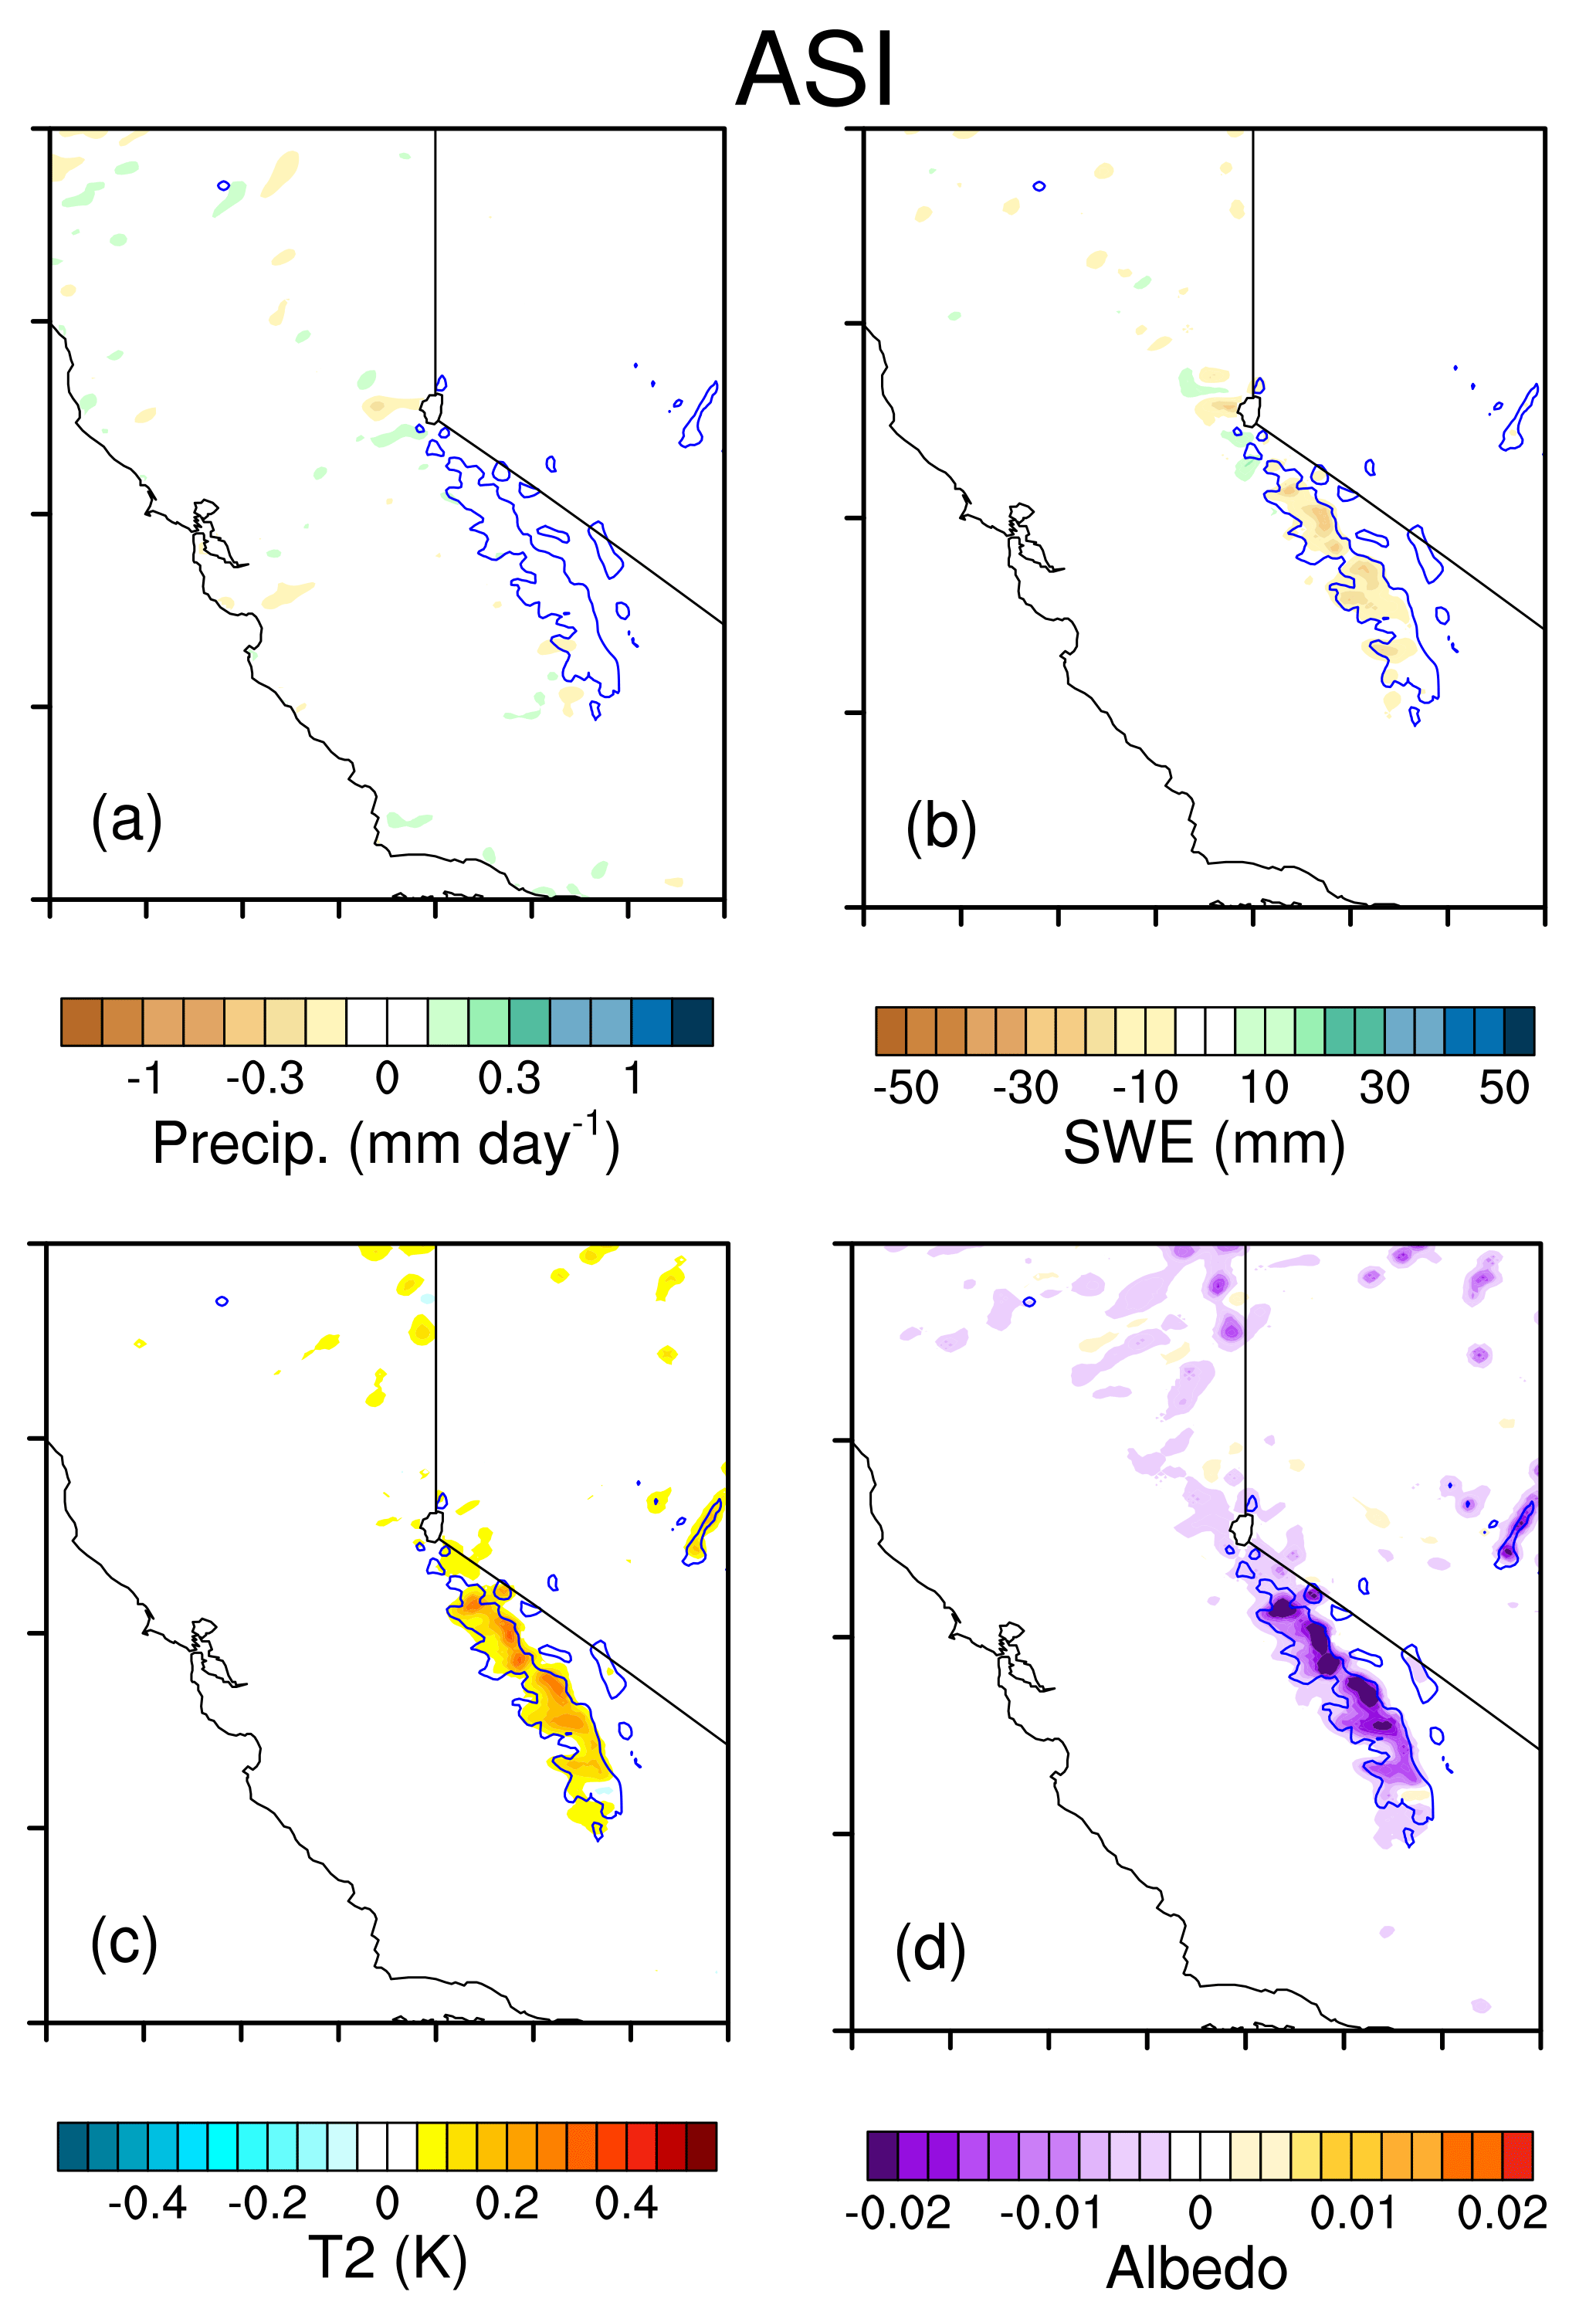
Figure 7ASI effects (CTRL – NASI) on spatial distributions of (a) precipitation (mm day−1), (b) SWE (mm), (c) T2 (K), and (d) surface albedo. Blue lines represent the mountaintops with elevation ≥ 2.5 km.
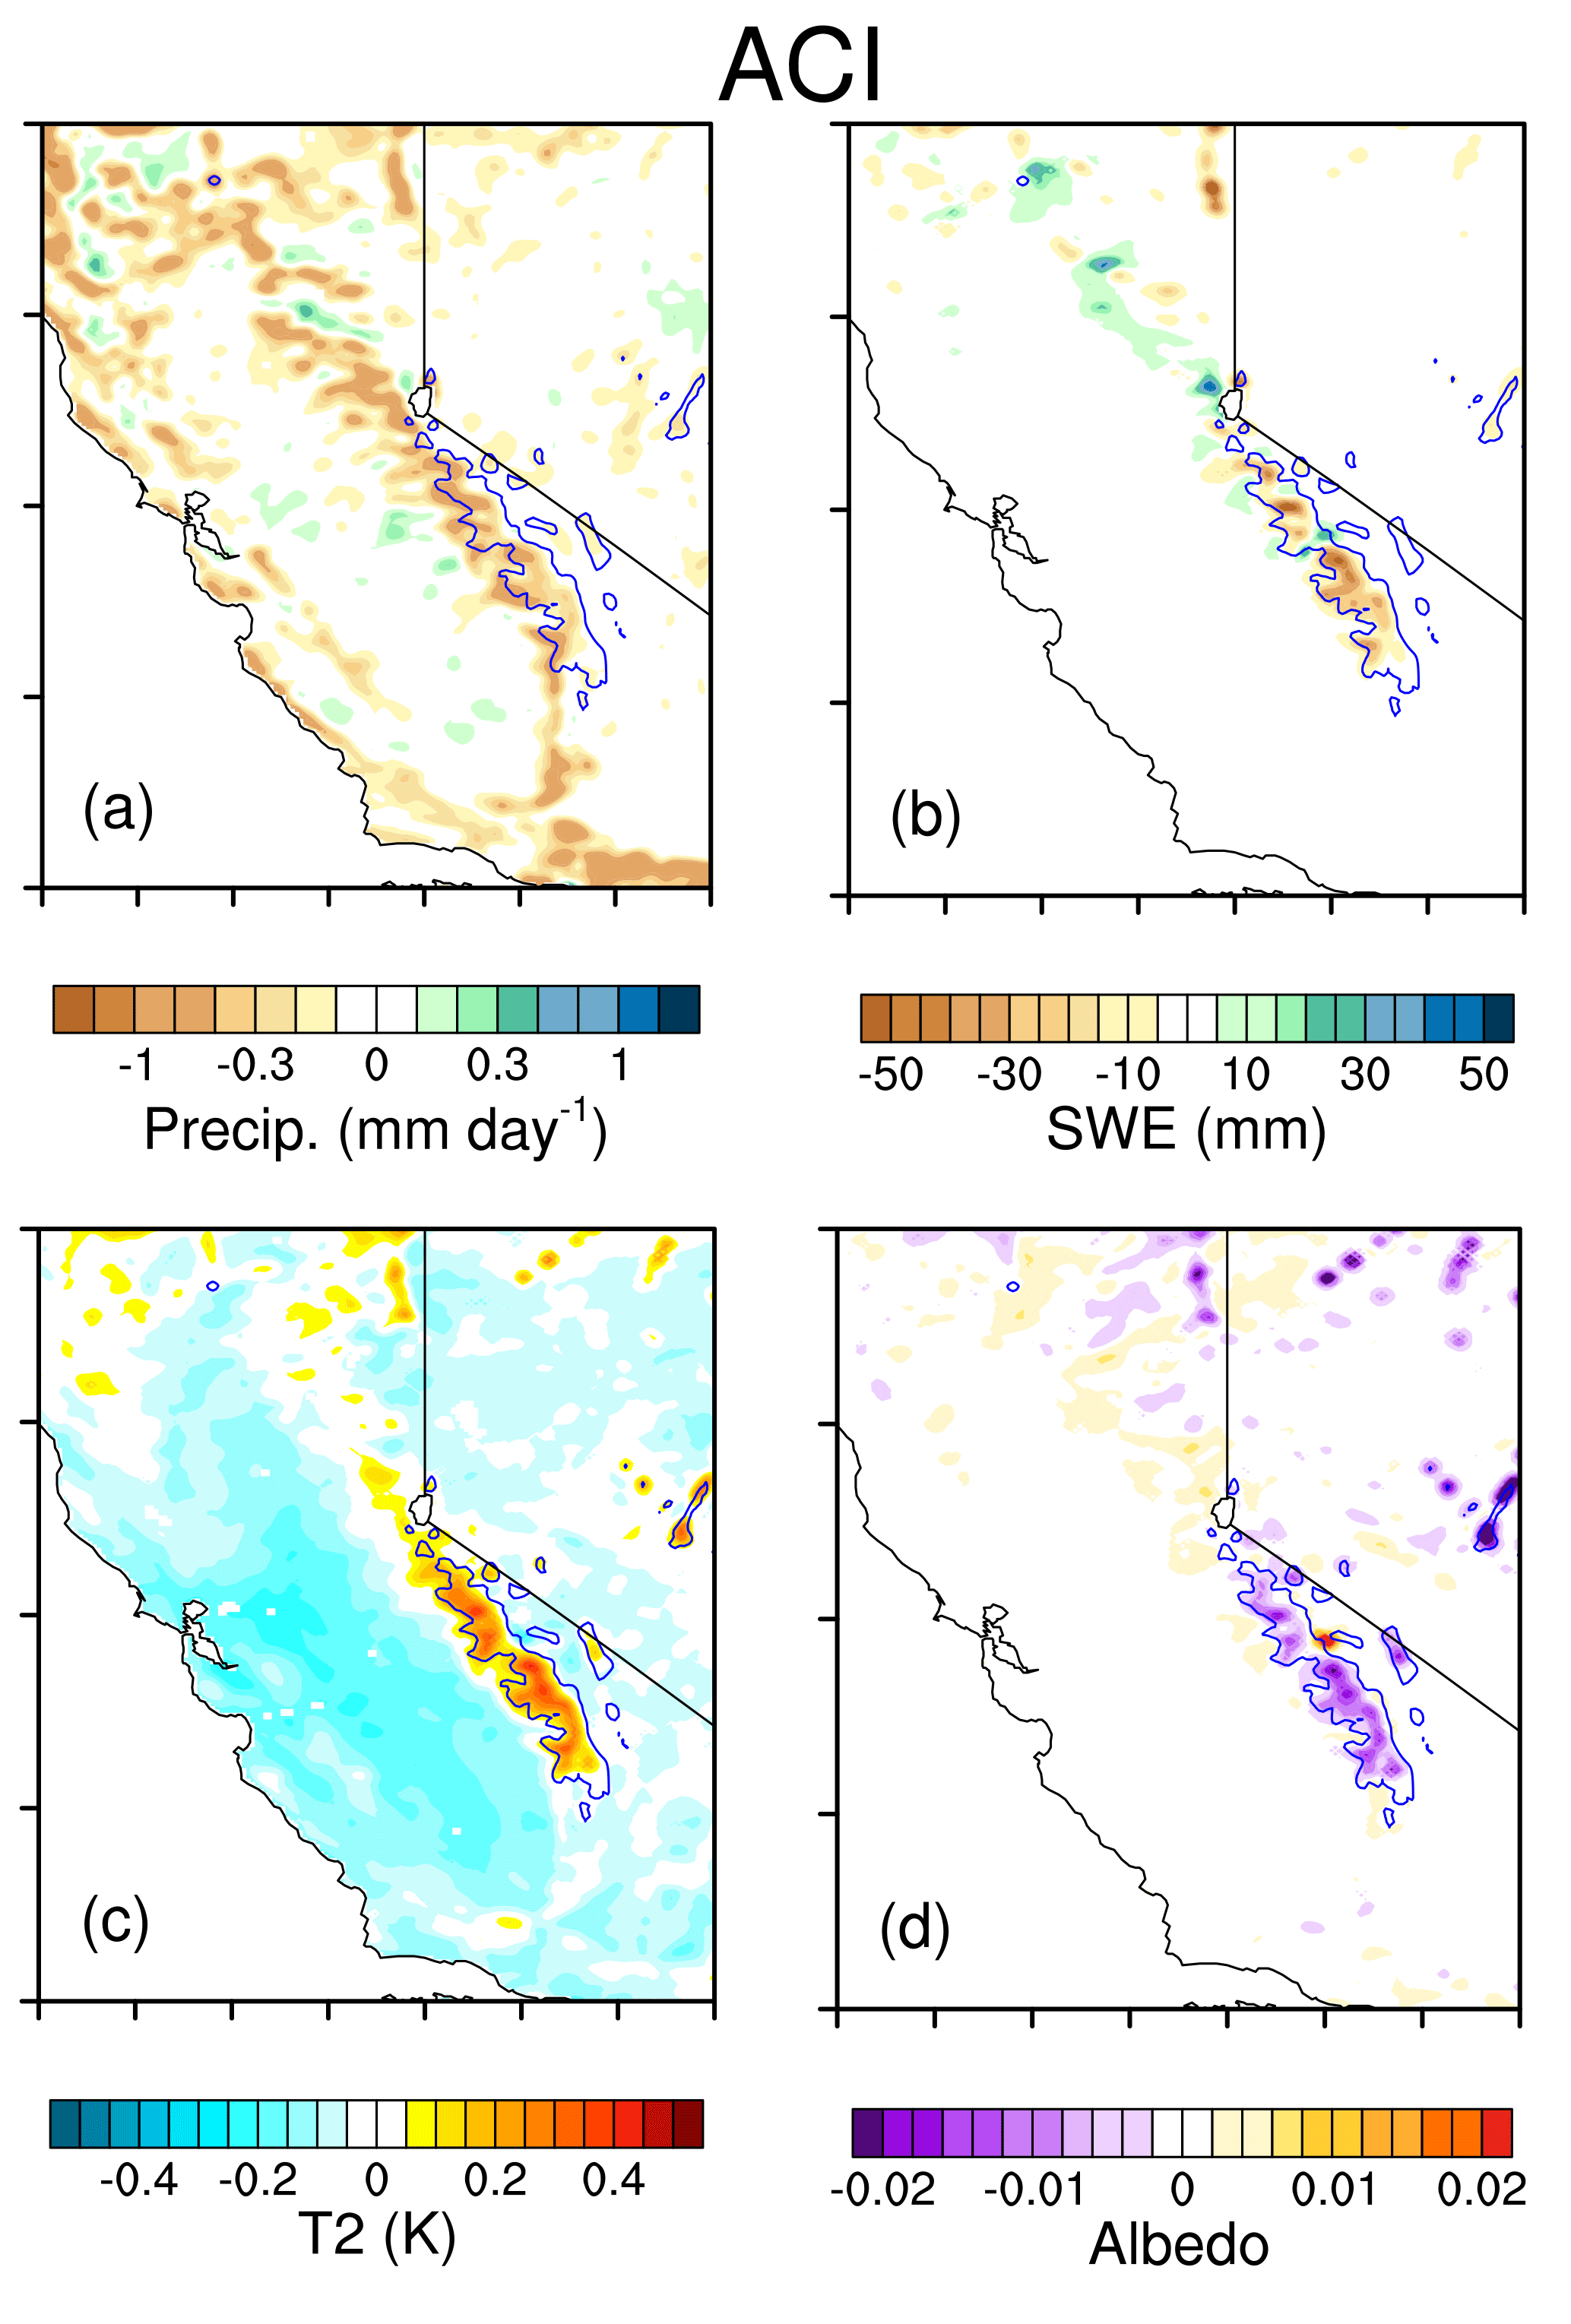
Figure 8 shows the effect of aerosols on clouds through ACI. When more aerosols are present in the atmosphere, more CCN are available for the formation of clouds with smaller cloud droplets. As a result, more nonprecipitating clouds are produced when aerosols are included in the model. The enhanced LWP (Fig. 8a) is primarily produced by the ACI effect (Fig. 8c). There are no significant changes in IWP (including ice, snow, and graupel) because the aerosol effect on ice cloud formation is not explicitly treated in the model. The ACI effect leads to reduced precipitation and less SWE over the mountains (Fig. 9a, b). Temperature decreases over the valley due to more clouds that formed in association with the ACI effect. The increase in temperature over the mountain areas (Fig. 9c) is caused by the reduced snow amount, which results in weaker surface albedo (Fig. 9d) and enhanced solar absorption at the surface, and overwhelms the decrease in temperature which may be caused by an increase in cloud.
Overall, aerosols affect surface temperature, precipitation, and snowpack in California through the three pathways. ACI plays a dominant role in increasing cloud water but reduces precipitation, leading to reduced SWE and surface runoff (Fig. S3) over the Sierra Nevada. ASI also reduces SWE due to the smaller snow albedo associated with dirty snow, leading to more surface absorption and snowmelt. ARI, in contrast, slightly increases SWE through the cooling of the surface. For surface temperature, ARI and ACI contribute together to the cooling of the valley area, while ACI and ASI significantly warm the surfaces of the mountaintops. Note that for the ASI effect, warming of the snow cover area through aerosol induced snow–albedo feedback is the cause of the reduced SWE. For the ACI effect, however, warming over the mountain region is a result of the reduced SWE which can also induce snow–albedo feedback and result in smaller surface albedo and more surface absorption of solar radiation.
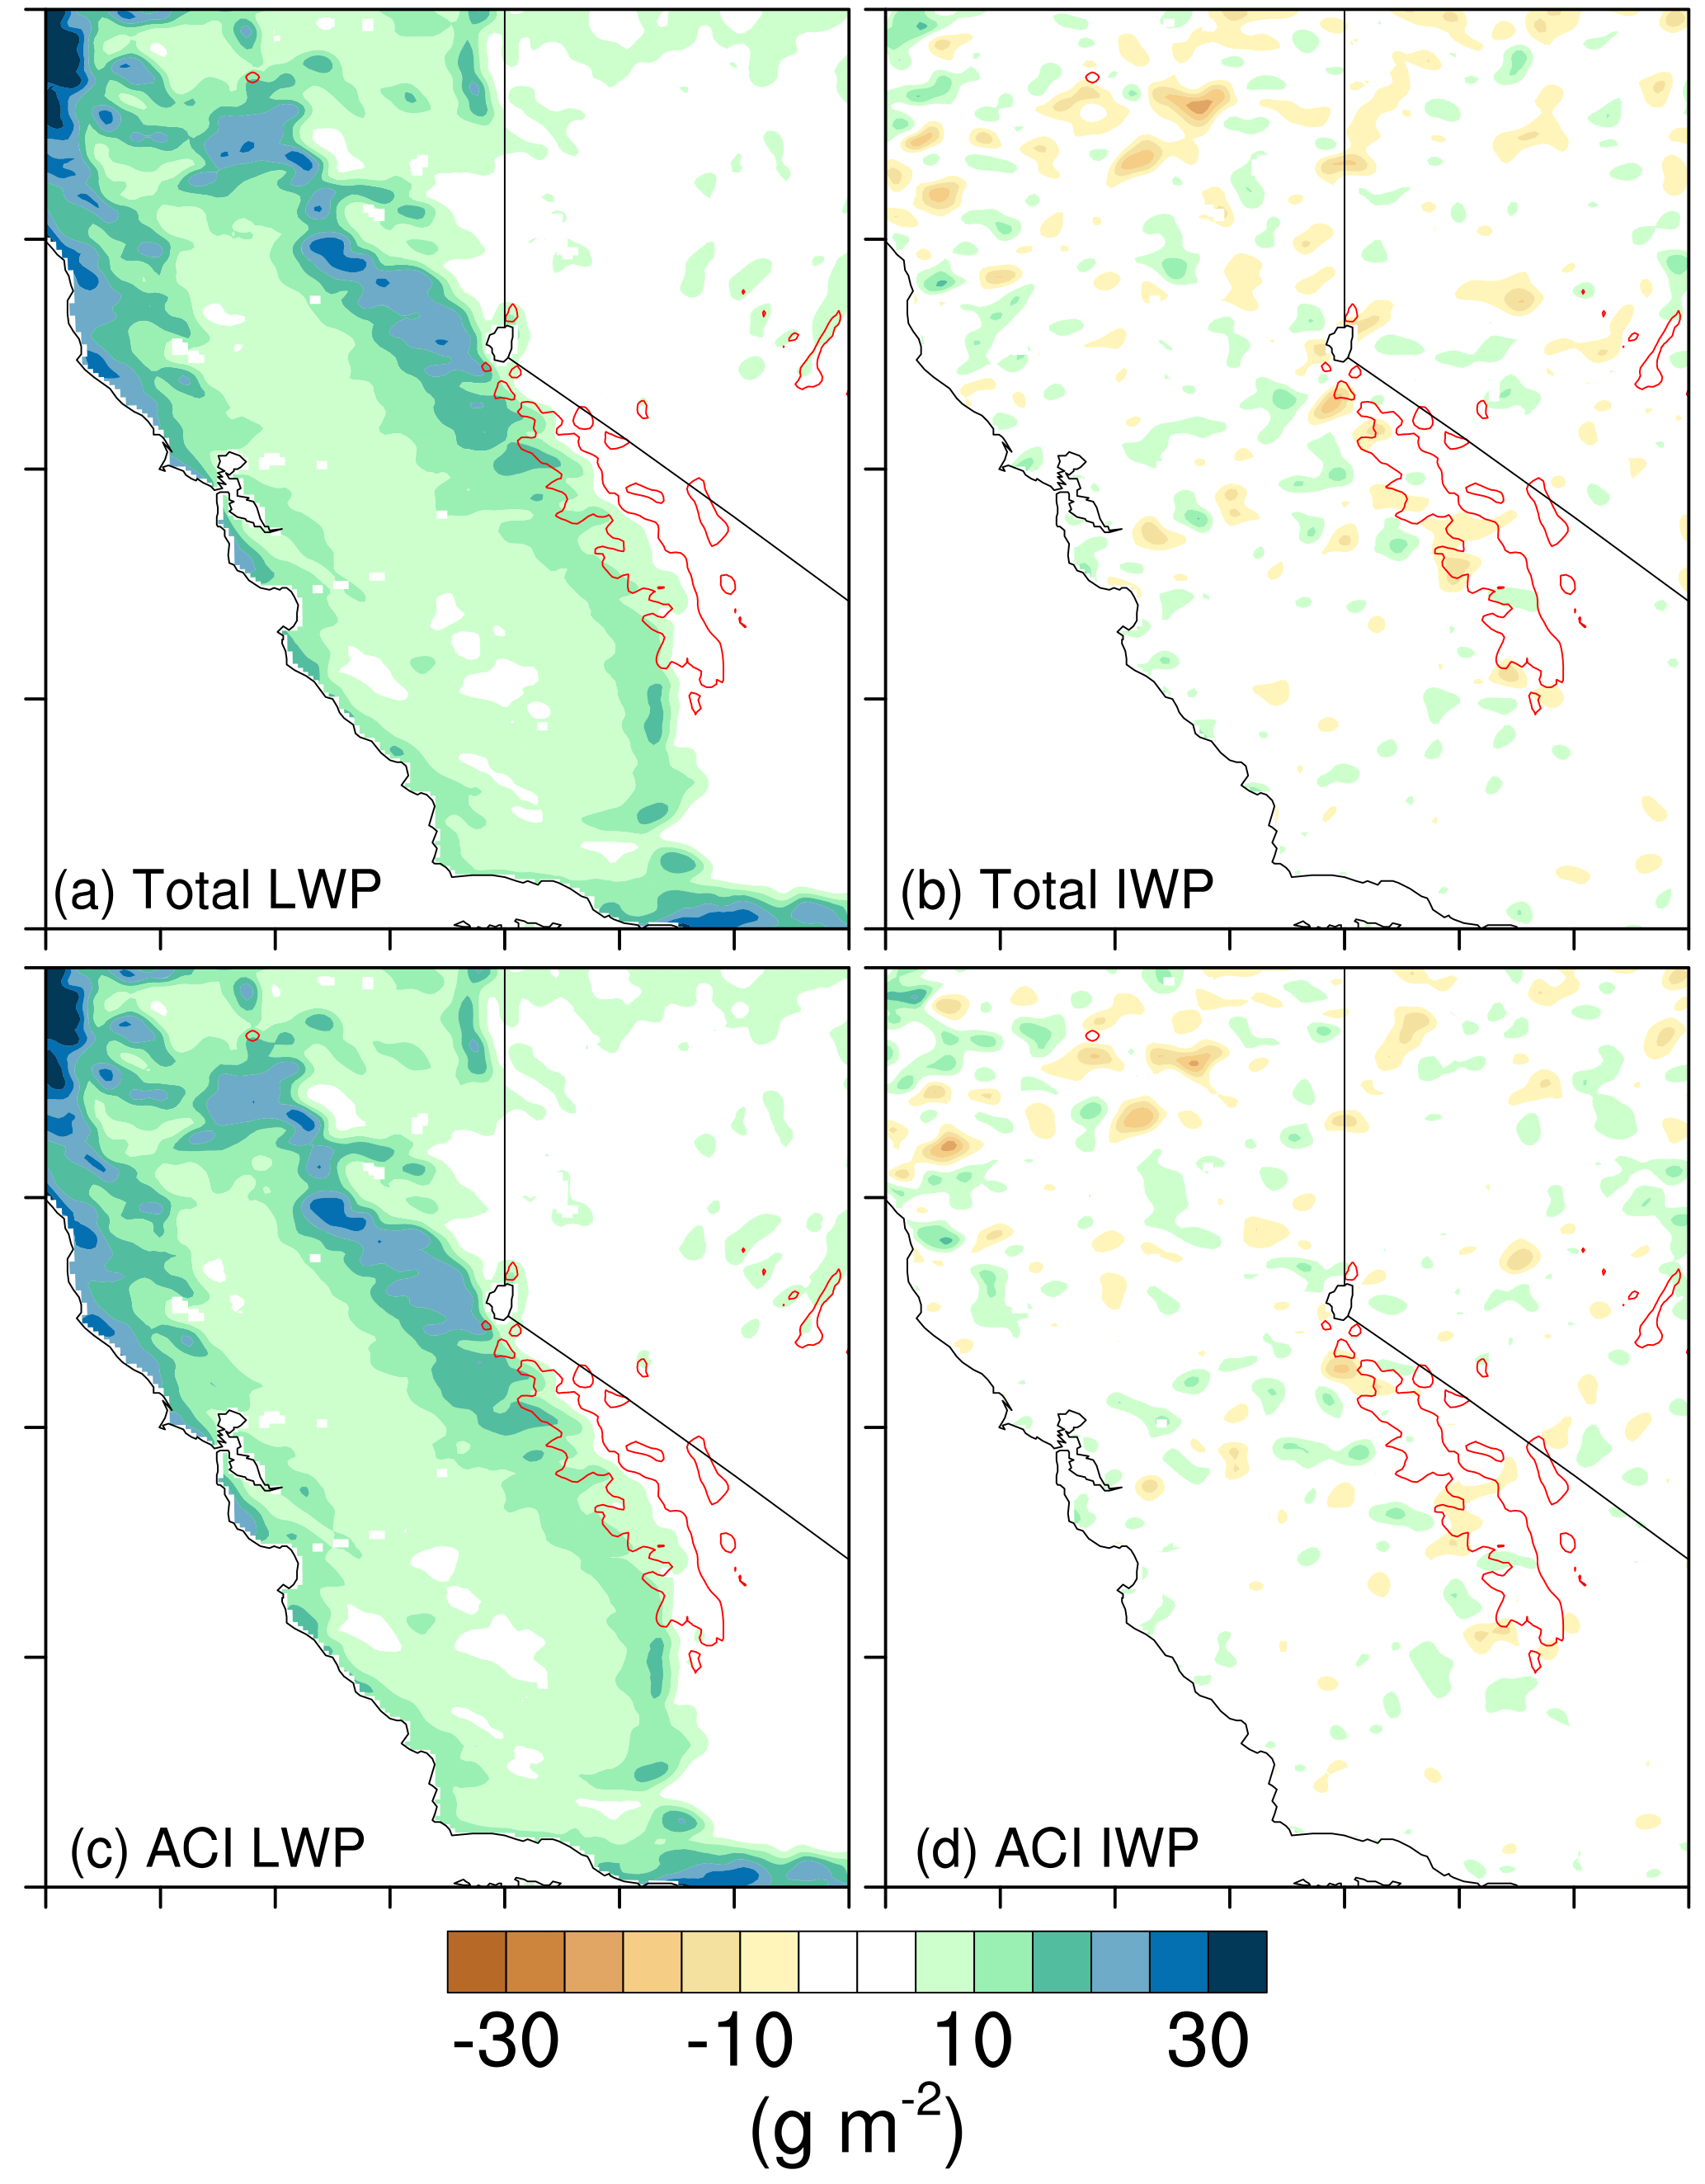
Figure 8Differences in (a) LWP (g m−2) and (b) IWP (g m−2) due to all aerosol effects (CTRL – CLEAN), and (c) LWP (g m−2) and (d) IWP (g m−2) due to the ACI effect (NARS – CLEAN). Red lines represent the mountaintops with elevation ≥ 2.5 km.
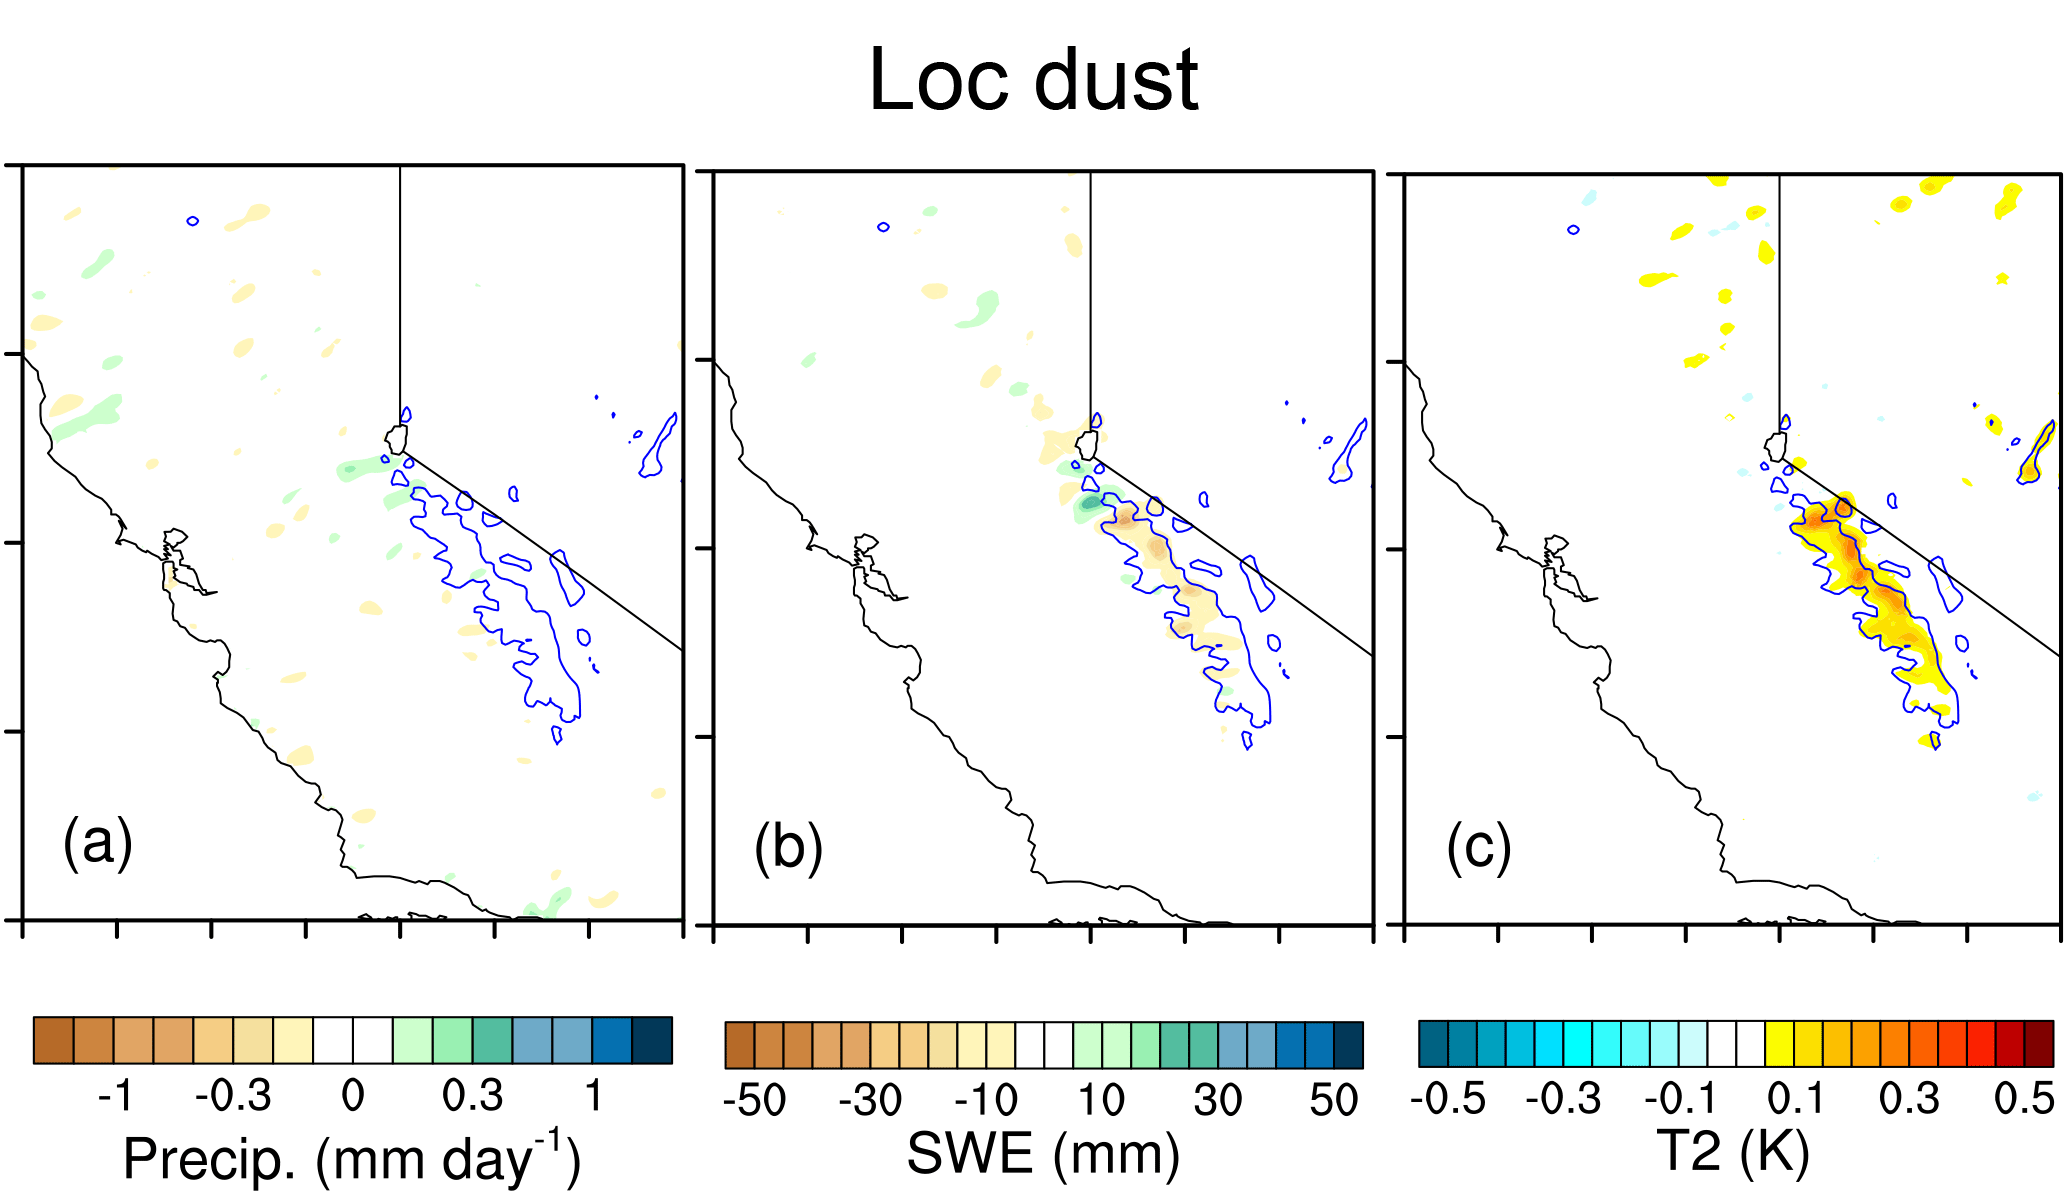
Next, we examine the roles of local anthropogenic aerosols and local dust as well as transported aerosols. The effect of local anthropogenic aerosols can be discovered from the differences between CTRL and NoLocAnth. It is shown that local anthropogenic aerosols slightly suppress precipitation (Fig. 10a) via ACI, leading to reduced SWE (Fig. 10b) and warming over the mountaintops (Fig. 10c). The cooling of the valley area, where locally emitted anthropogenic aerosols are mostly located (Fig. 4b), is associated with both the ARI effect and more nonprecipitating clouds produced through ACI. Dust aerosols emitted from local sources mainly warm the surface through the reduction of snow albedo (ASI, Fig. 11c), consequently enhancing the snowmelt and leading to the reduced SWE (Fig. 11b). Local dust aerosols have no significant effect on precipitation (Fig. 11a).
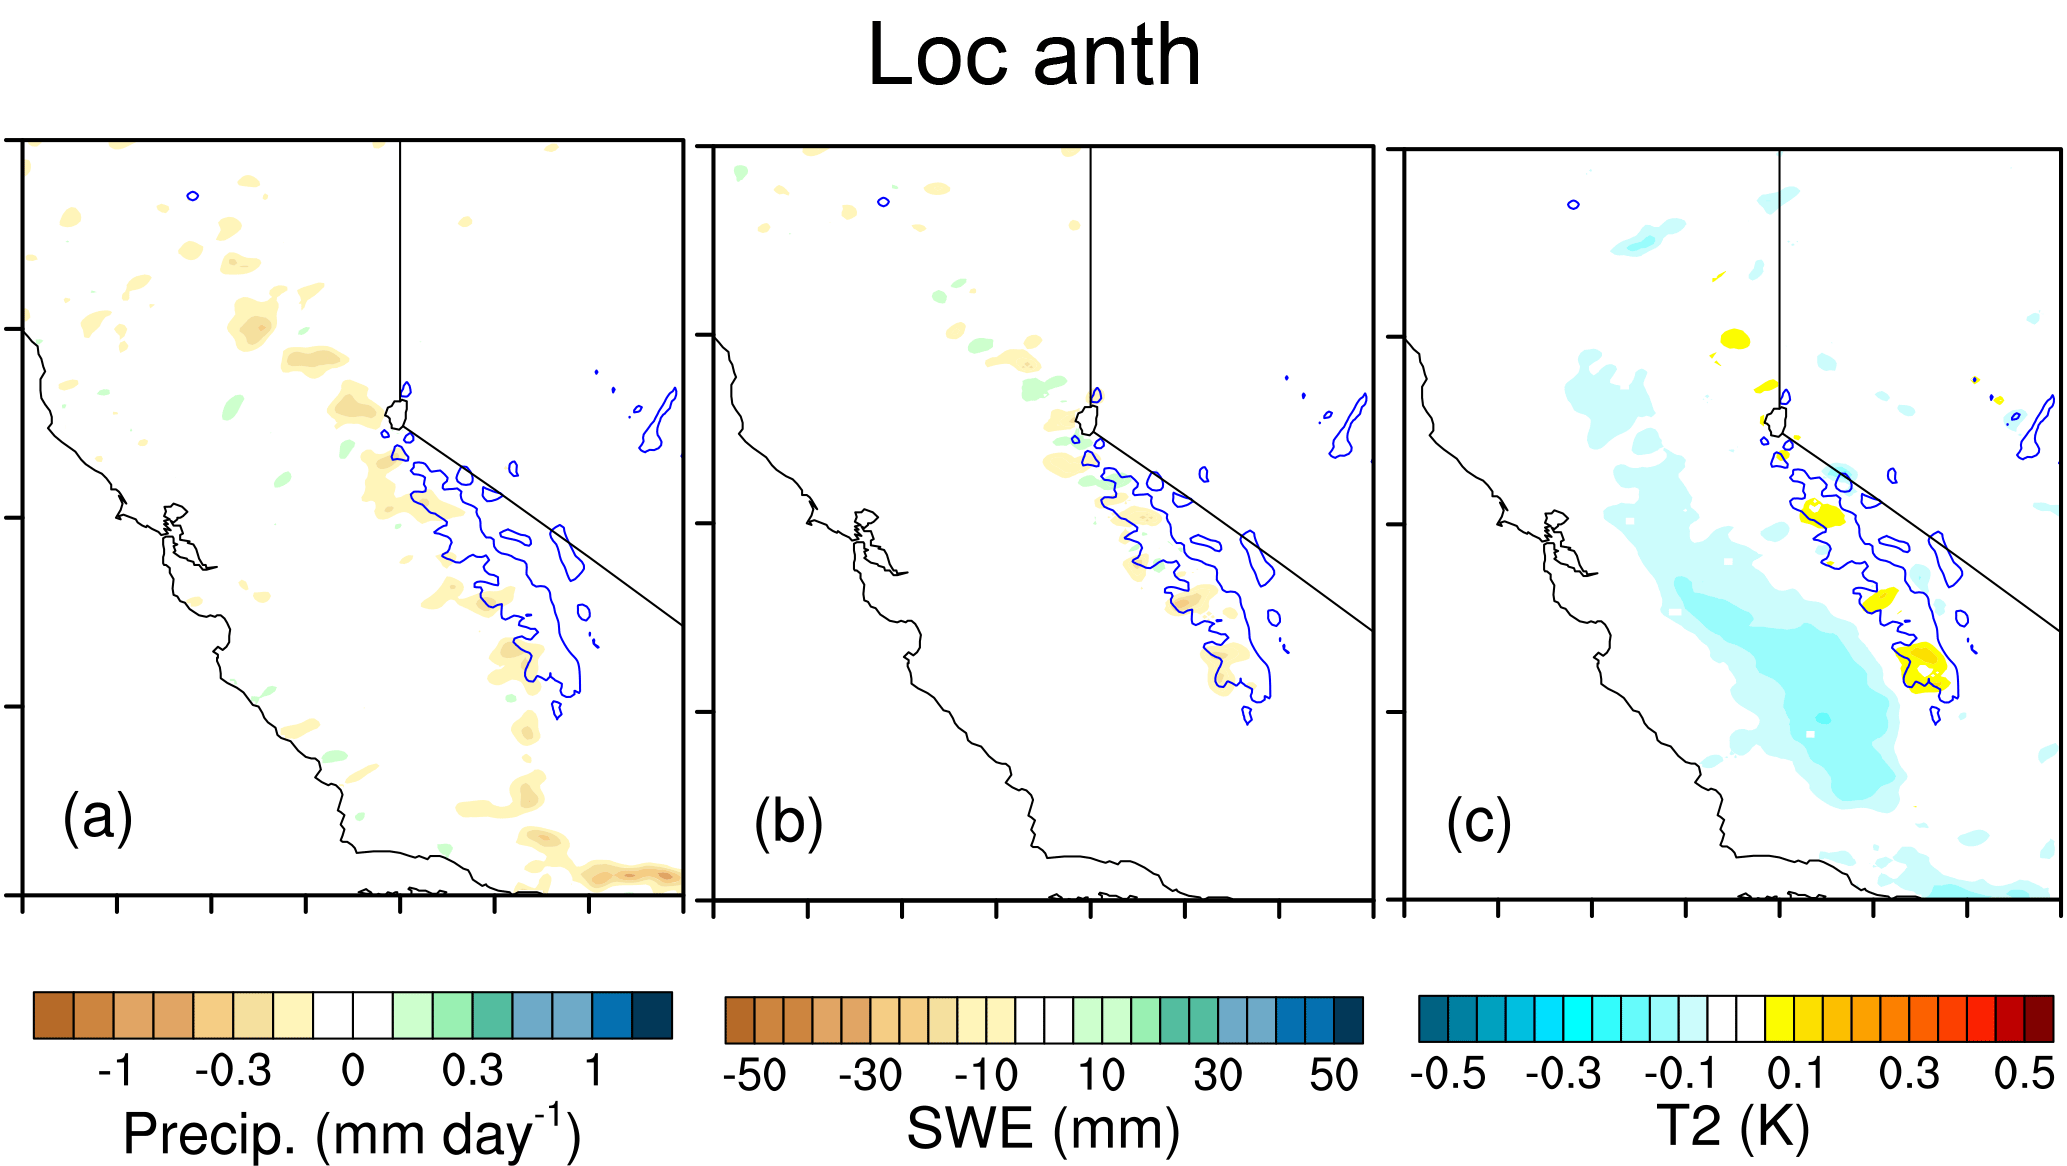
Figure 10Effect of local anthropogenic aerosols (CTRL – NoLocAnth) on spatial distributions of (a) precipitation (mm day−1), (b) SWE (mm), and (c) T2 (K). Blue lines represent the mountaintops with elevation ≥ 2.5 km.
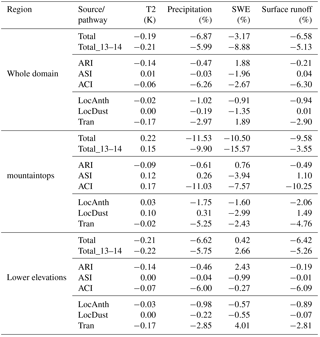
Note that the effects of local anthropogenic and dust aerosols do not seem to be able to explain the total effects of aerosols as seen in Fig. 5, raising the question of whether the transported aerosols play an important role in precipitation and snowpack over the Sierra Nevada. Figure 12 illustrates the impact of aerosols transported from outside the model domain. It is shown that transported aerosols reduce the precipitation through ACI (Fig. 12a), which exceeds the ARI effect and leads to decreased SWE and increased temperature over the southern part of the Sierra Nevada (Fig. 12b, c). Over the Central Valley, as well as over the northern part of the Sierra Nevada, temperature decreases (Fig. 12c) due to the relatively larger ARI effect of the transported aerosols compared to the ACI effect, result in less snowmelt and increased SWE over that region (Fig. 12b).
The overall changes induced by aerosols for surface temperature (K) and precipitation, SWE, and surface runoff in percentage averaged from October to June are given in Table 4 for the whole domain (34–42∘ N, 117–124∘ W, not including ocean points), mountaintops (elevation ≥ 2.5 km), and lower elevations (elevation < 2.5 km). For the whole domain in 2012–2013, temperature is cooled by 0.19 K due to aerosol ARI (−0.14 K) and ACI (−0.06 K), which are mainly associated with transported aerosols (−0.17 K), and is accompanied by reductions in precipitation, SWE, and surface runoff of about 7, 3, and 7 %, respectively. Reduction in precipitation is mainly caused by ACI (−6.26 %) associated with transported (−2.97 %) and local anthropogenic (−1.02 %) aerosols. For SWE, the reduction is attributed to ACI (−2.67 %) and ASI (−1.96 %), while ARI contributes to an increase (1.88 %). Surface runoff is defined as water from precipitation, snowmelt, or other sources that flows over the land surface and is a major component of the hydrological cycle. Overall changes in surface runoff are similar to those in precipitation and are accompanied by contributions from changes in snowmelt. For the mountaintops, a warming of 0.22 K is found and attributed to ASI (0.12 K) and ACI (0.17 K), associated with local dust and anthropogenic aerosols, respectively, with 10 % or more reduction in precipitation, snowpack, and surface runoff. Therefore, aerosols may contribute to the California drought through both the warming of mountaintops and anomalously low precipitation over the whole area. For lower elevations, the domain-averaged changes are similar to those for the whole domain, except for SWE which slightly increases by 0.42 % due to ARI (2.43 %), with the main contribution from transported aerosols (4.01 %).
Table 4Changes in surface temperature (K) and precipitation, SWE, and surface runoff in percentage averaged from October 2012 to June 2013 due to overall and various aerosol effects for the whole domain (34–42∘ N, 117–124∘ W, not including ocean points), mountaintops (with elevation ≥ 2.5 km), and lower elevations (< 2.5 km). Total impacts for the simulations from October 2013 to June 2014 are also included as “Total_13–14”.
The simulations for 2013–2014 are consistent with those in 2012–2013 (Table 4). For the whole domain in 2013–2014, the temperature cools by 0.21 K due to aerosols and is accompanied by reductions in precipitation, SWE, and surface runoff of about 6, 9, and 5 %. Aerosol impacts on SWE are more significant in 2013–2014 (−8.88 %) than in 2012–2013 (−3.17 %), possibly due to less precipitation and SWE in 2013–2014 than in 2012–2013 (not shown). The changes in SWE for 2013–2014 are −15.57 % for the mountaintops and 2.66 % for the lower elevations. The relative change in surface runoff on the mountaintops in 2013–2014 is smaller than 2012–2013 because the mean surface runoff in 2013–2014 (0.33 mm day−1) is larger than that in 2012–2013 (0.27 mm day−1), possibly contributed to by less SWE and faster snowmelt on the mountaintops in 2013–2014. The corresponding changes in evapotranspiration are −0.12 % in 2012–2013 and −1.20 % in 2013–2014, which also contributes to the relatively smaller change in surface runoff in 2013–2014 on the mountaintops.
3.3 Seasonal variations of aerosol effects
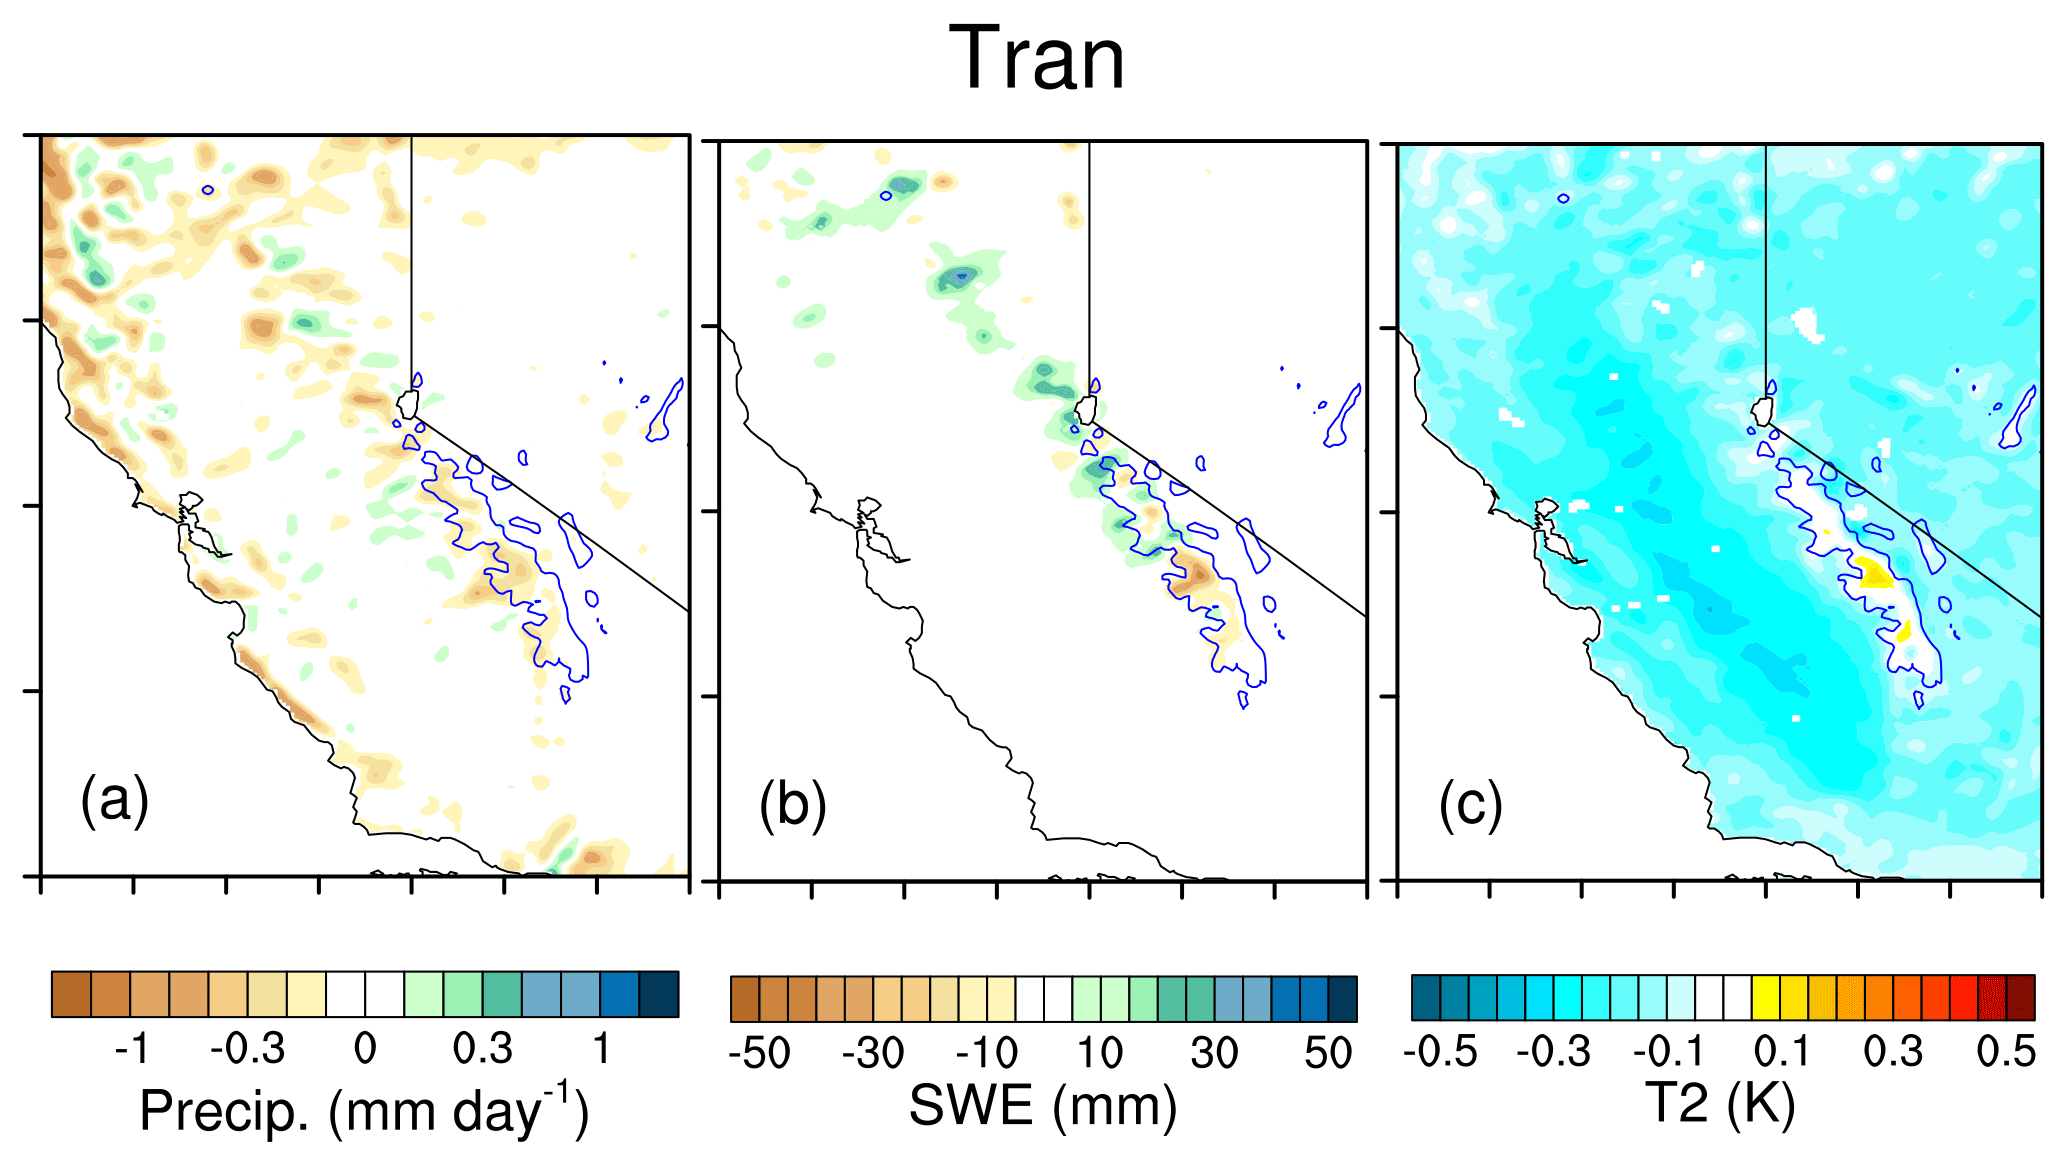
Figure 13 depicts the monthly mean AOD for total aerosols (brown solid), local anthropocentric aerosols (green dashed), local dust (blue dashed), and transported aerosols (red dashed) averaged over the whole domain, mountaintops, and lower elevation area from October 2012 to June 2013. It is seen that transported aerosols contribute to about two-thirds of the total AOD. The total AOD has two maxima, one in December and one in May, which are mainly associated with the seasonal variations of transported aerosols and local dust aerosols. Local dust AOD starts to increase in March and reaches a maximum around May, while transported aerosol AOD peaks in April (Fig. 13a). The seasonal variations in AOD over the mountaintops and lower elevations are similar to those over the whole domain (Fig. 13b, c).
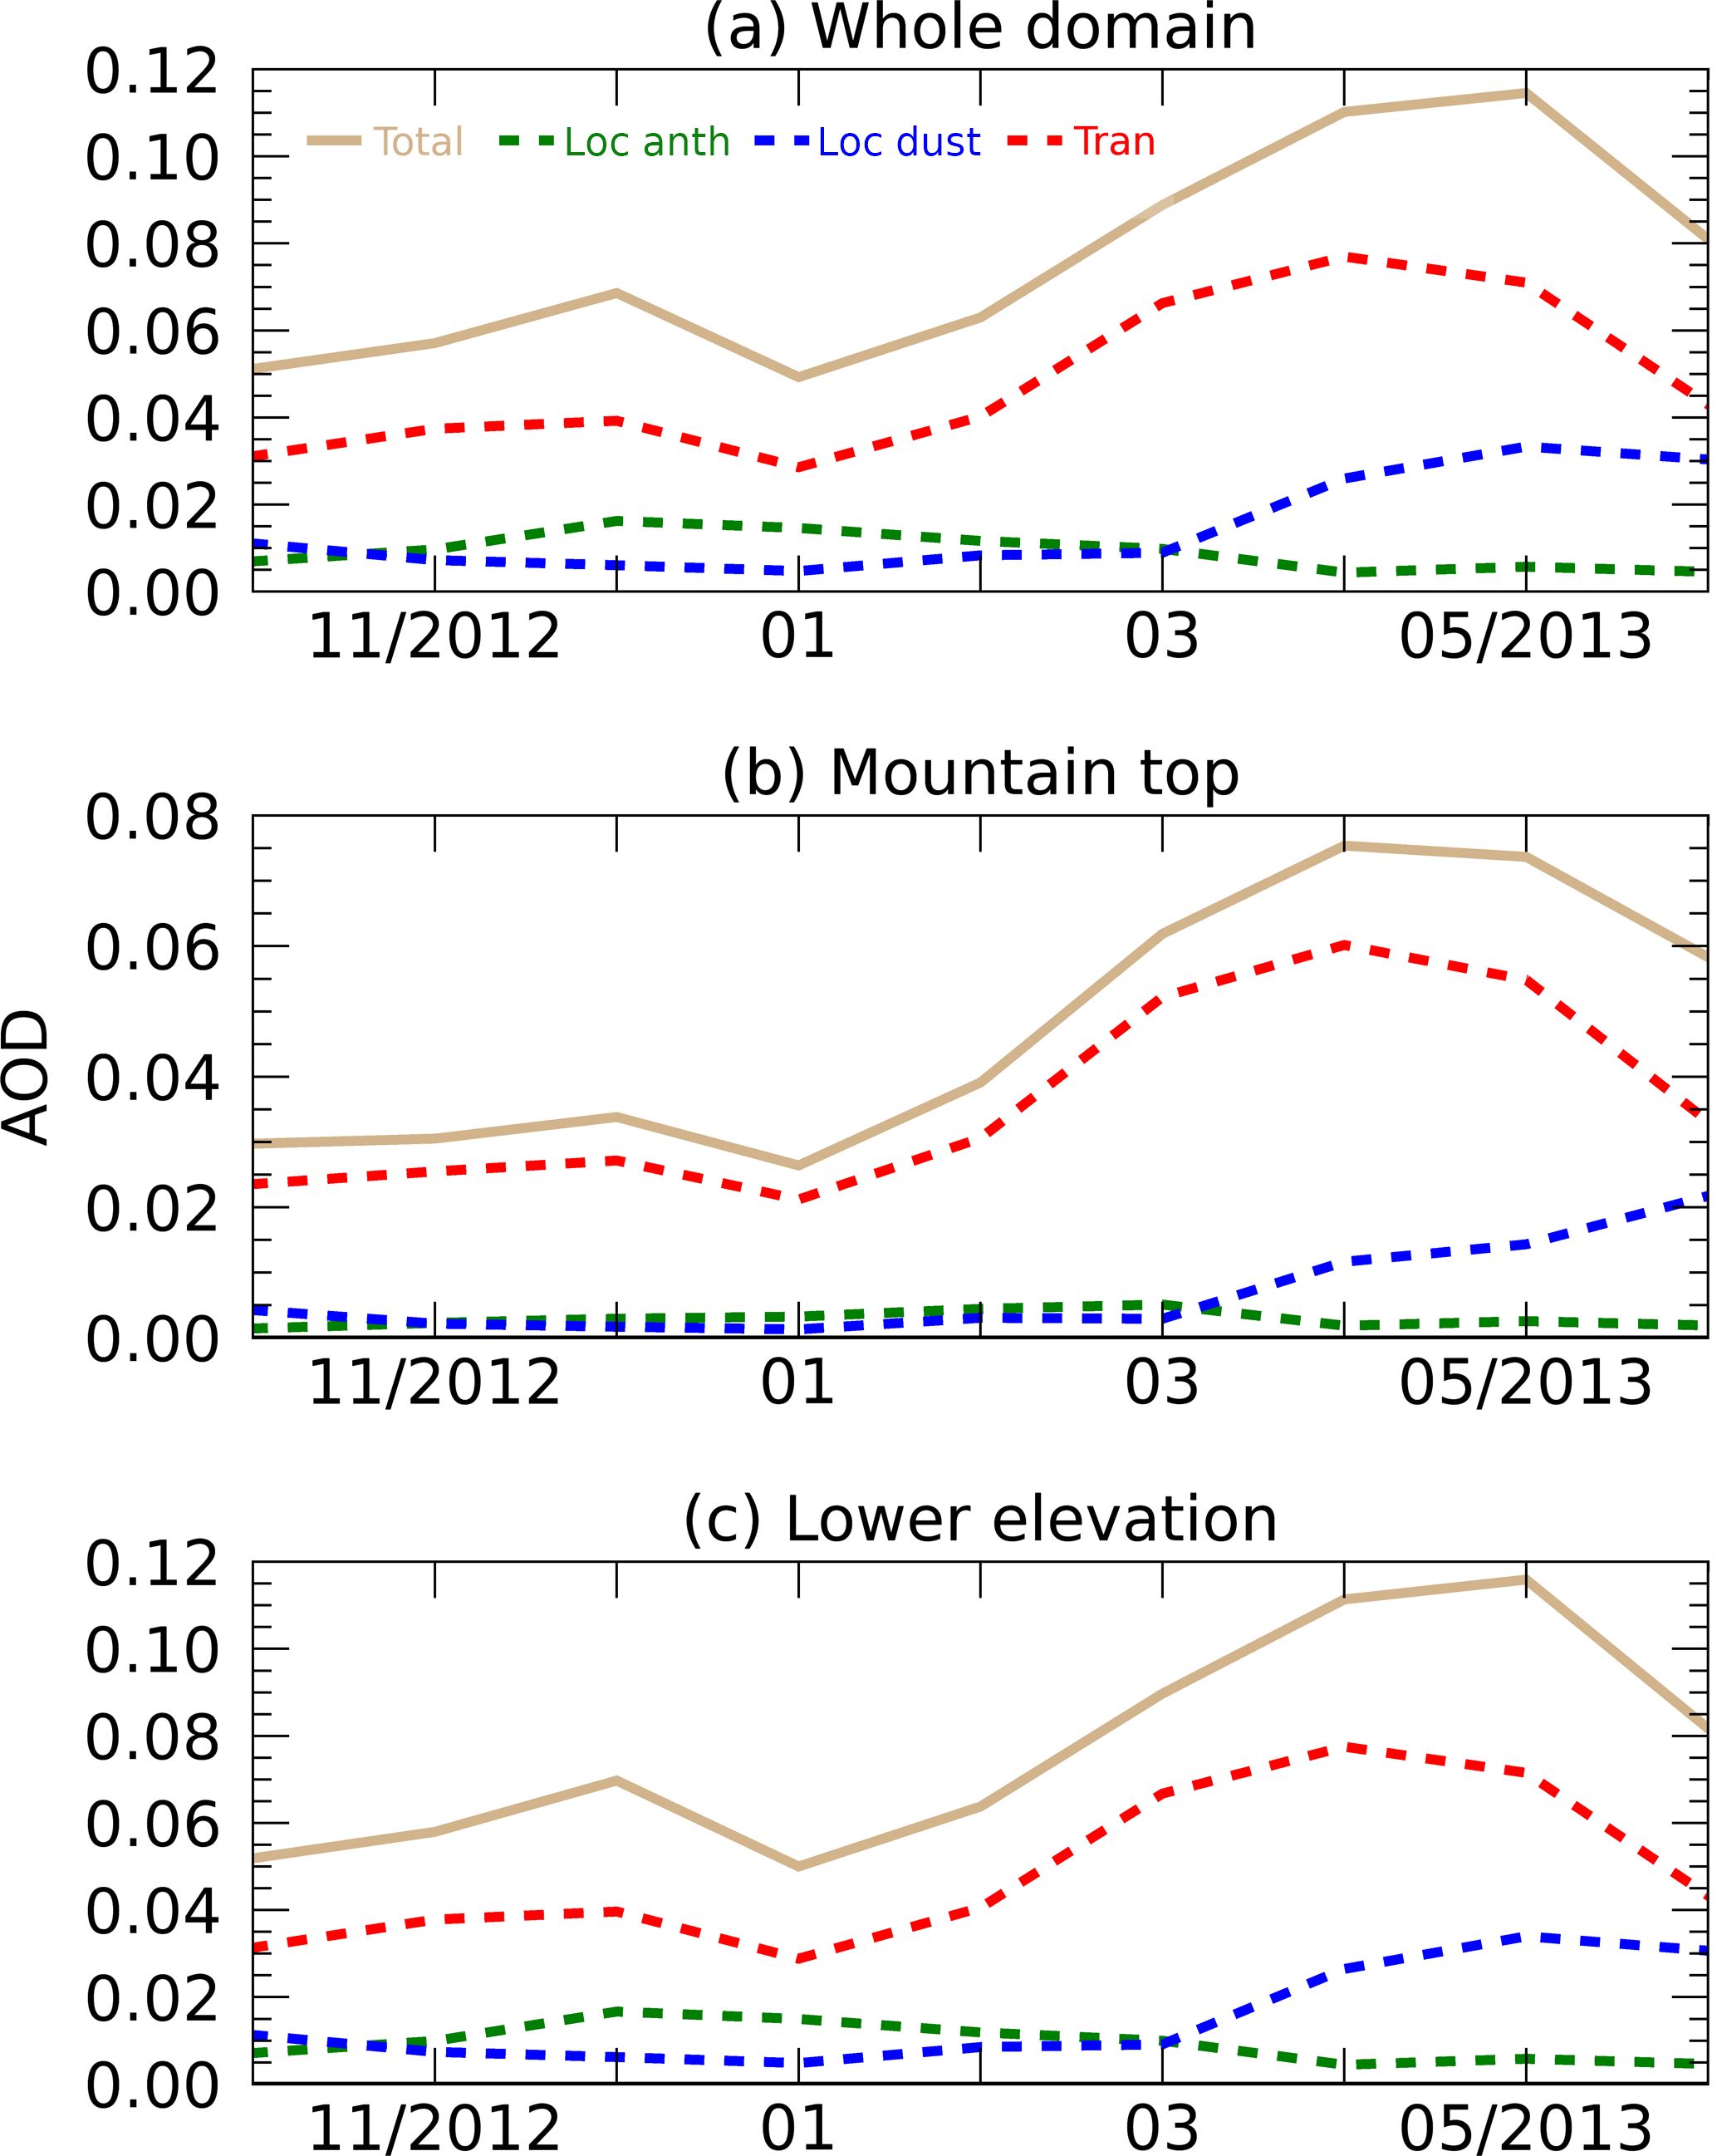
Figure 13Monthly mean AOD simulated from CTRL for total aerosols (brown solid), local anthropocentric aerosols (green dashed), local dust (blue dashed), and transported aerosols (red dashed) averaged over (a) the whole domain (34–42∘ N, 117–124∘ W, not including ocean points), (b) mountaintops (with elevation ≥ 2.5 km), and (c) lower elevation area (< 2.5 km) from October 2012 to June 2013.
The monthly mean differences in precipitation due to the total aerosols (brown solid), ARI (green solid), ASI (blue solid), ACI (red solid), local anthropocentric aerosols (green dashed), local dust (blue dashed), and transported aerosols (red dashed) are shown in Fig. 14. Reduced precipitation is seen over the whole domain, with the most contribution from transported aerosols, followed by local anthropogenic aerosols, both of which play a role in precipitation changes through ACI as previously shown. ARI, ASI, or locally emitted dust aerosols do not seem to play an important role in the monthly mean precipitation changes (Fig. 14a). Two maxima of aerosol effects are found: one is in December when it is the rainy season in California (Fig. 3a) and relatively larger AOD is present over this region (Fig. 13a); the other peak reduction in precipitation due to the aerosol effects is found in May with a value of about 0.2 mm day−1 (Fig. 13a), probably associated with the maximum aerosols (Fig. 13a) and the orographic precipitation over the mountain region during that time period (Lee et al., 2015). Given that the monthly mean precipitation in May is only about 1 mm day−1 (Fig. 3a), the reduction caused by aerosols is about 20 %. For monthly mean precipitation, changes over the mountaintops and the lower elevation area have similar seasonal variation patterns (Fig. 14b, c).
Figure 14Monthly mean differences in precipitation (mm day−1) due to total aerosols (brown solid), ARI (green solid), ASI (blue solid), ACI (red solid), local anthropocentric aerosols (green dashed), local dust (blue dashed), and transported aerosols (red dashed) averaged over (a) the whole domain (34–42∘ N, 117–124∘ W, not including ocean points), (b) mountaintops (with elevation ≥ 2.5 km), and (c) lower elevation area (< 2.5 km) from October 2012 to June 2013. Zero line is shown as a thin black line.
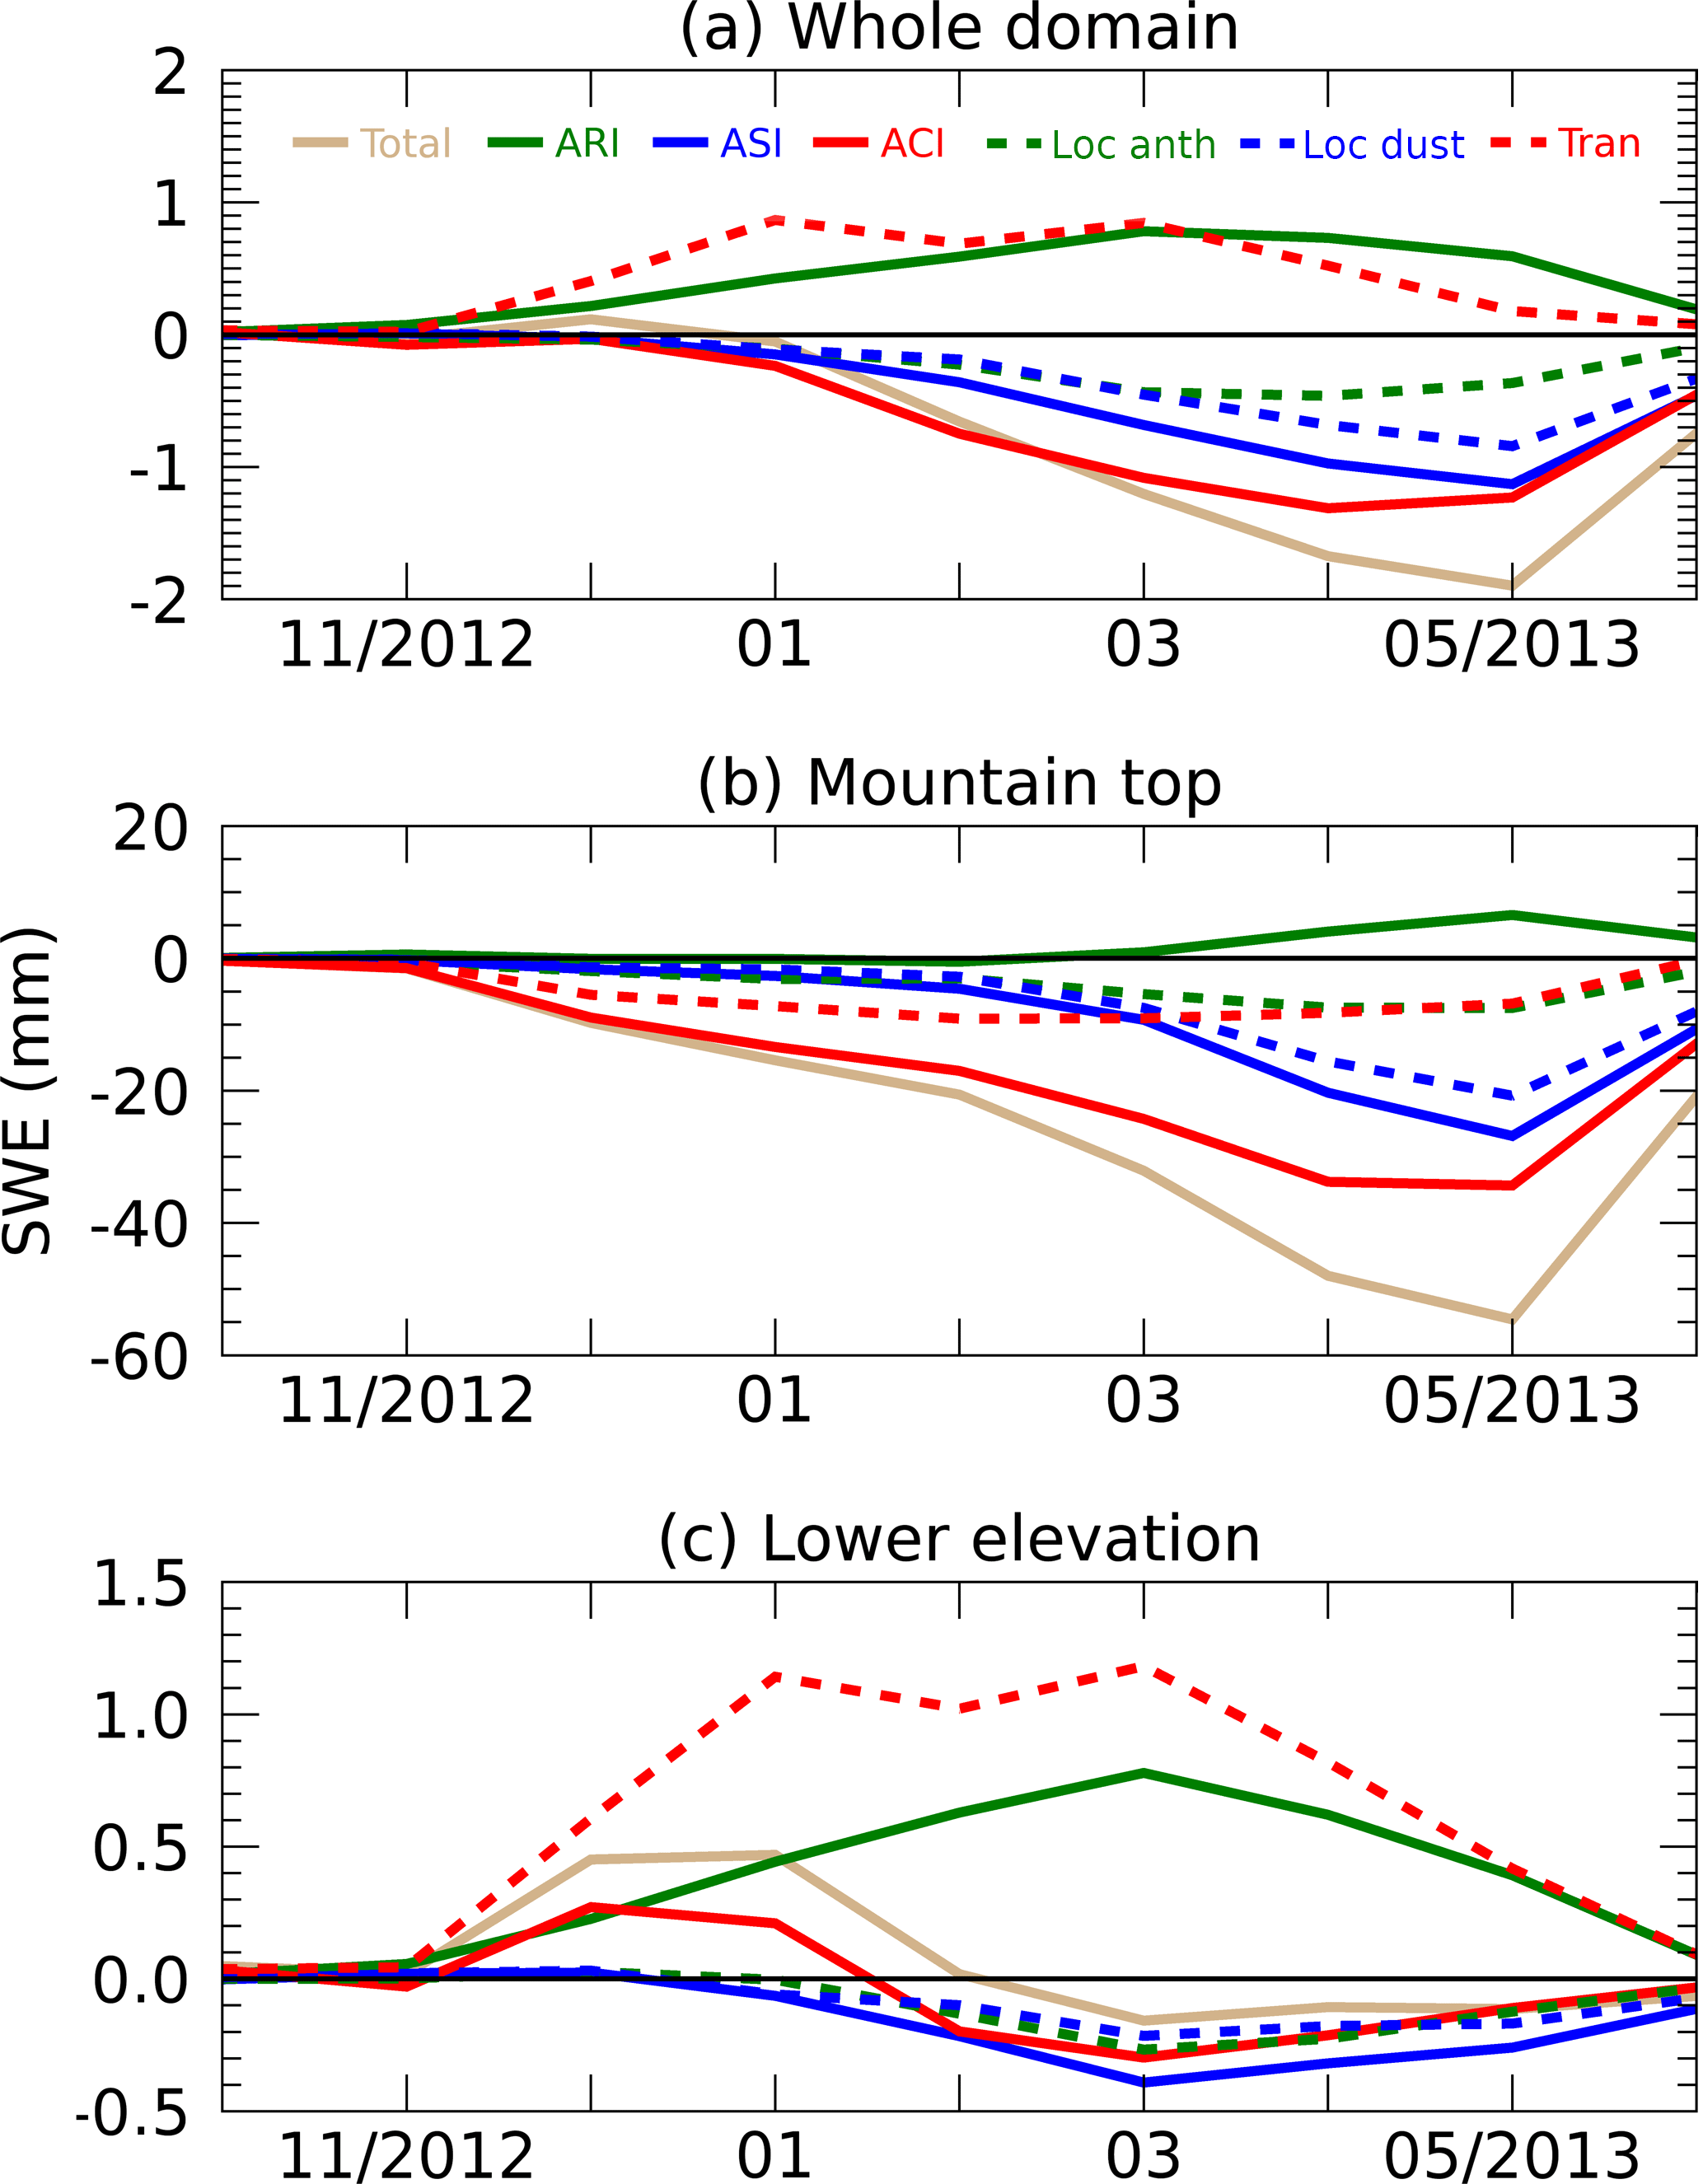
For SWE, however, changes over the mountaintops are different from those in the lower areas (Fig. 15). For mountaintops, negative changes in SWE are seen over the whole time period, with a maximum reduction of about 60 mm in May corresponding to the maximum AOD (Fig. 15b). A major contribution is from local dust aerosols through ASI, as well as transported and local anthropogenic aerosols through ACI. ARI produces small positive changes (∼ 5 mm in May) in SWE due to the scattering and absorption of solar radiation by aerosols which leads to surface cooling. For lower elevation areas, slightly enhanced SWE is found during the wintertime, associated with the effects of transported aerosols which produce more clouds through ACI, and together with the ARI effect, lead to the cooling of the surface and hence less snowmelt (Fig. 15c). Over the whole domain, SWE is reduced with a maximum of about 2 mm in May, equivalent to about 2 % reduction, which is mainly attributed to the local dust particles through ASI, and local anthropogenic and transported aerosols through ACI (Fig. 15a).
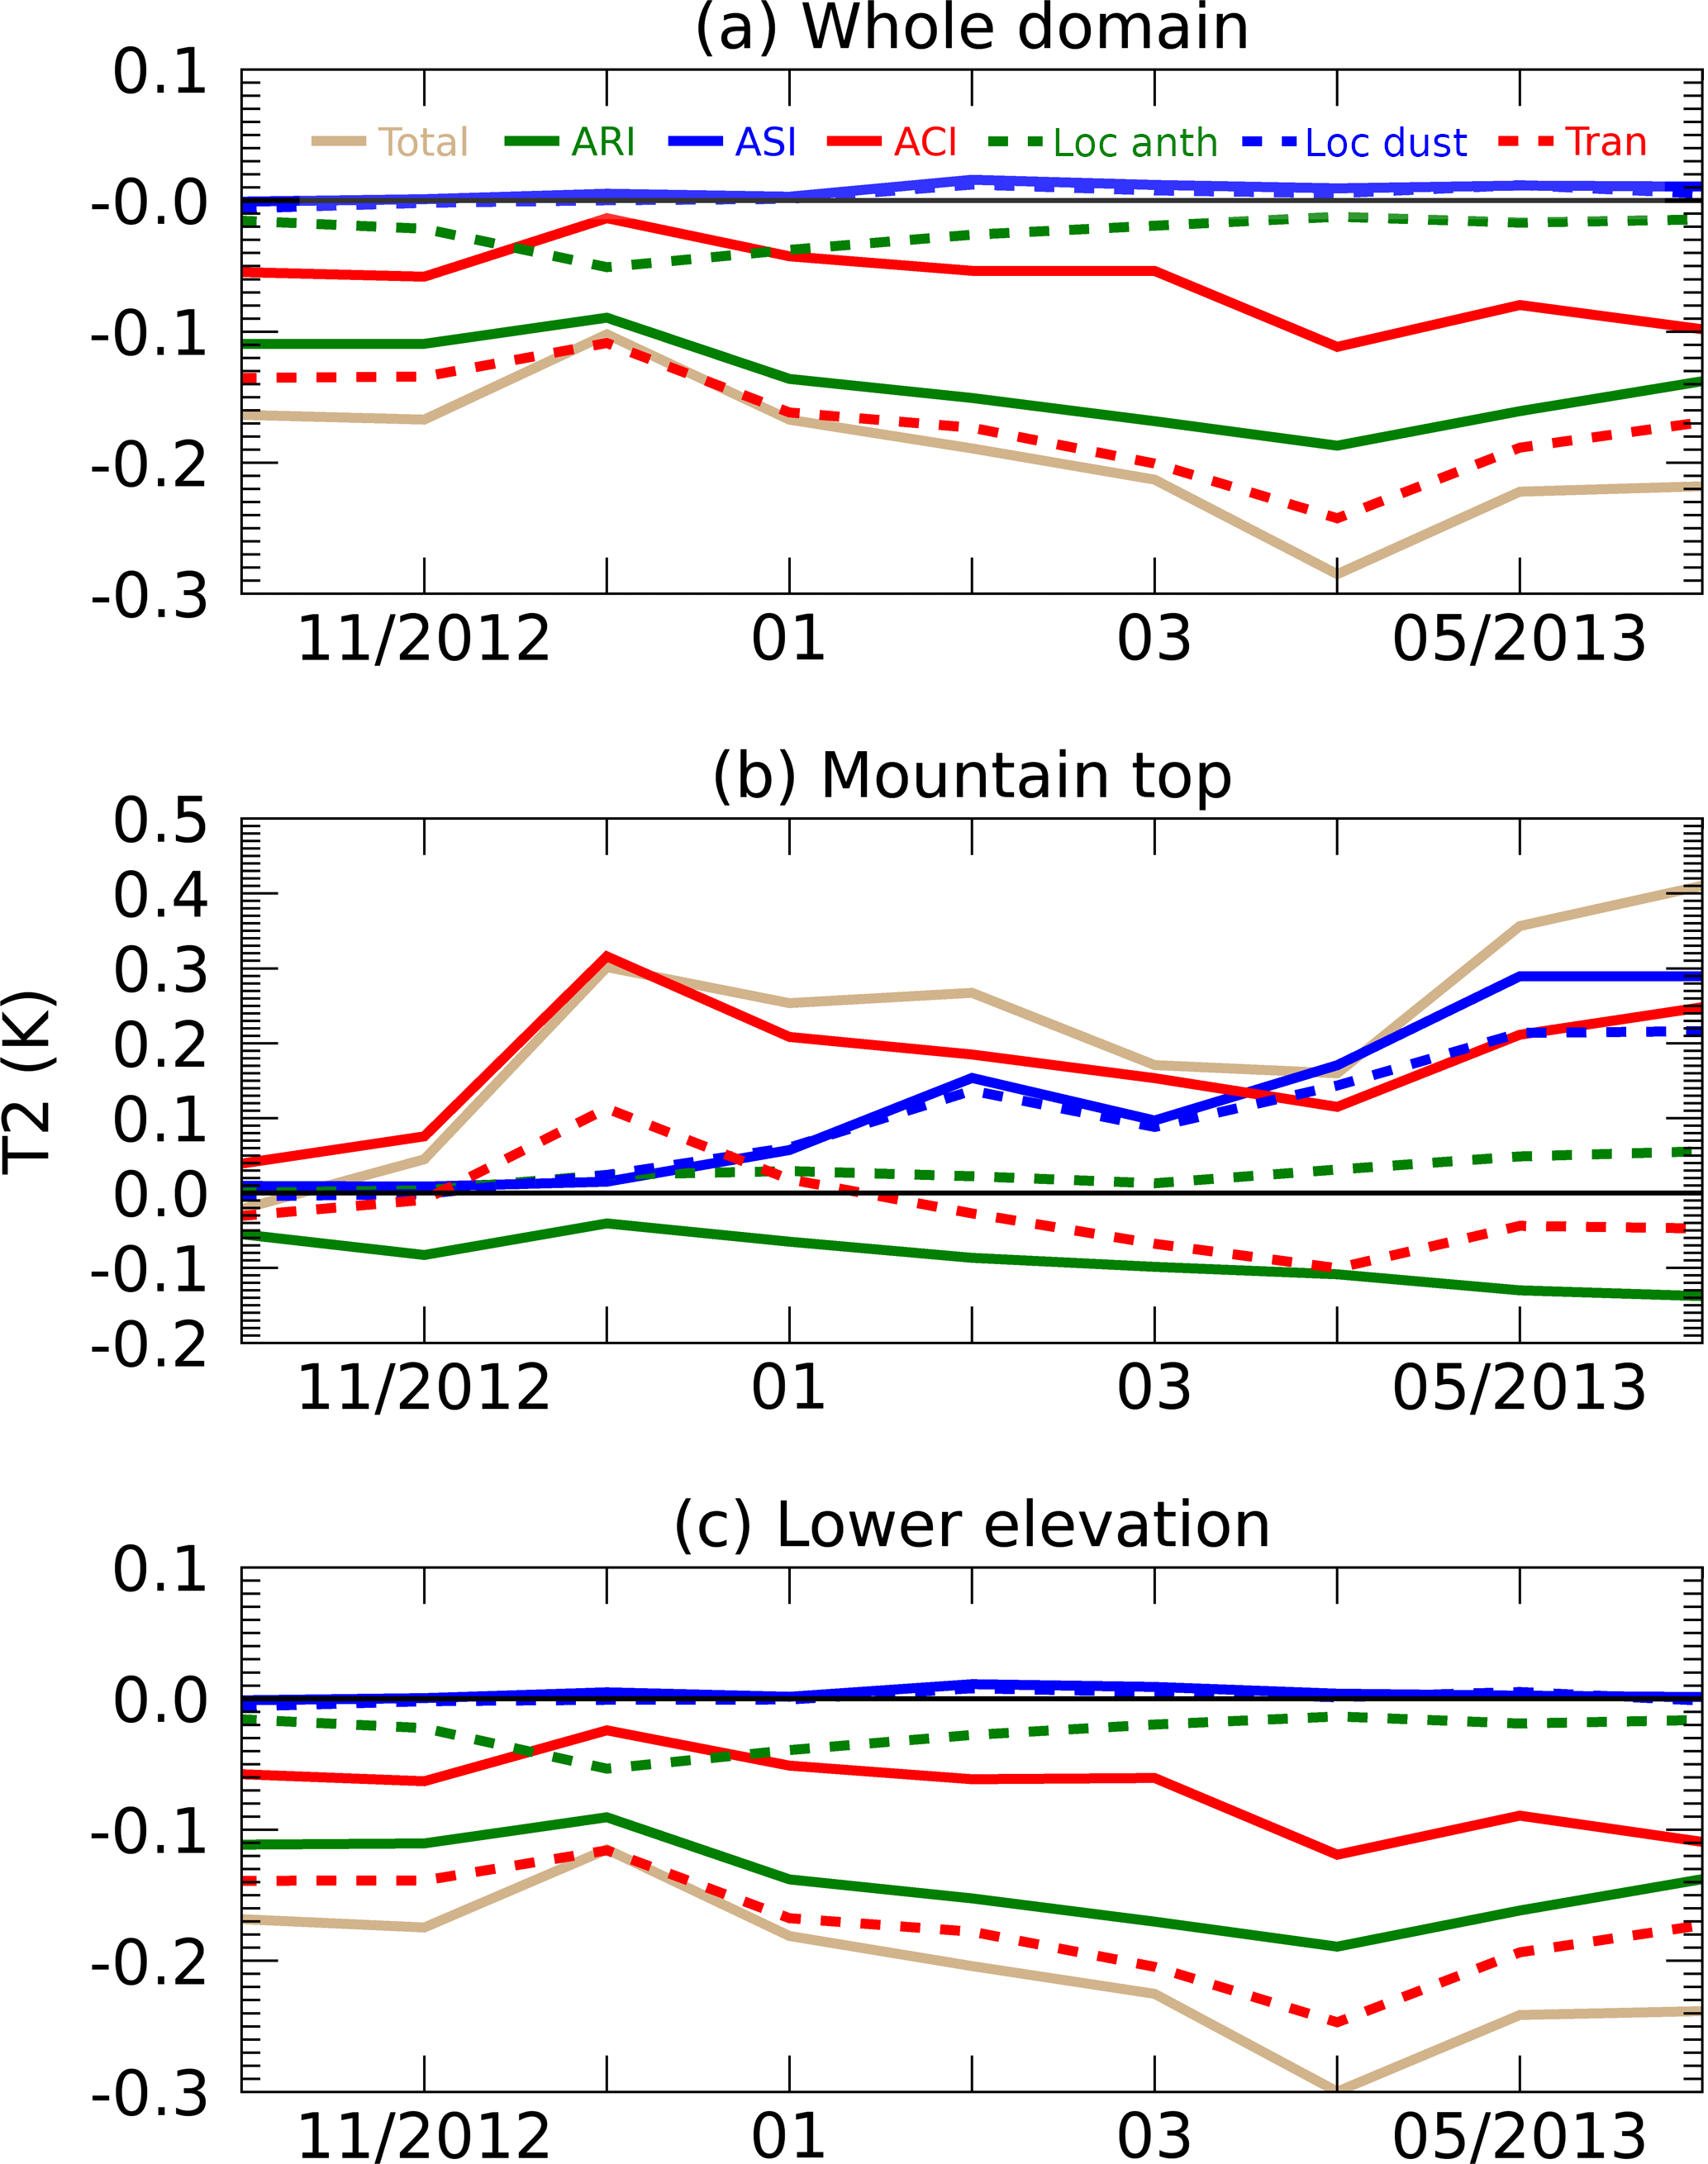
Changes in temperature also exhibit different patterns over the mountaintops and at lower elevations (Fig. 16). Warming over the mountaintops is produced by dust aerosols through ASI with a maximum around May and by transported aerosols through ACI during winter, which leads to reduced precipitation and SWE with a maximum in January (Fig. 16b). Cooling over the lower-elevation areas is caused by ARI and also induced by more clouds generated in the model simulations due to transported aerosols through ACI, with a maximum cooling of about 0.3 K in April, corresponding to the maximum AOD of transported aerosols (Fig. 16c). The average temperature changes over the whole domain are negative because of the large low-elevation area (Fig. 16a).
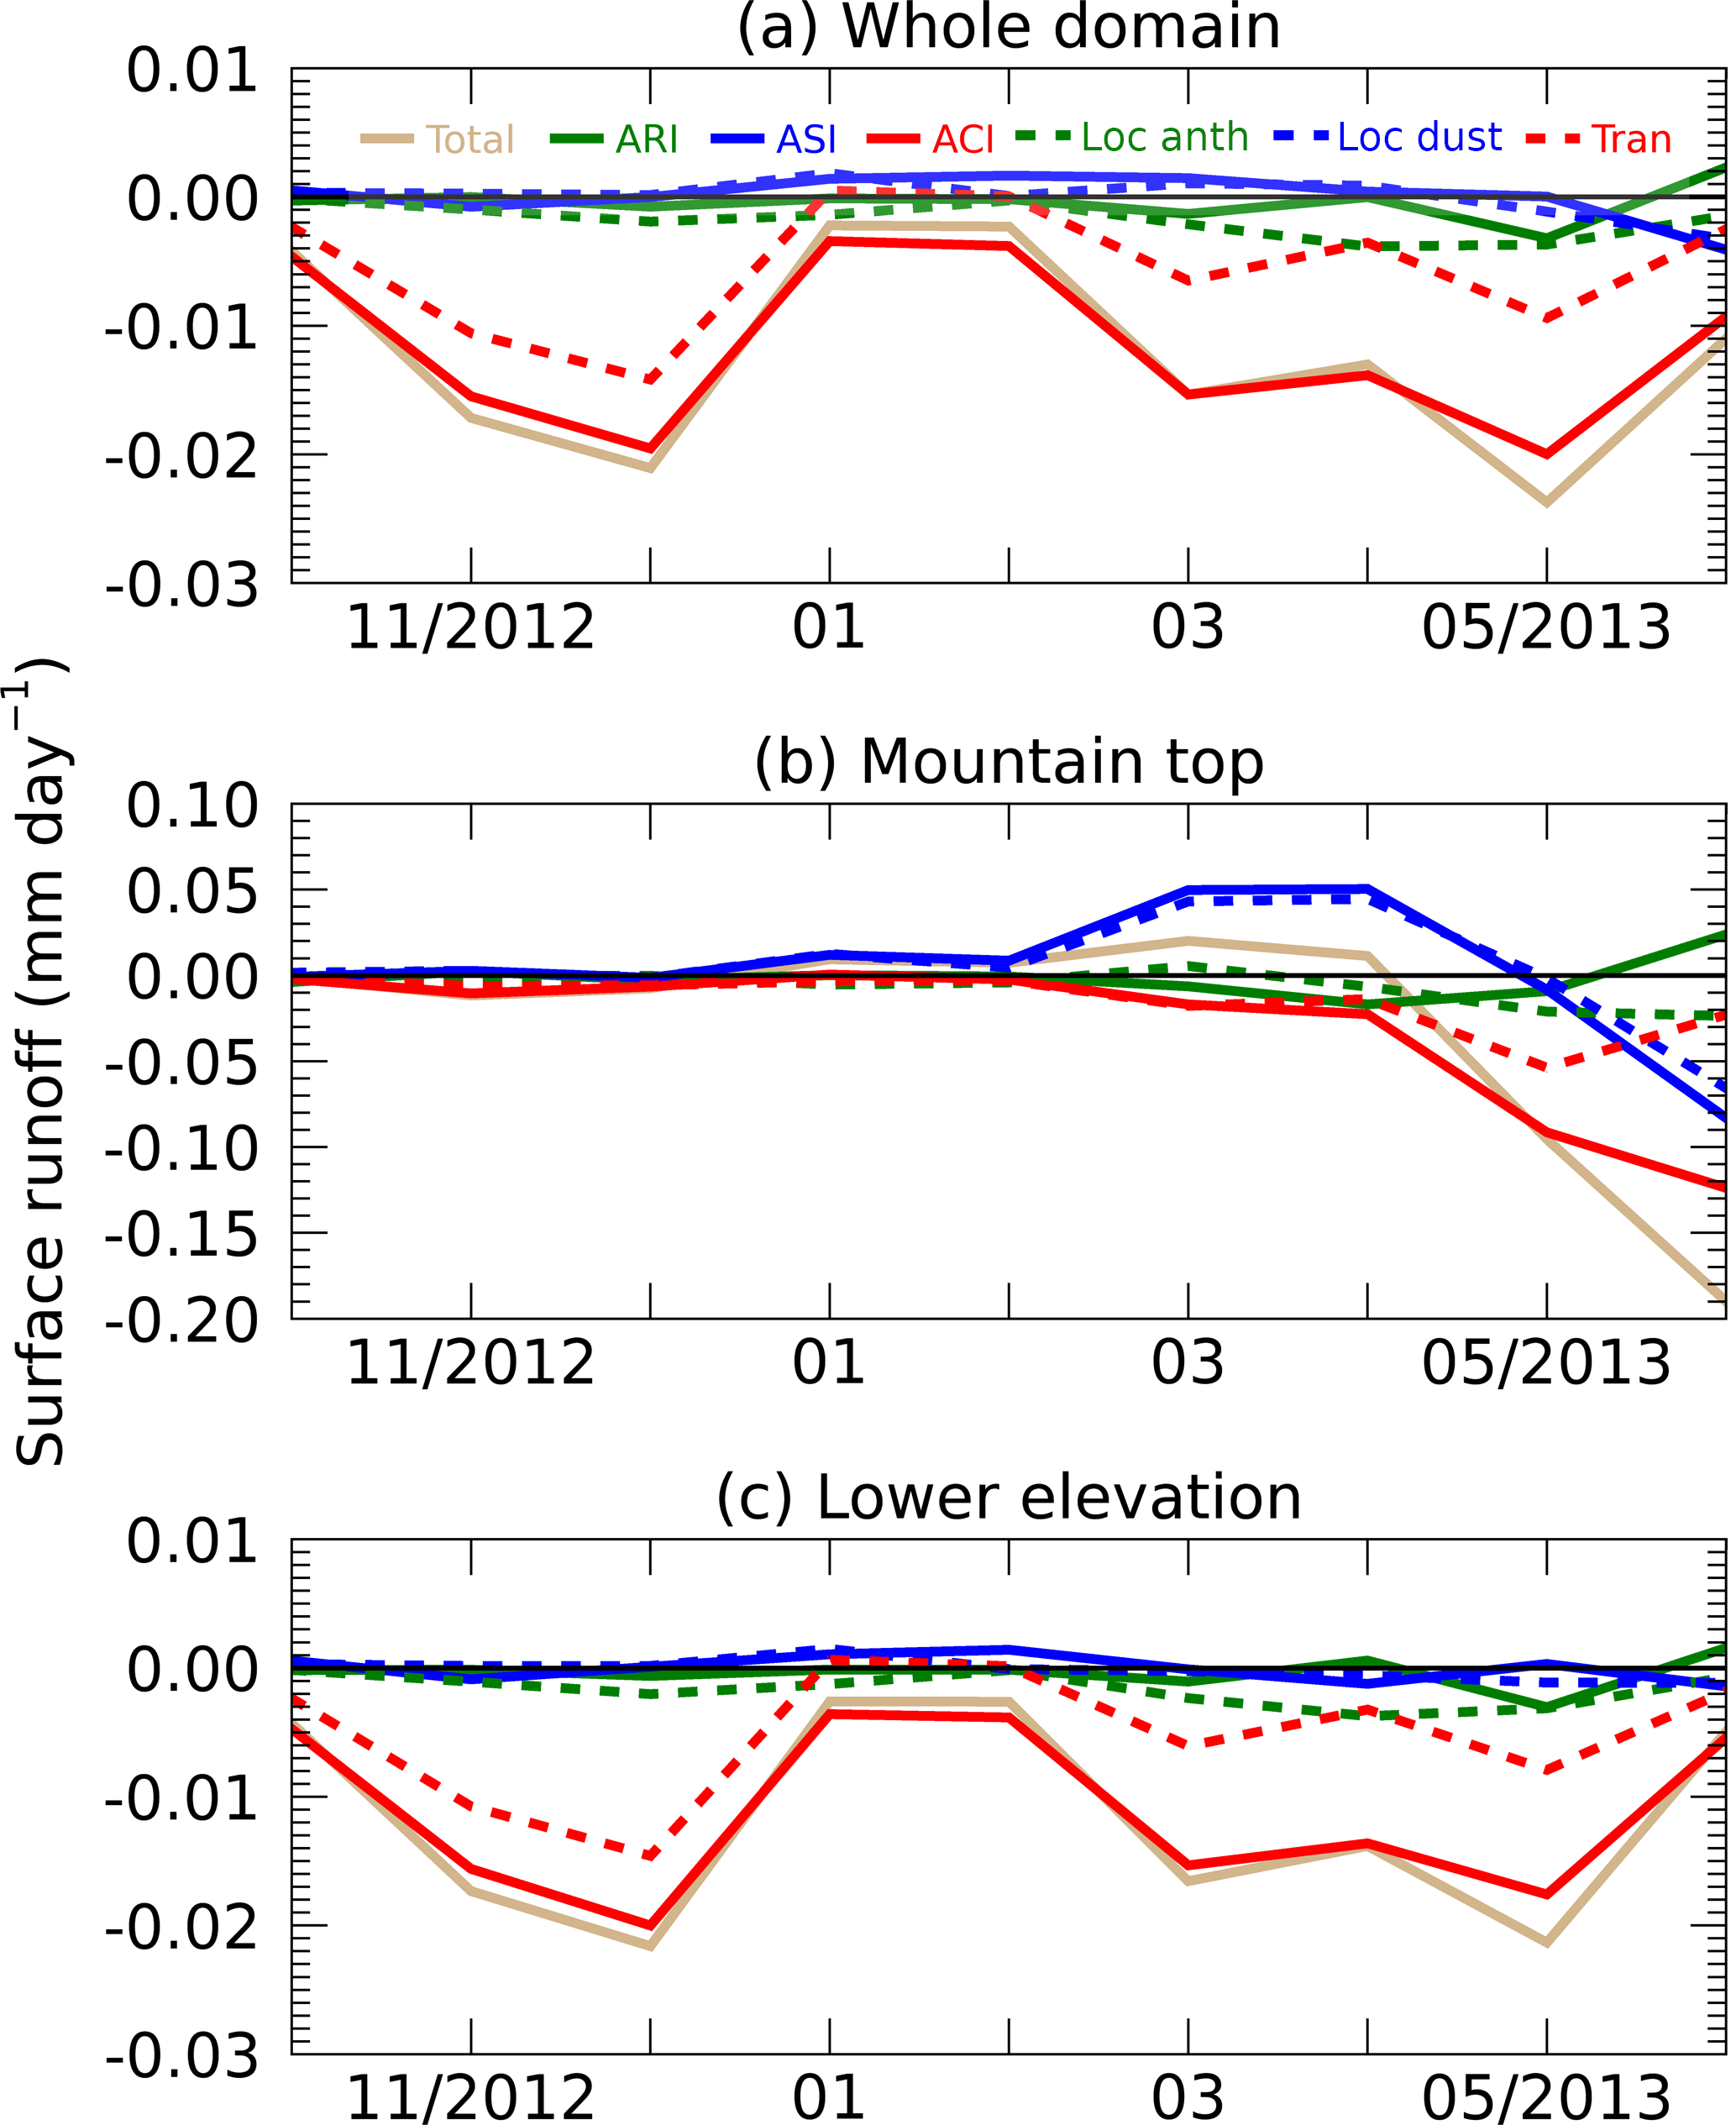
Surface runoff reaches a maximum in December for the lower elevations and the whole domain, but a peak value in May for mountaintops when the temperature is warmer (Fig. S4). For lower elevations where there is not much snow, surface runoff is mainly associated with precipitation and the changes present a similar pattern to those for precipitation (Fig. 17c). Changes in surface runoff for the whole area present similar patterns to those of the lower elevations because of the larger area at lower elevations (Fig. 17a). However for mountaintops, changes in surface runoff are also associated with changes in snowmelt. Surface runoff on the mountaintops shows a slight increase in spring and then a decrease after April (Fig. 17b). The increase can be explained by the effect of local dust aerosols deposited on the snow, which reduce the snow albedo through ASI and warm the surface, leading to more and earlier snowmelt than normal, consistent with negative changes in SWE. The decrease after April is a combined effect of less snowpack available for melting caused by earlier snowmelt due to local dust aerosols and reduced precipitation caused by transported and local anthropogenic aerosols through ACI. Thus, the impact of aerosols is to speed up snowmelt on the mountaintops in spring and modify the seasonal cycle of surface runoff.
A fully coupled high-resolution aerosol–meteorology–snowpack model is employed to investigate the impacts of various aerosol sources on precipitation and snowpack in California. The relative roles of locally emitted anthropogenic and dust aerosols, and aerosols transported from outside the model domain are differentiated through the three pathways, aerosol–radiation interaction (ARI), aerosol–snow interaction (ASI), and aerosol–cloud interaction (ACI). In the following summary, the numbers in brackets represent the domain-averaged changes (Table 4).
-
Temperature: Local dust aerosols warm the mountaintop surface through ASI (0.12 K), in which the reduced snow albedo associated with dirty snow leads to more surface absorption of solar radiation. Transported and local anthropogenic aerosols warm the surface of mountaintops through ACI (0.17 K), which produces more nonprecipitating clouds but reduces precipitation and hence the snow amount, leading to decreased surface albedo and more absorption of solar energy. The cooling of the valley area (−0.21 K) is primarily caused by the scattering and absorption of all aerosols through ARI (−0.14 K). Transported and anthropogenic aerosols can also cool the surface over the Central Valley through ACI (−0.07 K), which enhances the amount of cloud, leading to more reflection of solar radiation.
-
Precipitation and SWE: A reduction in precipitation of −6.87 % is found due to the aerosol effects and is mainly caused by transported and local anthropogenic aerosols through ACI (−6.26 %). The maximum aerosol effect on precipitation is found in December during the rainy season when the aerosols loadings are also relatively large. The other peak effect occurs in May with a reduction of about 20 %, probably associated with the maximum aerosol loading and more orographic precipitation over the mountains. Locally emitted dust aerosols represent one of the most important contributors to the reduced SWE (−3.17 %) through ASI (−1.96 %), with the largest reduction in May corresponding to the maximum dust emission over that time. Local anthropogenic aerosols can also reduce SWE through ACI (−2.67 %). In contrast, ARI (2.43 %) exceeds the effects of ASI (−0.99 %) and ACI (−0.27 %) by all aerosols, with most contributions from the transported aerosols, and slightly enhances SWE by 0.42 % over lower elevations in wintertime through surface cooling.
-
Surface runoff: As a major component of the water cycle, surface runoff is mainly generated by precipitation, but for mountaintops, the changes in surface runoff are also associated with changes in snowmelt. We find that the seasonal mean surface runoff is reduced by −6.58 % associated with suppressed precipitation and caused by transported and anthropogenic aerosols through ACI (−6.30 %). Over mountaintops, runoff slightly increases in spring due to the enhanced solar absorption by dust aerosols. Runoff decreases after April as a combined effect of less snowpack available for melting caused by earlier snowmelt due to local dust and reduced precipitation due to transported and local anthropogenic aerosols through ACI. Therefore, one of the important impacts of aerosols is to speed up the snowmelt at mountaintops in spring and modify the seasonal cycle of surface runoff.
In summary, we find that the WRF-Chem model simulations with aerosol effects included would produce lower precipitation and SWE by about 10 % and colder temperature by 0.2 K over California than the simulations without aerosols. Therefore, including aerosol effects can reduce the high biases in these variables in the simulations reported previously. Aerosols play an important role in California water resources through the warming of mountaintops and the subsequent modification of precipitation and snowmelt. From October to June the total aerosol effects produce a warming of 0.22 K over mountaintops and reductions in precipitation, SWE, and surface runoff of about 7, 3, and 7 % for the whole domain, with corresponding reductions of 10 % or more over mountaintops. In a dry year (2013–2014), aerosol can have more significant impacts on SWE, with a reduction of up to 9 % for the whole domain and 16 % over mountaintops.
It is challenging to accurately represent aerosol properties in the model (Fast et al., 2014). As pointed out by Wu et al. (2017), biases exist in the current model compared to observations, for example, underestimation of AOD due to poor representation of dust emission and vertical mixing in the warm season. The underestimation of AOD in the model implies that the simulated aerosol effects could also have a low bias. Given the important role that dust plays in the California snowpack, improved dust emission and vertical mixing are needed for accurate quantification of the impact of dust. Also, the underestimation of organic matter (associated with secondary organic aerosol processes) in the model (Wu et al., 2017), which is primarily made up of scattering aerosols, would contribute to the high bias in the simulation of surface temperature. More accurate representations and simulations of these aerosols in the model are needed. In the current WRF-Chem model, the aerosol effect on ice clouds is not included. ACI associated with ice clouds are more complex than that with liquid clouds. For example, a few studies have shown that negative Twomey effects may occur with aerosols and ice clouds, in which increased aerosols (and thus ice nuclei) lead to enhanced heterogeneous nucleation that is associated with larger and fewer ice crystals compared to the homogeneous nucleation counterpart (Chylek et al., 2006; DeMott et al., 2010; Zhao et al., 2018). A recent study shows that the responses of ice crystal effective radii to aerosol loadings are modulated by the water vapor amount in conjunction with several other meteorological parameters. While there is a significant negative correlation between ice effective radius and aerosol loading in moist conditions, consistent with the Twomey effect for liquid clouds, a strong positive correlation between the two occurs in dry conditions (Zhao et al., 2018). Despite numerous studies about the impact of aerosols on ice clouds, the role of anthropogenic aerosols in ice processes, especially over polluted regions, remains a challenging scientific issue. The effect of anthropogenic aerosols on ice formation and cloud radiative properties may be a critical pathway through which anthropogenic activities affect regional climate and present opportunities for further studies using observations and models.
Our model simulation produces relatively larger SWE than the SNOTEL observations. Improvements in snowpack simulation in the land surface model are needed for accurate quantification of aerosol impacts on snowpack. Our results are based on 2 years of simulations. Additional simulations under different meteorological conditions will help to better assess the aerosol impacts on California hydrology quantitatively.
The PRISM data are available through the following link: http://prism.oregonstate.edu/recent/ (last access: 17 April 2018). The CPC data are available through the following link: https://www.esrl.noaa.gov/psd/data/gridded/data.unified.daily.conus.html. The DWR data are available through the following link: http://cdec.water.ca.gov/snow_rain.html The CIMIS data are available through the following link: http://wwwcimis.water.ca.gov/. The SNOTEL data are available through the following link: https://www.wcc.nrcs.usda.gov/snow. The MISR data are available through the following link: https://misr.jpl.nasa.gov/getData/accessData/. The NLDAS MOS0125 albedo data are available through the following link: https://giovanni.gsfc.nasa.gov/giovanni/\#service=TmAvMp&starttime=&endtime=&variableFacets=dataFieldMeasurement:Albedo;dataProductPlatformInstrument:NLDAS Model;dataProductTimeInterval:monthly; (last access: 17 April 2018).
The supplement related to this article is available online at: https://doi.org/10.5194/acp-18-5529-2018-supplement.
The authors declare that they have no conflict of interest.
This study was carried out at the Joint Institute for Regional Earth System
Science and Engineering and Department of Atmospheric and Oceanic Science,
University of California, Los Angeles, and sponsored by California Energy
Commission under grant no. EPC-14-064. Longtao Wu, Jonathan H. Jiang, Hui Su,
and Yong-Sang Choi conducted the work at the Jet Propulsion Laboratory,
California Institute of Technology, under contract with the National
Aeronautics and Space Administration. They acknowledge the funding support
from the NASA ACMAP program. Chun Zhao is supported by the “Thousand Talents
Plan for Young Professionals” program of China. The contribution of Yun Qian
is supported by the US Department of Energy (DOE), Office of Science,
Biological and Environmental Research as part of the Regional and Global
Climate Modeling Program. The Pacific Northwest National Laboratory (PNNL) is
operated for DOE by Battelle Memorial Institute under contract
DE-AC05-76RL01830. We would like to thank two anonymous reviewers for their
constructive comments and suggestions for the improvement of this
paper.
Edited by: Bernhard
Vogel
Reviewed by: two anonymous referees
Ault, A. P., Williams, C. R., White, A. B., Neiman, P. J., Creamean, J. M., Gaston, C. J., Ralph, F. M., and Prather K. A.: Detection of Asian dust in California orographic precipitation, J. Geophys. Res., 116, D16205, https://doi.org/10.1029/2010JD015351, 2011.
Ban, N., Schmidli, J., and Schär C.: Evaluation of the convection-resolving regional climate modeling approach in decade-long simulations, J. Geophys. Res.-Atmos., 119, 7889–7907, doi:10.1002/2014JD021478, 2014.
Barnard, J. C., Fast, J. D., Paredes-Miranda, G., Arnott, W. P., and Laskin, A.: Technical Note: Evaluation of the WRF-Chem “Aerosol Chemical to Aerosol Optical Properties” Module using data from the MILAGRO campaign, Atmos. Chem. Phys., 10, 7325–7340, https://doi.org/10.5194/acp-10-7325-2010, 2010.
Bechtold, P., Semane, N., Lopez, P., Chaboureau, J.-P., Beljaars, A., and Bormann, N.: Representing equilibrium and nonequilibrium convection in large-scale models, J. Atmos. Sci., 71, 734–753, 2014.
Benedict, J. J., Maloney, E. D., Sobel, A. H., Frierson, D. M., and Donner, L. J.: Tropical intraseasonal variability in version 3 of the GFDL atmospheremodel, J. Clim., 26, 426–449, 2013.
Berg, P., Wagner, S., Kunstmann, H., and Schädler, G.: High resolution regional climate model simulations fo rGermany: PartI-Validation, Clim. Dyn., 40, 401–414, 2013.
Binkowski, F. S. and Shankar, U.: The Regional Particulate Matter Model: 1. Model description and preliminary results, J. Geophys. Res., 100, 26191–26209, https://doi.org/10.1029/95JD02093, 1995.
Brandt, R. E., Warren, S. G., and Clarke, A. D.: A controlled snowmaking experiment testing the relation between black-carbon content and reduction of snow albedo, J. Geophys. Res., 116, D08109, https://doi.org/10.1029/2010JD015330, 2011.
Brockhaus, P., Lüthi, D. and Schär C.: Aspects of the diurnal cycle in a regional climate model, Meteorol. Z., 17, 433–s443, 2008.
California Data Exchange Center: DWR data, available at: http://cdec.water.ca.gov/snow_rain.html, last access: 17 April 2018.
Chapman, E. G., Gustafson Jr., W. I., Easter, R. C., Barnard, J. C., Ghan, S. J., Pekour, M. S., and Fast, J. D.: Coupling aerosol-cloud-radiative processes in the WRF-Chem model: Investigating the radiative impact of elevated point sources, Atmos. Chem. Phys., 9, 945–964, https://doi.org/10.5194/acp-9-945-2009, 2009.
Charlson, R. J., Schwartz, S. E., Hales, J. H., Cess, R. D., Coakley Jr., J. A., Hansen, J. E., and Hofmann D. J.: Climate forcing by anthropogenic aerosols, Science, 255, 423–430, https://doi.org/10.1126/science.255.5043.423, 1992.
Chen, M., Xie, P., and CPC Precipitation Working Group: CPC Unified Gauge-based Analysis of Global Daily Precipitation, Western Pacific Geophysics Meeting, Cairns, Australia, 29 July–1 August 2008.
Chylek, P., Dubey, M. K., Lohmann, U., Ramanathan, V., Kaufman, Y. J., Lesins, G., Hudson, J., Altmann, G., and Olsen, S.: Aerosol indirect effect over the Indian Ocean, Geophys. Res. Lett., 33, L06806, https://doi.org/10.1029/2005gl025397, 2006.
CIMIS, data available at: http://wwwcimis.water.ca.gov/, last access: 17 April 2018.
CPC US Unified Precipitation data, data available at: https://www.esrl.noaa.gov/psd/data/gridded/data.unified.daily.conus.html, last access: 17 April 2018.
Creamean, J. M., Suski, K. J., Rosenfeld, D., Cazorla, A., DeMott, P. J., Sullivan, R. C., White, A. B., Ralph, F. M., and Prather, K. A.: Dust and biological aerosols from the Sahara and Asia influence precipitation in the western US, Science, 339, 1572–1578, https://doi.org/10.1126/science.1227279, 2013.
Creamean, J. M., Ault, A. P., White, A. B., Neiman, P. J., Ralph, F. M., Minnis, P., and Prather, K. A.: Impact of interannual variations in sources of insoluble aerosol species on orographic precipitation over California's central Sierra Nevada, Atmos. Chem. Phys., 15, 6535–6548, https://doi.org/10.5194/acp-15-6535-2015, 2015.
Dai, A., Giorgi, F., and Trenberth, K. E.: Observed and model simulated diurnal cycles of precipitation over the contiguous united states, J. Geophys. Res., 104, 6377–6402, 1999.
DeMott, P. J., Prenni, A. J., Liu, X., Kreidenweis, S. M., Petters, M. D., Twohy, C. H., Richardson, M. S., Eidhammer, T., and Rogers, D. C.: Predicting global atmospheric ice nuclei distributions and their impacts on climate, P. Natl. Acad. Sci. USA, 107, 11217–11222, 10.1073/pnas.0910818107, 2010.
Diner, D. J., Beckert, J. C., Reilly, T. H., Bruegge, C. J., Conel, J. E., Kahn, R. A., Martonchik, J. V., Ackerman, T. P., Davies, R., Gerstl, S. A.W., Gordon, H. R., Muller, J. P., Myneni, R. B., Sellers, P. J., Pinty, B., and Verstraete, M. M.: Multi-angle Imaging SpectroRadiometer (MISR) Instrument Description and Experiment Overview, IEEE T. Geosci. Remote, 36, 1072–1087, 1998.
Donner, L. J., Wyman, B., Hemler, R. S., Horowitz, L. W., Ming, Y., Zhao, M., Golaz, J.-C., Ginoux, P., Lin, S.-J., Schwarzkopf, M. D., Austin, J., Alaka, G., Cooke, W. F., Delworth, T. L., Freidenreich, S. M., Gordon, C. T., Griffies, S. M., Held, I. M., Hurlin, W. J., Klein, S. A., Knutson, T. R., Langenhorst, A. R., Lee, H.-C., Lin, Y., Magi, B. I., Malyshev, S. L., Milly, P. C. D., Naik, V., Nath, M. J., Pincus, R., Ploshay, J. J., Ramaswamy, V., Seman, C. J., Shevliakova, E., Sirutis, J. J., Stern, W. F., Stouffer, R. J., Wilson, R. J., Winton, M., Wittenberg, A. T., and Zeng, F.: The dynamical core, physical parameterizations, and basic simulation characteristics of the atmospheric component AM3 of the GFDL global coupled model CM3, J. Clim., 24, 3484–3519, 2011.
Easter, R. C., Ghan, S. J., Zhang, Y., Saylor, R. D., Chapman, E. G., Laulainen, N. S., Abdul-Razzak, H., Leung, L. R., Bian, X., and Zaveri, R. A.: MIRAGE: Model description and evaluation of aerosols and trace gases, J. Geophys. Res., 109, D20210, https://doi.org/10.1029/2004JD004571, 2004.
Emmons, L. K., Walters, S., Hess, P. G., Lamarque, J.-F., Pfister, G. G., Fillmore, D., Granier, C., Guenther, A., Kinnison, D., Laepple, T., Orlando, J., Tie, X., Tyndall, G., Wiedinmyer, C., Baughcum, S. L., and Kloster, S.: Description and evaluation of the Model for Ozone and Related chemical Tracers, version 4 (MOZART-4), Geosci. Model Dev., 3, 43–67, https://doi.org/10.5194/gmd-3-43-2010, 2010.
Fan, J., Leung, L. R., DeMott, P. J., Comstock, J. M., Singh, B., Rosenfeld, D., Tomlinson, J. M., White, A., Prather, K. A., Minnis, P., Ayers, J. K., and Min, Q.: Aerosol impacts on California winter clouds and precipitation during CalWater 2011: local pollution versus long-range transported dust, Atmos. Chem. Phys., 14, 81–101, https://doi.org/10.5194/acp-14-81-2014, 2014.
Fast, J. D., Gustafson Jr., W. I., Easter, R. C., Zaveri, R. A., Barnard, J. C., Chapman, E. G., Grell, G. A., and Peckham, S. E.: Evolution of ozone, particulates, and aerosol direct radiative forcing in the vicinity of Houston using a fully coupled meteorology-chemistry-aerosol model, J. Geophys. Res., 111, D21305, https://doi.org/10.1029/2005JD006721, 2006.
Fast, J. D., Allan, J., Bahreini, R., Craven, J., Emmons, L., Ferrare, R., Hayes, P. L., Hodzic, A., Holloway, J., Hostetler, C., Jimenez, J. L., Jonsson, H., Liu, S., Liu, Y., Metcalf, A., Middlebrook, A., Nowak, J., Pekour, M., Perring, A., Russell, L., Sedlacek, A., Seinfeld, J., Setyan, A., Shilling, J., Shrivastava, M., Springston, S., Song, C., Subramanian, R., Taylor, J. W., Vinoj, V., Yang, Q., Zaveri, R. A., and Zhang, Q.: Modeling regional aerosol and aerosol precursor variability over California and its sensitivity to emissions and long-range transport during the 2010 CalNex and CARES campaigns, Atmos. Chem. Phys., 14, 10013–10060, https://doi.org/10.5194/acp-14-10013-2014, 2014.
Flanner, M. G. and Zender, C. S.: Snowpack radiative heating: Influence on Tibetan Plateau climate, Geophys. Res. Lett., 32, L06501, https://doi.org/10.1029/2004GL022076, 2005.
Flanner, M. G., Zender, C. S., Randerson, J. T., and Rasch, P. J.: Present-day climate forcing and response from black carbon in snow, J. Geophys. Res., 112, D11202, https://doi.org/10.1029/2006JD008003, 2007.
Flanner, M. G., Zender, C. S., Hess, P. G., Mahowald, N. M., Painter, T. H., Ramanathan, V., and Rasch, P. J.: Springtime warming and reduced snow cover from carbonaceous particles, Atmos. Chem. Phys., 9, 2481–2497, https://doi.org/10.5194/acp-9-2481-2009, 2009.
Flanner, M. G., Liu, X., Zhou, C., Penner, J. E., and Jiao, C.: Enhanced solar energy absorption by internally-mixed black carbon in snow grains, Atmos. Chem. Phys., 12, 4699–4721, https://doi.org/10.5194/acp-12-4699-2012, 2012.
Fosser, G., Khodayar, S., and Berg, P.: Benefit of convection permitting climate model simulations in the representation of convective precipitation, Clim. Dyn., 44, 45–60, 2014.
Giovanni: NLDAS MOS0125 albedo data, data available at: https://giovanni.gsfc.nasa.gov/giovanni//#service=TmAvMp&starttime=&endtime=&variableFacets=dataFieldMeasurement:Albedo;BdataProductTimeInterval:monthly;, last access: 17 April 2018.
Grell, G. A., Peckham, S. E., Schmitz, R., McKeen, S. A., Frost, G., Skamarock, W. C., and Eder, B.: Fully coupled “online” chemistry within the WRF model, Atmos. Environ., 39, 6957–6975, 2005.
Griffin, D. and Anchukaitis, K. J.: How unusual is the 2012–2014 California drought?, Geophys. Res. Lett., 41, 9017–9023, https://doi.org/10.1002/2014GL062433, 2014.
Gu, Y., Liou, K. N., Xue, Y., Mechoso, C. R., Li, W., and Luo, Y.: Climatic effects of different aerosol types in China simulated by the UCLA general circulation model, J. Geophys. Res., 111, D15201, https://doi.org/10.1029/2005JD006312, 2006.
Gu, Y., Liou, K. N., Lee, W.-L., and Leung, L. R.: Simulating 3-D radiative transfer effects over the Sierra Nevada Mountains using WRF, Atmos. Chem. Phys., 12, 9965–9976, https://doi.org/10.5194/acp-12-9965-2012, 2012a.
Gu, Y., Liou, K. N., Jiang, J. H., Su, H., and Liu, X.: Dust aerosol impact on North Africa climate: a GCM investigation of aerosol-cloud-radiation interactions using A-Train satellite data, Atmos. Chem. Phys., 12, 1667–1679, https://doi.org/10.5194/acp-12-1667-2012, 2012b.
Gu, Y., Liou, K. N., Jiang, J. H., Fu, R., Lu, S., and Xue, Y.: A GCM investigation of impact of aerosols on the precipitation in Amazon during the dry to wet transition, Clim. Dyn., 48, 2393–2404, https://doi.org/10.1007/s00382-016-3211-7, 2017.
Gustafson, W. I., Chapman, E. G., Ghan, S. J., Easter, R. C., and Fast, J. D.: Impact on modeled cloud characteristics due to simpli?ed treatment of uniform cloud condensation nuclei during NEAQS 2004, Geophys. Res. Lett., 34, L19809, https://doi.org/10.1029/2007GL030021, 2007.
Hadley, O. L. and Kirchstetter, T. W.: Black-carbon reduction of snow albedo, Nat. Clim. Change, 2, 437–440, https://doi.org/10.1038/nclimate1433, 2012.
Hadley, O. L., Corrigan, C. E., Kirchstetter, T. W., Cliff, S. S., and Ramanathan, V.: Measured black carbon deposition on the Sierra Nevada snow pack and implication for snow pack retreat, Atmos. Chem. Phys., 10, 7505–7513, https://doi.org/10.5194/acp-10-7505-2010, 2010.
Hansen, J., Sato, M., and Ruedy, R.: Radiative forcing and climate response, J. Geophys. Res., 102, 6831–6864, https://doi.org/10.1029/96JD03436, 1997.
Hess, M., Koepke, P., and Schult, I.: Optical Properties of Aerosols and Clouds: The Software Package OPAC, B. Am. Meteor. Soc., 79, 831–844, https://doi.org/10.1175/1520-0477(1998)079<0831:OPOAAC>2.0.CO;2, 1998.
Hu, Z., Zhao, C., Huang, J., Leung, L. R., Qian, Y., Yu, H., Huang, L., and Kalashnikova, O. V.: Trans-Pacific transport and evolution of aerosols: evaluation of quasi-global WRF-Chem simulation with multiple observations, Geosci. Model Dev., 9, 1725–1746, https://doi.org/10.5194/gmd-9-1725-2016, 2016.
Jacobson, M. Z.: Climate response of fossil fuel and biofuel soot, accounting for soot's feedback to snow and sea ice albedo and emissivity, J. Geophys. Res., 109, D21201, https://doi.org/10.1029/2004JD004945, 2004.
Jet Propulsion Laboratory: MISR, data available at: https://misr.jpl.nasa.gov/getData/accessData/, last access: 17 April 2018.
Jiang, H. and Feingold, G.: Effect of aerosol on warm convective clouds: Aerosol-cloud-surface flux feedbacks in a new coupled large eddy model, J. Geophys. Res., 111, D01202, https://doi.org/10.1029/2005JD006138, 2006.
Jiang, J. H., Livesey, N. J., Su, H., Neary, L., McConnell, J. C., and Richards, N. A.: Connecting surface emissions, convective uplifting, and long-range transport of carbon monoxide in the upper-troposphere: New observations from the Aura Microwave Limb Sounder, Geophys. Res. Lett., 34, L18812, https://doi.org/10.1029/2007GL030638, 2007.
Johnson, J. B. and Marks, D.: Thedetectionandcorrectionof snow-water equivalent pressure sensor errors, Hydrol. Process., 18, 3513–3525, 2004.
Kiehl, J. and Briegleb, B.: The relative roles of sulfate aerosols and greenhouse gases in climate forcing, Science, 260, 311–314, 1993.
Kim, J., Gu, Y., and Liou, K.-N.: The impact of the direct aerosol radiative forcing on surface insolation and spring snowmelt in the southern Sierra Nevada, J. Hydrometeorol., 7, 976–983, 2006.
Koren, I., Kaufman, Y. J., Remer, L. A., and Martins, J. V.: Measurement of the effect of Amazon smoke on inhibition of cloud formation, Science, 303, 1342–1345, https://doi.org/10.1126/science.1089424, 2004.
Lee, W.-L. and Liou, K. N.: Effect of absorbing aerosols on snow albedo reduction in the Sierra Nevada, Atmos. Environ., 55, 425–430. https://doi.org/10.1016/j.atmosenv.2012.03.024, 2012.
Lee, W.-L., Gu, Y., Liou, K. N., Leung, L. R., and Hsu, H.-H.: A global model simulation for 3-D radiative transfer impact on surface hydrology over the Sierra Nevada and Rocky Mountains, Atmos. Chem. Phys., 15, 5405–5413, https://doi.org/10.5194/acp-15-5405-2015, 2015.
Leung, L. R., Qian, Y., Bian, X., Washington, W. M., Han, J., and Roads, J. O.: Mid-century ensemble regional climate change scenarios for the western United States, Clim. Change, 62, 75–113, 2004.
Liou, K. N., Gu, Y., Leung, L. R., Lee, W. L., and Fovell, R. G.: A WRF simulation of the impact of 3-D radiative transfer on surface hydrology over the Rocky Mountains and Sierra Nevada, Atmos. Chem. Phys., 13, 11709–11721, https://doi.org/10.5194/acp-13-11709-2013, 2013.
Lynn, B., Khain, A., Rosenfeld, D., and Woodley, W. L.: Effects of aerosols on precipitation from orographic clouds, J. Geophys. Res., 112, D10225, https://doi.org/10.1029/2006JD007537, 2007.
Meyer, J. D. D., Jin, J., and Wang, S.-Y.: Systematic patterns of the inconstancy between snow water equivalent and accumulated precipitation as reported by the snowpack telemetry network, J. Hydrometeorol., 13, 1970–1976, https://doi.org/10.1175/JHM-D-12-066.1, 2012.
National Resources Conservation Service: SNOTEL, data available at: https://www.wcc.nrcs.usda.gov/snow/, last access: 17 April 2018.
Oaida, C. M., Xue, Y., Flanner, M. G., Skiles, S. M., De Sales, F., and Painter, T. H.: Improving snow albedo processes in WRF/SSiB regional climate model to assess impact of dust and black carbon in snow on surface energy balance and hydrology over western U.S., J. Geophys. Res.-Atmos., 120, 3228–3248. https://doi.org/10.1002/2014JD022444, 2015.
Painter, T. H., Barrett, A. P., Landry, C. C., Neff, J. C., Cassidy, M. P., Lawrence, C. R., McBride, K. E., and Farmer, G. L.: Impact of disturbed desert soils on duration of mountain snow cover, Geophys. Res. Lett., 34, L12502, https://doi.org/10.1029/2007GL030284, 2007.
Painter, T. H., Deems, J. S., Belnap, J., Hamlet, A. F., Landry, C. C., Udall, B.: Response of Colorado River runoff to dust radiative forcing in snow, P. Natl. A. Sci. USA, 2010, 107, 17125–17130, 2010.
Pepin, N., Bradley, R. S., Diaz, H. F., Baraer, M., Caceres, E. B., Forsythe, N., H. Fowler, H., Greenwood, G., Hashmi, M. Z., Liu, X. D., Miller, J. R., Ning, L., Ohmura, A., Palazzi, E., Rangwala, I., Schöner, W., Severskiy, I., Shahgedanova, M., Wang, M. B., Williamson, S. N., and Yang., D. Q.: Elevation-dependent warming in mountain regions of the world, Nat. Clim. Change, 5, 424, https://doi.org/10.1038/nclimate2563, 2015.
Prein, A. F., Holland, G. J., Rasmussen, R. M., Done, J., Ikeda, K., Clark, M. P., and Liu, C. H.: Importance of regional climate model grid spacing for the simulation of heavy precipitation in the Colorado head waters, J. Clim., 26, 4848–4857, 2013.
Prein, A. F., Langhans, W., Fosser, G., ferrone, A., Ban, N., Goergen, K., Keller, M., Tolle, M., Gutjahr, O., Feser, F., Brisson, Erwan, Kollett, S., Schimidle, J., van Lipzig, N. P. M., and Leung, R.: A review on regional convection-permitting climate modeling: Demonstrations, prospects, and challenges, Rev. Geophys., 53, 323–361, https://doi.org/10.1002/2014RG000475, 2015.
PRISM Climate Group, Oregon State University, available at: http://prism.oregonstate.edu(last access: 17 April 2018), created 4 February 2004.
Qian Y., Leung, L. R., Ghan, S. J., and Giorgi, F.: Regional Climate Effects of Aerosols Over China: Modeling and Observation, Tellus B, 55, 914–934, 2003.
Qian, Y., Gustafson Jr., W. I., Leung, L. R., and Ghan, S. J.: Effects of soot-induced snow albedo change on snowpack and hydrological cycle in western United States based on Weather Research and Forecasting chemistry and regional climate simulations, J. Geophys. Res., 114, D03108, https://doi.org/10.1029/2008JD011039, 2009a.
Qian, Y., Gong, D., Fan, J., Leung, L. R., Bennartz, R., Chen, D., and Wang, W.: Heavy pollution suppresses light rain in China: observations and modeling, J. Geophys. Res.-Atmos., 114, D00K02, https://doi.org/10.1029/2008JD011575, 2009b.
Qian, Y., Flanner, M. G., Leung, L. R., and Wang, W.: Sensitivity studies on the impacts of Tibetan Plateau snowpack pollution on the Asian hydrological cycle and monsoon climate, Atmos. Chem. Phys., 11, 1929–1948, https://doi.org/10.5194/acp-11-1929-2011, 2011.
Qian, Y., Yasunari, T. J., Doherty, S. J., Flanner, M. G., Lau, W. K., Ming, J., Wang, H., Wang, M., Warren, S. G., and Zhang, R.: Light-absorbing Particles in Snow and Ice: Measurement and Modeling of Climatic and Hydrological Impact, Adv. Atmos. Sci., 32, 64–91, https://doi.org/10.1007/s00376-014-0010-0, 2015.
Rosenfeld, D., Woodley, W. L., Axisa, D., Freud, E., Hudson, J. G., and Givati, A.: Aircraft measurements of the impacts of pollution aerosols on clouds and precipitation over the Sierra Nevada, J. Geophys. Res., 113, D15203, https://doi.org/10.1029/2007JD009544, 2008a.
Rosenfeld, D., Lohmann, U., Raga, G. B., O'Dowd, C. D., Kulmala, M., Fuzzi, S., Reissell, A., and Andreae, M. O.: Flood or drought: How do aerosols affect precipitation?, Science, 321, 1309–1313, https://doi.org/10.1126/science.1160606, 2008b.
Satoh, M., Matsuno, T., Tomita, H., Miura, H., Nasuno, T., and Iga, S.-I.: Nonhydrostatic Icosahedral Atmospheric Model (NICAM) for global cloud resolvings imulations, J. Comput. Phys., 227, 3486–3514, 2008.
Serreze, M. C., Clark, M. P., Armstrong, R. L., McGinnis, D. A., and Pulwarty, R. S.: Characteristics of the western United States snowpack from snowpack telemetry (SNOTEL) data, Water Resour. Res., 35, 2145–2160, 1999.
Serreze, M. C., Clark, M. P., and Frei, A.: Characteristics of large snowfall events in the montane western United States as examined using snowpack telemetry (SNOTEL) data, Water Resour. Res., 37, 675–688, 2001.
Sheffield, J., Pan, M., Wood, E. F., Mitchell, K. E., Houser, P. R., Schaake, J. C., Robock, A., Lohmann, D., Cosgrove, B., Duan, Q., Luo, L., Higgins, R. W., Pinker, R. T., Dan Tarpley, J., and Ramsay, B. H.: Snow process modeling in the North American Land Data Assimilation System (NLDAS): 1. Evaluation of model-simulated snow cover extent, J. Geophys. Res., 108, 8849, https://doi.org/10.1029/2002JD003274, 2003.
Snyder, R. L.: California irrigation management information system, Am. J. Potato Res., 61, 229–234, 1984.
Toon, O. B., McKay, C. P., Ackerman, T. P. and Santhanam, K.: Rapid calculation of radiative heating rates and photodissociation rates in inhomogeneous multiple scattering atmospheres, J. Geophys. Res., 94, 16287–16301, https://doi.org/10.1029/JD094iD13p16287, 1989.
Twomey, S.: The influence of pollution on the shortwave albedo of clouds, J. Atmos. Sci., 34, 1149–1152, 1977.
VanCuren, R. A.: Asian aerosols in North America: Extracting the chemical composition and mass concentration of the Asian continental aerosol plume from long-term aerosol records in the western United States, J. Geophys. Res., 108, 4623, https://doi.org/10.1029/2003JD003459, 2003.
VanCuren, R. A., Cliff, S. S., Perry, K. D., and Jimenez-Cruz, M.: Asian continental aerosol persistence above the marine boundary layer over the eastern North Pacific: Continuous aerosol measurements from Intercontinental Transport and Chemical Transformation 2002 (ITCT 2K2), J. Geophys. Res., 110, D09S90, https://doi.org/10.1029/2004JD004973, 2005.
Vicars, W. C. and Sickman, J. O.: Mineral dust transport to the Sierra Nevada, California: Loading rates and potential source areas, J. Geophys. Res., 116, G01018, https://doi.org/10.1029/2010JG001394, 2011.
Waliser, D., Kim, J., Xue, Y., Chao, Y., Eldering, A., Fovell, R., Hall, A., Li, Q., Liou, K. N., McWilliams, J., Kapnick, S., Vasic, R., Sale, F. D., and Yu, Y.: Simulating the Sierra Nevada snowpack: The impact of snow albedo and multi-layer snow physics, Clim. Change, 109, 95–117, https://doi.org/10.1007/s10584-011-0312-5, 2011.
Wang, Y., Jiang, J. H., and Su, H.: Atmospheric Responses to the Redistribution of Anthropogenic Aerosols, J. Geophys. Res.-Atmos., 120, 9625–9641, https://doi.org/10.1002/2015JD023665, 2015.
Warren, S. and Wiscombe W.: Dirty snow after nuclear war, Nature, 313, 467–470, 1985.
Weisman, M. L., Skamarock, W. C., and Klemp, J. B.: The resolution dependence of explicitly modeled convective systems, Mon. Weather Rev., 125, 527–548, 1997.
Wiscombe, W. J. and Warren, S. G.: A model for the spectral albedo of snow, I: Pure snow, J. Atmos. Sci., 37, 2712–2733, 1980.
Wu, L., Su, H., Kalashnikova, O. V., Jiang, J. H., Zhao, C., Garay, M. J., Campbell, J. R., and Yu, N.: WRF-Chem simulation of aerosol seasonal variability in the San Joaquin Valley, Atmos. Chem. Phys., 17, 7291–7309, https://doi.org/10.5194/acp-17-7291-2017, 2017.
Zaveri, R. A. and Peters, L. K.: A new lumped structure photochemical mechanism for large-scale applications, J. Geophys. Res., 104, 30387–30415, 1999.
Zaveri, R. A., Easter, R. C., Fast, J. D., and Peters, L. K.: Model for Simulating Aerosol Interactions and Chemistry (MOSAIC), J. Geophys. Res., 113, D13204, https://doi.org/10.1029/2007JD008782, 2008.
Zhao, B., Liou, K.-N., Gu, Y., He, C., Lee, W.-L., Chang, X., Li, Q., Wang, S., Tseng, H.-L. R., Leung, L.-Y. R., and Hao, J.: Impact of buildings on surface solar radiation over urban Beijing, Atmos. Chem. Phys., 16, 5841–5852, https://doi.org/10.5194/acp-16-5841-2016, 2016.
Zhao, B., Liou, K.-N., Gu, Y., Jiang, J. H., Li, Q., Fu, R., Huang, L., Liu, X., Shi, X., Su, H., and He, C.: Impact of aerosols on ice crystal size, Atmos. Chem. Phys., 18, 1065–1078, https://doi.org/10.5194/acp-18-1065-2018, 2018.
Zhao, C., Liu, X., Leung, L. R., Johnson, B., McFarlane, S. A., Gustafson Jr., W. I., Fast, J. D., and Easter, R.: The spatial distribution of mineral dust and its shortwave radiative forcing over North Africa: modeling sensitivities to dust emissions and aerosol size treatments, Atmos. Chem. Phys., 10, 8821–8838, https://doi.org/10.5194/acp-10-8821-2010, 2010.
Zhao, C., Liu, X., Ruby Leung, L., and Hagos, S.: Radiative impact of mineral dust on monsoon precipitation variability over West Africa, Atmos. Chem. Phys., 11, 1879–1893, https://doi.org/10.5194/acp-11-1879-2011, 2011.
Zhao, C., Leung, L. R., Easter, R., Hand, J., and Avise, J.: Characterization of speciated aerosol direct radiative forcing over California, J. Geophys. Res., 118, 2372–2388, https://doi.org/10.1029/2012JD018364, 2013a.
Zhao, C., Chen, S., Leung, L. R., Qian, Y., Kok, J. F., Zaveri, R. A., and Huang, J.: Uncertainty in modeling dust mass balance and radiative forcing from size parameterization, Atmos. Chem. Phys., 13, 10733–10753, https://doi.org/10.5194/acp-13-10733-2013, 2013b.
Zhao, C., Hu, Z., Qian, Y., Ruby Leung, L., Huang, J., Huang, M., Jin, J., Flanner, M. G., Zhang, R., Wang, H., Yan, H., Lu, Z., and Streets, D. G.: Simulating black carbon and dust and their radiative forcing in seasonal snow: a case study over North China with field campaign measurements, Atmos. Chem. Phys., 14, 11475–11491, https://doi.org/10.5194/acp-14-11475-2014, 2014.