the Creative Commons Attribution 4.0 License.
the Creative Commons Attribution 4.0 License.
 | 15 Jan 2018
Chemical characteristics of submicron particles at the central Tibetan Plateau: insights from aerosol mass spectrometry
Jianzhong Xu
Jinsen Shi
Xinlei Ge
Conghui Xie
Junfeng Wang
Shichang Kang
Ruixiong Zhang
Yuhang Wang
Recent studies have revealed a significant influx of anthropogenic aerosol from South Asia to the Himalayas and Tibetan Plateau (TP) during pre-monsoon period. In order to characterize the chemical composition, sources, and transport processes of aerosol in this area, we carried out a field study during June 2015 by deploying a suite of online instruments including an Aerodyne high-resolution time-of-flight aerosol mass spectrometer (HR-AMS) and a multi-angle absorption photometer (MAAP) at Nam Co station (90∘57′ E, 30∘46′ N; 4730 m a.s.l.) at the central of the TP. The measurements were made at a period when the transition from pre-monsoon to monsoon occurred. The average ambient mass concentration of submicron particulate matter (PM1) over the whole campaign was ∼ 2.0 µg m−3, with organics accounting for 68 %, followed by sulfate (15 %), black carbon (8 %), ammonium (7 %), and nitrate (2 %). Relatively higher aerosol mass concentration episodes were observed during the pre-monsoon period, whereas persistently low aerosol concentrations were observed during the monsoon period. However, the chemical composition of aerosol during the higher aerosol concentration episodes in the pre-monsoon season was on a case-by-case basis, depending on the prevailing meteorological conditions and air mass transport routes. Most of the chemical species exhibited significant diurnal variations with higher values occurring during afternoon and lower values during early morning, whereas nitrate peaked during early morning in association with higher relative humidity and lower air temperature. Organic aerosol (OA), with an oxygen-to-carbon ratio (O ∕ C) of 0.94, was more oxidized during the pre-monsoon period than during monsoon (average O ∕ C ratio of 0.72), and an average O ∕ C was 0.88 over the entire campaign period, suggesting overall highly oxygenated aerosol in the central TP. Positive matrix factorization of the high-resolution mass spectra of OA identified two oxygenated organic aerosol (OOA) factors: a less oxidized OOA (LO-OOA) and a more oxidized OOA (MO-OOA). The MO-OOA dominated during the pre-monsoon period, whereas LO-OOA dominated during monsoon. The sensitivity of air mass transport during pre-monsoon with synoptic process was also evaluated with a 3-D chemical transport model.
- Article
(9874 KB) -
Supplement
(3197 KB) - BibTeX
- EndNote


The Tibetan Plateau (TP) and Himalayas form a vast and elevated highland in Central Asia that extends over the area of 27–45∘ N, 70–105∘ E with a mean elevation of more than 4000 m above sea level (a.s.l.). It is a sparsely populated area with minimal local pollution. The TP is an ideal area for observations of free-tropospheric air masses and aerosol transported from polluted areas surrounding the TP after long distances. Determination of the chemical characteristics of aerosol particles in the TP is important for assessments of their influences on atmospheric chemistry and climate (Li et al., 2016), which are so far poorly understood due to harsh conditions and logistical limitations.
Over recent decades, an increasing number of field studies have been conducted in these regions to characterize aerosol physical and chemical features from mountain observatories, e.g., the Nepal Climate Observatory-Pyramid (5079 m), which is set up for long-term monitoring and synchronous observation (Bonasoni et al., 2010; Liu et al., 2017). There are significant seasonal variations in aerosol mass loading in the southern TP and Himalayas. Higher aerosol concentration was often found during pre-monsoon due to less precipitation and favorable atmospheric circulation (Bonasoni et al., 2010; Marinoni et al., 2010, 2013; Zhao et al., 2013). For example, the concentration of carbonaceous species at the Qomolangma (Mt. Everest) station (4276 m a.s.l.), northern Himalayas, during pre-monsoon was found to be 3–5 times higher than that during the monsoon periods (Cong et al., 2015). Since this seasonal variation of aerosol loading is consistent at both the southern and northern Himalayas (C. Xu et al., 2014), aerosol plume was thought to be able to cross the Himalayas, a finding which is also supported by model results (Lu et al., 2012; Lüthi et al., 2015; Zhang et al., 2015). During monsoon period, ambient aerosol from the upwind sources is significantly scavenged during long-range transport and air mass mainly originates from marine area, which can lead to aerosol chemical differences between pre-monsoon and monsoon. The distinct seasonal variation of aerosol loading is mainly attributed to the change of the dominant climatic systems and afterwards to weather conditions. During pre-monsoon, the cold and dry southern westerlies dominated the southern TP and Himalayas, while the South Asia monsoon covers most of South Asia, Himalayas, and the southern TP during summer period.
Most of the studies conducted in these regions focused on some specific species, such as black carbon, which has strong light absorption. Burning of biomass fuels and wildfires in the southern Himalaya and South Asia are thought to be important sources for black carbon (Stone et al., 2010; Engling et al., 2011; Kumar et al., 2011). However, a recent study shows that sources of black carbon in the region of South Asia are highly complex, including emissions from low-efficiency transport tools and cooking using cow dung and biogas (Stockwell et al., 2016). These burning activities also emit other species such as organic and inorganic particulate species and volatile organic compounds, which generate a well-mixed aerosol plume eventually via processes such as coagulation, evaporation, oxidation, and condensation. Fang et al. (2015) recently suspected that biogenic aerosol could also be an important contribution for aerosol in the TP during summer. However, these mixed plumes have been rarely, if ever, characterized by comprehensive field measurements.
Filter-based sampling methods with a low time resolution (days) have been widely adopt in these remote regions due to logistical difficulties with deployment of real-time instruments. The low time resolution made the understanding of chemical processes of aerosol during transport challenging. Secondary species such as sulfate and water-soluble organic carbon (WSOC) are normally the dominant species in aerosol. For example, WSOC accounted for about 60 % of organic carbon (OC), and the ratio of OC to elemental carbon (EC) could be up to 10 (Zhao et al., 2013; Cong et al., 2015), suggesting a dominant contribution of secondary organic aerosol (SOA) to carbonaceous aerosol loading in the TP. The ambient conditions at high-elevation regions are characterized by higher solar radiation and concentrations of oxidants such as O3, which makes photochemical processing in this high-elevation remote region intense and likely dominant. High time resolution measurement is thus necessary in this region for detecting short-term events and the evolution of pollutants. In addition, the high-time-resolution data are useful for constraining atmospheric chemical transport models.
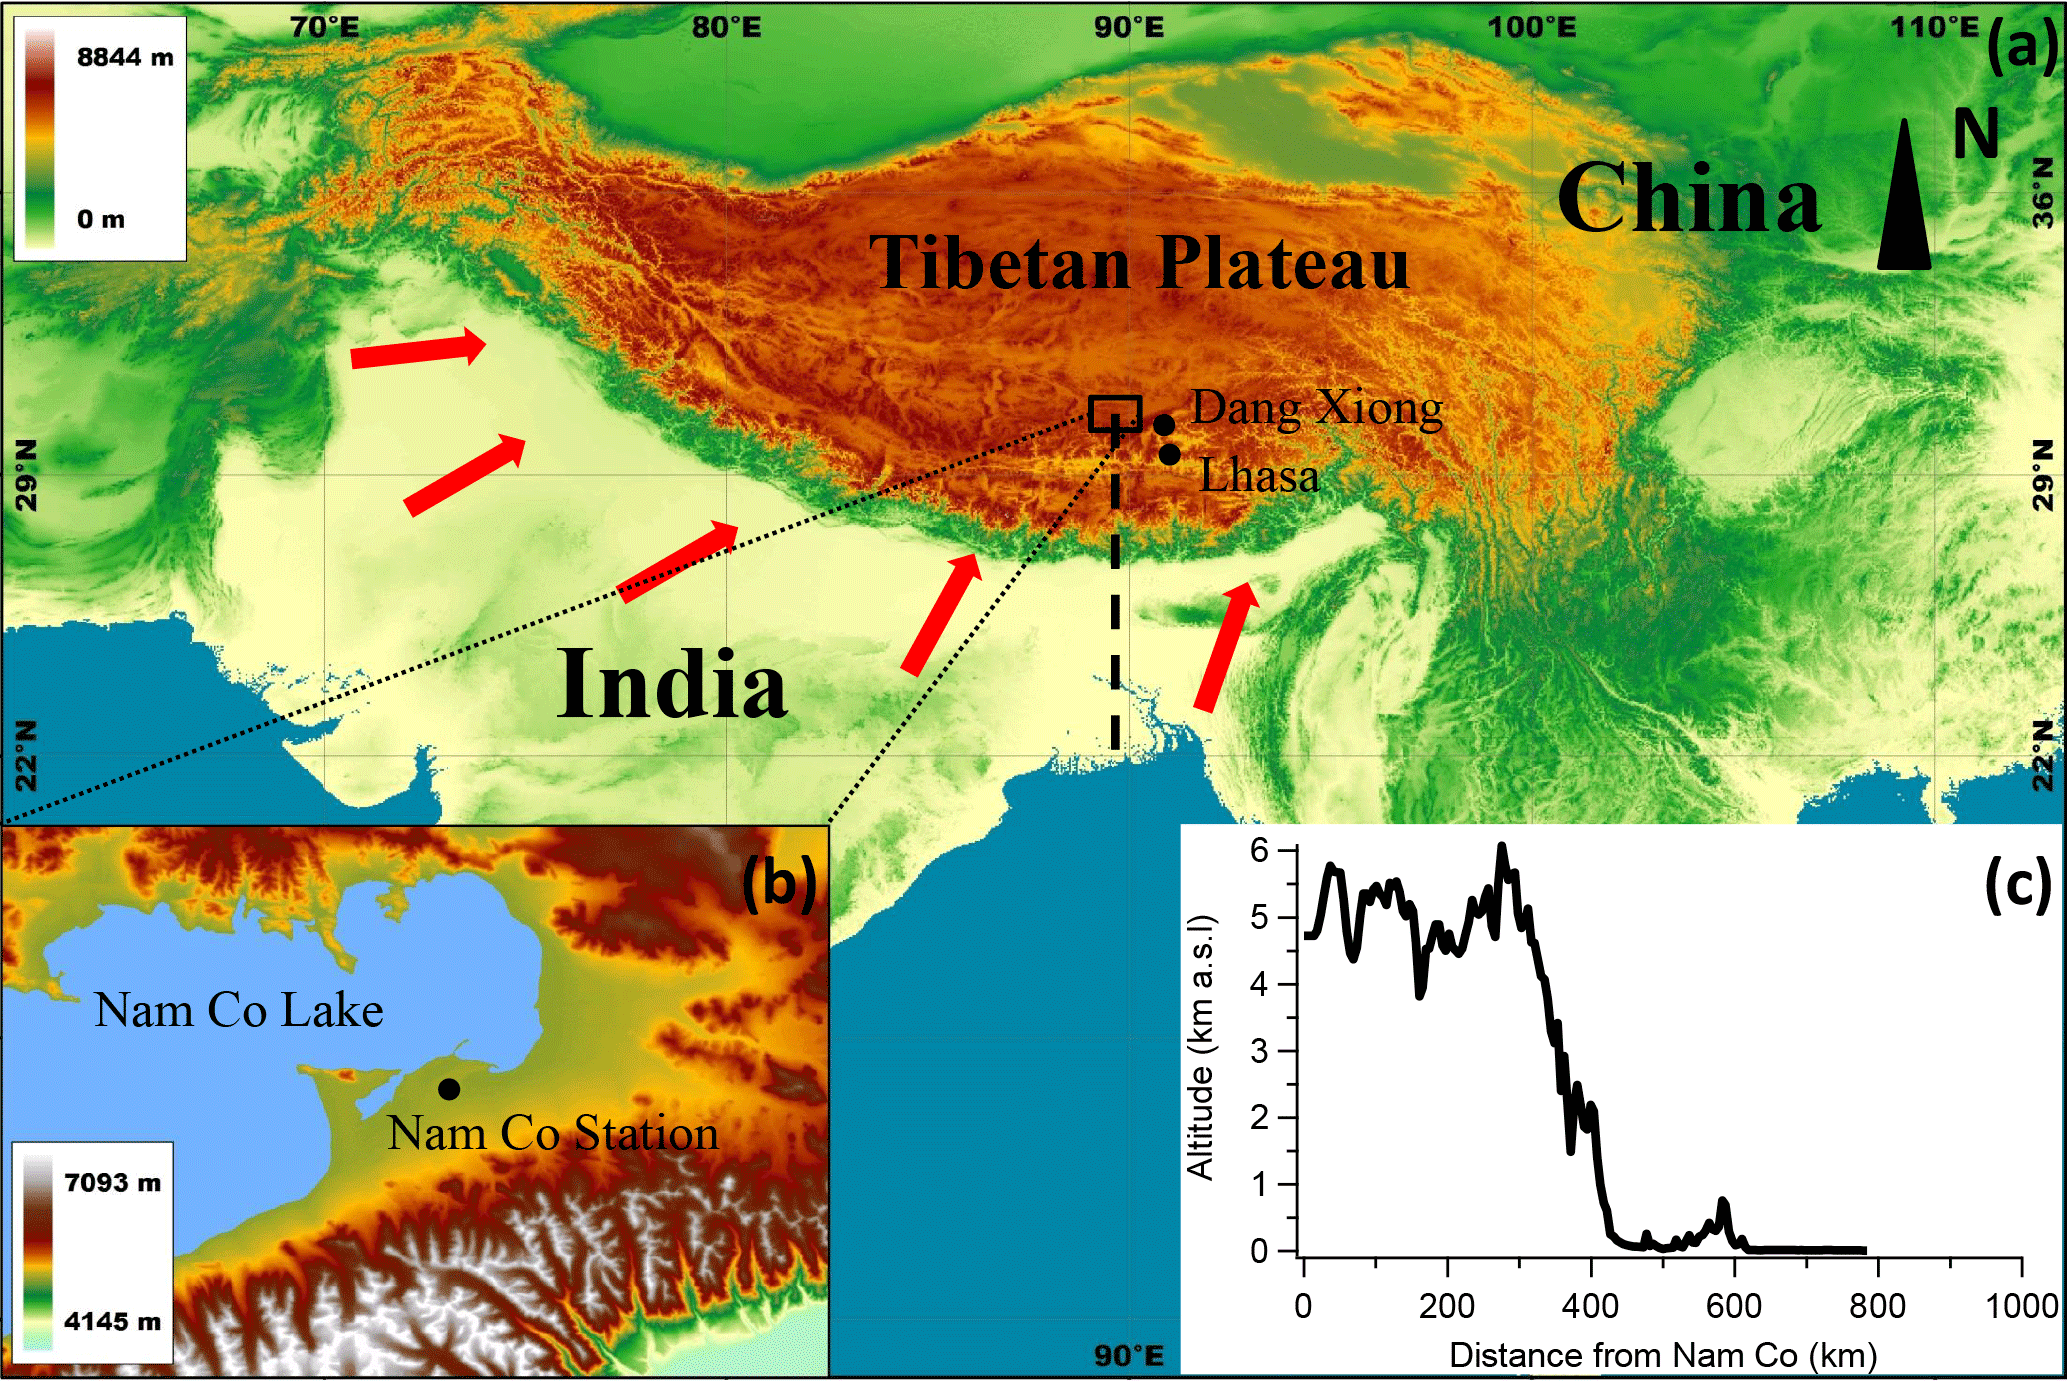
Figure 1Location map for (a) the Tibetan Plateau and (b) Nam Co station, colored according to altitude. (c) The profile of altitude from costal area to Nam Co station (vertical dashed line). The red arrows in the map represent the possible wind direction.
Aerodyne aerosol mass spectrometers (AMSs) have been widely used to study the chemical composition of non-refractory submicron particle (e.g., J. Xu et al., 2014, 2016). There are two merits of the AMS: its high time resolution and bulk measurement. The high time resolution is usually in minutes which has advanced our understanding of fundamental chemical processes of fine aerosols in different regions of the world (Canagaratna et al., 2007). The bulk measurements allow us to obtain a wealth of information on various aerosol chemical species simultaneously. The organic aerosol, which is often the most important component of aerosol, can be further analyzed to determine average elemental ratios and, by positive matrix factorization (PMF) analysis, sources and atmospheric processes (Ulbrich et al., 2009; Zhang et al., 2011). The atomic elemental ratios of oxygen and hydrogen to carbon (O ∕ C and H ∕ C) calculated from the organic aerosol (OA) mass spectra can provide information about the sources and evolution processes of OA in the atmosphere (Aiken et al., 2008; Heald et al., 2010; Kroll et al., 2011; Ng et al., 2011). They also often closely correlate with key OA properties such as hygroscopicity, density, and phase separation (Jimenez et al., 2009; Bertram et al., 2011). In addition, due to high sensitivity and low detection limits, AMS has been successfully deployed at many remote sites with low aerosol mass loading such as Antarctica (Schmale et al., 2013; Giordano et al., 2017).
The study here presents results from measurements using an AMS at the central TP during the transitional period from pre-monsoon to monsoon. The study was designed to characterize aerosol chemical composition, temporal variations, transport processes, and emission sources. During the campaign, besides the AMS, multiple other real-time instruments were also deployed.
2.1 Site description
The field study was conducted between 31 May and 1 July 2015 at a high-altitude observatory, i.e., Nam Co station for Multisphere Observation and Research, Chinese Academy of Sciences (90∘57′ E, 30∘46′ N; 4730 m a.s.l.), at the central part of the TP (Fig. 1). The Nam Co station is located near Nam Co Lake (Fig. 1b), the second largest inland lake in the TP (area: 1920 km2) which is located at the northern border of the Nyainqentanglha Mountains. The melted glacier from the Nyainqentanglha Mountains supplies water to the lake each year during the warm season. The Nam Co station and its surrounding is a pristine region except for a small village that is about 10 km west of the station with a population of 300 to 500. In the past several years, tourism at this beautiful lake has grown. A highway for tourists was built about 3 km south of the station with low traffic intensity (less than 300 cars per day) during June. The capital city (Lhasa) of the Tibet Autonomous Region is about 100 km southeast of the station, with an average elevation of 3600 m a.s.l., between which are the Nyainqentanglha Mountains (higher than 6000 m a.s.l.; Fig. 1c). The closest town, Dangxiong, is alongside the famous Qinghai–Tibet Highway and about 70 km east of the station, with an average elevation of 4200 m a.s.l. Overall, the station is surrounded by the mountains in the south and east, and the lake to the west. The ecology of surrounding area is semi-arid land dominated by alpine meadow and barren areas. The precipitation mainly occurs during summer monsoon period. The cooking and heating at the station uses electric power and natural gas.
2.2 Instrument setup
The study was conducted at the observatory field of the station using a custom-made trailer with inlet stepped out of the top with the height of ∼ 5 m above ground. All the instruments were arranged inside the trailer where the air temperature was controlled at ∼ 20 ∘C by two air conditioners. The air flow of inlet was maintained by a vacuum pump with a flow rate of 10 L min−1, and several instruments took samples from this inlet including a high-resolution time-of-flight aerosol mass spectrometer (HR-AMS, Aerodyne Research Inc., Billerica, MA, USA), a custom-made scanning mobility particle sizer (SMPS), a soot particle Aerodyne mass spectrometer (SP-AMS, Aerodyne Research Inc., Billerica, MA, USA), a single-particle intracavity laser-induced incandescence photometer (SP2, DMT, Inc., Boulder, CO, USA), and a seven-wavelength aethalometer (model AE31, Magee Scientific, Berkeley, CA, USA). The total flow rate of the inlet was maintained at ∼ 16 L min−1 and a PM2.5 cyclone was used in the front of the inlet (model URG-2000-30EH, URG Corp., Chapel Hill, NC, USA) to remove coarse particles. Several additional instruments were also co-located but with their own inlets, such as a nephelometer (model 3563, TSI, Shoreview, MN, USA), a PM2.5 sampler (model PQ200, BGI, USA), and a multi-angle absorption photometer (MAAP, model 5012, Thermo Electron Cooperation, USA). The meteorological data were recorded at the tower of the Nam Co station at a height of 20 m above ground.
HR-AMS was used to measure the non-refractory PM1 (NR-PM1), which was thermally vaporized at ∼ 600 ∘C, ionized with a 70 eV electron impact and determined by using a time-of-flight mass spectrometry. The details of the instrument have been described elsewhere (DeCarlo et al., 2006). For our study, HR-AMS was only operated with V mode with 5 min resolution due to the low aerosol mass loading. Due to malfunction of the chopper, the size distribution of NR-PM1 was not determined. The HR-AMS was calibrated for ionization efficiency (IE) with the ammonium nitrate following standard procedures (Jayne et al., 2000) at the beginning, middle, and end of the study. Particulate-free air was sampled twice during the study period to adjust the influence of air on the fragmentation table and determine the detection limits (DLs) of aerosol species. The DLs were calculated as 3 times the standard deviations (3σ) of the measured values during the particle-free sampling periods. The 2.5 min DLs for organic, sulfate, nitrate, ammonium, and chloride were determined at 0.108, 0.014, 0.007, 0.002, and 0.010 µg m−3, which are comparable to the values reported in previous studies.
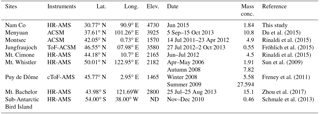
Table 1Summary of AMS measurement at high-elevation sites around the world. The mass concentration was for NR-PM1.
2.3 Data processing
The HR-ToF-AMS data were processed using the standard software of SQUIRREL (v1.56) and PIKA (v1.15c) written in IGOR (Wavemetrics, Inc., Lake Oswego, OR, USA; http://cires.colorado.edu/jimenez-group/ToFAMSResources/ToFSoftware/index.html) to determine the mass concentrations of the NR-PM1 species and the ion-speciated mass spectra of organics. An empirical particle collection efficiency (CE) of 0.5 was used, which has been widely used in field studies employing AMS with a dryer installed in front of the equipment's particle inlet. This CE value was further validated by the consistency and reasonable slope between HR-AMS-measured mass concentrations and SMPS-determined particle volumes (Sect. 3.1.2, R2= 0.9, slope = 1.48). The elemental ratios of OA (O ∕ C; H ∕ C; and organic matter to carbon, OM ∕ OC) in this study was determined using the “improved-ambient” method (Canagaratna et al., 2015). Default relative ionization efficiency (RIE) values were used for organics (1.4), nitrate (1.1), and chloride (1.3), while an RIE value of 3.8 was determined for ammonium and 1.1 for sulfate based on the calibration for pure NH4NO3 and (NH4)2SO4, respectively.
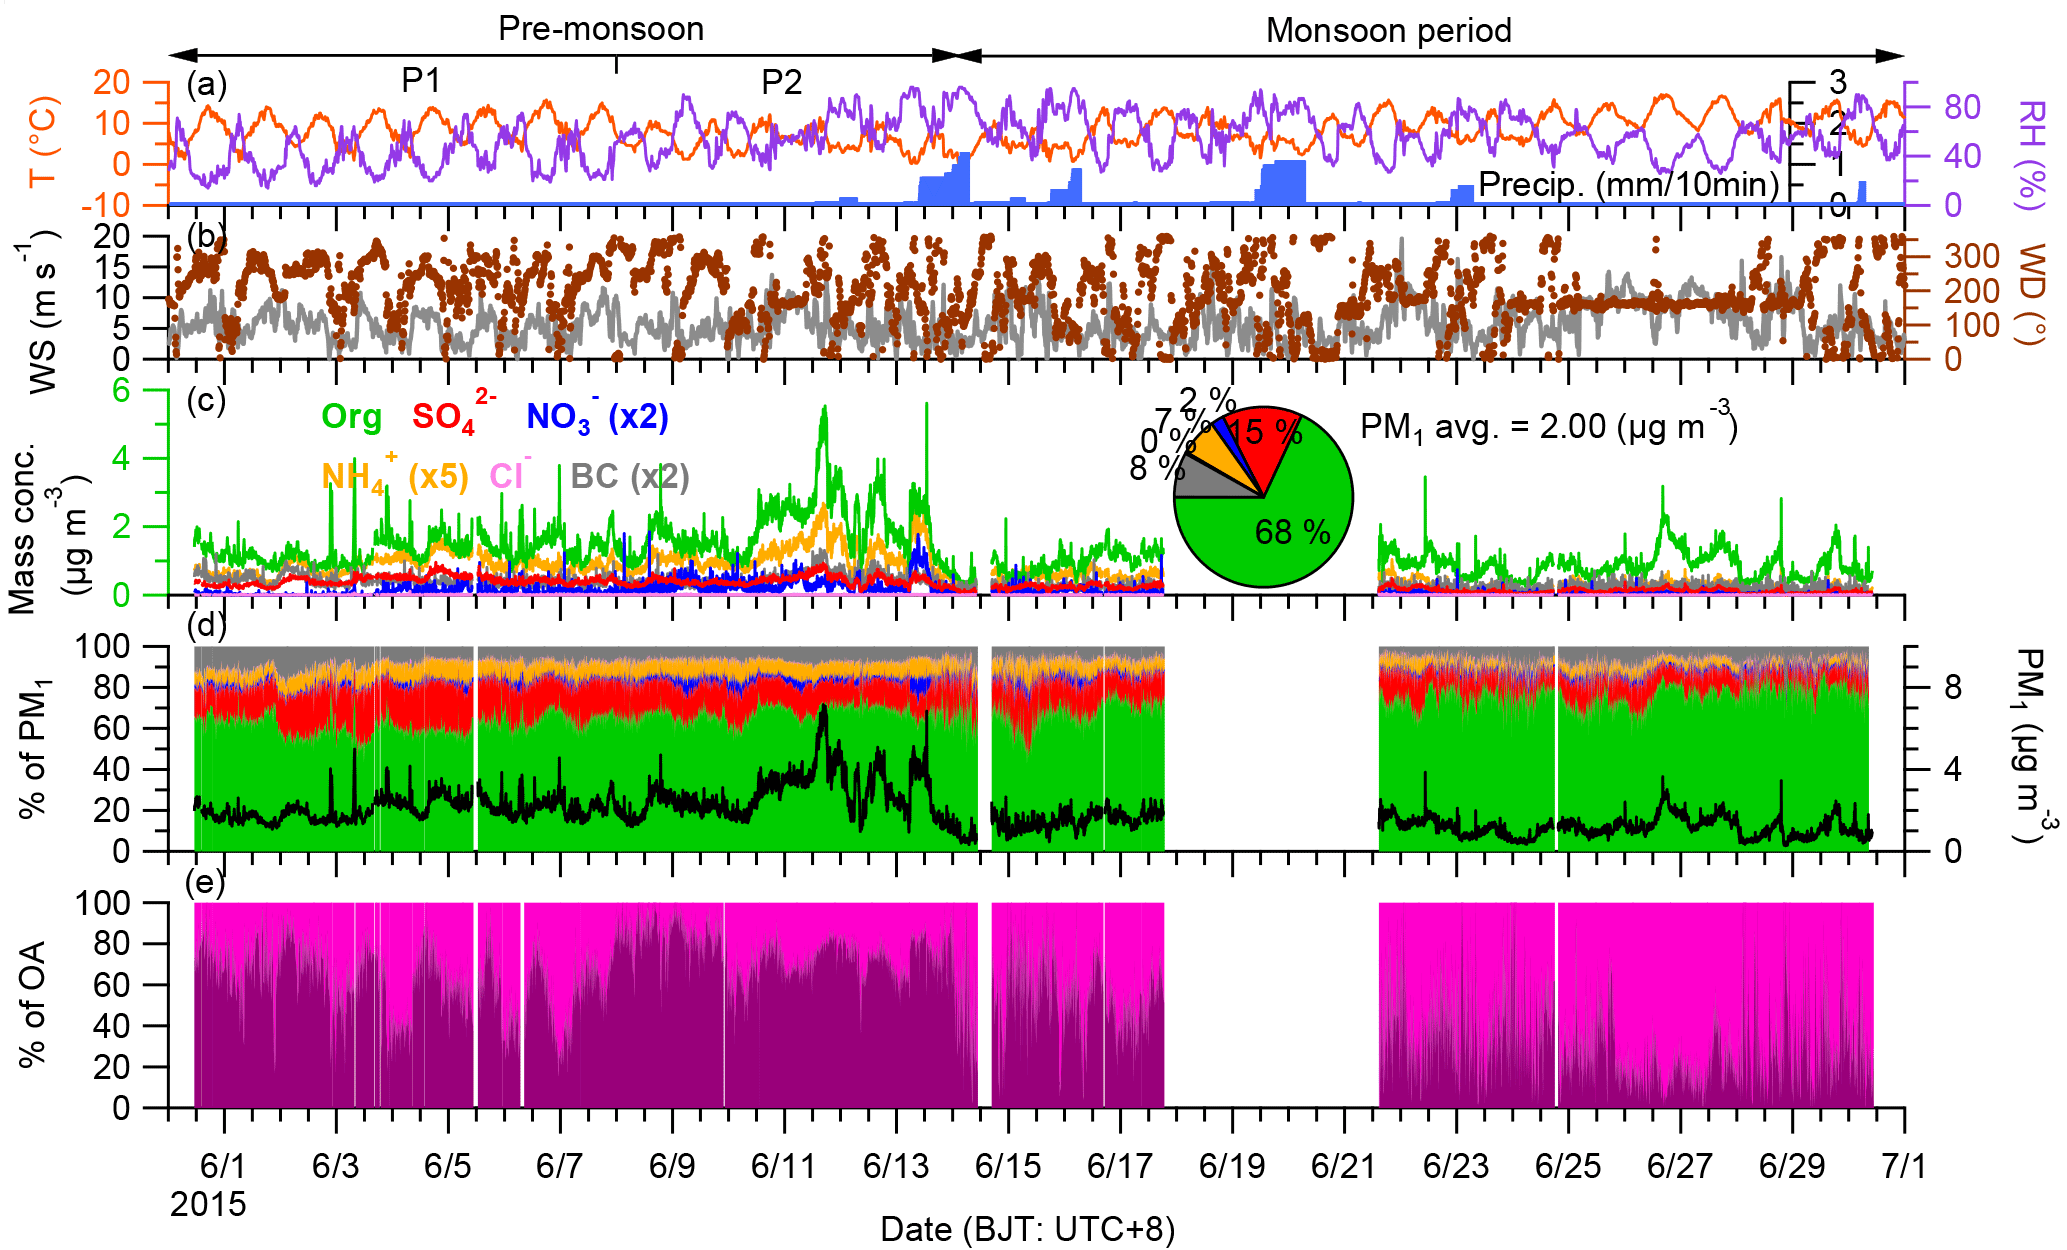
Figure 2The combo plot of the data of the Nam Co study including (a) the meteorological conditions (T: air temperature; RH: relative humidity; Precip.: precipitation), (b) the variation of WS (wind speed) colored according to WD (wind direction), (c) the temporal variation of mass concentration of PM1 species and the average contribution each species (pie chart), (d) the mass contribution of each PM1 species and the total mass concentration of PM1, and (e) the mass contribution of PMF results (Sect. 3.5). Three periods based on the meteorological conditions were marked. Please note the dates are given in MM/DD format.
The source apportionment of organics was conducted by PMF with the robust engine. First, organic matrix was analyzed using the PMF2.exe algorithm in robust mode (Paatero and Tapper, 1994) and explored using the PMF Evaluation Toolkit (PET; Ulbrich et al., 2009). The PMF solution was evaluated following the procedures outlined in Table 1 of Zhang et al. (2011) including modification of the error matrix and down-weighting of low signal-to-noise ions. Moreover, based on the AMS fragmentation table, some organic ions were not directly measured but scaled to the organic signal at m∕z 44, which were down-weighted by increasing their errors by a factor of 3. A two-factor solution with fPeak = 0 was chosen in this study, as it is able to reconstruct the total OA mass and temporal profiles very well. The results of three-factor solution with fPeak = 0 are shown in the Supplement (Fig. S1), which show splitting of the solutions.
3.1 The meteorological conditions during the study
During the field study, the meteorological conditions were generally cold and windy (Fig. 2a and b). The average air temperature was 8.4 ± 3.6 ∘C with a diurnal hourly average ranging from 4.8 to 12.3 ∘C; the diurnal average wind speed (WS) ranged from 4.5 to 6.5 m s−1. The dominant wind directions were south and southwest, although they varied during different periods (Figs. 2b and S2). The wind direction (WD) had distinct diurnal variation with air mass from south during night to morning and west during afternoon. Based on the report of the Climate Diagnostics Bulletin of India (http://imdpune.gov.in/Clim_RCC_LRF/Climate_Diagnostic_Bulletins/cdbi_apr_2015.pdf), the precipitation from Indian monsoon extended over most of India over 12 to 14 June and these days are treated as the onset of South Asian monsoon. Indeed, precipitation was recorded at the Nam Co station on 13 June and lasted for several days (Fig. 2a). Based on these weather conditions, the period before 14 June was classified as the pre-monsoon period and afterwards as the monsoon period. The RH during the pre-monsoon and monsoon periods were 48.4 ± 19.2 and 58.8 ± 16.5 %, respectively. The origins of the air masses were also different during these two periods. Figure 3 shows the air mass from west during pre-monsoon period accounted about 30–40 %, while it was only 7 % during monsoon period, of which ∼ 80 % was from south.
3.2 The temporal variations of chemical species
The average mass concentration of PM1 (NR-PM1+ BC) was 2.0 µg m−3 during the whole study period with 68 % OA, 15 % sulfate, 2 % nitrate, 7 % ammonium, and 8 % BC. The NR-PM1 mass loading (1.84 µg m−3) at Nam Co station was lower than the values observed at some high-elevation sites such as Menyuan (10.8 µg m−3; Du et al., 2015), Montsec (4.9 µg m−3; Ripoll et al., 2015), Mt. Cimone (4.5 µg m−3; Rinaldi et al., 2015), Puy de Dôme (5–27 µg m−3), and Mt. Bachelor (15.1 µg m−3; Zhou et al., 2017), but higher than those in some other sites, such as sub-Antarctic (0.46 µg m−3; Schmale et al., 2013) and Jungfraujoch (0.55 µg m−3; Fröhlich et al., 2015), similar to that at Mt. Whistler (1.91 µg m−3; Sun et al., 2009; Table 1 and Fig. S3). Although the sampling seasons and altitudes of these sampling sites are different (Table 1), the results of these studies could basically represent the level of aerosol at these sites due to their relatively long sampling spans (from 1 to 10 months). The contribution of OA at these high-elevation sites ranged from 50 to 90 %; the highest value was at Mt. Bachelor, which was frequently influenced by transported biomass burning plume, while the relative low OA contribution (38 %) in the sub-Antarctic due to the dominant source from marine emissions with a high sulfate content. The mass concentration of PM1 varied dynamically during our study with distinct difference between pre-monsoon and monsoon periods. The average mass concentrations of PM1 for these two periods were 2.6 and 1.2 µg m−3, respectively. For comparison, the concentrations of various species for these two periods were displayed side by side in Fig. 4a. The ratios between pre-monsoon and monsoon for all the species were higher than 1 with the maxima for ammonium (3.1) and sulfate (2.8); the contribution of OA was thus slightly higher during the monsoon period than during the pre-monsoon (71 vs. 64 % with a mass concentration ratio of 1.9). Apart from the potential scavenging effect, these results could also be influenced by the sources, transport route, and chemical processes during different periods.

Figure 372 h backward air mass trajectory and class statistics over Nam Co station for (a) P1, (b) P2, and (c) monsoon period. The back trajectories at 1000 m above ground level were calculated at 1h intervals using the NOAA Hybrid Single Particle Lagrangian Integrated Trajectory (HYSPLIT) model (Draxler and Hess, 1998) and 1∘ resolution Global Data Assimilation System (GDAS) data set (https://ready.arl.noaa.gov/gdas1.php). The classes of trajectories are colored according to pressure. Fire spot observed by MODIS (https://firms.modaps.eosdis.nasa.gov) and average wind rose plot during each period are also shown.
Based on the mass concentration and temporal variations of PM1 species and weather conditions, the pre-monsoon period could be further divided into two periods, i.e., period 1 (P1: 30 May to 7 June) and period 2 (P2: 8 to 13 June). P1 was characterized by relatively high sulfate concentration (0.46 vs. 0.41 µg m−3) and sunny days, while P2 was characterized by high PM1 concentration (2.9 vs. 2.1 µg m−3; P < 0.005, χ2 test), high nitrate contribution, and wet and cold days (Fig. S4). The air masses for P2 had higher contributions from west and north than those during P1 (Fig. 3). Figure 4b shows the comparisons of mass concentration of different species between these two periods. For chemical species, from P1 to P2, nitrate and OA increased dramatically by a factor of 1.6 and 2.2, respectively, and BC and ammonium also increased, suggesting the influence of the elevated air plume. However, sulfate and chloride decreased slightly (the ratios between P2 and P1 were ∼ 0.95). The variations of sulfate and nitrate during these two periods could be related to the photochemical conditions and origination of air mass (see Sect. 3.3).
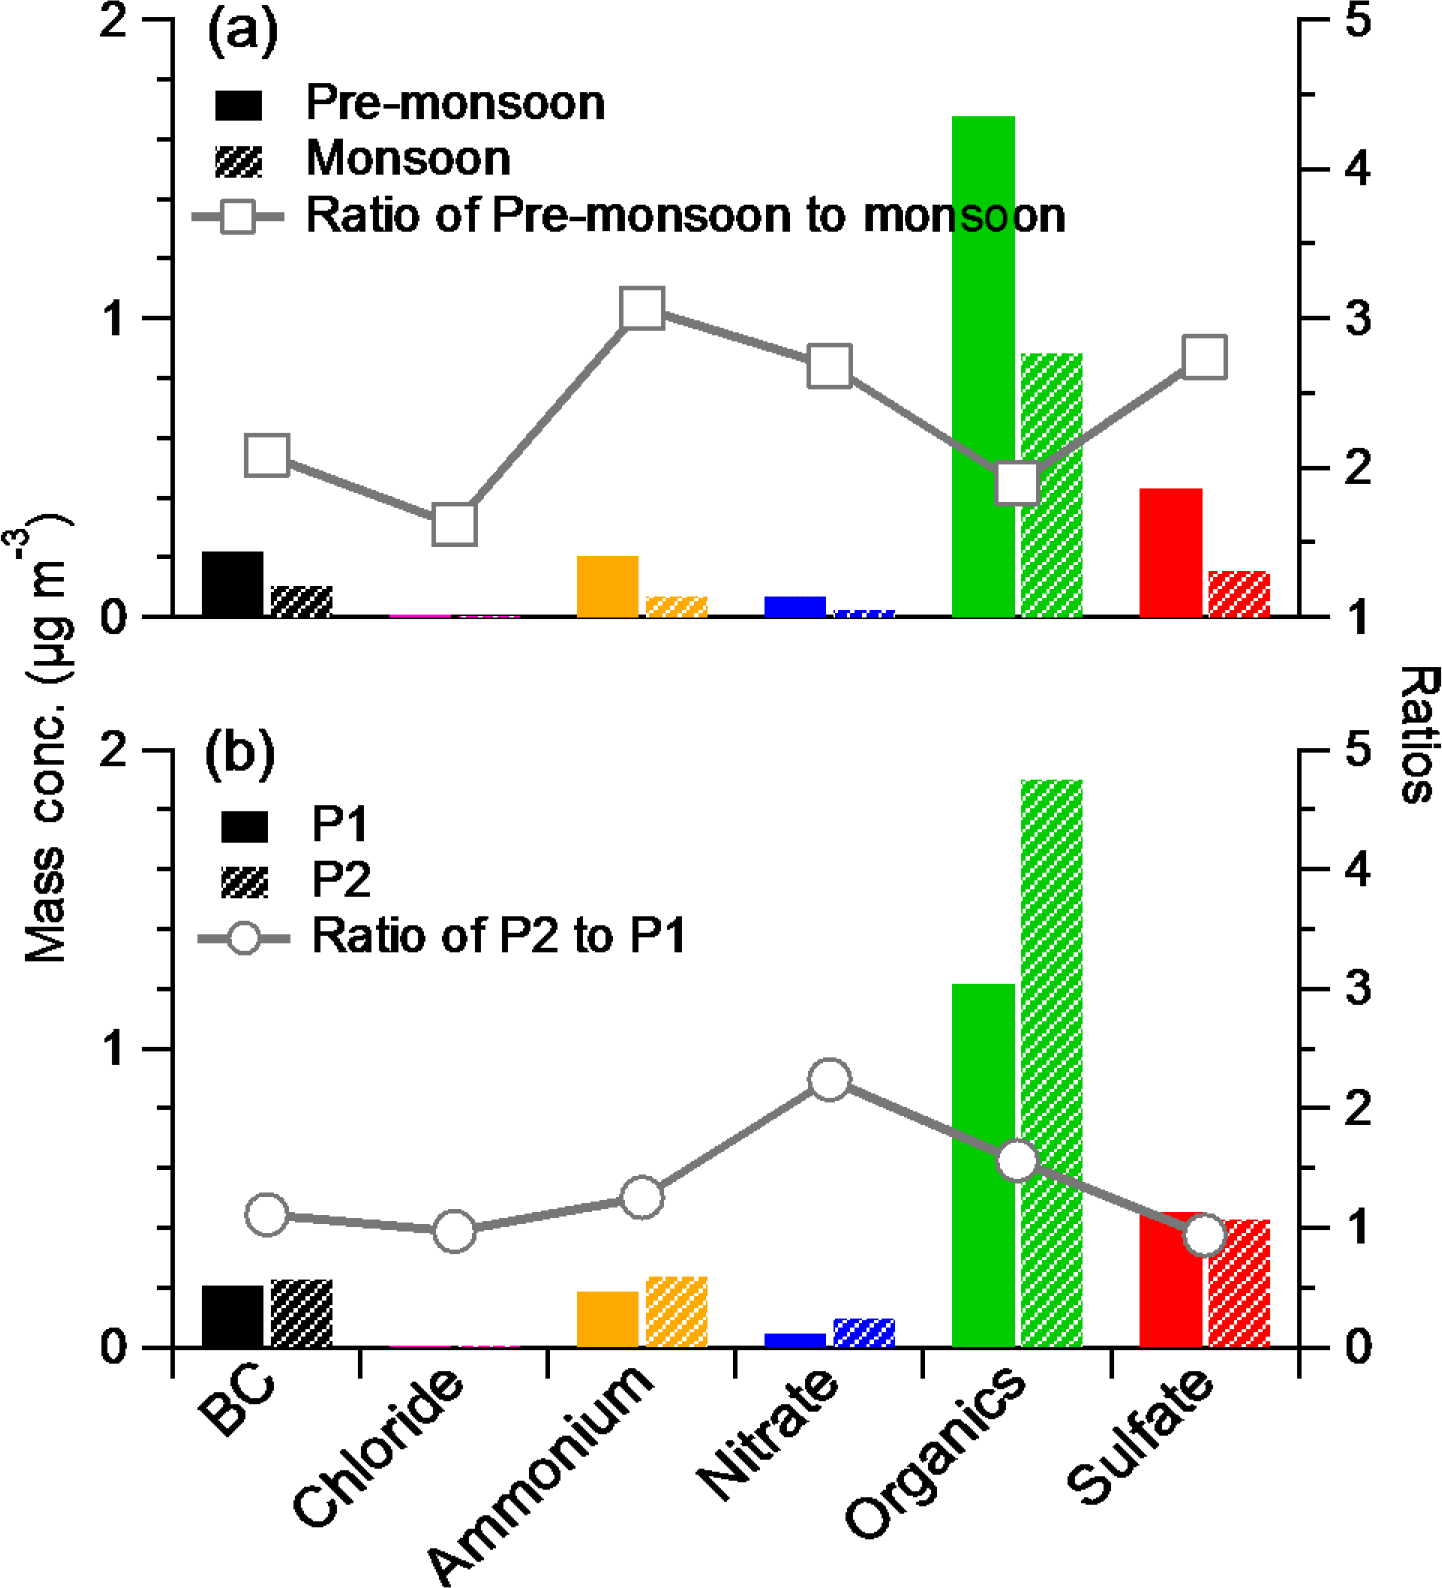
Figure 4The comparisons of PM1 species of the mass concentration (left axis) and the ratio between them (right axis) between (a) pre-monsoon and monsoon and (b) P1 and P2.
The particles were generally neutralized as illustrated by the scatter plot between predicted and measured ammonium (slope = 0.91; Fig. S5a). The neutralized PM1 were likely due to the high availability of ammonia from agriculture emission in northern India (Clarisse et al., 2009; Van Damme et al., 2015). The slope was ∼ 0.75 during P2 (green circles, Fig. S5a), which suggests that there was more ammonium than needed to neutralize sulfate and nitrate. We checked whether the high ammonium was from fragmentation of organic nitrogen such as amines. The ratios of NH+ to NH were consistent during the study (Fig. S5b), suggesting there was no significant influence from amino compounds. This excess ammonium determined by the neutralization could be related to the presence of significant amounts of organic anions in aerosol (such as carboxylic acids) or variation of RIE for ammonium, which could have a higher value in the mixed acidic particles.
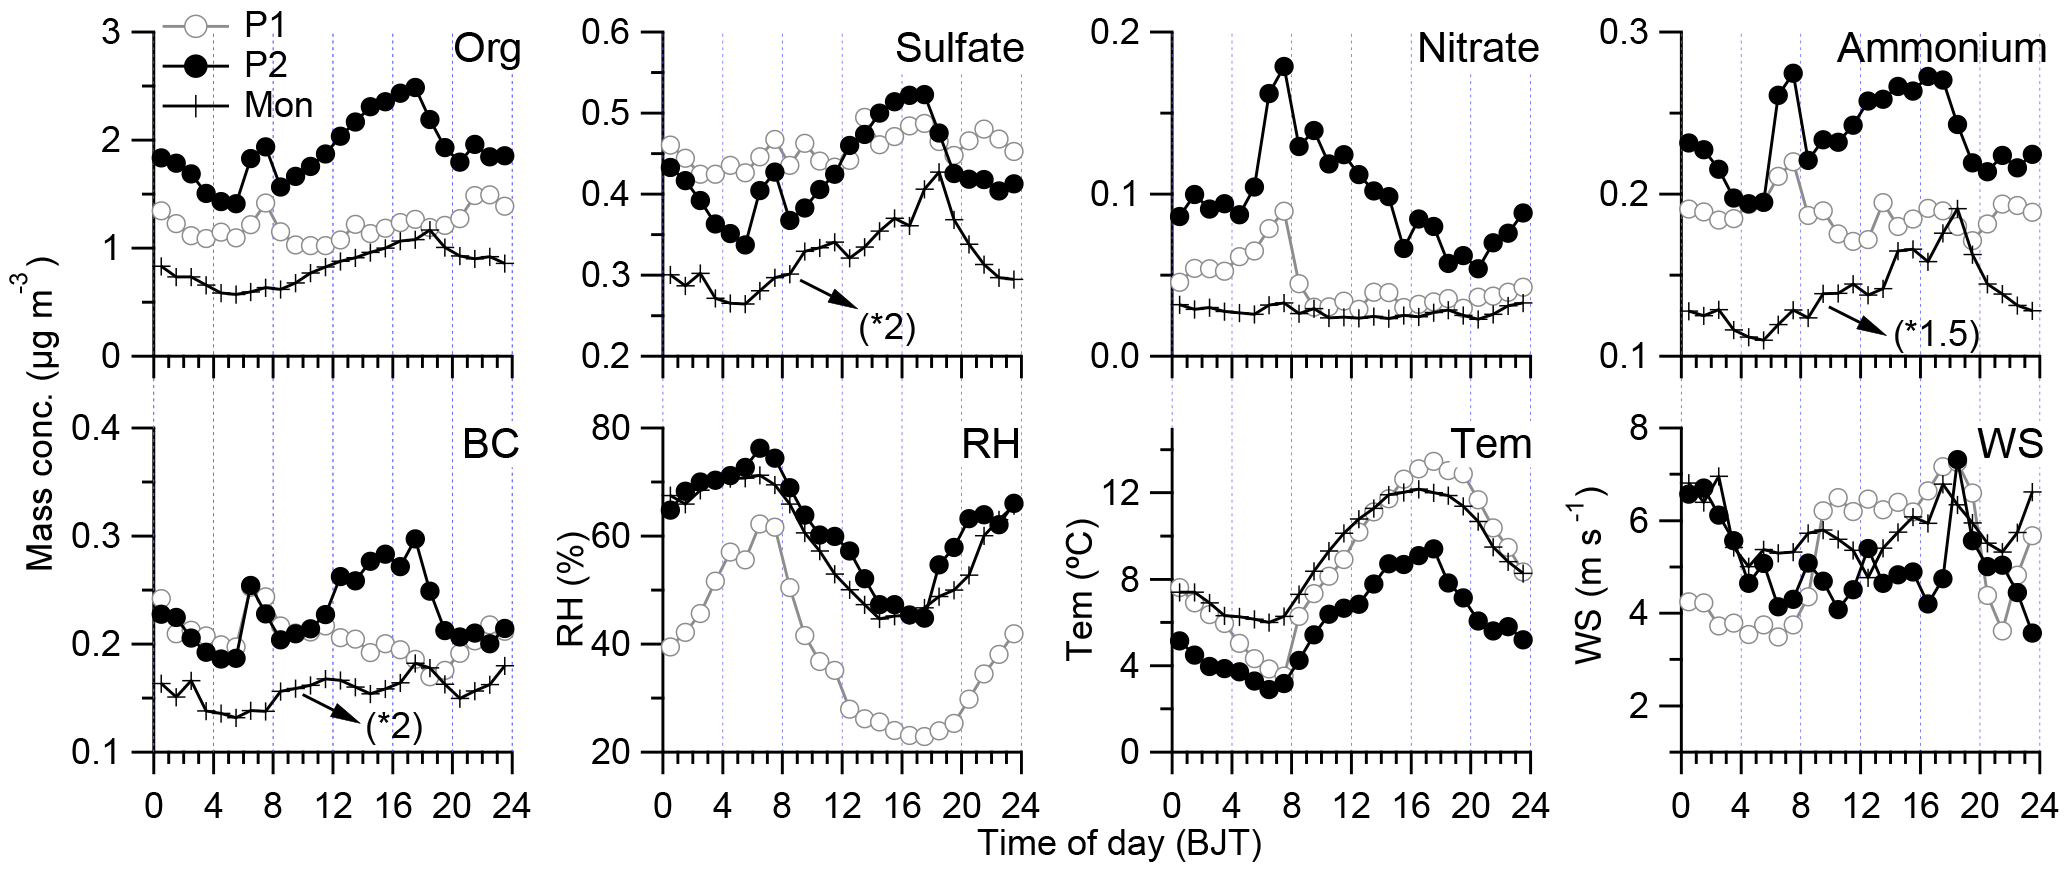
Figure 5Diurnal variations of each species and weather conditions (RH: relative humidity; Tem: air temperature; and WS: wind speed) during three periods of the study. Note that the signals of sulfate, ammonium, and BC are increased by a factor of 2 or 1.5 for comparison, respectively.
3.3 Diurnal variation and chemical process of different species
The diurnal cycles of OA, sulfate, nitrate, ammonium, and BC during different periods are shown in Fig. 5. All these species unexpectedly present dramatic diurnal variations, especially during P2. OA, sulfate, ammonium, and BC showed a similar pattern with low values during nighttime to early morning and high values during afternoon, which suggests their common sources or similar transport pathways (Zhang et al., 2001). We checked the diurnal variation of the origination of air masses and found that there were increased air masses from south during nighttime and from west during afternoon (Fig. S6). This phenomenon could be related to the plateau monsoon during summer, when the strong heating at the surface resulted in a shallow cyclonic circulation over the TP (Tang and Reiter, 1984). The enhanced air mass transportation from west during afternoon could favor the aerosol plume transport. The enhanced WS during afternoon was also observed with the increase in air temperature (Fig. 5). The diurnal variations of chemical species during monsoon period were relatively flat compared with those during P1 and P2, which may be related to the relatively consistent air mass origination during monsoon. Nitrate presented a significantly different diurnal variation with high values during nighttime to early morning and low values during afternoon. These features were highly correlated with that of the RH and air temperature (Fig. 5), suggesting the importance of thermodynamically driven gas/particle partitioning of ammonium nitrate and heterogeneous production of nitrate due to hydrolysis of N2O5. In addition, during the early morning (06:00–08:00), there was a peak for most species, which was accompanied by the lowest air temperature and the highest RH, and the lower plenary boundary layer (PBL), which could concentrate all the aerosol species (Yanai and Li, 1994). Overall, the diurnal variations of aerosol species at Nam Co may be dominated by the variabilities of both long-range transport air mass and local meteorological conditions.
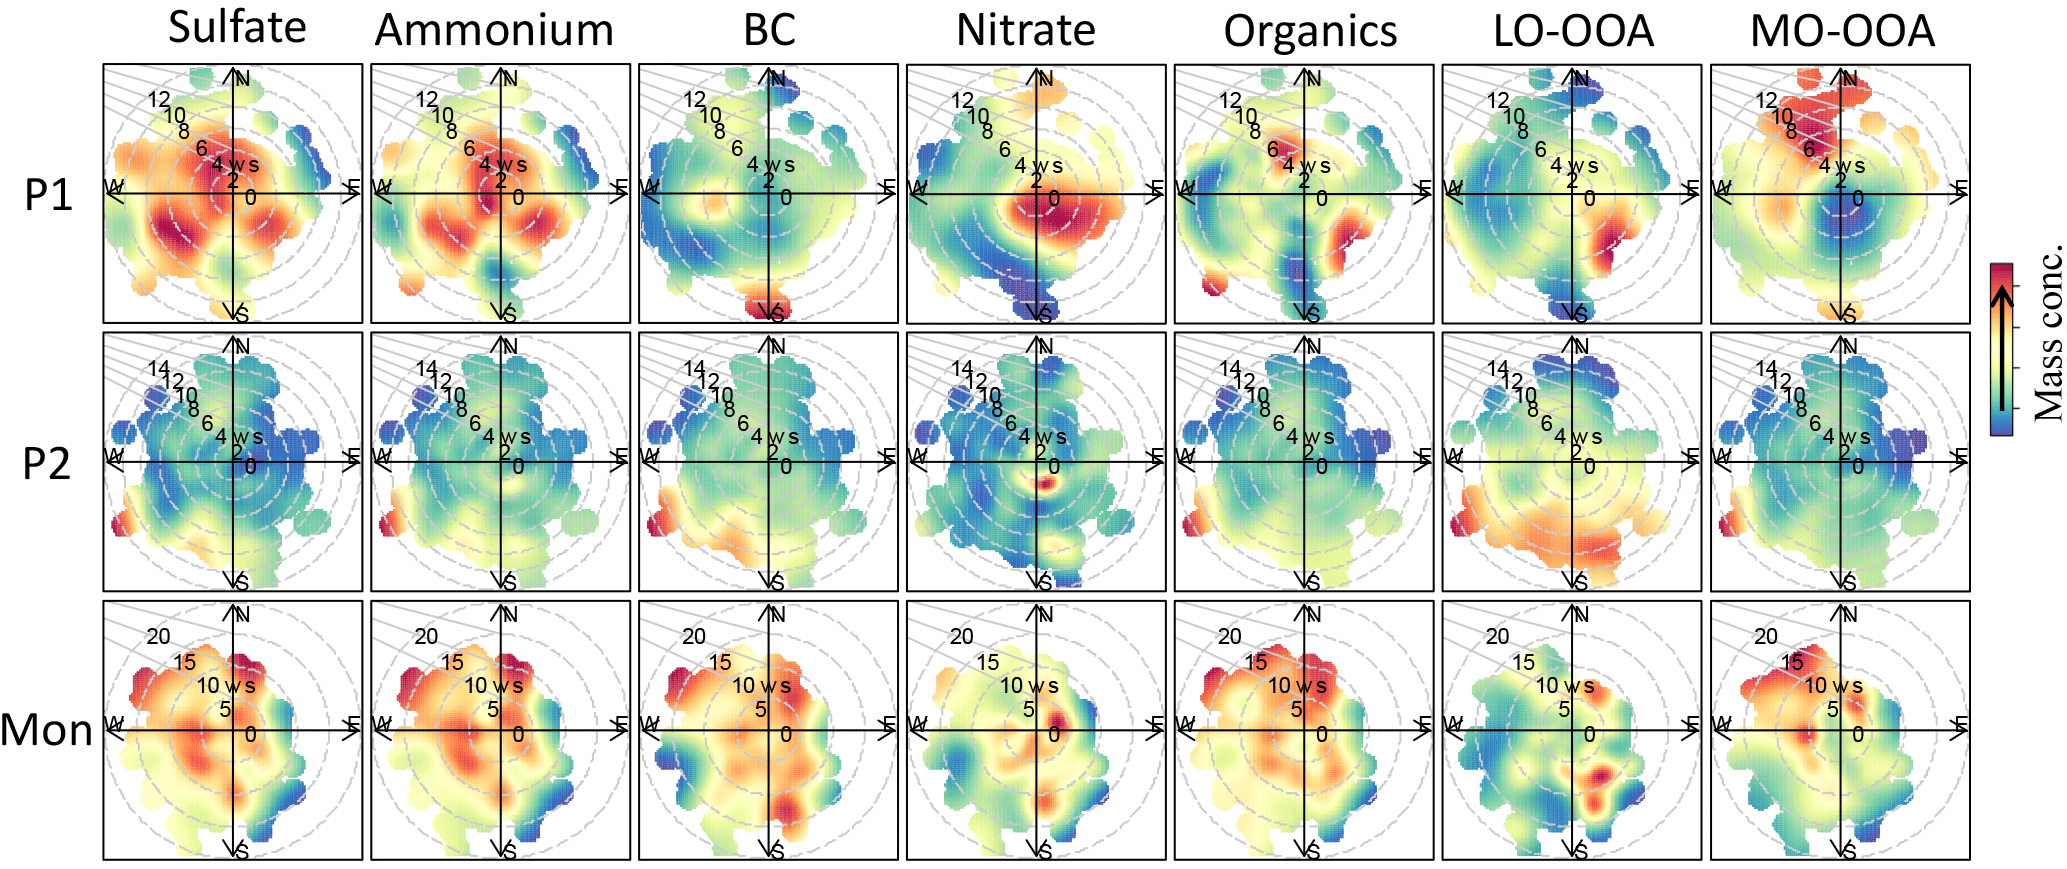
Figure 6Bivariate polar plots that illustrate the variations of the concentrations (colored) of each species as a function of wind speed (m s−1) and wind direction during different periods of the study.
In order to further elucidate the chemical processes and potential sources of the aerosol species, the relationships of chemical species with wind conditions were analyzed based on bivariate polar plot analysis (Fig. 6). During P1, sulfate and ammonium had hotspots from all directions across a wide range of wind speed (0–10 m s−1); OA was prevailing from southeast and northwest winds; nitrate had hotspots when the wind speed was relatively slow (0–8 m s−1) and from southeast/east mainly; BC had hotspots from south, west, and northwest at high wind speeds (4–12 m s−1). During P2, all species except nitrate had hotspots from south/southwest at high wind speeds (6–14 m s−1); nitrate also had hotspots at a relative low wind speed from southwest. These results suggested that the sources and formations of aerosols during P1 and P2 could be different, although the diurnal variations of species between these two periods were similar. During monsoon period, all species had similar hotspot distributions, which were from all directions but relatively weak from southeast.
The significant difference of diurnal variation between sulfate and nitrate suggested the different chemical evolution of these two species. Nitrate and sulfate during three periods all had weak correlations. During P1, the ratios of sulfate to nitrate had peaks (> 20) during afternoon, while during P2, all ratios remained low (< 20; not shown). In order to further investigate the chemical evolutions of these two species, we selected the high-concentration periods based on nitrate concentration (> average +2σ). Figure 7 showed all periods with high nitrate during the study and the corresponding meteorological conditions. It is easy to find that most of the high mass loading periods occurred during nighttime. The wind speed and wind direction varied dynamically and mostly were from southwest. Higher wind speed from this wind direction could transport more aerosol plumes to Nam Co as illustrated from event 1 (E1) during which all the species (OA, sulfate, ammonium, and BC) except nitrate increased; this type of event was accompanied by warm and dry air conditions. When the wind direction was from southwest with lower wind speed (E2), the RH increased to higher than 90 % accompanied by deceased air temperature, and the mass concentrations of nitrate, sulfate, and OA increased significantly and BC decreased significantly. These results further suggest the different chemical evolution and sources for different aerosol episodes at Nam Co station.
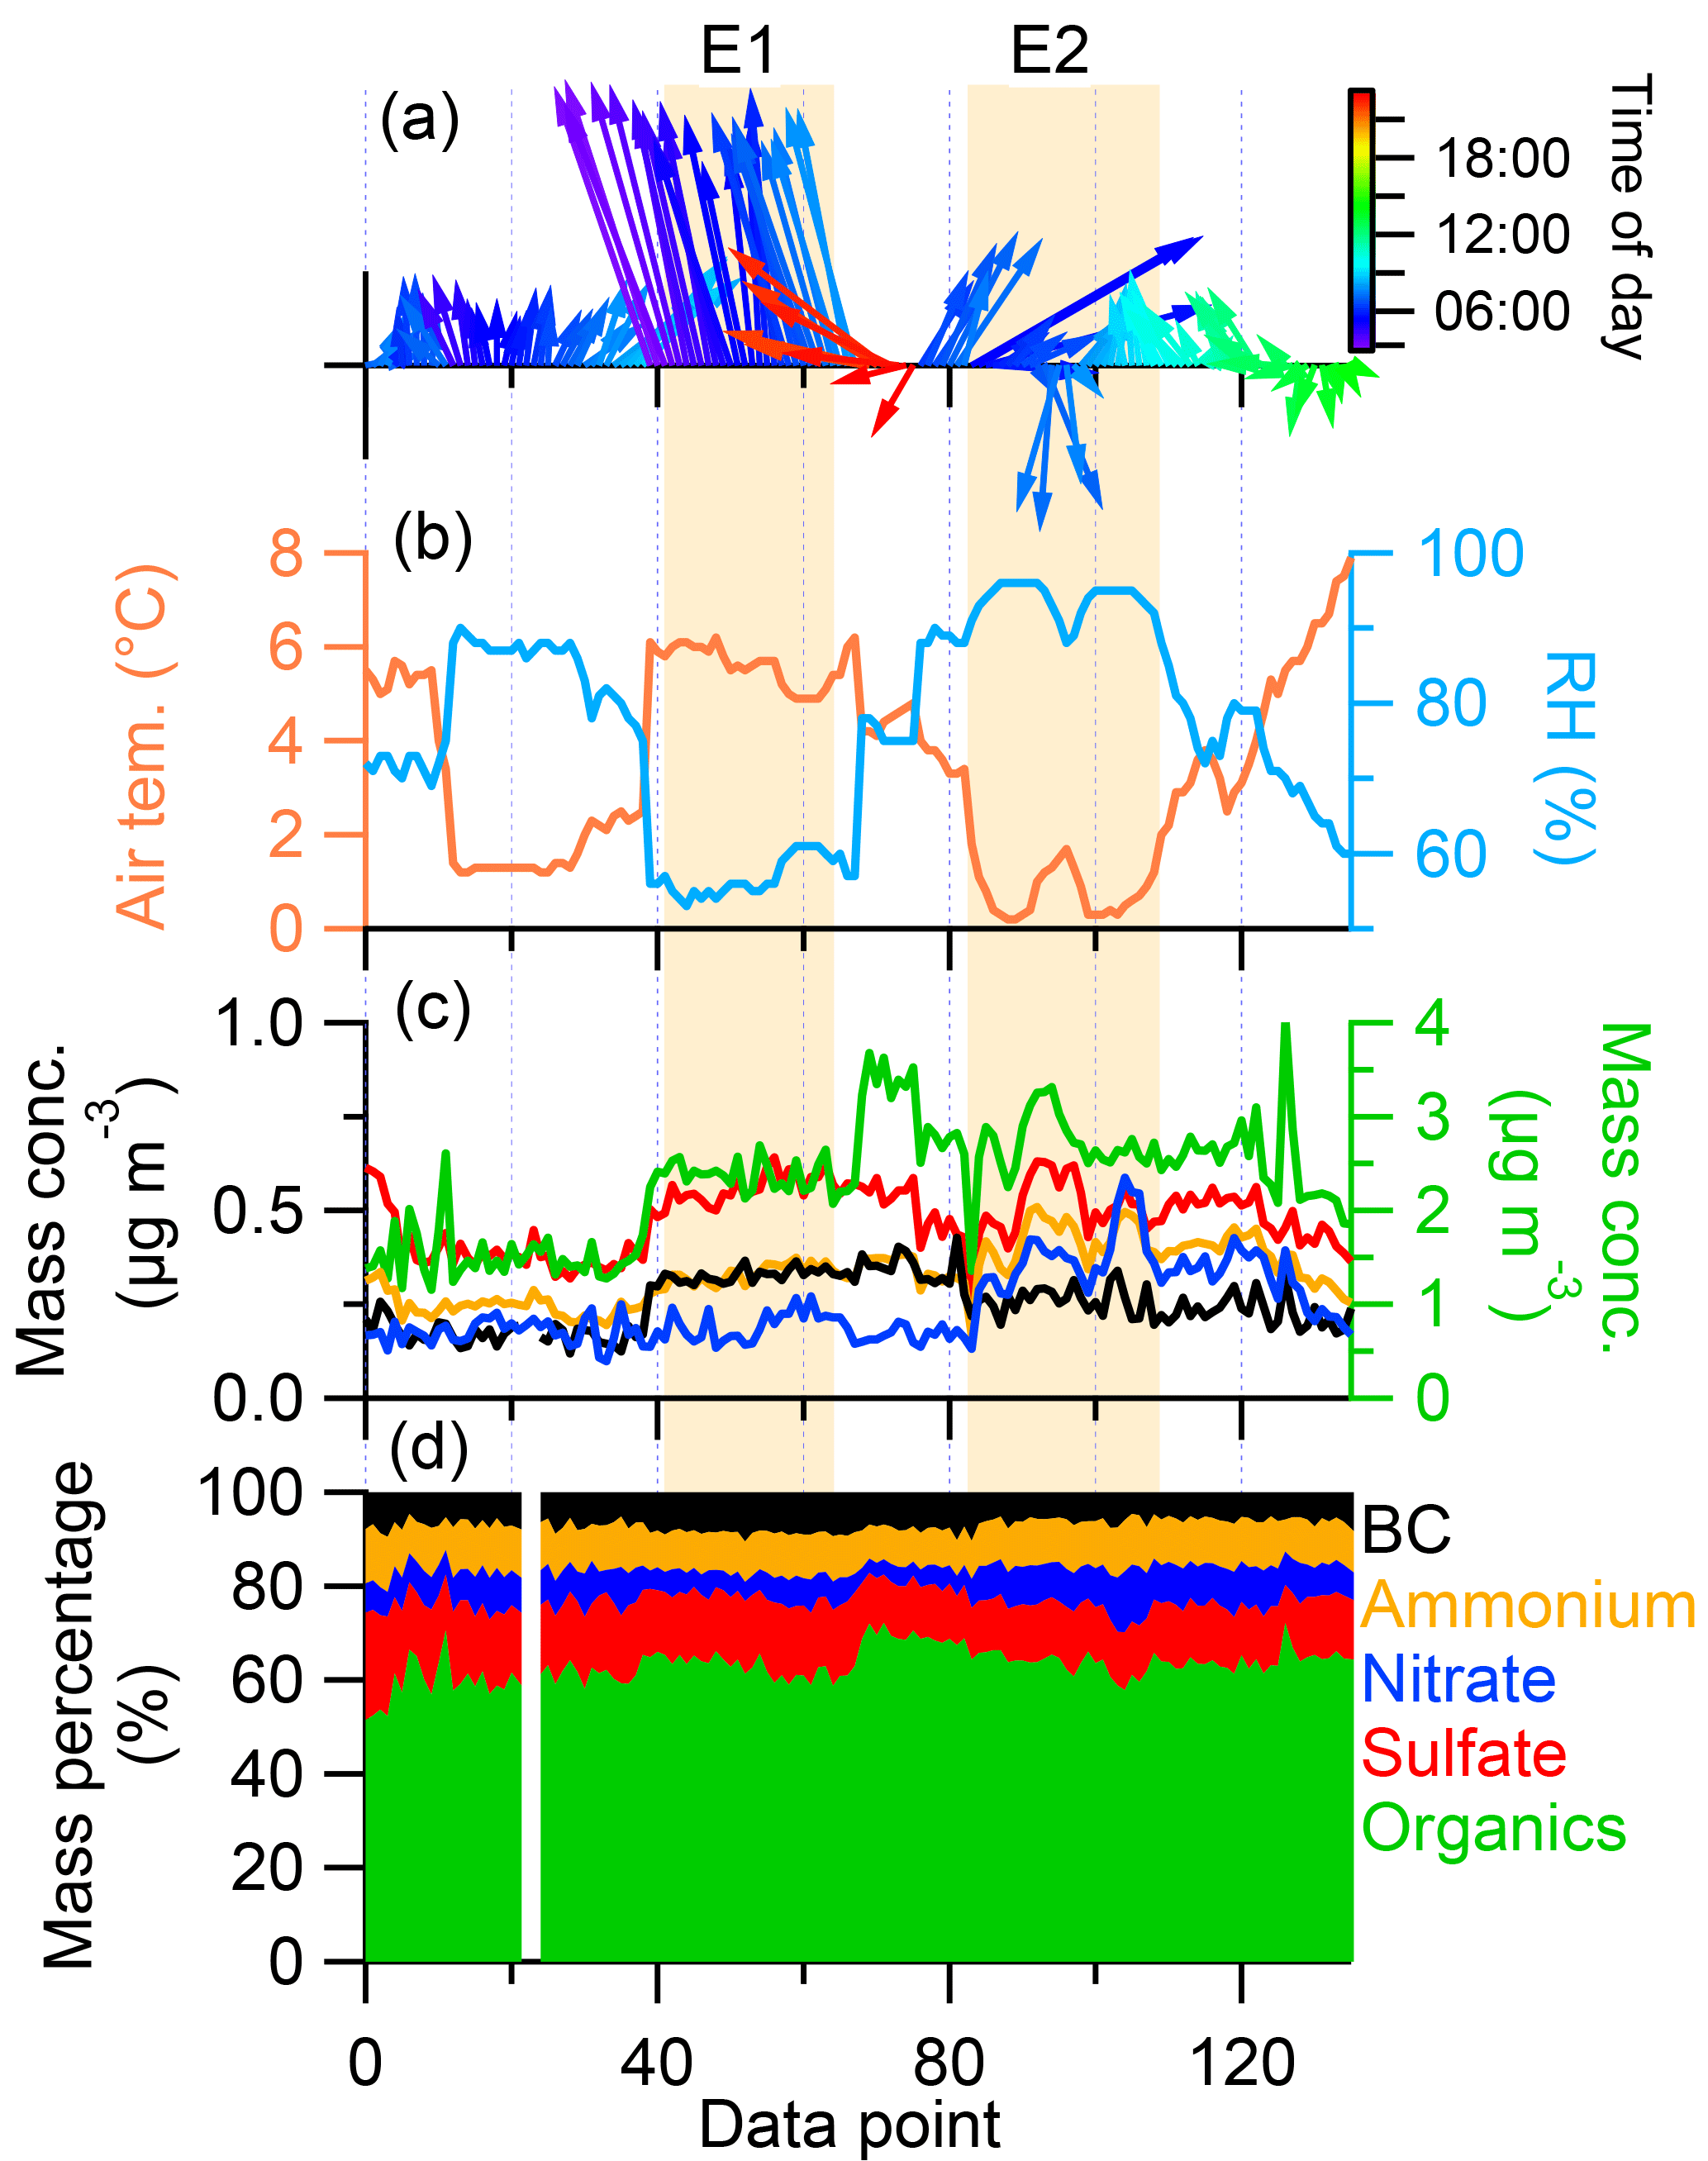
Figure 7The high aerosol loading periods based on nitrate (> average + 2σ) accompanying meteorological data.
3.4 The average chemical feature of organic aerosol
The average mass spectrum of OA was shown in Fig. 8a. The organic mass was on average composed of 51 % oxygen, 44 % carbon, and 5 % hydrogen, with an average nominal formula being C1H1.33O0.88N0.001. On average, CxHyO (38.1 %) and CxH (37.3 %) ions dominated the total OA followed by CxHyO (19.8 %), and HyO (4.6 %). m∕z 44 was the base peak in the OA spectrum and mainly composed of CO (99 %). m∕z 43 had contributions from both C2H3O+ (82 %) and C3H (18 %). m∕z 55, likely an important primary fragment, consisted of 51 % C4H and 49 % C3H3O+. The OA was highly oxidized with an O ∕ C ratio of 0.88 on average. The OA was more oxidized during pre-monsoon than monsoon with higher O ∕ C ratio (0.94 vs. 0.72) and lower H ∕ C ratio (1.28 vs. 1.44; Fig. 8b). The oxidation states of OA during two pre-monsoon periods were also different. The O ∕ C during P2 (0.98) was higher than P1 (0.90) and the H ∕ C was higher during P1 than P2 (1.30 vs. 1.27, significant, P < 0.005, χ2 test). Correspondingly, the OA during P2 contained higher contribution of CxHyO (40.3 vs. 39.1 %, significant, P < 0.005, χ2 test) and CxHyO (25.2 vs. 23.6 %, significant, P < 0.005, χ2 test) ions than those during P1 (Fig. 8c).
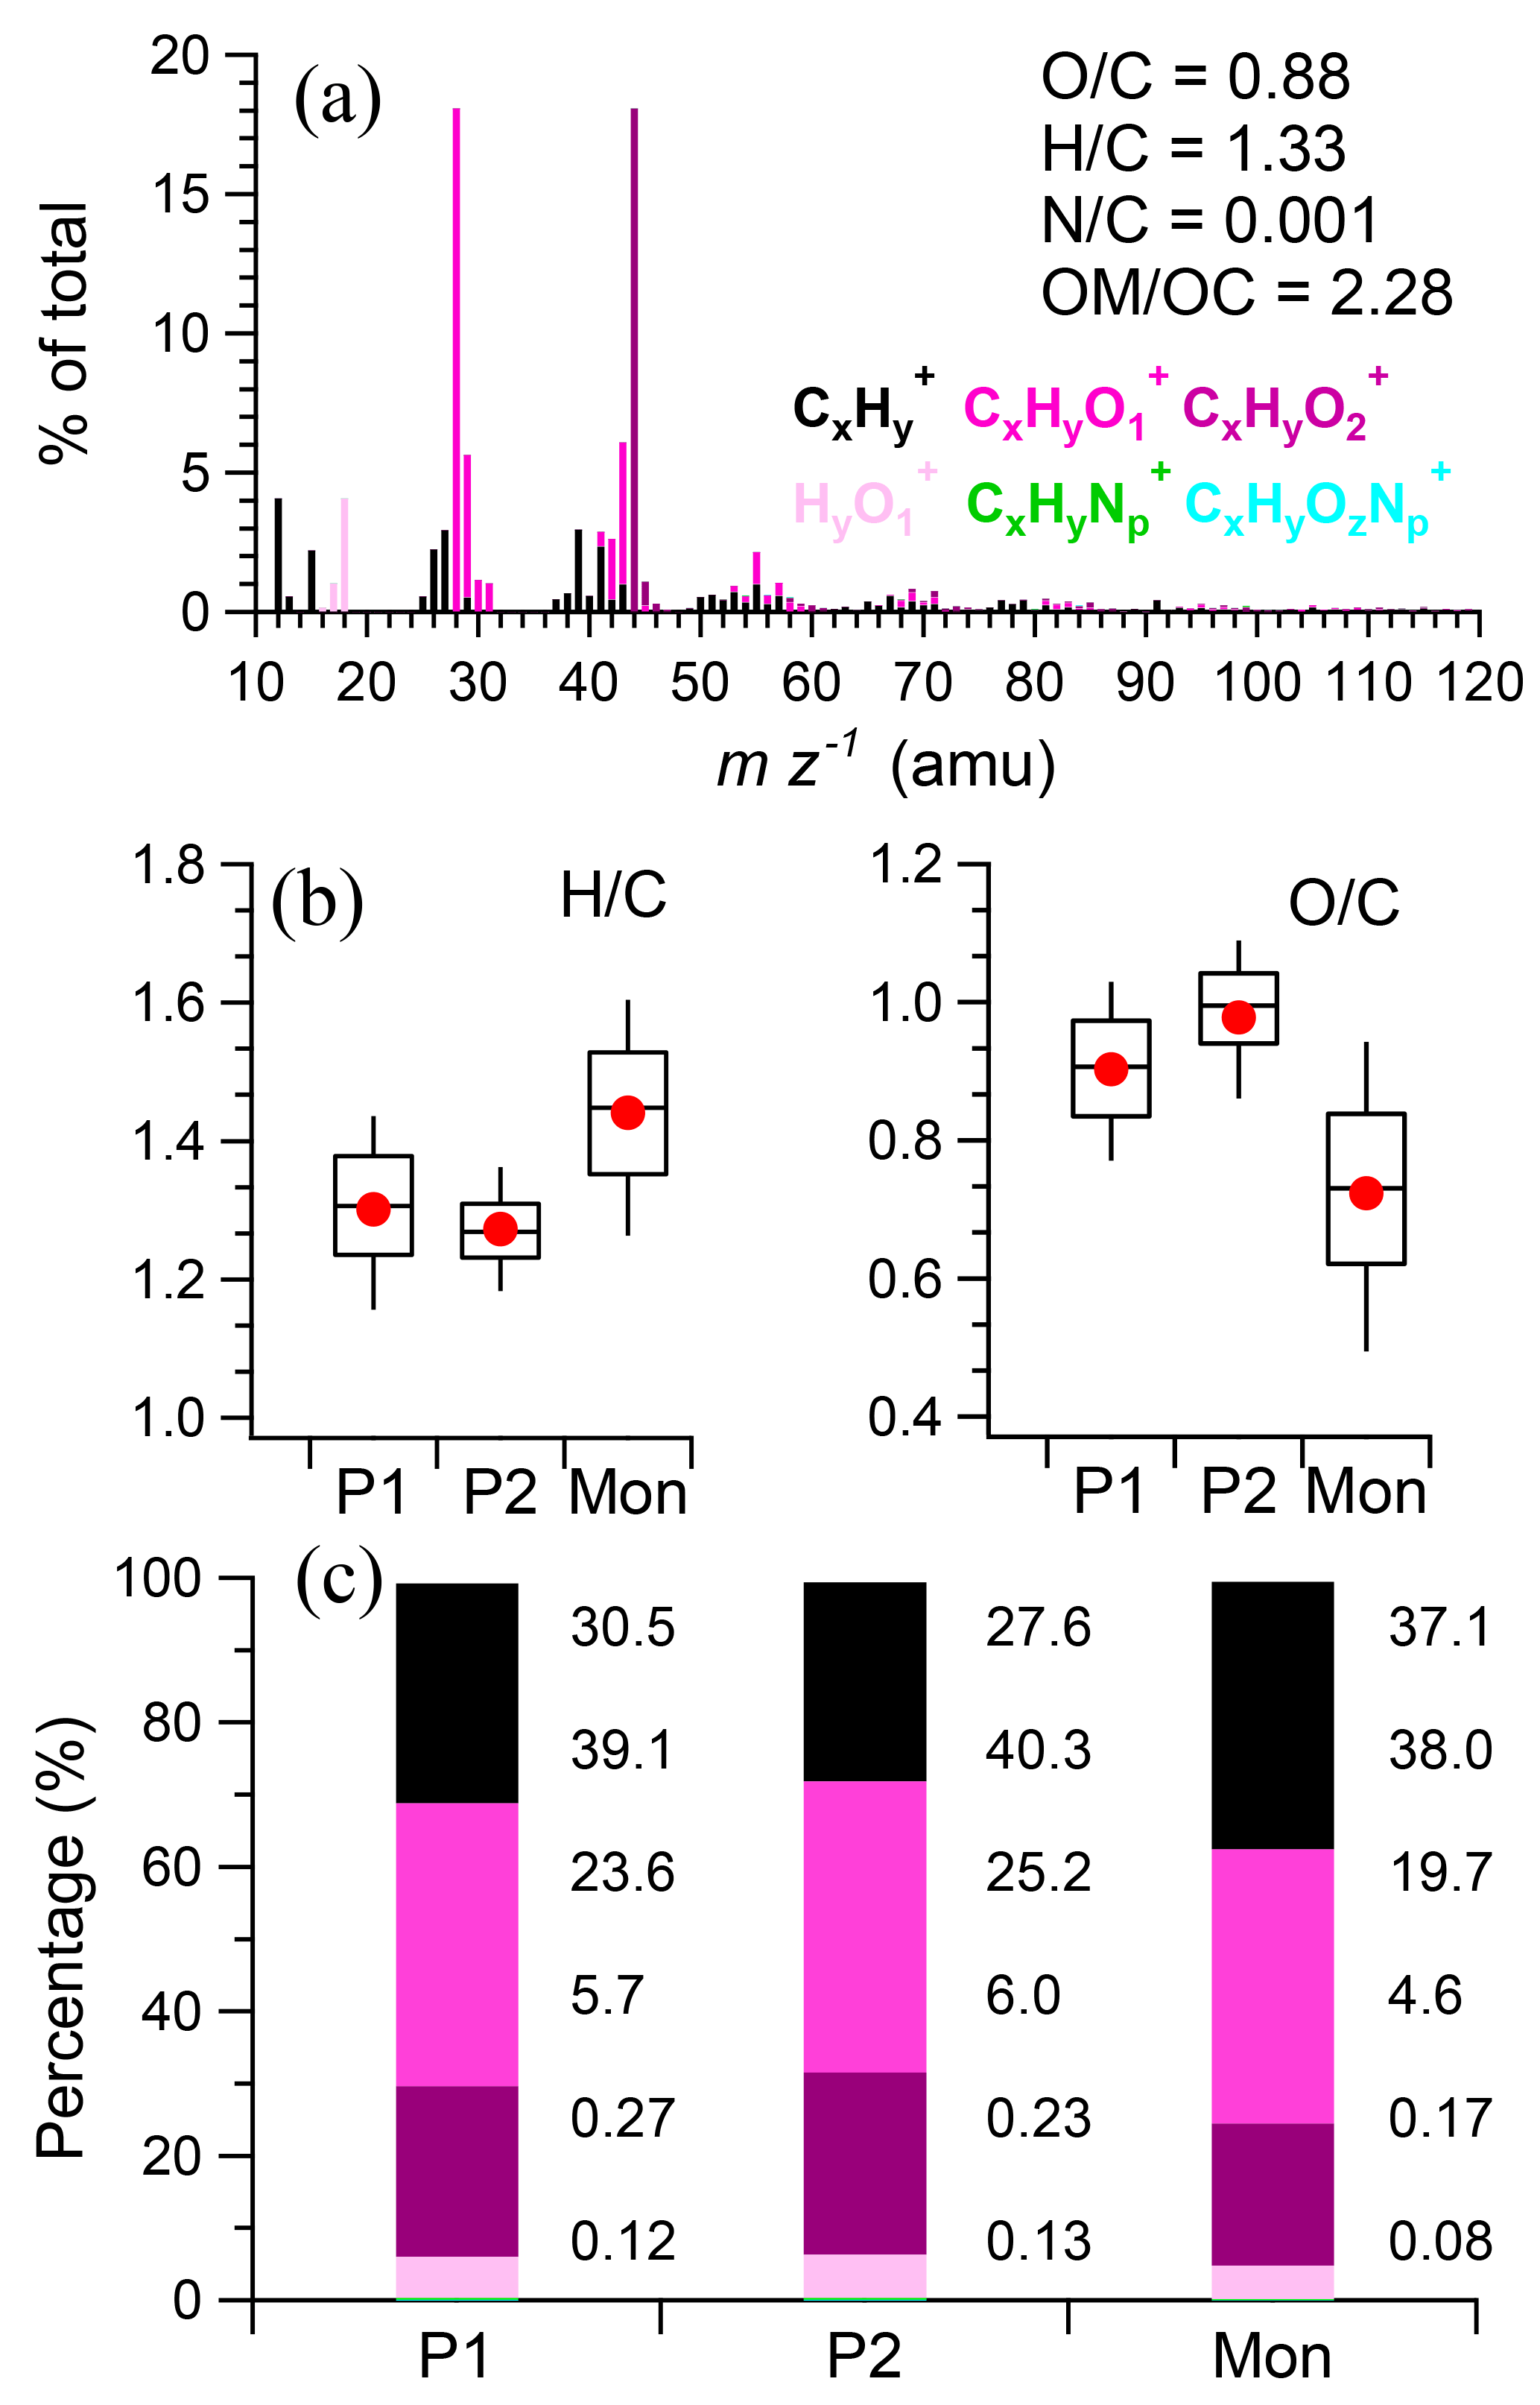
Figure 8(a) The average mass spectrum of organic aerosol, (b) the average ratios of H ∕ C and O ∕ C during different periods, and (c) the average contribution of six ion categories during different periods.
The diurnal variations of both O ∕ C and OM ∕ OC ratios presented higher values during late morning to afternoon and lower values during early morning (Fig. 9a). H ∕ C presented an opposite trend. These patterns suggested that OA was more oxidized during daytime which could be due to photo oxidation and/or transport of highly oxidized OA during daytime. We examined the variation of elemental ratios with OA mass concentrations, and found that the O ∕ C increase was accompanied by the increase in OA mass concentration (Fig. 9b). This relationship could be related with the different influences of wet scavenging on more oxidized and less oxidized OA. In addition, this result suggested the likely importance of transportation on the oxidized OA during afternoon due to the higher mass concentration occurring frequently in the afternoon. However it was not possible that aerosol plume arrived at Nam Co within several hours due to the long distance from source regions (more than 1000 km from India). Previous studies have reported the presence of an aerosol layer between 6 and 18 km a.s.l. altitude over the Tibetan Plateau during summer (Tobo et al., 2007; Vernier et al., 2011). He et al. (2014) examined the vertical profiles of aerosol extinction coefficients measured with a micro-pulse lidar at Naqu, about 100 km east of Nam Co station, and observed a maximum in aerosol extinction coefficient between 18 and 19 km a.s.l. during summer 2011. Recently, Gu et al. (2016) examined the aerosol compositions using the global three-dimensional Goddard Earth Observing System chemical transport model (GEOS-Chem) and found elevated concentrations of sulfate, nitrate, ammonium, BC, and organic carbon over the TP. Further, observational and modeling studies have also shown that deep convection over the TP during daytime is one of the important routes for tropospheric and stratospheric exchange of aerosols (Cristofanelli et al., 2009, 2010; Lin et al., 2016). Thus the enhanced aerosol concentrations during afternoon could possibly be attributed to the downward mixing of the aerosol layer from the upper troposphere during the growth of TP boundary layer. Recently, Xu et al. (2017) elucidated this mechanism at Nam Co station to explain the source of O3 and peroxyacetyl (PAN), and found strong downward motion core events during pre-monsoon and monsoon periods which were accompanied by increased O3 and PAN at the ground level. We also performed a test using the Weather Research and Forecasting (WRF) model to examine this kind of transport during P2 which indeed showed a downward motion core at the Nam Co station (Fig. S7). Nevertheless, this hypothesis needs further validation in the future in this region.
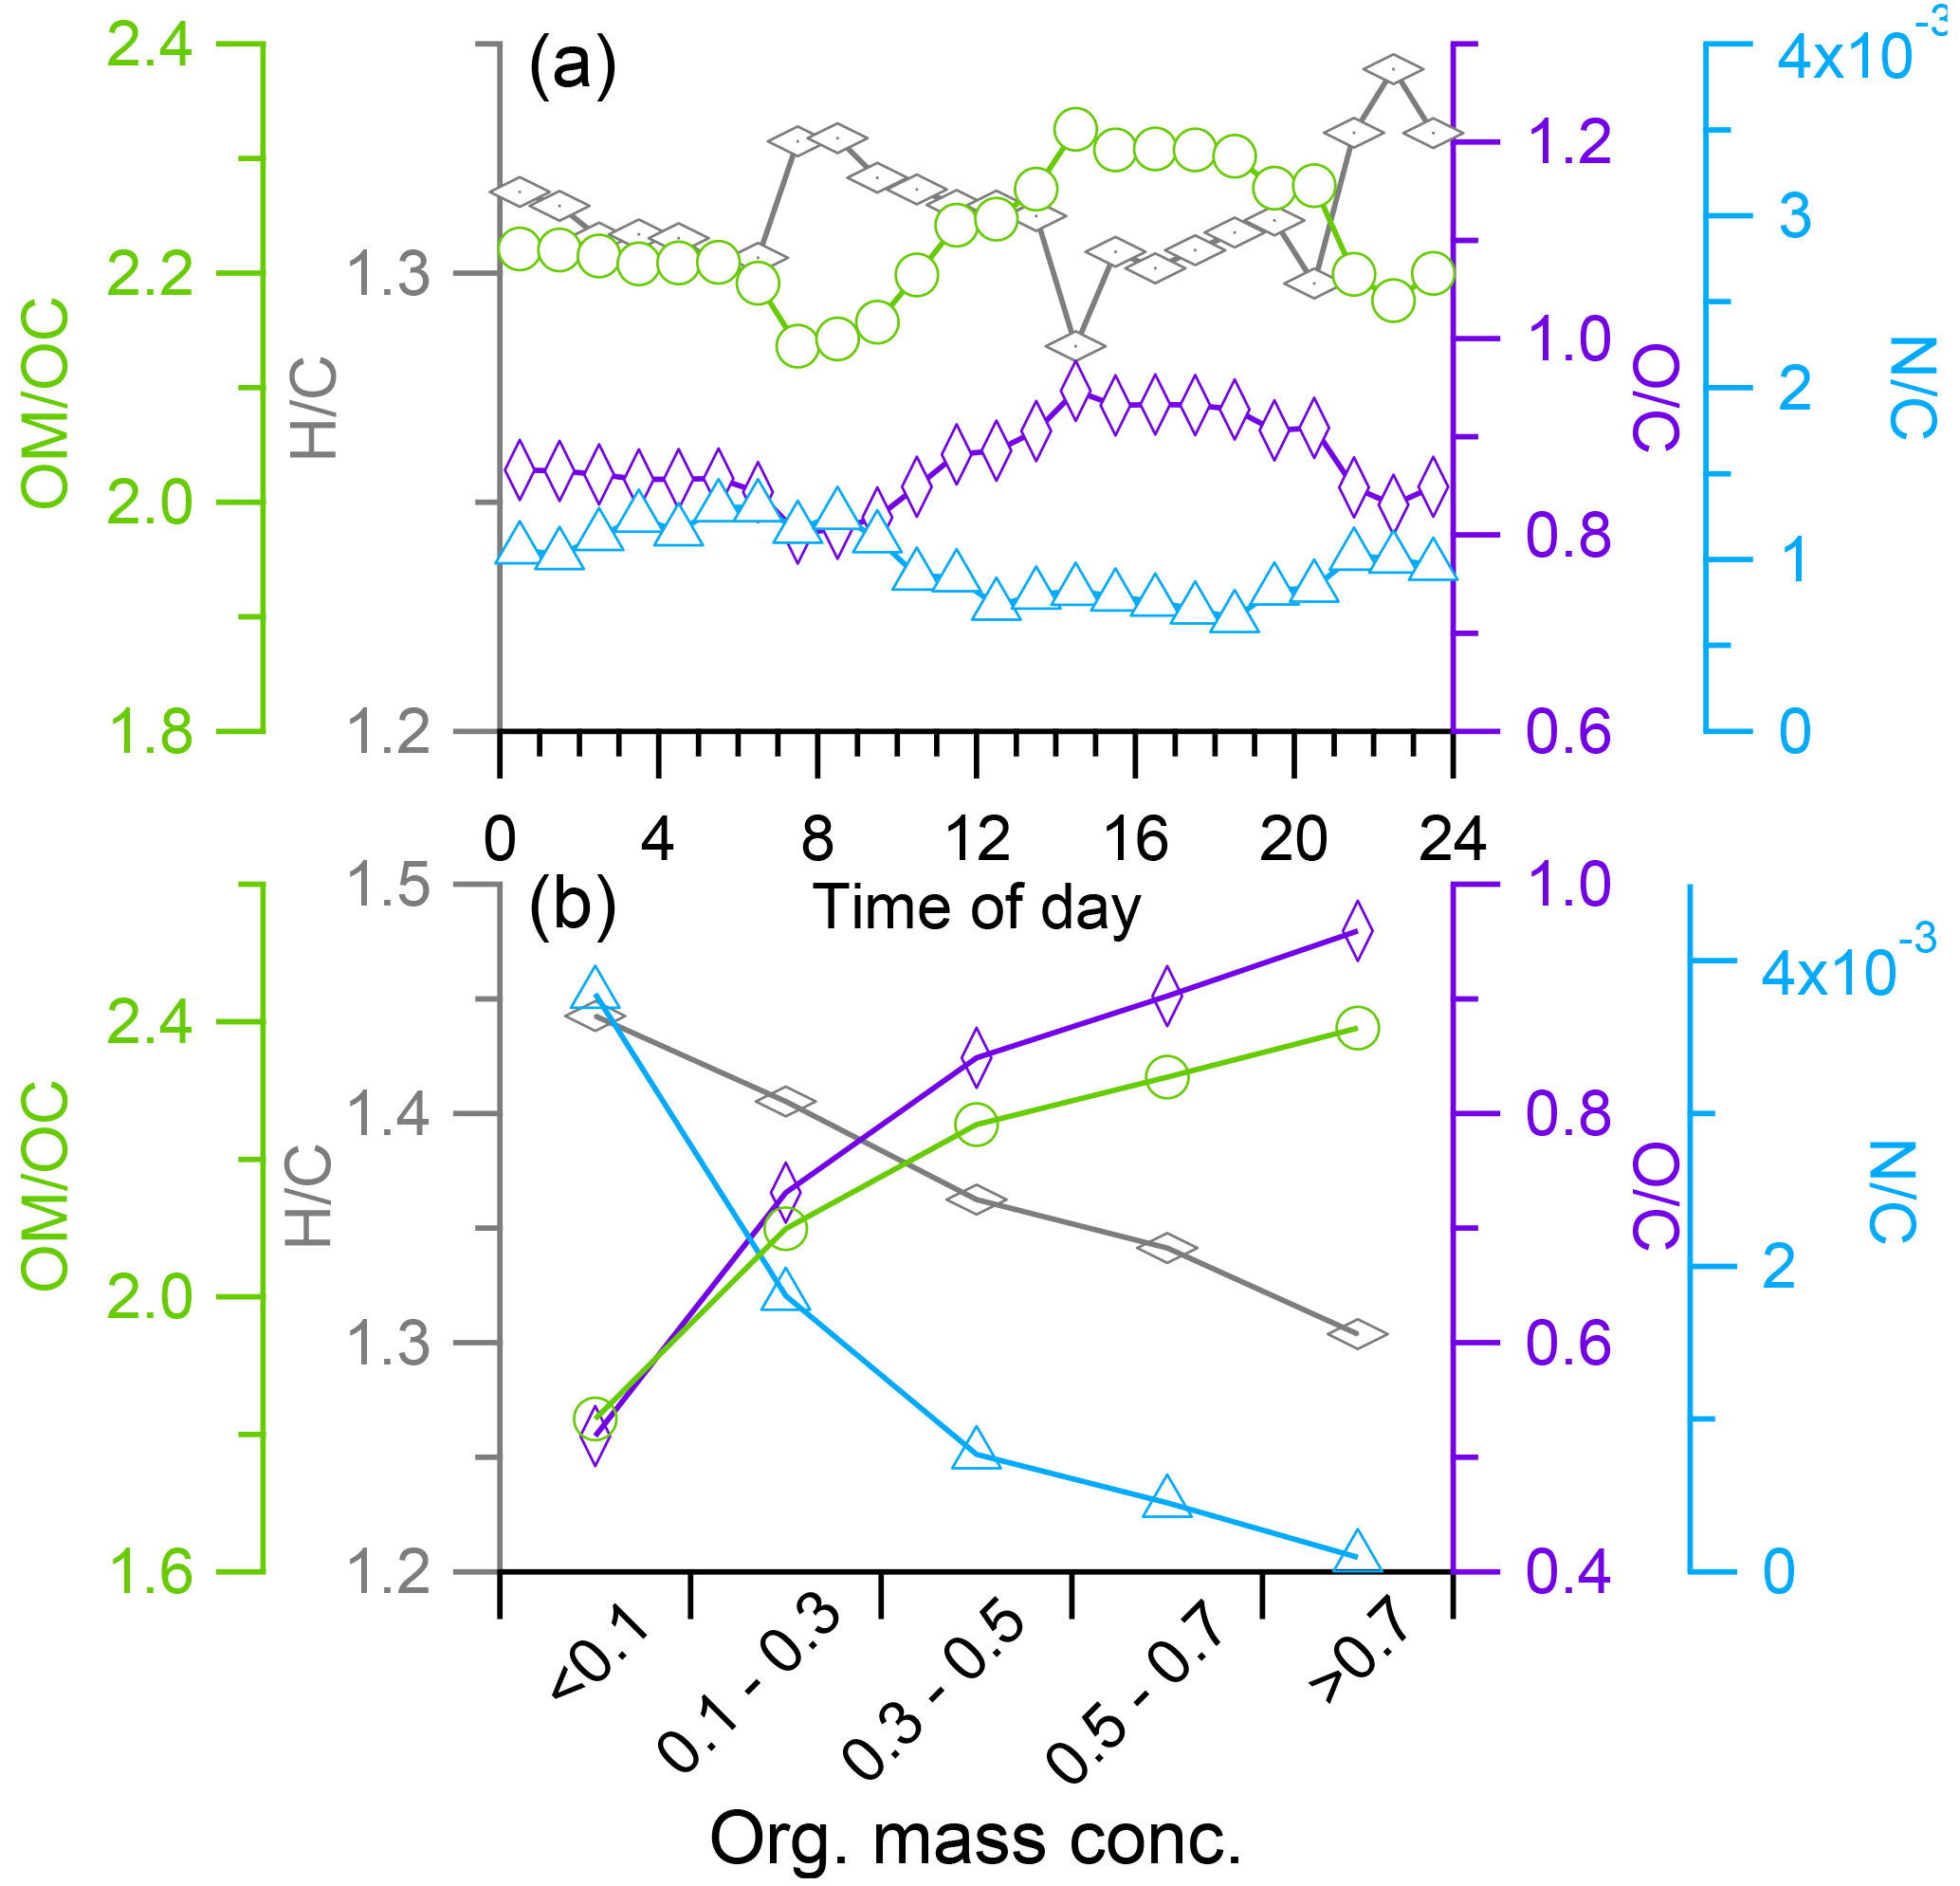
Figure 9(a) Diurnal variations of elemental ratios and (b) the variations of elemental ratios as the function of mass concentration of organic aerosol.
3.5 The PMF apportionment on the OA
The two OA factors determined by PMF have distinctly different mass spectra and diurnal patterns (Fig. 10), including a less oxidized oxygenated organic aerosol (LO-OOA; O ∕ C = 0.49) and a more oxidized oxygenated organic aerosol (MO-OOA; O ∕ C = 0.96). Both factors appeared to be secondary in nature. Our inability to separate a primary traffic-related OA factor is consistent with the fact that C4H was a minor peak in the OA spectra (0.6 % of the total signal) and its organic-equivalent concentration averaged only 0.008 µg m−3 during this study, suggesting a minimal contribution from traffic-related primary OA. Collier et al. (2015) reported that the average fC4H (fraction of total organic signal accounted for by C4H was 8.1 % in the mass spectrum of primary OA from vehicle emissions. Based on this relationship, even assuming C4H was completely contributed by vehicle-derived OA, the average vehicle OA concentration would be only ∼ 0.1 µg m−3, or 7 % of total OA mass, during our study. Note that C4H fit well in the PMF analysis with very small residual, indicating that the signal of this ion was properly apportioned between the two OOA factors.
The mass spectra of MO-OOA and LO-OOA were characterized by high peaks at m∕z 44 (mostly CO and LO-OOA had a relative large peak at m∕z 43 (mostly C2H3O+) as well (Fig. 10a). The contributions of the CxHyO ion category in these two mass spectra were 15.1 and 28.6 %, respectively, while the contributions of CxHyO were 37.8 and 41.5 %, respectively. The time series of LO-OOA correlated well with CxHyO and CxH ions, while MO-OOA correlated well with CxHyO ions (Fig. S8). In addition, the time series of MO-OOA correlated well with sulfate (R2= 0.55) and BC (R2= 0.54), and less well with nitrate (R2= 0.33), while LO-OOA correlated poorly with sulfate, BC, and nitrate (Figs. 10b and S9). These results highlight the oxidation degree of MO-OOA and LO-OOA. LO-OOA and MO-OOA accounted for 41 and 59 % on average, respectively, of total OA mass during this study (Fig. 11a), and their relative contributions varied across the study (Fig. 2e). For example, LO-OOA accounted for 41 % of the total OA mass during P1, 24 % during P2, and 67 % during the monsoon period (Fig. 11b). The diurnal pattern of MO-OOA was characterized by higher concentrations during afternoon similar to those of sulfate and BC, while the diurnal pattern of LO-OOA peaked at early evening (Fig. 10c). The polar plot showed concentrated hotspots to the northwest of the sampling site for MO-OOA, and southeast for LO-OOA (Fig. 6), indicating that the sources of these two components were different. Based on trajectory analysis (Fig. 3), MO-OOA was likely closely related to long-range transport of air mass from southwest, while LO-OOA could be derived from relatively shorter distance transport such as from a marine air mass from south and regional background aerosol during the nighttime. Shen et al. (2015) reported that there was a significant aerosol source from biogenic emissions during summer near the Nam Co station. As shown in Fig. 12a and b, MO-OOA, which was highly oxidized (O ∕ C = 0.96), appeared on the upper-left corner of the triangle plot while LO-OOA was in the middle part with an O ∕ C ratio of 0.49. The high oxidation degree of MO-OOA was likely related to extensive aging processes occurring during long-range transport. The slope of linear fitting of all the data points in the VK diagram is −0.76, suggesting the evolution of OA as carboxylic acid functionalization (Fig. 12c).
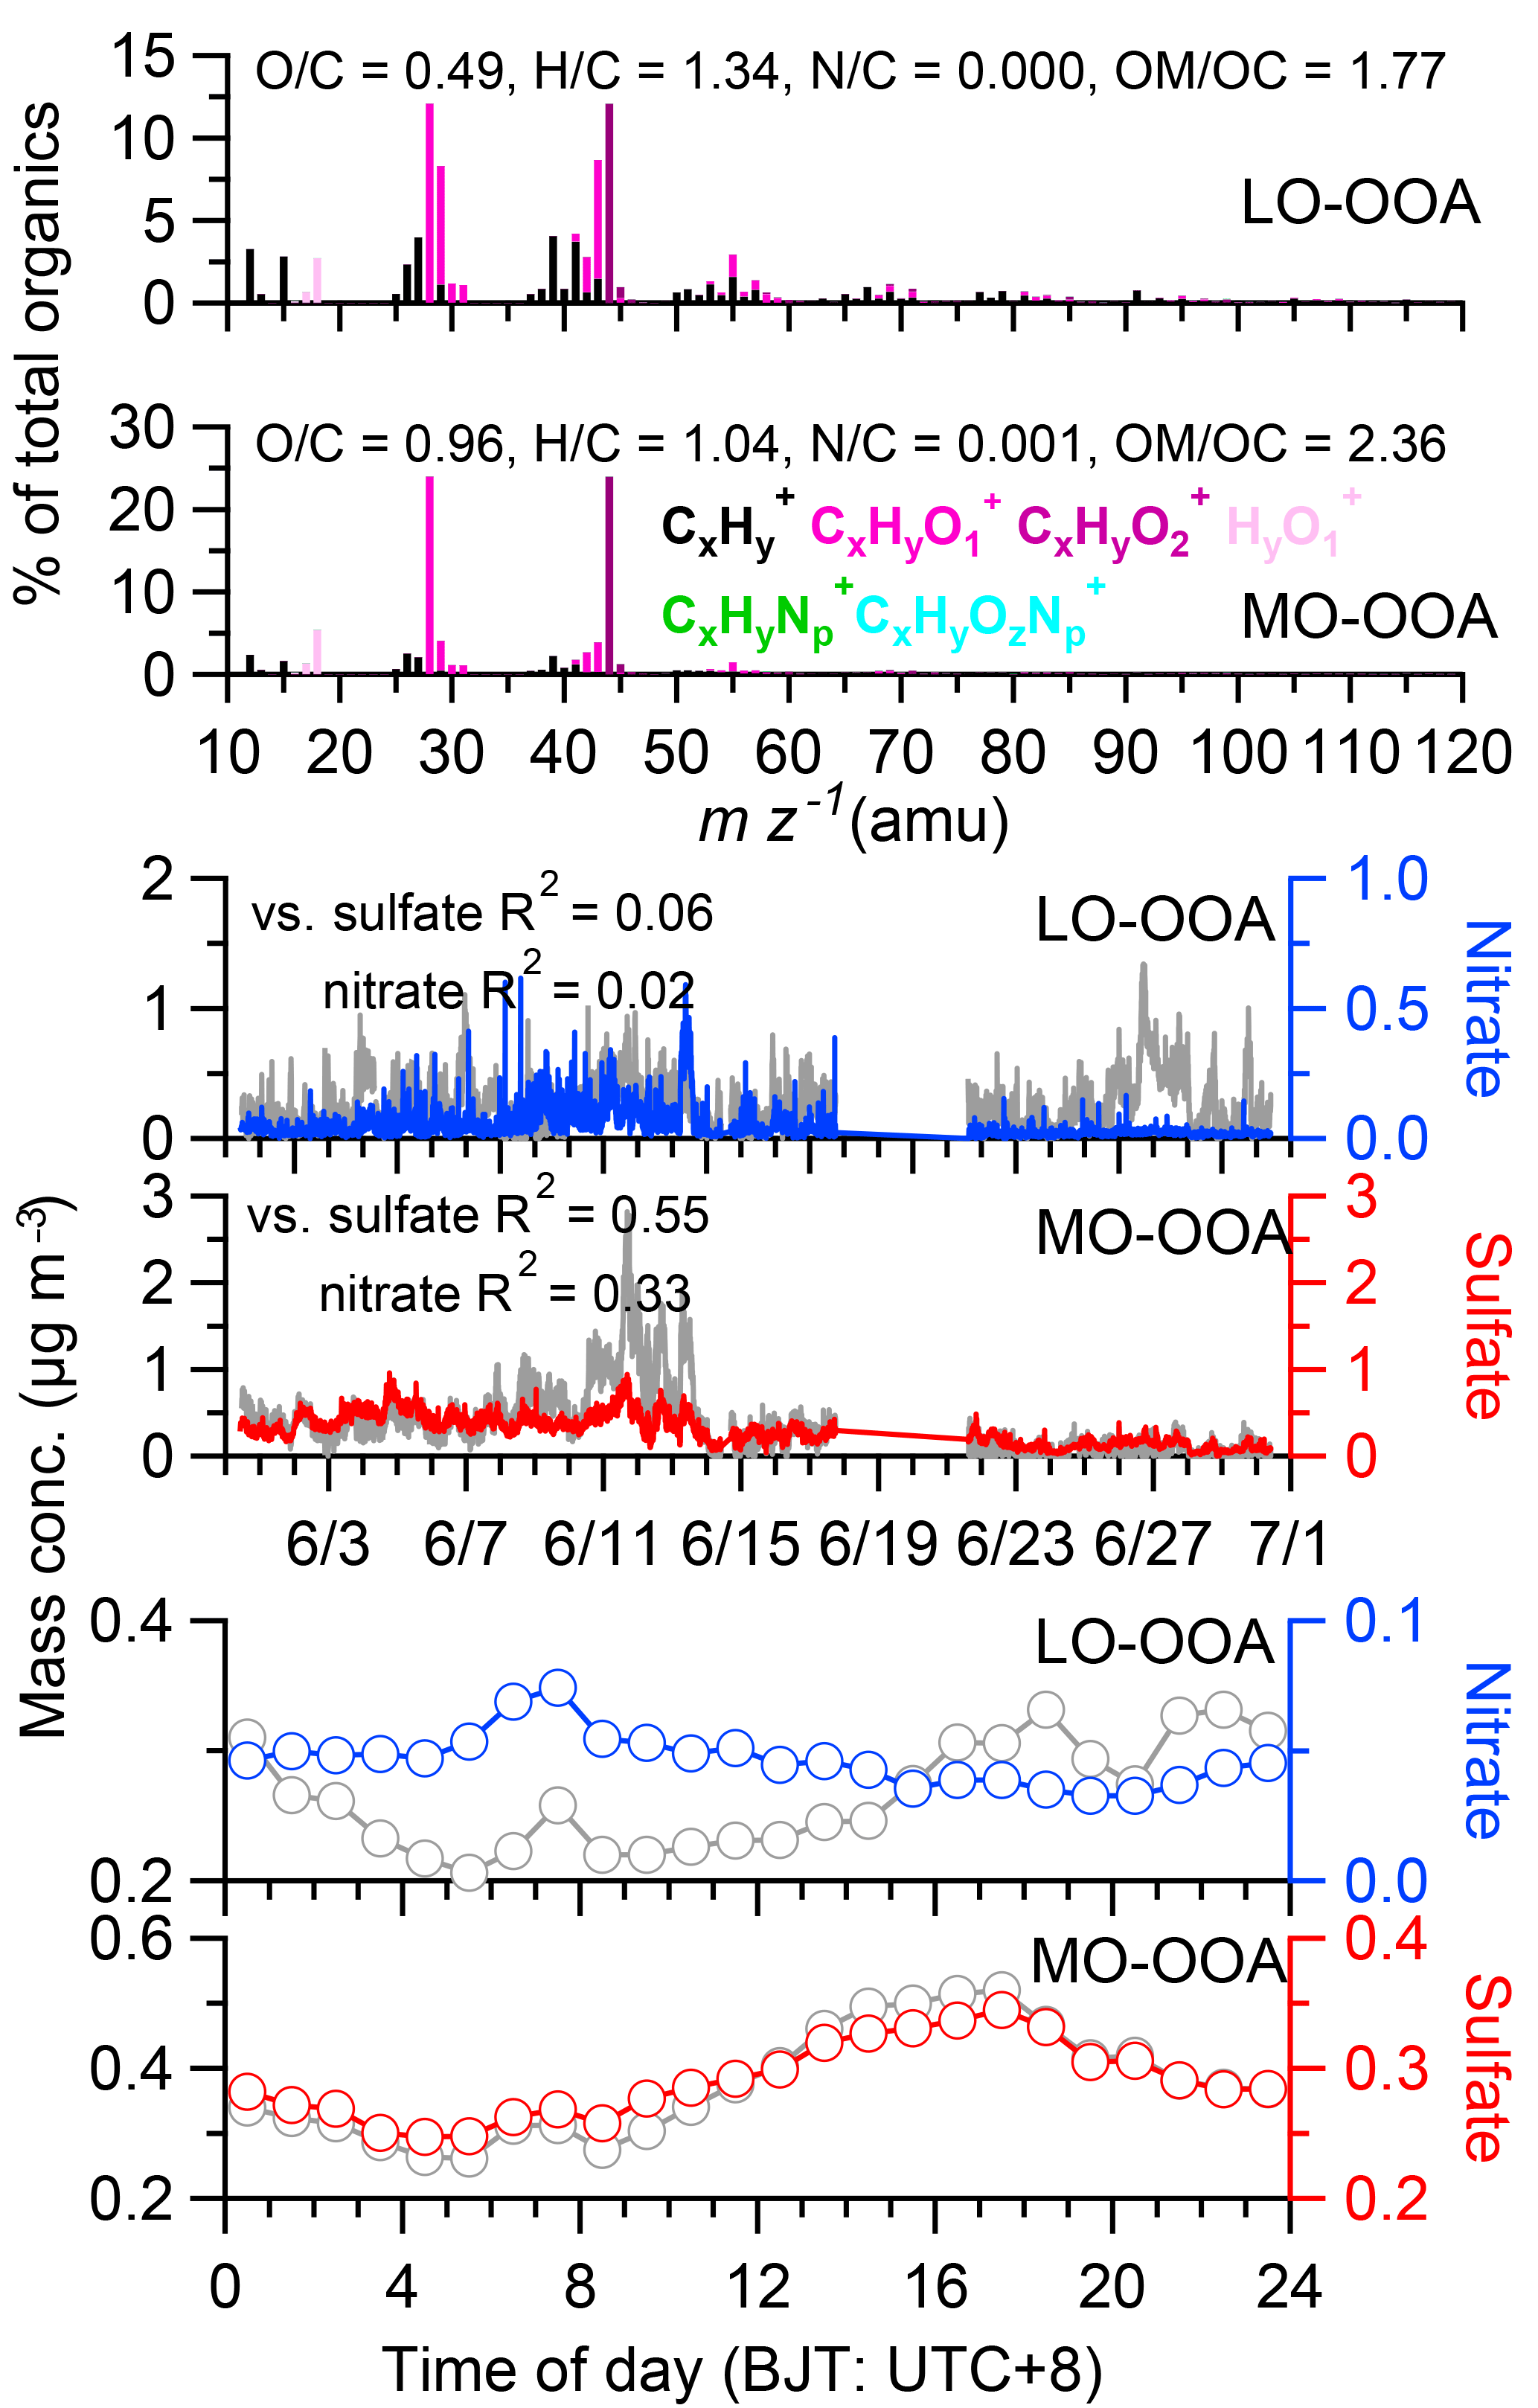
Figure 10PMF results of (a) high-resolution mass spectra colored according to six ion categories for LO- and MO-OOA, respectively, (b) temporal variations of the OA factors and corresponding comparison with tracer species (sulfate and nitrate), and (c) diurnal variations of the mass concentration of the OA factors and tracer species.
Biomass burning emission is an important source in South Asia and could be transported to Himalayas and TP during pre-monsoon (Engling et al., 2011; Kumar et al., 2011; Sang et al., 2013; Cong et al., 2015); however, there are not significant signals of biomass burning aerosol in our AMS results such as signals at m∕z 60 and 73 in mass spectrum of OA which were found to be associated with levoglucosan formed from the pyrolysis of cellulose (Alfarra et al., 2007). The contribution of f60 (fraction of total organic signal accounted for by m∕z 60) for LO-OOA and MO-OOA were 0.2 and 0.3 %, respectively, which were similar to the global background level (less than 0.3 %) suggested by Cubison et al. (2011). These results suggest that OA, if ever partly originating from biomass burning emissions, could have been highly oxidized during transport. The behavior that levoglucosan could be quickly (within a few hours) oxidized after being emitted has been observed in a few studies (Ortega et al., 2013). In addition, Zhou et al. (2017) recently reported the observation of a highly aged biomass burning OA (BBOA) factor with f60 < 0.3 % in its mass spectrum, in aged wildfire plumes that had gone through extensive photochemical oxidation.
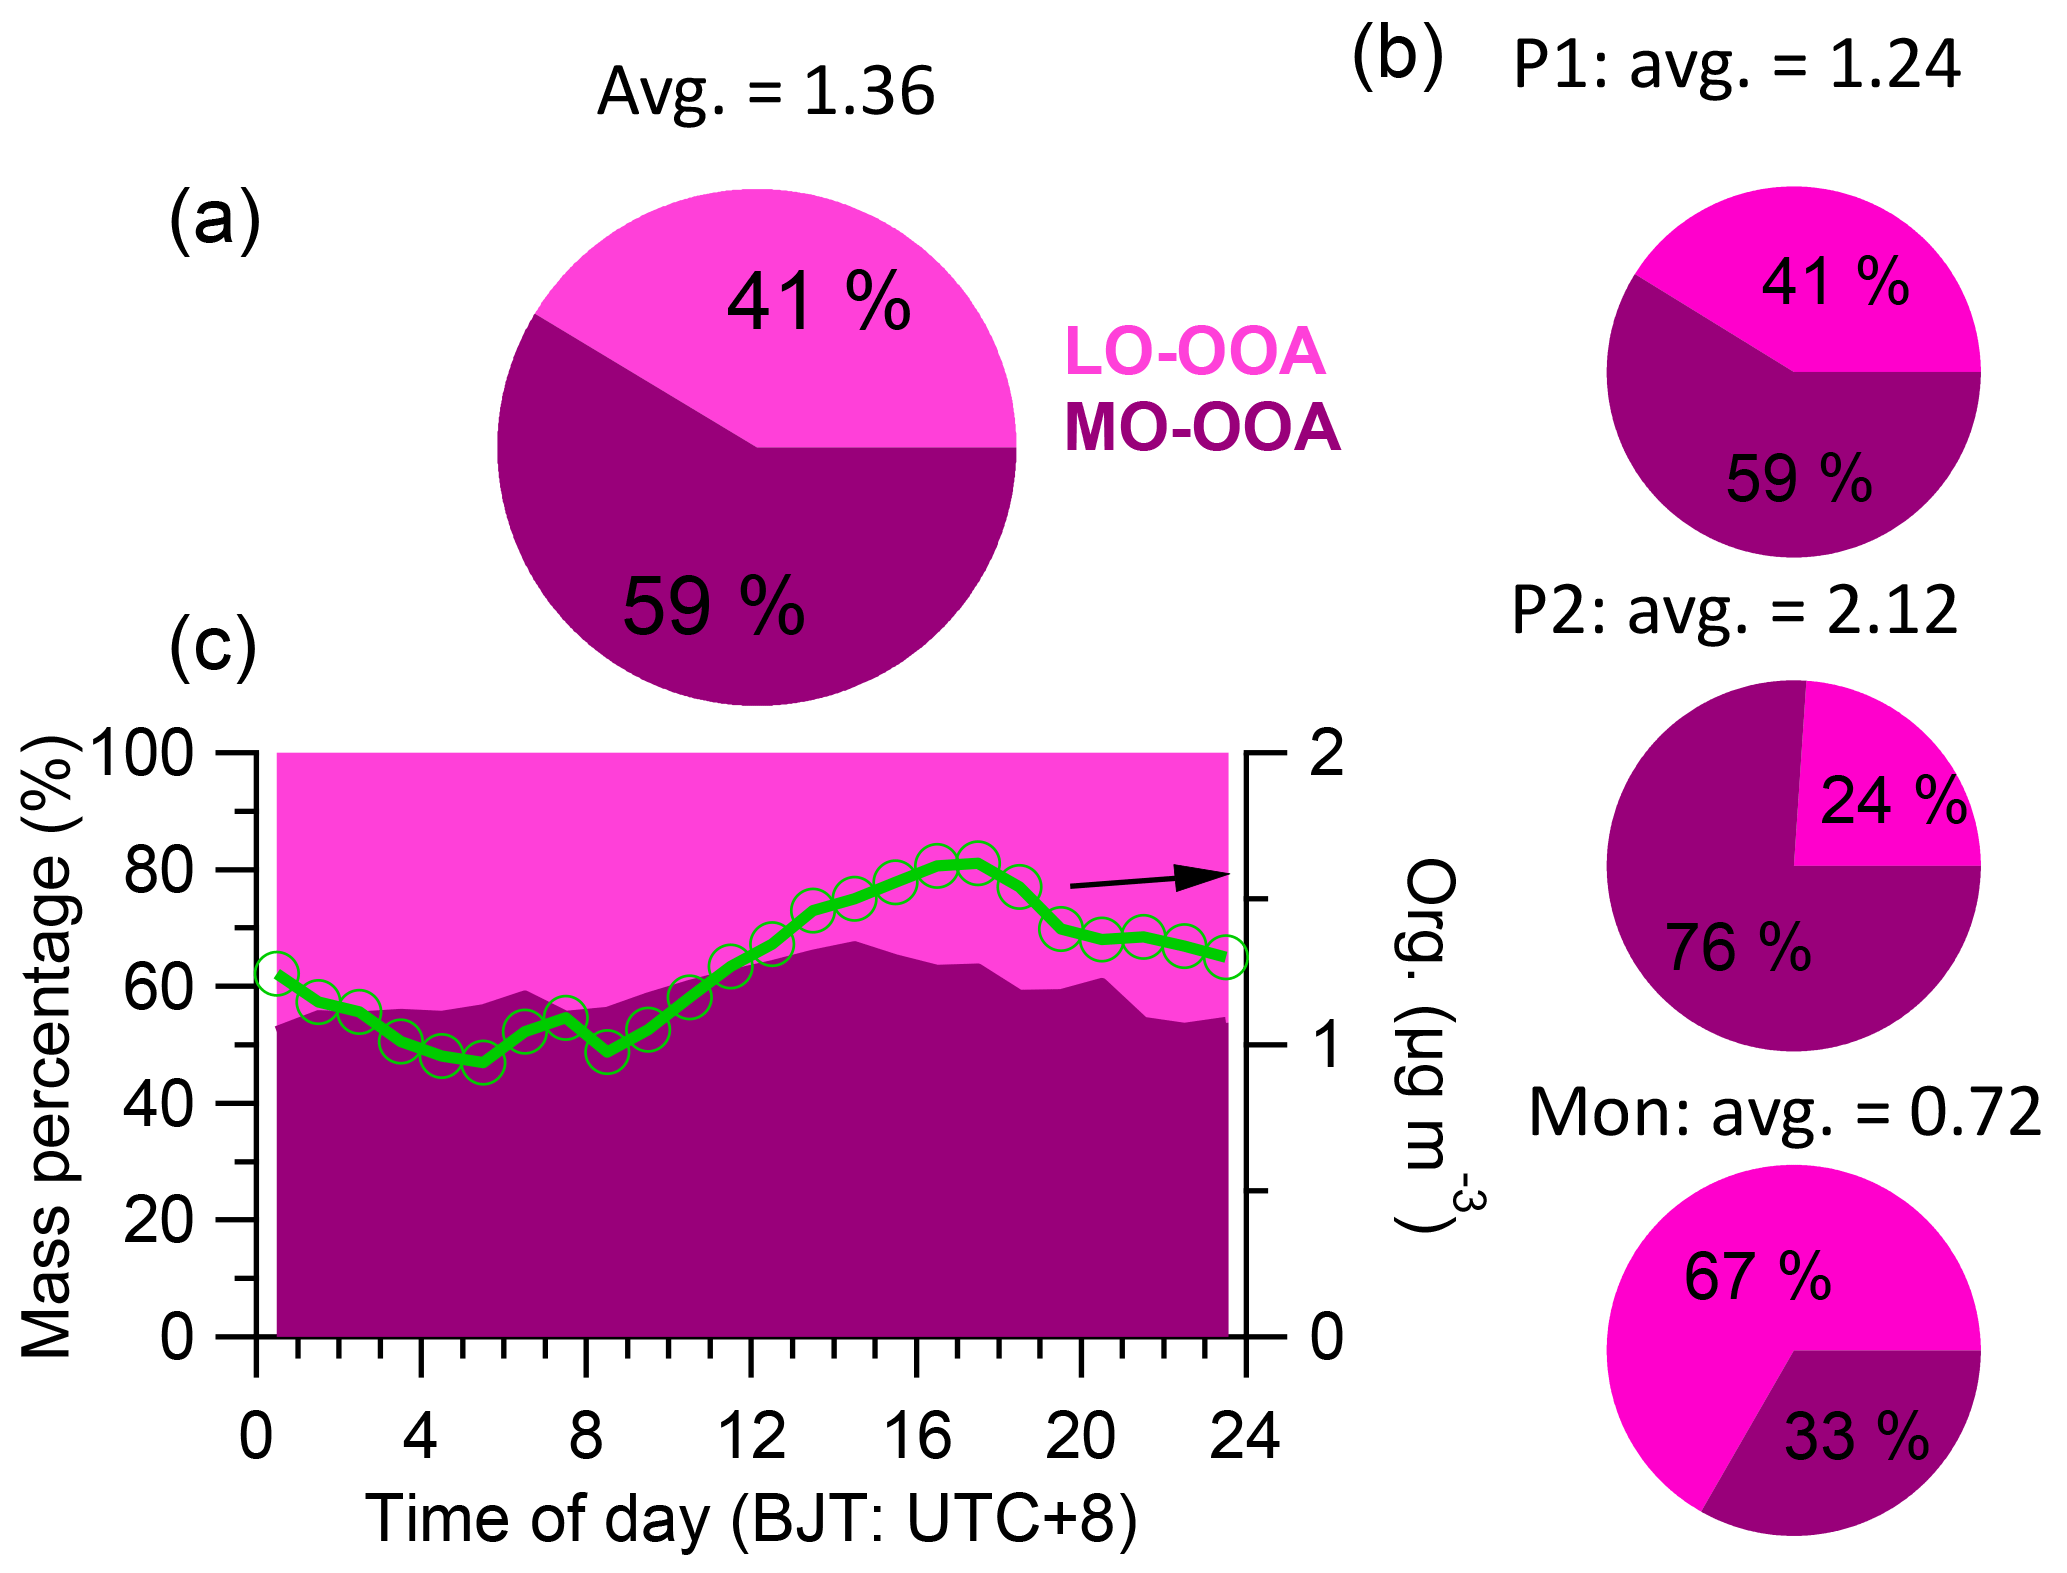
Figure 11(a) The average mass contributions of two factors (a) during the study, (b) during the different periods, and (c) the diurnal mass contribution of two factors (left axis) accompanying the total organics (right axis).
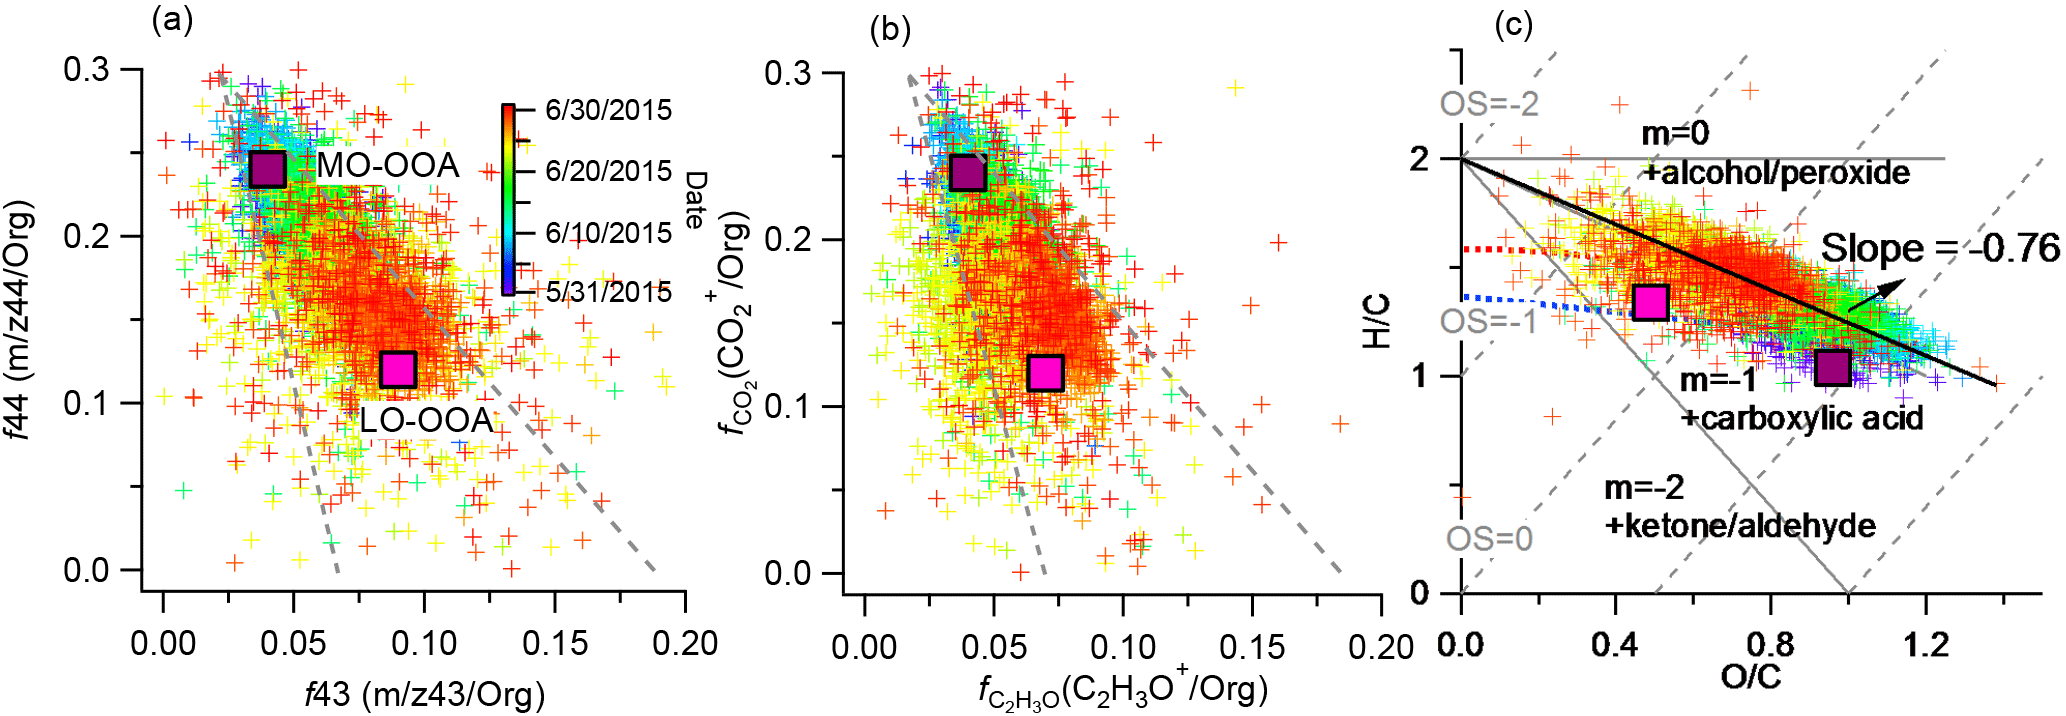
Figure 12Scatter plots of (a) f44 vs. f43 (dates given in MM/DD/YYYY format), (b) fCO vs. fC2H3O+, and (c) H ∕ C vs. O ∕ C for the OA. The dashed lines in (a) and (b) refer to a triangular region that encompasses ambient OOA factors determined from PMF analyses of 43 AMS data sets (Ng et al., 2010). The light solid lines with slopes of 0, −1, and −2 in (c) indicate the changes of H ∕ C against O ∕ C due to adding specific functional groups to an aliphatic carbon (Heald et al., 2010); the light dashed lines indicate the oxidation state (OS) of −2, −1, 0, 1, and 2, respectively (Kroll et al., 2011); the red and blue dashed lines are derived from the right and left lines in the triangle plot; the heavy solid line indicates the slope of our measured data. The corresponding values of the OOAs identified in this study are also shown in each plot.
3.6 Sensitivity of the aerosol transport to synoptic process
The synoptic process is an important factor determining if the regional emissions can be transported to the TP. It is interesting to know what kind of synoptic process is favorable for transporting aerosol plume to the Himalayas and the TP. A 3-D regional chemical transport model (REAM) coupled with WRF was used to examine the chemical evolution and regional transport of pollutants such as aromatics in this study. REAM has been used in previous studies of the Tibetan Plateau, and details about the model can be found in Zhang et al. (2017) and Supplement. REAM could capture some synoptic processes which cannot be simulated by the normally used reanalysis data due to their low resolution and the complexity of terrain in the Tibetan Plateau (Zhang et al., 2017). Figure 13 shows the distribution of simulated daily surface wind, 300 hPa geopotential height fields, and concentrations of reactive aromatics over the Tibetan Plateau during 30 May–13 June 2015. During 30 May to 7 June, corresponding to P1, there was a trough over the north propagated from west to east and this low pressure induced increasingly stronger surface wind from India to the TP, which could lead to transport of aerosol plume as illustrated by the results of model and AMS. The simulated concentration of reactive aromatics showed a peak during this period (Fig. S10). During 8–11 June, there was a weak ridge system over the north. Weak wind from west and south was observed and the simulated concentrations of reactive aromatics were sharply decreased (Fig. S10). After that, a weak low-pressure trough system was observed again. The increased concentrations of reactive aromatics were also observed accompanying the intensified southern wind. Although these trends are basically consistent with our AMS results, there were also significant differences (Fig. S10). The possible reason was that the weak ridge during P2 enhanced the wind from north and weakened the wind from west and south, where a lot of biomass burning emission sources are located (Fig. 3b). Zhang et al. (2017) suggested that a cut-off low system from the upper troposphere could be an important driver for aerosol plume transport into the TP. In our study, the trough/ridge system seems to be also an important factor affecting the transport of aerosol plume from south and west, although this effect tends to be weaker in summer than in the other seasons because the tropopause is higher and stratospheric wave activity is weaker in summer.
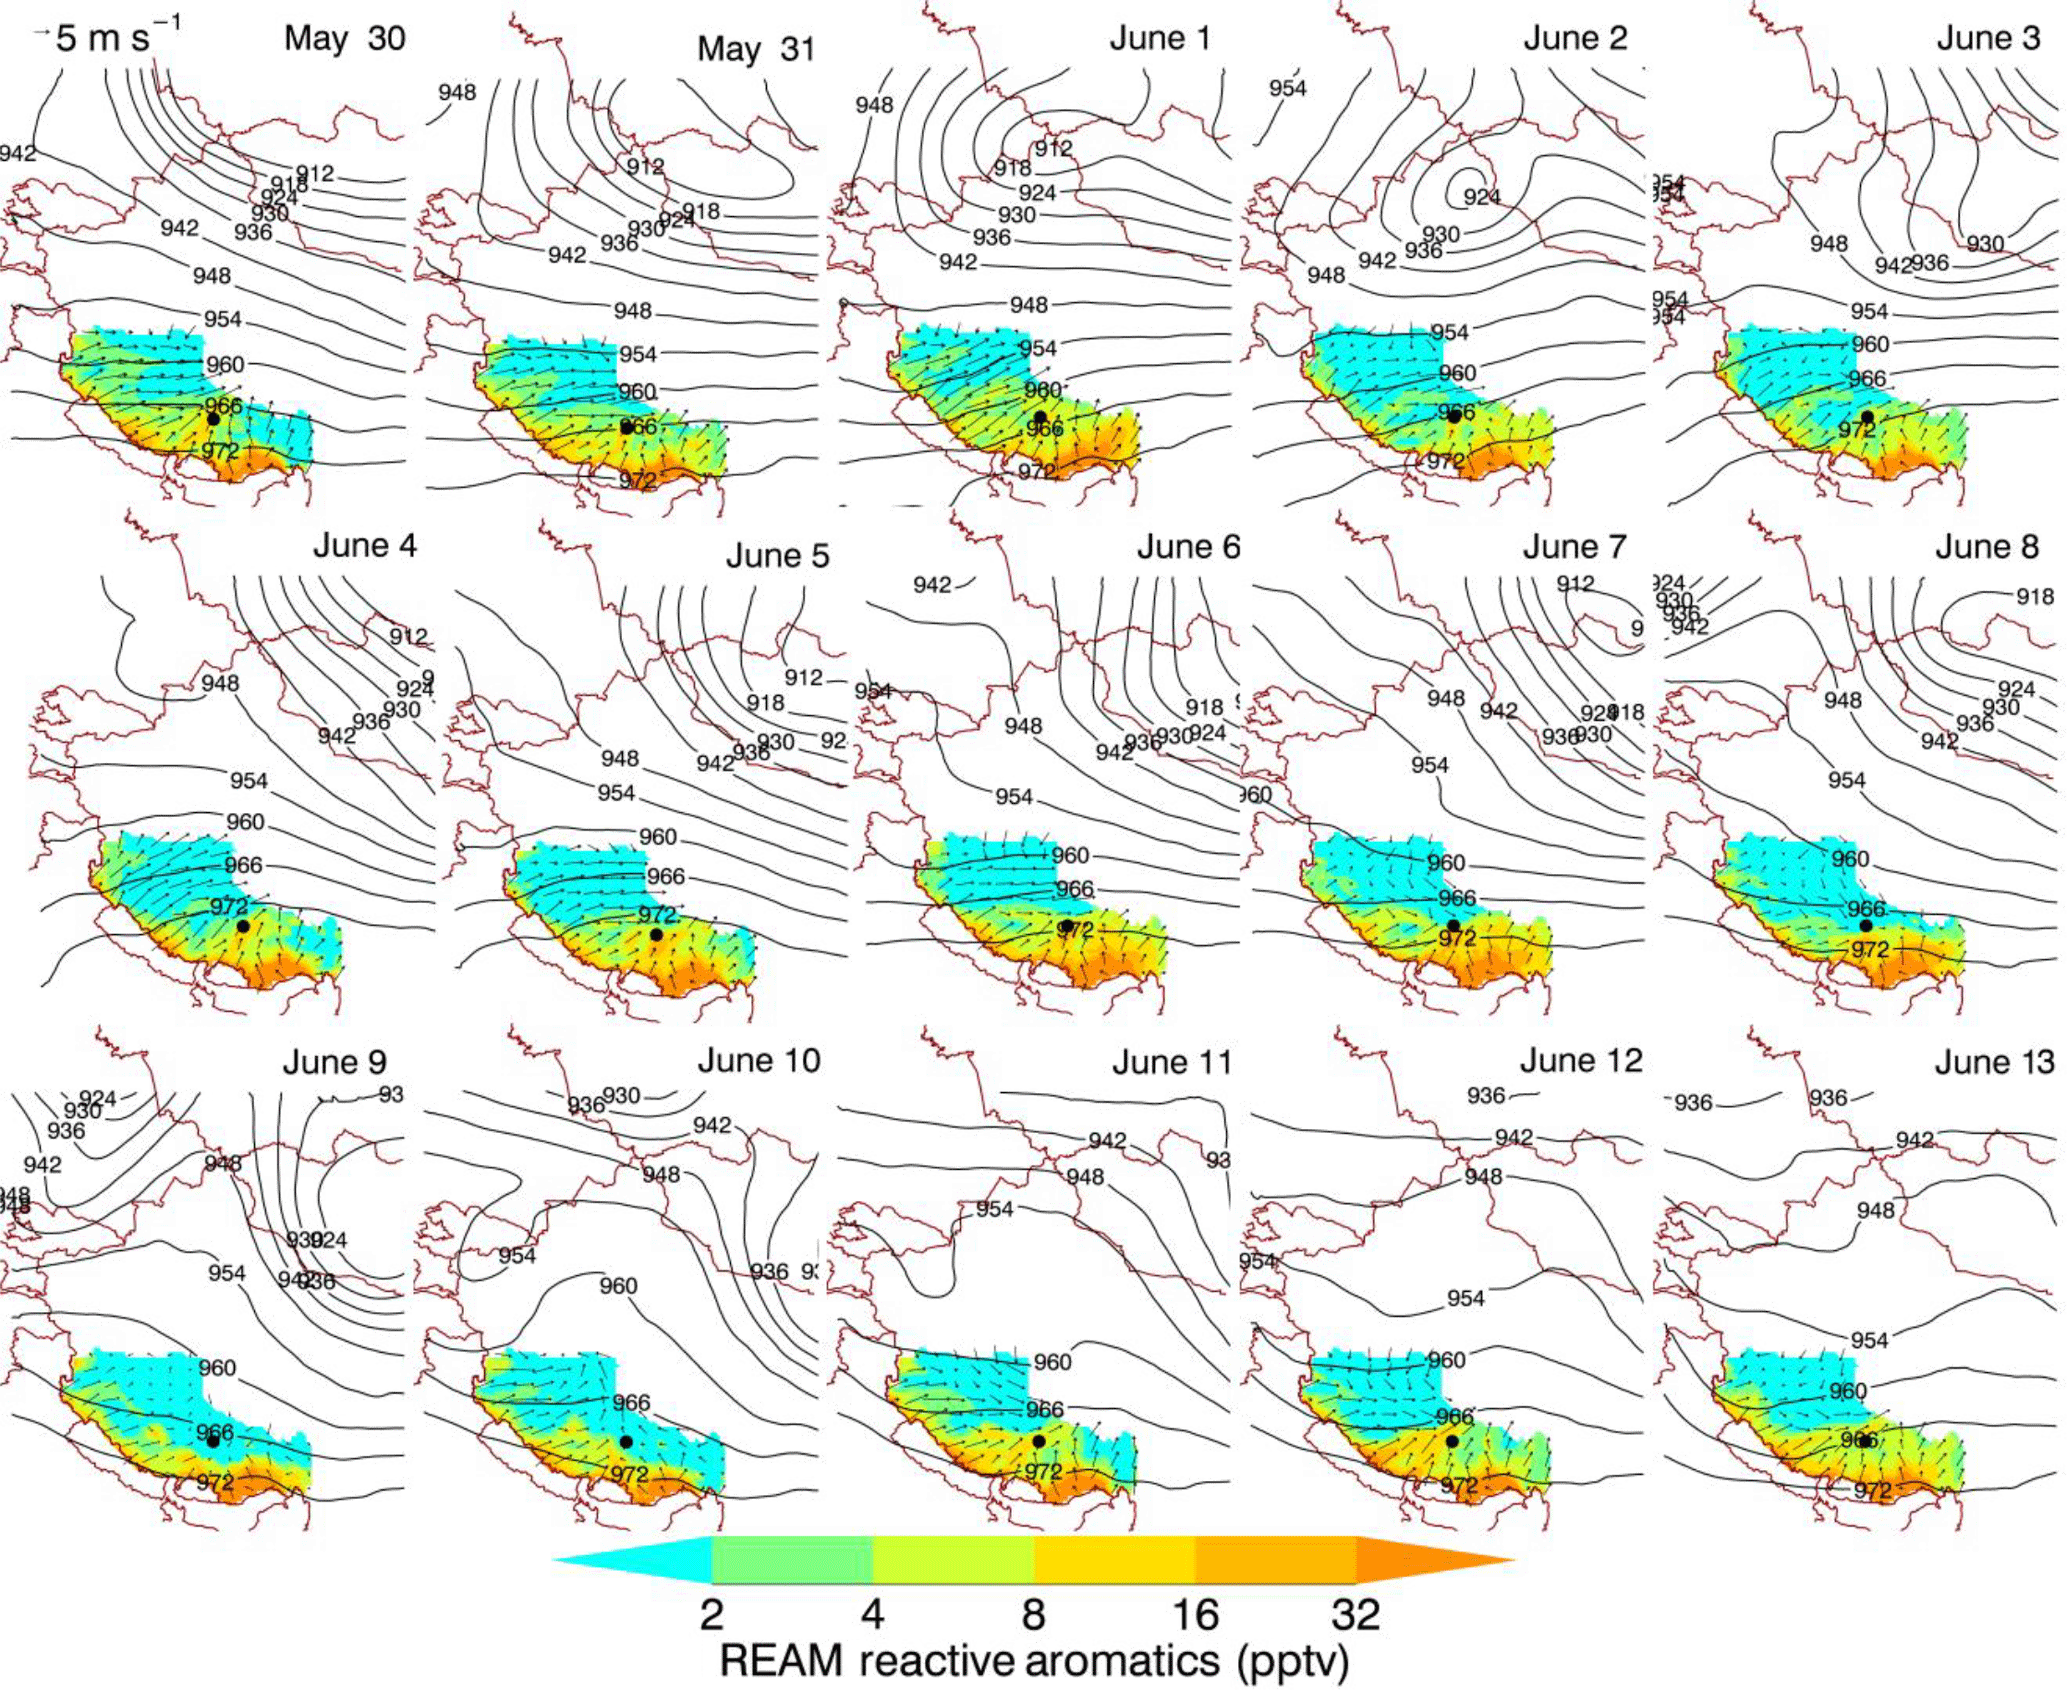
Figure 13Daily distribution of WRF-simulated surface wind and REAM-simulated concentrations of reactive aromatics over the Tibetan Plateau during 30 May to 13 June 2015.
3.7 Atmospheric implications
Our results have several potential implications for atmospheric studies in the TP and Himalayas. Firstly, it is useful for the accurate estimation of the radiative forcing of aerosols in this region and validation of current model simulation results based on our observed chemical composition and mass loadings of fine aerosols. Ji et al. (2015) estimate the radiative forcing from aerosols over the TP and Himalayas at the surface level using a regional climate model (RegCM4.3); for carbonaceous aerosols, there are several studies which have tested the model results, but all other species referred to in published studies have coarse spatial and temporal resolution. Secondly, our findings have implications for aerosol deposition on the glacier of this region and evaluation of subsequent impacts on the melting of snow/ice (Yasunari et al., 2010). Thirdly, highly time-resolved aerosol data are very scarce in this remote plateau; thus our data are valuable to validate modeling results regarding the transport of aerosol plume as demonstrated in Sect. 3.6. Finally, the transport mechanism of aerosol to the inland of TP is less understood so far. Hindman and Upadhyay (2002) suggested that the vertical lifting due to convection and subsequent horizontal mountain valley wind could lead to the transport of aerosol from Nepal to Tibet. Dumka et al. (2010) also highlighted the important role of mountain valley wind in the aerosol transport in the central Himalayas. The dynamic variations of aerosol chemical species measured here are likely helpful for elucidating the transport mechanism of high-concentration air mass. Nevertheless, this scientific issue requires further detailed investigations in the future.
The average PM1 loading measured at Nam Co during June 2015 was 2.0 µg m−3 with organics accounting for 68 %, followed by sulfate (15 %), black carbon (8 %), ammonium (7 %), and nitrate (2 %). This mass concentration was comparable to some AMS observations from mountain top sites. The mass concentration of PM1 varied during different weather conditions with higher concentration during pre-monsoon and lower concentration during monsoon. The pre-monsoon period could also be divided into two periods (P1 and P2) based on meteorological conditions and aerosol chemical composition. During P1, PM1 was characterized with high contribution from OA and sulfate, while increased contribution of nitrate was observed during P2 with wet and cold weather conditions. All PM1 species had clear diurnal variations with OA, sulfate, BC, and ammonium peaking during afternoon due to photochemical production of these species coupled with transport of aerosol plumes. Nitrate, however, peaked during the nighttime and early morning, which was related to high RH and low air temperature. The formation of nitrate was highly correlated with transport of air masses from southwest under very low wind speeds, while the mass concentrations of sulfate, OA, and BC were highly correlated with air masses from northwest and southeast under higher wind speed conditions. OA was overall highly oxidized during the entire study with higher O ∕ C ratios during the pre-monsoon period. Based on PMF analysis, the OA was found to be composed of a LO-OOA and a MO-OOA. LO-OOA was mainly associated with air masses originating from the south, while MO-OOA was mainly from northwest. MO-OOA dominated OA during the pre-monsoon period, while LO-OOA dominated during the monsoon period. The transport mechanism of aerosol plume was further investigated by using the REAM chemical model coupled with the WRF model. The aerosol plume was found to be more easily transported to the TP and Himalayas during low-pressure trough weather.
The processed AMS data and meteorological data in this study are available upon request from the corresponding author.
The supplement related to this article is available online at: https://doi.org/10.5194/acp-18-427-2018-supplement.
The authors declare that they have no conflict of interest.
This article is part of the special issue “Study of ozone, aerosols and radiation over the Tibetan Plateau (SOAR-TP) (ACP/AMT inter-journal SI)”. It is not associated with a conference.
The authors show thanks for the logistical support of the Nam Co station for Multisphere
Observation and Research, Chinese Academy of Sciences. This research was
supported by grants from the National Natural Science Foundation of China
(41771079, 41330526), the National Natural Science Foundation of China
Science Fund for Creative Research Groups (41421061), the Key Laboratory of
Cryospheric Sciences Scientific Research Foundation (SKLCS-ZZ-2017-01), the
US National Science Foundation, and the Chinese Academy of Sciences Hundred
Talents Program.
Edited by: Xiaobin Xu
Reviewed by: two anonymous referees
Aiken, A. C., DeCarlo, P. F., Kroll, J. H., Worsnop, D. R., Huffman, J. A., Docherty, K. S., Ulbrich, I. M., Mohr, C., Kimmel, J. R., Sueper, D., Sun, Y., Zhang, Q., Trimborn, A., Northway, M., Ziemann, P. J., Canagaratna, M. R., Onasch, T. B., Alfarra, M. R., Prevot, A. S. H., Dommen, J., Duplissy, J., Metzger, A., Baltensperger, U., and Jimenez, J. L.: O ∕ C and OM ∕ OC Ratios of Primary, Secondary, and Ambient Organic Aerosols with High-Resolution Time-of-Flight Aerosol Mass Spectrometry, Environ. Sci. Technol., 42, 4478–4485, https://doi.org/10.1021/es703009q, 2008.
Alfarra, M. R., Prevot, A. S. H., Szidat, S., Sandradewi, J., Weimer, S., Lanz, V. A., Schreiber, D., Mohr, M., and Baltensperger, U.: Identification of the Mass Spectral Signature of Organic Aerosols from Wood Burning Emissions, Environ. Sci. Technol., 41, 5770–5777, https://doi.org/10.1021/es062289b, 2007.
Bertram, A., Martin, S., Hanna, S., Smith, M., Bodsworth, A., Chen, Q., Kuwata, M., Liu, A., You, Y., and Zorn, S.: Predicting the relative humidities of liquid-liquid phase separation, efflorescence, and deliquescence of mixed particles of ammonium sulfate, organic material, and water using the organic-to-sulfate mass ratio of the particle and the oxygen-to-carbon elemental ratio of the organic component, Atmos. Chem. Phys., 11, 10995–11006, https://doi.org/10.5194/acp-11-10995-2011, 2011.
Bonasoni, P., Laj, P., Marinoni, A., Sprenger, M., Angelini, F., Arduini, J., Bonafè, U., Calzolari, F., Colombo, T., Decesari, S., Di Biagio, C., di Sarra, A. G., Evangelisti, F., Duchi, R., Facchini, M. C., Fuzzi, S., Gobbi, G. P., Maione, M., Panday, A., Roccato, F., Sellegri, K., Venzac, H., Verza, G. P., Villani, P., Vuillermoz, E., and Cristofanelli, P.: Atmospheric Brown Clouds in the Himalayas: first two years of continuous observations at the Nepal Climate Observatory-Pyramid (5079 m), Atmos. Chem. Phys., 10, 7515–7531, https://doi.org/10.5194/acp-10-7515-2010, 2010.
Canagaratna, M. R., Jayne, J. T., Jimenez, J. L., Allan, J. D., Alfarra, M. R., Zhang, Q., Onasch, T. B., Drewnick, F., Coe, H., Middlebrook, A., Delia, A., Williams, L. R., Trimborn, A. M., Northway, M. J., DeCarlo, P. F., Kolb, C. E., Davidovits, P., and Worsnop, D. R.: Chemical and microphysical characterization of ambient aerosols with the aerodyne aerosol mass spectrometer, Mass. Spectrom. Rev., 26, 185–222, https://doi.org/10.1002/mas.20115, 2007.
Canagaratna, M. R., Jimenez, J. L., Kroll, J. H., Chen, Q., Kessler, S. H., Massoli, P., Hildebrandt Ruiz, L., Fortner, E., Williams, L. R., Wilson, K. R., Surratt, J. D., Donahue, N. M., Jayne, J. T., and Worsnop, D. R.: Elemental ratio measurements of organic compounds using aerosol mass spectrometry: characterization, improved calibration, and implications, Atmos. Chem. Phys., 15, 253–272, https://doi.org/10.5194/acp-15-253-2015, 2015.
Clarisse, L., Clerbaux, C., Dentener, F., Hurtmans, D., and Coheur, P.-F.: Global ammonia distribution derived from infrared satellite observations, Nat. Geosci., 2, 479–483, https://doi.org/10.1038/ngeo551, 2009.
Collier, S., Zhou, S., Kuwayama, T., Forestieri, S., Brady, J., Zhang, M., Kleeman, M., Cappa, C., Bertram, T., and Zhang, Q.: Organic PM Emissions from Vehicles: Composition, O ∕ C Ratio, and Dependence on PM Concentration, Aerosol Sci. Tech., 49, 86–97, https://doi.org/10.1080/02786826.2014.1003364, 2015.
Cong, Z., Kang, S., Kawamura, K., Liu, B., Wan, X., Wang, Z., Gao, S., and Fu, P.: Carbonaceous aerosols on the south edge of the Tibetan Plateau: concentrations, seasonality and sources, Atmos. Chem. Phys., 15, 1573–1584, https://doi.org/10.5194/acp-15-1573-2015, 2015.
Cristofanelli, P., Bonasoni, P., Bonafé, U., Calzolari, F., Duchi, R., Marinoni, A., Roccato, F., Vuillermoz, E., and Sprenger, M.: Influence of lower stratosphere/upper troposphere transport events on surface ozone at the Everest-Pyramid GAW Station (Nepal): first year of analysis, Int. J. Remote Sens., 30, 4083–4097, https://doi.org/10.1080/01431160902821940, 2009.
Cristofanelli, P., Bracci, A., Sprenger, M., Marinoni, A., Bonafè, U., Calzolari, F., Duchi, R., Laj, P., Pichon, J. M., Roccato, F., Venzac, H., Vuillermoz, E., and Bonasoni, P.: Tropospheric ozone variations at the Nepal Climate Observatory-Pyramid (Himalayas, 5079 m a.s.l.) and influence of deep stratospheric intrusion events, Atmos. Chem. Phys., 10, 6537–6549, https://doi.org/10.5194/acp-10-6537-2010, 2010.
Cubison, M. J., Ortega, A. M., Hayes, P. L., Farmer, D. K., Day, D., Lechner, M. J., Brune, W. H., Apel, E., Diskin, G. S., Fisher, J. A., Fuelberg, H. E., Hecobian, A., Knapp, D. J., Mikoviny, T., Riemer, D., Sachse, G. W., Sessions, W., Weber, R. J., Weinheimer, A. J., Wisthaler, A., and Jimenez, J. L.: Effects of aging on organic aerosol from open biomass burning smoke in aircraft and laboratory studies, Atmos. Chem. Phys., 11, 12049–12064, https://doi.org/10.5194/acp-11-12049-2011, 2011.
DeCarlo, P. F., Kimmel, J. R., Trimborn, A., Northway, M. J., Jayne, J. T., Aiken, A. C., Gonin, M., Fuhrer, K., Horvath, T., Docherty, K. S., Worsnop, D. R., and Jimenez, J. L.: Field-Deployable, High-Resolution, Time-of-Flight Aerosol Mass Spectrometer, Anal. Chem., 78, 8281–8289, https://doi.org/10.1021/ac061249n, 2006.
Draxler, R. R. and Hess, G. D.: An overview of the hysplit-4 modeling system for trajectories, Aust. Meteorol. Mag., 47, 295–308, 1998.
Du, W., Sun, Y. L., Xu, Y. S., Jiang, Q., Wang, Q. Q., Yang, W., Wang, F., Bai, Z. P., Zhao, X. D., and Yang, Y. C.: Chemical characterization of submicron aerosol and particle growth events at a national background site (3295 m a.s.l.) on the Tibetan Plateau, Atmos. Chem. Phys., 15, 10811–10824, https://doi.org/10.5194/acp-15-10811-2015, 2015.
Dumka, U. C., Moorthy, K. K., Kumar, R., Hegde, P., Sagar, R., Pant, P., Singh, N., and Babu, S. S.: Characteristics of aerosol black carbon mass concentration over a high altitude location in the Central Himalayas from multi-year measurements, Atmos. Res., 96, 510–521, https://doi.org/10.1016/j.atmosres.2009.12.010, 2010.
Engling, G., Zhang, Y.-N., Chan, C.-Y., Sang, X.-F., Lin, M., Ho, K.-F., Li, Y.-S., Lin, C.-Y., and Lee, J. J.: Characterization and sources of aerosol particles over the southeastern Tibetan Plateau during the Southeast Asia biomass-burning season, Tellus B, 63, 117–128, https://doi.org/10.1111/j.1600-0889.2010.00512.x, 2011.
Fang, K., Makkonen, R., Guo, Z., Zhao, Y., and Seppa, H.: An increase in the biogenic aerosol concentration as a contributing factor to the recent wetting trend in Tibetan Plateau, Scientific Reports, 5, 14628, https://doi.org/10.1038/srep14628, 2015.
Freney, E. J., Sellegri, K., Canonaco, F., Boulon, J., Hervo, M., Weigel, R., Pichon, J. M., Colomb, A., Prévôt, A. S. H., and Laj, P.: Seasonal variations in aerosol particle composition at the puy-de-Dôme research station in France, Atmos. Chem. Phys., 11, 13047–13059, https://doi.org/10.5194/acp-11-13047-2011, 2011.
Fröhlich, R., Crenn, V., Setyan, A., Belis, C. A., Canonaco, F., Favez, O., Riffault, V., Slowik, J. G., Aas, W., Aijälä, M., Alastuey, A., Artiñano, B., Bonnaire, N., Bozzetti, C., Bressi, M., Carbone, C., Coz, E., Croteau, P. L., Cubison, M. J., Esser-Gietl, J. K., Green, D. C., Gros, V., Heikkinen, L., Herrmann, H., Jayne, J. T., Lunder, C. R., Minguillón, M. C., Močnik, G., O'Dowd, C. D., Ovadnevaite, J., Petralia, E., Poulain, L., Priestman, M., Ripoll, A., Sarda-Estève, R., Wiedensohler, A., Baltensperger, U., Sciare, J., and Prévôt, A. S. H.: ACTRIS ACSM intercomparison – Part 2: Intercomparison of ME-2 organic source apportionment results from 15 individual, co-located aerosol mass spectrometers, Atmos. Meas. Tech., 8, 2555–2576, https://doi.org/10.5194/amt-8-2555-2015, 2015.
Giordano, M. R., Kalnajs, L. E., Avery, A., Goetz, J. D., Davis, S. M., and DeCarlo, P. F.: A missing source of aerosols in Antarctica – beyond long-range transport, phytoplankton, and photochemistry, Atmos. Chem. Phys., 17, 1–20, https://doi.org/10.5194/acp-17-1-2017, 2017.
Gu, Y., Liao, H., and Bian, J.: Summertime nitrate aerosol in the upper troposphere and lower stratosphere over the Tibetan Plateau and the South Asian summer monsoon region, Atmos. Chem. Phys., 16, 6641–6663, https://doi.org/10.5194/acp-16-6641-2016, 2016.
He, Q. S., Li, C. C., Ma, J. Z., Wang, H. Q., Yan, X. L., Lu, J., Liang, Z. R., and Qi, G. M.: Lidar-observed enhancement of aerosols in the upper troposphere and lower stratosphere over the Tibetan Plateau induced by the Nabro volcano eruption, Atmos. Chem. Phys., 14, 11687–11696, https://doi.org/10.5194/acp-14-11687-2014, 2014.
Heald, C. L., Kroll, J. H., Jimenez, J. L., Docherty, K. S., DeCarlo, P. F., Aiken, A. C., Chen, Q., Martin, S. T., Farmer, D. K., and Artaxo, P.: A simplified description of the evolution of organic aerosol composition in the atmosphere, Geophys. Res. Lett., 37, L08803, https://doi.org/10.1029/2010gl042737, 2010.
Hindman, E. E. and Upadhyay, B. P.: Air pollution transport in the Himalayas of Nepal and Tibet during the 1995–1996 dry season, Atmos. Environ., 36, 727–739, https://doi.org/10.1016/S1352-2310(01)00495-2, 2002.
Jayne, J. T., Leard, D. C., Zhang, X., Davidovits, P., Smith, K. A., Kolb, C. E., and Worsnop, D. R.: Development of an Aerosol Mass Spectrometer for Size and Composition Analysis of Submicron Particles, Aerosol. Sci. Tech., 33, 49–70, https://doi.org/10.1080/027868200410840, 2000.
Ji, Z. M., Kang, S. C., Cong, Z. Y., Zhang, Q. G., and Yao, T. D.: Simulation of carbonaceous aerosols over the Third Pole and adjacent regions: distribution, transportation, deposition, and climatic effects, Clim. Dynam., 45, 2831–2846, 2015.
Jimenez, J. L., Canagaratna, M. R., Donahue, N. M., Prevot, A. S. H., Zhang, Q., Kroll, J. H., DeCarlo, P. F., Allan, J. D., Coe, H., Ng, N. L., Aiken, A. C., Docherty, K. S., Ulbrich, I. M., Grieshop, A. P., Robinson, A. L., Duplissy, J., Smith, J. D., Wilson, K. R., Lanz, V. A., Hueglin, C., Sun, Y. L., Tian, J., Laaksonen, A., Raatikainen, T., Rautiainen, J., Vaattovaara, P., Ehn, M., Kulmala, M., Tomlinson, J. M., Collins, D. R., Cubison, M. J., E., Dunlea, J., Huffman, J. A., Onasch, T. B., Alfarra, M. R., Williams, P. I., Bower, K., Kondo, Y., Schneider, J., Drewnick, F., Borrmann, S., Weimer, S., Demerjian, K., Salcedo, D., Cottrell, L., Griffin, R., Takami, A., Miyoshi, T., Hatakeyama, S., Shimono, A., Sun, J. Y., Zhang, Y. M., Dzepina, K., Kimmel, J. R., Sueper, D., Jayne, J. T., Herndon, S. C., Trimborn, A. M., Williams, L. R., Wood, E. C., Middlebrook, A. M., Kolb, C. E., Baltensperger, U., and Worsnop, D. R.: Evolution of Organic Aerosols in the Atmosphere, Science, 326, 1525–1529, https://doi.org/10.1126/science.1180353, 2009.
Kroll, J. H., Donahue, N. M., Jimenez, J. L., Kessler, S. H., Canagaratna, M. R., Wilson, K. R., Altieri, K. E., Mazzoleni, L. R., Wozniak, A. S., Bluhm, H., Mysak, E. R., Smith, J. D., Kolb, C. E., and Worsnop, D. R.: Carbon oxidation state as a metric for describing the chemistry of atmospheric organic aerosol, Nat. Chem., 3, 133–139, https://doi.org/10.1038/nchem.948, 2011.
Kumar, R., Naja, M., Satheesh, S. K., Ojha, N., Joshi, H., Sarangi, T., Pant, P., Dumka, U. C., Hegde, P., and Venkataramani, S.: Influences of the springtime northern Indian biomass burning over the central Himalayas, J. Geophys. Res.-Atmos., 116, D19302, https://doi.org/10.1029/2010jd015509, 2011.
Li, Z., Lau, W. K. M., Ramanathan, V., Wu, G., Ding, Y., Manoj, M. G., Liu, J., Qian, Y., Li, J., Zhou, T., Fan, J., Rosenfeld, D., Ming, Y., Wang, Y., Huang, J., Wang, B., Xu, X., Lee, S. S., Cribb, M., Zhang, F., Yang, X., Zhao, C., Takemura, T., Wang, K., Xia, X., Yin, Y., Zhang, H., Guo, J., Zhai, P. M., Sugimoto, N., Babu, S. S., and Brasseur, G. P.: Aerosol and monsoon climate interactions over Asia, Rev. Geophys., 54, 2015RG000500, https://doi.org/10.1002/2015RG000500, 2016.
Lin, M., Zhang, Z., Su, L., Hill-Falkenthal, J., Priyadarshi, A., Zhang, Q., Zhang, G., Kang, S., Chan, C.-Y., and Thiemens, M. H.: Resolving the impact of stratosphere-to-troposphere transport on the sulfur cycle and surface ozone over the Tibetan Plateau using a cosmogenic 35S tracer, J. Geophys. Res.-Atmos., 121, 2015JD023801, https://doi.org/10.1002/2015JD023801, 2016.
Liu, B., Cong, Z., Wang, Y., Xin, J., Wan, X., Pan, Y., Liu, Z., Wang, Y., Zhang, G., Wang, Z., Wang, Y., and Kang, S.: Background aerosol over the Himalayas and Tibetan Plateau: observed characteristics of aerosol mass loading, Atmos. Chem. Phys., 17, 449–463, https://doi.org/10.5194/acp-17-449-2017, 2017.
Lu, Z., Streets, D. G., Zhang, Q., and Wang, S.: A novel back-trajectory analysis of the origin of black carbon transported to the Himalayas and Tibetan Plateau during 1996–2010, Geophys. Res. Lett., 39, L01809, https://doi.org/10.1029/2011gl049903, 2012.
Lüthi, Z. L., Škerlak, B., Kim, S. W., Lauer, A., Mues, A., Rupakheti, M., and Kang, S.: Atmospheric brown clouds reach the Tibetan Plateau by crossing the Himalayas, Atmos. Chem. Phys., 15, 6007–6021, https://doi.org/10.5194/acp-15-6007-2015, 2015.
Marinoni, A., Cristofanelli, P., Laj, P., Duchi, R., Calzolari, F., Decesari, S., Sellegri, K., Vuillermoz, E., Verza, G. P., Villani, P., and Bonasoni, P.: Aerosol mass and black carbon concentrations, a two year record at NCO-P (5079 m, Southern Himalayas), Atmos. Chem. Phys., 10, 8551–8562, https://doi.org/10.5194/acp-10-8551-2010, 2010.
Marinoni, A., Cristofanelli, P., Laj, P., Duchi, R., Putero, D., Calzolari, F., Landi, T. C., Vuillermoz, E., Maione, M., and Bonasoni, P.: High black carbon and ozone concentrations during pollution transport in the Himalayas: Five years of continuous observations at NCO-P global GAW station, J. Environ. Sci., 25, 1618–1625, https://doi.org/10.1016/s1001-0742(12)60242-3, 2013.
Ng, N. L., Canagaratna, M. R., Zhang, Q., Jimenez, J. L., Tian, J., Ulbrich, I. M., Kroll, J. H., Docherty, K. S., Chhabra, P. S., Bahreini, R., Murphy, S. M., Seinfeld, J. H., Hildebrandt, L., Donahue, N. M., DeCarlo, P. F., Lanz, V. A., Prévôt, A. S. H., Dinar, E., Rudich, Y., and Worsnop, D. R.: Organic aerosol components observed in Northern Hemispheric datasets from Aerosol Mass Spectrometry, Atmos. Chem. Phys., 10, 4625–4641, https://doi.org/10.5194/acp-10-4625-2010, 2010.
Ng, N. L., Canagaratna, M. R., Jimenez, J. L., Chhabra, P. S., Seinfeld, J. H., and Worsnop, D. R.: Changes in organic aerosol composition with aging inferred from aerosol mass spectra, Atmos. Chem. Phys., 11, 6465–6474, https://doi.org/10.5194/acp-11-6465-2011, 2011.
Ortega, A. M., Day, D. A., Cubison, M. J., Brune, W. H., Bon, D., de Gouw, J. A., and Jimenez, J. L.: Secondary organic aerosol formation and primary organic aerosol oxidation from biomass-burning smoke in a flow reactor during FLAME-3, Atmos. Chem. Phys., 13, 11551–11571, https://doi.org/10.5194/acp-13-11551-2013, 2013.
Paatero, P. and Tapper, U.: Positive matrix factorization: A non-negative factor model with optimal utilization of error estimates of data values, Environmetrics, 5, 111–126, https://doi.org/10.1002/env.3170050203, 1994.
Rinaldi, M., Gilardoni, S., Paglione, M., Sandrini, S., Fuzzi, S., Massoli, P., Bonasoni, P., Cristofanelli, P., Marinoni, A., Poluzzi, V., and Decesari, S.: Organic aerosol evolution and transport observed at Mt. Cimone (2165 m a.s.l.), Italy, during the PEGASOS campaign, Atmos. Chem. Phys., 15, 11327–11340, https://doi.org/10.5194/acp-15-11327-2015, 2015.
Ripoll, A., Minguillón, M. C., Pey, J., Jimenez, J. L., Day, D. A., Sosedova, Y., Canonaco, F., Prévôt, A. S. H., Querol, X., and Alastuey, A.: Long-term real-time chemical characterization of submicron aerosols at Montsec (southern Pyrenees, 1570 m a.s.l.), Atmos. Chem. Phys., 15, 2935–2951, https://doi.org/10.5194/acp-15-2935-2015, 2015.
Sang, X., Zhang, Z., Chan, C., and Engling, G.: Source categories and contribution of biomass smoke to organic aerosol over the southeastern Tibetan Plateau, Atmos. Environ., 78, 113–123, https://doi.org/10.1016/j.atmosenv.2012.12.012, 2013.
Schmale, J., Schneider, J., Nemitz, E., Tang, Y. S., Dragosits, U., Blackall, T. D., Trathan, P. N., Phillips, G. J., Sutton, M., and Braban, C. F.: Sub-Antarctic marine aerosol: dominant contributions from biogenic sources, Atmos. Chem. Phys., 13, 8669–8694, https://doi.org/10.5194/acp-13-8669-2013, 2013.
Shen, R. Q., Ding, X., He, Q. F., Cong, Z. Y., Yu, Q. Q., and Wang, X. M.: Seasonal variation of secondary organic aerosol tracers in Central Tibetan Plateau, Atmos. Chem. Phys., 15, 8781–8793, https://doi.org/10.5194/acp-15-8781-2015, 2015.
Stockwell, C. E., Christian, T. J., Goetz, J. D., Jayarathne, T., Bhave, P. V., Praveen, P. S., Adhikari, S., Maharjan, R., DeCarlo, P. F., Stone, E. A., Saikawa, E., Blake, D. R., Simpson, I. J., Yokelson, R. J., and Panday, A. K.: Nepal Ambient Monitoring and Source Testing Experiment (NAMaSTE): emissions of trace gases and light-absorbing carbon from wood and dung cooking fires, garbage and crop residue burning, brick kilns, and other sources, Atmos. Chem. Phys., 16, 11043–11081, https://doi.org/10.5194/acp-16-11043-2016, 2016.
Stone, E. A., Schauer, J. J., Pradhan, B. B., Dangol, P. M., Habib, G., Venkataraman, C., and Ramanathan, V.: Characterization of emissions from South Asian biofuels and application to source apportionment of carbonaceous aerosol in the Himalayas, J. Geophys. Res.-Atmos., 115, D06301, https://doi.org/10.1029/2009jd011881, 2010.
Sun, Y., Zhang, Q., Macdonald, A. M., Hayden, K., Li, S. M., Liggio, J., Liu, P. S. K., Anlauf, K. G., Leaitch, W. R., Steffen, A., Cubison, M., Worsnop, D. R., van Donkelaar, A., and Martin, R. V.: Size-resolved aerosol chemistry on Whistler Mountain, Canada with a high-resolution aerosol mass spectrometer during INTEX-B, Atmos. Chem. Phys., 9, 3095–3111, https://doi.org/10.5194/acp-9-3095-2009, 2009.
Tang, M. and Reiter, E. R.: Plateau monsoons of the Northern Hemisphere: A comparison between North America and Tibet, Mon. Weather Rev., 112, 617–637, 1984.
Tobo, Y., Zhang, D., Iwasaka, Y., and Shi, G.: On the mixture of aerosols and ice clouds over the Tibetan Plateau: Results of a balloon flight in the summer of 1999, Geophys. Res. Lett., 34, L23801, https://doi.org/10.1029/2007GL031132, 2007.
Ulbrich, I. M., Canagaratna, M. R., Zhang, Q., Worsnop, D. R., and Jimenez, J. L.: Interpretation of organic components from Positive Matrix Factorization of aerosol mass spectrometric data, Atmos. Chem. Phys., 9, 2891–2918, https://doi.org/10.5194/acp-9-2891-2009, 2009.
Van Damme, M., Erisman, J. W., Clarisse, L., Dammers, E., Whitburn, S., Clerbaux, C., Dolman, A. J., and Coheur, P. F.: Worldwide spatiotemporal atmospheric ammonia (NH3) columns variability revealed by satellite, Geophys. Res. Lett., 42, 8660–8668, 2015.
Vernier, J. P., Thomason, L. W., and Kar, J.: CALIPSO detection of an Asian tropopause aerosol layer, Geophys. Res. Lett., 38, L07804, https://doi.org/10.1029/2010GL046614, 2011.
Xu, C., Ma, Y. M., Panday, A., Cong, Z. Y., Yang, K., Zhu, Z. K., Wang, J. M., Amatya, P. M., and Zhao, L.: Similarities and differences of aerosol optical properties between southern and northern sides of the Himalayas, Atmos. Chem. Phys., 14, 3133–3149, https://doi.org/10.5194/acp-14-3133-2014, 2014.
Xu, J., Zhang, Q., Chen, M., Ge, X., Ren, J., and Qin, D.: Chemical composition, sources, and processes of urban aerosols during summertime in northwest China: insights from high-resolution aerosol mass spectrometry, Atmos. Chem. Phys., 14, 12593–12611, https://doi.org/10.5194/acp-14-12593-2014, 2014.
Xu, J., Shi, J., Zhang, Q., Ge, X., Canonaco, F., Prévôt, A. S. H., Vonwiller, M., Szidat, S., Ge, J., Ma, J., An, Y., Kang, S., and Qin, D.: Wintertime organic and inorganic aerosols in Lanzhou, China: sources, processes, and comparison with the results during summer, Atmos. Chem. Phys., 16, 14937–14957, https://doi.org/10.5194/acp-16-14937-2016, 2016.
Xu, X., Zhang, H., Lin, W., Wang, Y., and Jia, S.: First simultaneous measurements of peroxyacetyl nitrate (PAN) and ozone at Nam Co in the central Tibetan Plateau: impacts from the PBL evolution and transport processes, Atmos. Chem. Phys. Discuss., https://doi.org/10.5194/acp-2017-803, in review, 2017.
Yanai, M. and Li, C.: Mechanism of heating and the boundary layer over the Tibetan Plateau, Mon. Weather Rev., 122, 305–323, 1994.
Yasunari, T. J., Bonasoni, P., Laj, P., Fujita, K., Vuillermoz, E., Marinoni, A., Cristofanelli, P., Duchi, R., Tartari, G., and Lau, K. M.: Estimated impact of black carbon deposition during pre-monsoon season from Nepal Climate Observatory – Pyramid data and snow albedo changes over Himalayan glaciers, Atmos. Chem. Phys., 10, 6603–6615, https://doi.org/10.5194/acp-10-6603-2010, 2010.
Zhang, D., Iwasaka, Y., and Shi, G.: Soot particles and their impacts on the mass cycle in the Tibetan atmosphere, Atmos. Environ., 35, 5883–5894, https://doi.org/10.1016/S1352-2310(01)00391-0, 2001.
Zhang, Q., Jimenez, J. L., Canagaratna, M. R., Ulbrich, I. M., Ng, N. L., Worsnop, D. R., and Sun, Y.: Understanding atmospheric organic aerosols via factor analysis of aerosol mass spectrometry: a review, Anal. Bioanal. Chem., 401, 3045–3067, https://doi.org/10.1007/s00216-011-5355-y, 2011.
Zhang, R., Wang, H., Qian, Y., Rasch, P. J., Easter, R. C., Ma, P. L., Singh, B., Huang, J., and Fu, Q.: Quantifying sources, transport, deposition, and radiative forcing of black carbon over the Himalayas and Tibetan Plateau, Atmos. Chem. Phys., 15, 6205–6223, https://doi.org/10.5194/acp-15-6205-2015, 2015.
Zhang, R., Wang, Y., He, Q., Chen, L., Zhang, Y., Qu, H., Smeltzer, C., Li, J., Alvarado, L. M. A., Vrekoussis, M., Richter, A., Wittrock, F., and Burrows, J. P.: Enhanced trans-Himalaya pollution transport to the Tibetan Plateau by cut-off low systems, Atmos. Chem. Phys., 17, 3083–3095, https://doi.org/10.5194/acp-17-3083-2017, 2017.
Zhao, Z., Cao, J., Shen, Z., Xu, B., Zhu, C., Chen, L. W. A., Su, X., Liu, S., Han, Y., Wang, G., and Ho, K.: Aerosol particles at a high-altitude site on the Southeast Tibetan Plateau, China: Implications for pollution transport from South Asia, J. Geophys. Res.-Atmos., 118, 11360–11375, https://doi.org/10.1002/jgrd.50599, 2013.
Zhou, S., Collier, S., Jaffe, D. A., Briggs, N. L., Hee, J., Sedlacek Iii, A. J., Kleinman, L., Onasch, T. B., and Zhang, Q.: Regional influence of wildfires on aerosol chemistry in the western US and insights into atmospheric aging of biomass burning organic aerosol, Atmos. Chem. Phys., 17, 2477–2493, https://doi.org/10.5194/acp-17-2477-2017, 2017.