the Creative Commons Attribution 4.0 License.
the Creative Commons Attribution 4.0 License.
 | 28 Mar 2018
Characteristics of intercontinental transport of tropospheric ozone from Africa to Asia
Huiling Yuan
Bingliang Zhuang
Ye Zhu
Yue Wu
Yuhan Yan
Aijun Ding
In this study, we characterize the transport of ozone from Africa to Asia through the analysis of the simulations of a global chemical transport model, GEOS-Chem, from 1987 to 2006. The receptor region Asia is defined within 5–60∘ N and 60–145∘ E, while the source region Africa is within 35∘ S–15∘ N and 20∘ W–55∘ E and within 15–35∘ N and 20∘ W–30∘ E. The ozone generated in the African troposphere from both natural and anthropogenic sources is tracked through tagged ozone simulation. Combining this with analysis of trajectory simulations using the Hybrid Single-Particle Lagrangian Integrated Trajectory (HYSPLIT) model, we find that the upper branch of the Hadley cell connects with the subtropical westerlies in the Northern Hemisphere (NH) to form a primary transport pathway from Africa to Asia in the middle and upper troposphere throughout the year. The Somali jet that runs from eastern Africa near the equator to the Indian subcontinent in the lower troposphere is the second pathway that appears only in NH summer.
The influence of African ozone mainly appears over Asia south of 40∘ N. The influence shows strong seasonality, varying with latitude, longitude, and altitude. In the Asian upper troposphere, imported African ozone is largest from March to May around 30∘ N (12–16 ppbv) and lowest during July–October around 10∘ N (∼ 2 ppbv). In the Asian middle and lower troposphere, imported African ozone peaks in NH winter between 20 and 25∘ N. Over 5–40∘ N, the mean fractional contribution of imported African ozone to the overall ozone concentrations in Asia is largest during NH winter in the middle troposphere (∼ 18 %) and lowest in NH summer throughout the tropospheric column (∼ 6 %).
This seasonality mainly results from the collective effects of the ozone precursor emissions in Africa and meteorology and chemistry in Africa, in Asia and along the transport pathways. The seasonal swing of the Hadley circulation and subtropical westerlies along the primary transport pathway plays a dominant role in modulating the seasonality. There is more imported African ozone in the Asian upper troposphere in NH spring than in winter. This is likely due to more ozone in the NH African upper troposphere generated from biogenic and lightning NOx emissions in NH spring. The influence of African ozone on Asia appears larger in NH spring than in autumn. This can be attributed to both higher altitudes of the elevated ozone in Africa and stronger subtropical westerlies in NH spring. In NH summer, African ozone hardly reaches Asia because of the blocking by the Saharan High, Arabian High, and Tibetan High on the transport pathway in the middle and upper troposphere, in addition to the northward swing of the subtropical westerlies. The seasonal swings of the intertropical convergence zone (ITCZ) in Africa, coinciding with the geographic variations of the ozone precursor emissions, can further modulate the seasonality of the transport of African ozone, owing to the functions of the ITCZ in enhancing lightning NOx generation and uplifting ozone and ozone precursors to upper layers. The strength of the ITCZ in Africa is also found to be positively correlated with the interannual variation of the transport of African ozone to Asia in NH winter.
Ozone from NH Africa makes up over 80 % of the total imported African ozone over Asia in most altitudes and seasons. The interhemispheric transport of ozone from southern hemispheric Africa (SHAF) is most evident in NH winter over the Asian upper troposphere and in NH summer over the Asian lower troposphere. The former case is associated with the primary transport pathway in NH winter, while the latter case is associated with the second transport pathway. The intensities of the ITCZ in Africa and the Somali jet can each explain ∼ 30 % of the interannual variations in the transport of ozone from SHAF to Asia in the two cases.
- Article
(10830 KB) -
Supplement
(2324 KB) - BibTeX
- EndNote


Tropospheric ozone is a major air pollutant, harmful to human health (Anenberg et al., 2010), agricultural crops, and natural ecosystems (Hollaway et al., 2012; Lefohn et al., 2017). It also acts as a greenhouse gas, whose global mean radiative forcing was about 0.4 ± 0.2 W m−2 for the period 1750–2011 (Myhre et al., 2013). The dominant source of tropospheric ozone is from the photochemical reactions in which volatile organic compounds (VOCs) and carbon monoxide (CO) are oxidized in the presence of nitrogen oxides (NOx) (Lelieveld and Dentener, 2000). Transport of ozone from the stratosphere downward is another source of tropospheric ozone (Neu et al., 2014; Akritidis et al., 2016). Due to its lifetime of days to weeks in the free troposphere, ozone can be transported over long distances across continents, as shown in a wealth of observational evidence (Huntrieser et al., 2005; Lewis et al., 2007; Verstraeten et al., 2015). Consequently, tropospheric ozone in a region is greatly influenced by ozone transport from upwind regions (Doherty et al., 2013, 2017). Therefore, intercontinental transport of ozone has been a significant issue for scientists, the public, and policymakers concerned with air quality and climate change (HTAP, 2010; Cooper et al., 2015; Doherty, 2015; Huang et al., 2017).
There have been numerous studies on the major source–receptor relationships in the Northern Hemisphere (NH) for ozone transport among Asia, North America, and Europe, which are trans-Pacific (Jaffe et al., 2003; Zhao et al., 2003; Cooper et al., 2010; Nopmongcol et al., 2017), trans-Atlantic (Wild et al., 1996; Cooper et al., 2002; Guerova et al., 2006; Derwent et al., 2015; Karamchandani et al., 2017; Knowland et al., 2017), and trans-Eurasian (Wild et al., 2004; Fiore et al., 2009; Li et al., 2014) transport. The trans-Pacific transport from Asia to North America has been studied most because of the efficient eastward export of high pollutants in Asia and the close connection to legislative issues related to the control of ozone in the United States (Cooper et al., 2010, 2011, 2015; Verstraeten et al., 2015; Huang et al., 2017; Lin et al., 2017). Developing a better understanding of the intercontinental transport of ozone across the NH is one of the main objectives for the Task Force on Hemispheric Transport of Air Pollution (TF HTAP) (Galmarini et al., 2017, http://www.htap.org).
Transport of ozone to Asia from various source regions in the world has been less documented but has received increasing attention since the 2000s (Holloway et al., 2008; Nagashima et al., 2010; Wang et al., 2011; Li et al., 2014; Chakraborty et al., 2015; B. Zhu et al., 2016; Y. Zhu et al., 2017). The distribution of foreign ozone in Asia is modulated by numerous processes, involving chemistry and meteorology in both Asia and the various source regions, as well as along the transport pathways (Wild et al., 2004; Li et al., 2014). Previous studies illustrated the important role that meteorology plays in these processes (Sudo and Akimoto, 2007; Sekiya and Sudo, 2012, 2014; Y. Zhu et al., 2017). For example, governed by the westerlies in the NH, the influence of European and North American ozone on Asia is larger in higher latitudes than in lower altitudes (Wild et al., 2004; Holloway et al., 2008; Y. Zhu et al., 2017). The seasonal switch in Asian monsoonal winds significantly affects the seasonal variation of ozone transported to Asia (Nagashima et al., 2010; Wang et al., 2011; Y. Zhu et al., 2017). The Asian monsoon anticyclone (Tibetan High or South Asian High) can also modulate the movement of ozone in the upper troposphere over Eurasia (Vogel et al., 2014; Garny and Randel, 2016).

Figure 1Domains of the source region, Africa, and the receptor region, Asia (areas within the solid purple lines). The area south of the pink dashed line at 40∘ N in Asia is used for calculating the regional mean of Asia for Figs. 6, 7, and 15. The brown dots indicate the locations of the ozonesonde sites where the ozone measurements are compared with the GEOS-Chem simulations. The seven blue stars indicate the sites where forward trajectory simulations are originated. The color-filled continents stand for the source and receptor regions defined in HTAP Phase 2 (HTAP2).
Africa covers areas from the NH to the Southern Hemisphere (SH), with around three-quarters of the continent in the tropics. Compared with other continents, Africa has the most frequent lightning (Albrecht et al., 2016) and the largest burned areas (Giglio et al., 2013). Approximately 70 % of tropospheric ozone produced over the African troposphere is exported from Africa (Aghedo et al., 2007), making African ozone an obvious influence on the global tropospheric ozone budget (Piketh and Walton, 2004; Thompson, 2004; Williams et al., 2009; Bouarar et al., 2011; Zare et al., 2014). Nevertheless, there is relatively little literature on the transport of African ozone to Asia (Liu et al., 2002; Sudo and Akimoto, 2007; Lal et al., 2014). By tagging ozone from Africa in a global chemistry transport model, Liu et al. (2002) reported that African ozone contributed about 10–20 ppbv to the overall ozone concentrations in the middle and upper troposphere above Hong Kong, China, during the November–April period. Sudo and Akimoto (2007) showed that there is a significant interhemispheric ozone transport from South America to Japan in the upper troposphere in conjunction with ozone export from northern Africa. Lal et al. (2014) reported that the ozone distribution over western India in the lower troposphere during the summer monsoon season is affected by long-range transport from the east coast of Africa. These previous studies mostly focused on the transport of African ozone to some locations in Asia. It is unclear to which degree that African ozone influences Asia regionally, how the transport pathways vary with season, and what underlying mechanisms modulate the transport.
The intertropical convergence zone (ITCZ), defined as the convergence of the trade winds, is one of the most prominent meteorological phenomena in the tropics (Waliser and Gautier, 1993; Žagar et al., 2011; Suzuki, 2011). The ITCZ is a heat engine driving the ascending branch of the Hadley circulation (Nicholson, 2009; Suzuki, 2011). The ITCZ and its seasonality can significantly impact the meteorological conditions over Africa (Nicholson, 2009; Collier and Hughes, 2011; Suzuki, 2011). Characterized with deep and strong convection, the equatorial region between the ITCZ branches is a region with effective interhemispheric mixing (Avery et al., 2001). The convective divergence in the upper troposphere over the ITCZ was proposed to be one of the primary mechanisms for interhemispheric transport (Hartley and Black, 1995; Avery et al., 2001). Meanwhile, the ITCZ can be a barrier to interhemispheric exchange in the lower troposphere (Raper et al., 2001). Together with the Southeast Asian monsoon, the movement of the ITCZ can modulate pollution transport to Southeast Asia (Pochanart et al., 2003, 2004). In addition, the ITCZ over western Africa is found to play a significant role in controlling the transport of Saharan mineral dust to northern South America, modifying air quality and climate there (Piketh and Walton, 2004; Doherty et al., 2012, 2014; Rodríguez et al., 2015). However, the influence of the ITCZ on ozone transport from Africa to Asia has not been well understood.
In this paper, we present a comprehensive study on the transport of African ozone to Asia through analysis of tagged ozone simulations as well as trajectory simulations. In this paper, the term “African ozone” refers to ozone that is generated in the African troposphere below the tropopause from both natural and anthropogenic sources, as Sudo and Akimoto (2007) suggested that investigating the contributions of both sources to ozone production is necessary. The term “imported African ozone” or “imported ozone” refers to the African ozone that has been transported to and distributed over Asia, and it refers to African ozone concentrations in the model grids in Asia. The source region, Africa, and the receptor region, Asia, are shown in Fig. 1. The contribution of the source regions to the receptor region is presented as absolute or fractional contribution. The former refers to the imported African ozone concentrations in ppbv, while the latter is the ratio of the imported ozone concentrations to the overall ozone concentrations in the model grids in Asia. Our specific objectives are (1) to characterize the seasonal variations of ozone transport from Africa to Asia, (2) to investigate the underlying mechanisms responsible for such seasonal variations, and (3) to find meteorological influences, including the ITCZ, on the interannual variation of the transport of African ozone to Asia, including the interhemispheric transport from the SH. Our analysis is based on the simulations from a three-dimensional global chemical transport model, GEOS-Chem (Bey et al., 2001a), for 20 years from 1987 to 2006, supplemented by the analysis of trajectory simulations from the Hybrid Single-Particle Lagrangian Integrated Trajectory model (HYSPLIT) (Draxler and Hess, 1998; Stein et al., 2015). In Sect. 2, GEOS-Chem and the tagged ozone stimulation method are described, followed by the comparison of GEOS-Chem simulations with ozonesonde and satellite data. The HYSPLIT model and the meteorological data are also described. Section 3 is the core section that discusses the seasonality of imported African ozone over Asia and possible underlying mechanisms. In Sect. 4, meteorological influences on the interannual variation in the transport of African ozone to Asia, including the interhemispheric transport, are explored. Finally, conclusions are drawn through discussion in Sect. 5.
2.1 The description of the GEOS-Chem model
A global three-dimensional chemistry transport model, GEOS-Chem (version v9-02) (Bey et al., 2001a, http://geos-chem.org), is employed to simulate the global ozone distributions and the source–receptor relationship between Africa and Asia. GEOS-Chem includes a detailed description of tropospheric O3–NOx–hydrocarbon–aerosol. It is driven by assimilated meteorological data from the GEOS at NASA Global Modeling and Assimilation Office (GMAO).
In this study, the simulations are driven by GEOS-4 meteorology at a 4∘ latitude by 5∘ longitude horizontal resolution, degraded from their native resolution of 1∘ latitude by 1.25∘ longitude. There are 30 vertical layers including 17 levels in the troposphere. Transport and chemical time steps are 10 and 20 min, respectively, as suggested by Philip et al. (2016). GEOS-4 uses the deep convection scheme of Zhang and McFarlane (1995) and the shallow convection scheme of Hack (1994). By comparing the GEOS-Chem simulations driven by GEOS-4 and GEOS-5 with satellite observations in the tropical troposphere, Liu et al. (2010) and Zhang et al. (2011) have found that GEOS-4 has stronger deep convection in the tropics than GEOS-5. In general, GEOS-Chem driven by GEOS-4 can simulate tropospheric ozone concentrations that are in good agreement with ozonesonde observations (Liu et al., 2010; Zhang et al., 2011; Choi et al., 2017; Y. Zhu et al., 2017).
GEOS-Chem has various modes that serve different simulation goals. In the full chemistry simulation, the emission inputs for a specific year are scaled from each inventory's base year. The global anthropogenic emission inventories are from EDGAR 3.2 for NOx, CO, and SOx (Olivier and Berdowski, 2001) and RETRO for VOC emissions (Pulles et al., 2007) in 2000, merged with the following regional inventories: the INTEX-B Asia emissions inventory in 2006 (Zhang et al., 2009), the US Environmental Protection Agency National Emission Inventory in 2005 (NEI05) for North America, the Cooperative Programme for Monitoring and Evaluation of the Long-range Transmission of Air Pollutants in Europe (EMEP) inventory for Europe (Vestreng and Klein, 2002) in 2005, the Big Bend Regional Aerosol and Visibility Observational (BRAVO) Study Emissions Inventory for 1999 in Mexico (Kuhns et al., 2003), and the Criteria Air Contaminants (CAC) inventory for Canada in 2005. Biofuel emissions are from Yevich and Logan (2003). Biomass burning and biogenic emissions are from the GFED3 inventory (van der Werf et al., 2010) and MEGAN 2.1 (Guenther et al., 2012), respectively. Lightning NOx emissions are calculated using the scheme of Allen et al. (2010) and the vertical distribution suggested by Ott et al. (2010). The annual global lightning NOx emissions are 5.97 Tg N yr−1, comparable to 6 ± 2 Tg N yr−1 in Martin et al. (2007) and 6.3 Tg N yr−1 in Miyazaki et al. (2014). The annual total lightning NOx emission is 1.6 Tg N yr−1 in Africa, 0.80 Tg N yr−1 in northern hemispheric Africa (NHAF), and 0.79 Tg N yr−1 in southern hemispheric Africa (SHAF) (see Figs. S1 and S2 in the Supplement). The anthropogenic CO and NOx emissions from GEOS-Chem for 2000 are compared with those in the HTAP2 emission inventories for 2008 (http://edgar.jrc.ec.europa.eu/htap_v2/) (Figs. S3 and S4). The annual anthropogenic CO emissions in Africa are 12.2 Tg yr−1 for 2000 in GEOS-Chem, lower than 62.5 Tg yr−1 for 2008 from the HTAP2 inventories. The anthropogenic NOx emissions in GEOS-Chem are 2.27 Tg yr−1 for 2000, also lower than 4.53 Tg yr−1 for 2008 from the HTAP2 inventories. Although the anthropogenic emissions contribute less significantly to the ozone generation in Africa than biogenic, biomass burning, and lightning emissions (Aghedo et al., 2007), the differences between these emission inventories imply that African ozone simulated by GEOS-Chem has some uncertainties.
To track the transport of ozone generated in Africa, we use the tagged ozone mode in GEOS-Chem, in which odd oxygen is tagged (O + PAN + PMN + PPN, Fiore et al., 2002; Zhang et al., 2008). Since ozone accounts for most of Ox, we refer to ozone instead of Ox for clarity. To prepare for the tagged ozone simulation, we first run GEOS-Chem in the full chemistry mode to generate the daily ozone production rate and loss frequency. Then we run GEOS-Chem in the tagged ozone mode to differentiate ozone produced in different source regions, tagged as different tracers, by using the archived daily ozone production rates and loss frequencies. As shown in Fig. 1, the source region, Africa, is defined as the region of 35∘ S–15∘ N, 20∘ W–55∘ E and 15–35∘ N, 20∘ W–30∘ E. Therefore, ozone produced in Africa below the tropopause from all natural and anthropogenic sources is tagged as a tracer. We further divide Africa into NHAF and SHAF, each being further separated by the tropospheric layers, the lower troposphere (LT, from the surface to 700 hPa), the middle troposphere (MT, 700–300 hPa), and the upper troposphere (UT, 300 hPa–tropopause), therefore adding six more tracers. The receptor region, Asia, is defined as the region of 5–60∘ N, 60–145∘ E.
In the simulation for a year, both seasonal variations of chemistry and meteorology are considered. To study the meteorological influence on the interannual variation in the transport of African ozone to Asia, the tagged ozone simulation is conducted for 21 years from January 1986 to December 2006 (using 1986 for model spin-up). As our purpose is focused on the meteorological influence on transport, we allow the meteorology to vary from year to year but fix the chemistry constantly, i.e., using the archived daily ozone production and loss data in one year, i.e., 2005, for the 20-year simulation. This treatment is similar to previous studies (Liu et al., 2005; Sekiya and Sudo, 2014). Note that meteorology affects both transport (a physical process) and chemistry, while this study only considers the former.
Numerical approaches to exploring the source–receptor relationships include (1) tagged tracer simulations, (2) trajectory simulations, (3) perturbation simulations, and (4) inverse simulations (Y. Zhu et al., 2017). Compared with the other approaches, the tagged tracer simulation can track ozone effectively from different source regions and quantify the contributions of ozone from different source regions to a receptor region. One issue with the tagged ozone simulation is the nonlinearity of chemistry. This nonlinearity can cause large differences between the full chemistry and the tagged ozone simulations. To test the scale of the nonlinearity in the simulations, ozone concentrations between the full chemistry and the tagged ozone simulations are compared at four ozonesonde sites in Africa and India (Fig. S5). The difference is found to generally be within ± 5 %, suggesting that this approach works in these regions without large bias.
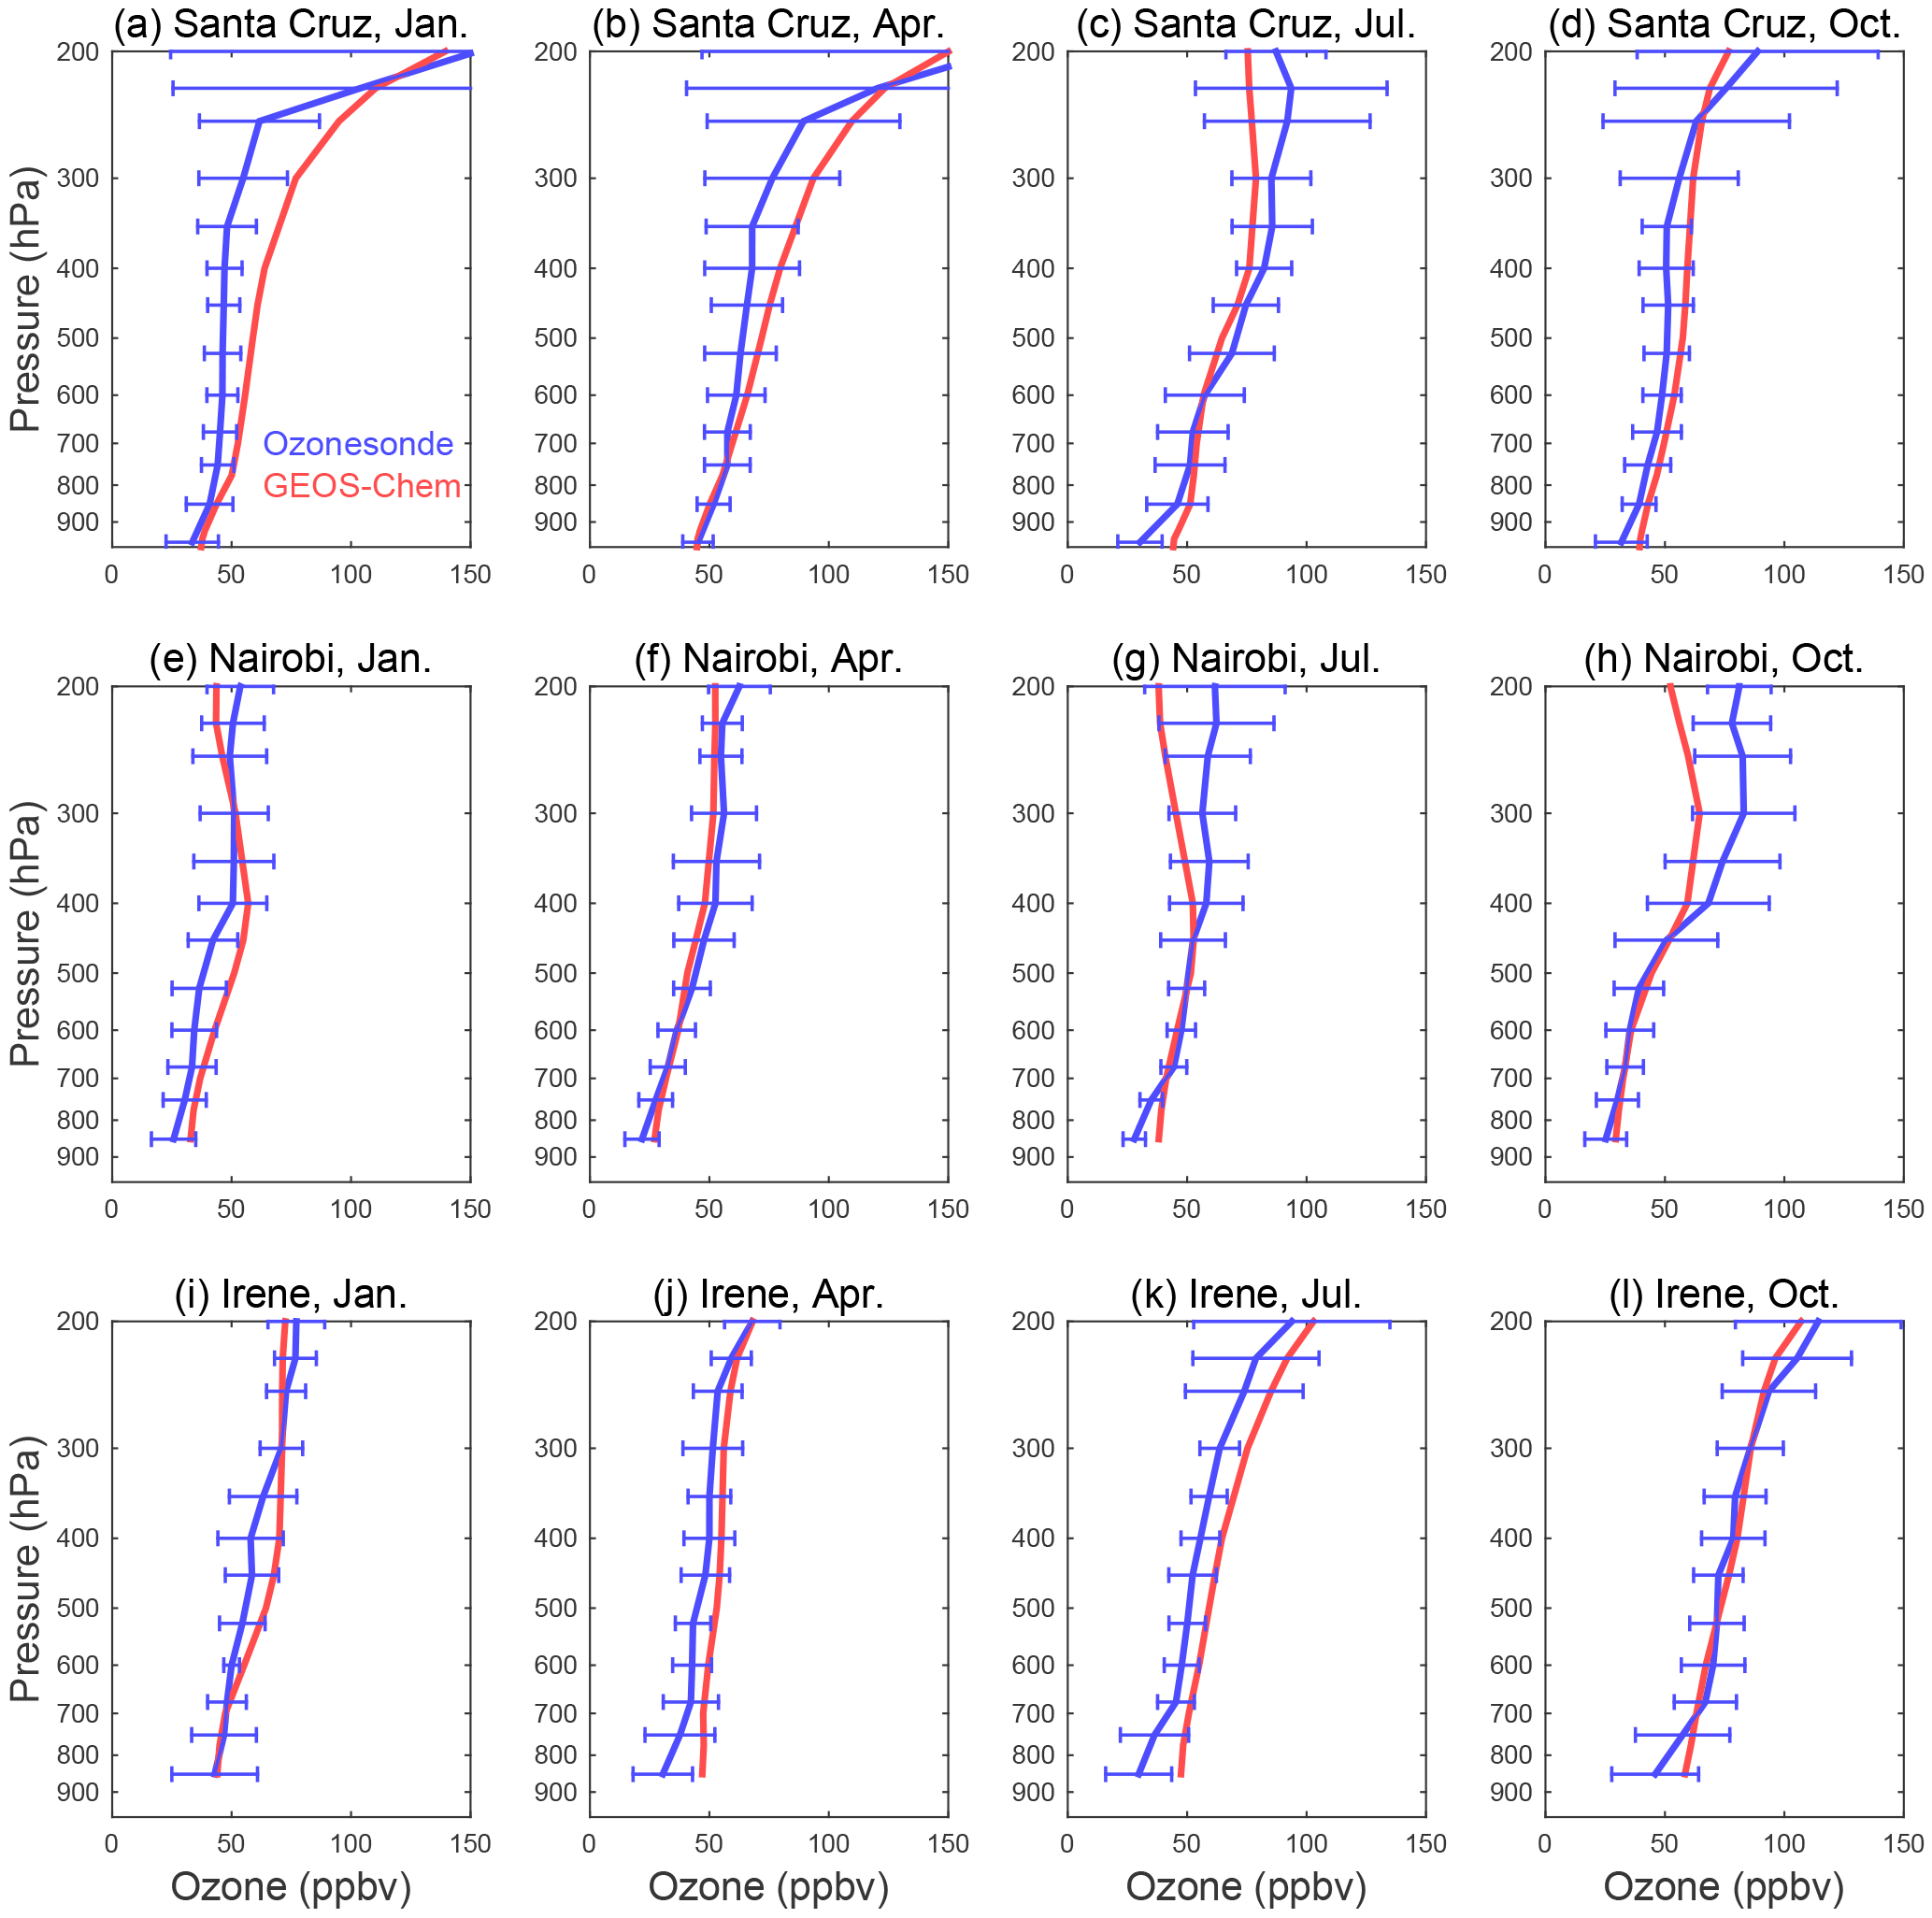
Figure 2Comparison of the monthly mean ozone vertical profiles between the GEOS-Chem simulations (red line) and the ozonesonde measurements (blue line) averaged over 1999–2003 at Santa Cruz (a–d), over 2003–2006 at Nairobi (e–h), and over 1999–2005 at Irene (i–l), in January (a, e, i), April (b, f, j), July (c, g, k), and October (d, h, l), respectively. The horizontal bar indicates the standard deviation.
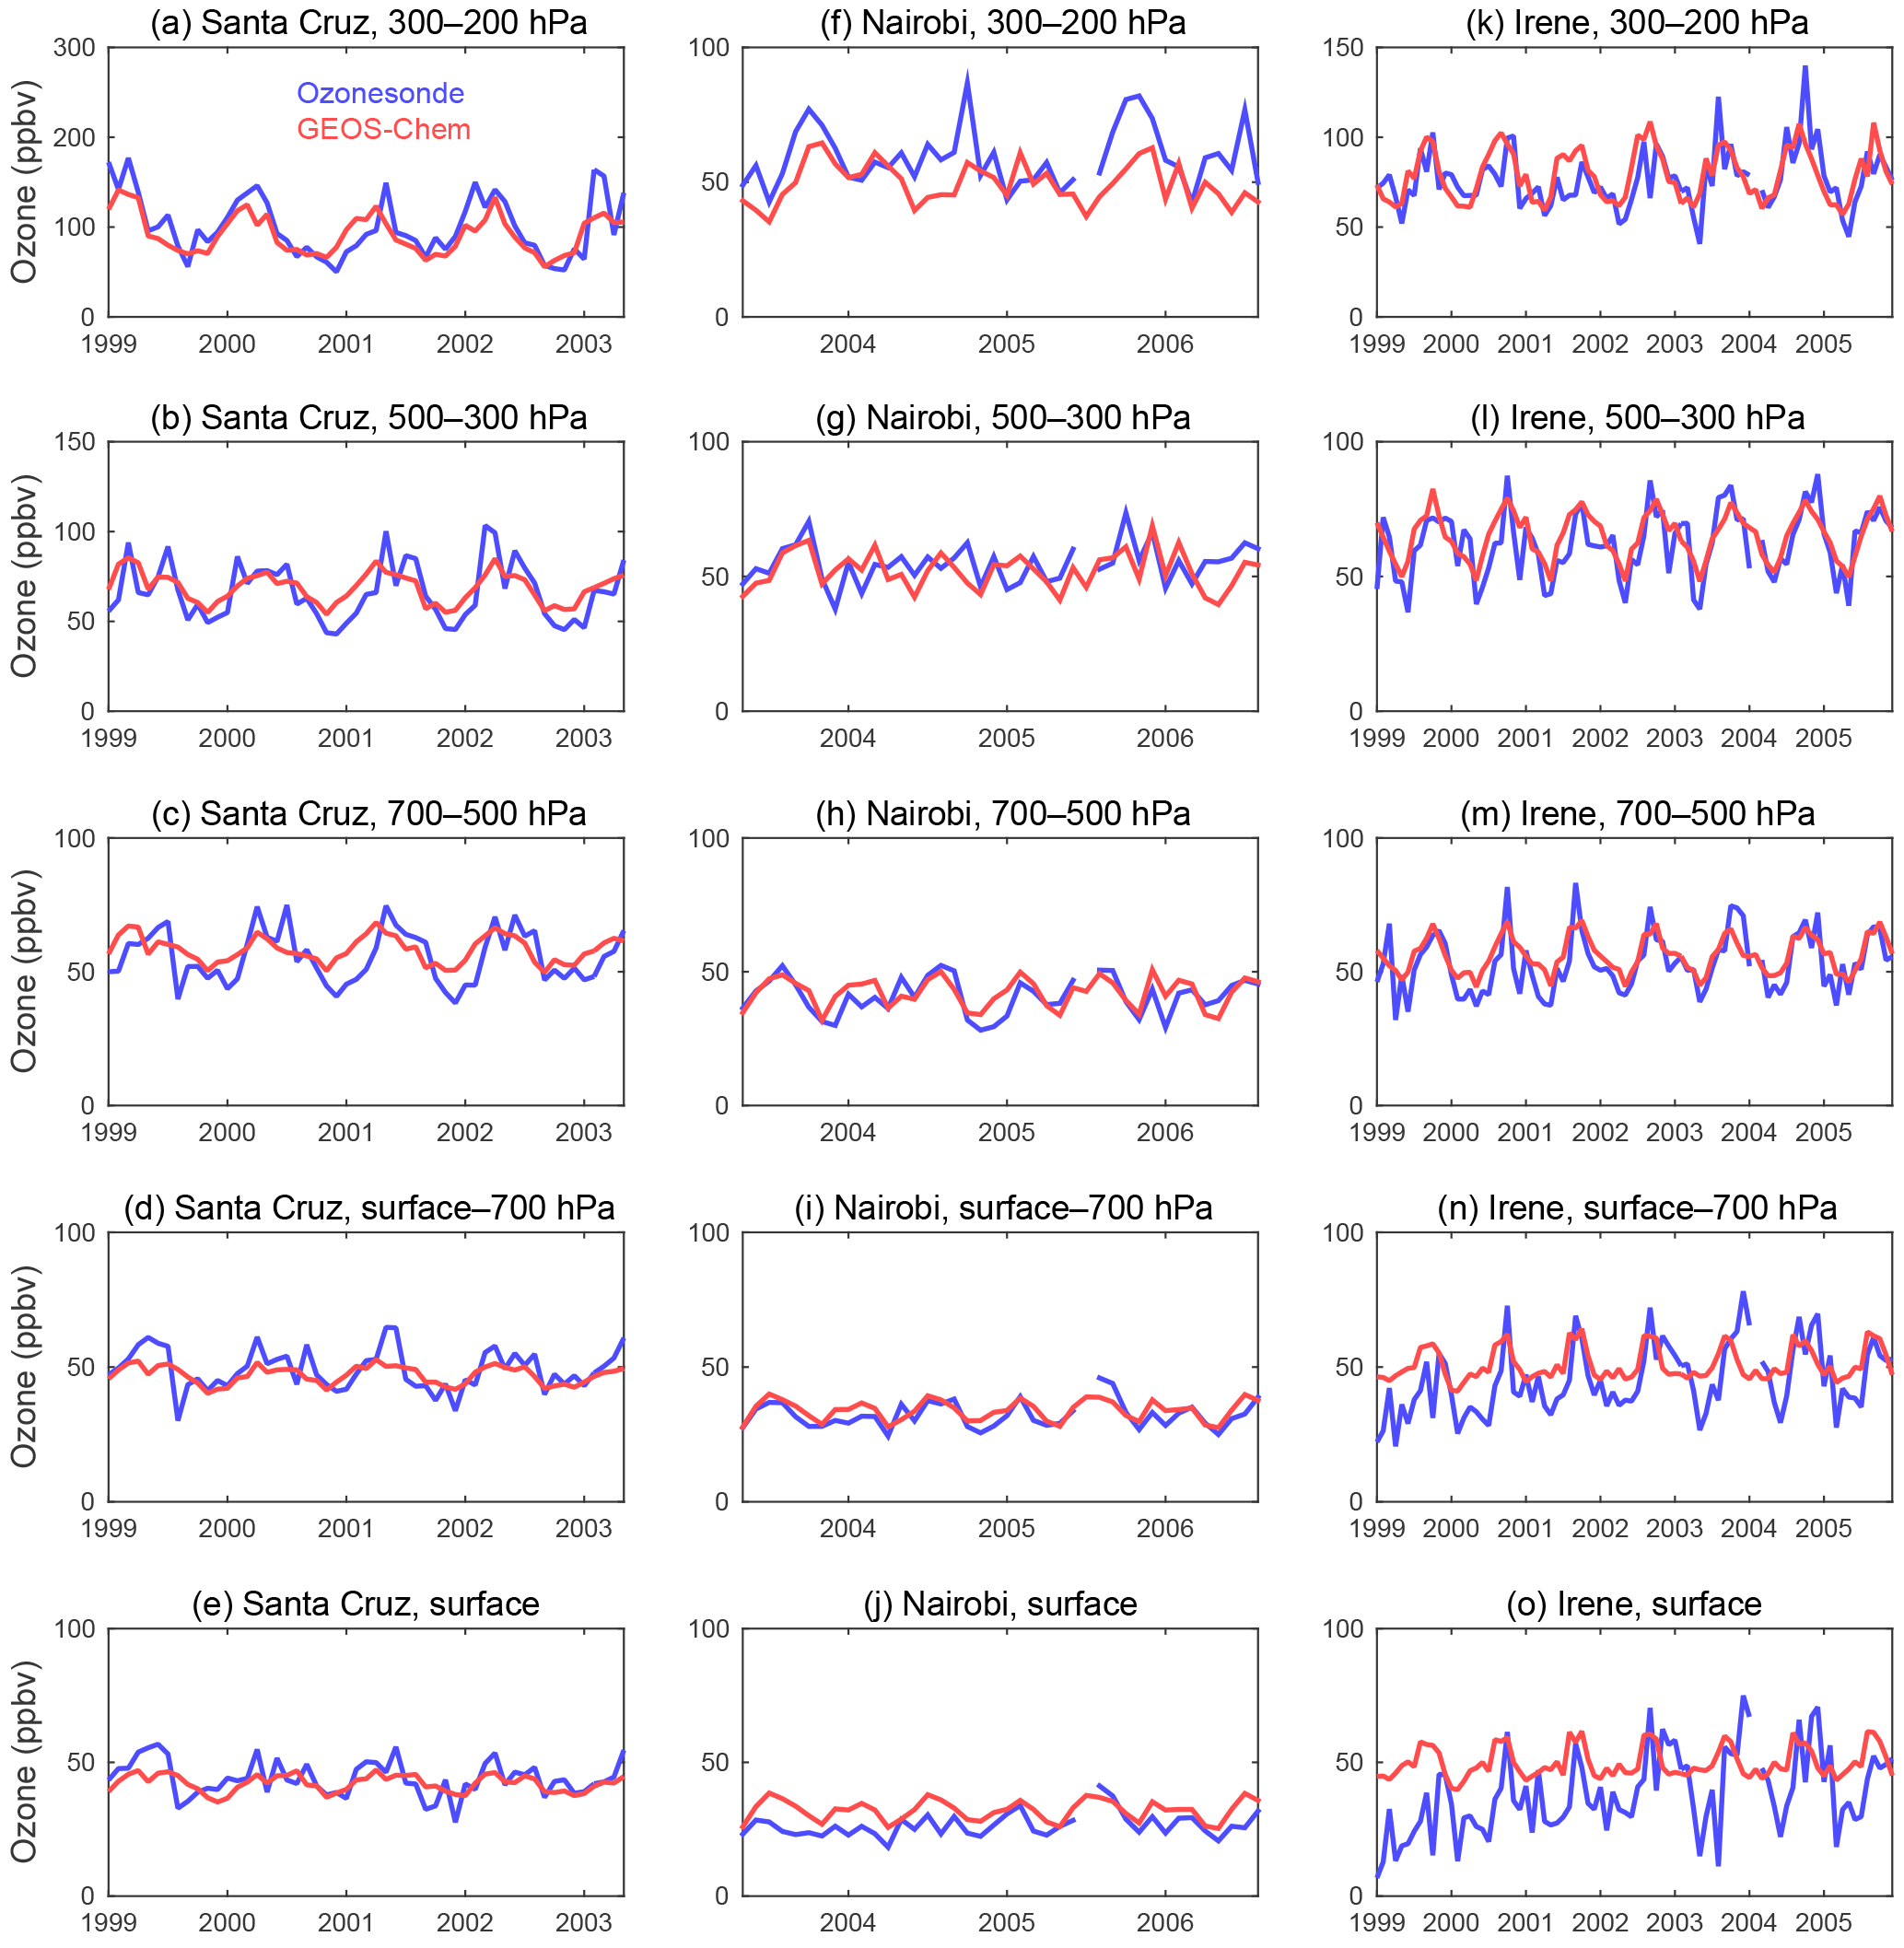
Figure 3Comparison of the time series of monthly ozone between GEOS-Chem simulations (red line) and ozonesonde measurements (blue line) for layers averaged over 300–200 hPa (a, f, k), 500–300 hPa (b, g, l), 700–500 hPa (c, h, m), surface–700 hPa (d, i, n), and at the surface layer (e, j, o) at Santa Cruz (a–e), Nairobi (f–j), and Irene (k–o) in Africa, respectively.
Table 1The ozone vertical profiles (see Fig. 2) simulated with GEOS-Chem in comparison with the ozonesonde measurements at Santa Cruz, Nairobi, and Irene in Africa in terms of bias (in %), root-mean-square error (RMSE, in ppbv), and correlation coefficient (r) in the four seasons.
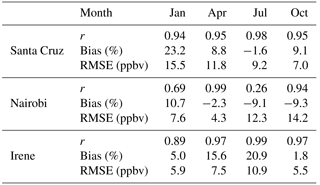
Table 2The time series of ozone concentrations at different tropospheric layers (see Fig. 3) from the GEOS-Chem simulations and ozonesonde measurements at Santa Cruz, Nairobi, and Irene in Africa. The two datasets are compared in terms of bias (in %), root-mean-square error (RMSE, in ppbv), and correlation coefficient (r).

2.2 The validation of GEOS-Chem simulations
GEOS-Chem has been used widely in studying pollution transport (Bey et al., 2001b; Koumoutsaris et al., 2008; Zhang et al., 2008; Liu et al., 2011; Wang et al., 2011; Ridder et al., 2012; Long et al., 2015; Jiang et al., 2016; Huang et al., 2017; Ikeda et al., 2017; J. Zhu et al., 2017; Y. Zhu et al., 2017). Tropospheric ozone simulated by GEOS-Chem has been extensively validated using ozonesonde and satellite data, such as in North America (Zhang et al., 2008; Y. Zhu et al., 2017), Europe (Kim et al., 2015), East Asia (Wang et al., 2011; J. Zhu et al., 2017; Y. Zhu et al., 2017), and other regions (Liu et al., 2009). These validation practices have suggested reasonable agreements between the model simulations and ozone measurements. In this study, for an enhanced confidence on the model performance, we compare the GEOS-Chem simulations with the ozonesonde data in Africa and India and with the satellite measurements from the Tropospheric Emission Spectrometer (TES) instrument. The ozonesonde data are acquired from the World Ozone and Ultraviolet Radiation Data Centre (WOUDC) (http://www.woudc.org/home.php) and the monthly TES product TL2O3LN is from the NASA Langley Atmospheric Science Data Center (https://eosweb.larc.nasa.gov/project/tes/tes_table).
Three ozonesonde stations in Africa are selected for their long record. The stations include Santa Cruz in northern Africa (28.42∘ N, 16.26∘ W; 36 m), Nairobi in eastern Africa (1.27∘ S, 36.8∘ E; 1745 m), and Irene in southern Africa (25.91∘ S, 28.21∘ E; 1524 m) (Fig. 1). These ozonesonde data have been used in studying tropospheric ozone in Africa widely (Clain et al., 2009; Thompson et al., 2012, 2014). In Asia, comparisons between GEOS-Chem simulations and ozonesonde observations have been made by Liu et al. (2002) and Y. Zhu et al. (2017) at stations over the Pacific Rim, showing that GEOS-Chem can generally capture the vertical and seasonal variations of ozone concentrations in the region. We further compare the GEOS-Chem simulations at three Indian sites, including New Delhi in northern India (28.3∘ N, 77.1∘ E; 273 m), Pune in western India (18.53∘ N, 73.85∘ E; 559 m), and Thiruvananthapuram in southern India (8.48∘ N, 76.95∘ E; 60 m) (Fig. 1).
Figure 2 shows the simulated and measured vertical ozone profiles by season, which are averaged from 1999 to 2003 at Santa Cruz, from 2003 to 2006 at Nairobi, and from 1999 to 2005 at Irene. Figure 3 compares the time series of monthly ozone concentrations between the model simulations and ozonesonde measurements at different tropospheric layers at the sites. The corresponding bias, root-mean-square error (RMSE), and correlation coefficient (r) between the two datasets are shown in Table 1 for the vertical profiles and in Table 2 for the time series, respectively.
For the ozone vertical profiles (Fig. 2 and Table 1), GEOS-Chem appears to reasonably capture the ozone vertical variation and its seasonality at the three sites. It appears that GEOS-Chem overestimates ozone in the upper troposphere at Santa Cruz in NH winter and spring and underestimates ozone in the upper troposphere at Nairobi in NH summer and autumn. The correlation coefficients between the two datasets are above 0.9 for most seasons at the three sites. The mean bias ranges from −9.3 % (at Nairobi in October) to 23.2 % (at Santa Cruz in January), while the RMSE ranges from 4.3 ppbv (at Nairobi in April) to 15.5 ppbv (at Santa Cruz in January). The bias and RMSE suggest that the model performs no better at a single station or in a single season than the other stations or seasons.
For the time series of ozone in the upper, middle, and lower troposphere, as well as the surface layer (Fig. 3 and Table 2), GEOS-Chem also performs reasonably well. The correlation coefficients between the two datasets in the tropospheric layers range within 0.57–0.79 at Santa Cruz, 0.76–0.90 at Nairobi, and 0.61–0.82 at Irene, all significant at a 95 % level. The correlation coefficient is 0.60, 0.82, and 0.39 for the surface layer at Santa Cruz, Nairobi, and Irene, respectively. However, the model underestimates upper tropospheric ozone in Nairobi (Table 2, bias = −14.2 %) and somewhat overestimates ozone in 500–300 hPa at Santa Cruz (Table 2, bias = 4.5 %) and near the surface at Irene (Table 2, bias = 60.3 %).
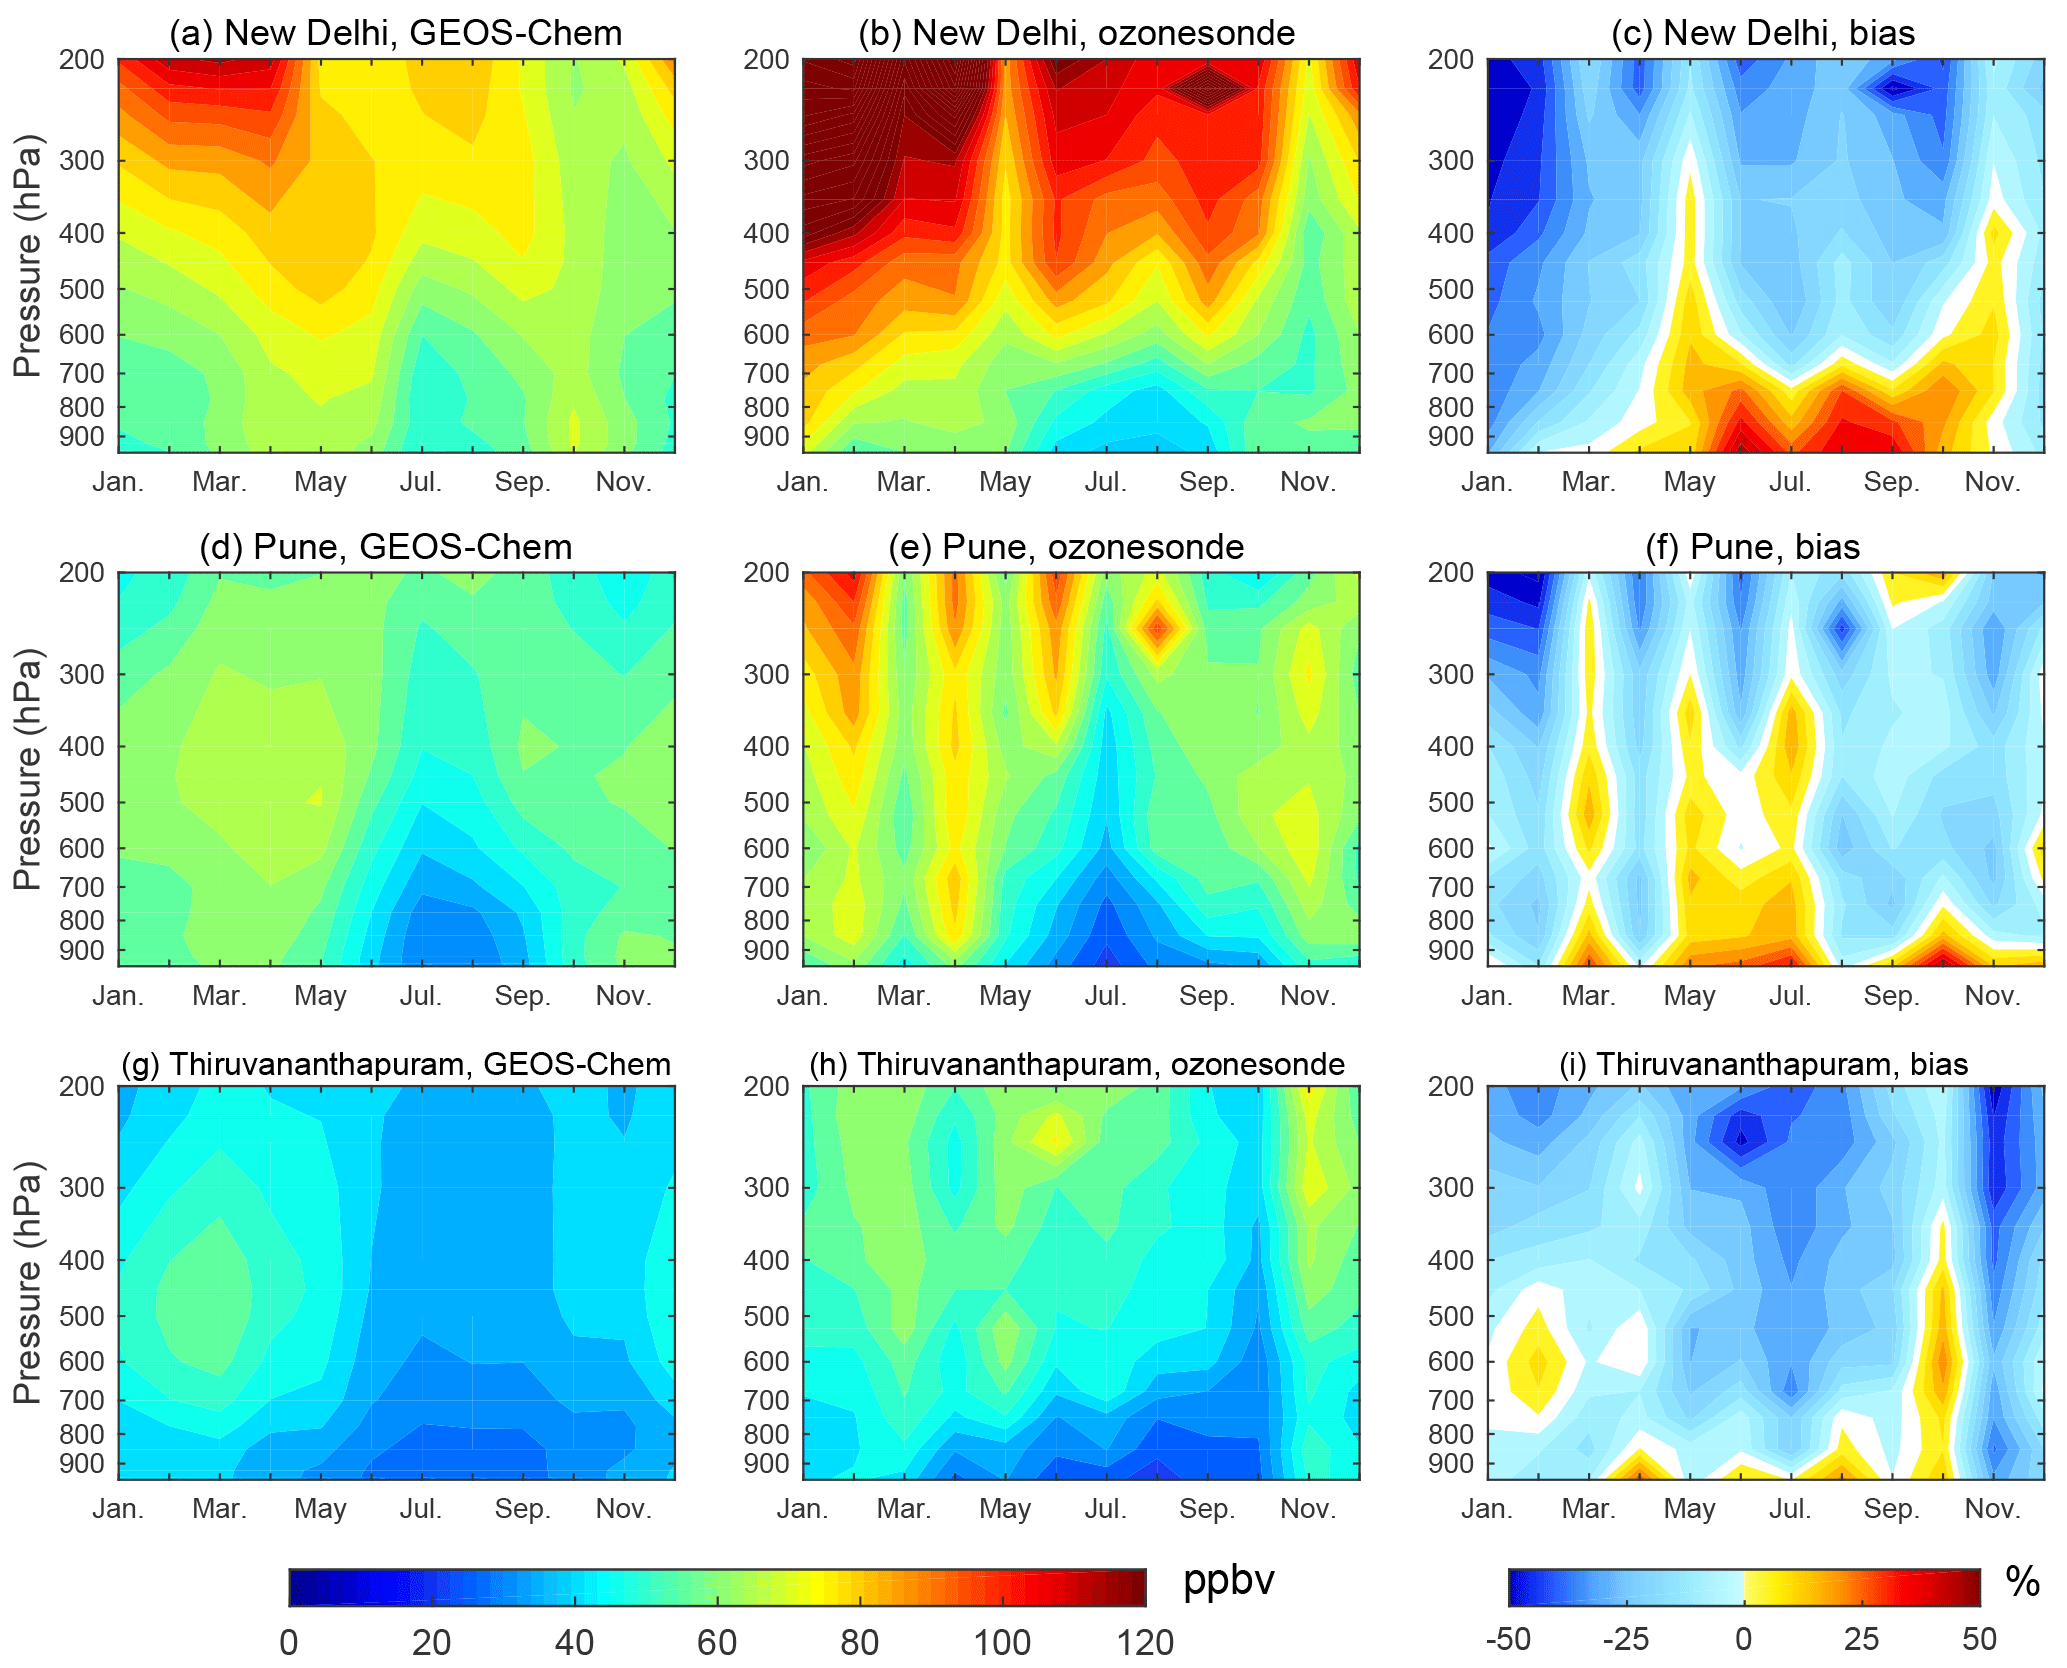
Figure 4Seasonal variation of vertical ozone profiles from the GEOS-Chem simulations (in ppbv, a, d, g), ozonesonde measurements (in ppbv, b, e, h), and the corresponding bias (in %, c, f, i) averaged over 1994–2003 at three Indian sites, New Delhi (a–c), Pune (d–f), and Thiruvananthapuram (g–i).
The comparison between the GEOS-Chem and ozonesonde data at the three India sites is shown in a seasonal altitude distribution in Fig. 4. The ozone concentrations are the means between 1994 and 2003. The time series of ozonesonde data at the sites are not shown because of inadequate records. The seasonal altitude patterns of ozone at the three sites are well simulated, although the model overestimates the ozone near the surface and underestimates the ozone in the middle and upper troposphere at the three sites. The annual mean bias at New Delhi is 5.6, −14.5, and −18.9 % in the LT, MT, and UT, respectively. At Pune, it is 2.1, −5.6, and −19.1 % in the LT, MT, and UT, respectively, while the annual mean bias at Thiruvananthapuram is −4.4 %, −13.3 %, and −27.4 % in the LT, MT, and UT, respectively.
The global distribution of ozone from the GEOS-Chem simulations is compared with the TES observation in 2005 in the four seasons at 464 hPa (Fig. S6), a layer around which the TES satellite data have the least bias. The GEOS-Chem simulations are smoothed with the TES averaging kernels and a priori profiles. The smoothed GEOS-Chem simulations resemble the GEOS-Chem simulations (not shown; see Jiang et al., 2016). Generally, GEOS-Chem can capture the global variation of ozone in space and by season, such as the elevated ozone concentrations over the NH middle latitudes in NH spring and summer and the plumes of elevated ozone from biomass burning over southern Africa in NH autumn. The smoothed ozone concentrations are generally lower than shown by the TES observations over Africa in all the seasons, with a maximum difference of 20 ppbv (or 20 %). Note that TES ozone retrievals generally are higher than ozonesonde data, having a mean positive bias of 3–11 ppbv in the troposphere (Nassar et al., 2008).
Overall, GEOS-Chem can reasonably capture the seasonality of the ozone vertical profiles in the ozonesonde data over Africa. In Asia, GEOS-Chem tends to overestimate ozone in the lower troposphere and underestimate ozone in the upper troposphere at three Indian sites. The GEOS-Chem simulations also compare well with satellite TES data in space and by season.
2.3 The HYSPLIT trajectory model and meteorological data
To supplement the analysis on the GEOS-Chem simulations, we use the Hybrid Single-Particle Lagrangian Integrated Trajectory model, version 4 (HYSPLIT-4) (Draxler and Hess, 1998; Stein et al., 2015), to simulate forward trajectories and examine the transport pathways of African ozone to Asia. The HYSPLIT model is one of the most extensively used atmospheric transport and dispersion models (Fleming et al., 2012). Meteorological inputs to HYSPLIT are from the NCEP reanalysis at a resolution of 2.5∘ × 2.5∘ (http://ready.arl.noaa.gov/archives.php). Six-day forward trajectories are calculated from 1987 to 2006 four times a day (00:00, 06:00, 12:00, and 18:00 UTC) at seven African sites, including Cairo (31.1∘ E, 30∘ N), Ghat (10.2∘ E, 24.6∘ N), Khartoum (32.3∘ E, 15.4∘ N), Abuja (7.3∘ E, 9∘ N), and Juba (31.4∘ E, 4.5∘ N) in NHAF, and Dar es Salaam (39.2∘ E, 6.5∘ S) and Luanda (13.1∘ E, 8.5∘ S) in SHAF (Fig. 1). The levels at 1.5, 5.5, and 11 km are selected to represent the trajector starting altitude at the lower, middle, and the upper troposphere, respectively. The seven sites are chosen to represent two longitudinal and 3–4 latitudinal zones in Africa.
The meteorological data include the NCEP/NCAR reanalysis I (Kalnay et al., 1996). The monthly wind fields are used to describe the climatology of atmospheric circulation during the study period from 1987 to 2006. The product is available on a 2.5∘ × 2.5∘ horizontal grid at 17 pressure levels from 1000 to 10 hPa (https://www.esrl.noaa.gov/psd/data/gridded/data.ncep.reanalysis.html).
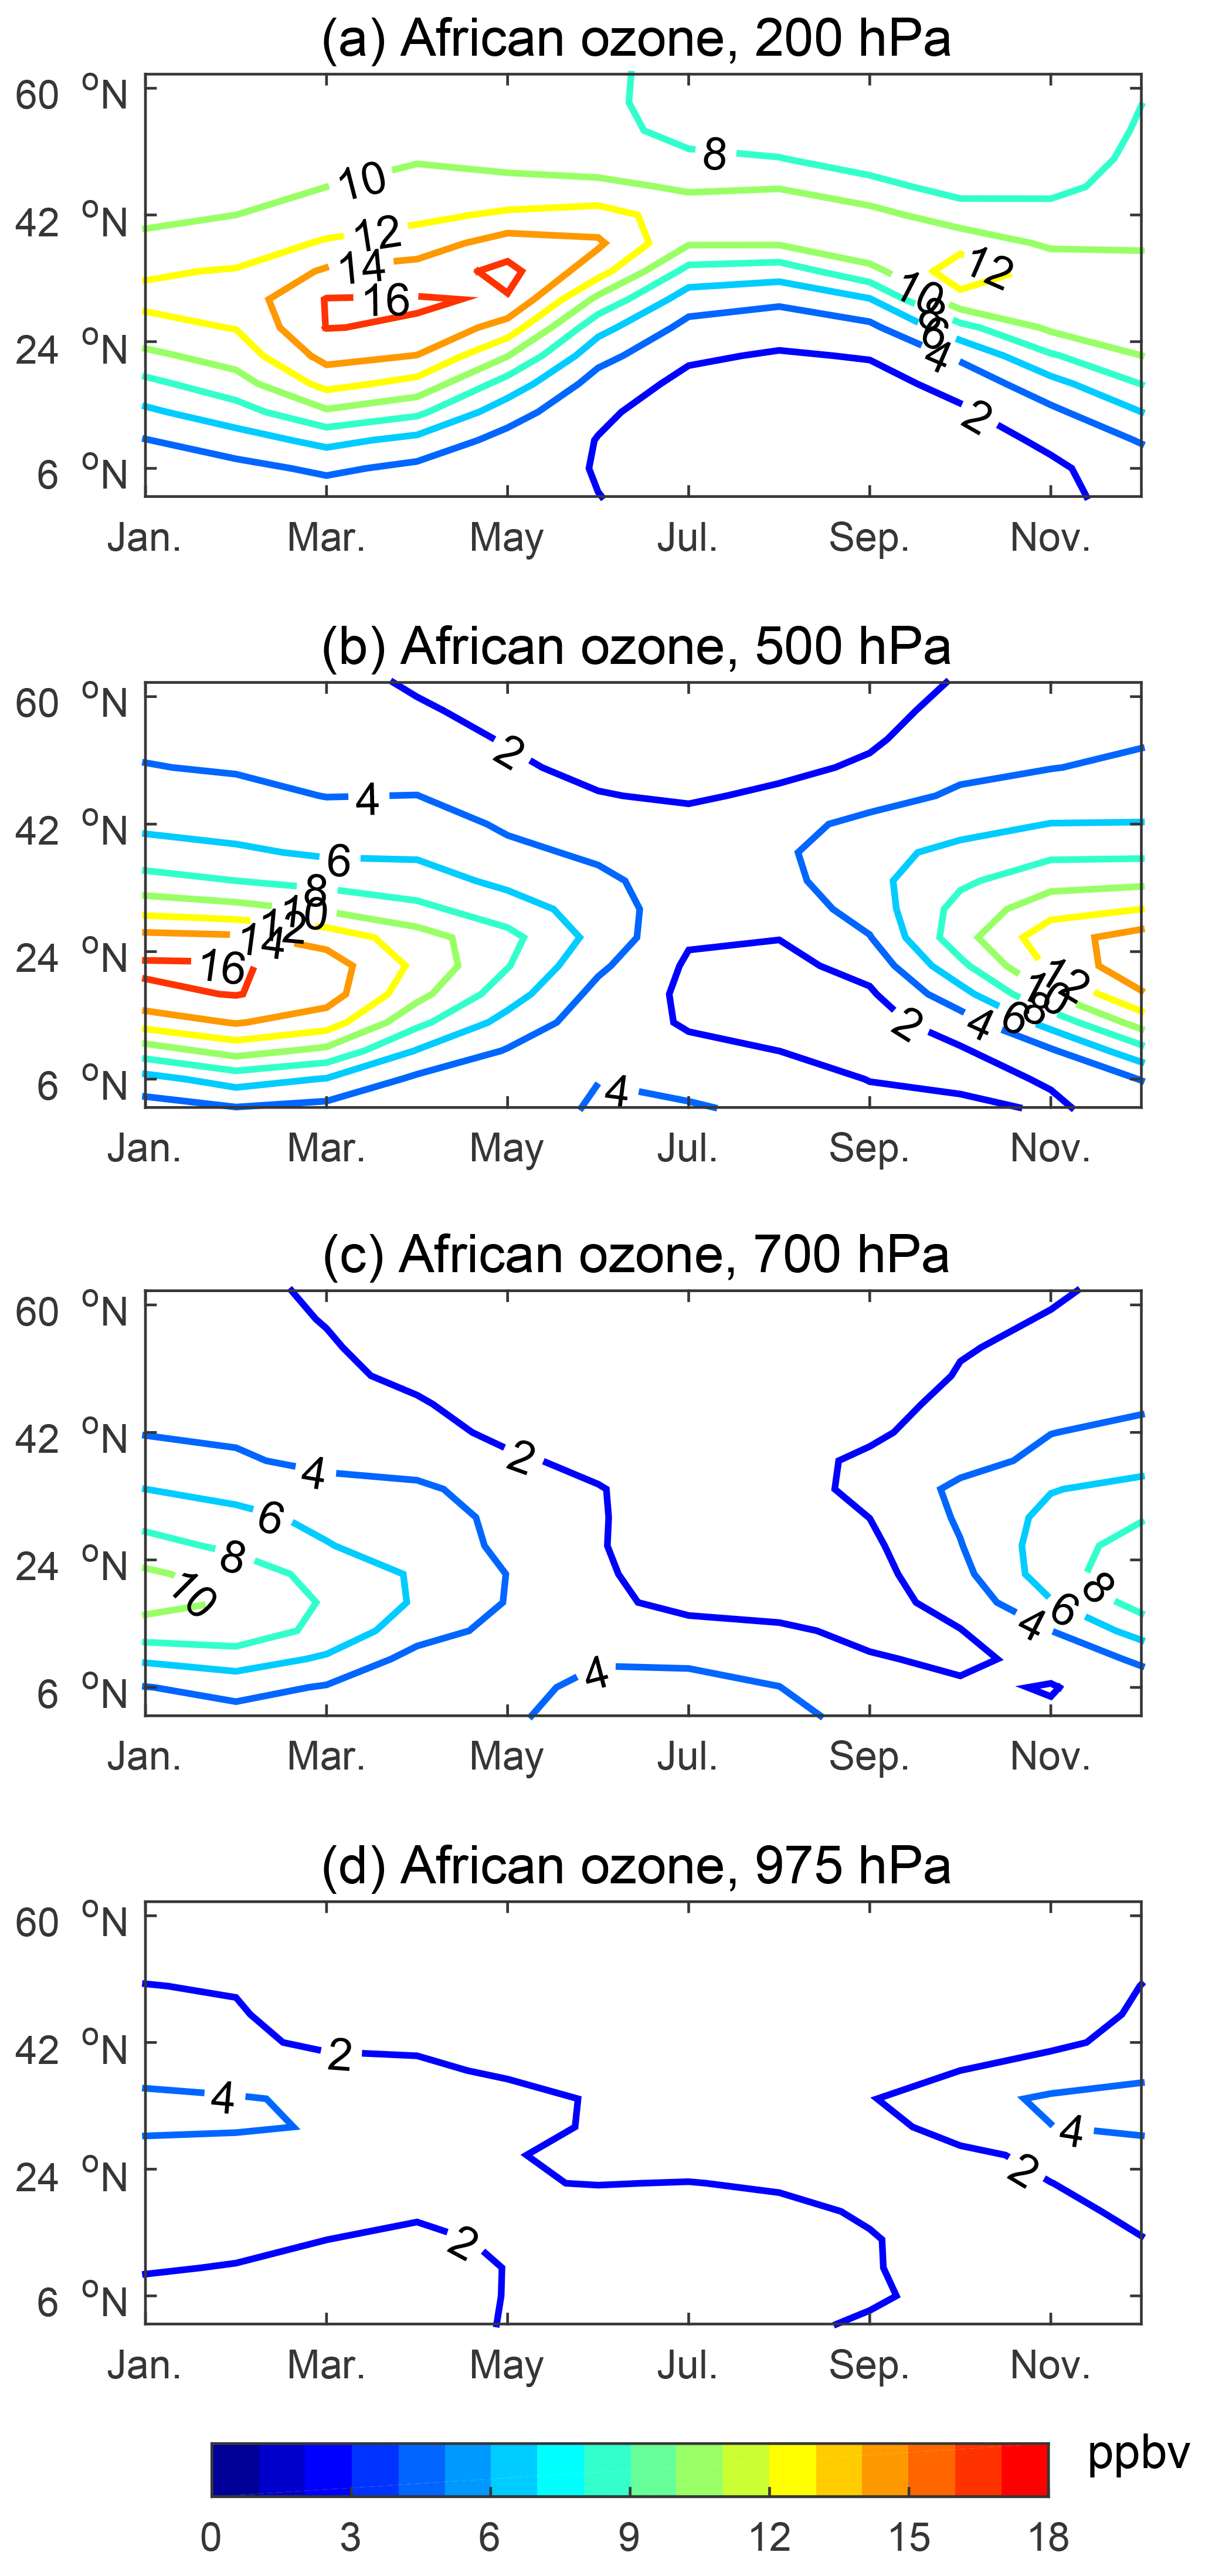
Figure 5Seasonal variation of imported African ozone (in ppbv) over Asia varying with latitude at (a) 200 hPa, (b) 500 hPa, (c) 700 hPa, and (d) 975 hPa. The values are the 20-year means (1987–2006) from the GEOS-Chem simulation and averaged over 60–145∘ E.
Additionally, the monthly Outgoing Longwave Radiation (OLR) data from NCAR at 2.5∘ × 2.5∘ with temporal interpolation (Liebmann and Smith, 1996, https://www.esrl.noaa.gov/psd/data/gridded/data.interp_OLR.html) are used to indicate the intensity of the ITCZ. The dataset has been widely used for tropical studies on deep convection and rainfall (Mounier and Janicot, 2004).
3.1 Seasonal variations in African ozone over Asia
Because a substantial amount of ozone and ozone precursors are produced or emitted in Africa, tropospheric ozone in the other continents is largely influenced by ozone outflow from Africa (Aghedo et al., 2007; Zare et al., 2014). Figure 5 shows seasonal variations of imported African ozone in the Asian troposphere, varying with latitude and altitude. The values are the 20-year means (1987–2006) from the GEOS-Chem simulation. The largest African influences appear in the Asian middle and upper troposphere, i.e., 12–16 ppbv at 500 and 200 hPa. African ozone in the Asian lower troposphere is reduced to 2–10 ppbv at 700 hPa. Unlike imported European and North American ozone that influences Asia mostly over high altitudes, i.e., north of 30∘ N (Y. Zhu et al., 2017), imported African ozone prevails over lower latitudes, generally between 5 and 40∘ N, considerably larger than European and North American ozone south of 30∘ N (Wild et al., 2004; Sudo and Akimoto, 2007; Y. Zhu et al., 2017). North of 50∘ N, African ozone influence is small, i.e., less than 8 and 2 ppbv, respectively, above and below the Asian middle troposphere. Seasonally imported African ozone in the upper troposphere peaks in NH spring around 30∘ N (∼ 16 ppbv, Fig. 5a) and is at its minimum in NH summer south of 25∘ N. Owing to the high radiative forcing efficiency, the change in ozone concentrations in the upper troposphere can impact climate more significantly than that in the lower troposphere (Lacis et al., 1990). Therefore, the influence of African ozone on the climate in southern Asia is likely larger than that of European and North American ozone. In the middle troposphere (Fig. 5b), African ozone is at its maximum (∼ 16 ppbv) in NH winter between 20 and 25∘ N. In the lower troposphere (Fig. 5c), between 5 and 40∘ N, African ozone is high in NH winter (∼ 6–10 ppbv), while south of 10∘ N, African ozone has another peak in NH summer (∼ 4 ppbv). Near the surface (Fig. 5d), African ozone concentrations are low, i.e., below 4 ppbv.
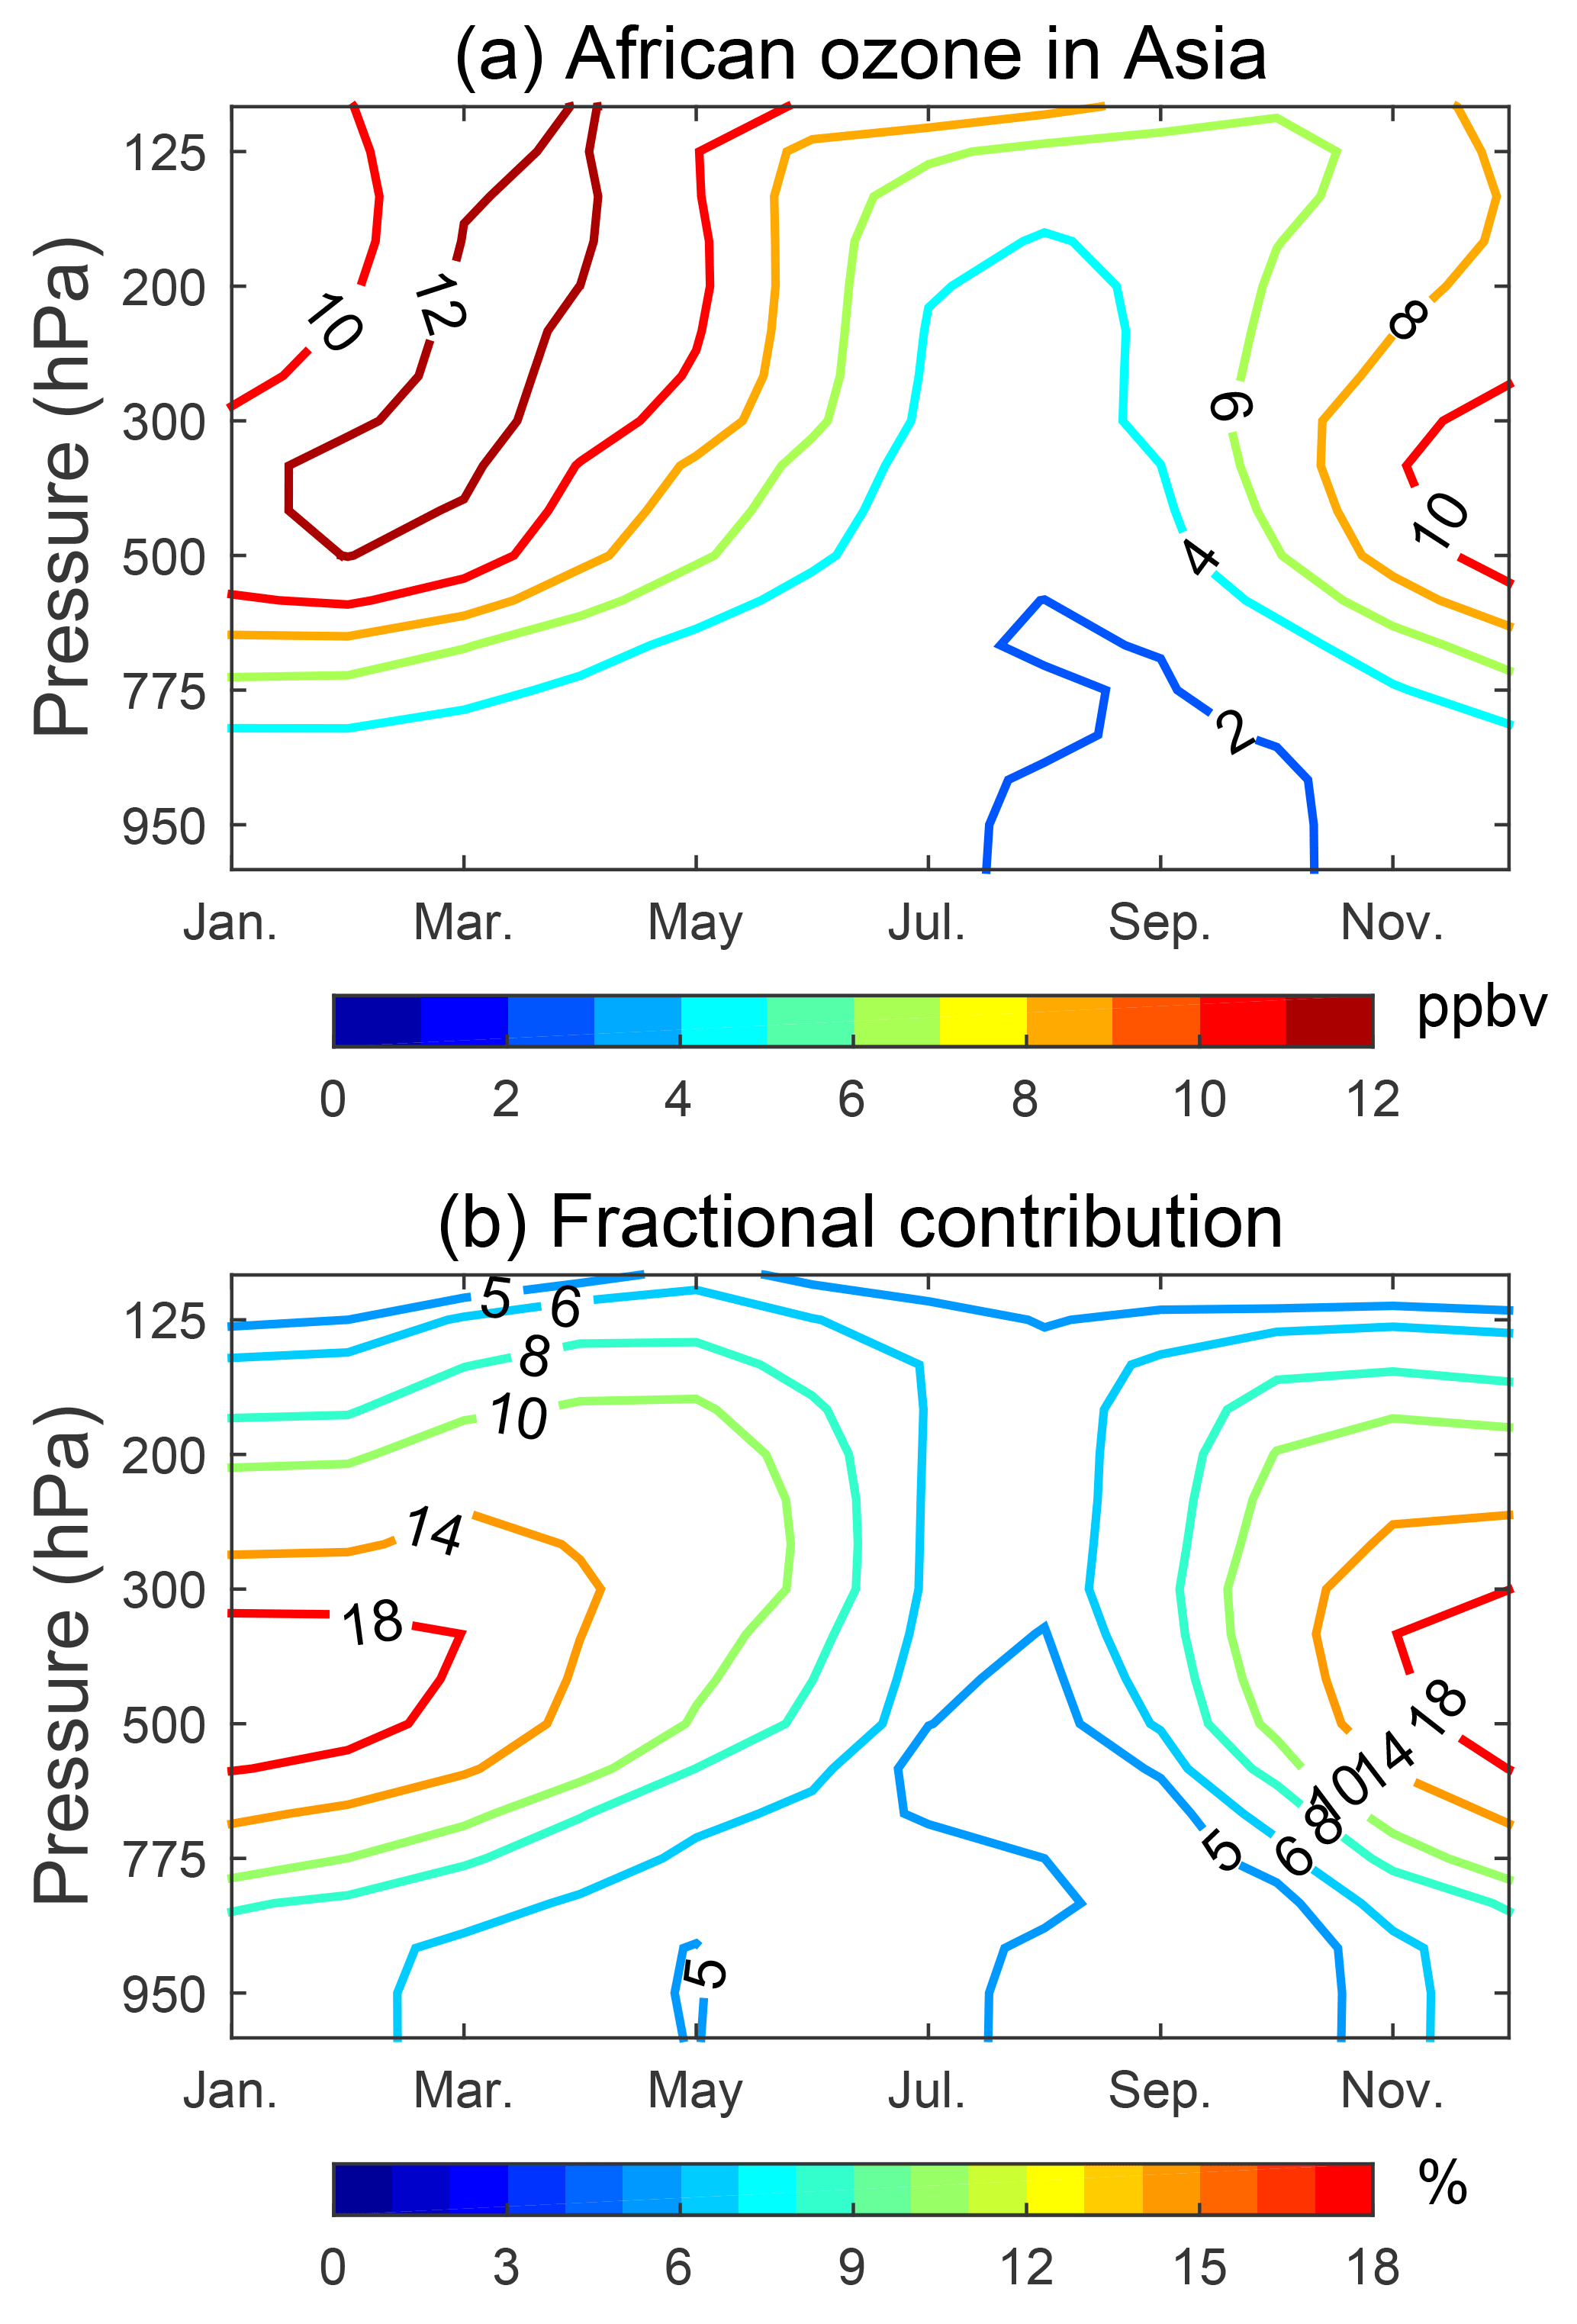
Figure 6(a) Seasonal variation of imported African ozone (in ppbv) varying with altitude. (b) The same as (a) but for the corresponding fractional contribution (in %). The values are the 20-year means (1987–2006) from the GEOS-Chem simulation averaged over Asia (60–145∘ E, 5–40∘ N; see Fig. 1).

Figure 7The fractional contribution of the imported African ozone from a layer in Africa to the total imported African ozone from all layers in Africa (in %). The layers include the lower troposphere (LT), middle troposphere (MT), and upper troposphere (UT). Each layer is further separated by hemisphere with blueish colors for NHAF and reddish colors for SHAF. The fractional contribution is shown in bars by season at (a) 200 hPa, (b) 600 hPa, and (c) 975 hPa over Asia. The values are the 20-year means (1987–2006) from the GEOS-Chem simulation averaged over Asia (60–145∘ E, 5–40∘ N; see Fig. 1).
The strong seasonality of imported African ozone can also be shown vertically in Fig. 6a, in which imported African ozone is averaged over Asia south of 40∘ N. The fractional contribution of imported African ozone to ozone in Asia is shown in Fig. 6b. In the Asian upper troposphere, imported African ozone is largest during March–May (over 10 ppbv) and least during July–October (below 6 ppbv). In the Asian middle troposphere, imported African ozone is at a minimum from July to September (∼ 4 ppbv, 6 % in the fractional contribution) and a maximum (over 10 ppbv, 14 % in the fractional contribution) from January to March, about 2 months earlier than in the upper troposphere. In the Asian lower troposphere, imported African ozone is largest in NH winter (∼ 4 ppbv, 8 % in the fractional contribution) and lowest in NH autumn (∼ 2 ppbv, 5 % in the fractional contribution).
Furthermore, the total imported African ozone over Asia is divided by tropospheric layer (UT, MT, and LT) and by hemisphere, and the fractional contribution for each region is shown in Fig. 7. Over the Asian upper troposphere, African ozone from the NHAF UT accounts for 60–70 % of the total imported African ozone (Fig. 7a), decreasing to ∼ 20 % in the Asian MT (Fig. 7b) and to below 20 % in the Asian LT (Fig. 7c). In the meantime, the influence of African ozone from the NHAF MT becomes larger in the Asian MT and LT (20–40 %), as does the influence of African ozone from the NHAF LT (20–40 %). African ozone from SHAF contributes to the total imported ozone throughout the year in the three tropospheric layers. The contribution is small, usually below 20 % of the total imported African ozone, except for in NH winter over the Asian UT (Fig. 7a) and in NH summer over the Asian LT (Fig. 7c). The two exceptions in interhemispheric transport will be discussed in detail in Sect. 4.2.
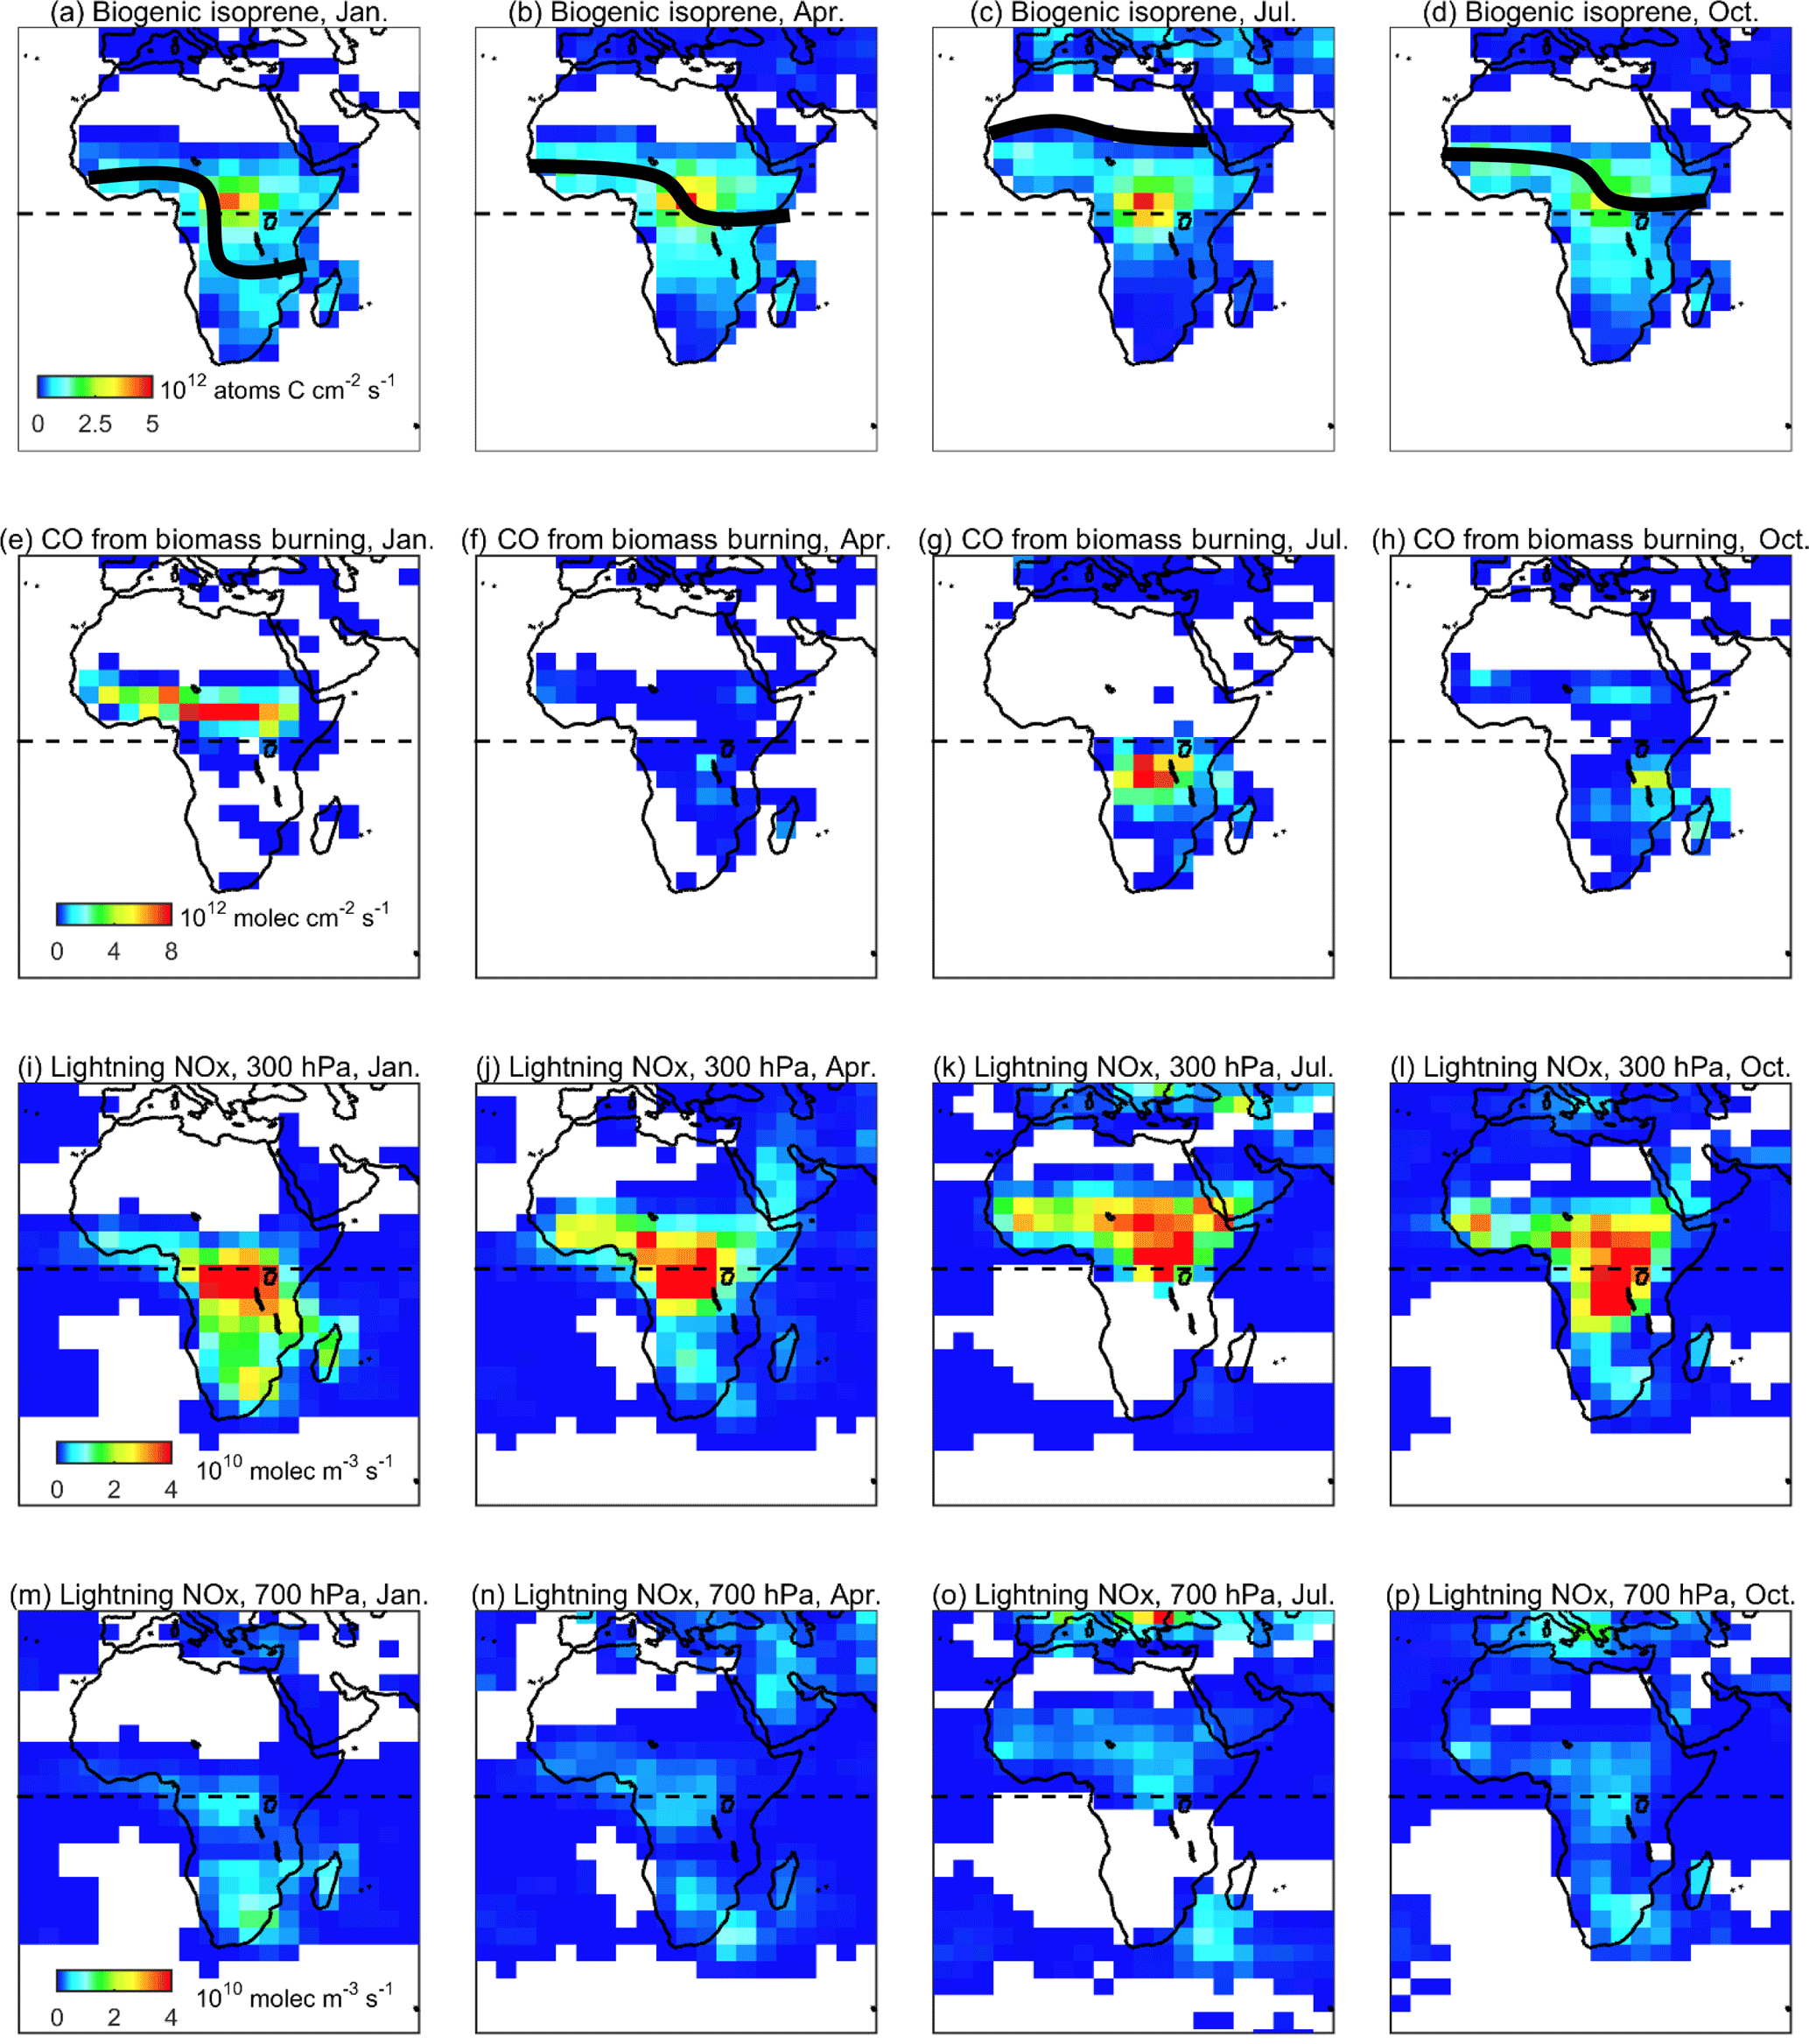
Figure 8Distributions of isoprene emissions from biogenic sources (a–d), CO emissions from biomass burning (e–h), and NOx emissions from lightning at 300 hPa (i–l) and 700 hPa (m–p) by season in 2005. The data are based on the emission inventories in GEOS-Chem (see Sect. 2.1). The dashed lines indicate the equator. The black solid lines indicate the seasonal variation in the location of the ITCZ.
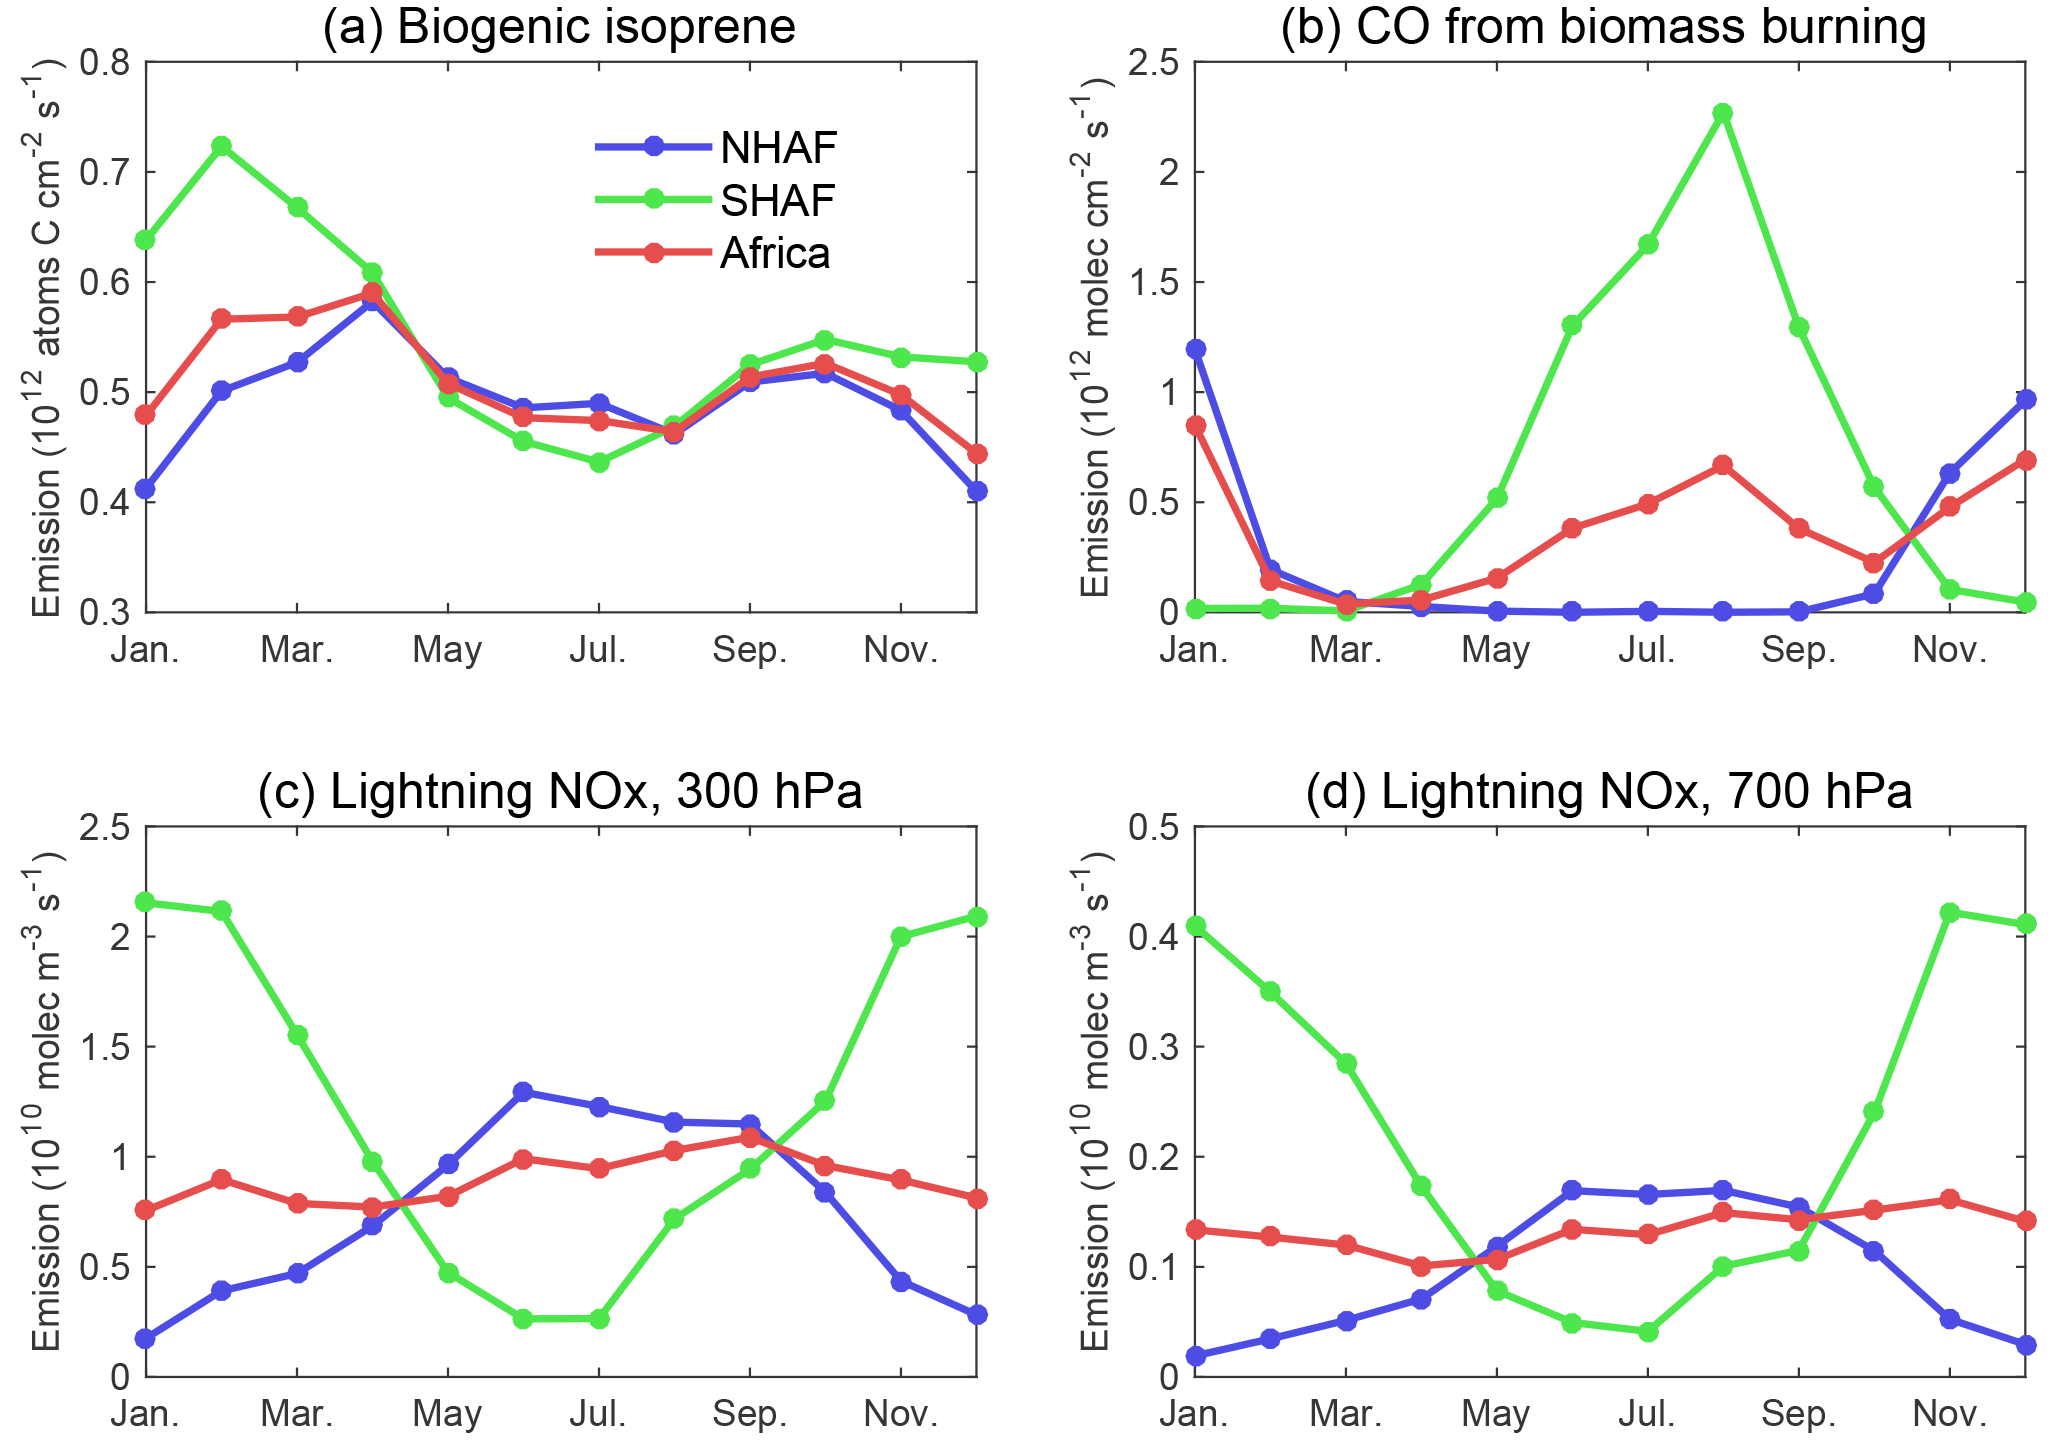
Figure 9Seasonal variations for (a) isoprene emissions from biogenic sources, (b) CO emissions from biomass burning, NOx emissions from lightning at (c) 300 hPa, and (d) 700 hPa averaged over Africa, NHAF, and SHAF in 2005.

Figure 10Horizontal distributions of African ozone (in ppbv, in color), overlaid with winds (shown by arrows), at 400 hPa in (a) January, (b) April, (c) July, and (d) October. The ozone values are the means from the 20-year GEOS-Chem simulation. Between the two pairs of parallel dashed lines, latitudinal and longitudinal means are taken and shown in Figs. 11 and 12, respectively.
The seasonality of the transport of African ozone to Asia results from the collective impact of the emissions of ozone precursors in the source region and the meteorology and chemistry from the source region to the receptor region. The precursors of African ozone are mainly from biogenic, biomass burning, and lightning NOx sources (Piketh and Walton, 2004; Thompson, 2004; Aghedo et al., 2007; Giglio et al., 2013; Monks et al., 2015). The seasonalities of emissions from biogenic sources, biomass burning, lightning, and anthropogenic sources in Africa are characterized rather differently from the other continents (Williams et al., 2009; Guenther et al., 2012; Giglio et al., 2013; Albrecht et al., 2016). Since Africa covers areas in both hemispheres with a large portion in the tropics, the atmospheric circulation over Africa experiences obvious seasonal changes induced by the seasonality of the ITCZ and the Hadley cell (Nicholson, 2008, 2009; Žagar et al., 2011; Suzuki, 2011). To cast some light on the seasonal variations of imported African ozone over Asia presented in this section, the ITCZ and ozone precursor emissions over Africa are discussed in Sect. 3.2. Based on the discussion, the possible mechanisms that modulate the transport of African ozone to Asia are speculated in Sect. 3.3.
3.2 ITCZ and ozone precursor emissions over Africa
Based on Nicholson (2009, 2013), Suzuki (2011), and Žagar et al. (2011), the mean positions of the ITCZ in Africa in the four seasons are roughly illustrated in Fig. 8a–d. The latitudinal migration of the ITCZ with season varies with longitude and the migration is within a wider range of latitudes in eastern Africa (10–40∘ E) than in western Africa (west of 10∘ E). In eastern Africa, ITCZ shifts between ∼ 10∘ S in NH winter and ∼ 20∘ N in NH summer, while in western Africa, the center of the ITCZ swings from 5 to 20∘ N between NH winter and NH summer.
Seasonal variations of African ozone largely depend on biogenic, biomass burning, lightning, and anthropogenic emissions. The anthropogenic emissions are generally considered to be small and have weak seasonality (Aghedo et al., 2007; Williams et al., 2009). Based on the emission inventories in GEOS-Chem that are described in Sect. 2.1, the spatial distributions of ozone precursor emissions are shown by season in Fig. 8, including isoprene emissions from biogenic sources, CO emissions from biomass burning, and NOx emissions from lightning at 700 and 300 hPa. Seasonal variations of these emissions averaged over Africa, NHAF, and SHAF are shown in Fig. 9.
Isoprene (C5H8) is the dominant non-methane volatile organic compound (NMVOC) emitted by vegetation (Marais et al., 2012). Biogenic isoprene emissions in Africa are considered to be responsible for about 65 % of ozone enhancement in the African upper troposphere (Aghedo et al., 2007). Isoprene emissions shown in Fig. 8a–d are representative of biogenic emissions of ozone precursors. The magnitude and spatiotemporal pattern of the isoprene emissions in Africa in Figs. 8 and 9 are comparable with Marais et al. (2014). The maximum biogenic isoprene emissions are over central African rainforests throughout the year (Fig. 8a–d). The seasonal cycle of biogenic isoprene over Africa peaks in NH spring and autumn (Fig. 9a). Plenty of non-methane VOCs are emitted from biogenic sources that can be uplifted by strong convection. Aghedo et al. (2007) and Zare et al. (2014) suggested that biogenic emissions can lead to more ozone generation in the African upper troposphere than biomass burning and anthropogenic emissions.
In NH winter, fires in Africa are active in the NH between 0–10∘ N and 15∘ W to 40∘ E (Fig. 8e–h; see also Sauvage et al., 2005). From NH winter to autumn, regions with biomass burning shift southward (Fig. 8e–h; see also van der Werf et al., 2010; Giglio et al., 2013). In NH summer, fires are most active in the SH from the equator to 20∘ S. Therefore, the regional CO emissions from biomass burning peak during NH winter in NHAF and during NH summer in SHAF (Fig. 9b). Aghedo et al. (2007) stated that biomass burning has the largest impact on surface ozone in the vicinity of the African burning regions during the burning seasons.
In Africa, lightning NOx is produced mostly in the middle to upper troposphere (Fig. 8i–p; see also Pickering et al., 1998; Ott et al., 2010; Miyazaki et al., 2014). Miyazaki et al. (2014) estimated that the altitudes where the annual lightning NOx emissions maximize are around 11 km in northern Africa and 9.36 km in southern Africa. Aghedo et al. (2007) suggested that lightning emissions mainly enhance ozone production in the African middle and upper troposphere. Ascribed to the high efficiency of deep moist convection, frequent lightning activities occur in the ITCZ (Christian et al., 2003; Avila et al., 2010). Collier and Hughes (2011) suggested that the peak lightning activities are generally located on the southern border of the ITCZ in Africa. The seasonality of the geographic variation of lightning NOx emissions clearly shows the influence of the ITCZ over Africa (Collier and Hughes, 2011). When the ITCZ reaches its northernmost position in NH summer (Fig. 8c), lightning NOx emission over NHAF becomes the highest (Fig. 9c and d). Similarly, the lightning NOx emission over SHAF peaks in NH winter (Fig. 9c and d).
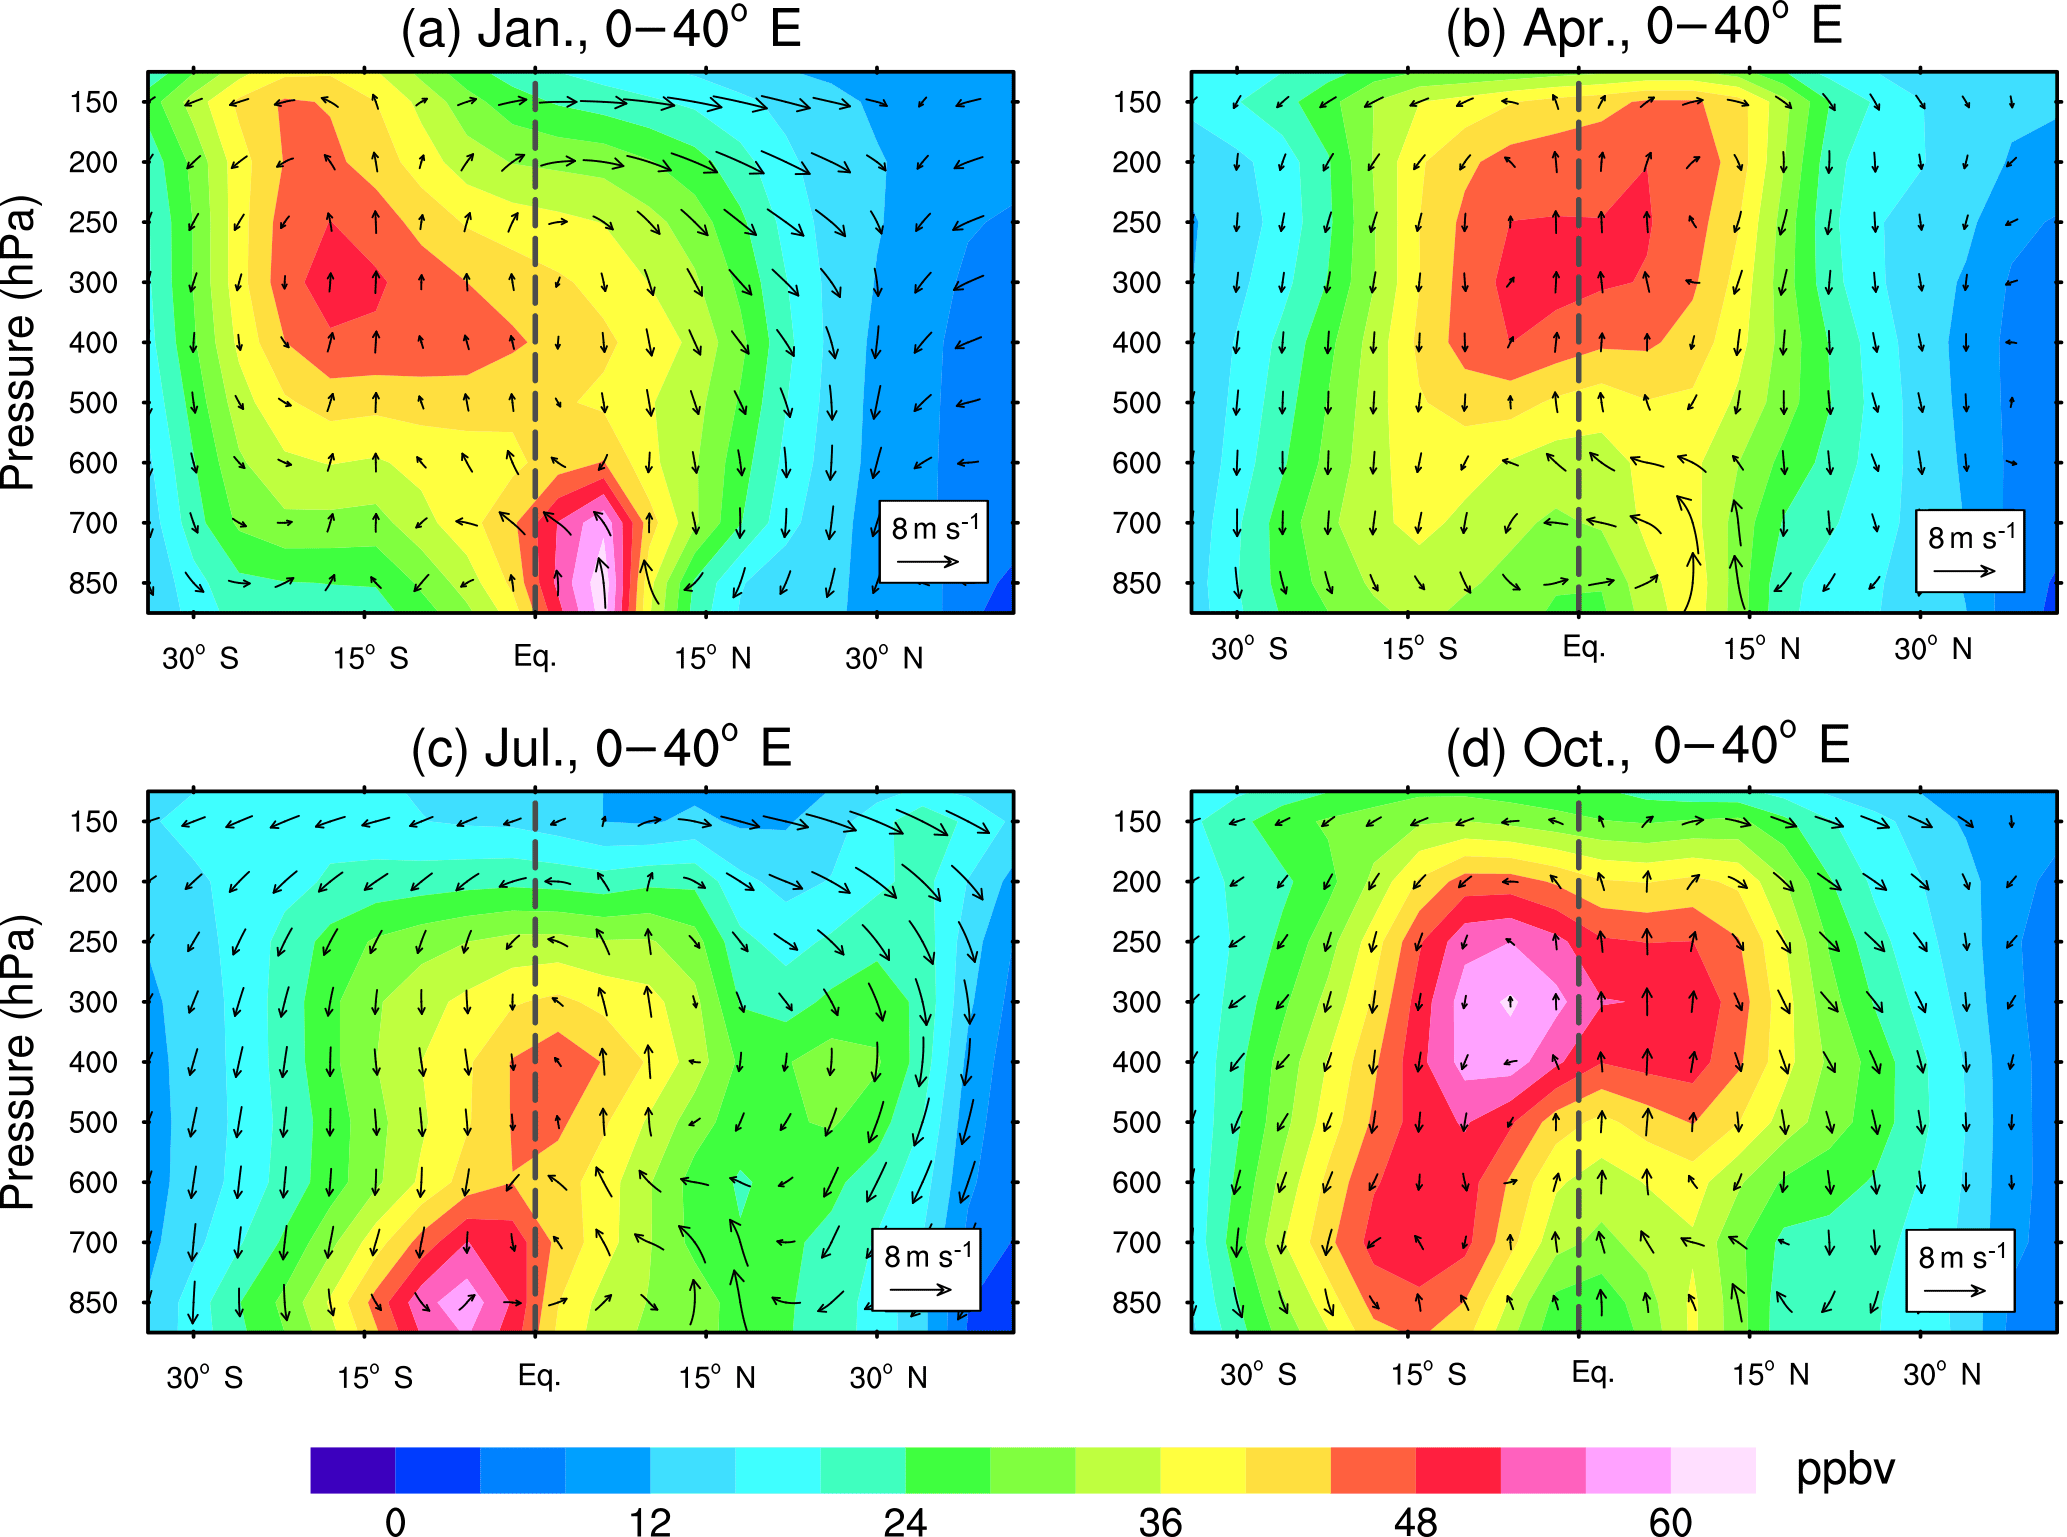
Figure 11Latitude–altitude distribution of African ozone (in ppbv, in color), overlaid with winds (shown by arrows), in (a) January, (b) April, (c) July, and (d) October. The ozone values are the means over 0–40∘ E (see Fig. 10) from the 20-year GEOS-Chem simulation. The vertical velocities in the p coordinates are enlarged by 200 times for illustration purposes. The vertical dashed line indicates the equator.
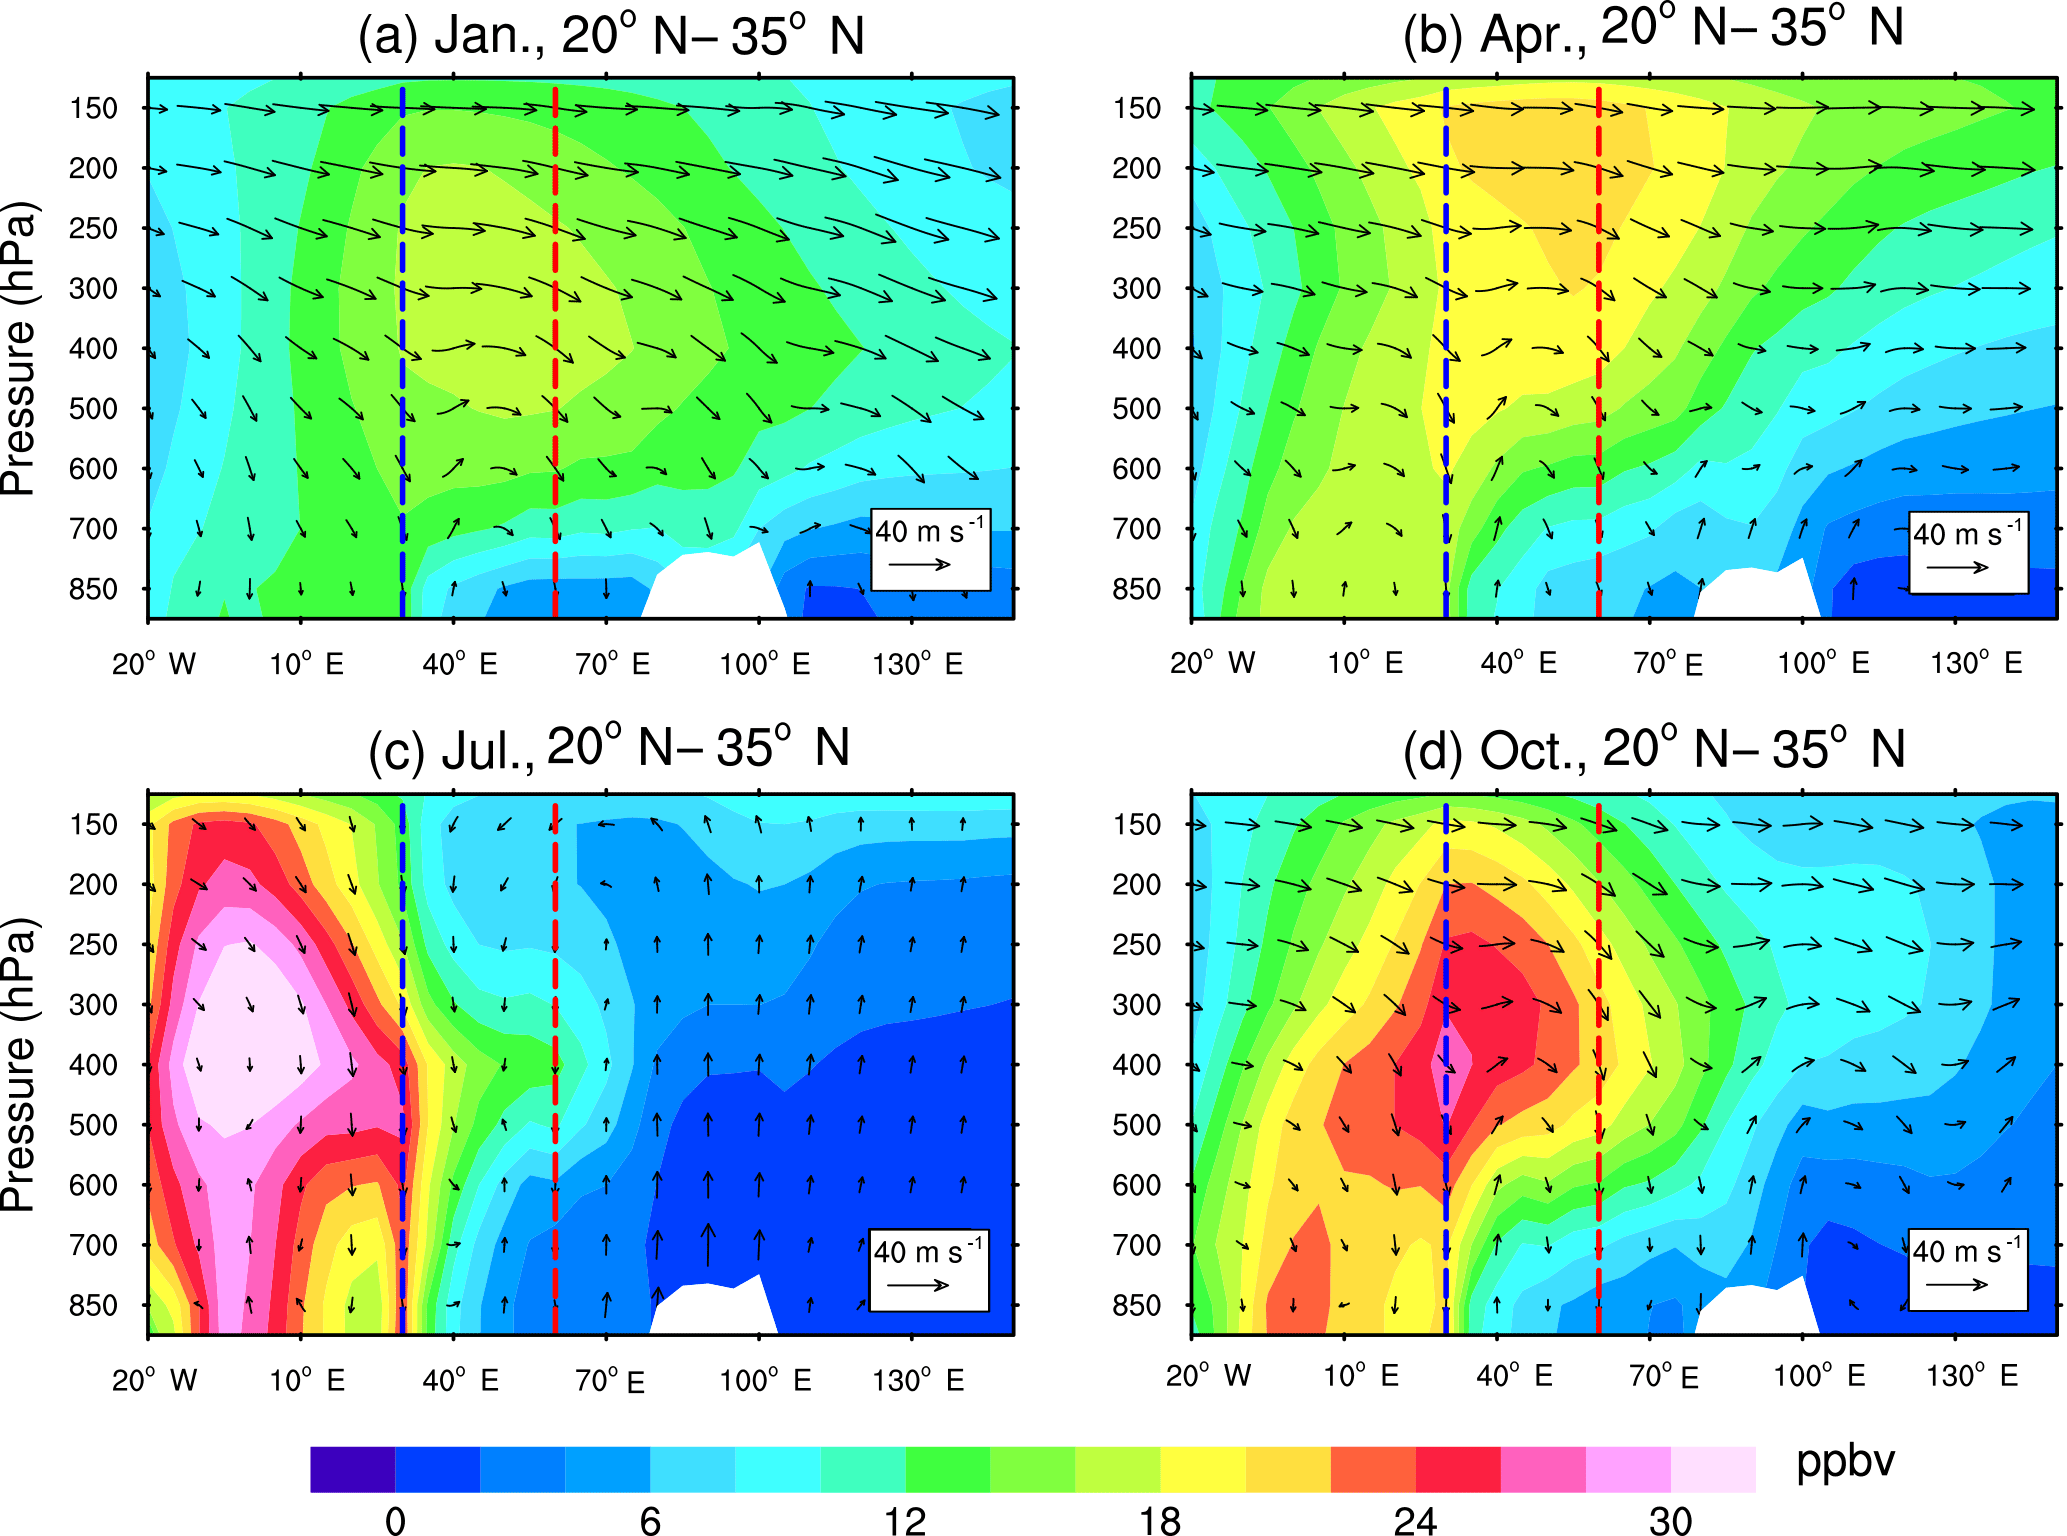
Figure 12Longitude–altitude distribution of African ozone (in ppbv, in color), overlaid with winds (shown by arrows), in (a) January, (b) April, (c) July, and (d) October. The ozone values are the means over 20–35∘ N (see Fig. 10) from the 20-year GEOS-Chem simulation. White areas indicate topography. The red and blue dashed lines indicate the western border of Asia and eastern border of Africa, respectively. The vertical velocities in the p coordinates are enlarged by 200 times for illustration purposes.
3.3 Analysis of the mechanisms for the transport of African ozone to Asia
As African ozone mainly peaks in the Asian middle and upper troposphere, the horizontal distributions of African ozone at 400 hPa in January, April, July, and October, overlaid with winds, are shown in Fig. 10 to illustrate the seasonality and the transport pathways of African ozone to Asia at this level. In NH winter, African ozone can be transported for a long distance along the subtropical westerlies in the two hemispheres, reaching the western Pacific in the NH and across Australia in the SH. In NH summer, the NH subtropical westerlies and tropical easterlies shift to their northernmost positions; less African ozone can be transported to Asia than in the other seasons. Furthermore, Fig. 11 shows the latitude–altitude cross sections of African ozone and winds averaged from 0 to 40∘ E. This is to show how African ozone in the source region varies vertically along different latitudes. Figure 12 is the same as Fig. 11 but for the longitude–altitude cross sections averaged from 20 to 35∘ N in order to show the transport pathway along longitudes from Africa to Asia. Figure 13 shows the 20-year mean paths for the trajectories that run from seven representative sites (Cairo, Ghat, Abuja, Khartoum, Juba, Dar es Salaam, and Luanda) to Asia. The mean paths are shown by season and by the original tropospheric layer, including the lapse day from the beginning of the trajectories. Additionally, we conduct three sensitivity experiments by “switching off” the biogenic, lightning, and biomass burning emissions, respectively, to assist our analysis. The separate contributions of the three sources to tropospheric ozone over Africa are shown in Fig. S7. In the following, we analyze the information from these figures, in combination with literature, to explore possible mechanisms responsible for the transport of African ozone to Asia in the four seasons.
3.3.1 In NH winter
In NH winter, the eastern part of ITCZ shifts to its southernmost position in eastern Africa around 15∘ S (Figs. 8a and 11a), while the western part of the ITCZ remains in NHAF around 5∘ N (Figs. 8a and 11a). In Fig. 11a, the ITCZ around the two latitudes and the two cells of the Hadley circulation is clearly shown. Biomass burning is active in NHAF (Figs. 8e and 9b). Biogenic emissions (Fig. 9a) and NOx emissions from lightning (Fig. 9c) are the highest in SHAF. All these conditions are well reflected in Fig. 11a. The elevated African ozone in the NHAF lower troposphere from the equator to 10∘ N results from high biomass burning and biogenic emissions (Fig. 8a and e; see also Fig. S7a and c, Aghedo et al., 2007), only this ozone is mostly confined under 700 hPa. In contrast, the high ozone concentrations over the SHAF middle and upper troposphere are due to deep convection and strong convergence of the ITCZ in SHAF that brings biogenic precursors to the upper troposphere and enhances ozone production there (Fig. 8a; see also Fig. S7a). In addition, ozone can be also generated in the middle and upper troposphere due to frequent lightning activities (Fig. 8i; see also Fig. S7b, Aghedo et al., 2007).
Driven by the Hadley cell, African ozone is transported upward over the ITCZ, northward in the middle and upper troposphere, and equatorward in the lower troposphere. The northward flow in the middle and upper troposphere gradually weakens between 15 and 30∘ N (Fig. 11a), where air parcels merge into the NH westerlies. This is also seen in the HYSPLIT trajectories in Fig. 13a and b. The trajectories originated from the two sites in the SH stop moving northward and turn toward the east around 20∘ N (Fig. 13a and b).

Figure 13Mean seasonal paths during the period 1987–2006 for the trajectories that reach Asia and start from African sites at Cairo, Ghat, Abuja, Khartoum, Juba, Dar es Salaam, and Luanda (stars; see also Fig. 1) from 11 km (UT) (a, d, g, j), 5.5 km (MT) (b, e, h, k), and 1.5 km (LT) (c, f, i, l) in January (a–c), April (d–f), July (g–i), and October (j–l). The triangles along the trajectory paths indicate the lapse days from the beginning.
From the source region to the receptor region, the NH subtropical westerlies build the pathways (Fig. 12a; see also trajectories in Fig. 13a and b). In Fig. 12a, along the latitudinal pathways, downdrafts behind the European trough around 40∘ E divert part of African ozone to the surface. However, the updrafts ahead of the European trough favor the uplift of African ozone so it can be transported long distances in the upper troposphere.
Finally, over the receptor region Asia, the downdrafts behind the Asian trough situated at around 140∘ E bring African ozone from the upper layers to the lower layers. Consequently, the contribution of African ozone to Asia becomes the highest in the middle and upper troposphere (Figs. 5 and 6). In NH winter, the transport of African ozone to Asia generally takes 4–6 days, varying with altitude and latitude (Fig. 13a and b).
3.3.2 In NH spring
In NH spring, a region with high ozone concentrations above 40 ppbv appears in higher altitudes and extends to a larger area in the middle and upper troposphere than in NH winter (Figs. 11b and 12b). This region is further north than the elevated ozone region in NH winter. This is because the ITCZ in eastern Africa shifts northward to near the equator (Fig. 8b). Biomass burning is least active in both NHAF and SHAF (Figs. 8f and 9b), while the biogenic emissions in the season are the largest in NHAF and the second largest in SHAF (Fig. 9a). As the ITCZ is over the region where biogenic emissions are also high near the equator (Fig. 8b), the ITCZ effectively uplifts the biogenic precursors and also leads to production of NOx from lightning in the upper layers (Fig. 8j). The ozone precursors from both sources can enhance the generation of ozone in the middle and upper troposphere (Fig. S7d and e; see also Aghedo et al., 2007), where elevated ozone concentrations are apparent (Fig. 11b). Therefore, more African ozone can be exported from Africa in the upper troposphere in NH spring than in NH winter (Fig. 10a vs. 10b, Fig. 12a vs. 12b). It takes more time for trajectories to arrive in Asia in NH spring than in NH winter (Fig. 13a–c vs. 13d–f).
3.3.3 In NH summer
In NH summer, the ITCZ in Africa swings to its northernmost position around 15∘ N (Figs. 8c and 11c).The region with active biomass burning shifts to SHAF (Figs. 8g and 9b). A large amount of ozone, generated from the biomass burning in SHAF, is shown in Fig. 11c over the SHAF lower troposphere from ∼ 15∘ S to the equator. However, this ozone is mostly confined in the lower troposphere (Figs. 11c and S7i). Note that ozone in the middle and upper troposphere north of 15∘ N is higher than in the other seasons, which is likely a result of lightning activities and biogenic emissions (Figs. 8k, S2, and S7g). This ozone can be readily transported to Asia.
Along the transport pathway from Africa to Asia (Fig. 12c), African ozone concentrations in the source region are the highest among the four seasons (Figs. 10c and 12c). However, meteorological conditions along the pathway are most unfavorable for the transport of African ozone to Asia because of multiple reasons. First, the NH subtropical westerly jet in NH summer moves to the northernmost position around 40∘ N (Huang et al., 2012). The tropical easterlies also shift northward simultaneously (Fig. 8c) so to prevent African ozone from reaching Asia between 10 and 30∘ N in the middle and upper troposphere (see Figs. 5 and 6 for imported African ozone concentrations and Figs. 10c and 12c for African ozone and wind fields). Second, on the transport pathway, the heavy downdrafts from the Saharan High, a mid-tropospheric high-pressure system that is an eastward extension of the Azores High (Nicholson, 2017) and the Arabian High in the middle troposphere over the Middle East (Liu et al., 2011), hamper African ozone from reaching Asia. Note that in Fig. 12c, there is a region with lower African ozone than its surroundings in the lower troposphere between 10 and 40∘ E. The downdrafts of African ozone near 30∘ E are likely due to a summertime trough at 40∘ E (Y. Zhu et al., 2017). Consequently, the amount of African ozone is reduced during the transport. Thirdly, in the source region, strong updrafts occur over the Tibetan Plateau (Fig. 12c) and further block the transport of African ozone toward the east. Finally, the strong divergence from the Tibetan High obstructs the eastward transport of African ozone in the upper troposphere. For these reasons, imported African ozone over Asia is lowest in NH summer among the four seasons (Figs. 5 and 6). There are scarcely any trajectories from the African sites that can cross Asia, unlike in the other seasons (Fig. 13g, h, and i).
3.3.4 In NH autumn
In NH autumn, the ITCZ shifts southward to a location similar to in NH spring (Fig. 8b vs. 8d). Biogenic emissions are slightly lower than in NH spring (Fig. 8b vs. 8d, Fig. 9a), whereas lightning NOx emissions are higher than in NH spring (Fig. 8j vs. 8l, Fig. 9c). Biomass burning is strong but occurs mostly in SHAF (Fig. 9b), so it imposes small influence on the Asian troposphere (Fig. 7). In NHAF, the strong biogenic emissions are uplifted effectively by the ITCZ, similar to NH spring. The uplifted biogenic precursors and NOx from lightning in the middle and upper troposphere lead to elevated ozone there (Fig. 11d, see also Fig. S7j and k). African ozone concentrations in the NHAF middle and upper troposphere look higher than in NH spring (Fig. 10b vs. 10d, Fig. 11b vs. 11d, Fig. 12b vs. 12d). However, there is less African ozone arriving in Asia in NH autumn than in NH spring (Figs. 5 and 6). This may be due to two reasons. In NH spring, the elevated African ozone in NHAF is located at higher altitudes than in NH autumn (Fig. 11b vs. 11d, Fig. 12b vs. 12d). This ozone can be more effectively transported to Asia by higher speed winds in the upper layers. The second reason is because of the weaker subtropical westerlies in NH autumn than in NH spring (Fig. 10b vs. 10d, Fig. 12b vs. 12d; see also Huang et al., 2012). The transport pathways and the time for the transport of African ozone to Asia in NH autumn are similar to in NH spring, as shown in the trajectories (Fig. 13).
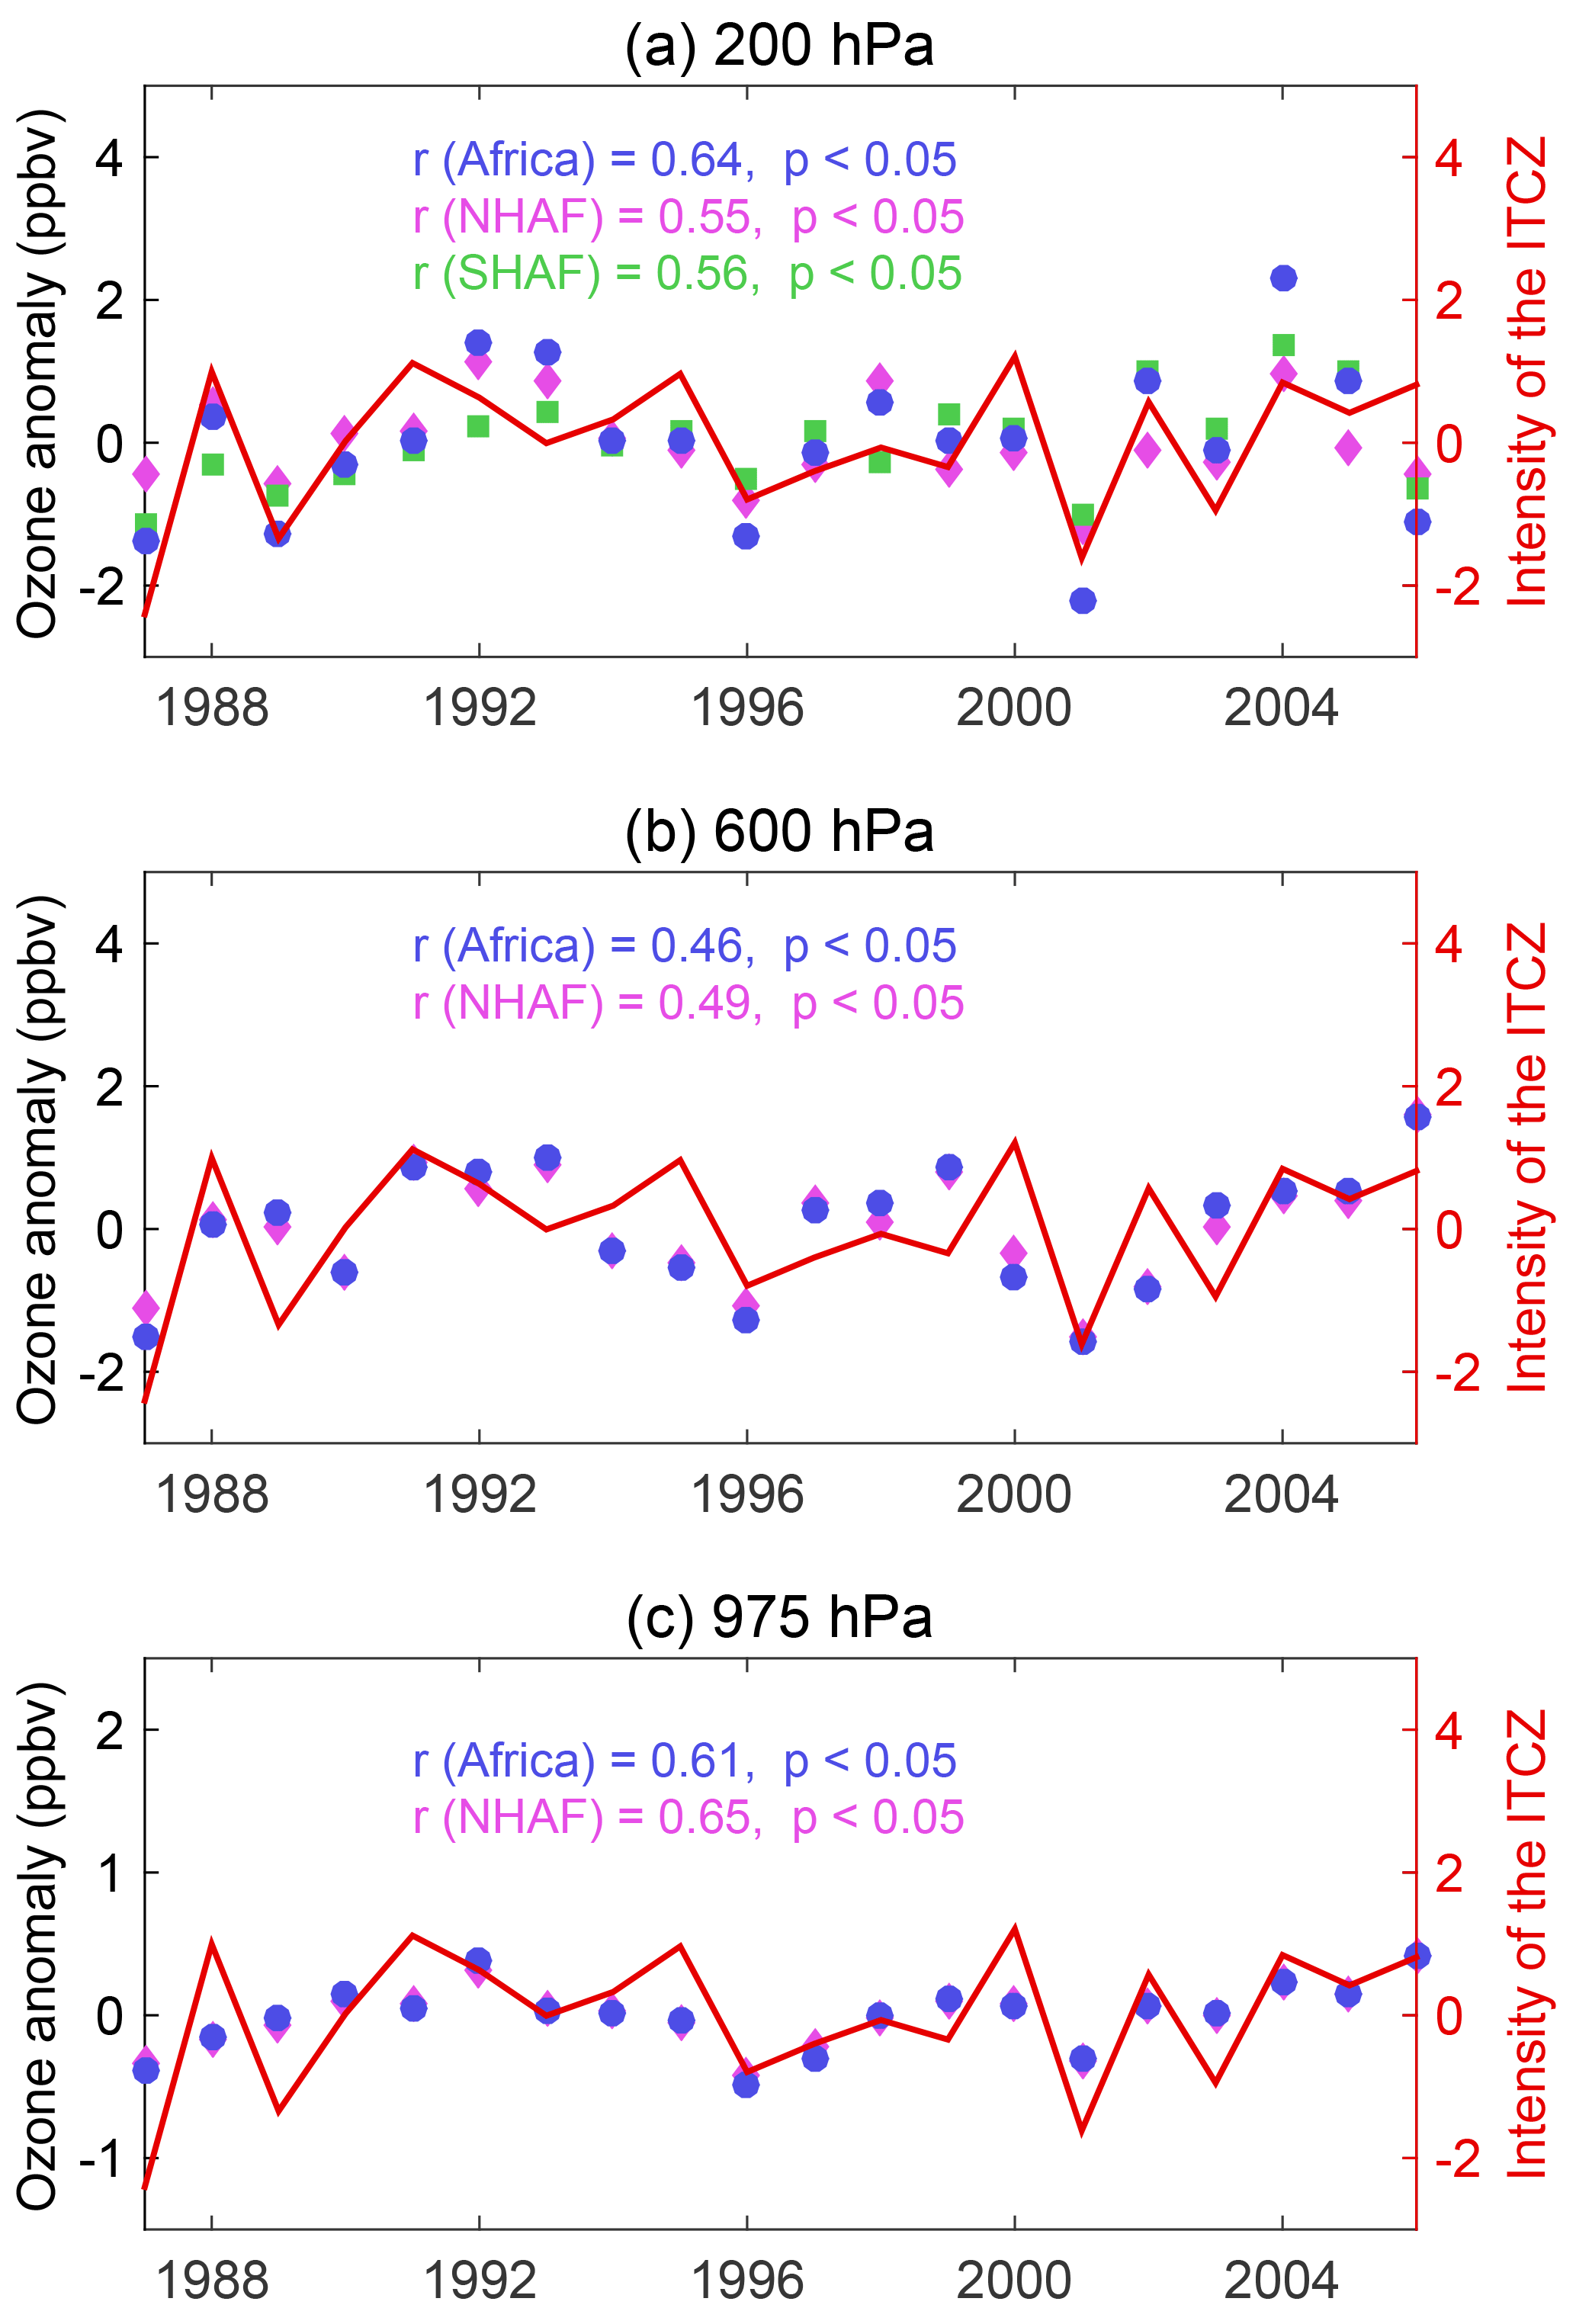
Figure 14Interannual variation of the intensity of the ITCZ (the values are normalized) over Africa and the anomaly of imported ozone from Africa, NHAF, and SHAF over Asia from 1987 to 2006 at (a) 200 hPa, (b) 600 hPa, and (c) 975 hPa in January, respectively.
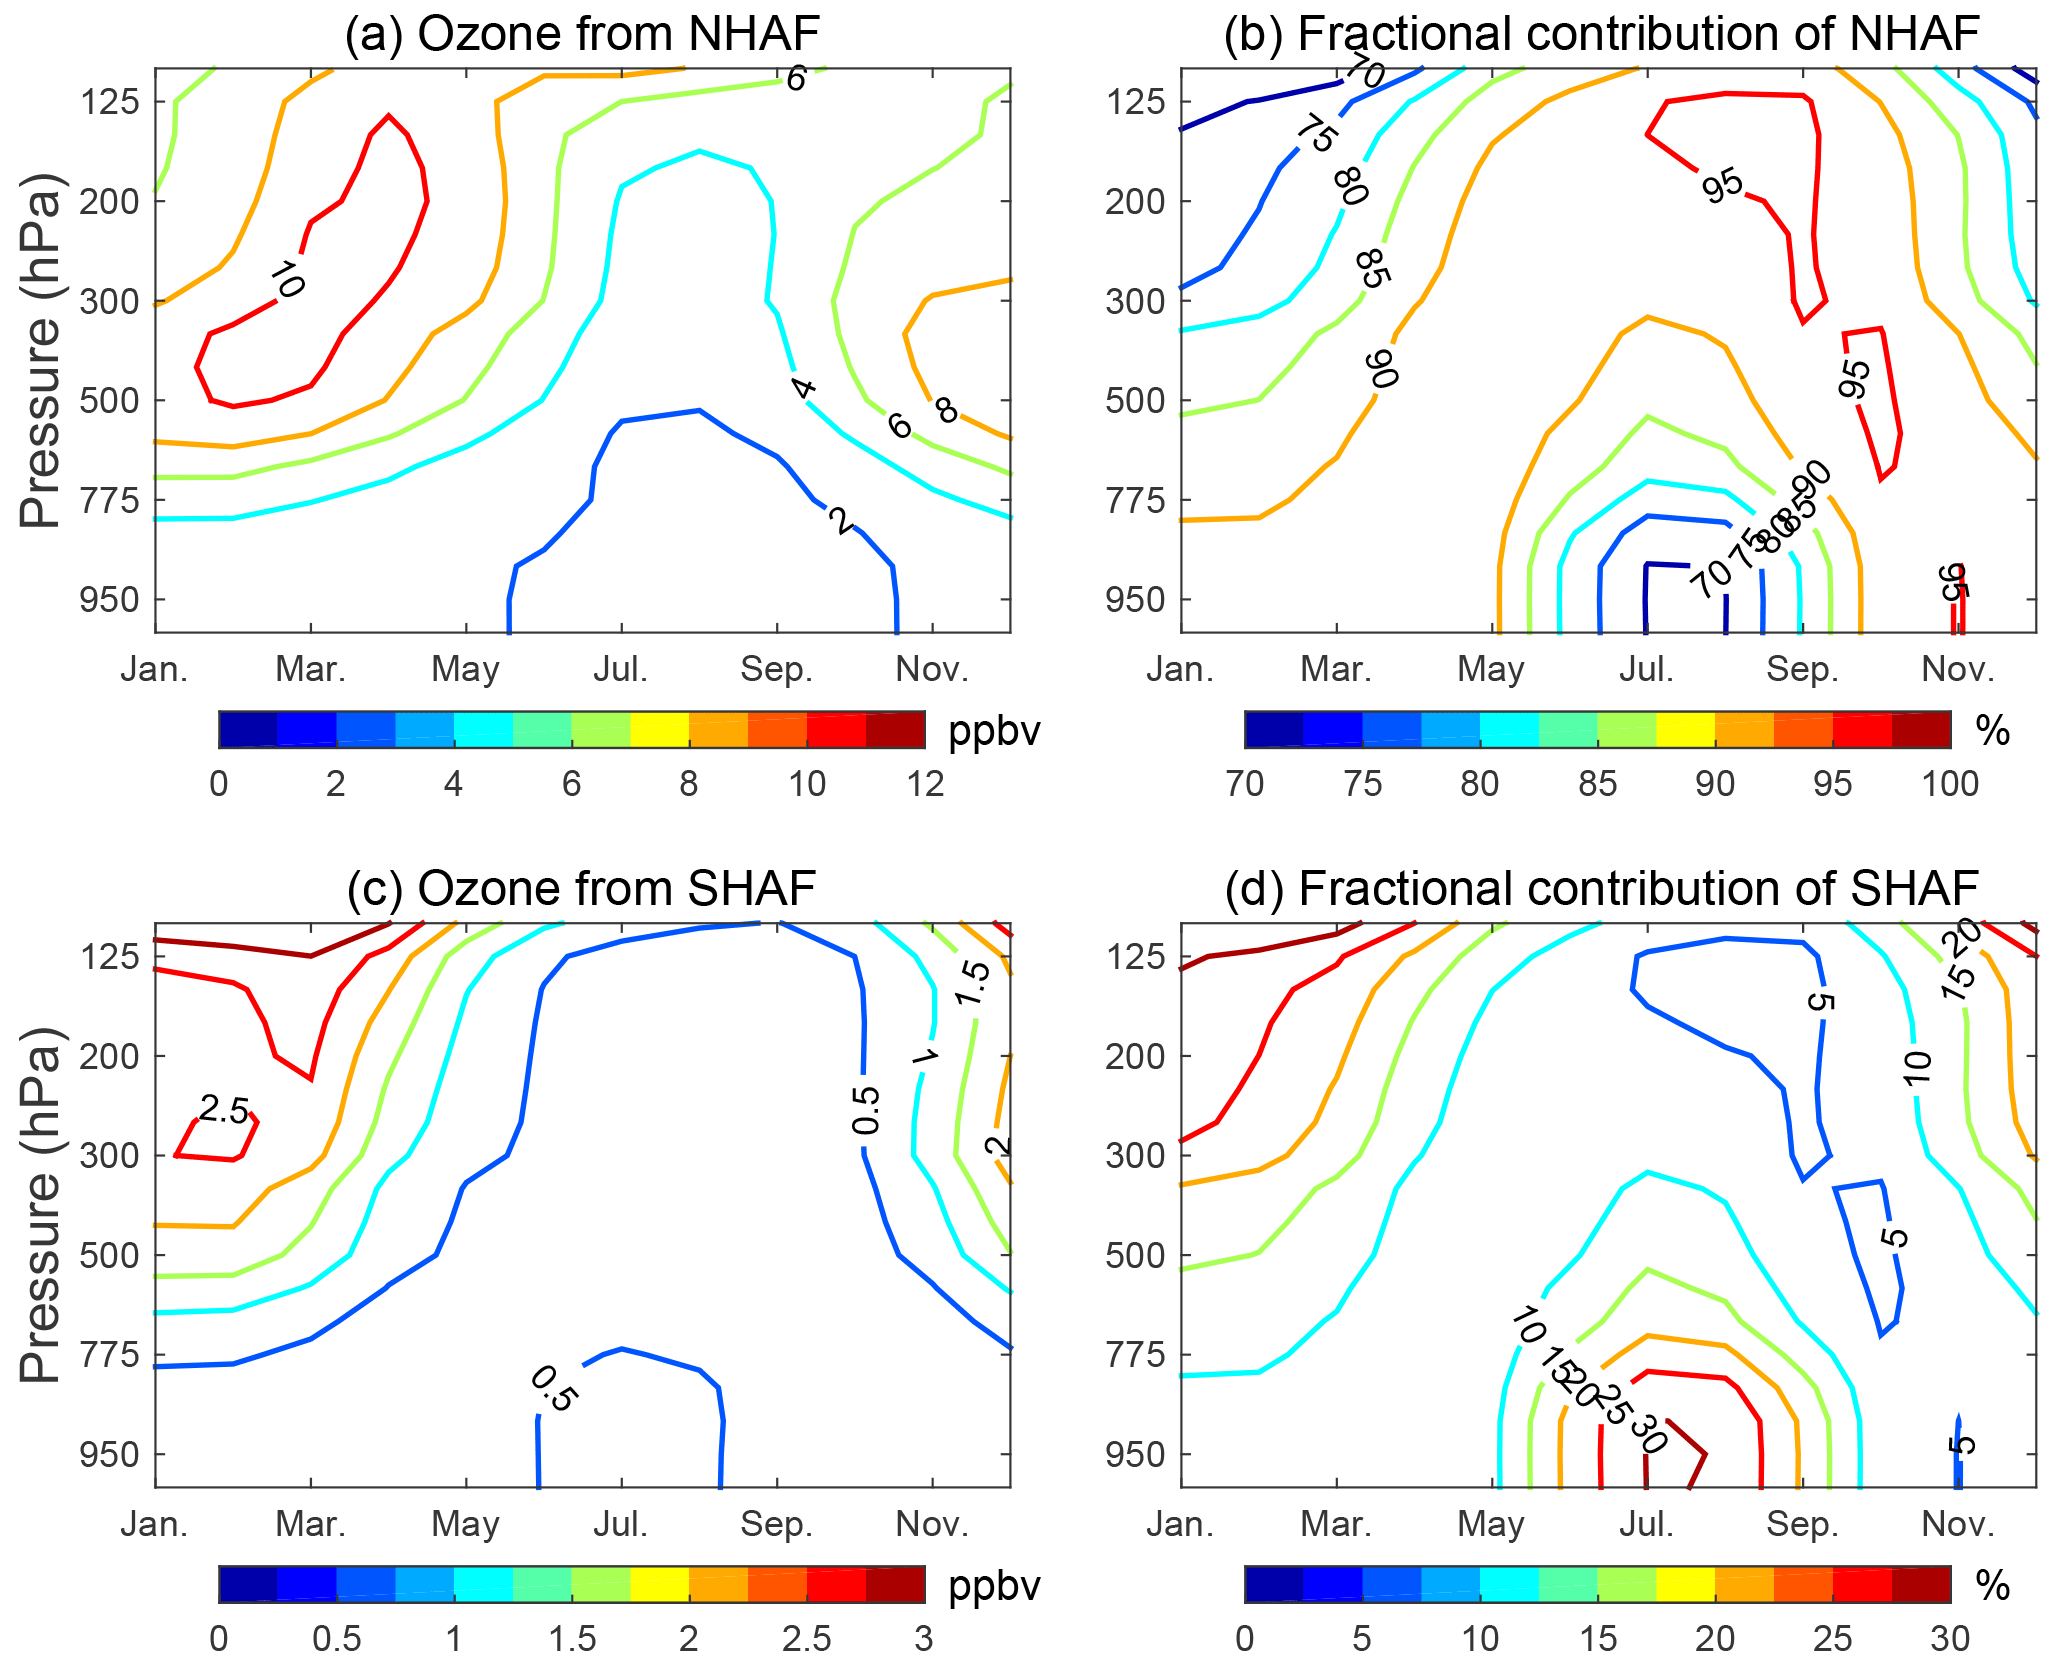
Figure 15Seasonal altitude variations of imported African ozone (in ppbv) from (a) NHAF and (c) SHAF over Asia (60–145∘ E, 5–40∘ N; see Fig. 1) and the fractional contribution of ozone from (b) NHAF and (d) SHAF to the total imported African ozone over Asia (in %). The ozone values are the means from the 20-year GEOS-Chem simulation.
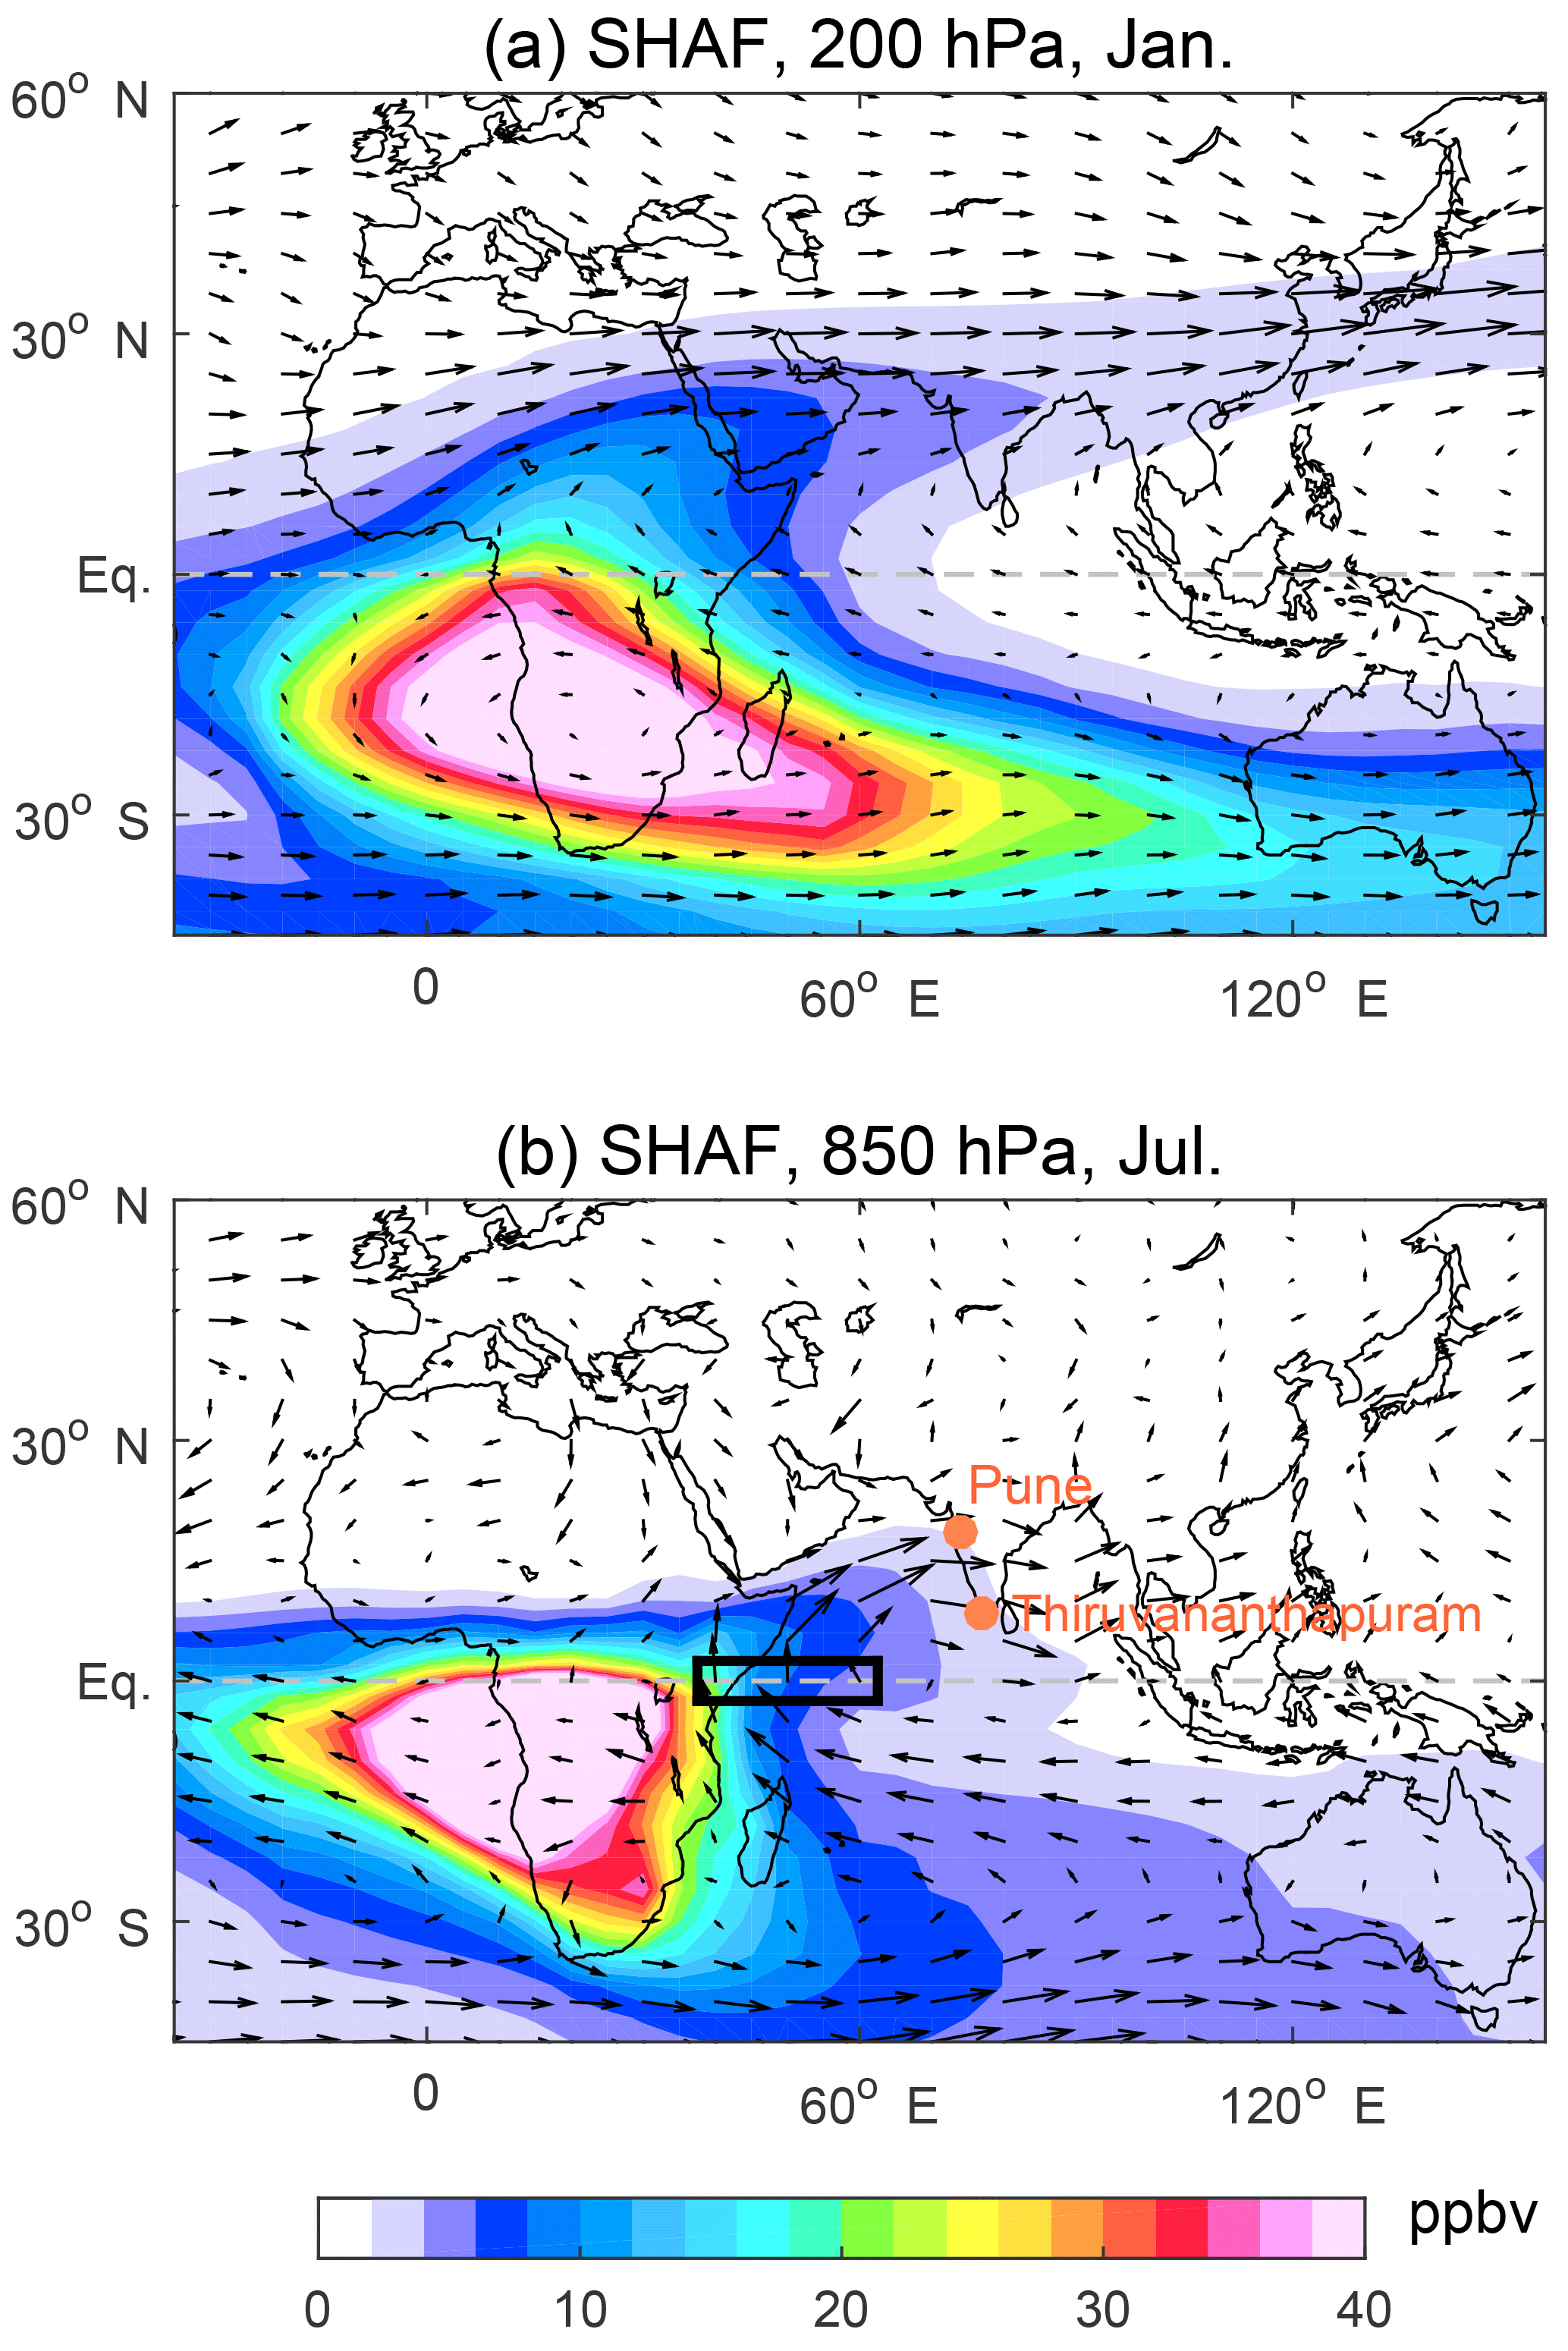
Figure 16Distributions of ozone from SHAF (in ppbv, in color), overlaid with winds (shown by arrows), at (a) 200 hPa in January and (b) at 850 hPa in July. The ozone values are the means from the 20-year GEOS-Chem simulation. The black rectangle indicates the domain used in calculating the strength of the Somali cross-equatorial flow. The brown dots indicate the ozonesonde sites in western India.
4.1 The influence of the ITCZ on African ozone transport to Asia in NH winter
As discussed, the ITCZ can impact meteorology in Africa (Sultan and Janicot, 2000; Xie, 2004; Hu et al., 2007; Collier and Hughes, 2011; Suzuki, 2011). The deep convection along the ITCZ can carry ozone precursors from biogenic, biomass burning, and anthropogenic emissions to the upper layers from the surface. The ITCZ is also a zone with large lightning activities and thus can impact the seasonality of NOx emission from lightning. The convective divergence in the upper troposphere over the ITCZ in Africa plays a significant role in output of African ozone and in the interhemispheric transport between SHAF and NHAF (Fig. 11 and see trajectories in Fig. 13).
To investigate the impact of ITCZ on the interannual variation of the transport of African ozone to Asia, we use the monthly OLR data from NCAR at 2.5∘ × 2.5∘ with temporal interpolation (Liebmann and Smith, 1996) as a proxy to indicate the intensity of the ITCZ. According to Waliser et al. (1993) and Fukutomi and Yasunari (2013), the number of the grids with OLR ≤ 260 W m−2 in the region of 15∘ W–45∘ E, 20∘ S–20∘ N can indicate the intensity of the convection over the ITCZ in Africa.
We find that the intensity of the ITCZ in Africa is mostly related to imported African ozone over Asia in NH winter. Figure 14 shows the time series of anomalies of imported African ozone averaged over Asia, against the intensity of the ITCZ over Africa. The intensity of the ITCZ is normalized; i.e., the normalized value is equal to the original value minus the mean and then divided by the standard deviation in January from 1987 to 2006. The intensity of the ITCZ and anomalies of imported African ozone are correlated with the correlation coefficient (r) of 0.61, 0.46, and 0.64 in the Asian lower (975 hPa), middle (600 hPa), and upper (200 hPa) troposphere, respectively, all statistically significant at the 95 % level (p<0.05).
Differentiating between hemispheres, significant correlations are found between the ITCZ and imported NHAF ozone in the entire troposphere in Asia (Fig. 14). The interhemispheric transport of ozone from SHAF to Asia also correlates with the intensity of ITCZ in Africa well, with r being 0.56 in the Asian upper troposphere (Fig. 14a). The interhemispheric transport to the Asian middle and lower troposphere is minimal so these time series are not shown.
Overall, when the intensity of the African ITCZ is stronger, more ozone and ozone precursors are uplifted to the middle and upper troposphere and transported northward and then eastward to Asia by the NH subtropical westerlies. Additionally, driven by the enhanced convective divergence over the ITCZ, more ozone from SHAF is transported across the equator and to the NHAF upper troposphere. Consequently, African ozone increases in the Asian middle and upper troposphere. Meanwhile, carried by the downdrafts from the Asian winter monsoon (Y. Zhu et al., 2017), more ozone is transported to the surface in Asia.
4.2 The influence of meteorology on the interhemispheric transport of ozone from SHAF to Asia
As shown in Fig. 7 and discussed in earlier sections, ozone generated in SHAF can be transported across the equator and eventually to Asia. This is illustrated in more detail in Fig. 15, showing seasonal altitude variations of imported ozone from NHAF and SHAF over Asia and the fractional contributions of NHAF and SHAF ozone to the total imported African ozone. Ozone from NHAF accounts for over 80 % of the total imported African ozone in the Asian tropospheric column throughout the year, except for in the upper troposphere during NH winter and in the lower troposphere during NH summer (Fig. 15b and d). This represents two important interhemispheric transport pathways.
For the first transport pathway, Fig. 7 suggests that the SHAF ozone originates mainly from the SHAF UT. This ozone can be transported northward across the equator along the Hadley circulation and then eastward to Asia by the NH subtropical westerlies (Fig. 13a). The amount of ozone being transported is at a maximum in NH winter and at a minimum in NH summer (Figs. 7 and 15c) when the ITCZ is at its southernmost and northernmost position, respectively (Fig. 8a–d). This can be further illustrated in the horizontal distribution of SHAF ozone at 200 hPa (Fig. 16a). SHAF ozone is 2–4 ppbv over China south of 30∘ N and 4–6 ppbv over western India. As shown in Sect. 4.1 (Fig. 14a), the variation of the ITCZ intensity in Africa can explain 31 % of the interannual variation of the transport of SHAF ozone to Asia in NH winter along this pathway.
The second transport pathway is shown in Fig. 16b for SHAF ozone distribution at 850 hPa in July, as Fig. 7c also suggests that the interhemispheric transport mainly occurs from the SHAF lower and middle troposphere. SHAF ozone concentrations are 2–4 ppbv over the Arabian Sea and the west coast of the Indian subcontinent. This ozone is transported to India in NH summer by the Somali cross-equatorial flow (Fig. 16b), which is the strongest seasonal cross-equatorial flow in the lower troposphere, serving as an essential component of the Asian monsoon system (Zhu, 2012). This is the reason for the maximum SHAF ozone (∼ 4 ppbv) over the Asian lower troposphere south of 10∘ N in NH summer (Fig. 5c). One more piece of evidence for this transport is shown in the trajectories from Dar es Salaam, on the eastern coast of Africa (Fig. 13h and i). The interhemispheric ozone transport to western India takes more than 6 days. Furthermore, the signal of the transport is captured in the ozonesonde data in western India. The vertical distributions of the seasonal ozone variations at Pune and Thiruvananthapuram are shown for the ozonesonde and GEOS-Chem data (Fig. 4). A dip of lower tropospheric ozone concentrations in both datasets is apparent in NH summer, when the Somali jet carries clear air masses from the sea, which can be traced back to SHAF (Figs. 13h, i and 16b).
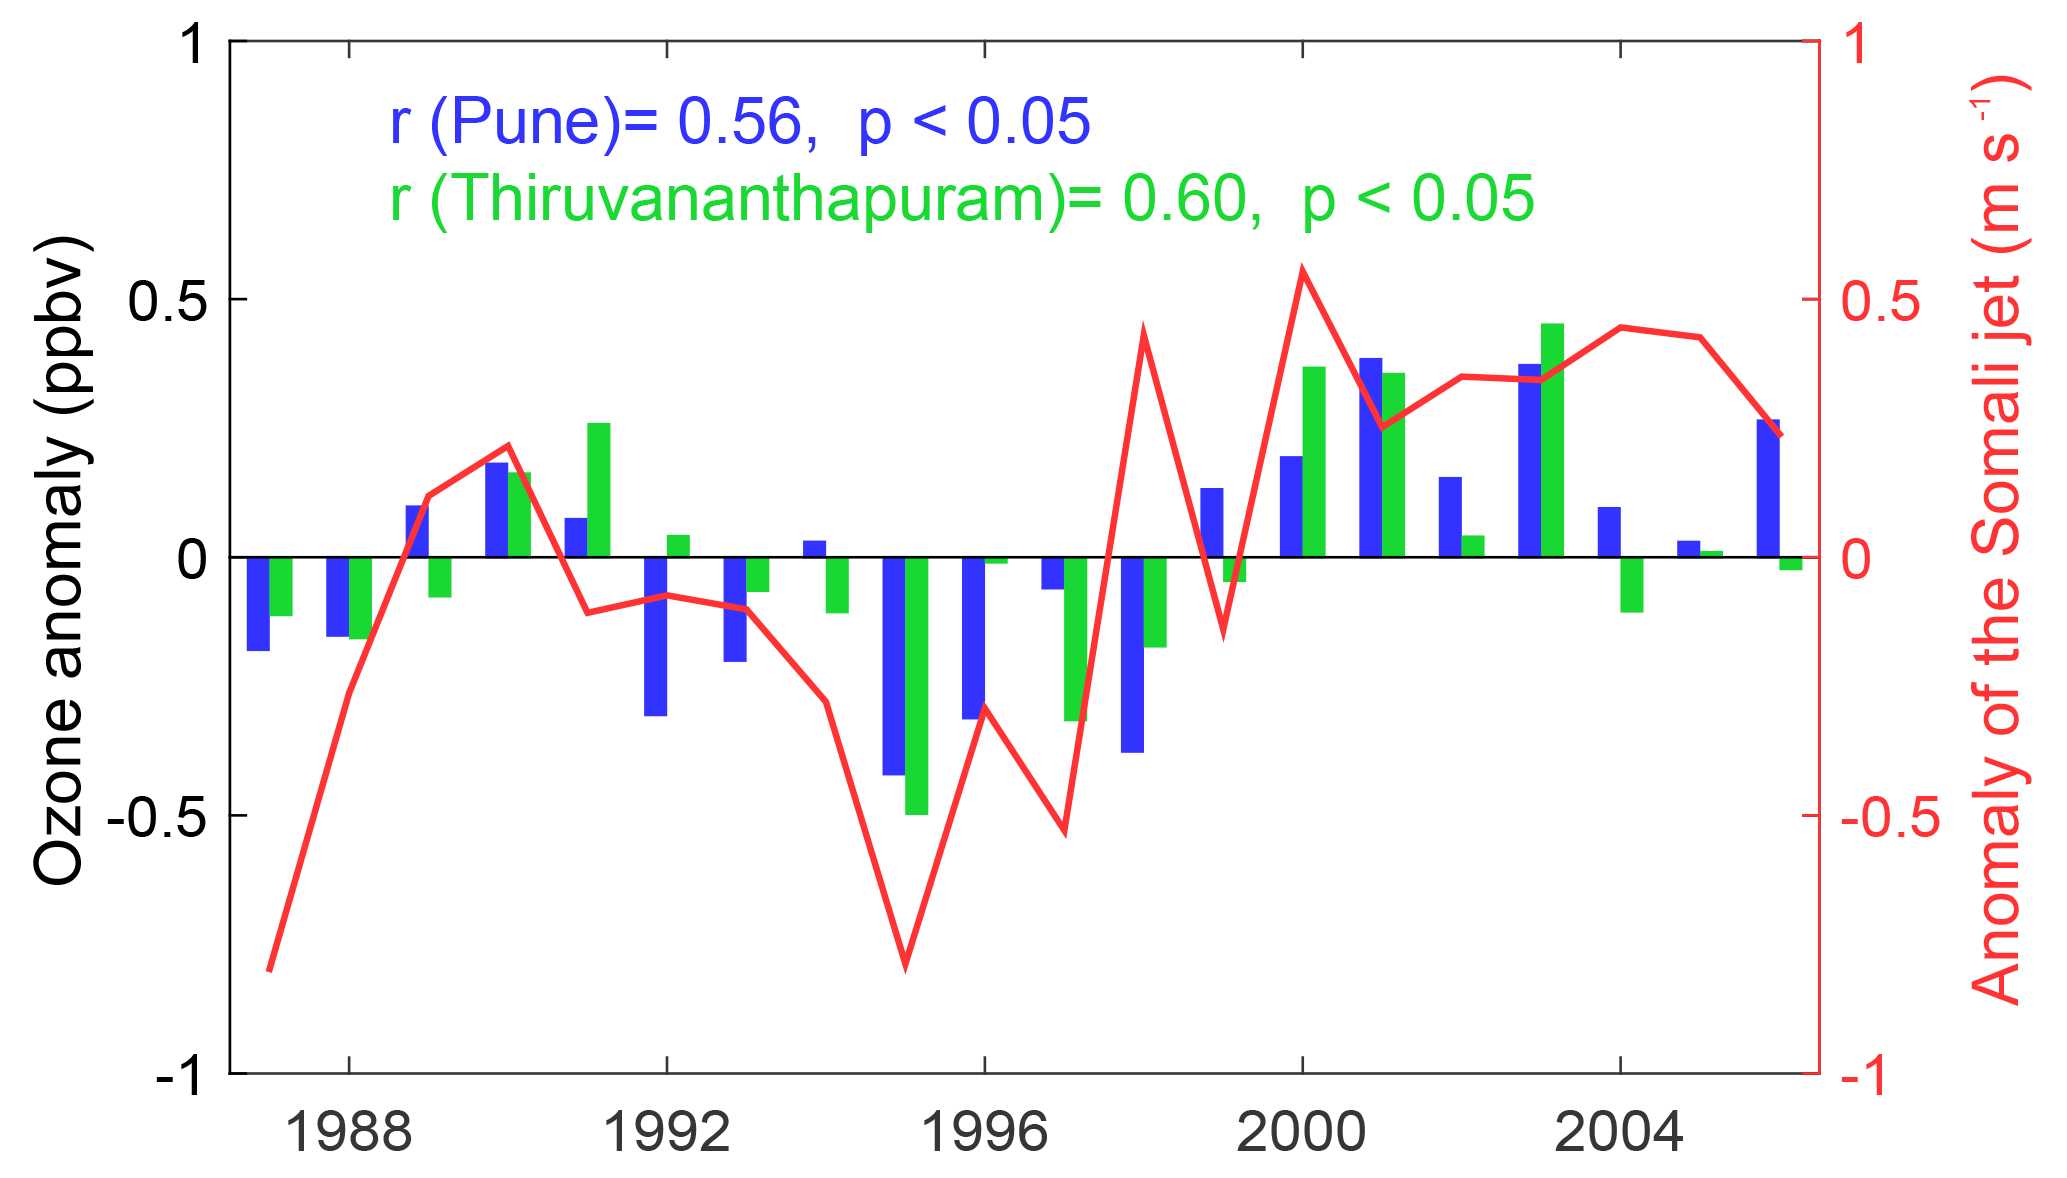
Figure 17Interannual variation of the anomaly of the strength of the Somali jet and ozone from SHAF at two Indian sites, Pune and Thiruvananthapuram, in the lower troposphere in NH summer from 1987 to 2006.
To search for a connection between the Somali jet and the imported SHAF ozone over western India, we use an index, proposed by Li and Li (2014), to indicate the intensity of the Somali jet. The index is calculated as the mean meridional wind at 850 hPa in the domain shown in Fig. 16b. Li and Li (2014) correlated the Somali jet and other cross-equatorial flows using the index. Figure 17 shows the anomaly of SHAF ozone averaged in the lower troposphere at Pune and Thiruvananthapuram during NH summer from 1987 to 2006. Positive correlations are found between the anomaly and the intensity of the Somali jet at both sites, with the correlation coefficients over 0.56, significant at the 95 % level.
We have characterized the transport of African ozone to Asia according to the simulations of a global chemical transport model, GEOS-Chem, for 20 years from 1987 to 2006. The ozone generated in the African troposphere is tracked using the GEOS-Chem tagged tracer simulation. Combining this with analysis of trajectory simulations using HYSPLIT and meteorological data of winds and OLR, we draw conclusions through discussion as follows.
-
In Asia, imported African ozone shows strong seasonality that varies greatly with latitude, longitude, and altitude in the troposphere (Figs. 5–6). The influence of African ozone mainly prevails in Asia south of 40∘ N. From 5 to 40∘ N, imported African ozone is largest from March to May (10–16 ppbv) and lowest during July–October (2–6 ppbv) in the Asian upper troposphere (Fig. 5a). In the middle troposphere, imported African ozone is at a maximum from January to March (10–16 ppbv) and at a minimum from July to September (2–4 ppbv). Near the surface, the African influence is small (below 6 ppbv). Overall, the influence of African ozone peaks in the Asian middle and upper troposphere between 20 and 30∘ N in NH winter and spring. Over 5–40∘ N, the mean fractional contribution of imported African ozone to the overall ozone concentrations in Asia is largest during NH winter in the middle troposphere (∼ 18 %) and lowest in NH summer throughout the tropospheric column (∼ 6 %).
-
Both the tagged ozone and the trajectory simulations show that the Hadley cell connects the subtropical westerlies to form a transport route from Africa to Asia (Figs. 10–13). This is a primary pathway that occurs throughout the year. It takes 4–6 days for African ozone to reach Asia depending on the season and the initial altitude and latitude of the air mass; i.e., it is faster in NH winter than in NH summer, faster at higher altitudes than at lower altitudes, and faster at higher latitudes than at lower latitudes (Fig. 13). The second transport pathway only appears in NH summer that runs from eastern Africa near the equator to the Indian lower troposphere (Figs. 13h and i). It takes 6 or more days for African ozone to reach Asia along this pathway.
-
The seasonality of African ozone influence on Asia results from the collective effects of meteorology, chemistry, and ozone precursor emissions in the source and receptor regions and between them. For the primary transport pathway, ozone and ozone precursors from various sources in Africa can be efficiently uplifted to high altitudes by the ITCZ. The African ozone in the middle and upper troposphere can be transported northward along the upper branch of the Hadley circulation and then eastward to Asia along the NH subtropical westerlies in the middle and upper troposphere. Therefore, the seasonal swings of the Hadley cell and NH subtropical westerlies play a dominant role in determining the seasonality of this transport pathway. Consequently, imported African ozone in Asia is lowest in NH summer, increasing toward both NH spring and NH autumn. In NH spring, there are more biogenic and lightning NOx emissions than in NH winter. These precursors are uplifted by the ITCZ, causing more ozone to be present in the upper layers than in NH winter. Consequently, there is more African ozone to be transported to the Asian upper troposphere in NH spring than in winter (Figs. 5a and 6a). Although more ozone appears in Africa in NH autumn than in spring, there is less imported African ozone over Asia in NH autumn than in spring (Figs. 5 and 6a), likely due to the fact that the elevated ozone in NHAF is located at higher altitudes in NH spring and the NH subtropical westerlies are stronger in NH spring. In NH summer, although the ozone outflow from Africa is high, the ozone hardly reaches Asia because of the blocking by the Saharan High, Arabian High, and Tibetan High along the transport pathway in the middle and upper troposphere, in addition to the northward swing of the westerlies. Finally, the ITCZ in Africa, combined with the geographic variations in ozone precursor emissions with season, can modulate the seasonality of transport of African ozone to Asia. When the ITCZ coincides with the ozone precursor emissions from biogenic and biomass burning emissions, in addition to enhanced NOx emissions from lightning, strong ozone export from Africa is resultant, such as in NH spring.
-
The interannual variation of the transport of African ozone to Asia is closely related to the intensity of the ITCZ in Africa in NH winter. Positive correlations are found between the intensity of the ITCZ in Africa and imported African ozone over Asia (r=0.64 at 200 hPa, r=0.46 at 600 hPa, and r=0.61 at 975 hPa, and p<0.05 for the three layers) (Fig. 14). The stronger the ITCZ in a NH winter is, the more ozone and its precursors from the surface emissions can be uplifted. In the meantime, more lightning NOx is produced. Furthermore, the interhemispheric transport of ozone from SHAF is enhanced. Consequently, more African ozone can be transported to Asia.
-
Ozone from NHAF makes up over 80 % of the total imported African ozone in the Asian troposphere in all layers and seasons, but with two exceptions in which ozone from SHAF becomes larger than 20 % of the total imported African ozone (Figs. 7 and 15). The first exception occurs in the Asian upper troposphere during NH winter, corresponding to the primary transport pathway in NH winter (Fig. 7). In this season, the ITCZ swings to its southernmost position in Africa and the convective divergence over the ITCZ in the upper troposphere is enhanced, resulting in more interhemispheric transport of ozone from SHAF. The interhemispheric transport along this pathway is strongest in NH winter and weakest in NH summer (Figs. 7 and 15). The second exception takes place in the Asian lower troposphere during NH summer. The SHAF ozone is transported along the Somali jet, which is the second transport pathway, from eastern Africa near the equator to India (Fig. 16b), forming an African ozone maximum in the lower troposphere from the tropics to 15∘ N in NH summer (Fig. 5c). We find that the intensities of the ITCZ in Africa and the Somali jet can each explain approximately 30 % of the interannual variations in the transport of ozone from SHAF to Asia in the two cases (Figs. 14a and 17).
This study provides an enhanced understanding of the source–receptor relationship of ozone transport from Africa to Asia. The findings on the transport routes from this study may also be applicable to other atmospheric pollutants with similar lifetimes, such as carbon monoxide. Our analysis is based on the simulations from the GEOS-Chem and HYSPLIT models, both of which have their own biases associated with emission inventories, parameterization schemes, and input data. The influences of African ozone can be further assessed by separating different emission sources.
The ozonesonde data (http://www.woudc.org) were acquired from the World Ozone and Ultraviolet Radiation Data Center under the World Meteorological Organization. The TES ozone data (https://eosweb.larc.nasa.gov/project/tes/tes_table) were acquired from the NASA Langley Atmospheric Science Data Center. The NCEP/NCAR reanalysis (https://www.esrl.noaa.gov/psd/data/gridded/data.ncep.reanalysis.html) and OLR data https://www.esrl.noaa.gov/psd/data/gridded/data.interp_OLR.html) are from the NOAA Earth System Research Laboratory (2018a, b).
The supplement related to this article is available online at: https://doi.org/10.5194/acp-18-4251-2018-supplement.
The authors declare that they have no conflict of interest.
This article is part of the special issue “Global and regional assessment of intercontinental transport of air pollution: results from HTAP, AQMEII and MICS”. It is not associated with a conference.
We gratefully acknowledge that the GEOE-Chem model has been developed and
managed by the Atmospheric Chemistry Modeling Group at Harvard University.
The HYSPLIT (Hybrid Single-Particle Lagrangian Integrated Trajectory Model)
model is developed by NOAA Air Resources Laboratory, driven by the NCEP
reanalysis data provided by NOAA/OAR/ESRL PSD, Boulder, Colorado, USA. The
ozonesonde data were acquired from the World Ozone and Ultraviolet
Radiation Data Center under the World Meteorological
Organization. The TES ozone data were acquired from the NASA Langley
Atmospheric Science Data Center. The NCEP/NCAR reanalysis and OLR data are
from the NOAA Earth System Research Laboratory. This research is supported by
the Chinese Ministry of Science and Technology under the National Key Basic
Research Development Program (2014CB441203), the Natural Science Foundation
of China (41375140 and 91544230), and the Chinese Ministry of Science and
Technology under the National Key Basic Research Development Program
(2016YFA060020). We are grateful to the anonymous reviewers for their
valuable and helpful reviews.
Edited by: Frank Dentener
Reviewed by: two anonymous referees
Aghedo, A. M., Schultz, M. G., and Rast, S.: The influence of African air pollution on regional and global tropospheric ozone, Atmos. Chem. Phys., 7, 1193–1212, https://doi.org/10.5194/acp-7-1193-2007, 2007.
Akritidis, D., Pozzer, A., Zanis, P., Tyrlis, E., Škerlak, B., Sprenger, M., and Lelieveld, J.: On the role of tropopause folds in summertime tropospheric ozone over the eastern Mediterranean and the Middle East, Atmos. Chem. Phys., 16, 14025–14039, https://doi.org/10.5194/acp-16-14025-2016, 2016.
Albrecht, R. I., Goodman, S. J., Buechler, D. E., Blakeslee, R. J., and Christian, H. J.: Where are the lightning hotspots on Earth?, B. Am. Meteorol. Soc., 97, 2051–2068, https://doi.org/10.1175/BAMS-D-14-00193.1, 2016.
Allen, D., Pickering, K., Duncan, B., and Damon, M.: Impact of lightning NO emissions on North American photochemistry as determined using the Global Modeling Initiative (GMI) model, J. Geophys. Res., 115, D22301, https://doi.org/10.1029/2010JD014062, 2010.
Anenberg, S. C., Horowitz, L. W., Tong, D. Q., and West, J. J.: An estimate of the global burden of anthropogenic ozone and fine particulate matter on premature human mortality using atmospheric modeling, Environ. Health. Persp., 118, 1189–1195, https://doi.org/10.1289/ehp.0901220, 2010.
Avery, M., Westberg, D., Fuelberg, H., Newell, R., Anderson, B., Vay, S., Sachse, G., and Blake, D.: Chemical transport across the ITCZ in the central Pacific during an El Nino-Southern Oscillation cold phase event in March–April 1999, J. Geophys. Res., 106, 32539–32553, https://doi.org/10.1029/2001JD000728, 2001.
Avila, E. E., Bürgesser, R. E., Castellano, N. E., Collier, A. B., Compagnucci, R. H., and Hughes, A. R.: Correlations between deep convection and lightning activity on a global scale, J. Atmos. Sol.-Terr. Phy., 72, 1114–1121, https://doi.org/10.1016/j.jastp.2010.07.019, 2010.
Bey, I., Jacob, D. J., Logan, J. A., and Yantosca, R. M.: Asian chemical outflow to the Pacific in spring: Origins, pathways, and budgets, J. Geophys. Res., 106, 23073–23095, https://doi.org/10.1029/2001jd000807, 2001a.
Bey, I., Jacob, D. J., Yantosca, R. M., Logan, J. A., Field, B. D., Fiore, A. M., Li, Q., Liu, H. Y., Mickley, L. J., and Schultz, M. G.: Global modeling of tropospheric chemistry with assimilated meteorology: Model description and evaluation, J. Geophys. Res., 106, 23073–23095, https://doi.org/10.1029/2001jd000806, 2001b.
Bouarar, I., Law, K. S., Pham, M., Liousse, C., Schlager, H., Hamburger, T., Reeves, C. E., Cammas, J.-P., Nédéléc, P., Szopa, S., Ravegnani, F., Viciani, S., D'Amato, F., Ulanovsky, A., and Richter, A.: Emission sources contributing to tropospheric ozone over Equatorial Africa during the summer monsoon, Atmos. Chem. Phys., 11, 13395–13419, https://doi.org/10.5194/acp-11-13395-2011, 2011.
Chakraborty, T., Beig, G., Dentener, F. J., and Wild, O.: Atmospheric transport of ozone between Southern and Eastern Asia, Sci. Total Environ., 523, 28–39, https://doi.org/10.1016/j.scitotenv.2015.03.066, 2015.
Choi, H.-D., Liu, H., Crawford, J. H., Considine, D. B., Allen, D. J., Duncan, B. N., Horowitz, L. W., Rodriguez, J. M., Strahan, S. E., Zhang, L., Liu, X., Damon, M. R., and Steenrod, S. D.: Global O3–CO correlations in a chemistry and transport model during July–August: evaluation with TES satellite observations and sensitivity to input meteorological data and emissions, Atmos. Chem. Phys., 17, 8429–8452, https://doi.org/10.5194/acp-17-8429-2017, 2017.
Christian, H. J., Blakeslee, R. J., Boccippio, D. J., Boeck, W. L., Buechler, D. E., Driscoll, K. T., Goodman, S. J., Hall, J. M., Koshak, W. J., and Mach, D. M.: Global frequency and distribution of lightning as observed from space by the Optical Transient Detector, J. Geophys. Res., 108, ACL 4-1–ACL 4-15, https://doi.org/10.1029/2002JD002347, 2003.
Clain, G., Baray, J. L., Delmas, R., Diab, R., Leclair de Bellevue, J., Keckhut, P., Posny, F., Metzger, J. M., and Cammas, J. P.: Tropospheric ozone climatology at two Southern Hemisphere tropical/subtropical sites, (Reunion Island and Irene, South Africa) from ozonesondes, LIDAR, and in situ aircraft measurements, Atmos. Chem. Phys., 9, 1723–1734, https://doi.org/10.5194/acp-9-1723-2009, 2009.
Collier, A. B. and Hughes, A. R.: Lightning and the African ITCZ, J. Atmos. Sol.-Terr. Phy., 73, 2392–2398, https://doi.org/10.1016/j.jastp.2011.08.010, 2011.
Cooper, O., Moody, J., Parrish, D., Trainer, M., Ryerson, T., Holloway, J., Hübler, G., Fehsenfeld, F., and Evans, M.: Trace gas composition of midlatitude cyclones over the western North Atlantic Ocean: A conceptual model, J. Geophys. Res., 107, 5–24, https://doi.org/10.1029/2001jd000901, 2002.
Cooper, O., Parrish, D., Stohl, A., Trainer, M., Nédélec, P., Thouret, V., Cammas, J.-P., Oltmans, S., Johnson, B., and Tarasick, D.: Increasing springtime ozone mixing ratios in the free troposphere over western North America, Nature, 463, 344–348, https://doi.org/10.1038/nature08708, 2010.
Cooper, O., Oltmans, S., Johnson, B., Brioude, J., Angevine, W., Trainer, M., Parrish, D., Ryerson, T., Pollack, I., and Cullis, P.: Measurement of western US baseline ozone from the surface to the tropopause and assessment of downwind impact regions, J. Geophys. Res., 116, 898–908, https://doi.org/10.1029/2011JD016095, 2011.
Cooper, O. R., Langford, A. O., Parrish, D. D., and Fahey, D. W.: Challenges of a lowered US ozone standard, Science, 348, 1096–1097, https://doi.org/10.1126/science.aaa5748, 2015.
Derwent, R. G., Utembe, S. R., Jenkin, M. E., and Shallcross, D. E.: Tropospheric ozone production regions and the intercontinental origins of surface ozone over Europe, Atmos. Environ., 112, 216–224, https://doi.org/10.1016/j.atmosenv.2015.04.049, 2015.
Doherty, O. M., Riemer, N., and Hameed, S.: Control of Saharan mineral dust transport to Barbados in winter by the Intertropical Convergence Zone over West Africa, J. Geophys. Res., 117, 161–169, https://doi.org/10.1029/2012JD017767, 2012.
Doherty, O. M., Riemer, N., and Hameed, S.: Role of the convergence zone over West Africa in controlling Saharan mineral dust load and transport in the boreal summer, Tellus B, 66, 759–763, https://doi.org/10.3402/tellusb.v66.23191, 2014.
Doherty, R., Wild, O., Shindell, D., Zeng, G., MacKenzie, I., Collins, W., Fiore, A. M., Stevenson, D., Dentener, F., and Schultz, M.: Impacts of climate change on surface ozone and intercontinental ozone pollution: A multi-model study, J. Geophys. Res., 118, 3744–3763, https://doi.org/10.1002/jgrd.50266, 2013.
Doherty, R. M.: Atmospheric chemistry: Ozone pollution from near and far, Nat. Geosci., 8, 664–665, https://doi.org/10.1038/ngeo2497, 2015.
Doherty, R. M., Orbe, C., Zeng, G., Plummer, D. A., Prather, M. J., Wild, O., Lin, M., Shindell, D. T., and Mackenzie, I. A.: Multi-model impacts of climate change on pollution transport from global emission source regions, Atmos. Chem. Phys., 17, 14219–14237, https://doi.org/10.5194/acp-17-14219-2017, 2017.
Draxler, R. R. and Hess, G.: An overview of the HYSPLIT_4 modelling system for trajectories, Aust. Meteorol. Mag., 47, 295–308, 1998.
Fiore, A. M., Jacob, D. J., Bey, I., Yantosca, R. M., Field, B. D., Fusco, A. C., and Wilkinson, J. G.: Background ozone over the United States in summer: Origin, trend, and contribution to pollution episodes, J. Geophys. Res., 107, ACH 11-1–ACH 11-25, https://doi.org/10.1029/2001JD000982, 2002.
Fiore, A. M., Dentener, F., Wild, O., Cuvelier, C., Schultz, M., Hess, P., Textor, C., Schulz, M., Doherty, R., and Horowitz, L.: Multimodel estimates of intercontinental source-receptor relationships for ozone pollution, J. Geophys. Res., 114, 83–84, https://doi.org/10.1029/2008JD010816, 2009.
Fleming, Z. L., Monks, P. S., and Manning, A. J.: Review: Untangling the influence of air-mass history in interpreting observed atmospheric composition, Atmos. Res., 104, 1–39, https://doi.org/10.1016/j.atmosres.2011.09.009, 2012.
Fukutomi, Y. and Yasunari, T.: Structure and characteristics of submonthly-scale waves along the Indian Ocean ITCZ, Clim. Dynam., 40, 1819–1839, https://doi.org/10.1007/s00382-012-1417-x, 2013.
Galmarini, S., Koffi, B., Solazzo, E., Keating, T., Hogrefe, C., Schulz, M., Benedictow, A., Griesfeller, J. J., Janssens-Maenhout, G., Carmichael, G., Fu, J., and Dentener, F.: Technical note: Coordination and harmonization of the multi-scale, multi-model activities HTAP2, AQMEII3, and MICS-Asia3: simulations, emission inventories, boundary conditions, and model output formats, Atmos. Chem. Phys., 17, 1543–1555, https://doi.org/10.5194/acp-17-1543-2017, 2017.
Garny, H. and Randel, W. J.: Transport pathways from the Asian monsoon anticyclone to the stratosphere, Atmos. Chem. Phys., 16, 2703–2718, https://doi.org/10.5194/acp-16-2703-2016, 2016.
Giglio, L., Randerson, J. T., and Werf, G. R.: Analysis of daily, monthly, and annual burned area using the fourth-generation global fire emissions database (GFED4), J. Geophys. Res., 118, 317–328, https://doi.org/10.1002/jgrg.20042, 2013.
Guenther, A. B., Jiang, X., Heald, C. L., Sakulyanontvittaya, T., Duhl, T., Emmons, L. K., and Wang, X.: The Model of Emissions of Gases and Aerosols from Nature version 2.1 (MEGAN2.1): an extended and updated framework for modeling biogenic emissions, Geosci. Model Dev., 5, 1471–1492, https://doi.org/10.5194/gmd-5-1471-2012, 2012.
Guerova, G., Bey, I., Attié, J.-L., Martin, R. V., Cui, J., and Sprenger, M.: Impact of transatlantic transport episodes on summertime ozone in Europe, Atmos. Chem. Phys., 6, 2057–2072, https://doi.org/10.5194/acp-6-2057-2006, 2006.
Hack, J. J.: Parameterization of moist convection in the National Center for Atmospheric Research community climate model (CCM2), J. Geophys. Res., 99, 5551–5568, https://doi.org/10.1029/93jd03478, 1994.
Hartley, D. E. and Black, R. X.: Mechanistic analysis of interhemispheric transport, Geophys. Res. Lett., 22, 2945–2948, https://doi.org/10.1029/95gl02823, 1995.
Hollaway, M. J., Arnold, S. R., Challinor, A. J., and Emberson, L. D.: Intercontinental trans-boundary contributions to ozone-induced crop yield losses in the Northern Hemisphere, Biogeosciences, 9, 271–292, https://doi.org/10.5194/bg-9-271-2012, 2012.
Holloway, T., Sakurai, T., Han, Z., Ehlers, S., Spak, S. N., Horowitz, L. W., Carmichael, G. R., Streets, D. G., Hozumi, Y., and Ueda, H.: MICS-Asia II: Impact of global emissions on regional air quality in Asia, Atmos. Environ., 42, 3543–3561, https://doi.org/10.1016/j.atmosenv.2007.10.022, 2008.
HTAP: Hemispheric transport of air pollution 2010, United Nations, edited by: Dentener, F., Keating, T. and Akimoto, H., New York and Geneva, 2010.
Hu, Y., Li, D., and Liu, J.: Abrupt seasonal variation of the ITCZ and the Hadley circulation, Geophys. Res. Lett., 34, 5407–5413, https://doi.org/10.1029/2007GL030950, 2007.
Huang, M., Carmichael, G. R., Pierce, R. B., Jo, D. S., Park, R. J., Flemming, J., Emmons, L. K., Bowman, K. W., Henze, D. K., Davila, Y., Sudo, K., Jonson, J. E., Tronstad Lund, M., Janssens-Maenhout, G., Dentener, F. J., Keating, T. J., Oetjen, H., and Payne, V. H.: Impact of intercontinental pollution transport on North American ozone air pollution: an HTAP phase 2 multi-model study, Atmos. Chem. Phys., 17, 5721–5750, https://doi.org/10.5194/acp-17-5721-2017, 2017.
Huang, R., Chen, J., Wang, L., and Lin, Z.: Characteristics, processes, and causes of the spatio-temporal variabilities of the East Asian monsoon system, Adv. Atmos. Sci., 29, 910–942, https://doi.org/10.1007/s00376-012-2015-x, 2012.
Huntrieser, H., Heland, J., Schlager, H., Forster, C., Stohl, A., Aufmhoff, H., Arnold, F., Scheel, H., Campana, M., and Gilge, S.: Intercontinental air pollution transport from North America to Europe: Experimental evidence from airborne measurements and surface observations, J. Geophys. Res., 110, 372–384, https://doi.org/10.1029/2004JD005045, 2005.
Ikeda, K., Tanimoto, H., Sugita, T., Akiyoshi, H., Kanaya, Y., Zhu, C., and Taketani, F.: Tagged tracer simulations of black carbon in the Arctic: transport, source contributions, and budget, Atmos. Chem. Phys., 17, 10515–10533, https://doi.org/10.5194/acp-17-10515-2017, 2017.
Jaffe, D., McKendry, I., Anderson, T., and Price, H.: Six `new' episodes of trans-Pacific transport of air pollutants, Atmos. Environ., 37, 391–404, https://doi.org/10.1016/s1352-2310(02)00862-2, 2003.
Jiang, Z., Miyazaki, K., Worden, J. R., Liu, J. J., Jones, D. B. A., and Henze, D. K.: Impacts of anthropogenic and natural sources on free tropospheric ozone over the Middle East, Atmos. Chem. Phys., 16, 6537–6546, https://doi.org/10.5194/acp-16-6537-2016, 2016.
Kalnay, E., Kanamitsu, M., Kistler, R., Collins, W., Deaven, D., Gandin, L., Iredell, M., Saha, S., White, G., and Woollen, J.: The NCEP/NCAR 40-year reanalysis project, B. Am. Meteorol. Soc., 77, 437–471, https://doi.org/10.1175/1520-0477(1996)077<0437:tnyrp>2.0.co;2, 1996.
Karamchandani, P., Long, Y., Pirovano, G., Balzarini, A., and Yarwood, G.: Source-sector contributions to European ozone and fine PM in 2010 using AQMEII modeling data, Atmos. Chem. Phys., 17, 5643–5664, https://doi.org/10.5194/acp-17-5643-2017, 2017.
Kim, M. J., Park, R. J., Ho, C.-H., Woo, J.-H., Choi, K.-C., Song, C.-K., and Lee, J.-B.: Future ozone and oxidants change under the RCP scenarios, Atmos. Environ., 101, 103–115, https://doi.org/10.1016/j.atmosenv.2014.11.016, 2015.
Knowland, K. E., Doherty, R. M., Hodges, K. I., and Ott, L. E.: The influence of mid-latitude cyclones on European background surface ozone, Atmos. Chem. Phys., 17, 12421–12447, https://doi.org/10.5194/acp-17-12421-2017, 2017.
Koumoutsaris, S., Bey, I., Generoso, S., and Thouret, V.: Influence of El Niño-Southern Oscillation on the interannual variability of tropospheric ozone in the northern midlatitudes, J. Geophys. Res., 113, D19301, https://doi.org/10.1029/2007JD009753, 2008.
Kuhns, H., Green, M., and Etyemezian, V.: Big Bend Regional Aerosol and Visibility Observational (BRAVO) Study Emissions Inventory, Report prepared for BRAVO Steering Committee, Desert Research Institute, Las Vegas, Nevada, USA, 2003.
Lacis, A. A., Wuebbles, D. J., and Logan, J. A.: Radiative forcing of climate by changes in the vertical distribution of ozone, J. Geophys. Res., 95, 9971–9981, https://doi.org/10.1029/jd095id07p09971, 1990.
Lal, S., Venkataramani, S., Chandra, N., Cooper, O. R., Brioude, J., and Naja, M.: Transport effects on the vertical distribution of tropospheric ozone over western India, J. Geophys. Res., 119, 10012–10026, https://doi.org/10.1002/2014JD021854, 2014.
Lefohn, A. S., Malley, C. S., Simon, H., Wells, B., Xu, X., Zhang, L., and Wang, T.: Responses of human health and vegetation exposure metrics to changes in ozone concentration distributions in the European Union, United States, and China, Atmos. Environ., 152, 123–145, https://doi.org/10.1016/j.atmosenv.2016.12.025, 2017.
Lelieveld, J. and Dentener, F. J.: What controls tropospheric ozone?, J. Geophys. Res., 105, 3531–3551, https://doi.org/10.1029/1999jd901011, 2000.
Lewis, A., Evans, M., Methven, J., Watson, N., Lee, J., Hopkins, J., Purvis, R., Arnold, S., McQuaid, J., and Whalley, L.: Chemical composition observed over the mid-Atlantic and the detection of pollution signatures far from source regions, J. Geophys. Res., 112, 815–838, https://doi.org/10.1029/2006JD007584, 2007.
Li, C. and Li, S.: Interannual Seesaw between the Somali and the Australian Cross-Equatorial Flows and its Connection to the East Asian Summer Monsoon, J. Climate, 27, 3966–3981, https://doi.org/10.1175/JCLI-D-13-00288.1, 2014.
Li, X., Liu, J., Mauzerall, D. L., Emmons, L. K., Walters, S., Horowitz, L. W., and Tao, S.: Effects of trans-Eurasian transport of air pollutants on surface ozone concentrations over Western China, J. Geophys. Res., 119, 12338–12354, https://doi.org/10.1002/2014jd021936, 2014.
Liebmann, B. and Smith, C. A.: Description of a complete (interpolated) outgoing longwave radiation dataset, B. Am. Meteorol. Soc., 77, 1275–1277, 1996.
Lin, M., Horowitz, L. W., Payton, R., Fiore, A. M., and Tonnesen, G.: US surface ozone trends and extremes from 1980 to 2014: quantifying the roles of rising Asian emissions, domestic controls, wildfires, and climate, Atmos. Chem. Phys., 17, 2943–2970, https://doi.org/10.5194/acp-17-2943-2017, 2017.
Liu, H., Jacob, D. J., Chan, L. Y., Oltmans, S. J., Bey, I., Yantosca, R. M., Harris, J. M., Duncan, B. N., and Martin, R. V.: Sources of tropospheric ozone along the Asian Pacific Rim: An analysis of CO in the tropical troposphere using Aura satellite data and the GEOS-Chem model: ozonesonde observations, J. Geophys. Res., 107, ACH 3-1–ACH 3-19, https://doi.org/10.1029/2001JD002005, 2002.
Liu, J., Mauzerall, D. L., and Horowitz, L. W.: Analysis of seasonal and interannual variability of transpacific transport, J. Geophys. Res., 110, D04302, https://doi.org/10.1029/2004JD005207, 2005.
Liu, J., Logan, J. A., Jones, D. B. A., Livesey, N. J., Megretskaia, I., Carouge, C., and Nedelec, P.: Analysis of CO in the tropical troposphere using Aura satellite data and the GEOS-Chem model: insights into transport characteristics of the GEOS meteorological products, Atmos. Chem. Phys., 10, 12207–12232, https://doi.org/10.5194/acp-10-12207-2010, 2010.
Liu, J. J., Jones, D., Worden, J. R., Noone, D., Parrington, M., and Kar, J.: Analysis of the summertime buildup of tropospheric ozone abundances over the Middle East and North Africa as observed by the Tropospheric Emission Spectrometer instrument, J. Geophys. Res., 114, 730–734, https://doi.org/10.1029/2008JD010993, 2009.
Liu, J. J., Jones, D., Zhang, S., and Kar, J.: Influence of interannual variations in transport on summertime abundances of ozone over the Middle East, J. Geophys. Res., 116, 999–1010, https://doi.org/10.1029/2011JD016188, 2011.
Long, M. S., Yantosca, R., Nielsen, J. E., Keller, C. A., da Silva, A., Sulprizio, M. P., Pawson, S., and Jacob, D. J.: Development of a grid-independent GEOS-Chem chemical transport model (v9-02) as an atmospheric chemistry module for Earth system models, Geosci. Model Dev., 8, 595–602, https://doi.org/10.5194/gmd-8-595-2015, 2015.
Marais, E. A., Jacob, D. J., Kurosu, T. P., Chance, K., Murphy, J. G., Reeves, C., Mills, G., Casadio, S., Millet, D. B., Barkley, M. P., Paulot, F., and Mao, J.: Isoprene emissions in Africa inferred from OMI observations of formaldehyde columns, Atmos. Chem. Phys., 12, 6219–6235, https://doi.org/10.5194/acp-12-6219-2012, 2012.
Marais, E. A., Jacob, D. J., Guenther, A., Chance, K., Kurosu, T. P., Murphy, J. G., Reeves, C. E., and Pye, H. O. T.: Improved model of isoprene emissions in Africa using Ozone Monitoring Instrument (OMI) satellite observations of formaldehyde: implications for oxidants and particulate matter, Atmos. Chem. Phys., 14, 7693–7703, https://doi.org/10.5194/acp-14-7693-2014, 2014.
Martin, R. V., Sauvage, B., Folkins, I., Sioris, C. E., Boone, C., Bernath, P., and Ziemke, J.: Space-based constraints on the production of nitric oxide by lightning, J. Geophys. Res., 112, D09309, https://doi.org/10.1029/2006JD007831, 2007.
Miyazaki, K., Eskes, H. J., Sudo, K., and Zhang, C.: Global lightning NOx production estimated by an assimilation of multiple satellite data sets, Atmos. Chem. Phys., 14, 3277–3305, https://doi.org/10.5194/acp-14-3277-2014, 2014.
Monks, P. S., Archibald, A. T., Colette, A., Cooper, O., Coyle, M., Derwent, R., Fowler, D., Granier, C., Law, K. S., Mills, G. E., Stevenson, D. S., Tarasova, O., Thouret, V., von Schneidemesser, E., Sommariva, R., Wild, O., and Williams, M. L.: Tropospheric ozone and its precursors from the urban to the global scale from air quality to short-lived climate forcer, Atmos. Chem. Phys., 15, 8889–8973, https://doi.org/10.5194/acp-15-8889-2015, 2015.
Mounier, F. and Janicot, S.: Evidence of two independent modes of convection at intraseasonal timescale in the West African summer monsoon, Geophys. Res. Lett., 31, 2876–2877, https://doi.org/10.1029/2004GL020665, 2004.
Myhre, G., Shindell, D., Bréon, F.-M., Collins, W., Fuglestvedt, J., Huang, J., Koch, D., Lamarque, J.-F., Lee, D., Mendoza, B., Nakajima, T., Robock, A., Stephens, G., Takemura, T., and Zhang, H.: Anthropogenic and Natural Radiative Forcing, In: Climate Change 2013: The Physical Science Basis, Contribution of Working Group I to the Fifth Assessment Report of the Intergovernmental Panel on Climate Change, Cambridge University Press, Cambridge, United Kingdom and New York, NY, USA, 659–740, 2013.
Nagashima, T., Ohara, T., Sudo, K., and Akimoto, H.: The relative importance of various source regions on East Asian surface ozone, Atmos. Chem. Phys., 10, 11305–11322, https://doi.org/10.5194/acp-10-11305-2010, 2010.
NASA Langley Atmospheric Science Data Center: TES ozone data, available at: https://eosweb.larc.nasa.gov/project/tes/tes_table, last access: 26 March 2018.
Nassar, R., Logan, J. A., Worden, H. M., Megretskaia, I. A., Bowman, K. W., Osterman, G. B., Thompson, A. M., Tarasick, D. W., Austin, S., Claude, H., Dubey, M. K., Hocking, W. K., Johnson, B. J., Joseph, E., Merrill, J., Morris, G. A., Newchurch, M., Oltmans, S. J., Posny, F., Schmidlin, F. J., Vömel, H., Whiteman, D. N., and Witte, J. C.: Validation of Tropospheric Emission Spectrometer (TES) nadir ozone profiles using ozonesonde measurements, J. Geophys. Res., 113, D15S17, https://doi.org/10.1029/2007JD008819, 2008.
Neu, J. L., Flury, T., Manney, G. L., Santee, M. L., Livesey, N. J., and Worden, J.: Tropospheric ozone variations governed by changes in stratospheric circulation, Nat. Geosci., 7, 340–344, https://doi.org/10.1038/NGEO2138, 2014.
Nicholson, S. E.: The intensity, location and structure of the tropical rainbelt over west Africa as factors in interannual variability, Int. J. Climatol., 28, 1775–1785, https://doi.org/10.1002/joc.1507, 2008.
Nicholson, S. E.: A revised picture of the structure of the “monsoon” and land ITCZ over West Africa, Clim. Dynam., 32, 1155–1171, https://doi.org/10.1007/s00382-008-0514-3, 2009.
Nicholson, S. E.: The West African Sahel: A Review of Recent Studies on the Rainfall Regime and Its Interannual Variability, ISRN Meteorology, 2013, 32, https://doi.org/10.1155/2013/453521, 2013.
Nicholson, S. E.: Climate and climatic variability of rainfall over eastern Africa, Rev. Geophys., 55, 590–635, https://doi.org/10.1002/2016RG000544, 2017.
NOAA Earth System Research Laboratory: NCEP/NCAR reanalysis, available at: https://www.esrl.noaa.gov/psd/data/gridded/data.ncep.reanalysis.html, last access: 26 March 2018a.
NOAA Earth System Research Laboratory: OLR data, available at: https://www.esrl.noaa.gov/psd/data/gridded/data.interp_OLR.html, last access: 26 March 2018b.
Nopmongcol, U., Liu, Z., Stoeckenius, T., and Yarwood, G.: Modeling intercontinental transport of ozone in North America with CAMx for the Air Quality Model Evaluation International Initiative (AQMEII) Phase 3, Atmos. Chem. Phys., 17, 9931–9943, https://doi.org/10.5194/acp-17-9931-2017, 2017.
Olivier, J. G. J. and Berdowski, J. J. M.: Global emissions sources and sinks, in: The Climate System, edited by: Berdowski, J., Guicherit, R., and Heij, B. J., 33–78. A. A. Balkema Publishers/Swets & Zeitlinger Publishers, Lisse, the Netherlands, 2001.
Ott, L. E., Pickering, K. E., Stenchikov, G. L., Allen, D. J., Decaria, A. J., Ridley, B., Lin, R. F., Lang, S., and Tao, W. K.: Production of lightning NOx and its vertical distribution calculated from three-dimensional cloud-scale chemical transport model simulations, J. Geophys. Res., 115, 288–303, https://doi.org/10.1029/2009JD011880, 2010.
Philip, S., Martin, R. V., and Keller, C. A.: Sensitivity of chemistry-transport model simulations to the duration of chemical and transport operators: a case study with GEOS-Chem v10-01, Geosci. Model Dev., 9, 1683–1695, https://doi.org/10.5194/gmd-9-1683-2016, 2016.
Pickering, K. E., Wang, Y., Tao, W. K., Price, C., and Müller, J. F.: Vertical distributions of lightning NOx for use in regional and global chemical transport models, J. Geophys. Res., 103, 31203–31216, https://doi.org/10.1029/98jd02651, 1998.
Piketh, S. J. and Walton, N. W.: Characteristics of Atmospheric Transport of Air Pollution for Africa, in: Intercontinental Transport of Air Pollution, edited by: Stohl, A., Springer Berlin Heidelberg, 173–197, 2004.
Pochanart, P., Akimoto, H., Kajii, Y., and Sukasem, P.: Carbon monoxide, regional-scale transport, and biomass burning in tropical continental Southeast Asia: Observations in rural Thailand, J. Geophys. Res., 108, 1337–1352, https://doi.org/10.1029/2002JD003360, 2003.
Pochanart, P., Wild, O., and Akimoto, H.: Air pollution import to and export from East Asia, Air Pollution, 99–130, 2004.
Pulles, T., Bolscher, M. V. H., Brand, R., and Visschedijk, A.: Assessment of Global Emissions from Fuel Combustion in the Final Decades of the 20th Century, TNO report A-R0132/B, Ned. Org. voor toegepast Natuurwet, Onderzoek, Apeldoorn, the Netherlands, 2007.
Raper, J. L., Kleb, M. M., Jacob, D. J., Davis, D. D., Newell, R. E., Fuelberg, H. E., Bendura, R. J., Hoell, J. M., and McNeal, R. J.: Pacific Exploratory Mission in the Tropical Pacific-PEM-Tropics B, March–April 1999, J. Geophys. Res., 106, 32401–32425, https://doi.org/10.1029/2000JD900833, 2001.
Ridder, T., Gerbig, C., Notholt, J., Rex, M., Schrems, O., Warneke, T., and Zhang, L.: Ship-borne FTIR measurements of CO and O3 in the Western Pacific from 43∘ N to 35∘ S: an evaluation of the sources, Atmos. Chem. Phys., 12, 815–828, https://doi.org/10.5194/acp-12-815-2012, 2012.
Rodríguez, S., Cuevas, E., Prospero, J. M., Alastuey, A., Querol, X., López-Solano, J., García, M. I., and Alonso-Pérez, S.: Modulation of Saharan dust export by the North African dipole, Atmos. Chem. Phys., 15, 7471–7486, https://doi.org/10.5194/acp-15-7471-2015, 2015.
Sauvage, B., Thouret, V., Cammas, J.-P., Gheusi, F., Athier, G., and Nédélec, P.: Tropospheric ozone over Equatorial Africa: regional aspects from the MOZAIC data, Atmos. Chem. Phys., 5, 311–335, https://doi.org/10.5194/acp-5-311-2005, 2005.
Sekiya, T. and Sudo, K.: Role of meteorological variability in global tropospheric ozone during 1970-2008, J. Geophys. Res., 117, D18303, https://doi.org/10.1029/2012JD018054, 2012.
Sekiya, T. and Sudo, K.: Roles of transport and chemistry processes in global ozone change on interannual and multidecadal time scales, J. Geophys. Res., 119, 4903–4921, https://doi.org/10.1002/2013JD020838, 2014.
Stein, A. F., Draxler, R. R., Rolph, G. D., Stunder, B. J. B., Cohen, M. D., and Ngan, F.: NOAA's HYSPLIT Atmospheric Transport and Dispersion Modeling System, B. Am. Meteorol. Soc., 96, 2059–2077, https://doi.org/10.1175/bams-d-14-00110.1, 2015.
Sudo, K. and Akimoto, H.: Global source attribution of tropospheric ozone: Long-range transport from various source regions, J. Geophys. Res., 112, D12302, https://doi.org/10.1029/2006JD007992, 2007.
Sultan, B. and Janicot, S.: Abrupt shift of the ITCZ over West Africa and intra-seasonal variability, Geophys. Res. Lett., 27, 3353–3356, https://doi.org/10.1029/1999gl011285, 2000.
Suzuki, T.: Seasonal variation of the ITCZ and its characteristics over central Africa, Theor. Appl. Climatol., 103, 39–60, https://doi.org/10.1007/s00704-010-0276-9, 2011.
Thompson, A. M.: Intercontinental Transport of Ozone from Tropical Biomass Burning, in: Intercontinental Transport of Air Pollution, edited by: Stohl, A., Springer, Berlin Heidelberg, 225–254, 2004.
Thompson, A. M., Miller, S. K., Tilmes, S., Kollonige, D. W., Witte, J. C., Oltmans, S. J., Johnson, B. J., Fujiwara, M., Schmidlin, F., and Coetzee, G.: Southern Hemisphere Additional Ozonesondes (SHADOZ) ozone climatology (2005–2009): Tropospheric and tropical tropopause layer (TTL) profiles with comparisons to OMI-based ozone products, J. Geophys. Res., 117, D23301, https://doi.org/10.1029/2011JD016911, 2012.
Thompson, A. M., Balashov, N. V., Witte, J. C., Coetzee, J. G. R., Thouret, V., and Posny, F.: Tropospheric ozone increases over the southern Africa region: bellwether for rapid growth in Southern Hemisphere pollution?, Atmos. Chem. Phys., 14, 9855–9869, https://doi.org/10.5194/acp-14-9855-2014, 2014.
van der Werf, G. R., Randerson, J. T., Giglio, L., Collatz, G. J., Mu, M., Kasibhatla, P. S., Morton, D. C., DeFries, R. S., Jin, Y., and van Leeuwen, T. T.: Global fire emissions and the contribution of deforestation, savanna, forest, agricultural, and peat fires (1997–2009), Atmos. Chem. Phys., 10, 11707–11735, https://doi.org/10.5194/acp-10-11707-2010, 2010.
Verstraeten, W. W., Neu, J. L., Williams, J. E., Bowman, K. W., Worden, J. R., and Boersma, K. F.: Rapid increases in tropospheric ozone production and export from China, Nat. Geosci., 8, 690–695, https://doi.org/10.1038/NGEO2493, 2015.
Vestreng, V. and Klein, H.: Emission data reported to UNECE/EMEP: Quality assurance and trend analysis & Presentation of WebDab, MSC-W Status Report 2002, Norwegian Meteorological Institute, Oslo Norway, July 2002.
Vogel, B., Günther, G., Müller, R., Grooß, J.-U., Hoor, P., Krämer, M., Müller, S., Zahn, A., and Riese, M.: Fast transport from Southeast Asia boundary layer sources to northern Europe: rapid uplift in typhoons and eastward eddy shedding of the Asian monsoon anticyclone, Atmos. Chem. Phys., 14, 12745–12762, https://doi.org/10.5194/acp-14-12745-2014, 2014.
Waliser, D. E. and Gautier, C.: A satellite-derived climatology of the ITCZ, J. Climate, 6, 2162–2174, https://doi.org/10.1175/1520-0442(1993)006<2162:asdcot>2.0.co;2, 1993.
Waliser, D. E., Graham, N. E., and Gautier, C.: Comparison of the highly reflective cloud and outgoing longwave radiation datasets for use in estimating tropical deep convection, J. Climate, 6, 331–353, https://doi.org/10.1175/1520-0442(1993)006<0331:cothrc>2.0.co;2, 1993.
Wang, Y., Zhang, Y., Hao, J., and Luo, M.: Seasonal and spatial variability of surface ozone over China: contributions from background and domestic pollution, Atmos. Chem. Phys., 11, 3511–3525, https://doi.org/10.5194/acp-11-3511-2011, 2011.
Wild, O., Law, K. S., McKenna, D. S., Bandy, B. J., Penkett, S. A., and Pyle, J. A.: Photochemical trajectory modeling studies of the North Atlantic region during August 1993, J. Geophys. Res., 101, 29269–29288, https://doi.org/10.1029/96jd00837, 1996.
Wild, O., Pochanart, P., and Akimoto, H.: Trans-Eurasian transport of ozone and its precursors, J. Geophys. Res., 109, D11302, https://doi.org/10.1029/2003JD004501, 2004.
Williams, J. E., Scheele, M. P., van Velthoven, P. F. J., Cammas, J.-P., Thouret, V., Galy-Lacaux, C., and Volz-Thomas, A.: The influence of biogenic emissions from Africa on tropical tropospheric ozone during 2006: a global modeling study, Atmos. Chem. Phys., 9, 5729–5749, https://doi.org/10.5194/acp-9-5729-2009, 2009.
World Ozone and Ultraviolet Radiation Data Center: Ozonesonde data, available at: http://www.woudc.org, last access: 26 March 2018.
Xie, S.-P.: The shape of continents, air-sea interaction, and the rising branch of the Hadley circulation, in: The Hadley Circulation: Present, Past and Future, Springer, Dordrecht, 121–152, 2004.
Yevich, R. and Logan, J. A.: An assessment of biofuel use and burning of agricultural waste in the developing world, Global Biogeochem. Cy., 17, 1095, https://doi.org/10.1029/2002GB001952, 2003.
Žagar, N., Skok, G., and Tribbia, J.: Climatology of the ITCZ derived from ERA Interim reanalyses, J. Geophys. Res., 116, D15103, https://doi.org/10.1029/2011JD015695, 2011.
Zare, A., Christensen, J. H., Gross, A., Irannejad, P., Glasius, M., and Brandt, J.: Quantifying the contributions of natural emissions to ozone and total fine PM concentrations in the Northern Hemisphere, Atmos. Chem. Phys., 14, 2735–2756, https://doi.org/10.5194/acp-14-2735-2014, 2014.
Zhang, G. J. and McFarlane, N. A.: Sensitivity of climate simulations to the parameterization of cumulus convection in the Canadian climate centre general circulation model, Atmos. Ocean., 33, 407–446, https://doi.org/10.1080/07055900.1995.9649539, 1995.
Zhang, L., Jacob, D. J., Boersma, K. F., Jaffe, D. A., Olson, J. R., Bowman, K. W., Worden, J. R., Thompson, A. M., Avery, M. A., Cohen, R. C., Dibb, J. E., Flock, F. M., Fuelberg, H. E., Huey, L. G., McMillan, W. W., Singh, H. B., and Weinheimer, A. J.: Transpacific transport of ozone pollution and the effect of recent Asian emission increases on air quality in North America: an integrated analysis using satellite, aircraft, ozonesonde, and surface observations, Atmos. Chem. Phys., 8, 6117–6136, https://doi.org/10.5194/acp-8-6117-2008, 2008.
Zhang, L., Li, Q. B., Jin, J., Liu, H., Livesey, N., Jiang, J. H., Mao, Y., Chen, D., Luo, M., and Chen, Y.: Impacts of 2006 Indonesian fires and dynamics on tropical upper tropospheric carbon monoxide and ozone, Atmos. Chem. Phys., 11, 10929–10946, https://doi.org/10.5194/acp-11-10929-2011, 2011.
Zhang, Q., Streets, D. G., Carmichael, G. R., He, K. B., Huo, H., Kannari, A., Klimont, Z., Park, I. S., Reddy, S., Fu, J. S., Chen, D., Duan, L., Lei, Y., Wang, L. T., and Yao, Z. L.: Asian emissions in 2006 for the NASA INTEX-B mission, Atmos. Chem. Phys., 9, 5131–5153, https://doi.org/10.5194/acp-9-5131-2009, 2009.
Zhao, T., Gong, S., Zhang, X., and McKendry, I.: Modeled size-segregated wet and dry deposition budgets of soil dust aerosol during ACE-Asia 2001: Implications for trans-Pacific transport, J. Geophys. Res., 108, 420–424, https://doi.org/10.1029/2002JD003363, 2003.
Zhu, B., Hou, X., and Kang, H.: Analysis of the seasonal ozone budget and the impact of the summer monsoon on the northeastern Qinghai-Tibetan Plateau, J. Geophys. Res., 121, 2029–2042, https://doi.org/10.1002/2015JD023857, 2016.
Zhu, J., Liao, H., Mao, Y., Yang, Y., and Jiang, H.: Interannual variation, decadal trend, and future change in ozone outflow from East Asia, Atmos. Chem. Phys., 17, 3729–3747, https://doi.org/10.5194/acp-17-3729-2017, 2017.
Zhu, Y.: Variations of the summer Somali and Australia cross-equatorial flows and the implications for the Asian summer monsoon, Adv. Atmos. Sci., 29, 509–518, https://doi.org/10.1007/s00376-011-1120-6, 2012.
Zhu, Y., Liu, J., Wang, T., Zhuang, B., Han, H., Wang, H., Chang, Y., and Ding, K.: The impacts of meteorology on the seasonal and interannual variabilities of ozone transport from North America to East Asia, J. Geophys. Res., 122, 10612–10636, https://doi.org/10.1002/2017JD026761, 2017.
- Abstract
- Introduction
- Models and data
- Seasonal variations of the transport of African ozone to Asia
- Meteorological influences on the interannual variation of the transport of African ozone to Asia
- Discussion and conclusions
- Data availability
- Competing interests
- Special issue statement
- Acknowledgements
- References
- Supplement