the Creative Commons Attribution 4.0 License.
the Creative Commons Attribution 4.0 License.
 | 23 Mar 2018
Primary and secondary organic aerosols in summer 2016 in Beijing
Rongzhi Tang
Zepeng Wu
Xiao Li
Yujue Wang
Dongjie Shang
Yao Xiao
Mengren Li
Limin Zeng
Zhijun Wu
Mattias Hallquist
To improve air quality, the Beijing government has employed several air pollution control measures since the 2008 Olympics. In order to investigate organic aerosol sources after the implementation of these measures, ambient fine particulate matter was collected at a regional site in Changping (CP) and an urban site at the Peking University Atmosphere Environment Monitoring Station (PKUERS) during the “Photochemical Smog in China” field campaign in summer 2016. Chemical mass balance (CMB) modeling and the tracer yield method were used to apportion primary and secondary organic sources. Our results showed that the particle concentration decreased significantly during the last few years. The apportioned primary and secondary sources explained 62.8 ± 18.3 and 80.9 ± 27.2 % of the measured OC at CP and PKUERS, respectively. Vehicular emissions served as the dominant source. Except for gasoline engine emissions, the contributions of all the other primary sources decreased. In addition, the anthropogenic SOC, i.e., toluene SOC, also decreased, implying that deducting primary emissions can reduce anthropogenic SOA. In contrast to the SOA from other regions in the world where biogenic SOA was dominant, anthropogenic SOA was the major contributor to SOA, implying that deducting anthropogenic VOC emissions is an efficient way to reduce SOA in Beijing. Back-trajectory cluster analysis results showed that high mass concentrations of OC were observed when the air mass was from the south. However, the contributions of different primary organic sources were similar, suggesting regional particle pollution. The ozone concentration and temperature correlated well with the SOA concentration. Different correlations between day and night samples suggested different SOA formation pathways. Significant enhancement of SOA with increasing particle water content and acidity was observed in our study, suggesting that aqueous-phase acid-catalyzed reactions may be the important SOA formation mechanism in summer in Beijing.
- Article
(1918 KB) -
Supplement
(1269 KB) - BibTeX
- EndNote


Beijing is the capital and a major metropolis of China. With rapid economic growth and urbanization, Beijing is experiencing serious air pollution problems and has become one of the hotspots of PM2.5 (particular matter with a size smaller than 2.5 µm) pollution in the world (Guo et al., 2014a; Xiang et al., 2017; Tian et al., 2016). Due to the frequent haze events in Beijing, the Beijing government has taken a series of control measures in recent years, especially after the 2008 Olympics, which may greatly influence primary and secondary particle sources. Therefore, elucidating the current contributions of primary particle sources and secondary particle sources is of vital importance. It is also important to compare with previous results to evaluate the effectiveness of the control measures and shed light on the influence of primary source emission control on secondary aerosol formation.
Several studies regarding the source apportionment of fine particles in Beijing have been conducted using multifarious methods during the last few years (Yu et al., 2013; Gao et al., 2014; X. X. Zheng et al., 2016; Tan et al., 2014; Wang et al., 2009; Guo et al., 2013). The receptor model is a commonly used method to apportion particle sources (Zhang et al., 2013, 2017; Zhou et al., 2017; Song et al., 2006; Zheng et al., 2005). Elemental tracers were previously used to apportion particulate matter sources (Yu et al., 2013; Gao et al., 2014; X. X. Zheng et al., 2016). However, the elemental-tracer-based method was unable to distinguish sources that mostly emit organic compounds instead of specific elements such as diesel and gasoline engines. Among all the apportionment methods, the chemical mass balance (CMB) model was one of the most commonly used methods to apportion the primary organic sources of fine particulate matter (Zhang et al., 2017; Hu et al., 2015; Schauer et al., 1996). Organic tracers have been successfully used in several studies that aimed to quantify the main sources in Beijing (Liu et al., 2016; Guo et al., 2013; Wang et al., 2009). Wang et al. (2009) assessed the source contributions of carbonaceous aerosol during 2005 to 2007. Guo et al. (2013) and Liu et al. (2016) apportioned organic aerosol sources using the CMB model in summer 2008 and a severe haze event in winter of 2013. Both studies found that vehicle emissions and coal combustion were the dominant primary sources of fine organic particles. The tracer yield method has been considered as a useful tool to semi-quantify SOA derived from specific VOC precursors (Guo et al., 2012; Zhu et al., 2016, 2017; Tao et al., 2017; Hu et al., 2008). However, only a few studies have estimated secondary organic aerosol in Beijing. Yang et al. (2016) estimated the biogenic SOC to OC during the CAREBEIJING 2007 field campaign and found that biogenic SOC accounted for 3.1 % of the measured OC. Guo et al. (2012) illustrated the SOA contributions in 2008 and found that secondary organic carbon could contribute a great portion (32.5 ± 15.9 %) to measured organic carbon at an urban site. Ding et al. (2014) used the tracer yield method to investigate SOA loading on a national scale and found that SOA, especially anthropogenic SOA, played a great role in major city clusters in China.
In this study, we quantified 144 kinds of particulate organic species, including primary and secondary organic tracers, at a regional site and an urban site in Beijing. A CMB modeling and the tracer yield method were used to apportion the primary and secondary sources of organic aerosols in the 2016 summer in Beijing. The results were compared with previous studies to evaluate the effectiveness of control measures on primary and secondary organic aerosols. Moreover, source apportionment results from different air mass origins according to back-trajectory clustering analysis were shown to investigate the influences of air mass from different directions on fine organic particle sources. Influencing factors of SOA formation, i.e., temperature, oxidant concentration, aerosol water content, and particle acidity, were also discussed in this study to improve our understanding of SOA formation in a polluted environment.
2.1 Sampling and chemical analysis
The measurements were conducted simultaneously at an urban site at the Peking University Atmosphere Environment Monitoring Station (PKUERS; 39∘59′21∘ N, 116∘18′25∘ E) and a regional site in Changping (CP; 40∘8′24∘ N, 116∘6′36∘ E) 40 km north of the PKUERS site during the “Photochemical Smog in China” campaign from 16 May to 5 June 2016 (see Fig. S1 in the Supplement; Hallquist et al., 2016). The PKUERS site is set on the roof of an academic building on the campus of Peking University in the northwest of Beijing. The CP site is located on the fourth floor of a building on the Peking University Changping campus.
Four-channel samplers (TH-16A; Tianhong, China) consisting of three quartz filter channels and one Teflon filter channel were employed to collect 12 h aerosol samples at PKUERS and CP, respectively. The sampling flow rate was 16.7 L min−1. Teflon filters were weighed by a microbalance (Toledo AX105DR, USA) after a 24 h balance in an environmentally controlled room (temperature 20 ± 1 ∘C, relative humidity 40 ± 3 %) for gravimetric analysis. Teflon-based samples were extracted by deionized water to measure water-soluble inorganic compounds (WSICs), namely Na+, NH, K+, Mg2+, Ca2+, NO, SO, and Cl− by using a DIONEX ICS-2500 and ICS-2000 ion chromatograph. One punch (1.45 m2) of quartz-based sample was then cut off to analyze the EC and OC via a thermal–optical method using a Sunset Laboratory instrument (NIOSH protocol; TOT). The other two quartz filters were then extracted and analyzed for chemical composition and particulate organic matter. Some daytime and nighttime samples were combined to ensure the detection of most organic compounds. To better understand the chemical speciation, daytime samples were separated from nighttime samples.
Authentic standards were used to identify and quantify the organic compounds. The analytical methods used in this study referred to previous work (Song et al., 2014). Briefly, the samples were first spiked with a mixture of internal standard, including ketopinic acid (KPA), 20 kinds of deuterated compounds, and one carbon isotope 13C-substituted compound. The quartz filters were then ultrasonically extracted with methanol : dichloromethane (v:v = 1 : 3) solvent in a water bath (temperature < 30 ∘C) three times. Each time was 20 min. The extracts were filtered and then concentrated using a rotary vacuum evaporator. An ultrapure nitrogen flow was used to further concentrate the extracts into 0.5–1 mL. Each extracted solution was divided into two portions, to one of which BSTFA (BSTFA ∕ TMCS = 99:1; Supelco) was added to convert polar organic compounds into trimethylsilanized derivatives. Afterwards, the derivatized and the untreated samples were analyzed by an Agilent 6890 GC-MS System (MSD GC-5973N) equipped with an Agilent DB-5MS GC column (30 m × 0.25 mm × 0.5 µm).
2.2 Source apportionment
A chemical mass balance modeling developed by the US Environmental Protection Agency (EPA CMB version 8.2) was applied to determine the apportion of the primary contribution of OC (Schauer et al., 1996). This receptor model solved a set of linear equations using ambient concentrations and chemical source profiles. The CMB approach depends strongly on the representativeness of the source profile. In this study, five primary source profiles including vegetative detritus (Rogge et al., 1993), coal combustion (Zheng et al., 2005), gasoline engines (Lough et al., 2007), diesel engines (Lough et al., 2007), and biomass burning (Sheesley et al., 2007) were input into the model. Fitting species included EC, n-alkanes, levoglucosan, 17β(H)-21α(H)-norhopane, 17α(H)-21β(H)-hopane, benzo[b]fluoranthene, benzo[k]fluoranthene, benzo[e]pyrene, benzo[ghi]perylene, and indeno[1,2,3-cd]pyrene. The criteria for acceptable fitting results included the square regression coefficient of the regression equation R2 > 0.85 and the sum of square residual chi-square value χ2 < 4.
The tracer yield method was used to estimate the contributions of biogenic and anthropogenic secondary organic aerosols using the fixed-tracers-to-SOC ratio (fSOC) based on laboratory experiments, which was 0.155 ± 0.039 for isoprene, 0.231 ± 0.111 for α-pinene, 0.0230 ± 0.0046 for β-caryophyllene, and 0.0079 ± 0.0026 for toluene (Kleindienst et al., 2007). The mass fraction depends on the degree of oxidation. The uncertainty also depends on the selection of molecular tracers and the simplified procedures by using single-valued mass fractions (Yttri et al., 2011; El Haddad et al., 2011; Song et al., 2014; Guo et al., 2014b, c). Previous studies showed that SOA estimated by the tracer yield method and POA apportioned by the CMB model could fully account for the OA in the atmosphere (Lewandowski et al., 2008; Kleindienst et al., 2010). Researchers also found that the total estimated SOC derived from the tracer yield method was in accordance with that from the EC-tracer method during summer (Ding et al., 2012; Kleindienst et al., 2010; Turpin and Huntzicker, 1995). Comparable results were also found between the tracer yield method and positive matrix factorization model (Hu et al., 2010; Y. X. Zhang et al., 2009). All these results firmly demonstrated that the tracer yield method is a valuable and convincing method to estimate SOA contributions (Ding et al., 2014).
Estimations based on boundary values were generally acknowledged to have the largest source of uncertainties in the models, so those results could be used to determine the possible limit of the estimations. Also, Kleindienst et al. (2007) carried out a boundary analysis using data from Research Triangle Park North Carolina to measure the range of estimated SOA contributions. Results revealed that the possible contributions of isoprene, α-pinene, β-caryophyllene, and toluene were within the scope of 70–130, 50–220, 70–120, and 60–160 %, respectively. The above results were assumed to be in the acceptable range for PM2.5 source apportionment. In addition, the standard deviations of the tracer-to-SOC ratios were suitable as a source profile uncertainty (Kleindienst et al., 2007). Despite the uncertainties above, the tracer yield method represented a unique approach to estimate the SOA contributions using individual hydrocarbon precursors (Offenberg et al., 2007).
3.1 Gaseous pollutants and meteorological conditions of the observation period
Mixing ratios of gaseous pollutants and meteorological conditions during the observation period are shown in Fig. S2 and Table S1 in the Supplement. Compared with the results in summer 2010 (J. Zheng et al., 2016), the gaseous mixing ratios of SO2 and CO were lower than before owing to the desulfurization efforts made by the government. Higher concentrations of NO and NO2 were caused by the increasing number of vehicles. The increment of ozone indicated the importance of secondary pollution. Clearly, the ozone concentration at CP was higher than that of PKUERS, while other pollutants were lower.
During the campaign, the average wind speed was low, showing average values of 2.3 ± 1.4 and 2.4 ± 1.5 m s−1 at CP and PKUERS, respectively. The diurnal variations in wind directions and speeds are exhibited in Fig. S2 in the Supplement. The prevailing wind was from the south, with a higher wind speed during the daytime.
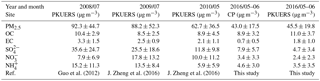
Table 1Summer PM2.5 mass concentrations in Beijing from 2008–2016; average ± standard deviation (µg m−3).
To explore the influence of air masses from different directions on fine particle loading and sources, back-trajectory analysis was performed using the National Oceanic and Atmospheric Administration (NOAA) Hybrid Single Particle Lagrangian Integrated Trajectory (HYSPLIT) model. We calculated 36 h air mass back trajectories arriving at two sampling sites during the observation period using the HYSPIT4 model with a 1∘ × 1∘ latitude–longitude grid and the final meteorological database. The model was run with starting times of 00:00, 04:00, 08:00, 12:00, 16:00, and 20:00 UTC. The arrival level was set at 200 m above ground level. The method used in trajectory clustering was based on the GIS-based software TrajStat (http://www.meteothinker.com/TrajStatProduct.aspx). Back trajectories of 36 h staring at 200 m above ground level at CP and PKUERS were calculated every 4 h during the entire campaign and then clustered according to their similarity in spatial distribution using the HYSPLIT4 software. A three-cluster solution was adopted as shown in Fig. S3 in the Supplement. The three clusters were defined as Far North West (Cluster 1, Far NW), Near West North (Cluster 2, Near WN), and South (Cluster 3). The South cluster was found to be the most frequent one, accounting for 52 % at CP and 64 % at PKUERS. Clusters Far NW and Near NW accounted for 17 and 31 %, 17, and 19 % at CP and PKUERS, respectively.
3.2 Overview of PM2.5 chemical composition
In this study, daily PM2.5 concentrations fluctuated dramatically from 6.7 to 80.3 µg m−3 at CP and from 9.6 to 82.5 µg m−3 at PKUERS, respectively. A paired t test was used to compare the mass concentrations at two sites. The results indicate that the mass concentrations showed a statistically nonsignificant difference, suggesting regional particle pollution in Beijing. PM2.5 mass concentrations during the summer of 2008 to 2016 in Beijing are summarized in Table 1. Guo et al. (2013) reported average PM2.5 concentrations during the summers of 2000 to 2008, which showed a distinct decreasing tendency during 2000–2006 and then slightly increased in 2007 due to unfavorable meteorological conditions. To better understand the variation tendency of the PM2.5 in the summer in Beijing, we compared the fine particle matter data since 2008. Compared with 2008, the PM2.5 concentrations decreased from 92.3 ± 44.7 to 88.2 µg m−3 in 2009 and 62.7 µg m−3 in 2010. The mass concentration continued falling to 45.5 µg m−3 in 2016. This decrease is attributed to the drastic emission control measures implemented by the Beijing government since 2012. In spite of the prominent decrease in the PM2.5 mass concentrations, the aerosol loading in Beijing was still much higher than that in developed countries (Tai et al., 2010; Barmpadimos et al., 2012; Park and Cho, 2011).
Figure S4 in the Supplement shows the chemical composition of PM2.5. In general, organic particulate matter (OM, OC × 1.6) and sulfate were the two dominant components, accounting for more than 50 % of the PM2.5 mass concentration during the field campaign. The average concentration of total WSICs for CP was 17.4 ± 11.5 µg m−3, higher than that of PKUERS (12.2 ± 8.5 µg m−3). Among the WSICs, secondary inorganic ions (sulfate, nitrate, and ammonium) were the most abundant compounds, indicating that secondary particles played great roles in the summer in Beijing. The higher sulfate proportion could be explained by the increased photochemical conversion of sulfur dioxide to sulfate aerosol (Xiang et al., 2017). Relevant data on the main WSICs (sulfate, nitrate, and ammonia) during 2008 to 2016 are also included in Table 1 to better elucidate the drastic decrease in fine particulate matter in recent years. Results showed that the daily average concentration of WSICs decreased from 2008 to 2016, with sulfate decreasing from 35.6 to 4.7 µg m−3, nitrate decreasing from 7.9 to 2.4 µg m−3, and ammonia decreasing from 15.2 to 3.5 µg m−3. The significant decrease in WSICs confirmed the effectiveness of the control measures taken by the government.
Carbonaceous aerosols, i.e., organic carbon (OC) and elemental carbon (EC), were also great contributors to PM2.5 concentrations. Higher proportions of OC and EC at PKUERS demonstrated severe carbonaceous pollution in urban Beijing, which might have close a correlation with the higher traffic flow, coal and/or wood combustion by residents, and industrial emissions (Wang et al., 2006; Dan et al., 2004; Cao et al., 2004). A comparison of the OC and EC concentrations from 2008 to 2016 is also listed in Table 1. Unlike PM2.5, the OC concentration at PKUERS showed a higher OC concentration (11.0 ± 3.7 µg m−3) compared with that in 2008 (9.2 ± 3.3 µg m−3), suggesting that organic aerosol pollution is becoming more and more important. The EC concentration decreased dramatically to 0.7 ± 0.5 µg m−3 at CP and 1.8 ± 1.0 µg m−3 at PKUERS, which showed the lowest value since 2000. This could be attributed to the implementation of an air pollution prevention and control action plan enacted by the state council since 2013. Therefore, we could draw the conclusion that the drastic decrease in fine particulate matter in Beijing was mainly due to the well-controlled EC and WSICs, with a negligible contribution of OC.
To evaluate the influences of air masses from different directions on the PM2.5 loadings during the campaign, three categories were identified according to the back-trajectory clustering analysis (see Fig. S5 in the Supplement). In general, cluster South represented the most polluted air mass origin, followed by clusters Near WN and Far NW, which was in accordance with previous studies demonstrating severe aerosol pollution in southerly airflow in summer in Beijing (Huang et al., 2010; Sun et al., 2010).
3.3 Concentration of particulate organic species from different air mass origins
The organic species (except secondary organic tracers) were divided into 12 categories. Their concentrations in different directions according to the back-trajectory clustering are shown in Fig. S6 in the Supplement. Detailed information for each class at the two sites can be found in the Supplement (Fig. S7). Cluster South showed a higher particulate organic matter concentration, followed by cluster Near WN and Far NW, indicating more severe aerosol pollution from the south. Our result are consistent with previous studies showing that more pollution emissions are from the south area of Beijing than from the north (Wu et al., 2011; Q. Zhang et al., 2009).
For all the species, a histogram shows the daily average concentrations with error bars representing 1 standard deviation. Dicarboxylic acid was the most abundant species among all the components, demonstrating the great contribution of secondary formation to organic aerosols in the summer in Beijing (Guo et al., 2010). A series of n-alkanes ranging from C12 to C36 were analyzed. Their distribution during the observation period is shown in Fig. S7a in the Supplement. The maximum alkane concentration species (Cmax) were C27 and C29. The odd carbon preference was indicative of biogenic sources (vegetative matter and biomass burning; Huang et al., 2006; Rogge et al., 1993). In this study, total PAHs were much lower than previous studies in summer in Beijing, suggesting the effectiveness of the control strategies since 2013 (Wang et al., 2009). According to Fig. S7c in the Supplement, five-ring PAHs were the dominant species among all the species, followed by four-ring and six-ring PAHs. In total, four- to six-ring PAHs had a higher abundance, accounting for more than 60 % of the total PAHs. The result was similar to previous studies showing that the distribution of PAHs was impacted by the volatility of PAHs and the temperature (Wang et al., 2009; Guo et al., 2013). Saccharide was considered to originate from biomass burning (Simoneit et al., 1999). In this study, we quantified three sugar compounds including levoglucosan, mannosan, and galactosan, and levoglucosan was considered as a good tracer for biomass burning. The average daily mass concentrations of levoglucosan at CP and PKUERS were 53.03 ± 39.26 and 59.87 ± 38.93 ng m−3, respectively. It is worth mentioning that the levoglucosan concentration was the lowest in recent years (Cheng et al., 2013; Guo et al., 2013). Hopanes have been considered as markers for oil combustion (Lambe et al., 2009), vehicles (i.e., gasoline-powered and diesel-powered engines; Cass, 1998; Lough et al., 2007), and coal combustion (Oros and Simoneit, 2000). Nevertheless, contributions of coal combustion to hopanes were much less than those of vehicle exhaust. Concentrations of quantified hopanes including 17α(H)-22,29,30-trishopane, 17β(H)-21α(H)-norhopane, and 17α(H)-21β(H)-hopane at CP and PKUERS are shown in Fig. S7d in the Supplement. The total average concentrations of hopanes were 3.05 ± 1.53 ng m−3 for CP and 3.90 ± 2.06 ng m−3 for PKUERS. The daily averaged hopane concentrations at the urban site PKUERS were much higher than those of CP, which could probably be explained by the heavier vehicle emissions in the urban area. The concentrations of primary organic tracers used in CMB model are listed in Table S2 in the Supplement.
3.4 Biogenic and anthropogenic SOA tracers
Table S3 in the Supplement compares the SOA tracers measured in this work with those in other regions in the world and those observed in Beijing 2008. The sites for comparison include an urban background site at the Indian Institute of Technology Bombay, Mumbai, India (IITB; Fu et al., 2016), an outflow region of Asian aerosols and precursors in Cape Hedo, Okinawa, Japan (CH; Zhu et al., 2016), a residential site in Yuen Long, Hong Kong (YL; Hu et al., 2008), three industrial sites in Cleveland Ohio (CL; data were averaged among the three sites), and a suburban site in Research Triangle Park (RTP) North Carolina. Detailed information about these sites is summarized in the Supplement.
Three isoprene SOA tracers, i.e., two 2-methyltetrols (2-methyltheitol and 2-methylerythritol) and 2-methylglyceric acid, were detected. The summed concentration of the isoprene SOA tracers ranged from 3.7 to 62.3 ng m−3 at CP and 8.6 to 46.5 ng m−3 at PKUERS. The concentration was higher than that of IITB and CH. Compared with the isoprene SOA tracers in 2008, the concentrations in 2016 were lower.
Nine α-pinene tracers were identified. The sum of the tracers ranged from 20.9 to 282.3 ng m−3 at CP and 50.0 to 161.4 ng m−3 at PKUERS, which had a similar distribution pattern to that measured in 2008 in Beijing and YL. The total α-pinene tracer concentrations were lower than those in 2008, while still much higher than the concentrations in other regions of the world.
β-Caryophyllinic acid is one of the oxidation products of β-caryophyllene that is considered as a tracer for β-caryophyllene SOA. In this study, β-caryophyllinic acid concentrations ranged from 1.4 to 16.7 ng m−3 at CP and 0.9 to 12.0 ng m−3 at PKUERS, with average daily average concentrations of 6.1 ± 3.5 and 6.0 ± 2.8 ng m−3 for CP and PKUERS, respectively. The values were lower than those at YL and RPT, but higher than those measured at Yufa and PKUERS in 2008.
2,3-Dihydroxy-4-oxopentanoic acid is deemed as a tracer for toluene SOA. Our results showed that the 2,3-dihydroxy-4-oxopentanoic acid concentration was 9.7 ± 7.3 ng m−3 at CP and 11.0 ± 3.7 ng m−3 at PKUERS. Compared with other regions of the world, the concentrations of 2,3-dihydroxy-4-oxopentanoic acid were much higher, implying higher contributions of anthropogenic sources at Beijing. However, the 2,3-dihydroxy-4-oxopentanoic acid concentrations at CP were lower than those of PKUERS.
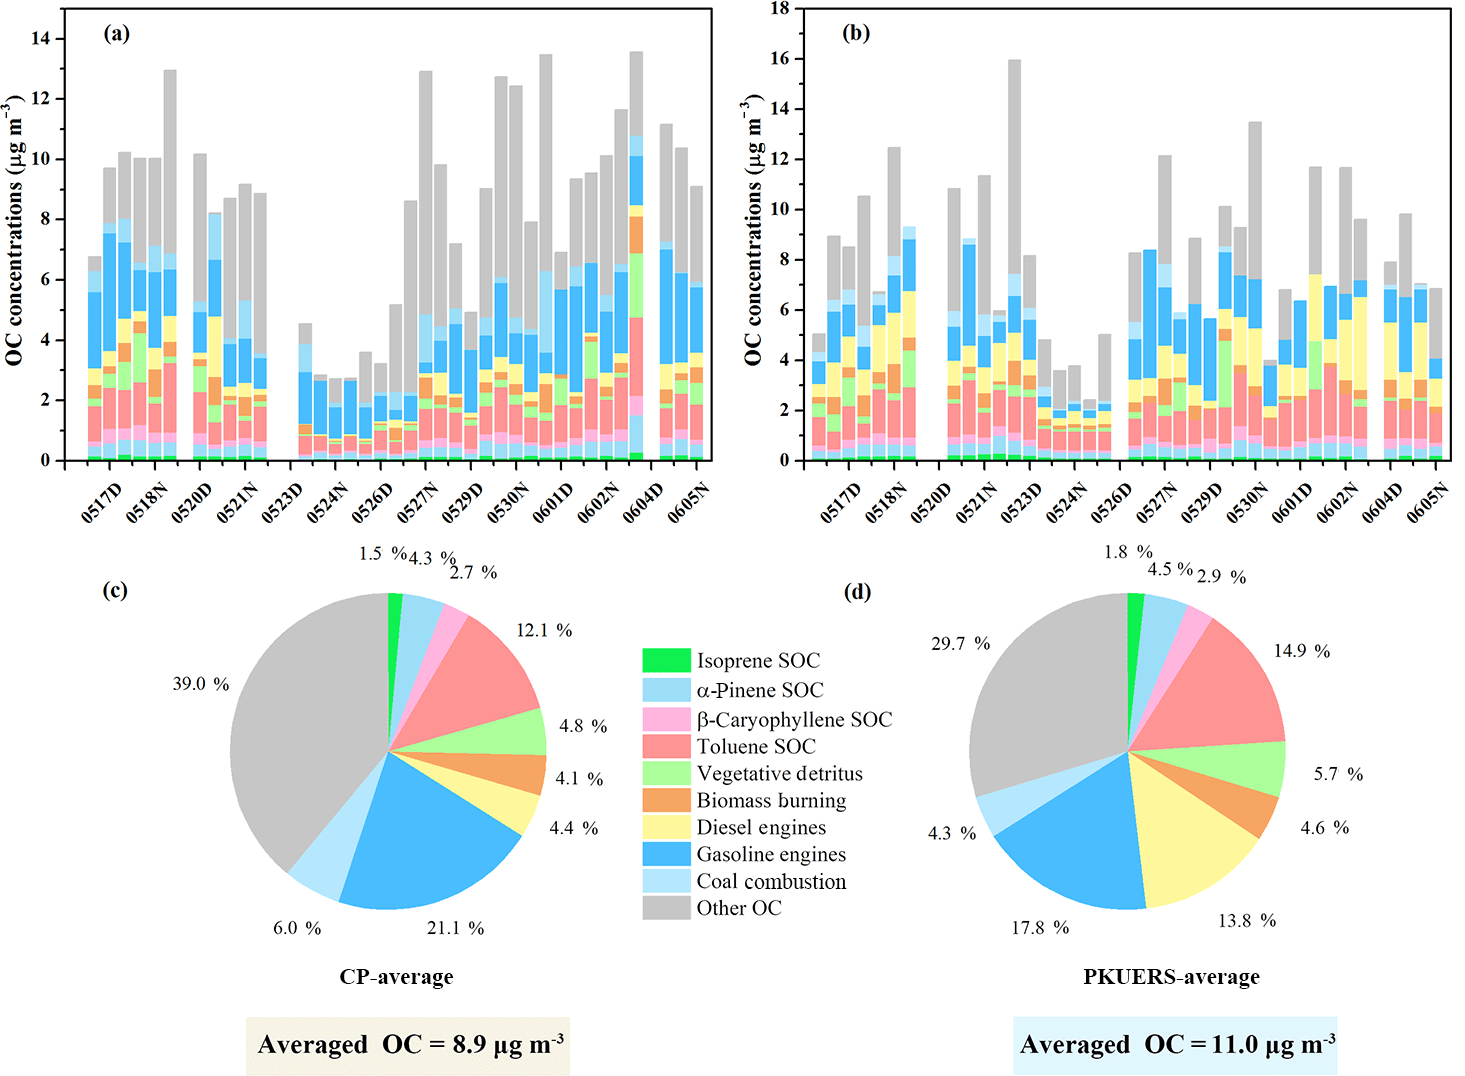
Figure 1Concentrations of organic carbon from primary and secondary organic sources at (a) CP and (b) PKUERS as well as their contributions to the measured organic carbon at (c) CP and (d) PKUERS (%).
4.1 Contributions of primary and secondary organic aerosols
A CMB model and the tracer yield method were used to quantify the contributions of primary and secondary sources to the ambient organic carbon (see Fig. 1). On average, the primary sources accounted for 42.6 ± 15.4 and 50.4 ± 19.1 % of the measured OC at CP and PKUERS, respectively. Vehicle emissions were the dominant primary source, with contributions of 28.8 ± 14.8 and 37.6 ± 19.3 % at PKUERS and CP, respectively, implying the urgency to control vehicular exhaust in urban areas. Despite the lower contribution of the gasoline exhaust at PKUERS, the mass concentration of the gasoline exhaust was higher compared with that of CP given the higher OC loading at PKUERS. The contributions of biomass burning were 3.9 ± 2.6 and 5.0 ± 2.2 % at CP and PKUERS, respectively, showing higher concentrations at night. The drastic change in the biomass burning contribution at CP at night was due to occasional burning activities at night. Coal combustion contributed 5.8 ± 5.5 and 4.6 ± 2.6 % of the measured OC at CP and PKUERS. The higher contribution at CP was due to more burning activities in the suburban areas.
The secondary organic sources accounted for 20.2 ± 6.7 % of the organic carbon at CP, with 1.6 ± 0.4 % from isoprene, 4.4 ± 1.5 % from α-pinene, 2.7 ± 1.0 % from β-caryophyllene, and 12.5 ± 3.4 % from toluene. As for PKUERS, the secondary organic sources took up 30.5 ± 12.0 % of the measured OC, in which isoprene was responsible for 2.3 ± 0.9 %, α-pinene for 5.6 ± 1.9 %, β-caryophyllene for 3.6 ± 2.6 %, and toluene for 19.0 ± 8.2 %. Haque et al. (2016) used a tracer-based method to apportion organic carbon and the results showed that biogenic SOC was responsible for 21.3 % of the total OC, with isoprene SOC contributing 17.4 %, α- and β-pinene SOC contributing 2.5 %, and β-caryophyllene SOC contributing 1.4 % in the summer in Alaska, implying significant contributions of biogenic SOA to the loading of organic aerosol. Our results showed that the biogenic SOA concentration was comparable or even high than that at some forest sites in other places of the world (Miyazaki et al., 2012; Stone et al., 2012; Claeys et al., 2004; Kourtchev et al., 2008). The SOA formation mechanism is complicated. A possible reason is the high oxidation capacity in China. The higher oxidation capacity in China may hasten the chemical lifetime of reactive gases and accelerate the aerosol aging process, which leads to an increase in biogenic SOA (Ghirardo et al., 2016). Another possible reason is the complicated emissions of anthropogenic VOCs, which can lead to an enhancement of secondary organic aerosol formation from biogenic precursors (Hoyle et al., 2011). We also compare the isoprene concentration with the forest site according to some literature. Wang et al. (2010) discovered that the mean isoprene concentration was 0.24 ppbv at PKUERS in June 2008. Lappalainen et al. (2009) measured the isoprene concentration of a boreal forest in Hyytiälä and found that the mean concentration of isoprene was 0.15 ppbv. This comparable or even higher concentration of isoprene may be due to different sources of biogenic VOCs. More work is still needed to investigate the SOA formation mechanism under the “air pollution complex” in China.
Stone et al. (2009) discovered that primary and secondary sources accounted for 83 ± 8 % of the measured organic carbon, with primary sources accounting for 37 ± 2 % and SOC contributing 46 ± 6 %, with 16 ± 2 % from biogenic gas-phase precursors and 30 ± 4 % from toluene, using the CMB model and tracer-based method in Cleveland with heavy industries, implying that anthropogenic sources played great roles in the formation of SOA. Our results showed a similar trend as the results published by Stone et al. (2009), in which anthropogenic sources, i.e., toluene-derived SOC, dominated the apportioned SOC. Our research revealed an important point that controlling SOA seems feasible in developing countries like China. It is difficult to control SOA in developed countries, since biogenic SOA is dominant. However, deducting anthropogenic precursors may be an efficient way to reduce SOA pollution in regions where anthropogenic SOA is dominant. On average, 62.8 ± 18.3 and 80.9 ± 27.2 % of the measured OC was apportioned at CP and PKUERS, respectively. About 36.3 ± 18.1 and 29.3 ± 15.6 % of the OC sources remained unknown, which were probably composed of uncharacterized primary or secondary sources. Further research is needed to explain the unapportioned sources of OC.
Due to the drastic emission control measures taken by the Beijing government, primary and secondary sources in Beijing may change greatly. Figure 2 displays the comparison of sources between 2008 and 2016 at the same site: PKUERS. We compared the average contributions by percentage rather than the mass concentration. In general, primary sources contributed 50.4 ± 19.1 % of the measured OC in 2016, closely correlated with the increasing contribution of vehicular emissions. Gasoline engines accounted for 18 % of the measured OC, showing an enhancement of 80 % with respect to 2008. This might be related to the rising number of the vehicles in Beijing. In comparison, diesel exhaust decreased by 12.5 % due to the strict control measures made by the government. A 28.5 and 20 % reduction of coal combustion and biomass burning could also be found due to the drastic measures made by the government. Compared with 2008, contributions of secondary organic aerosol decreased by 29.4 %, in which biogenic SOC served as the biggest contributor to the decrease. The formation of biogenic SOA is complicated. Several factors can affect biogenic SOC formation, among which the precursor concentration is one of the crucial factors. Biogenic VOCs, i.e., isoprene, α-pinene, etc., are predominantly emitted from plant foliage in a constitutive manner. The emission rate of biogenic VOCs depends on various factors, e.g., radiation, temperature, humidity, meteorological conditions, and seasonality (Ghirardo et al., 2016). Two or more of them will act synergistically to have an effect on the concentration of isoprene SOC. The changes in the vegetation in a certain area may also play a part in the change in the SOC concentration. Considering its comprehensive synergistic effect, it is difficult to determine the main reason responsible for the isoprene SOC decrease.
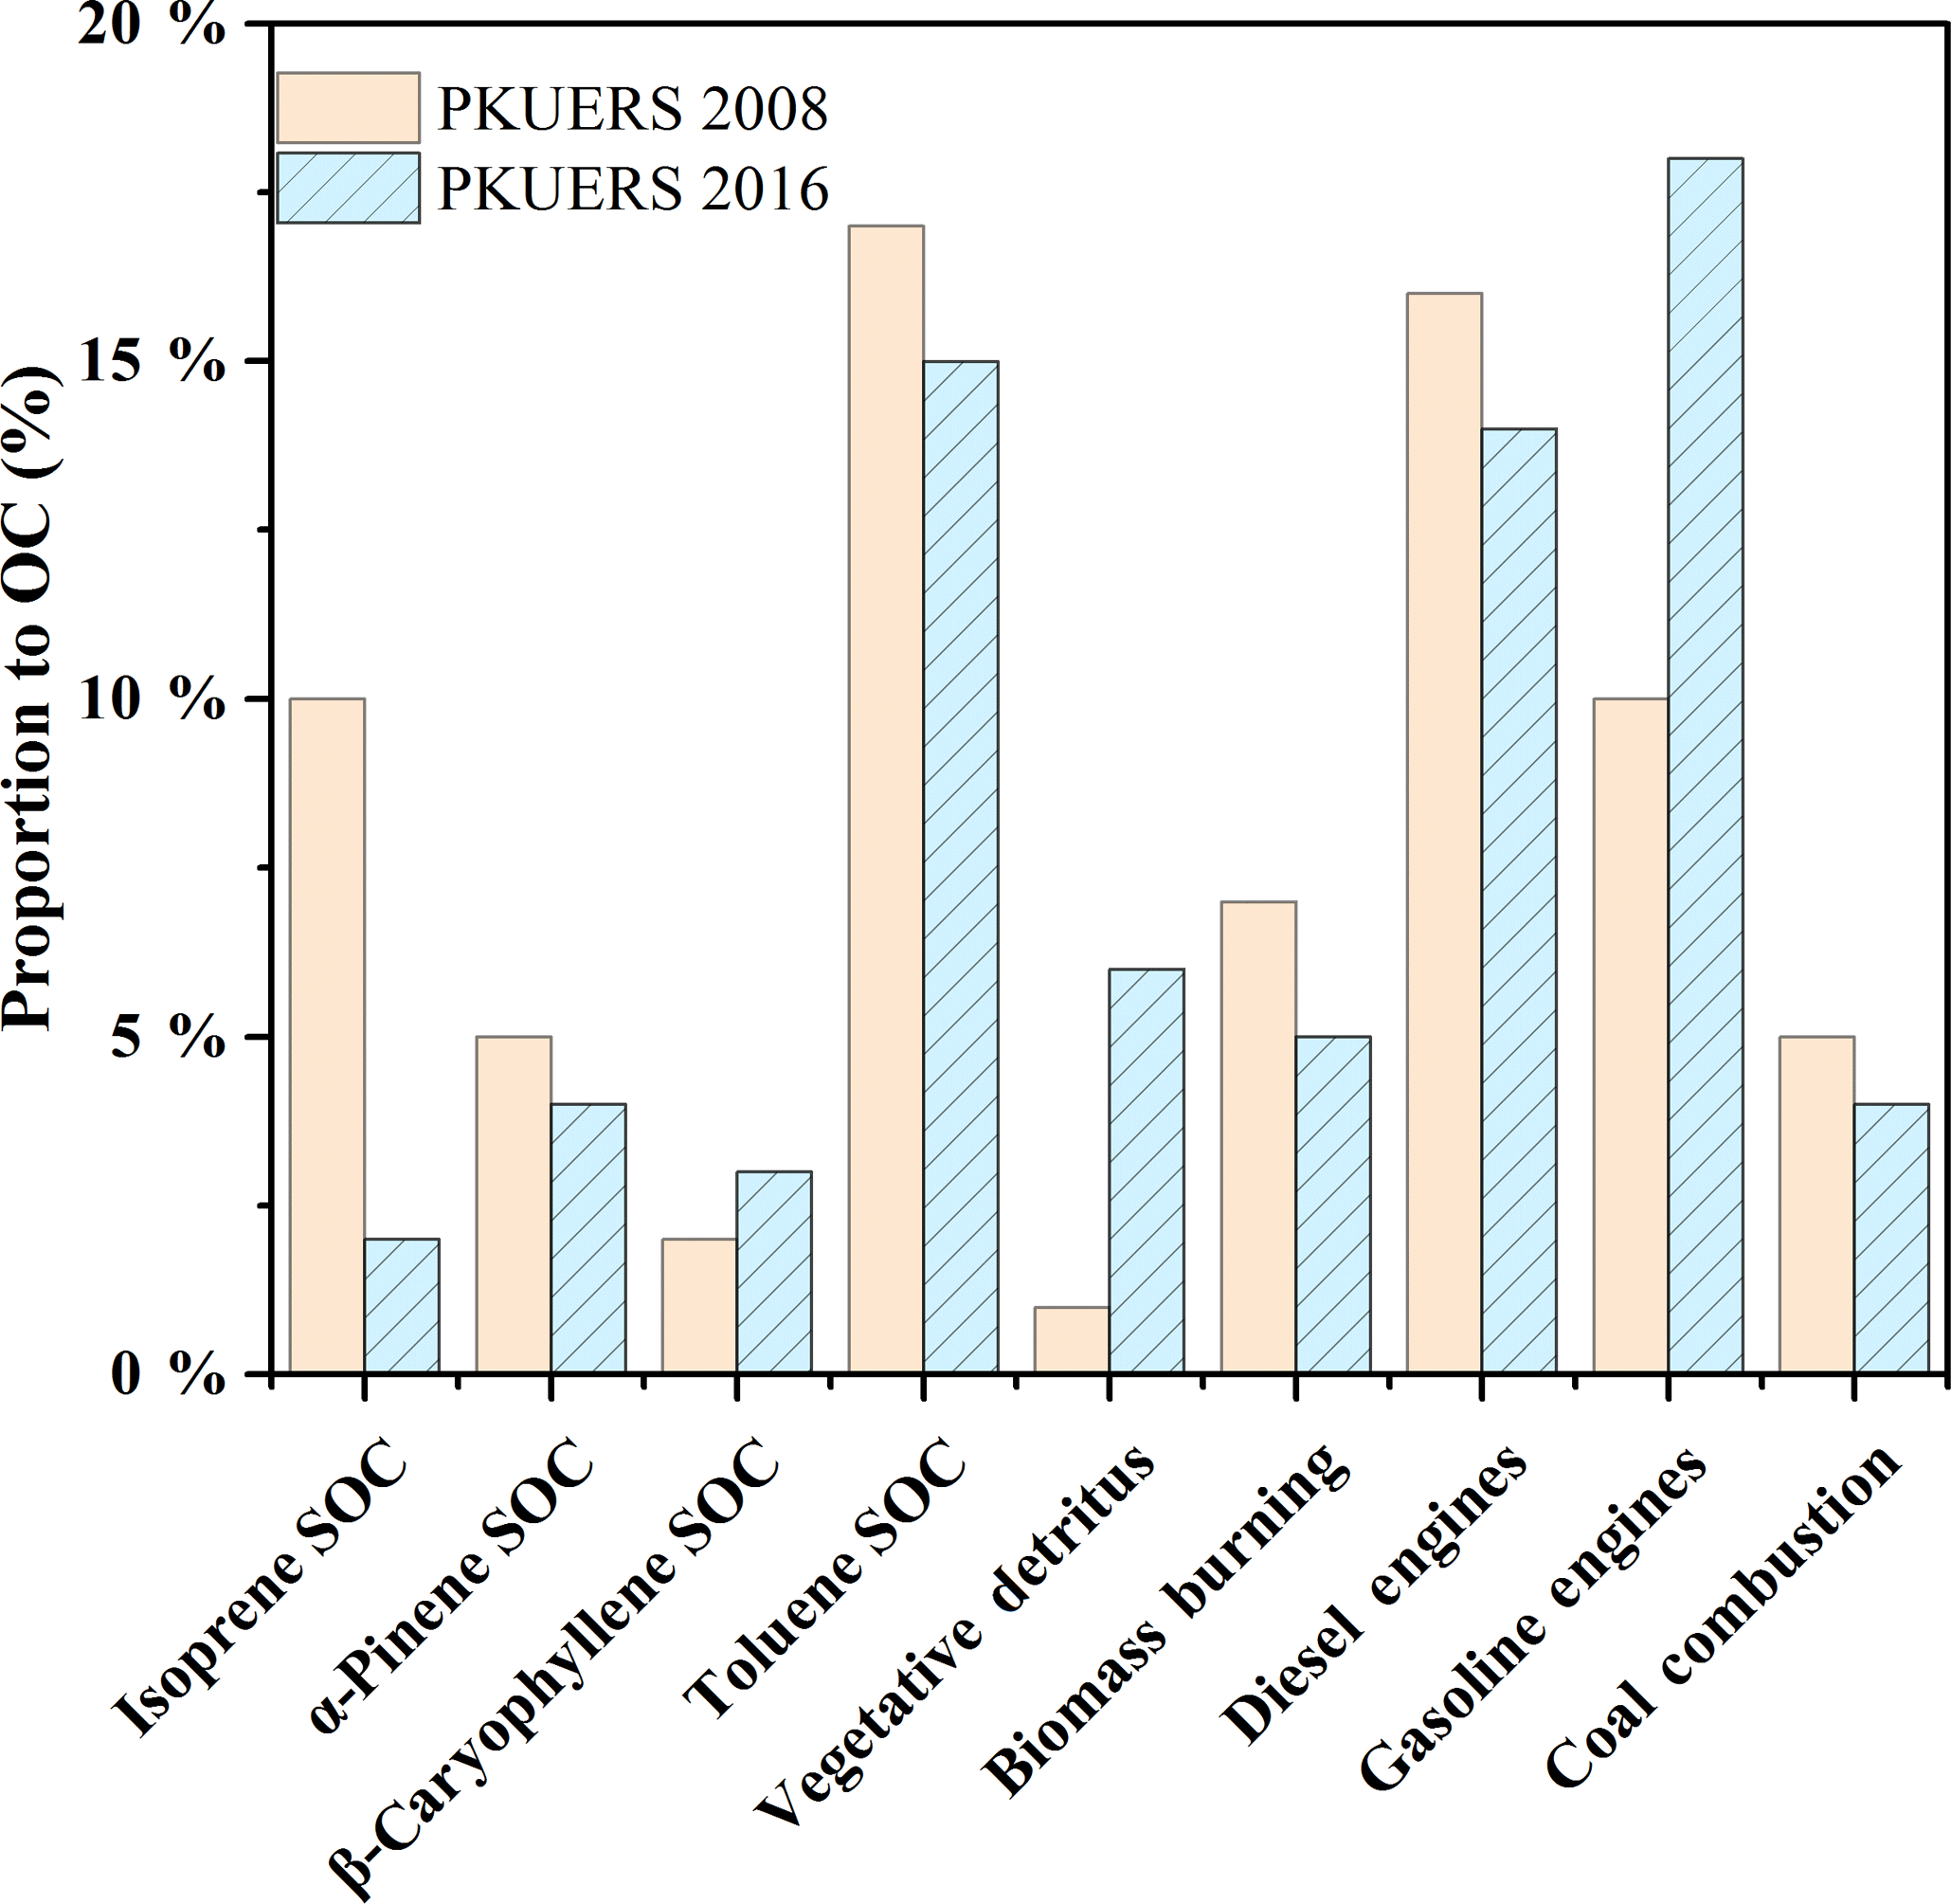

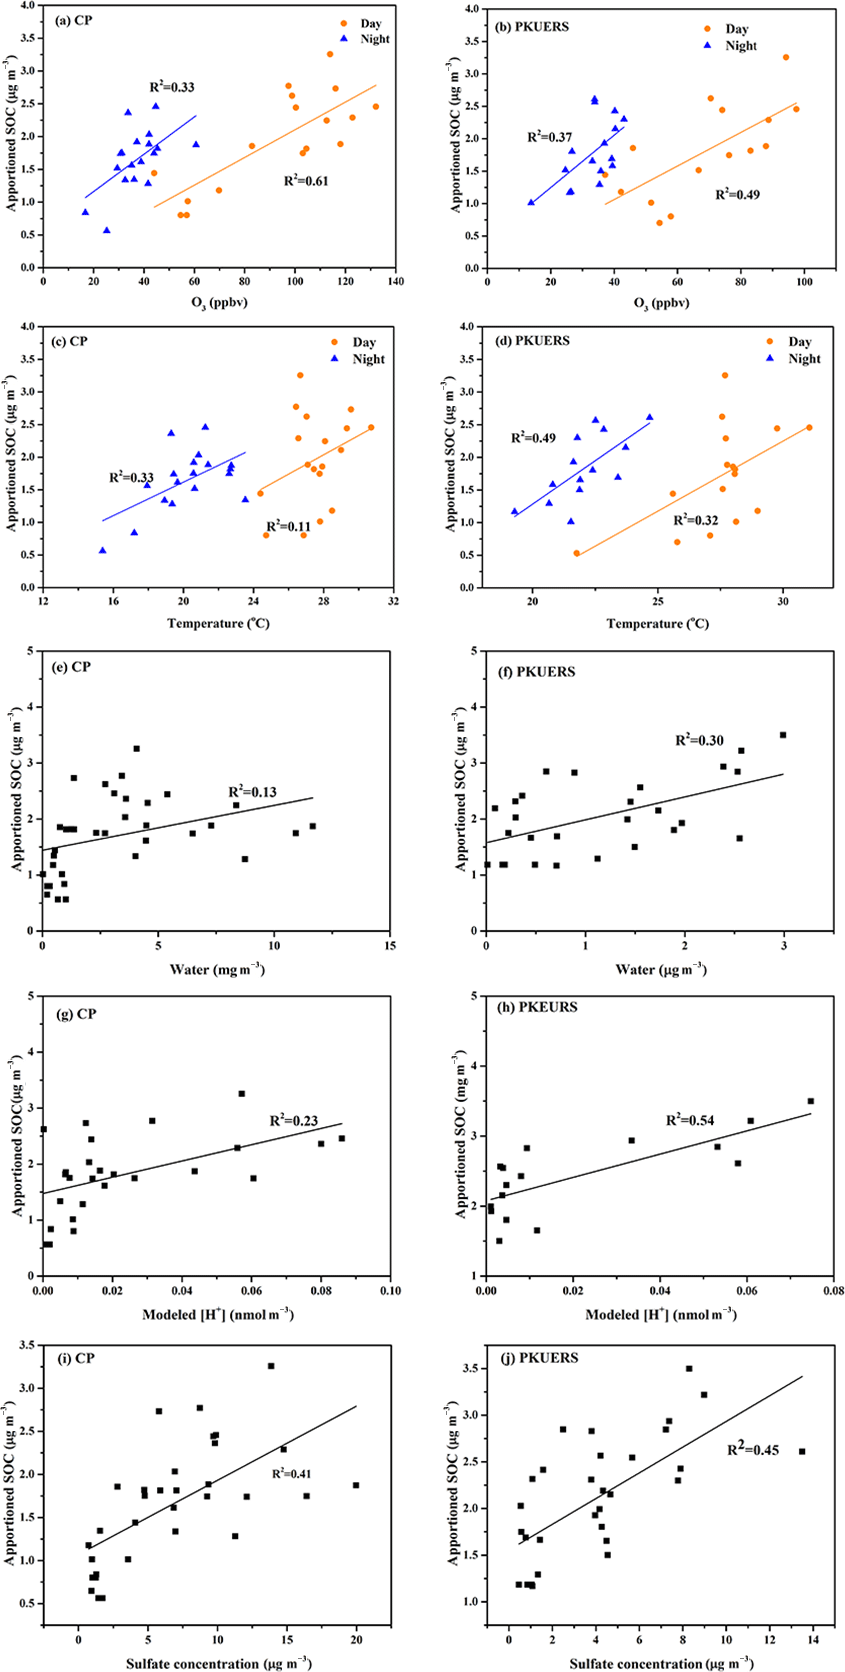
Figure 4Correlations between SOC and different influencing factors: (a–b) ozone, (c–d) temperature, (e–f) water, (g–h) H+ concentration, and (i–j) sulfate concentration.
However, the contribution of toluene SOC was the highest among the apportioned SOC, which was different from the results of the most developed countries in the world. Compared with previous studies, except β-caryophyllene SOC, vegetative detritus, and gasoline exhaust, the contributions of all other sources decreased, e.g., isoprene SOC, α-pinene SOC, toluene SOC, biomass burning, diesel exhaust, and coal combustion. However, the increases in β-caryophyllene SOC, vegetative detritus, and gasoline exhaust could not compensate for the decreases in other sources. This can be attributed to the larger portion of uncharacterized sources compared with 2008. The uncharacterized sources may mainly contain cooking emissions, mineral and road dust, industrial pollution, and other uncharacterized secondary sources (Tian et al., 2016; Liu et al., 2016). In summary, the contributions of most POA decreased in recent years, except for gasoline exhaust, indicating that more efforts should be made to control gasoline emissions. The apportioned SOC also decreased, with toluene SOC serving as the dominant source. Our results revealed that deducting anthropogenic precursors may be an efficient way to control SOA pollution in China.
4.2 Organic aerosol sources from different air mass origins
The regional sources and transport of air pollutants exert profound impacts on air quality in Beijing. To better understand the regional impacts on primary and secondary aerosol sources in Beijing, source apportionment results for air mass from different origins are shown in Fig. 3. Vehicular emissions, i.e., gasoline and diesel exhaust, showed identical contributions from different air mass origins (31.0 % from South vs. 31.3 % from Near WN vs. 31.7 % from Far NW) at PKUERS, demonstrating that vehicular pollution could mostly be attributed to vehicular emissions at the local site. However, the contribution of vehicular emissions at CP showed a significant difference from different air mass origins, with the lowest contribution when the air mass was from the far northwest. This might be explained by regional transport from different directions. Comparable contributions of coal combustion and biomass burning were found at CP and PKUERS from different air mass origins, implying regional pollution in Beijing. Similarly, biogenic SOC showed similar contributions from different air mass origins both at the regional site and the urban site. From all the directions, the toluene SOC (anthropogenic source) was the largest contributor to apportioned SOC, with higher concentrations at the urban site PKUERS. On the whole, most of the sources showed a comparable contribution from different air mass origins, implying that pollution in Beijing was regional.
4.3 Influencing factors for secondary organic aerosol formation in the summer in Beijing
Laboratory experiments have revealed that several factors can influence SOA formation, e.g., oxidants (OH radical, ozone, etc.), temperature, humidity, particle water content, and acidity. We found that the correlations between SOC and ozone–temperature are different for daytime and nighttime samples. However, it is not significant for water content and hydrogen ion concentration. Therefore, we separate the data between day and night as well as between SOC and ozone–temperature and use all data for the analysis of particle water and acidity. In this work, the relationships between estimated SOA and these factors were investigated to better understand SOA formation in Beijing.
4.3.1 SOA formation from ozonolysis
Ozone is considered as an important oxidant for SOA formation. Figure 4a and b show the correlation of the ozone mixing ratio and SOC. It is clear that SOC increased significantly with an increasing ozone mixing ratio, which is consistent with previous studies in Beijing (Guo et al. 2012). Different correlations were found between day and night samples, with better correlation for the daytime samples at both sites, implying that SOA may have formation mechanisms at night other than ozonolysis. At CP, the growth rate of SOC with O3 was similar for day and night samples, which was 0.02 µg m−3 per ppbv ozone. For PKUERS, the increment rate of SOC towards ozone was 0.04 and 0.02 µg m−3 per ppbv ozone in the day and night, respectively.
4.3.2 Influence of temperature and relative humidity on SOA formation
Temperature was considered as a great influencing factor on SOA formation. On the one hand, higher temperatures promoted the evaporation of semi-volatile SOA. On the other hand, high-temperature conditions would favor oxidation, which would accelerate SOA formation (Saathoff et al., 2009). Figure 4c and d show the variation in SOC concentrations with temperature. In this study, SOC concentrations showed a positive correlation with temperature at CP and PKUERS, demonstrating that temperature favors SOA formation in the summer in Beijing. Moreover, different correlations of the day and the night samples imply different pathways of SOA formation. However, poor relations could be found between SOC and RH.
4.3.3 Effects of aqueous-phase acid-catalyzed reactions on SOA formation
Aerosol water and acidity have been considered to have a great impact on aqueous-phase SOA formation (Cheng et al., 2016). To determine the influences of water content and aerosol acidity on aqueous-phase reactions, the ISORROPIA-II thermodynamic equilibrium model was used (Surratt et al., 2007). The model was set at forward mode based on the concentrations of particle-phase Na+, NH, K+, Mg2+, Ca2+, NO, SO, Cl−, and gaseous NH3 as well as ambient temperature and RH.
Results showed that the average aerosol water content at CP was 3.87 ± 3.73 µg m−3, higher than that at PKUERS (1.83 ± 1.81 µg m−3). The water content was lower in 2016 than that in 2008. The estimated SOC concentration showed good correlations with water content at both sites. Compared with CP, the correlation factor at PKUERS was better, implying that aqueous-phase reactions may be more important in an urban area. Different correlations could be found at different liquid water contents, especially for CP, for which liquid water content spanned a wide range, implying that different mechanisms may exist at different liquid water contents.
In this study, modeled H+ concentration and SOC showed significant correlation (p < 0.05) at the two places, which indicated that acid-catalyzed reactions might provide a crucial pathway for SOA formation in the summer in Beijing. Laboratory studies showed that acid-catalyzed reactive uptake might play great role in the enhancement of SOA (Zhang et al., 2014; Surratt et al., 2010; Jang et al., 2002). However, contrary conclusions were made by other groups, demonstrating the inconsistencies in aerosol acidity and SOA formation (Wong et al., 2015; Kristensen et al., 2014). The contradiction might imply that the impacts of acidity on SOA loading varied from place to place, as determined by the specific environmental conditions. Linear regression showed that the enhancement of SOC with modeled H+ concentration was at a value of 0.02 µg m−3 per nmol H+, which was lower than previous results (0.046 for PKUERS, and 0.041 for Yufa, 2008). Offenberg et al. (2009) discovered a good correlation between SOC and [H+]air, with an R2 value of 0.815. A value of 1 nmol m−3 [H+]air would give rise to a 0.015 µg m−3 SOC increase from the oxidation of α-pinene in the chamber experiment. We also analyzed the relationship between apportioned SOC and sulfate concentration and found that the apportioned SOC increased with the increase in sulfate concentration. The coefficient R2 values were 0.41 and 0.45 for CP and PKUERS, respectively, indicating that the increase in SOC may be influenced by sulfate aerosol. As such, the increase in SOC is likely to arise from acid-catalyzed reactions with the participation of sulfate aerosols. In the present work, different correlations could be found at different modeled H+ concentrations for which apportioned SOC increased significantly as the H+ concentration increased and then increased slowly at a certain level, showing gradient growth at different hydrogen ion concentrations. Therefore, aqueous-phase acid-catalyzed reactions may influence SOA formation through different mechanisms at varied levels of liquid water concentration and aerosol acidity.
High concentrations of fine particles were observed during the “Campaign on Photochemical Smog in China”, with average mass concentrations of 45.48 ± 19.78 and 42.99 ± 17.50 µg m−3 at the CP site and PKUERS site, respectively. Compared with previous studies, the concentrations of PM2.5, EC, and estimated SOC decreased significantly due to the drastic measures implemented by the government in recent years. However, OC showed a higher concentration, suggesting that particulate organic matter is becoming more and more important in Beijing. CMB modeling and the tracer yield method were used to apportion primary and secondary organic aerosol sources. The apportioned primary and secondary OC accounted for 62.8 ± 18.3 and 80.9 ± 27.2 % of the measured OC at CP and PKUERS, respectively. Vehicle emissions, i.e., diesel and gasoline engine emissions, were the major primary organic aerosol source, which contributed 28.8 ± 14.8 and 37.6 ± 19.3 % of the OC at CP and PKUERS, respectively. Compared with the results of previous work, the gasoline engine emissions contributed almost twice that in 2008 (18.0 vs. 10.0 %), while the contribution of diesel engine emissions decreased by 12.5 % compared with the result in 2008. In addition, the contributions of biomass burning and coal combustion both decreased. The apportioned biogenic and anthropogenic SOC can explain 20.2 ± 6.7 and 30.5 ± 12.0 % of the measured OC at CP and PKUERS, respectively. The contribution of toluene SOC is the highest among the apportioned SOC, which is different from the results of the most developed countries in the world. Our results revealed an important point, which is that controlling SOA seems feasible in developing countries like China. It is difficult to control SOA in developed countries, since biogenic SOA is dominant. However, deducting anthropogenic precursors may be an efficient way to reduce the SOA pollution in regions where anthropogenic SOA is dominant. Back-trajectory clustering analysis showed that the particle source contributions were similar when air masses were from different directions, suggesting regional organic particle pollution in Beijing. However, the higher organic particle loading from the South cluster indicates that there were more emissions from the southern region of Beijing. The present work also implied that aqueous-phase acid-catalyzed reactions may be an important SOA formation mechanism in summer in Beijing.
Relevant data have been included in the paper in the form of a table. Most of the raw data are available from the corresponding author upon request.
The supplement related to this article is available online at: https://doi.org/10.5194/acp-18-4055-2018-supplement.
The authors declare that they have no conflict of interest.
This article is part of the special issue “Regional transport and transformation of air pollution in eastern China”. It is not associated with a conference.
This research is supported by the National Key R&D Program of
China (2016YFC0202000, Task 3), the National Natural Science Foundation of
China (21677002), and the framework research program on “Photochemical Smog in
China” financed by the Swedish Research Council (639-2013-6917).
Edited by: Renyi Zhang
Reviewed by: two anonymous referees
Barmpadimos, I., Keller, J., Oderbolz, D., Hueglin, C., and Prévôt, A.: One decade of parallel fine (PM2.5) and coarse (PM10–PM2.5) particulate matter measurements in Europe: trends and variability, Atmos. Chem. Phys., 12, 3189–3203, https://doi.org/10.5194/acp-12-3189-2012, 2012.
Cao, J. J., Lee, S. C., Ho, K. F., Zou, S. C., Fung, K., Li, Y., Watson, J. G., and Chow, J. C.: Spatial and seasonal variations of atmospheric organic carbon and elemental carbon in Pearl River Delta Region, China, Atmos. Environ., 38, 444–4456, https://doi.org/10.1016/j.atmosenv.2004.05.016, 2004.
Cass, G. R.: Organic molecular tracers for particulate air pollution sources, Trac-Trend. Anal. Chem., 17, 356–366, https://doi.org/10.1016/s0165-9936(98)00040-5, 1998.
Cheng, Y., Engling, G., He, K.-B., Duan, F.-K., Ma, Y.-L., Du, Z.-Y., Liu, J.-M., Zheng, M., and Weber, R. J.: Biomass burning contribution to Beijing aerosol, Atmos. Chem. Phys., 13, 7765–7781, https://doi.org/10.5194/acp-13-7765-2013, 2013.
Cheng, Y., Zheng, G., Wei, C., Mu, Q., Zheng, B., Wang, Z., Gao, M., Zhang, Q., He, K., and Carmichael, G.: Reactive nitrogen chemistry in aerosol water as a source of sulfate during haze events in China, Sci. Adv., 2, e1601530, https://doi.org/10.1126/sciadv.1601530, 2016.
Claeys, M., Graham, B., Vas, G., Wang, W., Vermeylen, R., Pashynska, V., Cafmeyer, J., Guyon, P., Andreae, M. O., and Artaxo, P.: Formation of Secondary Organic Aerosols Through Photooxidation of Isoprene, Science, 303, 1173, https://doi.org/10.1126/science.1092805, 2004.
Dan, M., Zhuang, G., Li, X., Tao, H., and Zhuang, Y.: The characteristics of carbonaceous species and their sources in PM2.5 in Beijing, Atmos. Environ., 38, 3443–3452, https://doi.org/10.1016/j.atmosenv.2004.02.052, 2004.
Ding, X., Wang, X. M., Gao, B., Fu, X. X., He, Q. F., Zhao, X. Y., Yu, J. Z., and Zheng, M.: Tracer-based estimation of secondary organic carbon in the Pearl River Delta, south China, J. Geophys. Res.-Atmos., 117, D05313, https://doi.org/10.1029/2011JD016596,,2012.
Ding, X., He, Q. F., Shen, R. Q., Yu, Q. Q., and Wang, X. M.: Spatial distributions of secondary organic aerosols from isoprene, monoterpenes, beta-caryophyllene, and aromatics over China during summer, J. Geophys. Res.-Atmos., 119, 11877–11891, https://doi.org/10.1002/2014jd021748, 2014.
El Haddad, I., Marchand, N., Temime-Roussel, B., Wortham, H., Piot, C., Besombes, J.-L., Baduel, C., Voisin, D., Armengaud, A., and Jaffrezo, J.-L.: Insights into the secondary fraction of the organic aerosol in a Mediterranean urban area: Marseille, Atmos. Chem. Phys., 11, 2059–2079, https://doi.org/10.5194/acp-11-2059-2011, 2011.
Fu, P., Aggarwal, S. G., Chen, J., Li, J., Sun, Y., Wang, Z., Chen, H., Liao, H., Ding, A., Umarji, G. S., Patil, R. S., Chen, Q., and Kawamura, K.: Molecular Markers of Secondary Organic Aerosol in Mumbai, India, Environ. Sci. Technol., 50, 4659–4667, https://doi.org/10.1021/acs.est.6b00372, 2016.
Gao, J. J., Tian, H. Z., Cheng, K., Lu, L., Wang, Y. X., Wu, Y., Zhu, C. Y., Liu, K. Y., Zhou, J. R., Liu, X. G., Chen, J., and Hao, J. M.: Seasonal and spatial variation of trace elements in multi-size airborne particulate matters of Beijing, China: Mass concentration, enrichment characteristics, source apportionment, chemical speciation and bioavailability, Atmos. Environ., 99, 257–265, https://doi.org/10.1016/j.atmosenv.2014.08.081, 2014.
Ghirardo, A., Xie, J., Zheng, X., Wang, Y., Grote, R., Block, K., Wildt, J., Mentel, T., Kiendler-Scharr, A., Hallquist, M., Butterbach-Bahl, K., and Schnitzler, J.-P.: Urban stress-induced biogenic VOC emissions and SOA-forming potentials in Beijing, Atmos. Chem. Phys., 16, 2901–2920, https://doi.org/10.5194/acp-16-2901-2016, 2016.
Guo, S., Hu, M., Wang, Z. B., Slanina, J., and Zhao, Y. L.: Size-resolved aerosol water-soluble ionic compositions in the summer of Beijing: implication of regional secondary formation, Atmos. Chem. Phys., 10, 947–959, https://doi.org/10.5194/acp-10-947-2010, 2010.
Guo, S., Hu, M., Guo, Q., Zhang, X., Zheng, M., Zheng, J., Chang, C. C., Schauer, J. J., and Zhang, R.: Primary Sources and Secondary Formation of Organic Aerosols in Beijing, China, Environ. Sci. Technol., 46, 9846–9853, https://doi.org/10.1021/es2042564, 2012.
Guo, S., Hu, M., Guo, Q., Zhang, X., Schauer, J. J., and Zhang, R.: Quantitative evaluation of emission controls on primary and secondary organic aerosol sources during Beijing 2008 Olympics, Atmos. Chem. Phys., 13, 8303–8314, https://doi.org/10.5194/acp-13-8303-2013, 2013.
Guo, S., Hu, M., Zamora, M. L., Peng, J., Shang, D., Zheng, J., Du, Z., Wu, Z., Shao, M., and Zeng, L.: Elucidating severe urban haze formation in China, P. Natl. Acad. Sci., 111, 17373–17378, 2014a.
Guo, S., Hu, M., Guo, Q. F., and Shang, D. J.: Comparison of Secondary Organic Aerosol Estimation Methods, Acta Chim. Sinica, 72, 658–666, https://doi.org/10.6023/A14040254, 2014b.
Guo, S., Hu, M., Shang, D., Guo, Q., and Hu, W.: Research on Secondary Organic Aerosols Basing on Field Measurement, Acta Chim. Sinica, 72, 145–157, https://doi.org/10.6023/A13111169, 2014c.
Hallquist, M., Munthe, J., Hu, M., Wang, T., Chan, C. K., Gao, J., Boman, J., Guo, S., Hallquist, Å. M., and Mellqvist, J.: Photochemical smog in China: scientific challenges and implications for air-quality policies, Natl. Sci. Rev., 3, 401–403, 2016.
Haque, M. M., Kawamura, K., and Kim, Y.: Seasonal variations of biogenic secondary organic aerosol tracers in ambient aerosols from Alaska, Atmos. Environ., 130, 95–104, https://doi.org/10.1016/j.atmosenv.2015.09.075, 2016.
Hoyle, C. R., Boy, M., Donahue, N. M., Fry, J. L., Glasius, M., Guenther, A., Hallar, A. G., Huff Hartz, K., Petters, M. D., Petäjä, T., Rosenoern, T., and Sullivan, A. P.: A review of the anthropogenic influence on biogenic secondary organic aerosol, Atmos. Chem. Phys., 11, 321–343, https://doi.org/10.5194/acp-11-321-2011, 2011.
Hu, D., Bian, Q., Li, T. W., Lau, A. K., and Yu, J. Z.: Contributions of isoprene, monoterpenes, β-caryophyllene, and toluene to secondary organic aerosols in Hong Kong during the summer of 2006, J. Geophys. Res.-Atmos., 113, D22206, https://doi.org/10.1029/2008JD01043, 2008.
Hu, D., Bian, Q., Lau, A. K. H., and Yu, J. Z.: Source apportioning of primary and secondary organic carbon in summer PM2.5 in Hong Kong using positive matrix factorization of secondary and primary organic tracer data, J. Geophys. Res.-Atmos., 115, D16024, https://doi.org/10.1029/2009JD012498, 2010.
Hu, M., Guo, S., Peng, J.-F., and Wu, Z.-J.: Insight into characteristics and sources of PM2.5 in the Beijing–Tianjin–Hebei region, China, Natl. Sci. Rev., 2, 257–258, 2015.
Huang, X.-F., He, L.-Y., Hu, M., and Zhang, Y.-H.: Annual variation of particulate organic compounds in PM2.5 in the urban atmosphere of Beijing, Atmos. Environ., 40, 2449–2458, 2006.
Huang, X.-F., He, L.-Y., Hu, M., Canagaratna, M. R., Sun, Y., Zhang, Q., Zhu, T., Xue, L., Zeng, L.-W., Liu, X.-G., Zhang, Y.-H., Jayne, J. T., Ng, N. L., and Worsnop, D. R.: Highly time-resolved chemical characterization of atmospheric submicron particles during 2008 Beijing Olympic Games using an Aerodyne High-Resolution Aerosol Mass Spectrometer, Atmos. Chem. Phys., 10, 8933–8945, https://doi.org/10.5194/acp-10-8933-2010, 2010.
Jang, M. S., Czoschke, N. M., Lee, S., and Kamens, R. M.: Heterogeneous atmospheric aerosol production by acid-catalyzed particle-phase reactions, Science, 298, 814–817, https://doi.org/10.1126/science.1075798, 2002.
Kleindienst, T. E., Jaoui, M., Lewandowski, M., Offenberg, J. H., Lewis, C. W., Bhave, P. V., and Edney, E. O.: Estimates of the contributions of biogenic and anthropogenic hydrocarbons to secondary organic aerosol at a southeastern US location, Atmos. Environ., 41, 8288–8300, 2007.
Kleindienst, T., MichaelLewandowski, Offenberg, J., Edney, E., Jaoui, M., Zheng, M., X. Ding, and Edgerton, E.: Contribution of Primary and Secondary Sources to Organic Aerosol and PM2.5 at SEARCH Network Sites, J. Air Waste Manage. Assoc., 60, 1388–1399, https://doi.org/10.3155/1047-3289.60.11.1388, 2010.
Kourtchev, I., Warnke, J., Maenhaut, W., Hoffmann, T., and Claeys, M.: Polar organic marker compounds in PM2.5 aerosol from a mixed forest site in western Germany, Chemosphere, 73, 1308–1314, 2008.
Kristensen, K., Cui, T., Zhang, H., Gold, A., Glasius, M., and Surratt, J.: Dimers in α-pinene secondary organic aerosol: effect of hydroxyl radical, ozone, relative humidity and aerosol acidity, Atmos. Chem. Phys., 14, 4201–4218, https://doi.org/10.5194/acp-14-4201-2014, 2014.
Lambe, A. T., Miracolo, M. A., Hennigan, C. J., Robinson, A. L., and Donahue, N. M.: Effective Rate Constants and Uptake Coefficients for the Reactions of Organic Molecular Markers (n-Alkanes, Hopanes, and Steranes) in Motor Oil and Diesel Primary Organic Aerosols with Hydroxyl Radicals, Environ. Sci. Technol., 43, 8794–8800, https://doi.org/10.1021/es901745h, 2009.
Lappalainen, H. K., Sevanto, S., Bäck, J., Ruuskanen, T. M., Kolari, P., Taipale, R., Rinne, J., Kulmala, M., and Hari, P.: Day-time concentrations of biogenic volatile organic compounds in a boreal forest canopy and their relation to environmental and biological factors, Atmos. Chem. Phys., 9, 5447—5459, https://doi.org/10.5194/acp-9-5447-2009, 2009.
Lewandowski, M., Jaoui, M., Offenberg, J. H., Kleindienst, T. E., Edney, E. O., Sheesley, R. J., and Schauer, J. J.: Primary and secondary contributions to ambient PM in the midwestern United States, Environ. Sci. Technol., 42, 3303–3309, 2008.
Liu, Q. Y., Baumgartner, J., Zhang, Y., and Schauer, J. J.: Source apportionment of Beijing air pollution during a severe winter haze event and associated pro-inflammatory responses in lung epithelial cells, Atmos. Environ., 126, 28–35, https://doi.org/10.1016/j.atmosenv.2015.11.031, 2016.
Lough, G. C., Christensen, C. G., Schauer, J. J., Tortorelli, J., Mani, E., Lawson, D. R., Clark, N. N., and Gabele, P. A.: Development of molecular marker source profiles for emissions from on-road gasoline and diesel vehicle fleets, J. Air Waste Manage. Assoc., 57, 1190–1199, https://doi.org/10.3155/1047-3289.57.10.1190, 2007.
Miyazaki, Y., Jung, J., Fu, P., Mizoguchi, Y., Yamanoi, K., and Kawamura, K.: Evidence of formation of submicrometer water-soluble organic aerosols at a deciduous forest site in northern Japan in summer, J. Geophys. Res.-Atmos., 117, D19213, https://doi.org/10.1029/2012JD018250, 2012.
Offenberg, J. H., Lewis, C. W., Lewandowski, M., Jaoui, M., Kleindienst, T. E., and Edney, E. O.: Contributions of toluene and alpha-pinene to SOA formed in an irradiated toluene/alpha-pinene/NO(x)/air mixture: comparison of results using 14C content and SOA organic tracer methods, Environ. Sci. Technol., 41, 3972–3976, 2007.
Offenberg, J. H., Lewandowski, M., Edney, E. O., Kleindienst, T. E., and Jaoui, M.: Influence of Aerosol Acidity on the Formation of Secondary Organic Aerosol from Biogenic Precursor Hydrocarbons, Environ. Sci. Technol., 43, 7742–7747, https://doi.org/10.1021/es901538e, 2009.
Oros, D. R. and Simoneit, B. R. T.: Identification and emission rates of molecular tracers in coal smoke particulate matter, Fuel, 79, 515–536, https://doi.org/10.1016/S0016-2361(99)00153-2, 2000.
Park, S. S. and Cho, S. Y.: Tracking sources and behaviors of water-soluble organic carbon in fine particulate matter measured at an urban site in Korea, Atmos. Environ., 45, 60–72, 2011.
Rogge, W. F., Hildemann, L. M., Mazurek, M. A., Cass, G. R., and Simoneit, B. R. T.: Sources of fine organic aerosol. 4. Particulate abrasion products from leaf surfaces of urban plants, Environ. Sci. Technol., 27, 2700–2711, 1993.
Saathoff, H., Naumann, K.-H., Möhler, O., Jonsson, Å. M., Hallquist, M., Kiendler-Scharr, A., Mentel, T. F., Tillmann, R., and Schurath, U.: Temperature dependence of yields of secondary organic aerosols from the ozonolysis of α-pinene and limonene, Atmos. Chem. Phys., 9, 1551–1577, https://doi.org/10.5194/acp-9-1551-2009, 2009.
Schauer, J. J., Rogge, W. F., Hildemann, L. M., Mazurek, M. A., Cass, G. R., and Simoneit, B. R. T.: Source apportionment of airborne particulate matter using organic compounds as tracers, Atmos. Environ., 30, 3837–3855, https://doi.org/10.1016/1352-2310(96)00085-4, 1996.
Sheesley, R. J., Schauer, J. J., Zheng, M., and Wang, B.: Sensitivity of molecular marker-based CMB models to biomass burning source profiles, Atmos. Environ., 41, 9050–9063, 2007.
Simoneit, B. R., Schauer, J. J., Nolte, C., Oros, D. R., Elias, V. O., Fraser, M., Rogge, W., and Cass, G. R.: Levoglucosan, a tracer for cellulose in biomass burning and atmospheric particles, Atmos. Environ., 33, 173–182, 1999.
Song, G., Min, H., Qingfeng, G., and Dongjie, S.: Comparison of secondary organic aerosol estimation methods, Acta Chim. Sinica, 72, 658–666, 2014.
Song, Y., Zhang, Y., Xie, S., Zeng, L., Zheng, M., Salmon, L. G., Shao, M., and Slanina, S.: Source apportionment of PM2.5 in Beijing by positive matrix factorization, Atmos. Environ., 40, 1526–1537, 2006.
Stone, E. A., Zhou, J., Snyder, D. C., Rutter, A. P., Mieritz, M., and Schauer, J. J.: A comparison of summertime secondary organic aerosol source contributions at contrasting urban locations, Environ. Sci. Technol., 43, 3448–3454, https://doi.org/10.1021/es8025209, 2009.
Stone, E. A., Nguyen, T. T., Pradhan, B. B., and Dangol, P. M.: Assessment of biogenic secondary organic aerosol in the Himalayas, Environ. Chem., 9, 263–272, 2012.
Sun, J., Zhang, Q., Canagaratna, M. R., Zhang, Y., Ng, N. L., Sun, Y., Jayne, J. T., Zhang, X., Zhang, X., and Worsnop, D. R.: Highly time- and size-resolved characterization of submicron aerosol particles in Beijing using an Aerodyne Aerosol Mass Spectrometer, Atmos. Environ., 44, 131–140, 2010.
Surratt, J. D., Kroll, J. H., Kleindienst, T. E., Edney, E. O., Claeys, M., Sorooshian, A., Ng, N. L., Offenberg, J. H., Lewandowski, M., Jaoui, M., Flagan, R. C., and Seinfeld, J. H.: Evidence for organosulfates in secondary organic aerosol, Environ. Sci. Technol., 41, 517–527, https://doi.org/10.1021/es062081q, 2007.
Surratt, J. D., Chan, A. W., Eddingsaas, N. C., Chan, M., Loza, C. L., Kwan, A. J., Hersey, S. P., Flagan, R. C., Wennberg, P. O., and Seinfeld, J. H.: Reactive intermediates revealed in secondary organic aerosol formation from isoprene, P. Natl. Acad. Sci., 107, 6640–6645, 2010.
Tai, A. P., Mickley, L. J., and Jacob, D. J.: Correlations between fine particulate matter (PM2.5) and meteorological variables in the United States: Implications for the sensitivity of PM2.5 to climate change, Atmos. Environ., 44, 3976–3984, 2010.
Tan, J. H., Duan, J. C., Chai, F. H., He, K. B., and Hao, J. M.: Source apportionment of size segregated fine/ultrafine particle by PMF in Beijing, Atmos. Res., 139, 90–100, https://doi.org/10.1016/j.atmosres.2014.01.007, 2014.
Tao, J., Zhang, L., Cao, J., Zhong, L., Chen, D., Yang, Y., Chen, D., Chen, L., Zhang, Z., Wu, Y., Xia, Y., Ye, S., and Zhang, R.: Source apportionment of PM2.5 at urban and suburban areas of the Pearl River Delta region, south China – With emphasis on ship emissions, Sci. Total Environ., 574, 1559–1570, https://doi.org/10.1016/j.scitotenv.2016.08.175, 2017.
Tian, S. L., Pan, Y. P., and Wang, Y. S.: Size-resolved source apportionment of particulate matter in urban Beijing during haze and non-haze episodes, Atmos. Chem. Phys., 16, 1–19, https://doi.org/10.5194/acp-16-1-2016, 2016.
Turpin, B. J. and Huntzicker, J. J.: Identification of secondary organic aerosol episodes and quantitation of primary and secondary organic aerosol concentrations during SCAQS, Atmos. Environ., 29, 3527–3544, 1995.
Wang, B., Shao, M., Lu, S. H., Yuan, B., Zhao, Y., Wang, M., Zhang, S. Q., and Wu, D.: Variation of ambient non-methane hydrocarbons in Beijing city in summer 2008, Atmos. Chem. Phys., 10, 5911–5923, https://doi.org/10.5194/acp-10-5911-2010, 2010.
Wang, Q., Shao, M., Zhang, Y., Wei, Y., Hu, M., and Guo, S.: Source apportionment of fine organic aerosols in Beijing, Atmos. Chem. Phys., 9, 8573–8585, https://doi.org/10.5194/acp-9-8573-2009, 2009.
Wang, X., Bi, X., Sheng, G., and Fu, J.: Chemical composition and sources of PM10 and PM2.5 aerosols in Guangzhou, China, Environ. Monit. Assess., 119, 425–439, 2006.
Wong, J. P. S., Lee, A. K. Y., and Abbatt, J. P. D.: Impacts of Sulfate Seed Acidity and Water Content on Isoprene Secondary Organic Aerosol Formation, Environ. Sci. Technol., 49, 13215–13221, https://doi.org/10.1021/acs.est.5b02686, 2015.
Wu, Q., Wang, Z., Gbaguidi, A., Gao, C., Li, L., and Wang, W.: A numerical study of contributions to air pollution in Beijing during CAREBeijing-2006, Atmospheric Chemistry and Physics, 11, 5997–6011, https://doi.org/10.5194/acp-11-5997-2011, 2011.
Xiang, P., Zhou, X. M., Duan, J. C., Tan, J. H., He, K. B., Yuan, C., Ma, Y. L., and Zhang, Y. X.: Chemical characteristics of water-soluble organic compounds (WSOC) in PM2.5 in Beijing, China: 2011-2012, Atmos. Res., 183, 104–112, https://doi.org/10.1016/j.atmosres.2016.08.020, 2017.
Yang, F., Kawamura, K., Chen, J., Ho, K. F., Lee, S. C., Gao, Y., Cui, L., Wang, T. G., and Fu, P. Q.: Anthropogenic and biogenic organic compounds in summertime fine aerosols (PM2.5) in Beijing, China, Atmos. Environ., 124, 166–175, https://doi.org/10.1016/j.atmosenv.2015.08.095, 2016.
Yttri, K. E., Simpson, D., Nøjgaard, J. K., Kristensen, K., Genberg, J., Stenström, K., Swietlicki, E., Hillamo, R., Aurela, M., Bauer, H., Offenberg, J. H., Jaoui, M., Dye, C., Eckhardt, S., Burkhart, J. F., Stohl, A., and Glasius, M.: Source apportionment of the summer time carbonaceous aerosol at Nordic rural background sites, Atmos. Chem. Phys., 11, 13339–13357, https://doi.org/10.5194/acp-11-13339-2011, 2011.
Yu, L. D., Wang, G. F., Zhang, R. J., Zhang, L. M., Song, Y., Wu, B. B., Li, X. F., An, K., and Chu, J. H.: Characterization and Source Apportionment of PM2.5 in an Urban Environment in Beijing, Aerosol Air Qual. Res., 13, 574–583, https://doi.org/10.4209/aaqr.2012.07.0192, 2013.
Zhang, H., Zhang, Z., Cui, T., Lin, Y.-H., Bhathela, N. A., Ortega, J., Worton, D. R., Goldstein, A. H., Guenther, A., Jimenez, J. L., Gold, A., and Surratt, J. D.: Secondary Organic Aerosol Formation via 2-Methyl-3-buten-2-ol Photooxidation: Evidence of Acid-Catalyzed Reactive Uptake of Epoxides, Environ. Sci. Technol. Lett., 1, 242–247, https://doi.org/10.1021/ez500055f, 2014.
Zhang, Q., Streets, D. G., Carmichael, G. R., He, K. B., Huo, H., Kannari, A., Klimont, Z., Park, I. S., Reddy, S., Fu, J. S., Chen, D., Duan, L., Lei, Y., Wang, L. T., and Yao, Z. L.: Asian emissions in 2006 for the NASA INTEX-B mission, Atmos. Chem. Phys., 9, 5131–5153, https://doi.org/10.5194/acp-9-5131-2009, 2009.
Zhang, R., Jing, J., Tao, J., Hsu, S.-C., Wang, G., Cao, J., Lee, C. S. L., Zhu, L., Chen, Z., and Zhao, Y.: Chemical characterization and source apportionment of PM2.5 in Beijing: seasonal perspective, Atmos. Chem. Phys., 13, 7053–7074, https://doi.org/10.5194/acp-13-7053-2013, 2013.
Zhang, Y., Cai, J., Wang, S., He, K., and Zheng, M.: Review of receptor-based source apportionment research of fine particulate matter and its challenges in China, Sci. Total Environ., 586, 917–929, https://doi.org/10.1016/j.scitotenv.2017.02.071, 2017.
Zhang, Y. X., Sheesley, R. J., Schauer, J. J., Lewandowski, M., Jaoui, M., Offenberg, J. H., Kleindienst, T. E., and Edney, E. O.: Source apportionment of primary and secondary organic aerosols using positive matrix factorization (PMF) of molecular markers, Atmos. Environ., 43, 5567–5574, 2009.
Zheng, J., Hu, M., Peng, J., Wu, Z., Kumar, P., Li, M., Wang, Y., and Guo, S.: Spatial distributions and chemical properties of PM2.5 based on 21 field campaigns at 17 sites in China, Chemosphere, 159, 480–487, 2016.
Zheng, M., Salmon, L. G., Schauer, J. J., Zeng, L., Kiang, C., Zhang, Y., and Cass, G. R.: Seasonal trends in PM2.5 source contributions in Beijing, China, Atmos. Environ., 39, 3967–3976, 2005.
Zheng, X. X., Guo, X. Y., Zhao, W. J., Shu, T. T., Xin, Y. A., Yan, X., Xiong, Q. L., Chen, F. T., and Lv, M.: Spatial variation and provenance of atmospheric trace elemental deposition in Beijing, Atmos. Pollut. Res., 7, 260–267, https://doi.org/10.1016/j.apr.2015.10.006, 2016.
Zhou, J. B., Xiong, Y., Xing, Z. Y., Deng, J. J., and Du, K.: Characterizing and sourcing ambient PM2.5 over key emission regions in China II: Organic molecular markers and CMB modeling, Atmos. Environ., 163, 57–64, https://doi.org/10.1016/j.atmosenv.2017.05.033, 2017.
Zhu, C., Kawamura, K., and Fu, P.: Seasonal variations of biogenic secondary organic aerosol tracers in Cape Hedo, Okinawa, Atmos. Environ., 130, 113–119, https://doi.org/10.1016/j.atmosenv.2015.08.069, 2016.
Zhu, Y., Yang, L., Kawamura, K., Chen, J., Ono, K., Wang, X., Xue, L., and Wang, W.: Contributions and source identification of biogenic and anthropogenic hydrocarbons to secondary organic aerosols at Mt. Tai in 2014, Environ. Pollut., 220, 863–872, https://doi.org/10.1016/j.envpol.2016.10.070, 2017.