the Creative Commons Attribution 4.0 License.
the Creative Commons Attribution 4.0 License.
 | 20 Mar 2018
Observational analyses of dramatic developments of a severe air pollution event in the Beijing area
Mingyu Zhou
Zhigang Cheng
Qingchun Li
Xiaoyan Cao
Jingjiang Zhang
A rapid development of a severe air pollution event in Beijing, China, at the end of November 2015 was investigated with unprecedented observations collected during the field campaign of the Study of Urban Rainfall and Fog/Haze (SURF-15). Different from previous statistical analyses of air pollution events and their correlations with meteorological environmental conditions in the area, the role of turbulent mixing in the pollutant transfer was investigated in detail. The analyses indicate that the major pollution source associated with high particulate matter of diameter 2.5 µm (PM2.5) was from south of Beijing. Before the day of the dramatic PM2.5 increase, the nighttime downslope flow from the mountains to the west and north of Beijing reduced the surface PM2.5 concentration northwest of Beijing. The nighttime surface stable boundary layer (SBL) not only kept the relatively less-polluted air near the surface, it also shielded the rough surface from the pollutant transfer by southwesterly winds above the SBL, leading to the fast transport of pollutants over the Beijing area at night. As the daytime convective turbulent mixing developed in the morning, turbulent mixing transported the elevated polluted air downward even though the weak surface wind was from northeast, leading to the dramatic increase of the surface PM2.5 concentration in the urban area. As a result of both turbulent mixing and advection processes with possible aerosol growth from secondary aerosol formation under the low-wind and high-humidity conditions, the PM2.5 concentration reached over 700 µg m−3 in the Beijing area by the end of the day. Contributions of the two transporting processes to the PM2.5 oscillations prior to this dramatic event were also analyzed. The study demonstrates the important role of large-eddy convective turbulent mixing in vertical transfer of pollutants and the role of the SBL in not only decoupling vertical transport of trace gases and aerosols but also in accelerating horizontal transfer of pollutants above.


Rapid urbanization in China associated with its fast growing economy has led to heavy air pollution, which has drawn international attention. Although the number of “blue sky” days measured by the air quality index (AQI) increased in 2015 from its 2014 number according to the state bulletin issued by the Chinese Ministry of Environmental Protection (MEP), air pollution is still a serious issue especially in the region of Beijing–Tianjin–Hebei (BTH) and its surrounding area including provinces of Shanxi, Shandong, Henan, and Inner Mongolia. Heavy pollution events occurred frequently in the BTH region and its surrounding area. In 2015, 13 cities in the BTH region that are monitored by the MEP failed to meet the Chinese air quality standard for 47.6 % of the year (with light, medium, heavy, and severe pollution days at 27.1, 10.5, 6.8, and 3.2 % of the year, respectively).
Air pollution occurrence frequency, intensity, and impact areas are major concerns in China. An increasing number of studies have focused on Chinese air pollution and haze issues (Liang and Tang, 2017; Liu et al., 2017; Wang et al., 2018, 2017; Zhang et al., 2017a, b; Zhong et al., 2017). The worst pollution season in the Beijing area is during fall and winter, between October and March, although pollution may also occur frequently in summer (Li et al., 2016; Zhao et al., 2012). A number of studies have found that heavy pollution in Beijing is often associated with surface low pressures and weak winds (Meng and Cheng, 2002). Because Beijing is surrounded by the mountains from west to north, local circulations that are thermally and mechanically forced by the mountains, land–sea contrasts from the Bohai east of Beijing, and urban canopies also contribute to air pollution transportation in the Beijing area (Chen et al., 2009; Liu et al., 2009).
Zhang et al. (2006) indicated that the planetary boundary layer (PBL) depth is associated with the expansion volume for pollutants; low PBLs such as the stable boundary layer (SBL) provide favorite conditions for development of heavy pollution events. Xu et al. (2005), Zhao et al. (2013), and Liao et al. (2014) investigated correlations between environmental conditions of the atmospheric boundary layer and relatively high pollution events and also emphasized the role of the SBL in trapping pollutants. Y. Wang et al. (2014) reported that explosively developed and long-lasting air pollution events in Beijing are commonly associated with weak winds from weak pressure systems, the SBL, and high humidity. They also pointed out that rapid disappearance of air pollution is commonly due to strong northerly winds associated with a surface high pressure centered west of Beijing. Air pollution enhances concentration of particulate matter with diameter 2.5 µm (PM2.5), which affect human health and reduce visibility.
Human activities contribute to increased water vapor release in urban areas compared to rural areas as observed by Dou et al. (2014) especially in the nighttime SBL in winter. Pollutant contents have been investigated by Xu et al. (2005), Y. Wang et al. (2014), and Li et al. (2016). Han and Zhang (2014) found that relative humidity of about 10 to 40 % higher than the annual average value was often connected with heavy pollution events in the Beijing area and its surrounding provinces. Zhang et al. (2012) investigated high-humidity enhancement of hygroscopic growth of aerosols. Zhang et al. (2007) analyzed chemical characteristics of seasonal variations of PM2.5 in Beijing. Sun et al. (2014) found that high humidity could also enhance heterogeneous chemical reactions with highly concentrated mineral particles to increase generation of secondary aerosols. Quan et al. (2014) found that during heavy pollution events, significant amounts of NO3 and SO4 particles can be produced by gas–particle transformation from NOx and SO2. Zhao et al. (2013) observed secondary formation of aerosols including inorganic and organic pollutants and emphasized heterogeneous reaction processes in contribution of sulfate and nitrate to the PM2.5 concentration.
There are two general aspects which explain air pollution: aerosol transport and generation mechanisms; the two processes are highly correlated. Atmospheric circulations controlled by mechanical and thermal forcing provide conditions for not only aerosol transport but also for aerosol formation and growth. Although there is an increasing number of publications on air pollution transport in the Beijing area, most of them concentrated on statistical relationships among PM2.5 concentrations, atmospheric variables, and weather patterns based on numerical models with limited observations. Although there are modeling studies on regional transport of pollutants (Z. Wang et al., 2014), few are on detailed observational analyses of pollutant transporting mechanisms due to a lack of spatial coverage of meteorological and aerosol observations, especially on turbulent mixing in pollutant transport in the Beijing area. In this study, we concentrate on a severe air pollution event through detailed analyses of aerosol transporting mechanism with both turbulence and aerosol observations from an intensified field campaign in the Beijing area.
During the 7-day period between 26 November and 2 December 2015, an extremely heavy pollution event with the daily mean AQI greater than 200 developed in the Beijing area. The event would be classified as “red alert” by the MEP. However based on the local forecast, the pollution intensity of “orange alert” was issued instead. The failure of issuing the correct warning was publicized widely. As far as we know, three studies have investigated this event. Both Fan et al. (2016) and Zhang et al. (2017a) studied the case with the WRF mesoscale numerical model, and Hao et al. (2017) focused on the role of humidity in aerosol development at Tianjin. Although Zhang et al. (2017a) concluded that the spatial pattern of the PM2.5 concentration for this event could be predicted by the WRF-Chem model, the model failed to predict its peak value. During this event, the PM2.5 concentration oscillated dramatically starting at 12 h before the final rapid increase on 30 November. This event happened to occur during the 3-year field campaign of the Study of Urban Rainfall and Fog/Haze (SURF-15; Liang et al., 2018), which started in the spring of 2015. Using extra measurements from SURF-15 as well as routine measurements across the Beijing area described in Sect. 2, we investigate physical processes that led to the heavy pollution event in this study. We first study the regional environment related to the development of the heavy pollution event in Sect. 3. We then examine physical transporting processes responsible for the large oscillations of PM2.5 on 29 November prior to the dramatic increase of PM2.5, the rapid development of the severe pollution event on 30 November, and the dramatic decrease of the high PM2.5 on the evening of 1 December in Sect. 4. The summary is in Sect. 5.
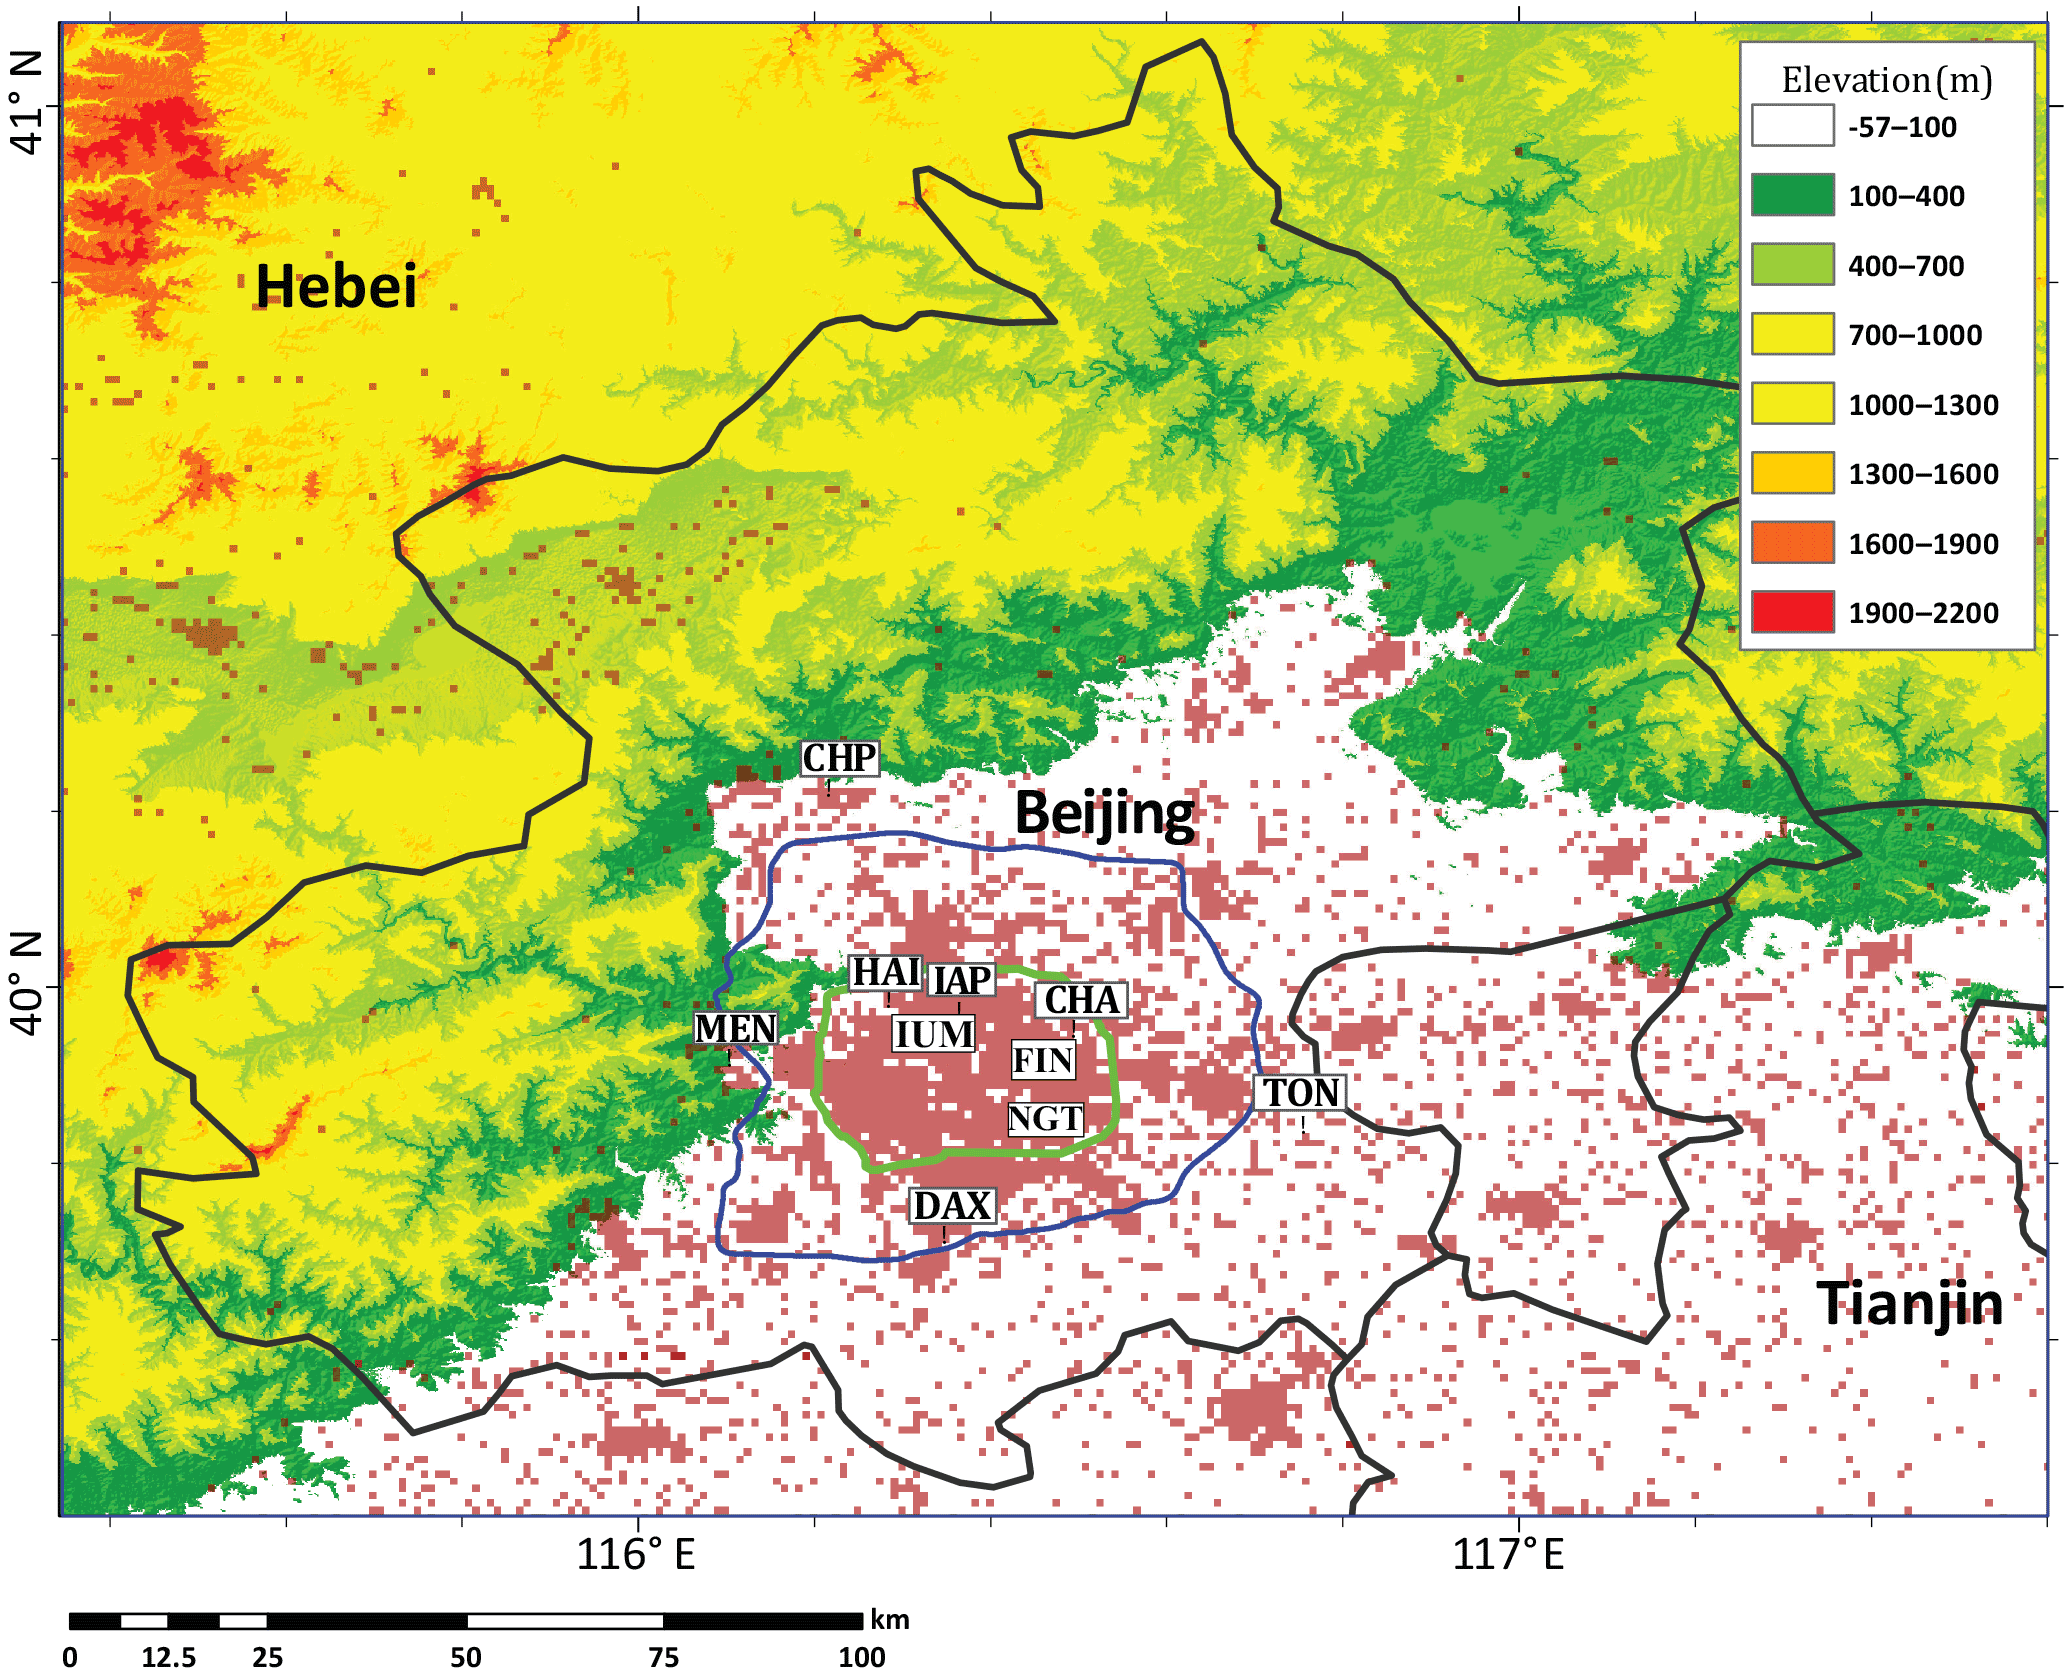
Figure 1Map of topography around Beijing (bounded by the black curve with Beijing in its center), China, where the building areas (brown dots), the sixth (blue curve) and the fifth (green curve) ring roads, and the main observation sites used in this study are marked.
The observations (http://www.ium.cn/dataCenter/) were collected during SURF-15 sponsored by the Institute of Urban Meteorology (IUM). We mainly focus on the data collected at the research site operated by the Institute of Atmospheric Physics (IAP), Chinese Academy of Sciences. All the observation heights used in this study are above the ground level (AGL). At the IAP site, a 325 m research tower has been operational since 1978. Wind directions (020C, American MetOne) and speeds (010C, American MetOne), and air temperature and relatively humidity (HC2-S3, Rotronic, Switzerland) were measured at 15 levels (8, 15, 32, 47, 65, 80, 100, 120, 140, 160, 180, 200, 240, 280, 320 m) on the tower with the sampling rate of 1 sample 20 s−1 and averaged to 1 sample 1 min−1. Wind speed at each level was measured on two booms: one pointed to 315∘ from north and the other one to 135∘; the larger value of the two is chosen as the wind speed for the level. Wind directions were measured by only one sensor at each level. Three-dimensional sonic anemometers – each on a 2.2 m boom from the tower center – were installed at 47 m (Windmaster, Gill), 140 m (CSAT3, Campbell Scientific), and 280 m (CSAT3, Campbell Scientific) at the direction of 30∘, 210∘, and 230∘ relative to the center of the tower, respectively. Downward- and upward-pointing pyrgeometers and pyranometers (CNR1, Kipp & Zonen) and CO2/H2O concentrations sensors (LI-7500) were also installed at these three levels. The data from the sonic anemometers and the LI-7500 sensors were sampled at 10 samples s−1. The turbulence data were calculated at every 30 min segment using the EDDY-PRO software (Burba, 2013). We also use a surface station about 20 m south of the IAP tower, where wind speed and direction (05103-L, R. M. Young), and temperature and relatively humidity (HMP45C, Vaisala) at 2.2 m were measured at 1 sample per 2 s.
In addition, a Doppler lidar (Windcube 100S, Leosphere) and a mini-micropulse aerosol lidar (mini-MPL, SigmaSpace) were located at about 20 m west–northwest of the IAP tower; the two lidars were 3 m apart. To observe wind profiles, the Doppler beam swinging (DBS) mode was used (Campbell et al., 2002). The lidar measurements with the vertical resolution of 20 m were recorded at every 5 s interval and averaged to 1 min segments. Due to the optical overlap function issue (Hey et al., 2011), the lowest Doppler lidar observation height was set to 70 m based on comparison between lidar and in situ observations even though its first range gate of 50 m is issued by the manufacturer. Wind speeds and directions as well as the carrier-to-noise ratio (CNR), which is found to be highly correlated with aerosol backscatter (Aitken et al., 2012), were observed from the Doppler lidar. Normalized relative backscatters (NRBs) were derived from the mini-MPL lidar measurement with the sampling rate of 1 sample 30 s−1 and the vertical resolution of 30 m above 100 m.
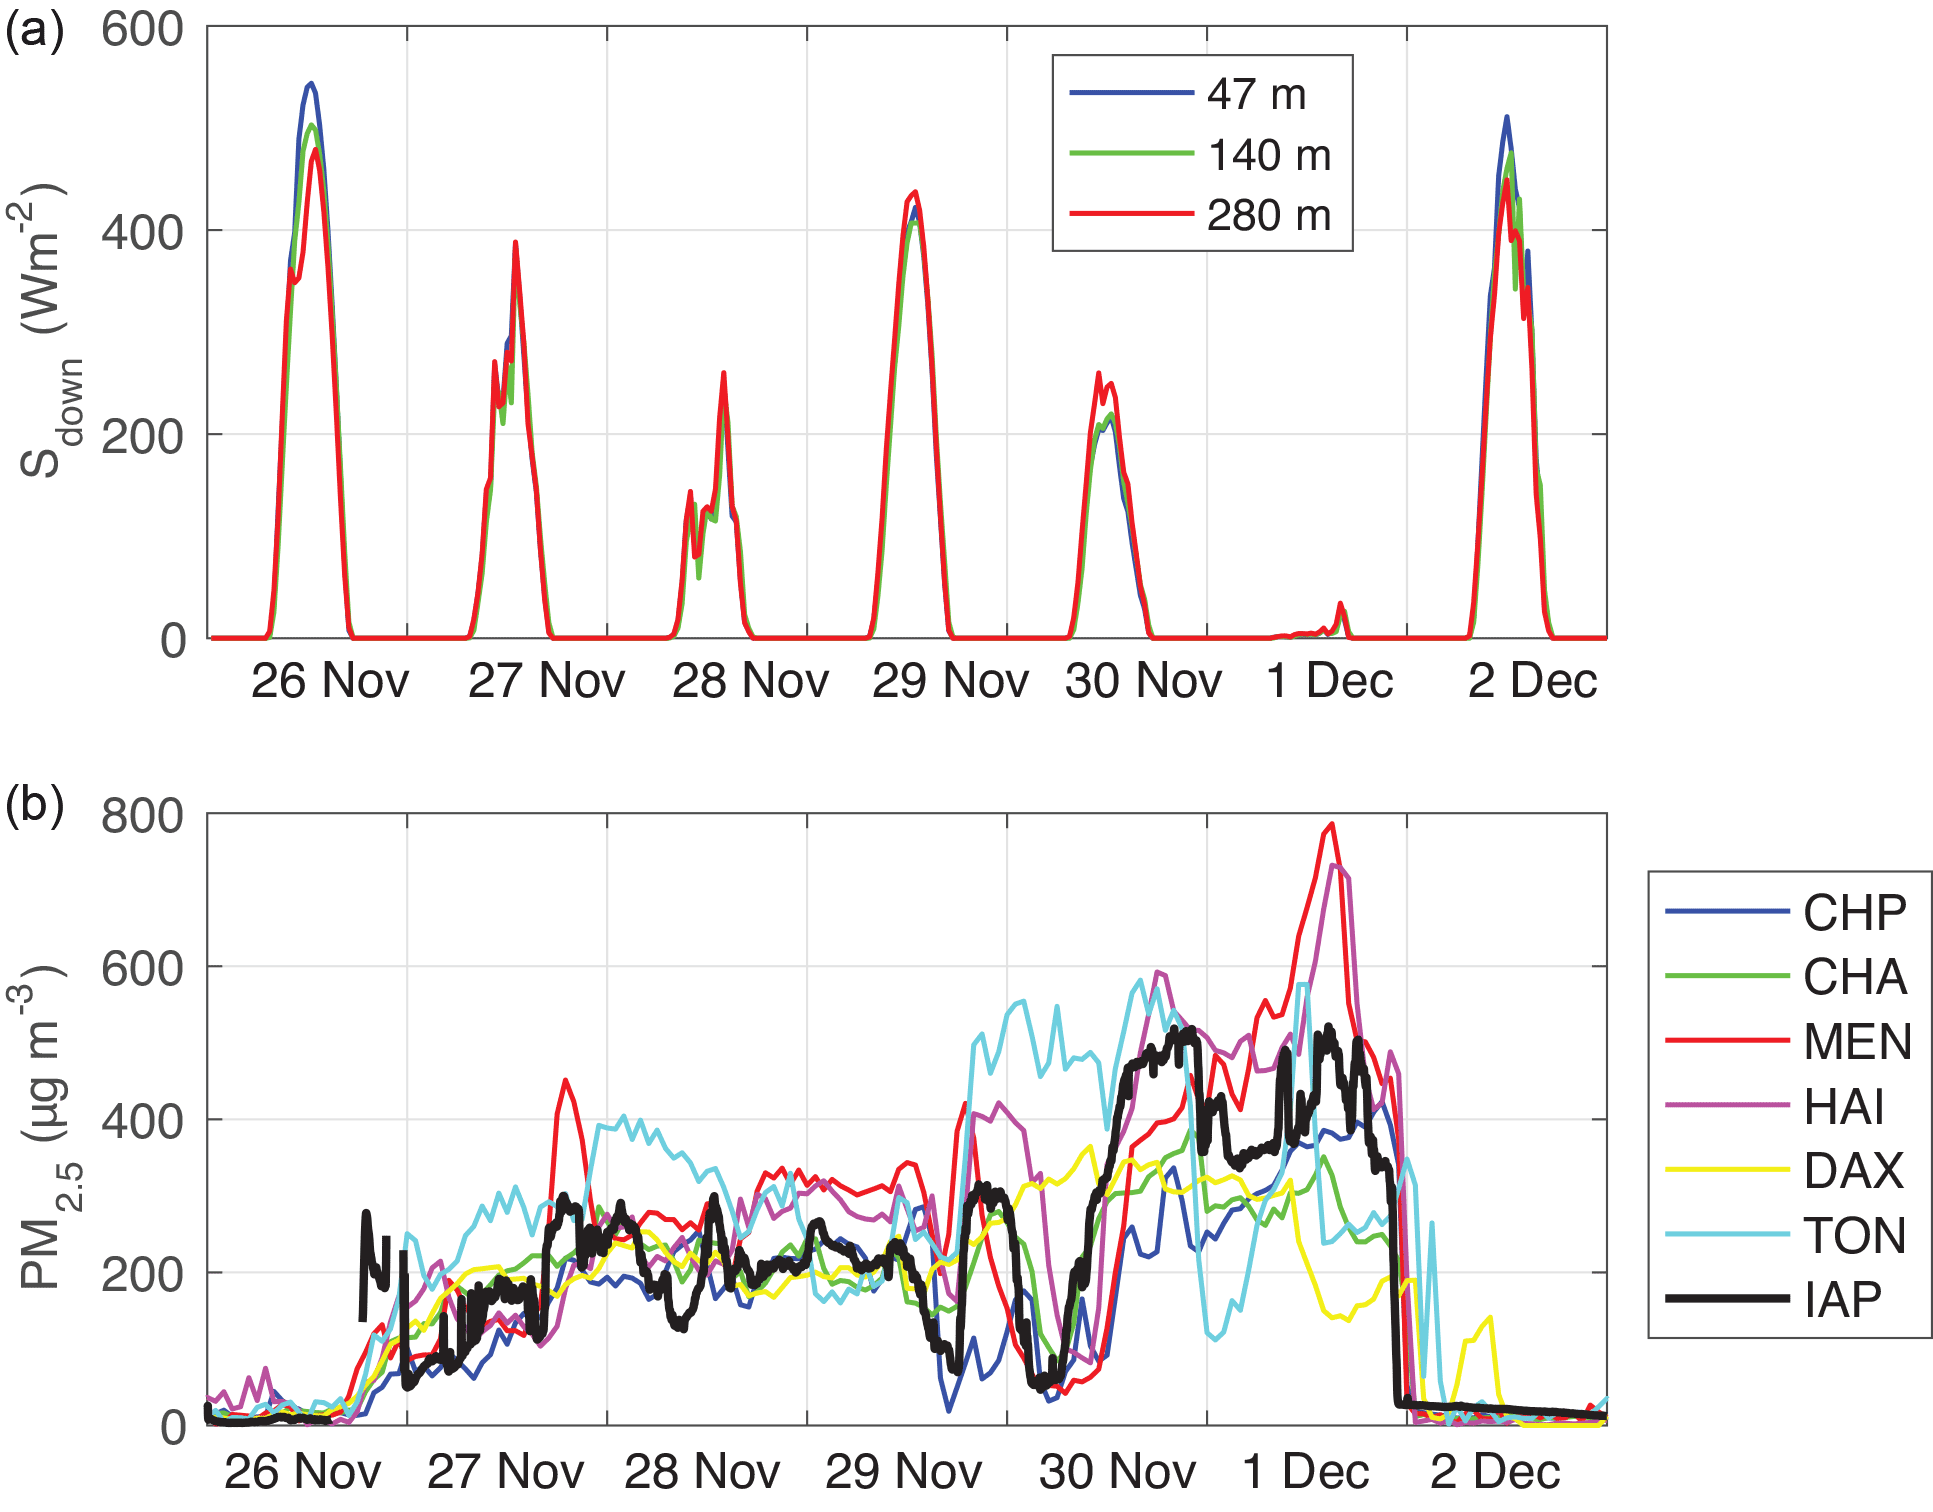
Figure 2(a) The downward solar radiation Sdown at the labeled heights and (b) the temporal variation of the PM2.5 concentration at the labeled stations.
Furthermore, we use remote sensed measurements from a mini-MPL at IUM, a ceilometer lidar (CL51) at Finnish Embassy (FIN), a wind profiler (CFL-08) at Nanjiao Guanxiang Tai (NGT) and at Haidian (HAI) located 7 km to the northwest of the IAP tower (all these locations are marked in Fig. 1). We also use radio soundings launched twice a day at NGT, which is about 20 km southeast of the IAP tower. During the study period, daily MODIS (Moderate Resolution Imaging Spectroradiometer) Rapid Response satellite images over the Beijing area are available from AERONET (https://aeronet.gsfc.nasa.gov/).
We also use 5 min measurements from the dense network of automatic weather stations (AWSs) operated by Beijing Meteorological Service (BMS). These data include wind speed and direction (EL15-2C) at 10 m, temperature and humidity (HMP155, Chinese Huayun Company) at 1.5 m, and pressure (PTB210, Chinese Huayun Company) at 1.5 m observed at Changping (CHP), Chaoyang (CHA), Mentougou (MEN), Daxing (DAX), Tongzhou (TON), and HAI. In addition, we also use the hourly PM2.5 concentration measured at ∼ 2 m at these stations, which belongs to the BMS air quality monitoring network, and the PM2.5 concentration at ∼ 10 m at the IAP site sampled at every minute. The PM2.5 concentration was measured with sensors from the LGH-01E, Landun Photoelectron Company at HAI, MEN, and TON, with Grimm 180 at CHA, CHP, and DAX, and with Thermo SHARP5030 at IAP.
On 26 November, the surface PM2.5 concentration began to increase steadily (Fig. 2). Starting from 05:00 LST, 30 November, the PM2.5 concentration increased dramatically and reached to 732 µg m−3 at HAI and 786 µg m−3 at MEN at 15:00 LST on 1 December.
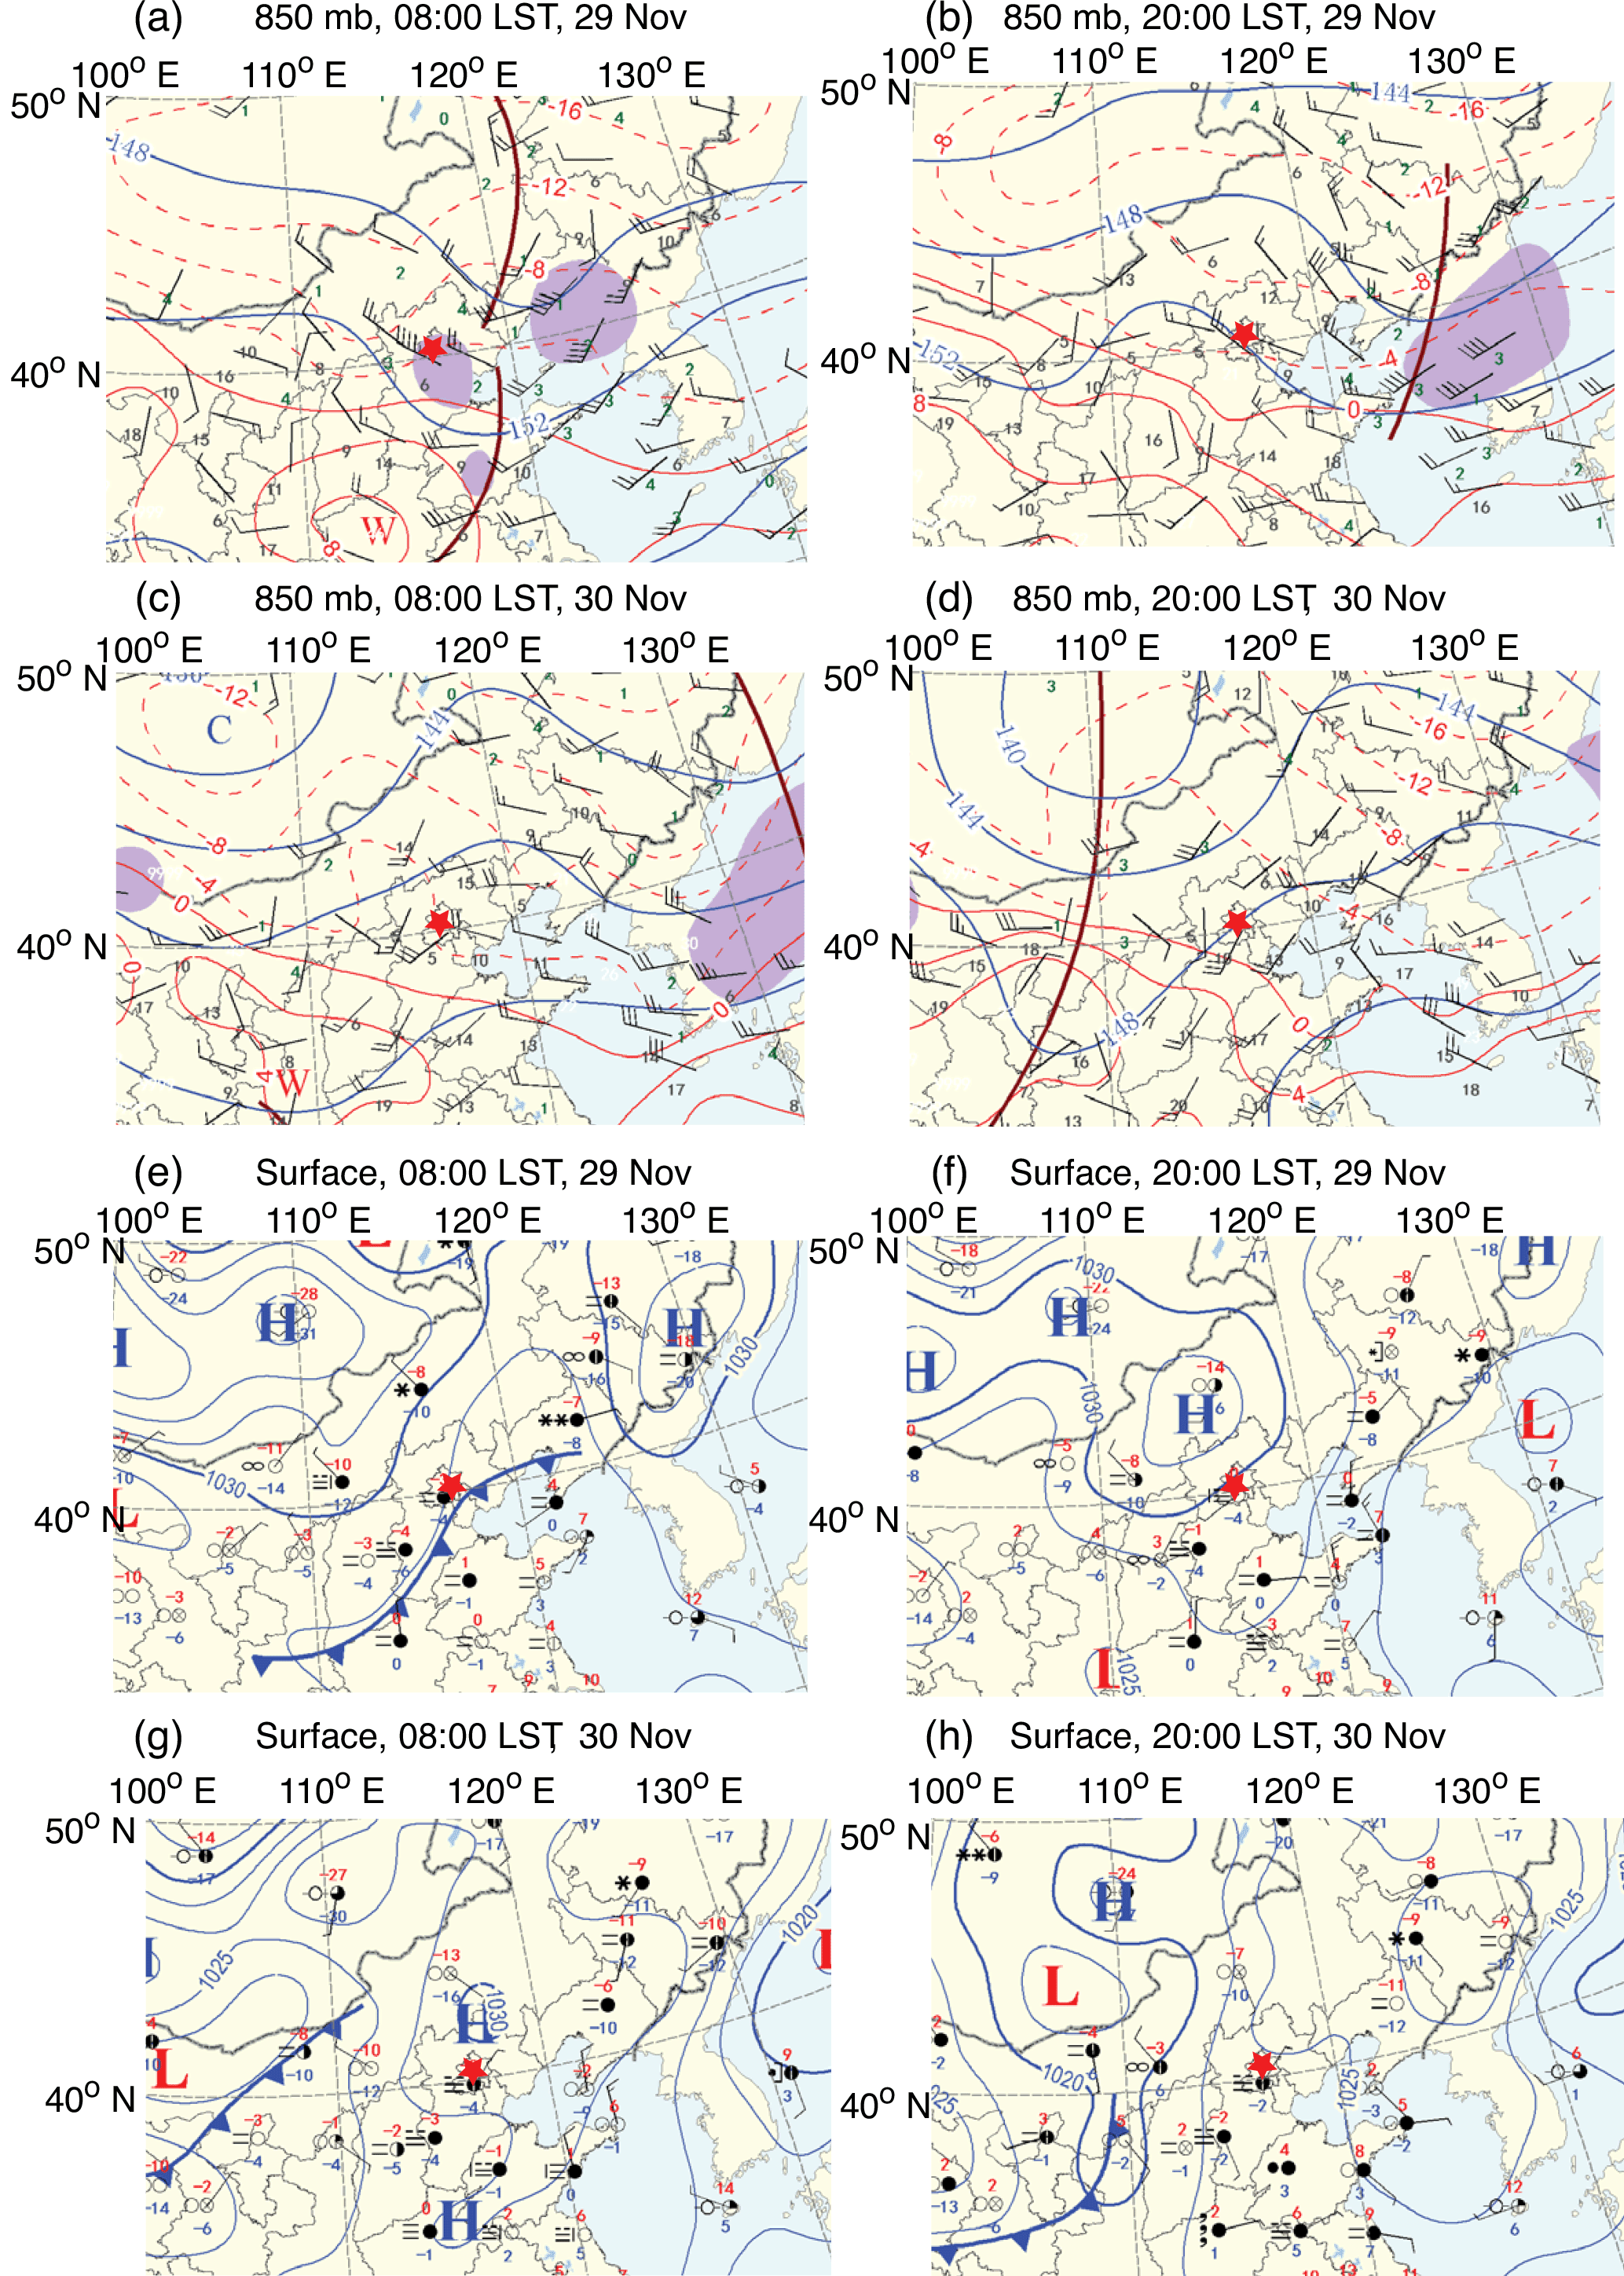
Figure 3The 850 mb weather maps at (a) 08:00 LST and (b) 20:00 LST for 29 November and at (c) 08:00 LST and (d) 20:00 LST for 30 November; surface maps at (e) 08:00 LST and (f) 20:00 LST on 29 November and at (g) 08:00 LST and (h) 20:00 LST on 30 November, where Beijing is marked by the red star in each panel.
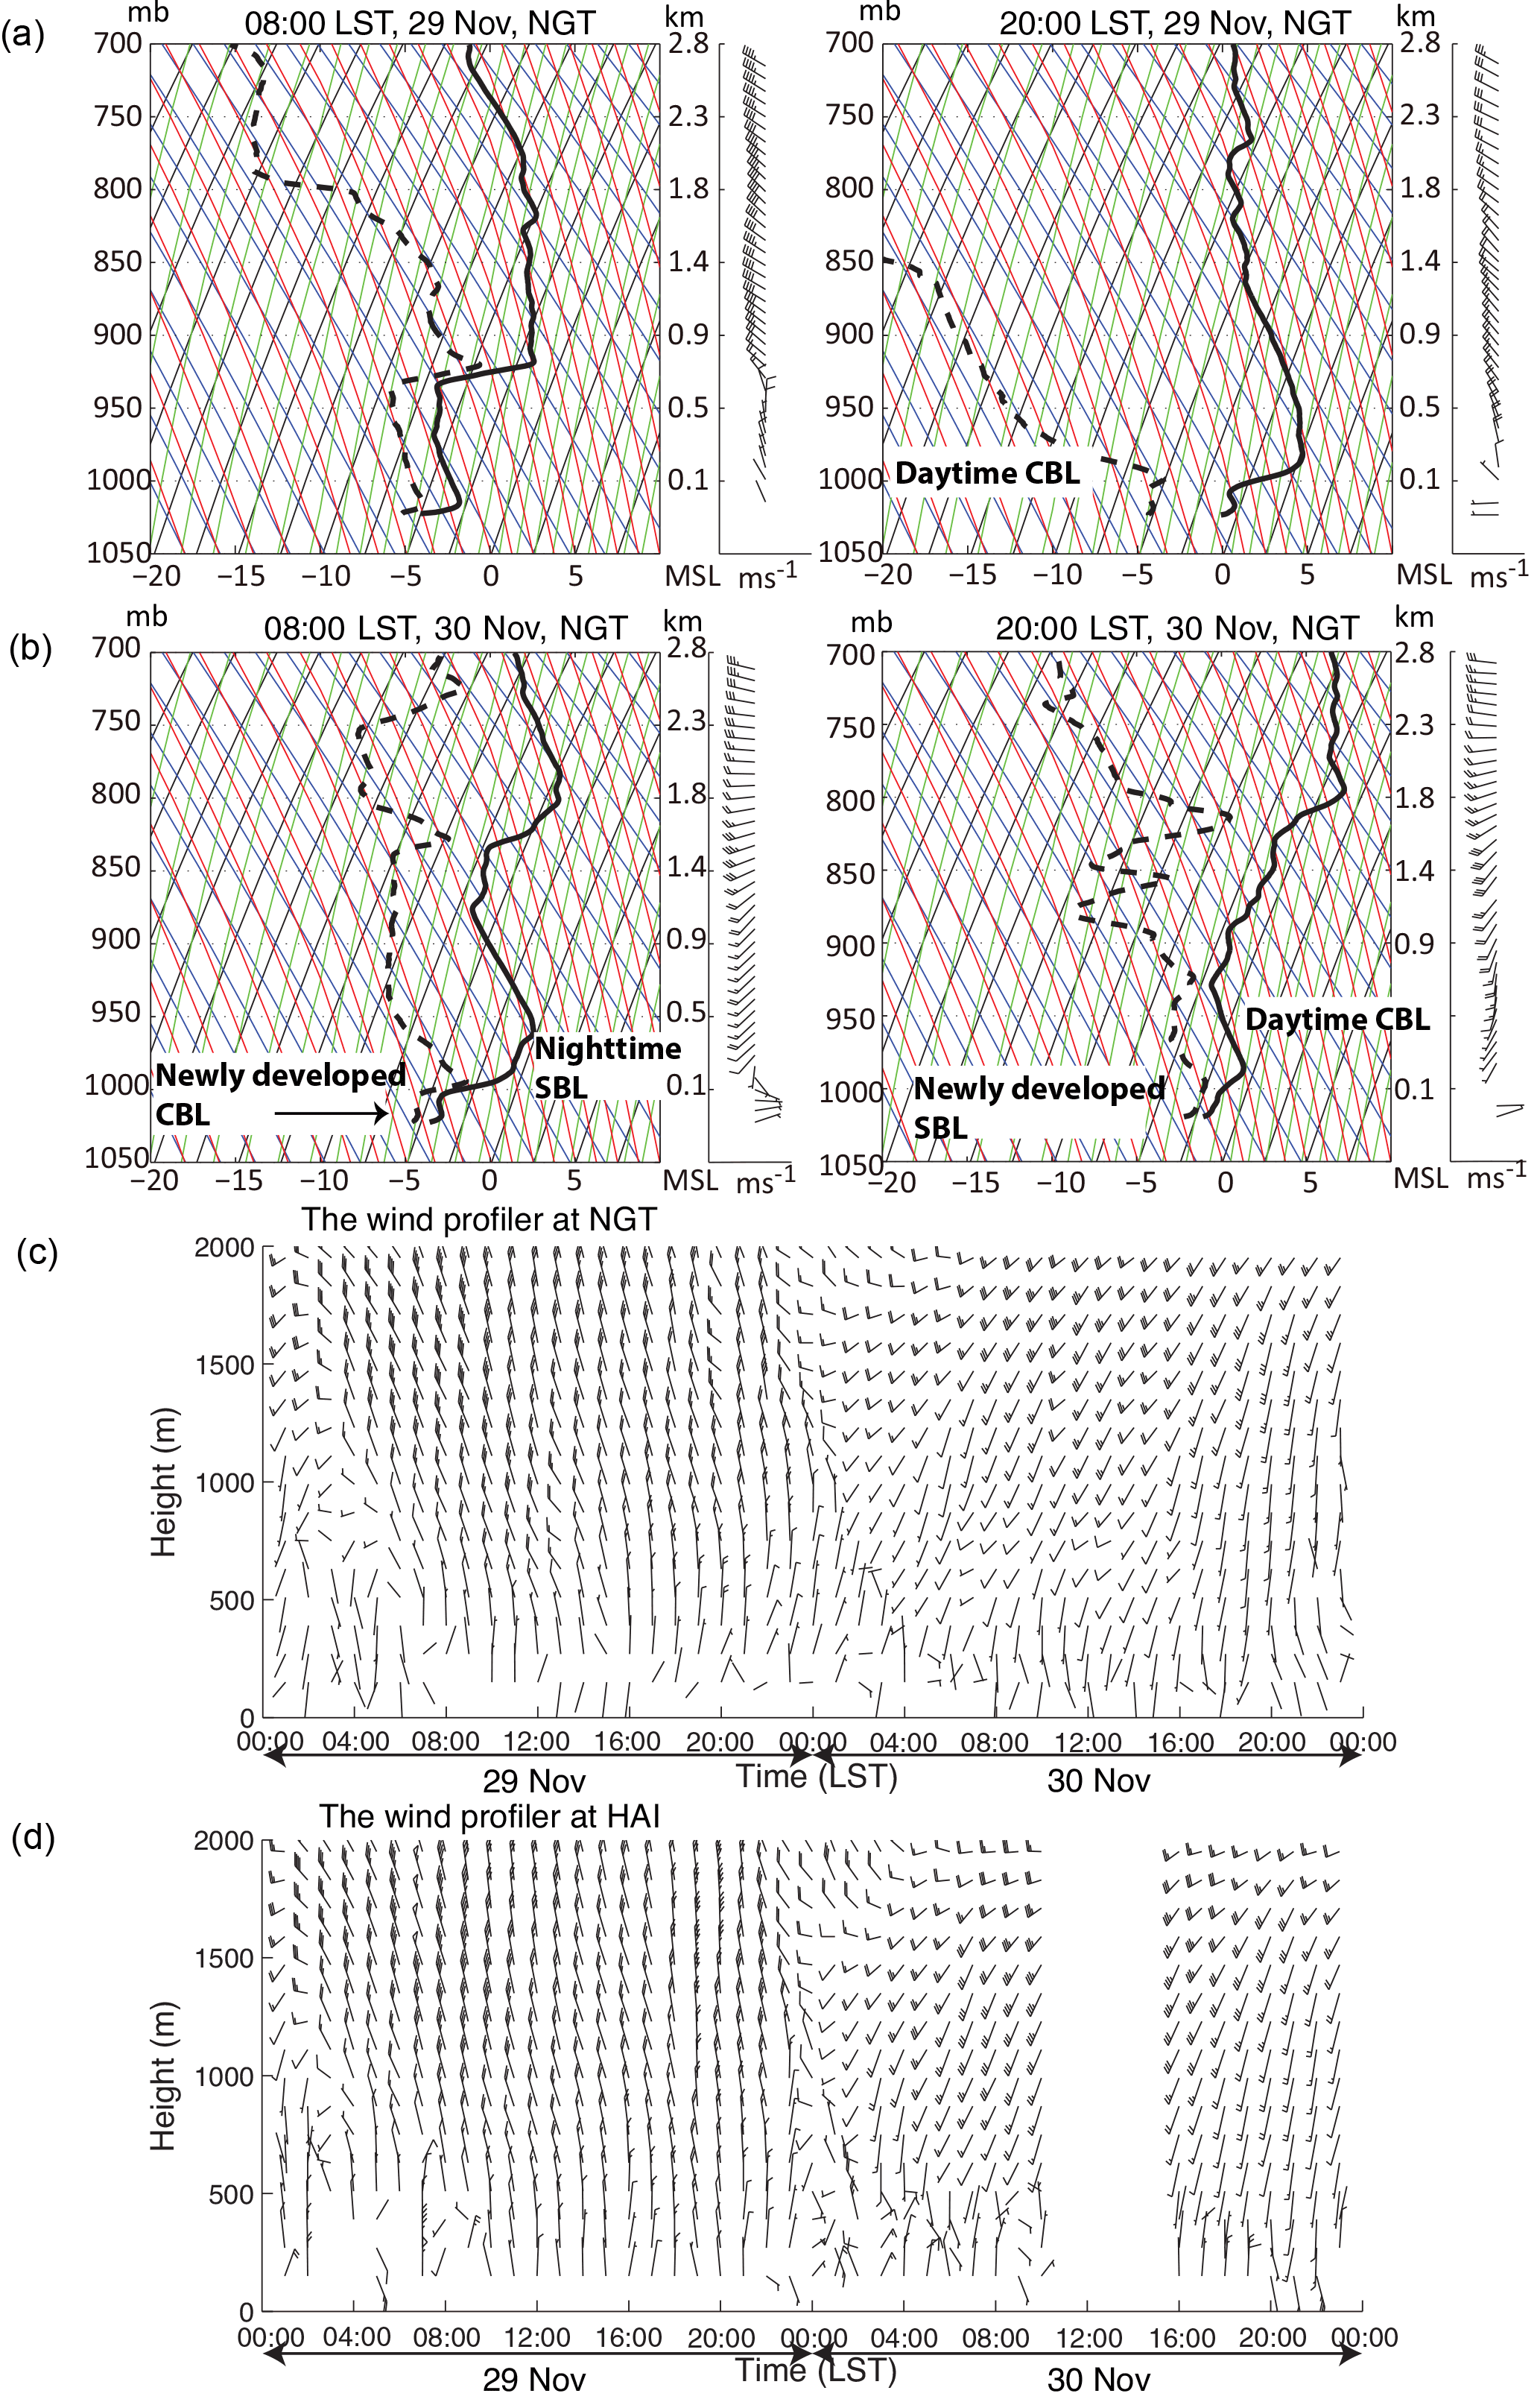
Figure 4Temperature (solid), dew point (dashed), and wind vectors from the sounding profiles at 08:00 LST and 20:00 LST at NGT on 29 (a) and 30 (b) November, and the temporal variation of the hourly wind-vector profiles from the wind profiler at NGT (c) and at HAI (d) for 29–30 November.
Horizontally, a weak high pressure ridge at 850 mb moved from west to east of Beijing during 29–30 November (Fig. 3). Because of the movement of this pressure ridge, the wind at the upper PBL changed from northwesterly on 29 November to southwesterly on 30 November, which is consistent with the sounding observations at NGT (Fig. 4). The wind profiler observations at both NGT and HAI indicate that the wind direction change occurred about midnight on 29 November (Fig. 4). On the surface, Beijing was between a high pressure center to the northwest and a low pressure center to the southeast on 29 November resulting in an easterly flow in Beijing. As the weak high pressure moved eastward, Beijing was between a weak high pressure to the east and a low pressure to the west on 30 November and was under influence of weak northeasterly winds (Fig. 3).
Vertically, the 20:00 LST sounding at NGT on 29 November shows that there was a well-mixed layer above about 200 m up to about 1400 m indicating that the convective turbulent mixing during the daytime of 29 November was relatively strong (Fig. 4). The 08:00 LST sounding on 30 November indicates that a well-mixed convective boundary layer (CBL) started to develop near the surface with the overnight SBL above, which was being entrained into the CBL below. The relatively well-mixed residual layer from the previous daytime mixing was above the elevated SBL (Fig. 4). The CBL on 30 November was associated with weak northeasterly winds, and the stable layer above was dominated by southwesterly winds. The relative humidity was highest in the stable layer compared to the residual layer above and the newly developed CBL below. Within the stable layer, the relative humidity decreased with height and dropped sharply at its bottom due to the turbulent mixing in the CBL below. By 20:00 LST on 30 November, the surface layer changed into a SBL of nearly 100 m thickness with the daytime well-mixed air above. The wind direction in the daytime convective boundary layer above the newly developed SBL became southerly and the bottom SBL was northeasterly to easterly. In addition, the air humidity increased in both the SBL and the daytime convective layer above. The increased humidity is consistent with the reported visibility of less than 1 km at most AWSs around Beijing on 30 November.
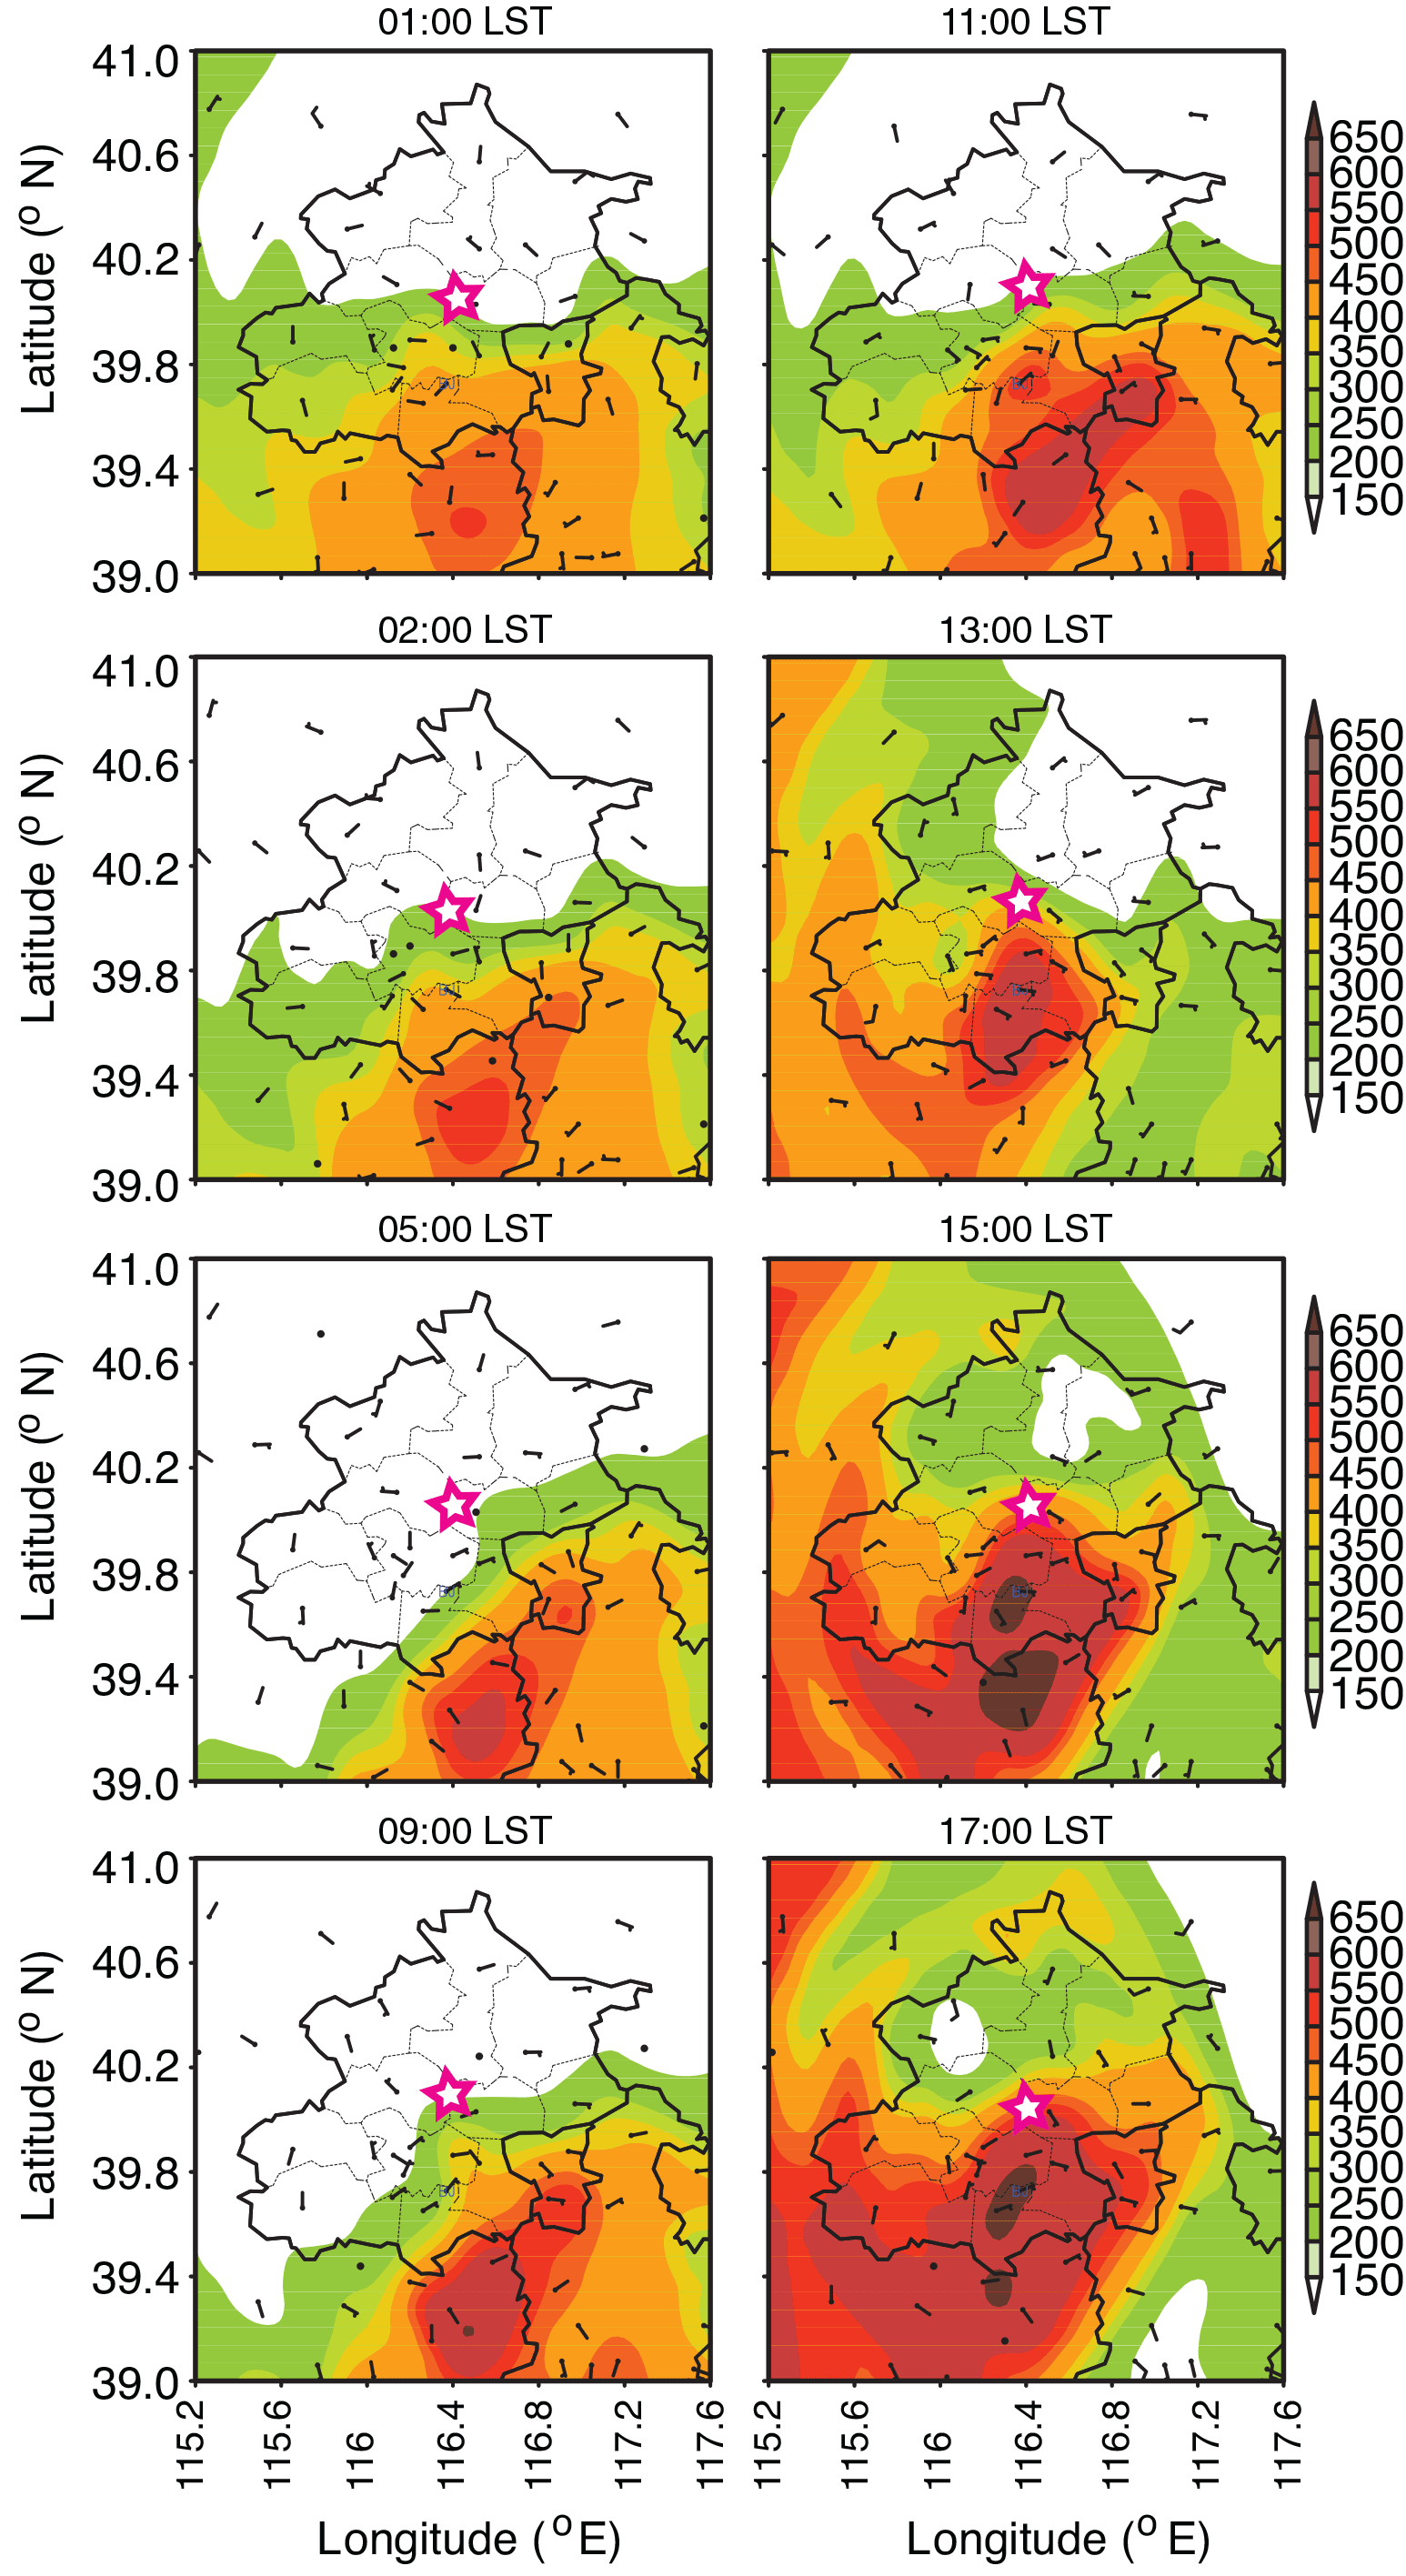
Figure 5The surface PM2.5 concentration in µg m−3 at 00:00, 02:00, 05:00, 09:00, and 11:00, 13:00, 15:00, and 17:00 LST on 30 November with surface wind barbs. The Beijing city boundary is marked by the dark black curve with the magenta star at its center.
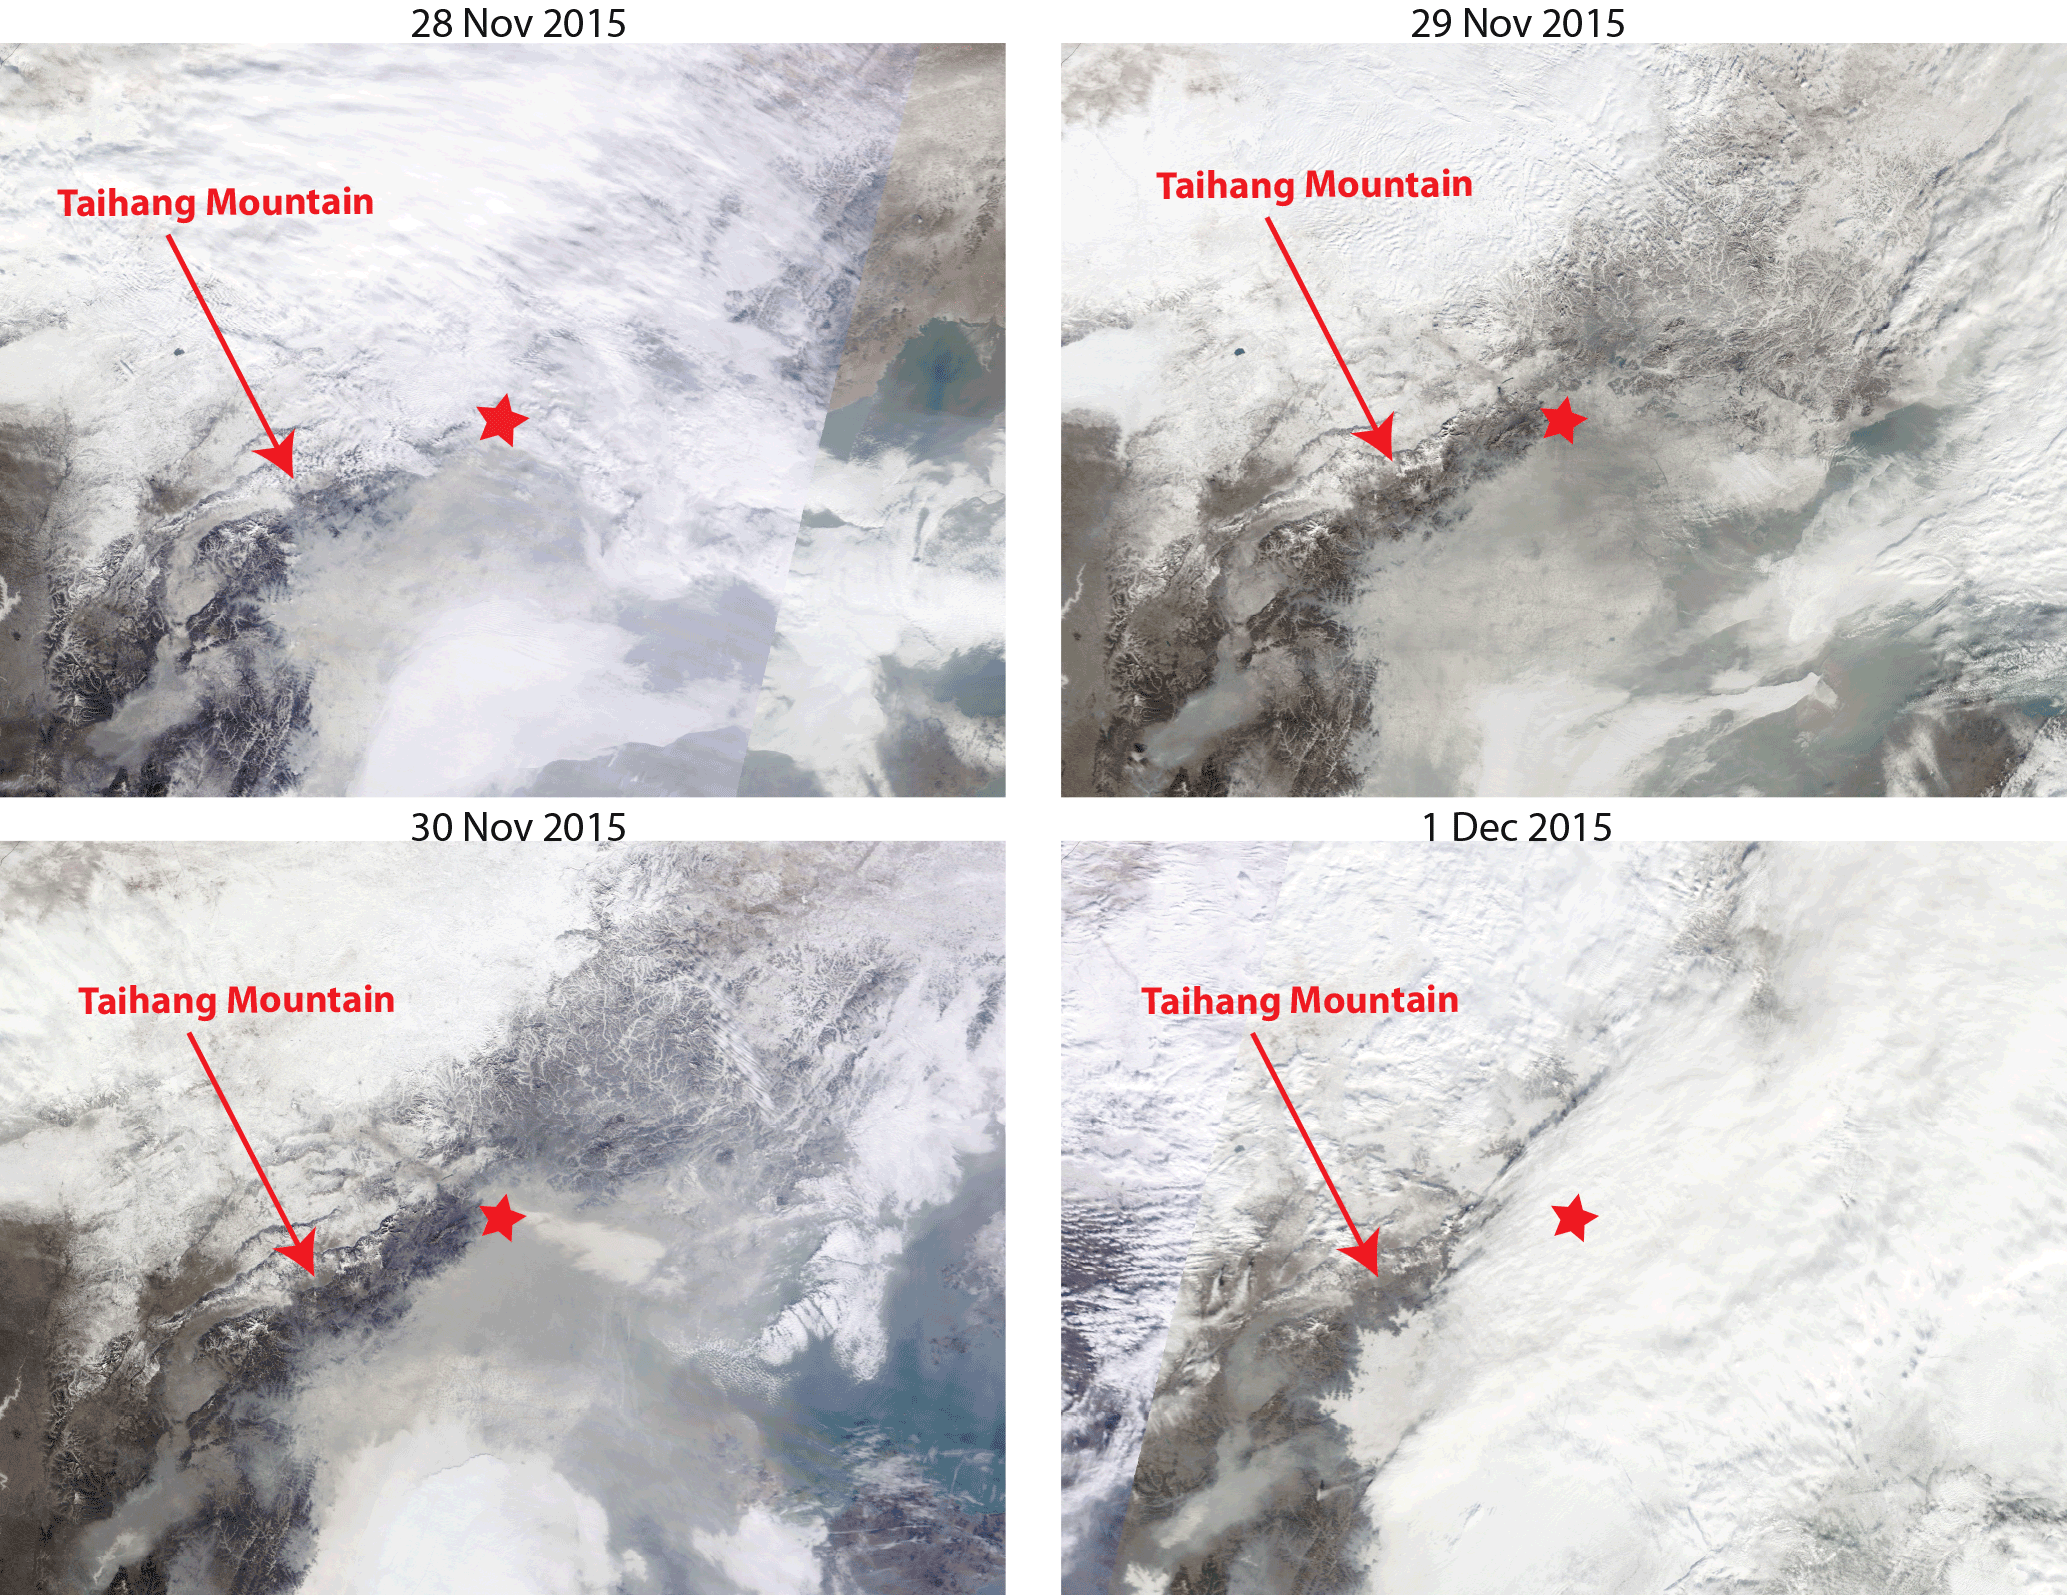
Figure 6MODIS rapid response images around noon from 28 November to 1 December 2015, where the red star marked the location of Beijing. The dark line southwest of the star visible on all the images is the Taihang Mountains.
At 01:00 LST, 30 November, the surface PM2.5 concentration was high south of Beijing (Fig. 5). This polluted air was visibly confined east of the Taihang Mountains from the MODIS images on 29 and 30 November (Fig. 6), which is often observed in winter (Xu et al., 2005; Zhao et al., 2013; Zhong et al., 2017). During the early morning hours of 30 November, for example, at 05:00 LST, the surface maximum PM2.5 concentration in Fig. 5 increased and its high concentration center was shifted toward southeast of Beijing (Fig. 5). From 05:00 to 11:00 LST, the PM2.5 concentration in Beijing increased dramatically, and its development was faster than its surrounding area, which is likely due to the rough surface of the urban area in its contribution to stronger turbulent mixing (Sun et al., 2017). In the following section, we demonstrate that the shift of the high surface PM2.5 to southeast of Beijing results from the relatively clean flow downslope from the mountains northwest of Beijing, leading to the reduction of the surface PM2.5 concentration northwest of Beijing. The northeastward movement of the high surface PM2.5 air during the daytime is due to downward transfer of pollutants by convective mixing, where pollutants are supplied by the northeastward flow through horizontal advection above the newly developed CBL in the morning.
In general, turbulence is generated either by positive buoyancy or by shear. Turbulent mixing leads to vertical transport of heat from the diurnal heating and cooling of the surface, resulting in air temperature changes. Turbulent mixing also leads to the vertical momentum transfer resulting in wind speed and direction changes because the background wind changes with height especially near the surface due to surface drag. Turbulent mixing during daytime is commonly generated by convection from the warm air at the heated surface from solar heating. Once wind speed is high, wind shear near the surface can also generate turbulence, which can occur day or night, although shear is the dominant turbulence generation mechanism at night. At night, the air near the surface is cooled by molecular thermal conduction from the cold surface due to longwave emission. The vertical temperature difference between the warm air heated from the daytime and the cooled air near the surface leads to the SBL, which reduces turbulence intensity and vertical turbulent transports of momentum, heat, trace gases, and aerosols. As a result, the air–surface coupling and the surface-emitted trace gases of water vapor and CO2 are confined near the surface. Impacts of the surface roughness on air motions are also limited to the near-surface stable layer (Sun et al., 2016). In summary, the diurnal variation of solar radiation leads to the diurnal variation of air temperature, wind speed and direction, trace gases, and aerosols near the surface.
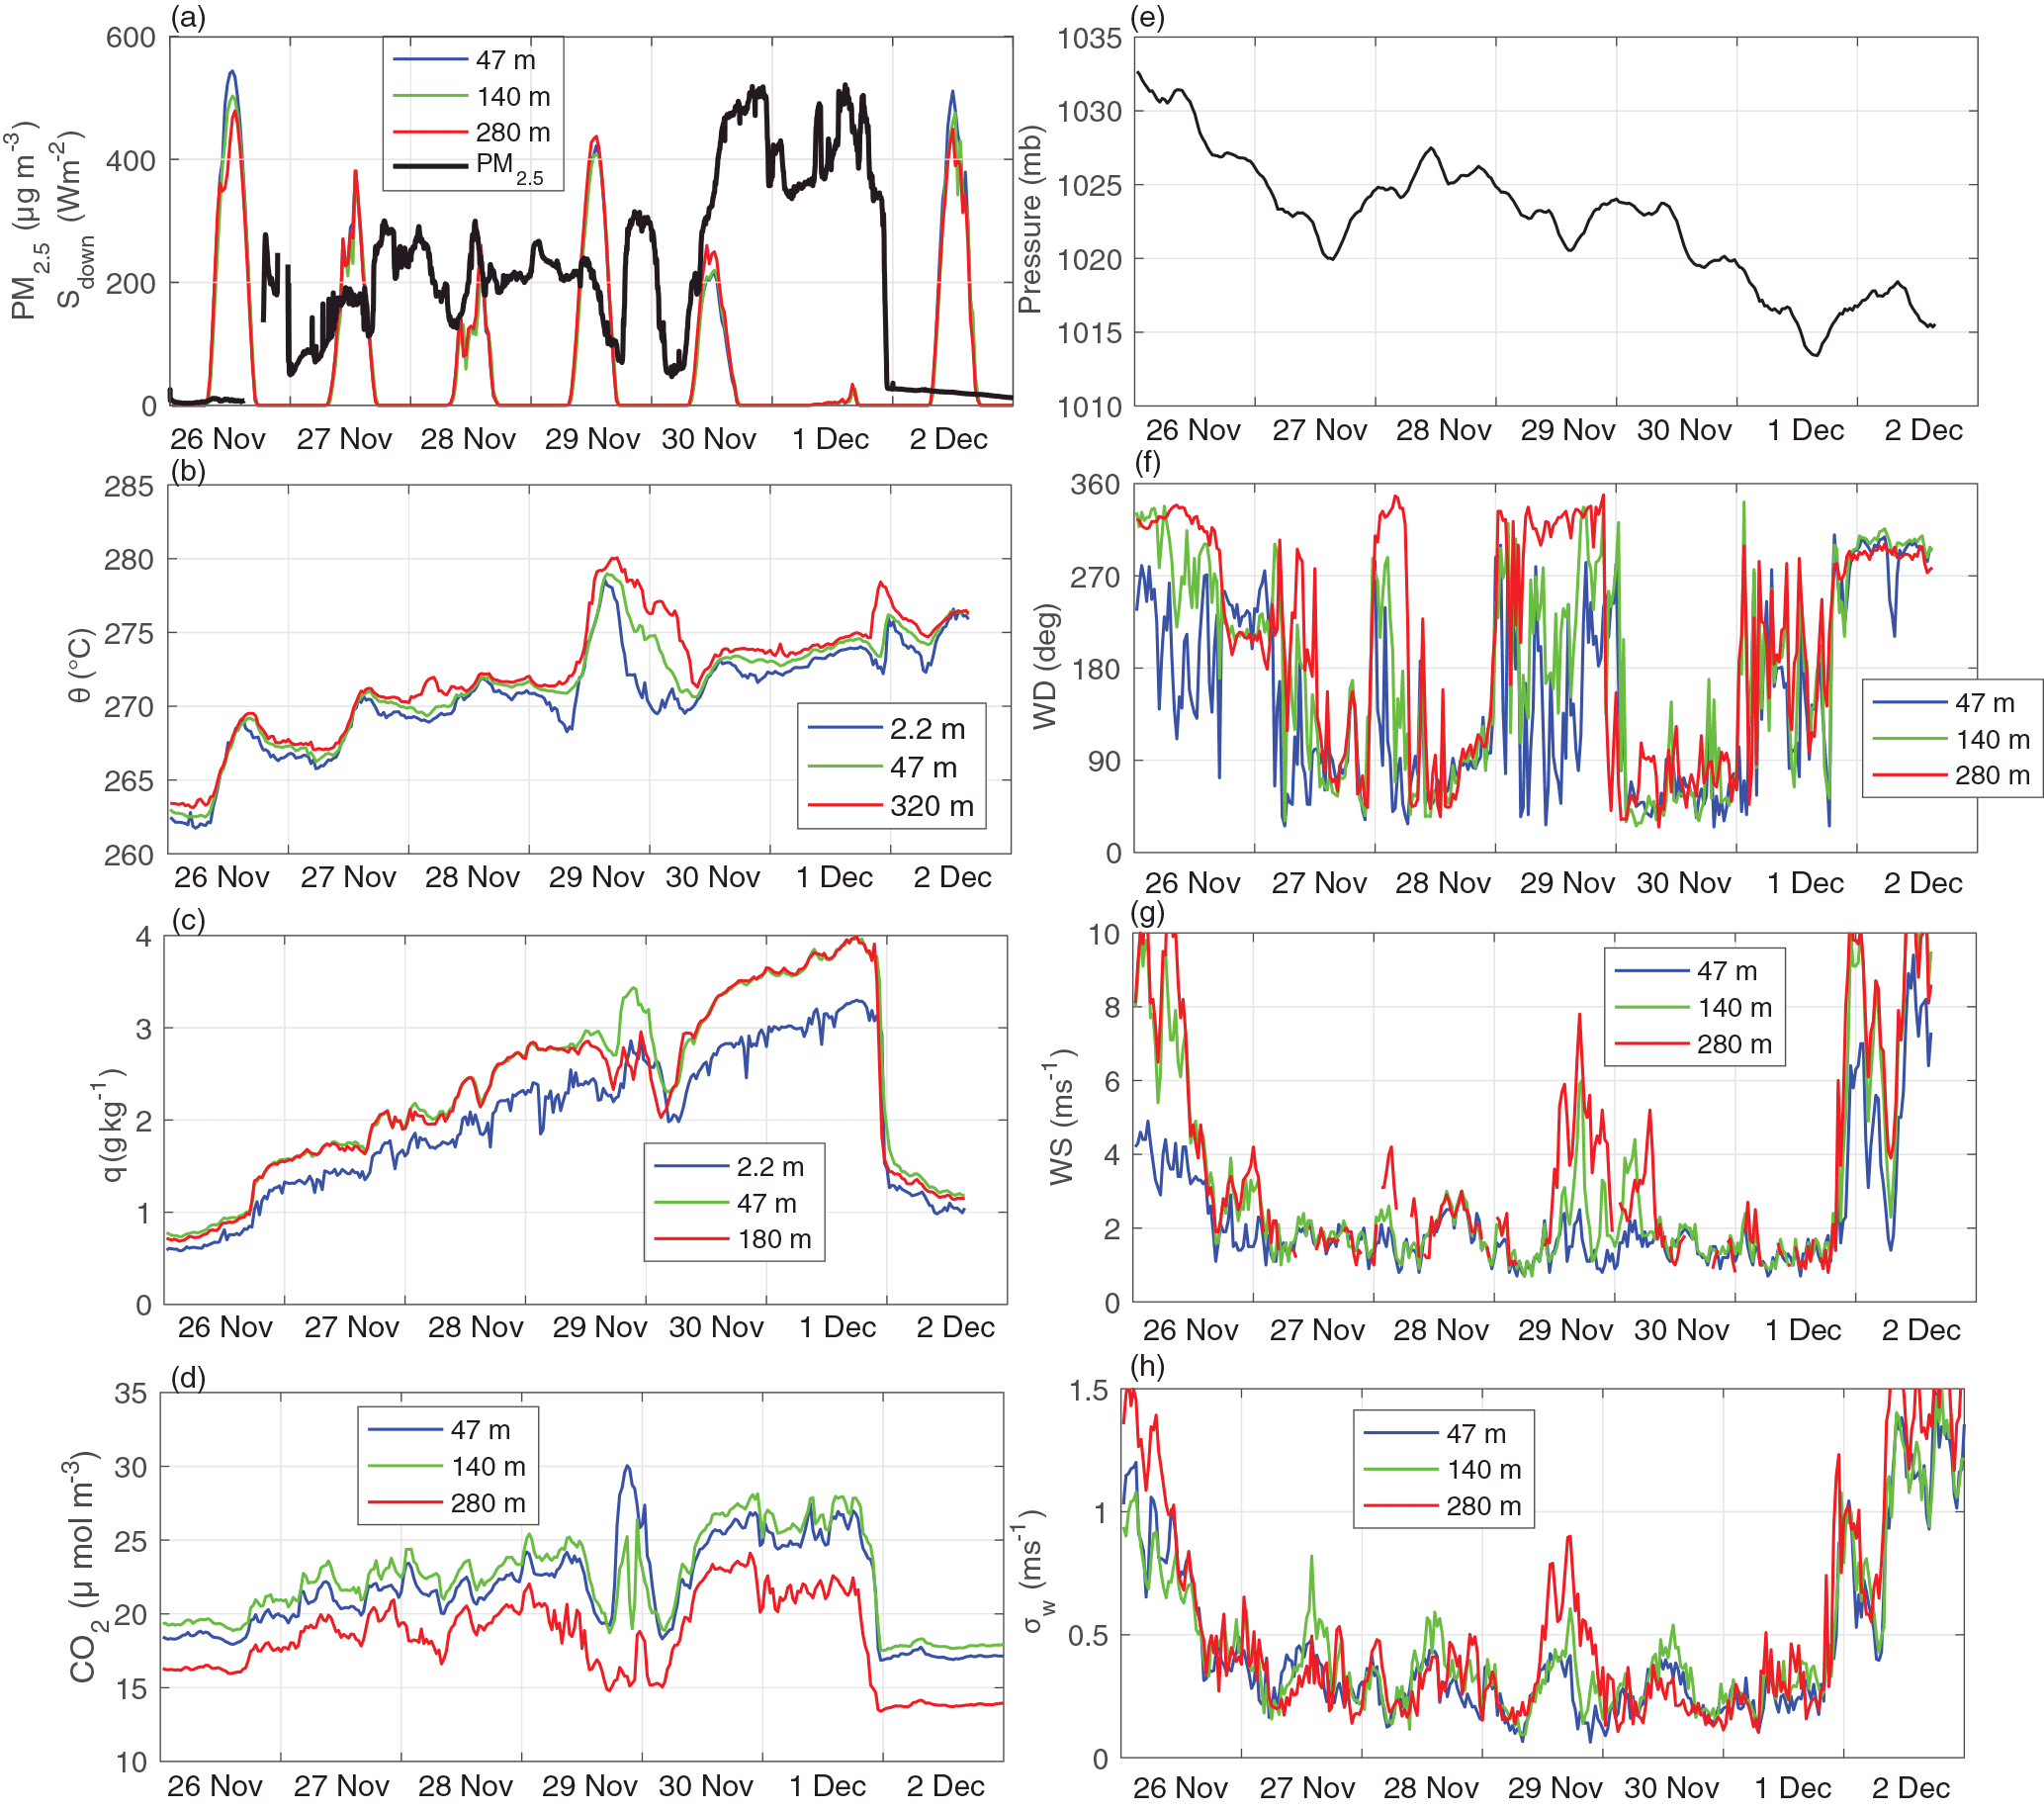
Figure 7Temporal variations of (a) the PM2.5 concentration and the downward solar radiation Sdown, (b) the potential temperature θ, (c) the specific humidity q, (d) the CO2 concentration, (e) the pressure at 2.2 m, (f) wind direction WD, (g) wind speed WS, and (h) the SD of the vertical velocity σw at IAP from 26 November to 2 December.
During the first 3 days of our study period, 26 to 28 November, the maximum downward solar radiation decreased steadily (Fig. 7a). The low downward solar radiation on 28 November was consistent with the cloudy MODIS satellite image that day (Fig. 6a). The PM2.5 concentration, air potential temperature θ, specific humidity q, and CO2 concentration increased steadily with their diurnal variations associated with turbulent mixing embedded in their increasing trends (Fig. 7). The wind speed was high during the first part of 26 November, and was low for the rest of the 3 days in association with the regional low pressure system (Fig. 7g), which was consistent with the decreasing pressure observed at IAP (Fig. 7e). The wind direction within the IAP tower layer varied diurnally – westerly in the first half of each day and easterly during the second half, especially when the ambient wind speed was low, for example, on 27 and 28 November (Fig. 7f) – indicating the mountains west of Beijing played an important role in the diurnal wind-direction variation. Because of the contribution of the positive buoyancy to turbulent mixing during daytime, turbulence intensity represented by the standard deviation (SD) of the vertical velocity σw increased during daytime on 27 and 28 November even though the maximum downward solar radiation was relatively low on 28 November (Fig. 7h). Because of the weak pressure system over Beijing, the diurnal variation of wind speed was not dramatic and the vertical variation of wind speed within several hundreds of meters above the surface was relatively small.
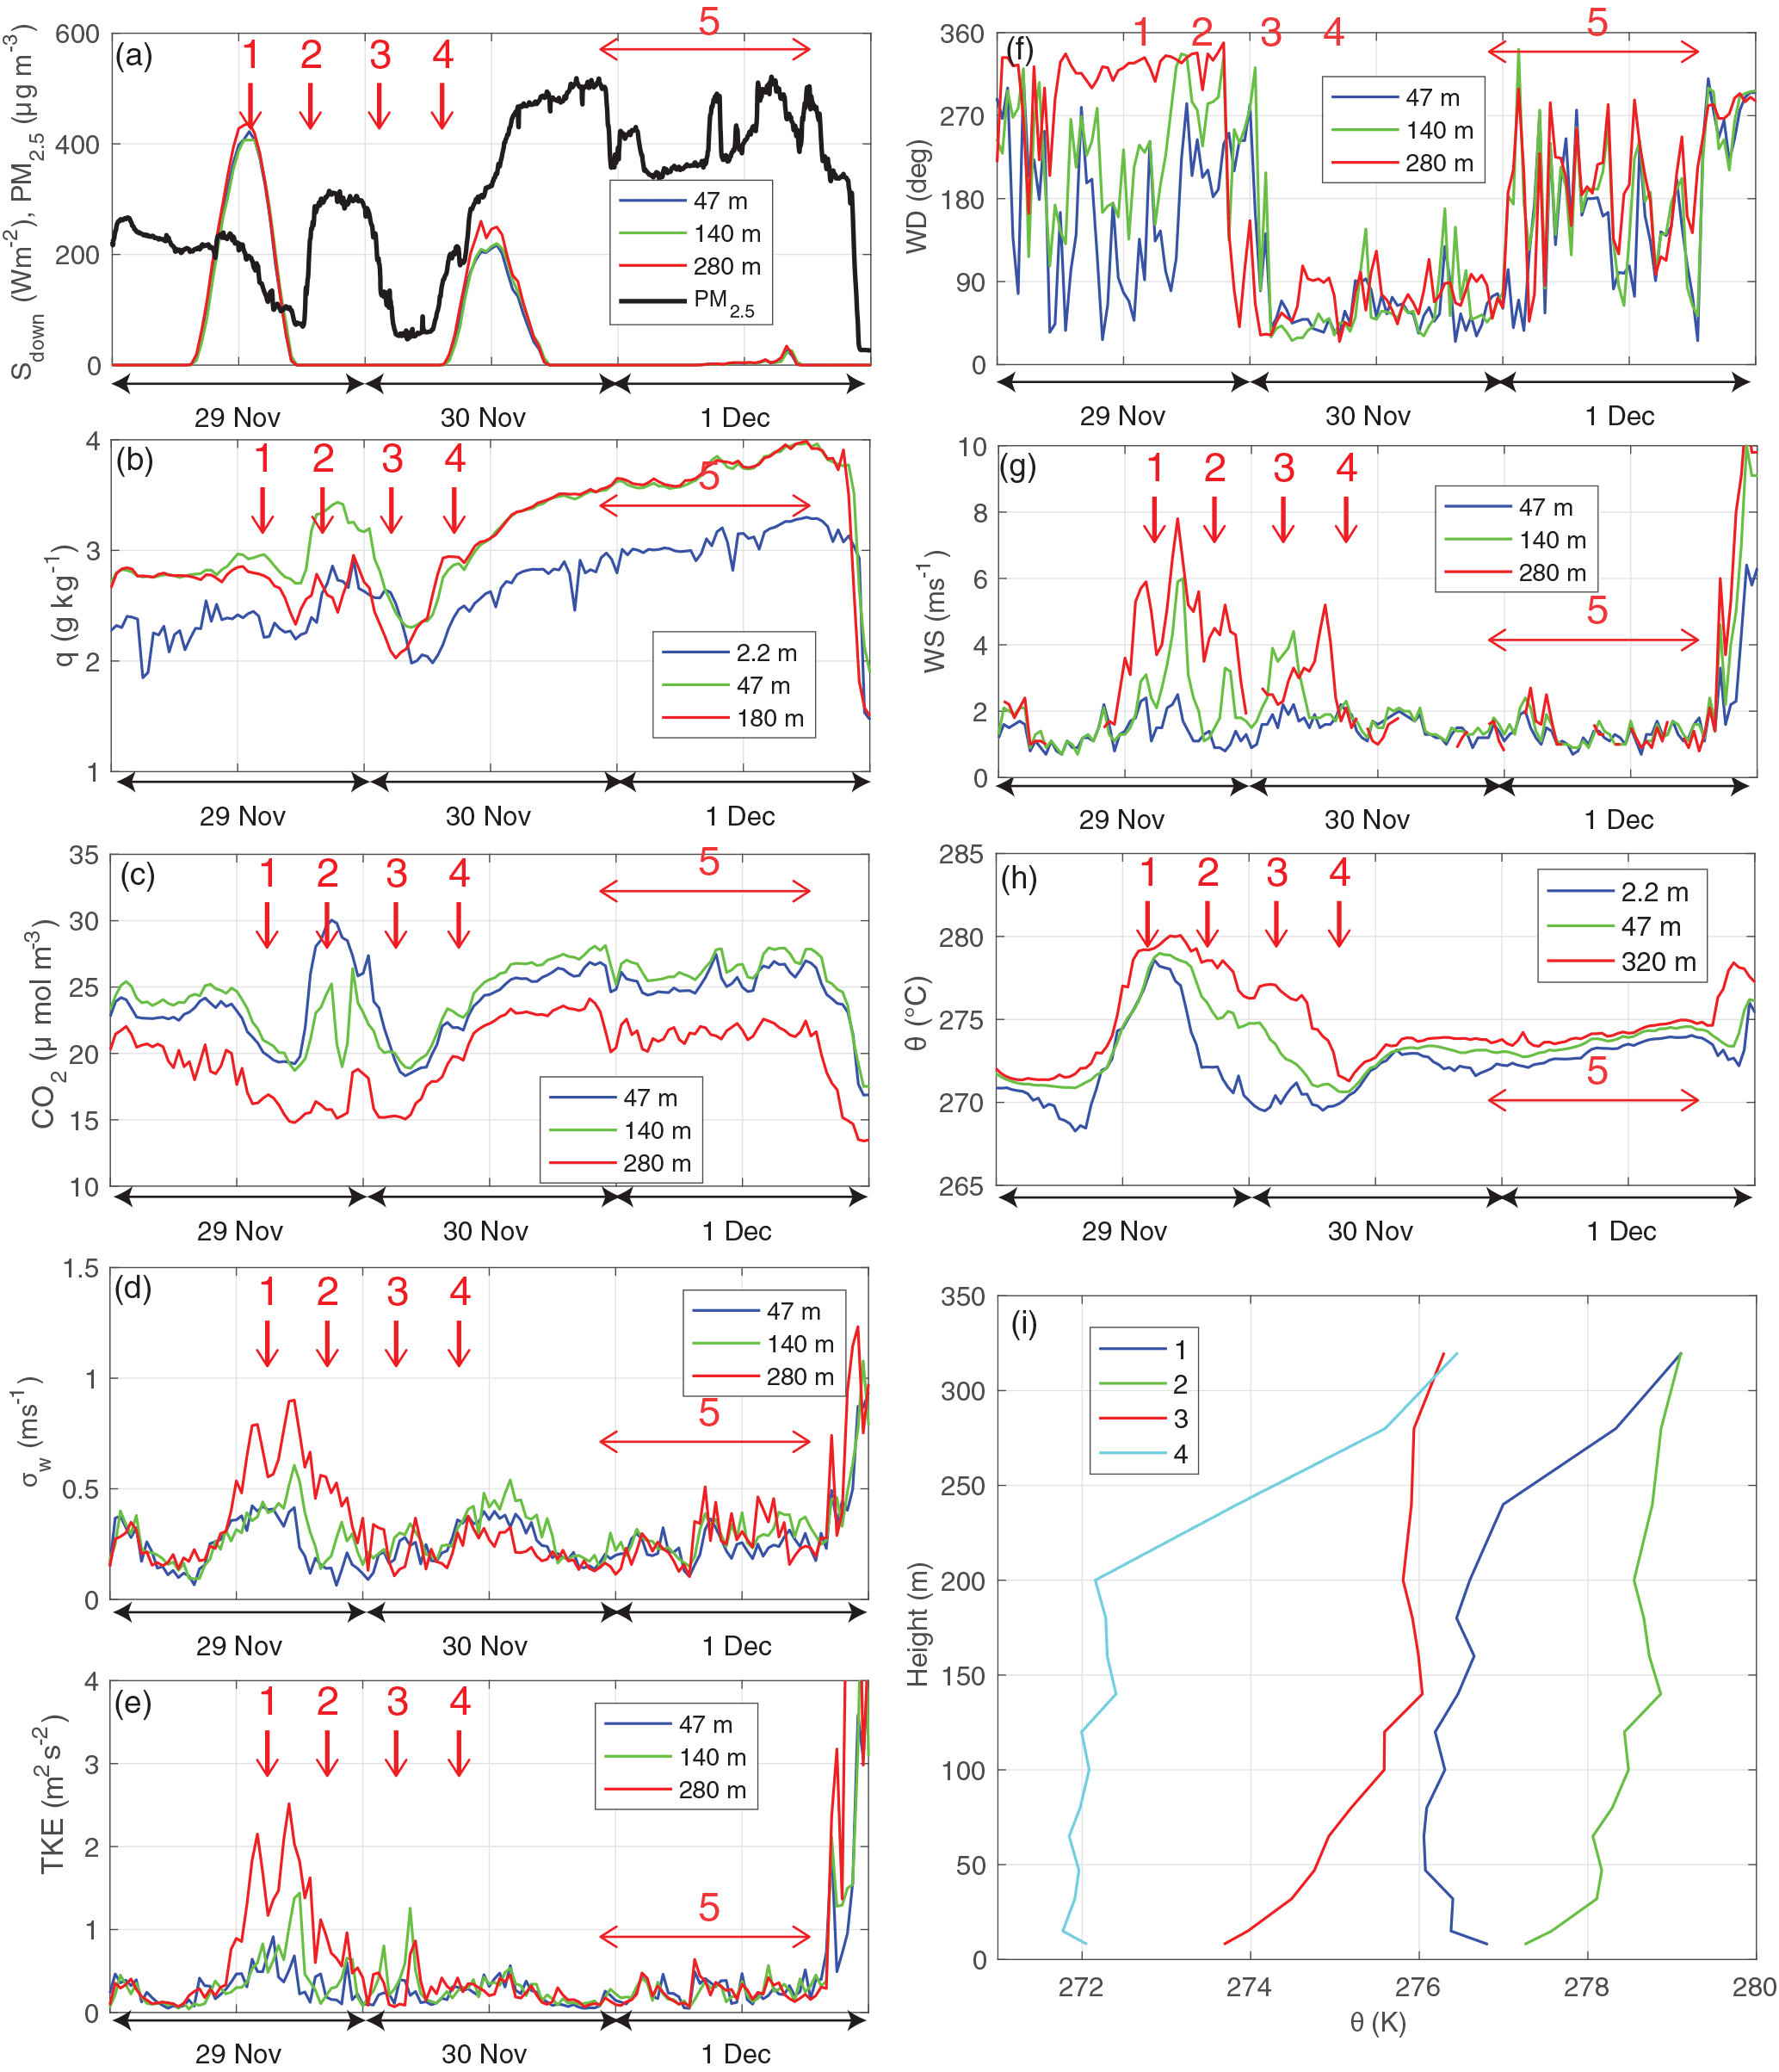
Figure 8Temporal variations of (a) the 10 m PM2.5 concentration and the downward solar radiation Sdown, (b) the specific humidity q, (c) the CO2 concentration, (d) the SD of the vertical velocity σw, (e) turbulence kinetic energy (TKE), (f) wind direction WD, (g) wind speed WS, (h) the potential temperature θ at IAP from 29 November to 1 December, and (i) θ profiles from the IAP tower at the time marked 1–4 in (a–h).
The PM2.5 concentration at IAP went through significant oscillations before its final dramatic increase on 30 November (Fig. 8a). Right after noon on 29 November, the PM2.5 concentration decreased significantly until about 18:00 LST (marked 1 in Fig. 8). After sunset, the PM2.5 concentration increased to its temporal maximum value around 22:00 LST (marked 2 in Fig. 8). Then it decreased sharply until the early morning of 30 November (marked 3 in Fig. 8). Around 06:00 LST, the PM2.5 concentration increased dramatically and reached its highest value of the day, 527 µg m−3, around 20:00 LST (marked 4 in Fig. 8). After that, the PM2.5 concentration was relatively steady and varied ±100 µg m−3 until the night of 1 December when it decreased to below 50 µg m−3 (marked 5 in Fig. 8).
In the rest of this section, we analyze the evolution of the PM2.5 concentration at IAP during the period between noon 29 November and the end of the severe pollution event at night of 1 December. We investigate the total five stages marked in Fig. 8, one in each subsection from Sects. 4.1 to 4.5, and conclude with the important pollutant transporting mechanisms in Sect. 4.6.
4.1 Stage 1
On 29 November, the downward solar radiation measured at IAP was significantly larger than the previous cloudy day (Fig. 7a). The convective mixing increased in the morning as shown in both σw and turbulence kinetic energy (TKE; marked 1 in Fig. 8d and e). Normally convective turbulent mixing in the morning would vertically spread trace gases and aerosols accumulated in the nighttime SBL, leading to reduction of their concentrations near the surface during the daytime. However, on this morning, the near-surface wind was from south (Fig. 8f), where air pollution was heavy. As a result of the pollutant transport from south through air advection, the concentrations of PM2.5, q, and CO2 increased slightly (Fig. 8a–c) until the increase of the strong northwesterly wind arrived in the afternoon (Fig. 8g). The strong wind shear relative to the rough urban surface generated strong turbulent mixing as explained by Sun et al. (2017), and resulted in the strong upward transport of the polluted air and the downward transport of the less-polluted air from northwest, leading to the decreases of PM2.5, q, and CO2 (marked 1 in Fig. 8a–c). Thus, the shear-generated turbulent mixing contributed to the reduction of the surface PM2.5 concentration in the afternoon of 29 November.
4.2 Stage 2
Because of the strong heating during the daytime of 29 November, the air temperature was highest during the 7 days period (Fig. 7b). When the downward solar radiation decreased in the afternoon, the reduced solar heating at the surface and the emission of the longwave radiation from the surface resulted in the surface cooling. Molecular thermal conduction at the cooling surface led to the air temperature decrease near the surface while the air above was still relatively warm from the daytime heating. Consequently the vertical air temperature difference became significant especially after the downward solar radiation approached zero after sunset (marked 2 in Fig. 8h), leading to the SBL (Fig. 8i). Associated with the strong stable stratification near the surface, the shear-generated turbulence was reduced significantly from its daytime value. The weak turbulent mixing under the very stable boundary layer constrained the vertical spreading of the surface trace gases and aerosols. Meanwhile, the wind direction near the surface started to be influenced by the mountains northwest of Beijing. During the gradual development of the northwesterly downslope wind, the wind direction within the tower layer rotated clockwise from easterly to northwesterly. As the wind direction was from south, the polluted air was advected into Beijing. Because the nighttime SBL prevented the air with high aerosol, q, and CO2 from spreading upward, the PM2.5 concentration as well as q and CO2 increased sharply (marked 2 in Fig. 8a–c).
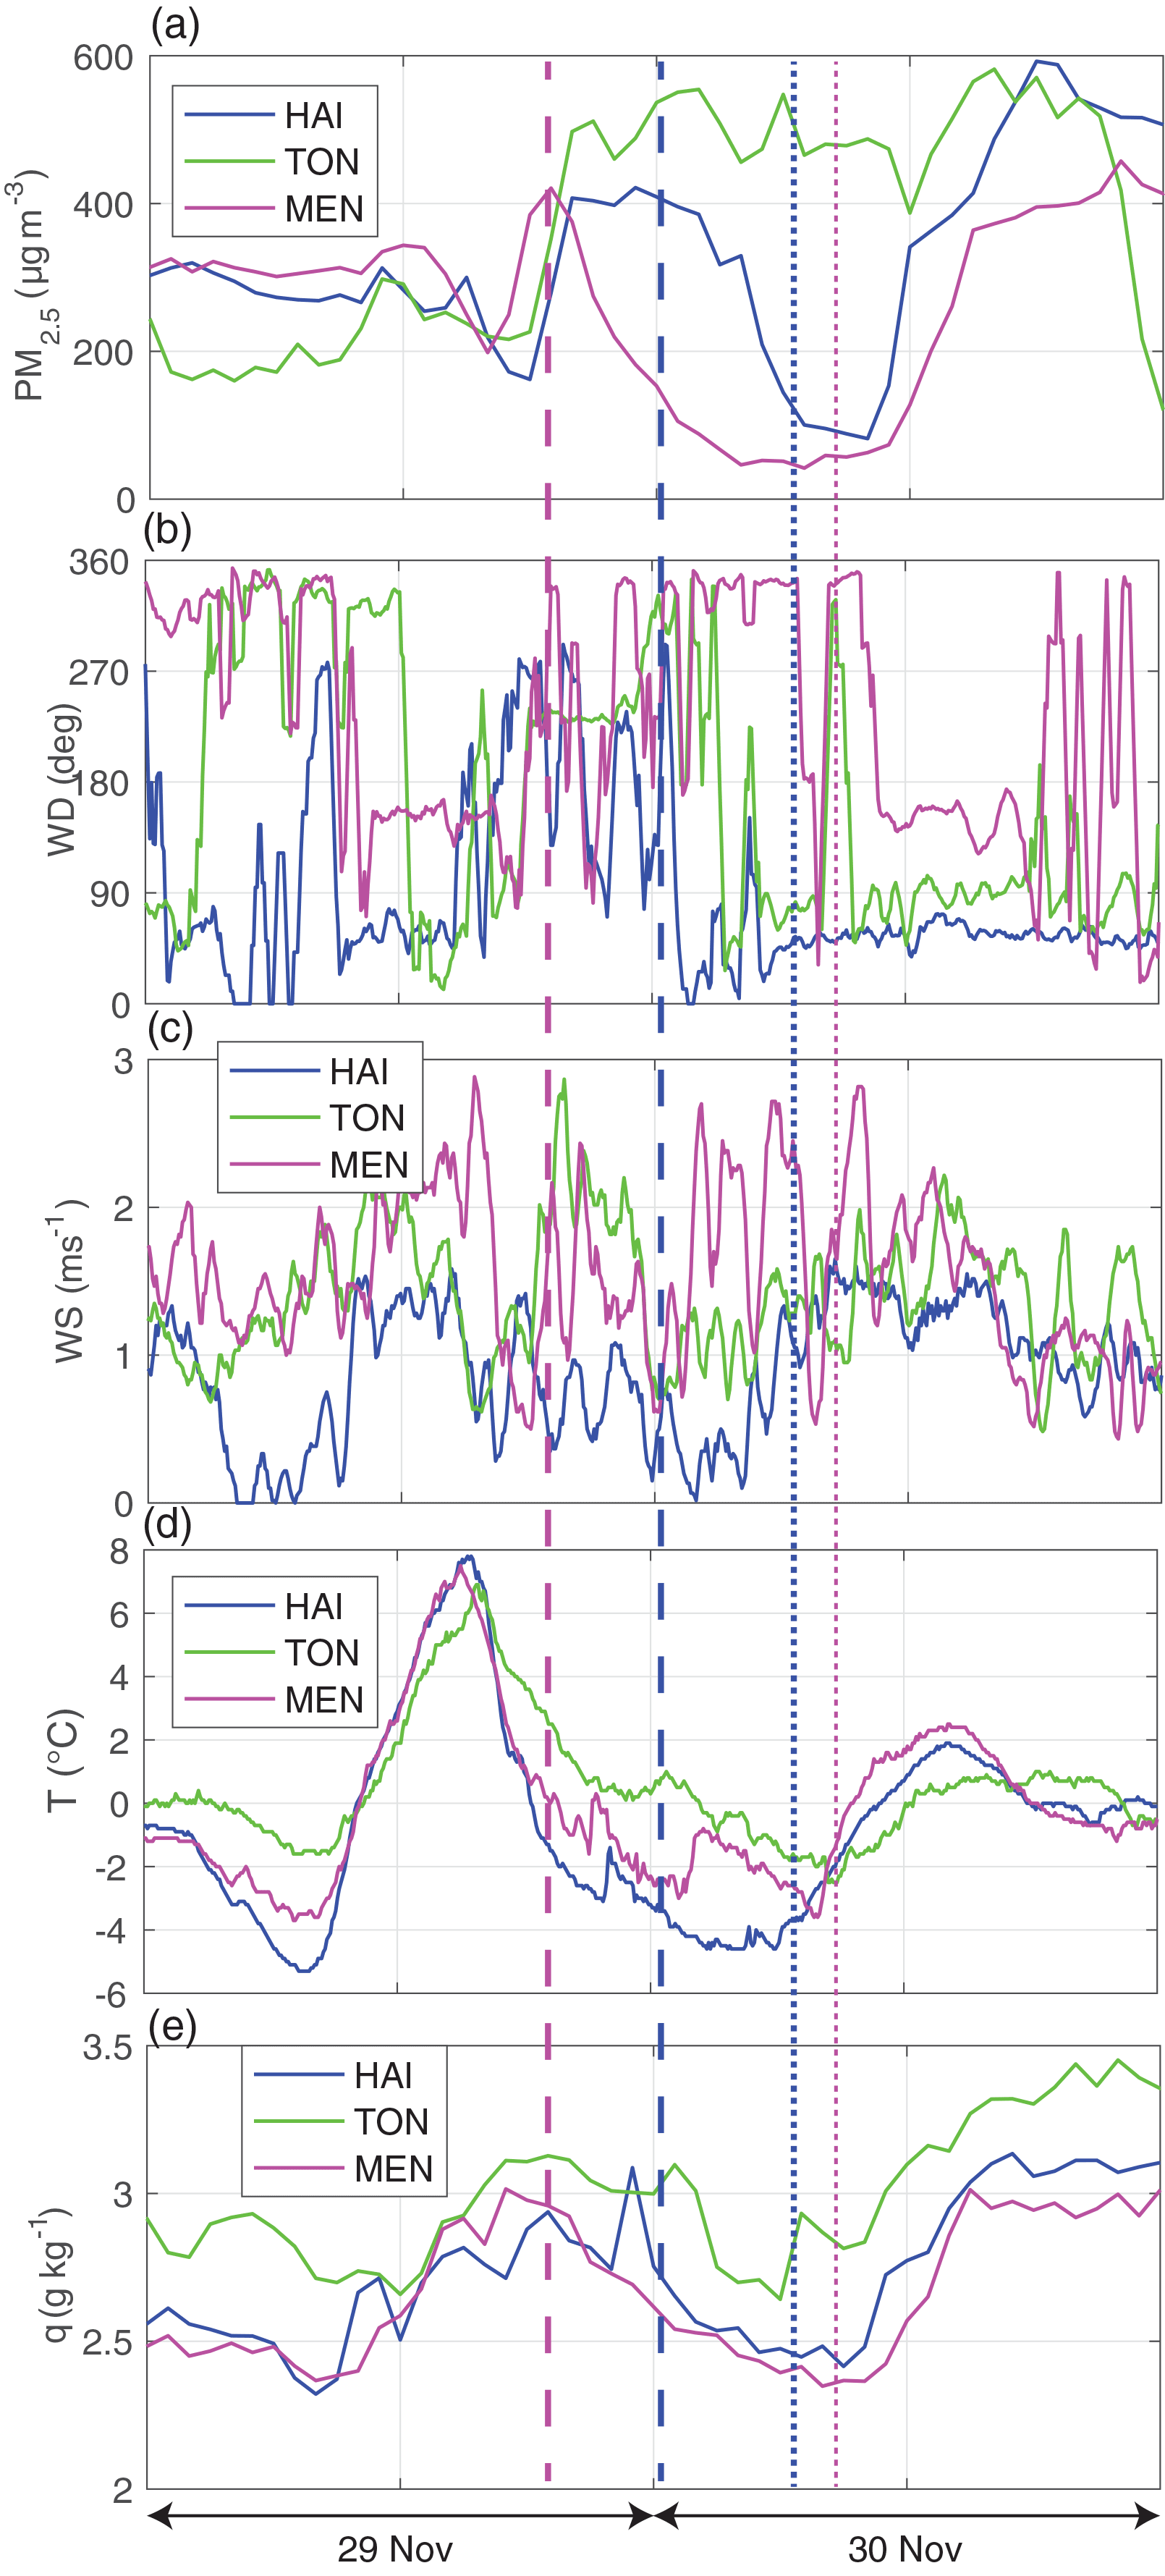
Figure 9Temporal variations of (a) the surface PM2.5 concentration, (b) wind direction WD, (c) wind speed WS, (d) air temperature T, and (e) water vapor specific humidity q at HAI, TON, and MEN from 29 to 30 November. The vertical dashed lines with the corresponding colors for MEN and HAI mark the PM2.5 decreases (stage 3) due to the downslope flow. The vertical dotted lines mark the PM2.5 increases (stage 4) associated with the development of the convective boundary layer at the two stations.
4.3 Stage 3
Because the thermally induced terrain flow is due to the horizontal pressure gradient generated by the daytime heating and the nighttime cooling over the sloped terrain similar to land breezes (Sun et al., 1998), the relatively strong heating on 29 November led to the relatively strong downslope drainage flow. Under the influence of the relatively clean downslope flow, the PM2.5 concentration in the vicinity of the mountains northwest of Beijing was reduced, and the high PM2.5 concentration center was shifted to southeast of Beijing starting around 01:00 LST on 30 November (Fig. 5). Because of the eastward spreading of the downslope flow and due to its decreasing strength with distance from the mountains, the PM2.5 concentration at the westernmost station, MEN, started to decrease first in the early evening and lasted the longest until nearly noon on 30 November when the daytime convective mixing brought the heavily polluted air down (Sect. 4.4). In contrast, the PM2.5 concentration at southeast of Beijing, TON, which is far from the mountains, remained around 500 µg m−3 throughout the night of 29 November (Figs. 2b and 9). As the downslope flow transported low-humidity and cold air from the relatively high elevation (Fig. 9), the relatively large humidity and the high PM2.5 concentration at TON in the evening of 29 November further indicates that the downslope wind did not influence TON much. Because of the cold downslope flow, the stable stratification in the Beijing area was further strengthened. As a result of the horizontal transport of the less-polluted air by the downslope flow, the surface PM2.5 concentration reduced significantly at IAP.
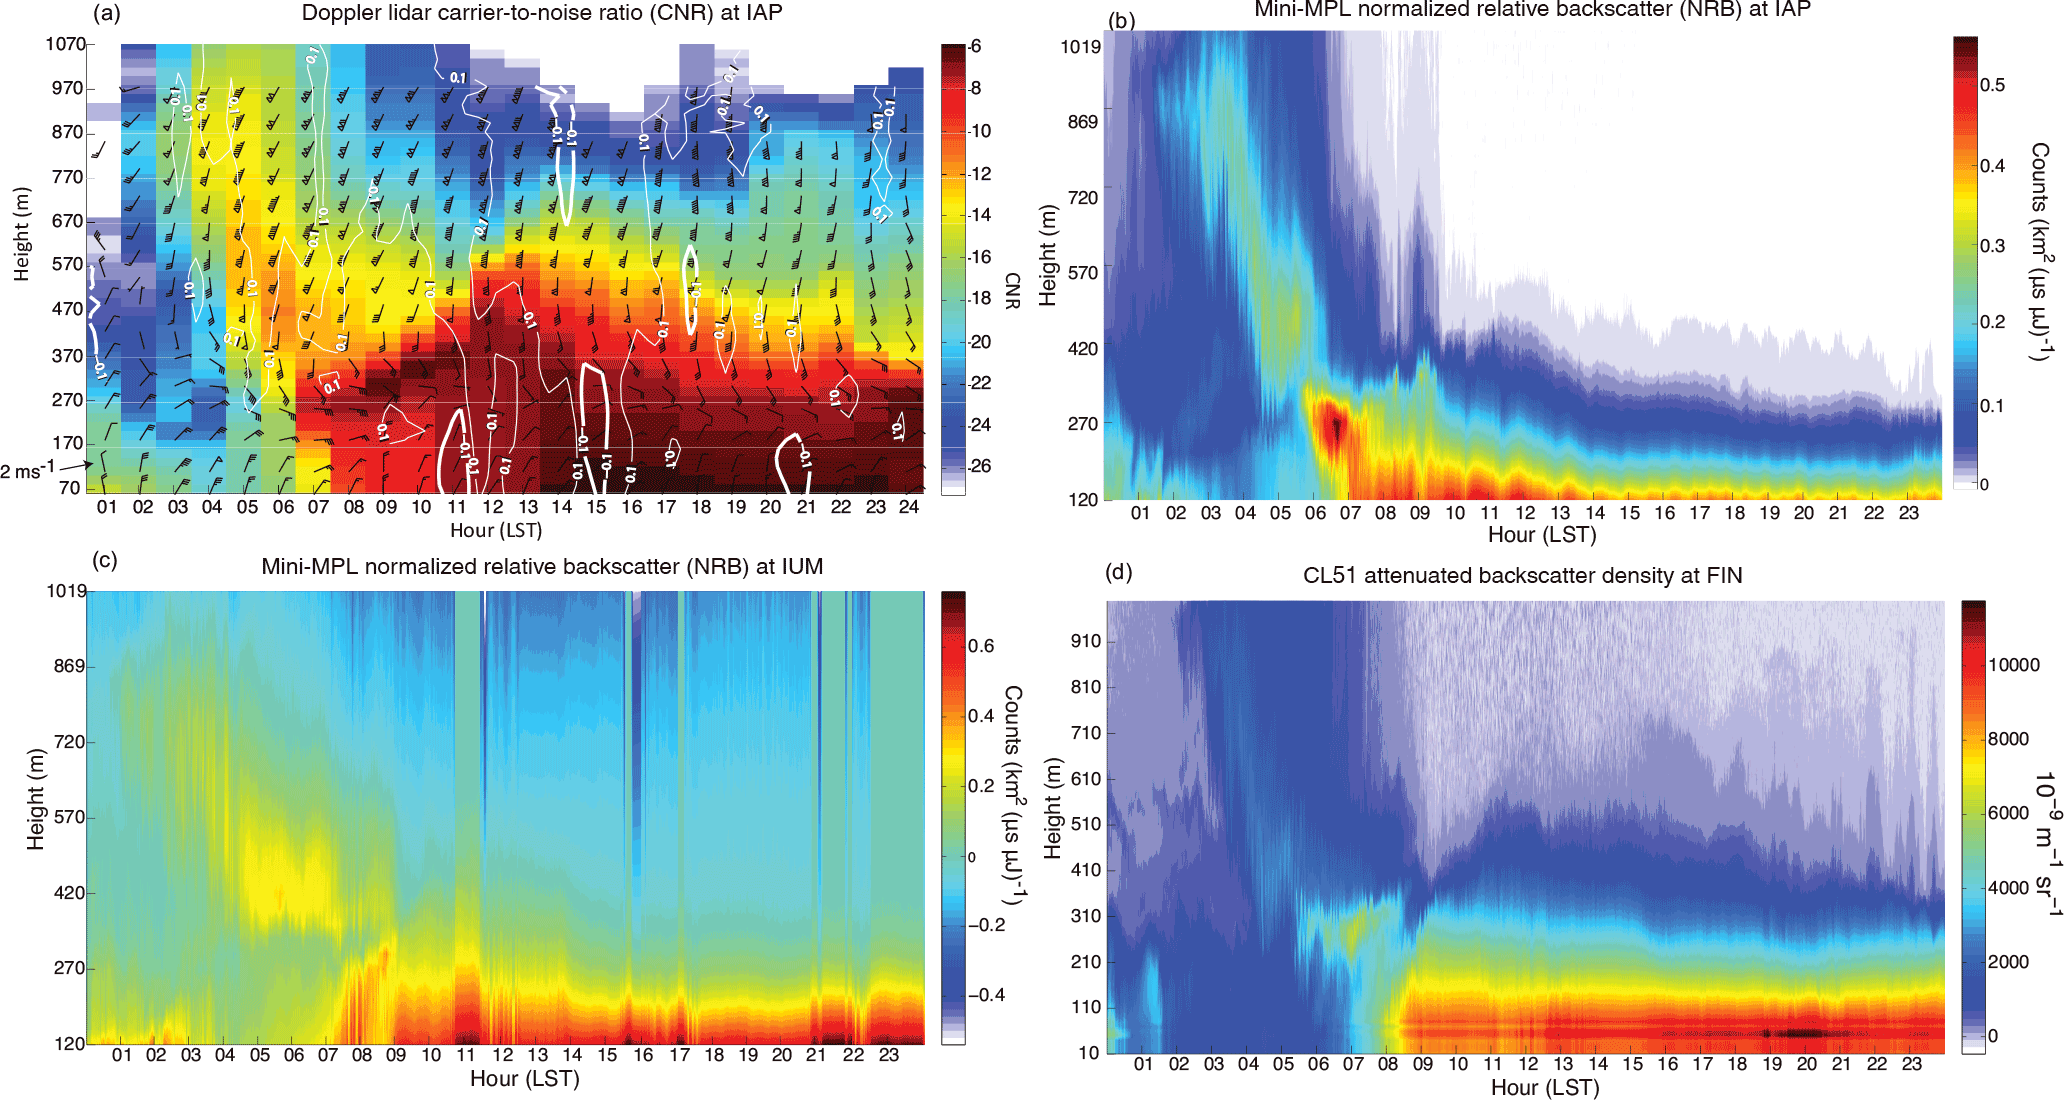
Figure 10(a) The Doppler lidar CNR with wind barbs at IAP, the normalized relative backscatter (NRB) from the mini-MPL lidar at (b) IAP and (c) IUM, and (d) the attenuated backscatter density from the CL51 lidar at FIN on 30 November. The wind barb of 2 m s−1 is marked at the bottom left corner of (a).
Meanwhile, the wind direction within the IAP tower layer changed to northeasterly under the influence of the surface pressure system (marked 3 in Fig. 8f), which also brought in the less-polluted air as shown in the slight decreases of both surface q and the PM2.5 concentrations at TON where the downslope flow could not reach (Fig. 9). The relatively clean air from both the downslope flow and the northeasterly was also visible in the aerosol lidar images in the early morning hours on 30 November (Fig. 10a–c). At the same time, the wind above about 500 m changed from northwesterly to southwesterly around midnight on 29 November (Fig. 4). Because of the strong SBL, shear-generated turbulence eddies were confined to the relatively thin SBL below 150 m (Fig. 8i), leading to decoupling between the rough urban surface and the air above the SBL. That is, the air flow above the SBL was not effectively reduced by the surface drag. As a result, the wind speed above the SBL increased above the SBL, which is shown at 140 and 280 m in the early morning of 30 November (marked 3 in Fig. 8g). The relatively strong southwesterly flow above the SBL effectively advected the polluted air from south to above the Beijing area (Fig. 10). The increased wind shear above the SBL enhanced turbulent mixing, leading to the downward transport of the polluted air to about 300 m around 06:00 LST on 30 November, which is clearly observed with the relatively high backscatter density at FIN and the relatively high NRB at IUM and IAP from the aerosol lidars. Therefore, both the advection of the less-polluted air into the Beijing urban area from the surrounding mountains at night and from northeast in the early morning and the small increase of turbulent mixing in the vertical spreading of the polluted air below the upper-level southwesterly flow contributed to the significant decrease of the PM2.5 concentration at IAP in the early morning of 30 November (Fig. 8a). The process also decreased the surface concentrations of q and CO2 (marked 3 in Fig. 8b and c).
4.4 Stage 4
In the morning of 30 November, the heavily polluted air above was efficiently advected by the southwesterly flow to over the Beijing area due to its decoupling from the rough surface, which resulted in the elevated polluted air above the surface SBL as shown in the lidar observations (Fig. 10). The elevated aerosol layer is consistent with the elevated humid air observed from the soundings at NGT because the polluted air from south is characterized by high humidity and high PM2.5 concentration (Fig. 4). The absence of the elevated aerosol signal from the mini-MPLs at IAP and IUM and from the ceilometer at FIN between 07:00 and 10:00 LST (Fig. 10) could be due to the fast decrease of the lidar power with distance (Davoust et al., 2014).
After the downward solar radiation increased in the morning of 30 November (marked 4 in Fig. 8a), the convective mixing increased as shown in both σw and TKE (marked 4 in Fig. 8d and e). The enhanced convective mixing led to the coupling between the surface and the elevated polluted air resulting in downward transport of the heavily polluted air and the dramatic increase of the PM2.5 concentration, air temperature, wind speed, q, and CO2 within the CBL in the morning (marked 4 in Fig. 8). The convective mixing also enhanced the upward transport of the heavily polluted air south of Beijing; the upper southwesterly wind continuously brought the heavily polluted air above Beijing, leading to the increasing aerosol concentration above IAP (Fig. 10a). Because the growth of the CBL, this high aerosol layer appeared to be “lifted” gradually from 270 to about 400 m between 06:00 and 12:00 LST on 30 November even though the entrainment of the polluted air into the CBL reduced the aerosol concentration right above the CBL (Fig. 10a). Because of the relatively shallow CBL at its early development, the aerosol concentration in the CBL below the elevated high-aerosol layer increased dramatically. As the CBL continued to grow, more high aerosol air was entrained into the CBL around 11:00 LST, leading to the explosive increase of the PM2.5 concentration. The role of the convective mixing in transporting the high polluted air down into the Beijing area is clearly demonstrated in the simultaneous sharp increases of the surface PM2.5 concentration and the downward solar radiation for the CBL development in Fig. 8a. Due to the overwhelming coverage of concrete large surface elements in the urban area and the large surface roughness from urban canopies, the CBL developed faster over the urban area than the rural area, leading to the fast downward transport of the polluted air as shown at 09:00 LST and 11:00 LST in Fig. 5.
The convective mixing also transported the heavily polluted air downward east of Beijing, where the nighttime surface PM2.5 concentration was relatively high and beyond the reach of the relatively clean downslope flow. As a result, the high PM2.5 center oriented in the northeast–southwest direction was enhanced as well and extended northeastward during the daytime. Gradually the surface northeasterly wind contributed to the horizontal advection of PM2.5 westward, leading to a relatively small enhancement of the PM2.5 concentration in the afternoon as the PM2.5 concentration became higher northeast of Beijing. The development of the SBL near the surface after the decrease of the downward solar radiation also contributed to the small increase of wind speed at 280 m (Fig. 8g). Overall, within 8 h, from 09:00 to 17:00 LST on 30 November, the PM2.5 concentration increased about 302 µg m−3 at IAP. As a result of the reduction of the downward solar radiation by the high aerosol concentration with the possible early development of clouds on 30 November, the maximum downward solar radiation at 140 m on 30 November was only about a half of that on 29 November.
Based on previous studies in the region and around the world, the stagnant urban environment with increasing humidity and anthropogenic emissions of volatile organic compounds, nitrogen oxides, and sulfur dioxides provides favorable conditions for aerosol growth and secondary aerosol formation as a result of chemical reactions and hygroscopic growth of aerosols (Guo et al., 2014; Mader et al., 1952; Parrish et al., 2011; Putaud et al., 2004, 2010; Van Dingenen et al., 2004; Zhang et al., 2015). Therefore, aerosol growth in the Beijing area might have also contributed to the dramatic increase of the PM2.5 concentration on 30 November as the high-humidity air was transported into the urban environment. The numerical study of an air pollution event on January 2013 by Wang et al. (2017) found that the emission from the Beijing urban area constituted more than 80 % of the surface PM2.5 concentration. Because the high-humidity air favorable for local aerosol growth was transported into the Beijing area and was associated with high aerosols, sorting out contributions of aerosols originating south of Beijing from local aerosol growth to the dramatic increase of aerosol concentration during the severe pollution event requires more observations and further investigation. Based on the detailed aerosol and turbulence observations presented above, at least a significant, if not a major, fraction of the fast increase of the surface PM2.5 concentration on 30 November can be explained by transferring processes associated with horizontal advection above the PBL and turbulent mixing within the PBL in the polluted area and the Beijing area. Higher surface PM2.5 concentration south of Beijing compared to the maximum PM2.5 concentration at IAP was indeed observed on 30 November (Hao et al., 2017).
4.5 Stage 5
Around midnight on 30 November, the air flow in the tower layer changed direction from northeasterly to northwesterly and the wind speed within the tower layer increased slightly under the influence of the mountains west and north of Beijing (Figs. 8f and 8g). The wind direction change brought in the less-polluted air, resulting in the surface PM2.5 concentration reduction of about 100 µg m−3. Meanwhile, clouds moved in as indicated in the time series of the downward longwave radiation (not shown) and the MODIS image around noon (Fig. 6d). As a result of clouds and extremely high aerosol concentration, the downward solar radiation at the surface was near zero even around noon on 1 December (Fig. 8a). Without surface heating and strong wind shear to generate turbulent mixing for transporting the heavily polluted air vertically and without effective horizontal advection to reduce the pollutant concentration, the heavily polluted air with the surface PM2.5 concentration of about 500 µg m−3 at IAP remained in the weakly stable urban boundary layer throughout 1 December until the significant increase of northwesterly wind arrived at midnight, which reduced the PM2.5 concentration down to below 50 µg m−3 within 2 h after the wind speed increase.
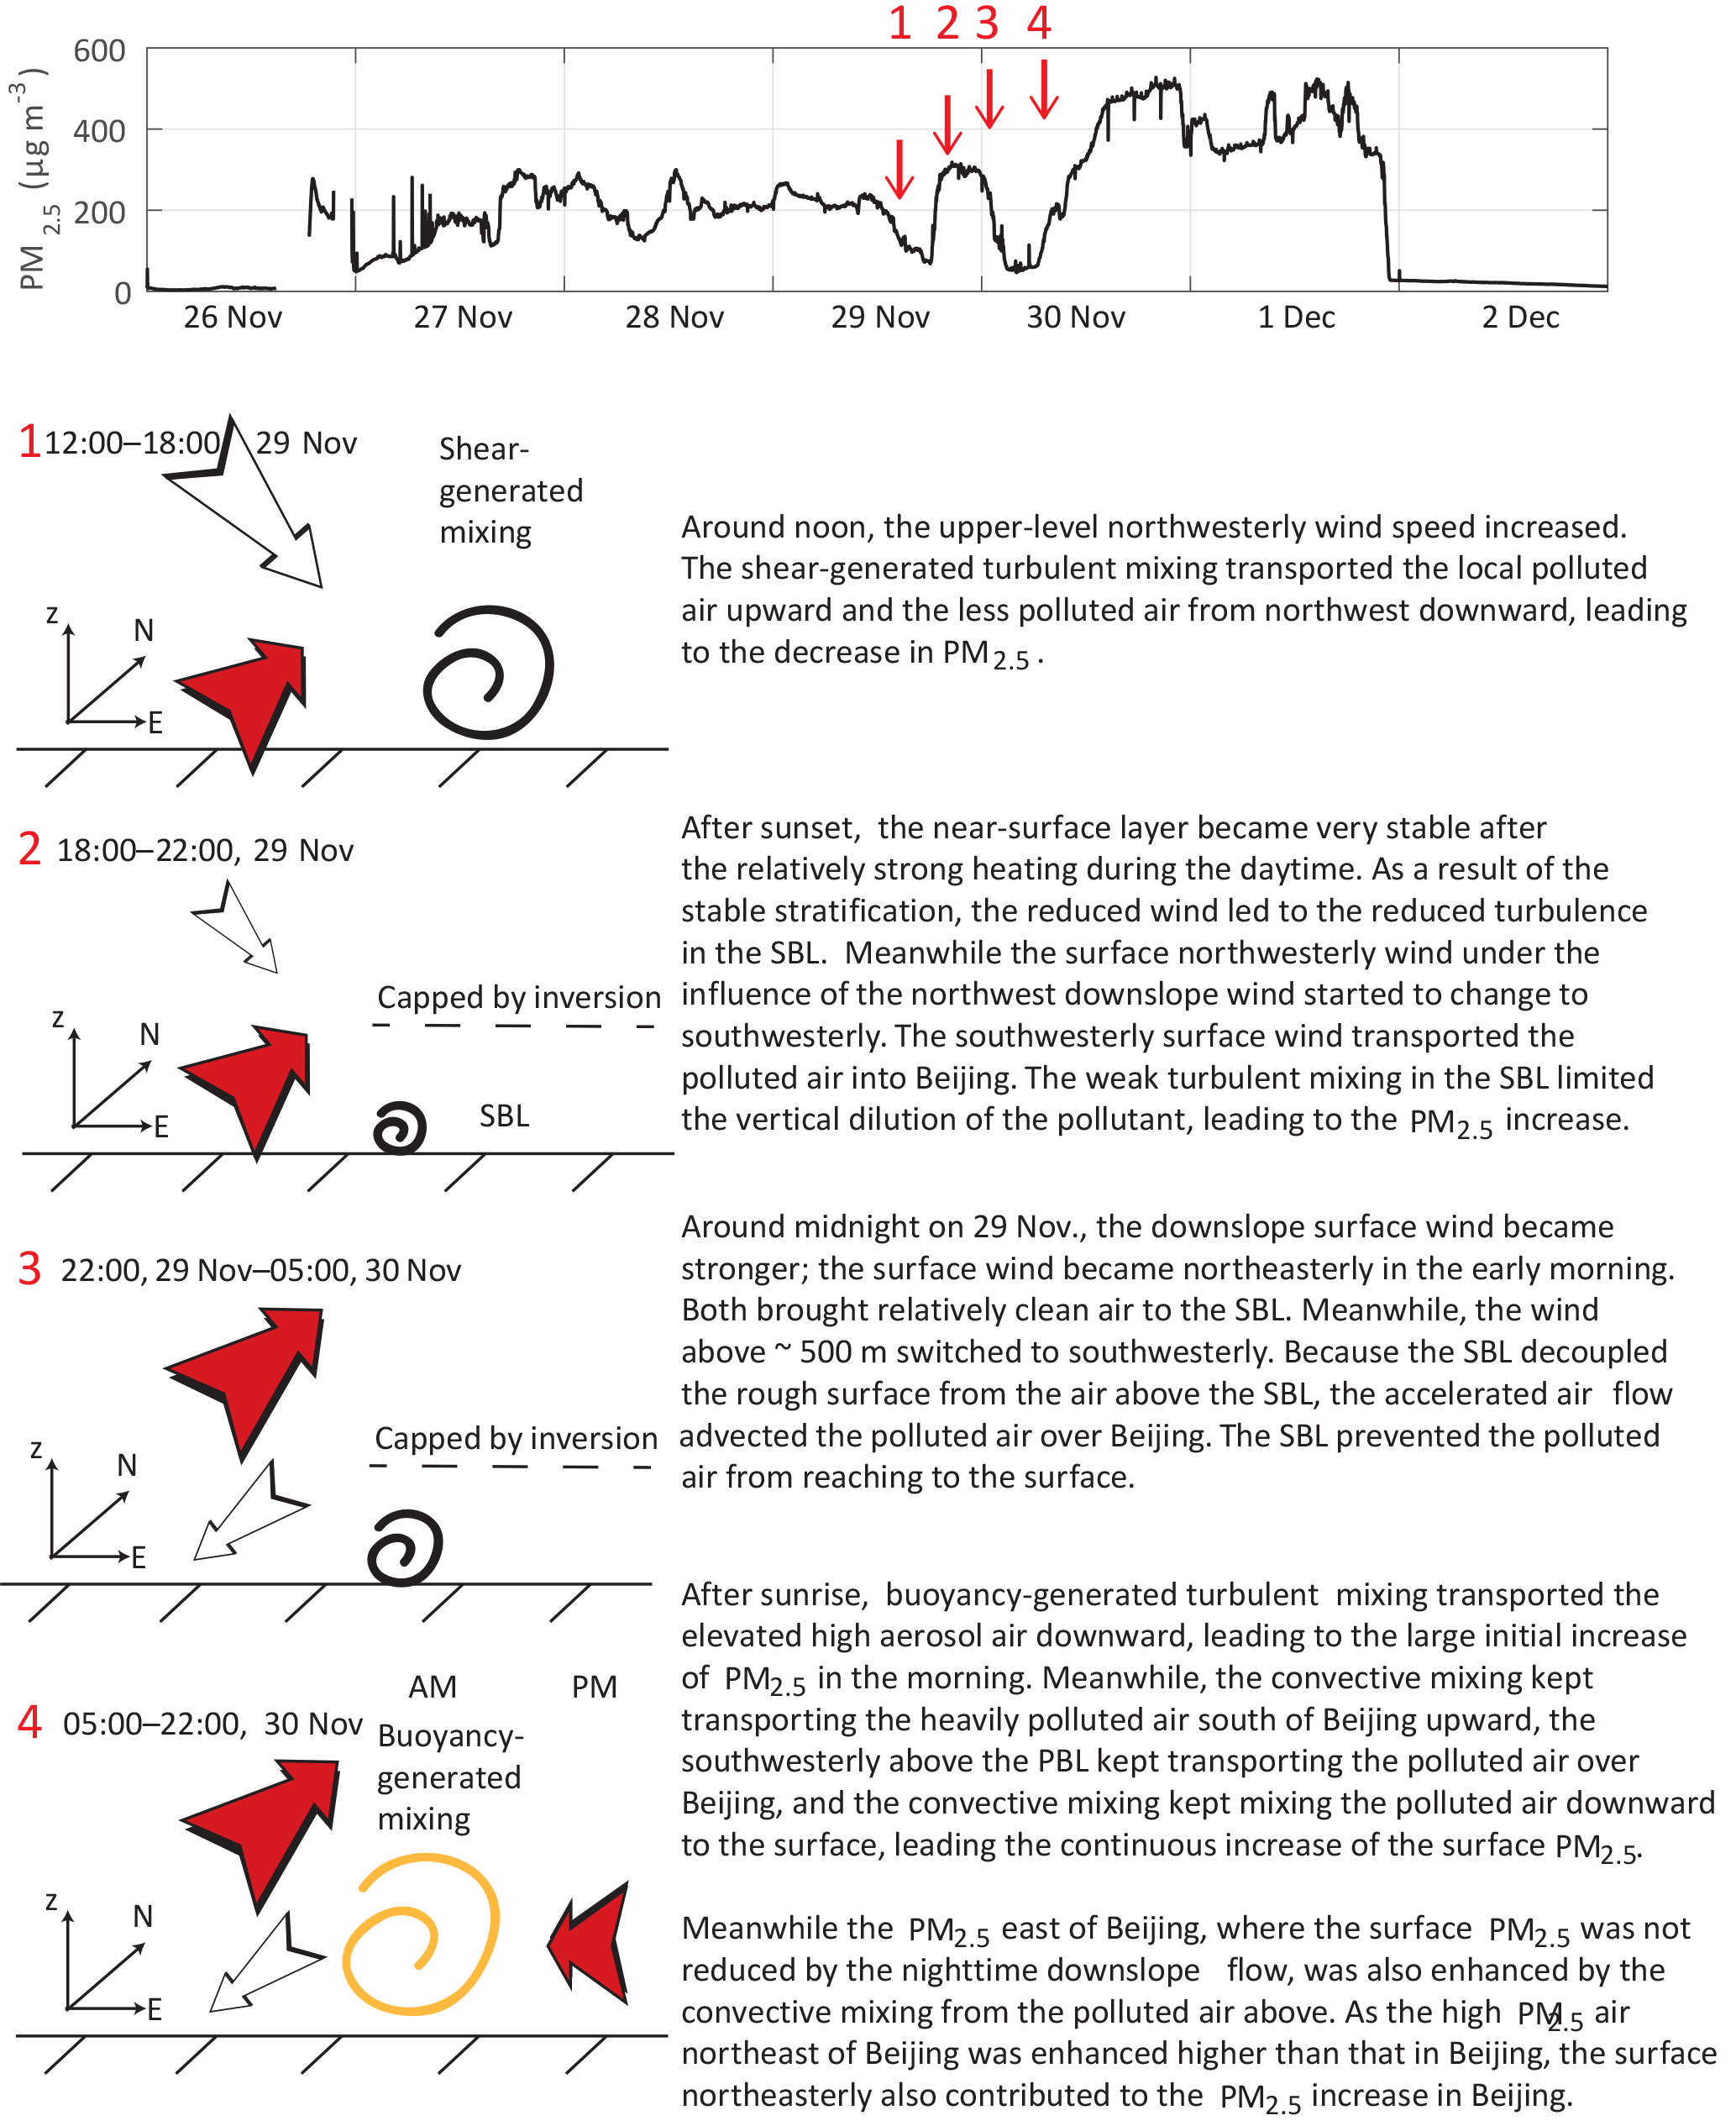
Figure 11Schematic diagrams of the roles of turbulent mixing and advection in the four stages of the surface PM2.5 oscillation (marked in the top panel) prior to and during the development of the heavy pollution event on 30 November at IAP. Thermally and mechanically forced turbulence eddies are represented by yellow and black spirals, respectively. The white and the red arrows represent the relatively clean and dirty air, respectively.
4.6 Discussion
Overall, both turbulent mixing and advection are responsible for transporting the heavily polluted air to the Beijing urban area and the PM2.5 oscillations. Turbulent mixing is generated by either surface heating or wind shear and transports pollutants from high to low concentration areas. If the upper-level concentration of pollutants is low, vertical turbulent mixing leads to the decrease of the surface concentration. If the vertical concentration gradient is reversed, vertical turbulent mixing leads to an increase of the surface concentration. Advection transports the air downstream. If the concentration of pollutants is higher upstream than downstream, the downstream pollutant concentration increases. In contrast to turbulent mixing, the downstream concentration would not affect the upstream concentration effectively. Horizontal advection of aerosols requires a non-zero air flow and an aerosol concentration difference between upstream and downstream. The air flow can be slowed by the surface drag through the air–surface coupling by turbulent mixing. Strong turbulent mixing such as under convective or strong wind conditions leads to strong impacts of the rough surface on the air flow. When the air near the surface is stably stratified, the air flow is slowed down because turbulence eddies consume energy for transferring heat downward such that turbulent kinetic energy cannot increase significantly, which is commonly called the stable stability effect on air flow (Garratt, 1992). That is, the air flow is not fully coupled with the surface; therefore, the impact of the surface drag on the air flow is reduced. As a result, the air flow above an stable layer is not slowed down by the rough surface as much as under unstable or neutral conditions. Therefore, the stable boundary layer does not only trap pollutants as is commonly observed, it also assists the pollutant transport above. Consequently horizontal advection of aerosols can be much more effective over a stable boundary layer than through a convective boundary layer. During this severe pollution event, the effective horizontal transport of the heavily polluted air above the PBL and the convective mixing within the PBL led to the dramatic increase of the surface PM2.5 concentration in the Beijing area. The roles of turbulent mixing and advection in the development of the severe air pollution event are schematically illustrated in Fig. 11.
Elevated polluted air has been observed in the Beijing area (Han et al., 2018); the advection process is commonly believed to be the transporting mechanism. This study demonstrates that turbulent mixing in the PBL plays an important role in direct transporting polluted air and in determining effectiveness of horizontal advection of polluted air.
We analyzed the extreme heavy pollution event at the end of November 2015 in Beijing, China, based on the observations collected during SURF-15. Similar to previous pollution studies, we found that the slow movement of the regional pressure system and the influence of the mountains northwest of Beijing provided favorable conditions to keep polluted air in the Beijing area. In addition, we also identified the unique role of convective turbulent mixing and the stable boundary layer in pollutant transfer and their impacts on effectiveness of horizontal pollutant transport.
During the daytime of 29 November, the relatively strong downward solar radiation led to the significant warming of the boundary layer air, which provide favorable conditions for the development of the stable nighttime boundary layer in the Beijing area. The nighttime downslope flow from the mountains northwest of Beijing brought in the relatively clean air, which reduced the surface PM2.5 concentration in the northwest part of Beijing and the high PM2.5 concentration appeared in the southeast part of Beijing. Around midnight on 29 November, the wind above the nighttime stable boundary layer changed from northwesterly to southwesterly. With the reduced surface drag through the reduced coupling of the stable boundary layer, the southwesterly wind effectively transported the polluted air from south of Beijing to above the urban area. After sunrise on 30 November, the daytime convective mixing with large coherent eddies transported the elevated polluted air downward, which initiated the dramatic increase of the surface PM2.5 concentration in the morning of 30 November. Meanwhile, the vertical convective mixing kept transporting the heavily polluted air southwest of Beijing upward and the upper southwesterly wind kept transporting the polluted air to above the convective boundary layer over Beijing, which provided the continuous pollution source to be entrained into the convective boundary layer leading to the explosive increase of the surface PM2.5 concentration in Beijing. The cloud cover as well as the high aerosol concentration on 1 December prevented buoyancy generation of turbulence; weak winds prevented shear generation of turbulence, leading to the stagnant high PM2.5 air throughout 1 December until midnight when the strong northwesterly wind arrived, which reduced the PM2.5 concentration to below 50 µg m−3 in the Beijing area. The low-wind conditions and high-humidity air during the buildup of the polluted air on 30 November might have also contributed to local aerosol growth. Significant oscillations of the surface PM2.5 concentration transported from south of Beijing prior to the dramatic increase of PM2.5 on 30 November can also be explained in terms of turbulent mixing and horizontal advection on pollutant transport.
Interactions between turbulent mixing and horizontal advection in transporting polluted air demonstrated in this study raise serious challenges for numerical models. Failure to simulate stable boundary layers in numerical models (Sun et al., 2015) may lead to unsuccessful prediction of aerosol concentrations not only because of the trapping mechanism of the stable boundary layer but also because of its decoupling mechanism on horizontal transport of aerosols above. The roles of turbulent mixing and horizontal advection in transporting moisture and aerosols can provide useful environment information for chemical reactions as well.
The Urban Meteorological Data Sharing Platform (UMDSP) archives the SURF field data collected from 2015 and 2016; see http://www.ium.cn/dataCenter/. The UMDSP provides information on observation sites and instruments, manufacturer-provided softwares, and quality-controlled observations from the wind profilers, MPLs, Doppler lidar, flux towers, microwave radiometers, and radiosondes. Additional observation data from weather radar, aircraft, and lightning during the field campaign period are also archived at the UMDSP. Information regarding the SURF field campaign can be found in Liang et al. (2018).
The authors declare that they have no conflict of interest.
The authors would like to thank the anonymous reviewers for their helpful comments and to acknowledge the data collected by
the IAP, Chinese Academy of Sciences. The SURF project is sponsored by the Institute of Urban Meteorology, Meteorological
Administration, Beijing, China; the Ministry of Science and Technology of China (grant nos. 2015DFA20870 and
2016YFC0203302); the National Natural Science Foundation of China, project no. 41505102; and Beijing Natural Science
Foundation of China (grant no. 8171002). The University Corporation for Atmospheric Research manages the National Center for
Atmospheric Research under sponsorship by the National Science Foundation. Any opinions, findings and conclusions, or
recommendations expressed in this publication are those of the authors and do not necessarily reflect the views of the
National Science Foundation.
Edited by: Veli-Matti Kerminen
Reviewed by: three anonymous referees
Aitken, M. L., Rhodes, M. E., and Lundquist, J. K.: Performance of a wind-profile lidar in the region of wind turbine rotor disks, J. Atmos. Ocean. Tech., 29, 347–355, 2012. a
Burba, G.: Eddy covariance method for scientifc, industrial, agricultural, and regulatory applications: a field book on measuring ecosystem gas exchange and areal emission rates, LI-COR Bioscience, Lincoln, NE, USA, 2013. a
Campbell, J. R., Hlavka, D. L., Welton, E. J., Flynn, C. J., Turner, D. D., Spinhirne, J. D., Scott III, V. S., and Hwang, I.: Full-time, eye-safe cloud and aerosol lidar observation at atmospheric radiation measurement program sites: instruments and data processing, J. Atmos. Ocean. Tech., 19, 431–442, 2002. a
Chen, Y., Zhao, C., Zhang, Q., Deng, Z., Huang, M., and Ma, X.: Aircraft study of mountain chimney effect of Beijing, China, J. Geophys. Res., 114, D08306, https://doi.org/10.1029/2008JD010610, 2009. a
Davoust, S., Jehu, A., Bouillet, M., Bardon, M., Vercherin, B., Scholbrock, A., Fleming, P., and Wright, A.: Assessment and optimization of lidar measurement availability for wind turbine control, in: Scientific. Proceedings of EWEA Conference 10–13 March 2014, Fira de Barcelona Gran Via in Barcelona, Spain, 2014. a
Dou, J., Wang, Y., and Miao, S.: Characteristics of spatial and temporal structures of surface moisture and wind fields in Beijing area, Applied Meteorology Report, 25, 559–569, 2014. a
Fan, M., Zhu, R., Zhu, K., and Li, Z.: Numerical simulation study on a lasting heavy air pollution in Beijing, Tianjin, and Hebei region in November 2015, Plateau and Mountain Meteorology Research, 36, 7–14, 2016 (in Chinese). a
Garratt, J. R.: The Atmospheric Boundary Layer, Cambridge Atmospheric and Space Science Series, Cambridge University Press, UK, 316 pp., 1992. a
Guo, S., Hu, M., Zamora, M. L., Peng, J., Shang, D., Zheng, J., Du, Z., Wu, Z., Shao, M., Zeng, L., Molina, M. J., and Zhang, R.: Elucidating severe urban haze formation in China, P. Natl. Acad. Sci. USA, 111, 17373–17378, 2014. a
Han, S., Hao, T., Zhang, Y., Liu, J., Li, P., Cai, Z., Zhang, M., Wang, Q., and Zhang, H.: Vertical observation and analysis on rapid formation and evolutionary mechanisms of a prolonged haze episode over Central-Eastern China, Sci. Total Environ., 616–617, 135–146, 2018. a
Han, X. and Zhang, M.: Model analysis of haze formation over the North China Plain in January, Clim. Env. Res., 19, 127–139, 2014 (in Chinese). a
Hao, T., Han, S., Chen, S., Shan, X., Zai, Z., Qiu, X., Yao, Q., Liu, J., Chen, J., and Meng, L.: The role of fog in haze episode in Tianjing, China: a case study for November 2015, Atmos. Res., 194, 235–244, 2017. a, b
Hey, J. V., Coupland, J., Foo, M. H., Richards, J., and Sandford, A.: Determination of overlap in lidar systems, Appl. Optics, 50, 5791–5797, 2011. a
Li, L.-J., Wang, Z.-S., Zhang, D.-W., Chen, T., Jiang, L., and Li, Y.-T.: Analysis of heavy air pollution episodes in Beijing during 2013–2014, Chinese Environmental Science, 36, 27–35, 2016 (in Chinese). a, b
Liang, J. and Tang, Y.: Climatology of the meteorological factors associated with haze events over Northern China and their potential response to the quansi-biannual oscillation, J. Meteorol. Res.-PRC, 31, 852–864, 2017. a
Liang, X., Miao, S., Li, J., Bornstein, R., Zhang, X., Gao, Y., Cao, X., Chen, F., Cheng, Z., Clements, C., Debberdt, W., Ding, A., Ding, D., Dou, J. J., Dou, J. X., Dou, Y., Grimoond, C. S. B., Gonzalez-Cruz, J., He, J., Huang, M., Huang, X., Ju, S., Li, Q., Niyogi, D., Quan, J., Sun, J., Sun, J. Z., Yu, M., Zhang, J., Zhang, Y., Zhao, X., Zheng, Z., and Zhou, M.: SURF: understanding and predicting urban convection and haze, B. Am. Meteorol. Soc., https://doi.org/10.1175/BAMS-D-16-0178.1, 2018. a
Liao, X., Zhang, X., and Wang, Y.: Comparative analysis on meteorological condition for persistent haze cases in summer and winter in Beijing, Environm. Sci., 35, 2031–2044, 2014 (in Chinese). a
Liu, S., Liu, Z., Li, J., Wang, Y., Ma, Y., Sheng, L., Liu, H., Liang, F., Xin, G., and Wang, J.: Numerical simulation for the coupling effect of local atmospheric circulations over the area of Beijing, Tianjin and Hebei province, Sci. China Ser. D, 52, 382–392, 2009. a
Liu, T., Gong, S., He, J., Yu, M., Wang, Q., Li, H., Liu, W., Zhang, J., Li, L., Wang, X., Li, S., Lu, Y., Du, H., Wang, Y., Zhou, C., Liu, H., and Zhao, Q.: Attributions of meteorological and emission factors to the 2015 winter severe haze pollution episodes in China's Jing-Jin-Ji area, Atmos. Chem. Phys., 17, 2971–2980, https://doi.org/10.5194/acp-17-2971-2017, 2017. a
Mader, P. P., MacPhee, R. D., Lofberg, R. T., and Larson, G. P.: Composition of organic portion of atmospheric aerosols in the Los Angeles area, Ind. Eng. Chem., 44, 1352–1355, 1952. a
Meng, Y. and Cheng, C.: Impact of surface synoptic situations on air pollution in Beijing area, Meteorology, 28, 42–47, 2002. a
Parrish, D. D., Singh, H. B., Molina, L., and Madronich, S.: Air quality progress in North American megacities: a review, Atmos. Environ., 45, 7015–7025, 2011. a
Putaud, J.-P., Raes, F., Van Dingenen, R., Brüggemann, E., Facchini, M.-C., Decesari, S., Fuzzi, S., Gehrig, R., Hüglin, C., Laj, P., Lorbeer, G., Maenhaut, W., Mihalopoulos, N., Müller, K., Querol, X., Rodriguez, S., Schneider, J., Spindler, G., ten Brink, H., TØrseth, K., and Wiedensohler, A.: A European aerosol phenomenology – 2: Chemical characteristics of particulate matter at kerbside, urban, rural and background sites in Europe, Atmos. Environ., 38, 2579–2595, 2004. a
Putaud, J.-P., Van Dingenen, R., Alastuey, A., Bauer, H., Birmili, W., Cyrys, J., Flentje, H., Fuzzi, S., Gehrig, R., Hansson, H. C., Harrison, R. M., Herrmann, H., Hitzenberger, R., Hüglin, C., Jones, A. M., Kasper-Giebl, A., Kiss, G., Kousa, A., Kuhlbusch, T. A. J., Löschau, G., Maenhaut, W., Molnar, A., Moreno, T., Pekkanen, J., Perrino, C., Pitz, M., Puxbaum, H., Querol, X., Rodriguez, S., Salma, I., Schwarz, J., Smolik, J., Schneider, J., Spindler, G., ten Brink, H., Tursic, J., Viana, M., Wiedensohler, A., and Raes, F.: A European aerosol phenomenology – 3: Physical and chemical characteristics of particulate matter from 60 rural, urban, and kerbside sites across Europe, Atmos. Environ., 44, 1308–1320, 2010. a
Quan, J., Tie, X., Zhang, Q., Liu, Q., Li, X., Gao, Y., and Zhao, D.: Characteristics of heavy aerosol pollution during the 2012–2013 winter in Beijing, China, Atmos. Environ., 88, 83–89, 2014. a
Sun, F., Zhang, D., Sun, R., Dong, X., Wang, X., Wang, Z., and Cheng, N.: Typical heavy pollution episode analysis on PM2.5 in winter of Beijing, Environment Monitoring in China, 30, 1–12, 2014 (in Chinese). a
Sun, J., Desjardins, R., Mahrt, L., and MacPherson, I.: Transport of carbon dioxide, water vapor, and ozone by turbulence and local circulations, J. Geophys. Res., 103, 25873–25885, 1998. a
Sun, J., Nappo, C. J., Mahrt, L., Belušić, D., Finnigan, J. J., Yagüe, C., Grisogono, B., Pouquet, A., Stauffer, D. R., Smith, R. B., Svensson, G., Neff, W. D., Mayor, S. D., Grachev, A. A., Galperin, B., Jiang, Q., Pulido, M., and Staquet, C.: Review of wave-turbulence interactions in stable atmospheric boundary layer, Rev. Geophys., 53, 956–993, https://doi.org/10.1002/2015RG000487, 2015. a
Sun, J., Lenschow, D. H., LeMone, M. A., and Mahrt, L.: The role of large-coherent-eddy transport in the atmospheric surface layer based on CASES-99 observations, Bound.-Lay. Meteorol., 160, 83–111, https://doi.org/10.1007/s10546-016-0134-0, 2016. a
Sun, J., Cheng, Z., Li, J., Dou, J., Cao, X., Zhang, J., and Zhou, M.: Influences of urban canopies on turbulent mixing in the lower atmospheric boundary layer, J. Appl. Meteorol. Clim., submitted, 2017. a, b
Van Dingenen, R., Raes, F., Putaud, J.-P., Baltensperger, U., Charron, A., Facchini, M.-C., Decesari, S., Fuzzi, S., Gehrig, R., Hansson, H.-C., Harrison, R. M., Hüglin, C., Jones, A. M., Laj, P., Lorbeer, G., Maenhaut, W., Palmgren, F., Querol, X., Rodriguez, S., Schneider, J., ten Brink, H., Tunved, P., Tørseth, K., Wehner, B., Weingartner, E., Wiedensohler, A., and Wåhlin, P.: A European aerosol phenomenology – 1: Physical characteristics of particulate matter at kerbside, urban, rural and background sites in Europe, Atmos. Environ., 38, 2561–2577, 2004. a
Wang, X., Wei, W., Cheng, S., Li, J., Zhang, H., and Lv, Z.: Characteristics and classification of PM2.5 pollution episodes in Beijing from 2013 and 2015, Sci. Total Environ., 612, 170–179, 2018. a
Wang, Y., Yao, L., Wang, L., Liu, Z., Ji, D., Tang, G., Zhang, J., Sun, Y., Hu, B., and Xin, J.: Mechanism for the formation of the January 2013 heavy haze pollution episode over Central and Eastern China, Sci. China Earth Sci., 57, 14–25, 2014. a, b
Wang, Y., Bao, S., Wang, S., Hu, Y., Shi, X., Wang, J., Zhao, B., Jiang, J., Zheng, M., Wu, M., Ruseel, A., Wang, Y., and Hao, J.: Local and regional contributions to fine particulate matter in Beijing during heavy haze episodes, Sci. Total Environ., 580, 283–296, 2017. a, b
Wang, Z., Li, J., Wang, Z., Yang, W., Tang, X., Ge, B., Yan, P., Zhu, L., Chen, X., Chen, H., Wand, W., Li, J., Liu, B., Wang, X., Wand, W., Zhao, Y., Lu, N., and Su, D.: Modeling study of regional severe hazes over Mid-Eastern China in January 2013 and its implications on pollution prevention and control, Sci. China Earth Sci., 57, 3–13, 2014. a
Xu, X., Zhou, X., and Shi, X.: Characteristics of spatial structures and scale analyses of air pollution over urban areas, Sinica D. Geophysics, 35, 1–19, 2005 (in Chinese). a, b, c
Zhang, B., Liu, S., and Liu, H.: The effect of MYJ and YSU schemes on the simulation of boundary layer meteorological factors of WRF, Chinese J. Geophys-Ch., 55, 2239–2248, 2012 (in Chinese). a
Zhang, K., Cai, X., and Chai, F.: Structures and characteristics of the atmospheric boundary layer over Beijing area in autumn, Acta Scientiarum Nauralium Universitatis Pekinensis, 42, 220–225, 2006. a
Zhang, R., Wang, G., Guo, S., Zamora, M. L., Ying, Q., Lin, Y., Wang, W., Hu, M., and Wang, Y.: Formation of urban fine particulate matter, Chem. Rev., 115, 3803–3855, 2015. a
Zhang, W., Guo, J., Sun, Y., Yuan, H., Zhuang, G., Zhuang, Y., and Hao, Z.: Source apportionment for urban PM10 and PM2.5 in the Beijing area, Chinese Sci. Bull., 52, 608–615, 2007. a
Zhang, Z., Gong, D., Mao, R., Kim, S.-J., Xu, J., Zhao, X., and Ma, Z.: Cause and predictability for the severe haze pollution in downtown Beijing November–December 2015, Sci. Total Environ., 592, 627–638, 2017a. a, b, c
Zhang, Z., Zhang, X., Zhang, Y., Wang, Y., Zhou, H., Shen, X., Che, H., Sun, J., and Zhang, L.: Characteristics of chemical composition and role of meteorological factors during heavy aerosol pollution episodes in northern Beijing area in autumn and winter of 2015, Tellus, 69, 1347484, https://doi.org/10.1080/16000889.2017.1347484, 2017b. a
Zhao, P., Xu, X.-F., Meng, W., Dong, F., He, D., Shi, Q., and Zhang, X.: Characteristics of hazy days in the region of Beijing, Tianjin, and Hebei, Chinese Environmental Science, 32, 31–36, 2012 (in Chinese). a
Zhao, X. J., Zhao, P. S., Xu, J., Meng,, W., Pu, W. W., Dong, F., He, D., and Shi, Q. F.: Analysis of a winter regional haze event and its formation mechanism in the North China Plain, Atmos. Chem. Phys., 13, 5685–5696, https://doi.org/10.5194/acp-13-5685-2013, 2013. a, b, c
Zhong, J., Zhang, X., Wang, Y., Sun, J., Zhang, Y., Wang, J., Tan, K., Shen, X., Che, H., Zhang, L., Zhang, Z., Qi, X., Zhao, H., Ren, S., and Li, Y.: Relative contributions of boundary-layer meteorological factors to the explosive growth of PM2.5 during the red-alert heavy pollution episodes in Beijing in December 2016, J. Meteorol. Res.-PRC, 31, 809–819, 2017. a, b