the Creative Commons Attribution 4.0 License.
the Creative Commons Attribution 4.0 License.
 | 07 Mar 2018
Non-methane organic gas emissions from biomass burning: identification, quantification, and emission factors from PTR-ToF during the FIREX 2016 laboratory experiment
Abigail R. Koss
Kanako Sekimoto
Jessica B. Gilman
Vanessa Selimovic
Matthew M. Coggon
Kyle J. Zarzana
Brian M. Lerner
Steven S. Brown
Jose L. Jimenez
Jordan Krechmer
James M. Roberts
Carsten Warneke
Robert J. Yokelson
Joost de Gouw
Volatile and intermediate-volatility non-methane organic gases (NMOGs) released from biomass burning were measured during laboratory-simulated wildfires by proton-transfer-reaction time-of-flight mass spectrometry (PTR-ToF). We identified NMOG contributors to more than 150 PTR ion masses using gas chromatography (GC) pre-separation with electron ionization, H3O+ chemical ionization, and NO+ chemical ionization, an extensive literature review, and time series correlation, providing higher certainty for ion identifications than has been previously available. Our interpretation of the PTR-ToF mass spectrum accounts for nearly 90 % of NMOG mass detected by PTR-ToF across all fuel types. The relative contributions of different NMOGs to individual exact ion masses are mostly similar across many fires and fuel types. The PTR-ToF measurements are compared to corresponding measurements from open-path Fourier transform infrared spectroscopy (OP-FTIR), broadband cavity-enhanced spectroscopy (ACES), and iodide ion chemical ionization mass spectrometry (I− CIMS) where possible. The majority of comparisons have slopes near 1 and values of the linear correlation coefficient, R2, of > 0.8, including compounds that are not frequently reported by PTR-MS such as ammonia, hydrogen cyanide (HCN), nitrous acid (HONO), and propene. The exceptions include methylglyoxal and compounds that are known to be difficult to measure with one or more of the deployed instruments. The fire-integrated emission ratios to CO and emission factors of NMOGs from 18 fuel types are provided. Finally, we provide an overview of the chemical characteristics of detected species. Non-aromatic oxygenated compounds are the most abundant. Furans and aromatics, while less abundant, comprise a large portion of the OH reactivity. The OH reactivity, its major contributors, and the volatility distribution of emissions can change considerably over the course of a fire.
- Article
(7755 KB) - Full-text XML
-
Supplement
(1899 KB) - BibTeX
- EndNote


Biomass burning, including wildfires, agricultural burning, and domestic fuel use, is a large source of non-methane organic gases (NMOGs) to the atmosphere (Crutzen and Andreae, 1990; Akagi et al., 2011). These compounds can be directly harmful to human health (Naeher et al., 2007) and contribute to the formation of secondary pollutants including ozone and secondary organic aerosol (SOA; Alvarado et al., 2009, 2015; Yokelson et al., 2009; Jaffe and Wigder, 2012). Because NMOGs from biomass burning are a complex mixture of many species that can change considerably depending on fuel and fire characteristics, many modeling and inventory efforts have had difficulty capturing subsequent chemistry in fire plumes (Alvarado et al., 2009; Grieshop et al., 2009; Wiedinmyer et al., 2011; Heald et al., 2011; Müller et al., 2016; Reddington et al., 2016; Shrivastava et al., 2017). Additionally, a substantial portion of gas-phase carbon may be missing from many field measurements (Warneke et al., 2011; Yokelson et al., 2013; Hatch et al., 2017) and the gas-phase precursors of SOA are not sufficiently understood (Jathar et al., 2014; Alvarado et al., 2015; Hatch et al., 2017). For these reasons, it is important to develop and understand analytical techniques that quantify a large number of biomass burning NMOGs.
Gas chromatography (GC) techniques have been used to identify NMOGs emitted by biomass burning in high chemical detail and provide exact isomer identifications (Hatch et al., 2015, 2017; Gilman et al., 2015). However, online GC techniques do not provide continuous measurement and are limited to certain classes of NMOGs depending on the column(s) selected and required sample preconditioning steps. This makes them nonideal for some important compounds or situations in which fast, continuous measurements are necessary. Whole-air sampling followed by GC can improve the time resolution but is affected by artifacts from canister storage (Lerner et al., 2017).
Proton-transfer-reaction mass spectrometry (PTR-MS) is a complementary technique widely used in atmospheric chemistry, both stand-alone and with a GC interface (de Gouw and Warneke, 2007; Yuan et al., 2017). This chemical ionization technique uses H3O+ to detect a wide range of unsaturated and polar NMOGs. It can measure continuously at a very fast rate: up to 10 Hz measurement has been reported in the literature (Müller et al., 2010). Recently, PTR-MS instruments using time-of-flight mass analyzers (PTR-ToF) with mass resolution greater than 4000 m∕Δm have provided fast, simultaneous measurements of exact mass and elemental formula over a wide mass range (m∕z typically between 10 and 500 Th) with detection limits in the range of tens to hundreds of parts per trillion (pptv; Jordan et al., 2009; Yuan et al., 2016). The addition of a GC interface can resolve isomers with the same elemental formula, thereby providing the exact identity of detected NMOGs.
Several recent papers have reported the use of high-resolution PTR-ToF to measure biomass burning NMOGs in the laboratory (Stockwell et al., 2015; Bruns et al., 2017) and the environment (Brilli et al., 2014; Müller et al., 2016). Hatch et al. (2017) suggest that PTR-ToF measures a substantial fraction (50–80 %) of total NMOG carbon mass. The mass spectra resulting from PTR-ToF detection of biomass burning NMOGs are complex, and many peak assignments are tentative. However, it is clear that PTR-ToF can provide detailed NMOG measurements relevant to studying the effects of fire emissions on human health and ozone and secondary organic aerosol formation.
A PTR-ToF instrument (Yuan et al., 2016) was deployed during the Fire Influence on Regional and Global Environments Experiment (FIREX) 2016 intensive at the US Forest Service Fire Sciences Laboratory in Missoula, Montana. This experiment burned a series of natural fuels and characterized the gas- and particle-phase emissions with a range of instrumentation (Selimovic et al., 2017). The aging of these emissions was explored with additional chamber experiments (described elsewhere). In this paper we describe the PTR-ToF instrument operation and interpretation of measurements. The focus is on direct emissions. Building on work by Stockwell et al. (2015), Brilli et al. (2014), and others, we provide new, more detailed, and more highly time-resolved chemistry of NMOG emissions from biomass burning than previously available.
The purposes of this work are to improve our understanding of the complex NMOG emissions from biomass burning by interpreting PTR-ToF measurements of biomass burning emissions, provide emission factors and emission ratios to CO for many NMOGs, link PTR-ToF measurements to GC, Fourier transform infrared spectroscopy (FTIR), and iodide CIMS (I− CIMS) measurements, and report instrument operation and data quality assurance information that will support future analyses. Novel tools to study NMOGs measured by PTR-ToF applied in this work include (1) use of a GC interface to provide an additional level of chemical information, (2) use of NO+ CIMS (switchable reagent ion) chemistry to support compound identification, and (3) use of an improved method to estimate the instrument sensitivity to NMOGs not directly calibrated.
2.1 Fire Sciences Laboratory experimental setup
Controlled biomass combustion experiments were conducted in a large (12.5 m × 12.5 m × 22 m high) indoor facility at the US Forest Service Fire Sciences Laboratory. Fuels were burned underneath a 1.6 m diameter exhaust stack. Emissions were vented through the stack to 17 m of height, where a sampling platform is located. The pressure, temperature, and relative humidity of the air in the combustion chamber were monitored and low light conditions were present during experiments. The Fire Sciences Laboratory facility is described in more detail elsewhere (Christian, 2003, 2004; Burling et al., 2010; Stockwell et al., 2014). The FIREX 2016 intensive burned fuels characteristic of the western US, including ponderosa pine, lodgepole pine, Douglas fir, Engelmann spruce, subalpine fir, manzanita, chamise, sage, and juniper. Several other types of fuels were also burned, but with fewer replicates, and these included additional pine species (loblolly and Jeffrey pine), bear grass, rice straw, Ceanothus, dung, peat, excelsior, and commercial lumber. Experiments with western fuels included the combustion of both specific components of the fuel, such as canopy, litter, and duff, and more realistic burns that included a mix of components (Selimovic et al., 2017).
Two types of combustion experiments were conducted. In the first set of experiments, the “stack burns”, emissions were entrained into the ventilation stack and measured from the 17 m sampling platform. These experiments allowed for the characterization of changes in emission composition during the course of a fire and typically lasted 5 to 20 min. In the second set of experiments, the “room burns”, emissions were not vented and were allowed to mix and fill the combustion chamber. These experiments lasted several hours and provided a more compositionally stable mixture for instruments requiring a longer sampling time. In this work, we discuss 58 stack burns measured directly with PTR-ToF, and these data were used for the comparison between instruments. We also reference measurements from an additional seven stack burns measured directly with NO+-CIMS and discuss results from three stack burns and three room burns that were measured with GC-PTR-ToF using both H3O+ and NO+ reagent ion chemistry. The particular fires measured with each technique were selected as follows. At least one fire of each fuel type was measured directly with PTR-ToF, and coniferous fuels were measured at least twice. Given these restrictions with the PTR-ToF measurement, the widest possible range of fuel types was measured with NO+-CIMS. GC-CIMS stack burns were selected for longer-burning fuels that allowed for the collection of more than one sample. GC-CIMS room burns were selected to explore a range of fuel types. We were not able to measure every fuel type with every instrumental technique. Because there was not a clear temporal separation between fire processes and because some compounds were lost to the chamber walls (Stockwell et al., 2014), room burns measured directly with PTR-ToF were not used for compound identification and calculation of emission factors.
2.2 Instrumentation
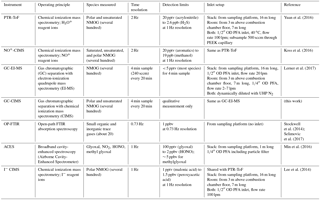
An overview of the instruments referenced in this work is given in Table 1.
2.2.1 PTR-ToF and NO+-CIMS
The PTR-ToF instrument is a chemical ionization mass spectrometer typically using H3O+ reagent ions. Trace gases with a proton affinity higher than that of water are protonated in a drift tube region and are detected sensitively with typical detection limits in the range of tens to hundreds of parts per trillion (pptv) for a 1 s measurement time. The main advantages of this technique are a response to a wide range of polar and unsaturated NMOGs, a low degree of fragmentation, and fast, online measurement capability. PTR-ToF additionally detects several inorganic species, including ammonia (NH3), isocyanic acid (HNCO), hydrogen sulfide (H2S), and nitrous acid (HONO), which are included in our discussion of NMOGs.
The instrument used in this work is very similar to that described by Yuan et al. (2016), with two relevant differences. The PTR-ToF instrument described by Yuan et al. (2016) includes two RF-only segmented quadrupole ion guides between the drift tube and time-of-flight mass analyzer, while the current version has only one ion guide. The effects of this are that the sensitivities are slightly higher (∼ 25 % on average), low ion masses (< m∕z 40 Th) are transmitted with higher efficiency, and the humidity dependence of NMOG sensitivity is less severe. There is also a higher flow rate (150 sccm) into the drift tube. Second, the instrument inlet (held at 40 ∘C) consists of ID PEEK tubing rather than PFA, which reduced residence time in the inlet.
The PTR-ToF instrument is equipped with a switchable reagent ion source that allows for H3O+ and alternatively NO+ ionization by flowing either water vapor for H3O+ or ultrapure air for NO+ through a hollow cathode ion source and adjusting ion source and ion guide voltages. NO+ chemical ionization of NMOGs creates different product ions than H3O+ chemical ionization, and the ionization mechanism depends on functional group (Koss et al., 2016). The PTR-ToF instrument in NO+ configuration (NO+-CIMS) can therefore detect several additional classes of NMOGs (e.g., branched alkanes) and can differentiate some sets of isomers, such as aldehydes and ketones, and nitriles and pyrroles. NO+-CIMS is described in detail by Koss et al. (2016). The NO+-CIMS was used to measure emissions directly from a small number of coniferous fuels and as the detector for the GC instrument for several fuel types.
In H3O+ mode the PTR-ToF instrument was operated with an electric field to number density ratio (E∕N) of 120 × 10−17 V cm2 (= 120 Townsend or Td). Measurements were made at a 2 Hz frequency. Ion m∕z from 12–500 Th were measured, and 12–217 Th were quantified with a maximum resolution of 4500 FWHM m (Δm)−1. This is sufficient to resolve many isobaric species, but many peaks still overlap in the mass spectrum. Overlap of an ion peak by an intense neighbor can strongly affect the accuracy of that ion measurement, and such affected ions were excluded from further analysis. ToF data were analyzed using the Tofware software package (Aerodyne Research, Inc., Tofwerk AG). For approximately one-half of the stack experiments, NMOG ion concentrations were temporarily high enough to deplete the reagent ion by 10–50 %. Under these conditions, sensitivity to NMOGs is lower and nonlinear (Veres et al., 2010b). We corrected NMOG ion signals for this effect, although effects from secondary proton-transfer reactions could still be a significant source of inaccuracy (Sect. S1 in the Supplement). Raw ion count rates (counts per second, cps) were corrected for duty cycle discrimination in the ToF extraction region and normalized to the intensity of the reagent ion (H3O+ 106 cps or NO+ 106 cps). Correction for humidity effects and the conversion of ion signal to mixing ratio are discussed in Sect. 2.3. Before each fire, we first measured instrument background by passing air from the combustion chamber through a heated platinum catalyst, then measured chamber background. Concentrations of NMOGs during the fire were generally several orders of magnitude higher than either background.
The PTR-ToF instrument transfer inlet was OD ( ID) PFA heated to 40 ∘C with a flow rate of 100 slpm. It was 16 m long (residence time 0.7 s) and located on the sampling platform for stack burns and 7 m long (residence time 0.3 s) and located 3 m above the combustion chamber floor for room burns. The instrument subsampled 500 sccm through a 40 ∘C 10 cm ID PEEK capillary orthogonally via a PFA branch-reducing tee mounted to the main inlet. Most particles were separated from the CIMS subsample capillary through virtual impaction, although a small, unquantified amount of particulate matter did enter the smaller instrument inlet. NMOGs could be lost to transfer inlet, instrument tubing, or drift tube surfaces. Based on good agreement with instrumentation on the sampling platform (Sect. 3.3.1), inlet losses of highly volatile compounds were negligible, but we were not able to quantify possible losses of less volatile compounds. Measurement of compounds with saturation vapor pressure (C0) less than 105 µg m−3 may be affected (Pagonis et al., 2017). A slight delay in the instrument response to some compounds with C0 close to 104 µg m−3 was observed.
2.2.2 GC-MS and GC-PTR-ToF
The gas chromatograph (GC) instrument cryogenically pre-concentrates 4 min samples of NMOGs before separation on one of two capillary columns (Lerner et al., 2017). The sample stream is separated into two channels that are optimized to reduce water and carbon dioxide before cryogenic trapping of NMOG. The first channel (trapping at −165 ∘C) is connected to an Al2O3∕KCl porous layer open tubular (PLOT) column optimized for C2–C6 hydrocarbons. The second channel (trapping at −135 ∘C) uses a medium polarity polysiloxane (Restek MXT-624) column optimized for C6–C10 hydrocarbons and many polar compounds. The two channels are analyzed sequentially.
The eluent from the GC columns was directed to either an electron ionization (EI) quadrupole mass spectrometer (Agilent model 5975C) or to the PTR-ToF instrument. The quadrupole mass spectrometer has unit mass resolution and was operated in full ion scan mode from m∕z 19 to 150 Th. When the PTR-ToF instrument in either H3O+ or NO+ configuration was used as the detector, the 2 sccm eluent from the columns was introduced directly into the drift tube. To maintain pressure (2.4 mbar) in the drift tube, an additional 50 sccm of catalyst-generated clean air was added to the drift tube. This is lower than the 150 sccm of flow used during non-GC-PTR-ToF operation but does not affect compound identification.
The GC inlet for stack burns was OD PFA, 16 m long, and located on the sampling platform, with a continuous flow rate of 20 lpm. A subsample was directed to the instrument with a OD PFA, 2 m long line with flow rates from 2–7 lpm. For room burns the inlet was 1/4 OD PFA, 7 m long, and located 3 m above the combustion chamber floor. A flow rate of 2–7 slpm was used. For both stack and room burns the inlet was heated to 40 ∘C and the stream was dynamically diluted with humidified UHP N2 (1 to 3 parts smoke to 5 parts N2). Particles were reduced by virtual impaction.
Two stack experiments (both Douglas fir) were measured with both GC-EI-MS and GC-PTR-ToF; one stack experiment (Engelmann spruce duff) and three room experiments (Douglas fir, subalpine fir, and sage) were each measured with GC-EI-MS, GC-PTR-ToF, and GC-NO+-CIMS. Two additional samples (of a room burn of sage), one with H3O+ and one with NO+ chemistry, were analyzed using an accelerated GC temperature ramp program to better observe late-eluting compounds. Each 4 min sample was analyzed with just one type of detector, and the detector was switched for the next 4 min sample. For room experiments and duff stack burns, NMOG composition was largely consistent between successive GC samples. Other stack burns varied more quickly. The room experiment GC-CIMS analyses detected NMOGs more sensitively because we were better able to adjust the GC sample stream dilution. Finally, we measured a 56-component NMOG calibration standard with the GC-PTR-ToF and GC-NO+-CIMS (three replicates) instruments to help establish GC retention times.
2.2.3 Other instrumentation
A number of trace gases measured by the PTR-ToF instrument were also measured by other instruments (Table 1), and in Sect. 3.3 we compare these measurements. The OP-FTIR instrument was located on the sampling platform with the optical path spanning the stack and therefore did not have an inlet (Stockwell et al., 2014). The OP-FTIR employed a time resolution of 1.37 s and the PTR-ToF data were interpolated to the OP-FTIR sampling times for the intercomparison.
Glyoxal, methylglyoxal, and HONO were measured with the NOAA Airborne Cavity-Enhanced Spectrometer (ACES) instrument, which uses broadband cavity-enhanced spectroscopy. Wavelength-resolved gas-phase extinction was measured in two spectral regions, one in the UV (361 to 390 nm) and one in the blue (438–468 nm), and then fit using literature cross sections to retrieve the concentrations of NO2, HONO, methylglyoxal, and glyoxal (Min et al., 2016). Data from this instrument were reported at 1 s intervals. The ACES instrument inlet was located on the sampling platform, with an inlet of approximately 1 m length sampling from the center of the stack flow directly above the OP-FTIR optical path.
The I− CIMS chemically ionizes organic and inorganic gases through iodide adduct formation and analyzes the resulting ions with a high-resolution time-of-flight mass spectrometer (Lee et al., 2014). The I− CIMS instrument shared an inlet with the PTR-ToF instrument. Air was subsampled from this inlet and dynamically diluted with UHP N2 to prevent reagent ion depletion. The dilution factor was determined by comparing the CO2 concentration before and after dilution measured by a LI-COR LI-6252 colocated with the I− CIMS. I− CIMS calibration factors were determined by direct calibration for the species discussed here.
2.3 Calibrations and method for estimating calibration factors
The calibration factor (units of ncps∕ppbv) is the normalized counts per second (ncps) per ppbv of the NMOG(s) whose PTR product is that ion. The ncps are derived from the raw ion count rate (counts per second, cps), corrected for the mass-dependent duty cycle of the ToF extraction, and normalized to the detected ion count rate of the primary ion (H3O+ cps × 10−6). We detect 8.5–11.5 × 10⁶ H3O+ ions per second. We detect about 1000 cps∕ppbv of acetone and 650 cps∕ppbv of benzene. We provide the sensitivity here as a raw ion count rate to enable comparison to other PTR-MS instruments, which may have different detected intensity of H3O+. This is about an order of magnitude higher than similar generation commercially available PTR-ToF instruments (Jordan et al., 2009), but an order of magnitude lower than new PTR-ToF instruments that use a different drift tube design (Breitenlechner et al., 2017). Calibration factors in this work were obtained by (1) direct calibration, (2) calculation using kinetic rate constants (Sekimoto et al., 2017), or (3) comparison with OP-FTIR, which will be discussed in Sect. 3.3. Calibration factors for all ion masses are provided in Tables S1 and S10 in the Supplement.
The calibration factors of 37 species were determined experimentally by introducing a known concentration of an NMOG from a standard cylinder, a permeation source (Veres et al., 2010a), a diffusion cell for isocyanic acid and methyl isocyanate (Roberts et al., 2010), or a liquid calibration unit (Ionicon Analytik). The calibration factors of these species have an error of 15 % (details in Table S1).
It is unrealistic to experimentally determine calibration factors for all NMOG species detected in biomass burning. Many compounds are highly reactive and cannot be purchased from a commercial supplier. Several methods to estimate calibration factors have been previously used by PTR-MS operators. For example, both Warneke et al. (2011) and Stockwell et al. (2015) estimated calibration factors for uncalibrated species based on ion mass-to-charge ratio and chemical formula in the latter case.

Figure 1Comparison of measured and calculated calibration factors for several NMOGs. The nine compounds used to determine the calibration proportionality constant are highlighted as red squares. The shaded area shows an uncertainty of +10 %/−50 %. HONO, HCN, and ammonia sensitivities were derived from comparison with FTIR and are included as “measured” sensitivities.
Sekimoto et al. (2017) recently developed an improved method of estimating calibration factors. The instrument calibration factor is linearly proportional to the kinetic capture rate constant of the H3O+ proton transfer reaction, with additional corrections for mass-dependent transmission and NMOG ion fragmentation, both of which can be constrained experimentally. The proportionality is determined by direct calibration of a small subset of NMOGs. For this work, we used a calibration gas standard containing acetonitrile, acetaldehyde, acetone, isoprene, 2-butanone (methyl ethyl ketone, MEK), benzene, toluene, o-xylene, and 1,2,4-trimethylbenzene dynamically diluted to 1–10 ppb. The kinetic capture rate constant can be calculated using the polarizability and permanent dipole moment of the NMOG or alternatively for unidentified ions using the NMOG molecular mass and elemental composition. Figure 1 compares the measured (from this work) and calculated (using the method from Sekimoto et al., 2017) calibration factors for several compounds. Most calculated calibration factors (72 %) fall within +10∕−50 % of the measured sensitivity. The calculated calibration factor provides the upper limit to the sensitivity, and some of the measured calibration factors are lower than predicted. These typically include species with proton affinity close to water (e.g., formaldehyde) and species that fragment to small masses (e.g., ethanol). A detailed discussion of why measured calibration factors can deviate from calculated ones is given in Sekimoto et al. (2017).
If an identified ion mass has only one NMOG contributing, as is the case for 65 % (102) of the ion masses with signal in the fire, we used the calibration factor from direct calibration or the Sekimoto et al. (2017) method. If an identified ion mass has more than one NMOG contributing, we used a weighted average of the calibration factors of all NMOG contributors to this ion mass (Eq. 1). The determination of relative NMOG contributions to the total ion signal of each individual mass was based on GC-PTR-ToF measurements, comparisons to other instruments, time series analysis, and reported values from the literature and will be described in Sect. 3.
The uncertainty for calibration factors for identified NMOGs ranges from 15 to 50 % depending on the calibration method used (Table S1). For ion masses for which we were not able to propose a NMOG, a calibration factor was estimated based on the elemental composition of the ion mass (Sekimoto et al., 2017). The uncertainty for calibration factors for unidentified species is within 10 % higher to 50 % lower.
Ambient humidity can change the measured sensitivity of an NMOG species (Yuan et al., 2016). For species whose calibration factor was measured, a humidity correction factor was also experimentally determined. We currently have no method to predict the humidity dependence of the sensitivity for other species, so for all other species no humidity correction was applied. To minimize the error from this omission, we calibrated compounds that were abundant in emissions and that likely have strong humidity dependence. These include compounds with proton affinities close to water (e.g., HNCO) and compounds whose ionization mechanism includes loss of water (e.g., 1-propanol). Excluding these compounds, the average measured humidity correction factor was less than 15 % for the humidity conditions experienced during FIREX (5–18 g kg−1). Measured sensitivities of different NMOGs both increased and decreased with humidity and an unknown humidity correction will likely only cause a small bias for total NMOG signals. There were no systematic differences in humidity between fires with different fuels.
3.1 Identification of PTR-ToF ion masses
During the Fire Lab experiments we measured 574 ions that were enhanced in emissions from one or more fuel types. Of these, we identified 156 ion masses with a high degree of certainty and for which a calibration factor can be determined. An additional 12 ion masses were identified as fragments of one or more NMOGs whose main product ion was already included in the list of 156 ions. Finally, four ions were identified as being a common product of a large number of structurally dissimilar NMOGs. These 172 ions, their identification, and support for that identification are listed in the Supplement. The Supplement provides detailed information on the isomer contributions to each mass (Table S1), sensitivities and calibration uncertainty (Tables S1 and S10), literature references (Table S6 in the Supplement), GC measurements (Table S7 in the Supplement), and observations from time series correlations (Table S9 in the Supplement). The Supplement additionally includes quantitative information on OH rate constants (Table S5 in the Supplement), instrument intercomparisons (Table S8 in the Supplement), and NO+-CIMS ion mass identifications (Table S4 in the Supplement). These 172 masses represent about 95 % of the total signal (ncps) from m∕z 12–217 Th measured by PTR-ToF. Below, we describe the methods used to ascribe NMOG identifications to PTR-ToF ion masses.
3.1.1 Literature survey
Identifications of many NMOGs emitted from biomass burning have been previously reported using GC, PTR-MS, and optical methods. We compiled a list of observed NMOGs and identifications to use as a starting point. The papers we referenced included Karl et al. (2007), Warneke et al. (2011), Brilli et al. (2014), Stockwell et al. (2015), Müller et al. (2016), and Bruns et al. (2017), which focus on PTR-MS measurements, and Gilman et al. (2015) and Hatch et al. (2015, 2017), which focus on GC measurements. Gilman et al. (2015) used 1-D-GC and focused on the most volatile species, and Hatch et al. (2015, 2017) used 2-D-GC and included many additional less volatile species. NMOG emission factors of identified compounds and the estimated mass of unidentified species have been reviewed by fire and/or ecosystem type globally (e.g., Akagi et al., 2011; Yokelson et al., 2013), but significant recent measurements have not yet been included in the online updates: e.g., Hatch et al. (2017). Finally, for some compounds, we referenced studies of the pyrolysis products of lignin, cellulose, and hemicellulose, which used GC-MS, X-ray spectroscopy, FTIR, theoretical calculations, and other analytical methods to identify major products and common reaction pathways (Patwardhan et al., 2009; Lu et al., 2011; Zhang et al., 2012; Heigenmoser et al., 2013; Collard and Blin, 2014; Liu et al., 2017a).
We assessed each identification as strongly or weakly supported. Strong identifications include those reported by many separate studies, NMOGs identified using GC methods (especially 2-D-GC-ToF-MS), and those supported by evidence from pyrolysis or other literature. Weak identifications include those with disagreement between different studies, tentative identifications based on only mass-to-charge ratio or elemental formula, and identifications that are inconsistent with reported formula or that are chemically implausible (e.g., highly strained structure). Identifications from the literature and citations are listed in Table S6. Overall we found literature evidence for 68 % of our ion identifications. Our interpretation differs from previously published PTR-MS interpretations for 34 ion masses as noted in Table S6. Forty-eight ion masses have not been previously reported in PTR-MS measurements of biomass burning.
The compounds with new and revised identifications were compared to review values of emission factors in Akagi et al. (2011) and Yokelson et al. (2013). A limited number of species from PTR are included in these reviews, largely because of uncertainty in identification. PTR species that have been detected but not included in review tables of EF include many more highly functionalized and larger molecules, and most of our updated identifications are these species. Yokelson et al. (2013) do include a number species from PTR (ion trap) that were not identified, and the identities of many of these have now been determined in this work.
Compounds that are included in review tables and for which we have updated the assignment are mostly unsaturated hydrocarbons and heteroatom-containing species, for which the identifications have been updated to include other contributing VOCs. For such species whose EF was determined solely from PTR, the actual emission factor should be lower than the reported value.

Figure 2(a) GC-PTR-ToF chromatograph of emissions from a Douglas fir fire. (b) Several chromatographic peaks containing m∕z 68.050 C4H5NH+ detected during the highlighted elution period in (a). The inset pie chart shows the relative contributions of the isomers to the total signal of C4H5NH+. (c) GC-NO+-C chromatographic trace of m∕z 67.042 C4H5N+ from the same Douglas fir fire. Only pyrrole is observed.
3.1.2 GC-PTR-ToF measurement
Gas chromatographic separation before measurement with PTR-MS is a powerful tool that has been widely used in many environments (Warneke et al., 2003; Karl et al., 2007; Warneke et al., 2011; Yuan et al., 2014). The combination of measured chromatographic retention time and product ions with GC-PTR-ToF, GC-NO+-CIMS, and GC-EI-MS allows for the unambiguous identification of the various isomers contributing to the PTR-ToF signal of many ions. Some additional ion masses had a high signal in the direct measurement of fire emissions, but did not appear in any chromatographs. This also provides insight into the NMOG chemical structure, as certain functional groups, like acids, cannot travel through the GC system. An example of GC-PTR-ToF measurement is shown in Fig. 2. Panel (a) in this figure shows the dense chromatographic elution of hundreds of peaks over the 800 s elution period. These chromatographic peaks are detected on several hundred PTR ions. Panel (b) shows the measured intensity of m∕z 68.050 C4H5NH+ during a 280 s segment of the elution, which includes product ions from pyrrole and several butene nitriles. These isomers cannot be distinguished by online PTR-ToF, and each contributes a different amount to the total signal of m∕z 68.050 C4H5NH+. Panel (c) shows the same 280 s retention time period from a sample taken immediately after the one shown in Panel (b), but measured with NO+-CIMS. These isomers can be identified by comparing GC-PTR-ToF and GC-NO+-CIMS chromatography, as NO+ reacts with pyrrole but not nitriles. The GC retention time, when it is known for a particular compound, provides additional support for the identification.
The relative intensities of the eluted peaks were used to quantify the relative contribution of each NMOG to each ion mass. The size of a chromatographic peak is determined not only by the mixing ratio of that NMOG in ambient air and the mass spectrometer response, but also by the trapping and elution efficiencies of the GC pre-separation unit. As isomers have the same molecular weight and elemental composition, their volatilities and trapping efficiencies are generally similar. For example, pyrrole and 3-butene nitrile have similar vapor pressures of 1.1 and 2.5 kPA at 25 ∘C compared to ethane (4000 kPA) and 1,4-diethylbenzene (0.13 kPA), which are the most and least volatile species measured by the GC, respectively (values from CRC Handbook, 97th ed.). Here we assumed that all compounds that create the same PTR ion mass have similar GC trapping efficiencies. This assumption is supported by GC-PTR-ToF measurements of C4 alkenes, C5 alkenes, C8 aromatics, and C9 aromatics in the 56-component NMOG GC calibration standard. These isomer groups have equal concentrations in the calibration gas and their resulting GC-PTR-ToF chromatographic peaks had similar areas.
The same GC methods were used to identify some signals from the NO+-CIMS. Observed and identified NO+-CIMS ion masses are included in Table S4. Hundreds of carbon-containing ion masses are also present in a typical NO+-CIMS mass spectrum. Using GC-NO+-CIMS, we identified the NMOG contributors to an average (across all fires measured with NO+-CIMS) of 32 % of the total signal of these ions. More identifications could likely be made by analysis with other techniques (intercomparisons, time series correlations, literature review, etc.) but were not attempted here. The NO+-CIMS ion mass identifications are included here as a reference for future work, but are not discussed further.
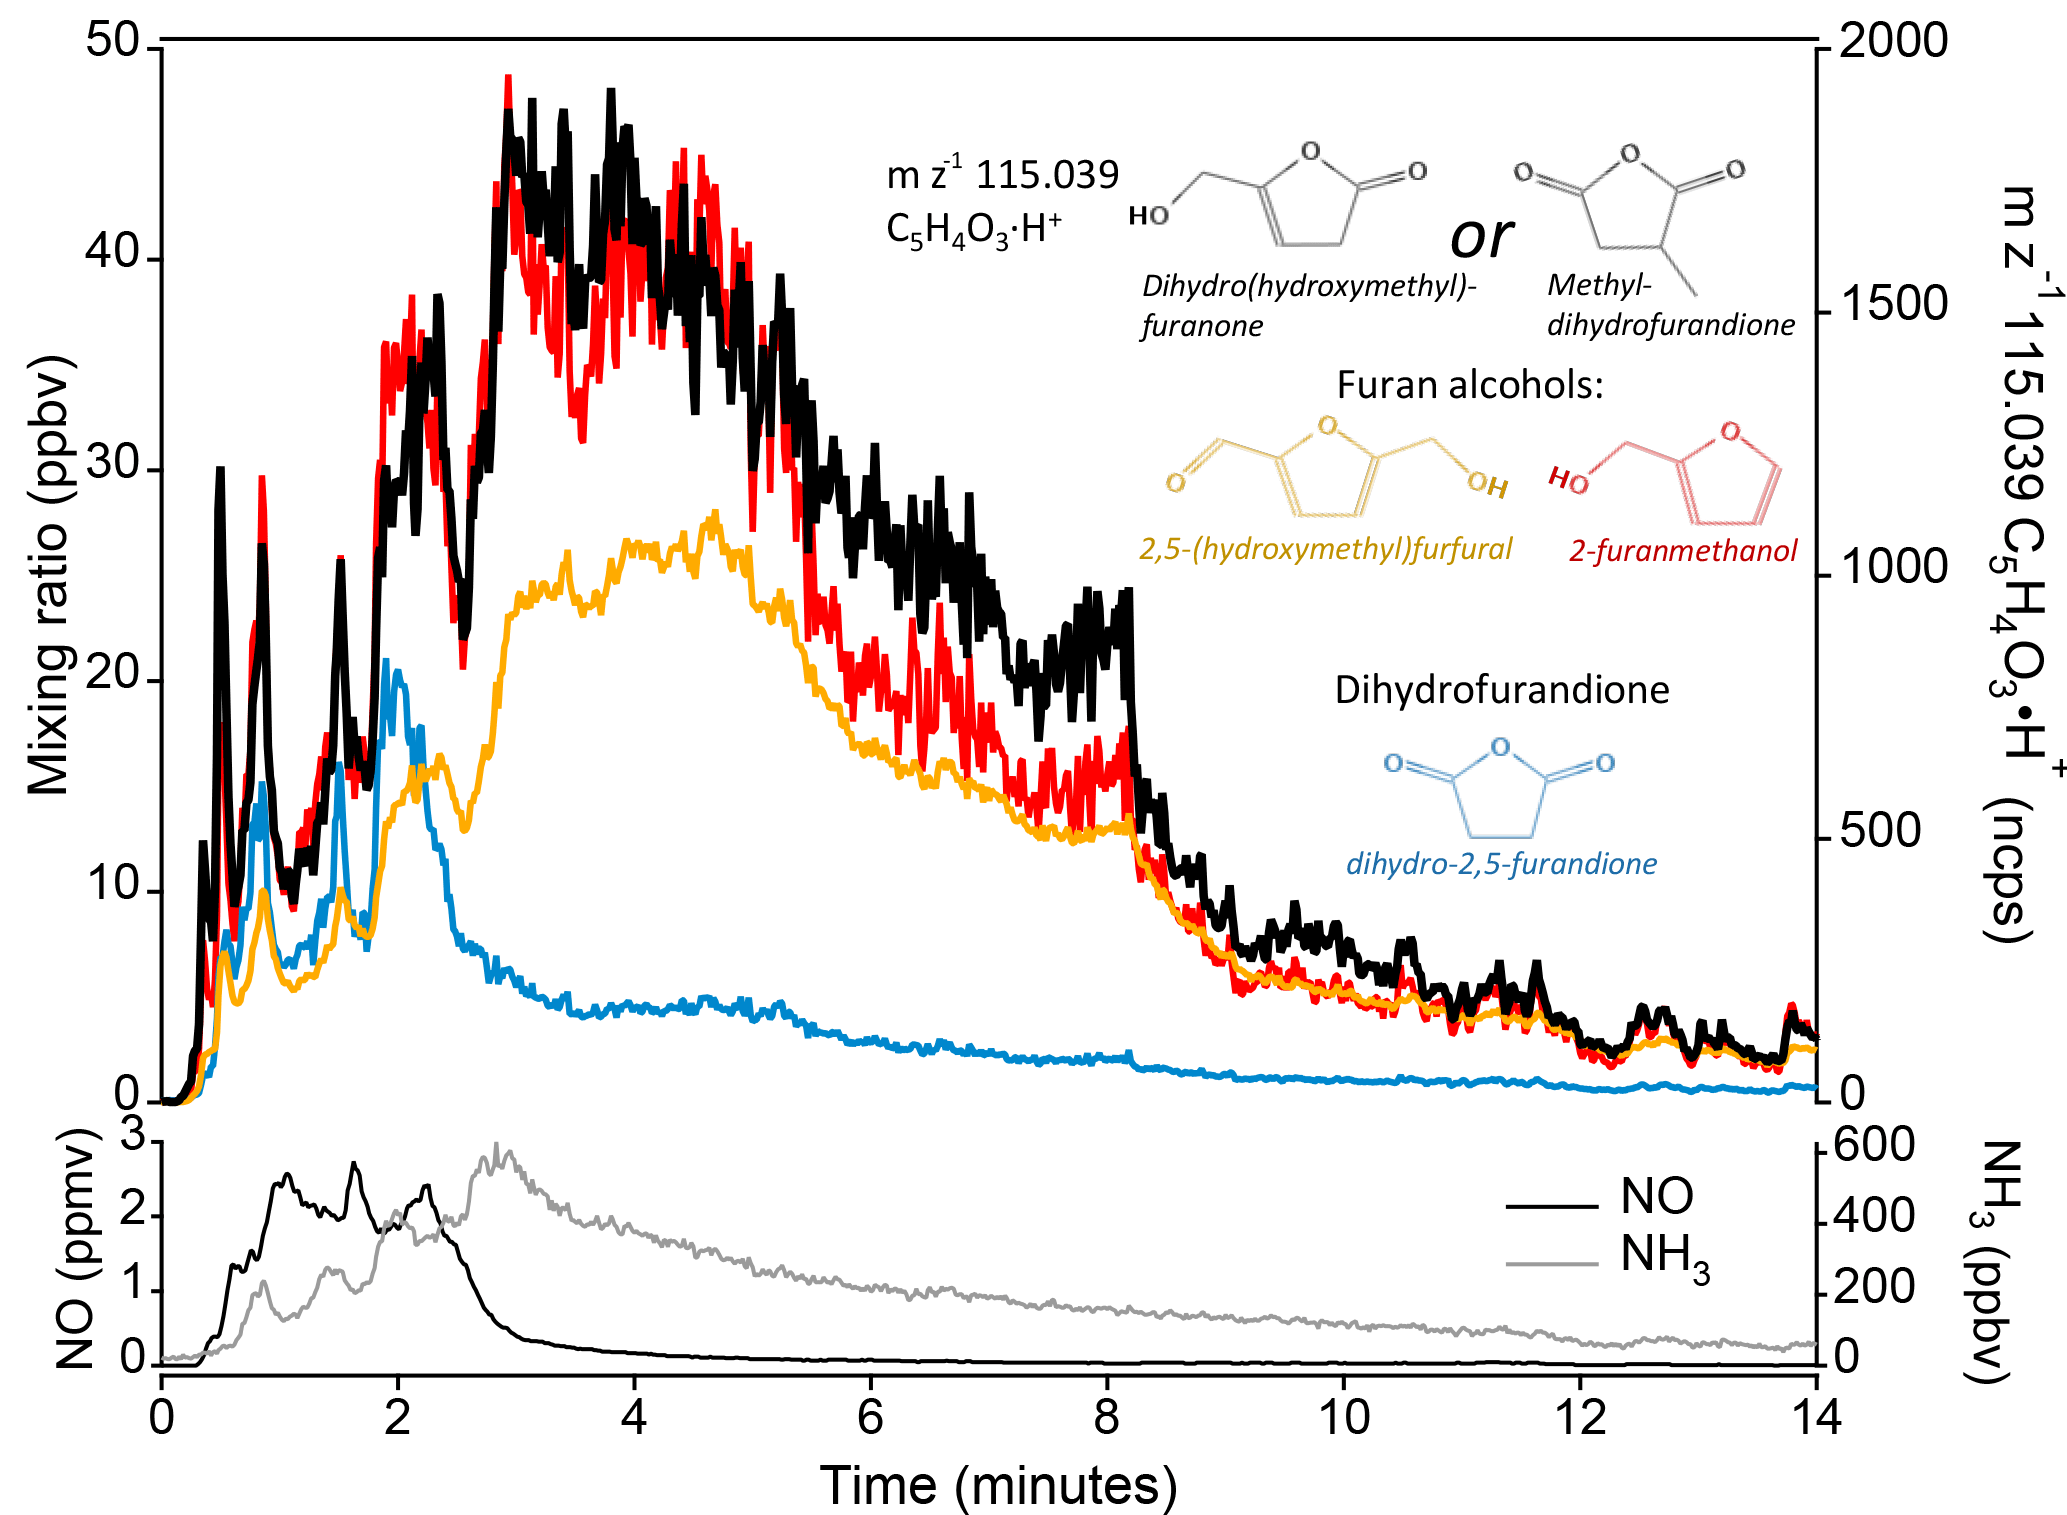
Figure 3At m∕z 115.039 C5H4O3H+ there are several possible candidates with chemical structures similar to species known to be produced by biomass burning. Candidates include furan alcohols and methyldihydrofuran. The time series trace of m∕z 115.039 during a ponderosa pine fire (Fire 2) is shown in black and compared to the time series of two furan alcohols: 2,5-(hydroxymethyl)furfural (yellow) and 2-furanmethanol (red); and to dihydro-2,5-furandione (blue). The identities of the furan alcohols and dihydro-2,5-furandione were confirmed through other methods. The superior correlation with furan alcohols is evidence that m∕z 115.039 is more likely a furan alcohol than a dione (see text). NO and NH3 are shown as a reference for higher- and lower-temperature fire processes, respectively. NO described by Stockwell et al., 2017. NH3 from PTR-ToF.
3.1.3 Time series correlation
Some species measured by the PTR-ToF instrument have several possible isomers, have not been previously reported in the literature, and are not transmittable through the GC. The identifications of these compounds are less certain. For these, we selected several reasonable isomeric structures based on the types of compounds typically seen in biomass burning emissions: substituted furans and aromatics, nitriles, pyridines, terpenes, and carbonyls. Then, we compared the temporal profile of these ion signals during several fires to compounds with more certain identification. Compounds with similar structure and functionality likely have similar behavior. Dissimilar compounds can also sometimes have similar temporal profiles (Yokelson et al., 1996), but it is still likely that time series correlation points to the correct assignment or a species with similar chemical functionality as the true assignment.
An example of how time series correlation is used to identify a species is shown in Fig. 3; m∕z 115.039 Th C5H4O3H+ is the unidentified species, for which there is no strong literature or GC evidence. This formula has several plausible isomers, including furan alcohols (e.g., dihydro(hydroxymethyl)furanone) and methyl-dihydrofurandione. Several other furan alcohols have been unambiguously identified, including 2-furanmethanol (from GC-PTR-ToF) and 2,5-(hydroxymethyl)furfural (reported in the pyrolysis literature; Lu et al., 2011). Dihydrofurandione has also been identified (limited isomeric possibilities). Comparing the time series of these species during a stack experiment fire shows that m∕z 115.039 C5H4O3H+ correlates better with furan alcohols than with dihydrofurandione. Thus m∕z 115.039 is more likely to be a furan alcohol. Based on structural similarity and reported pyrolysis pathways that frequently produce 2,5-substituted furans (Collard and Blin, 2014), dihydro-5-(hydroxymethyl)-2[3H]-furanone is a likely compound.
3.2 NMOG ion speciation for different fuel types and fire conditions
The contribution of isomers to any particular PTR ion exact mass was consistent among the four fuels (Douglas fir, Engelmann spruce duff, subalpine fir, and sage) sampled with GC-PTR-ToF (Table S7). Comparing all GC-PTR-ToF samples, the isomeric speciation on a particular exact mass typically varied by only 11 % (the SD of the contribution of each isomer to total signal on that mass) and therefore the same study-average NMOG contributions to each ion exact mass were used for all fuel types, regardless of whether or not supporting GC information was available. This is similar to the variation in isomer speciation reported by Hatch et al. (2015; 5 % on average), who investigated six diverse fuel types. Compounds that had larger variability between GC-PTR-ToF samples (and between fuel types) include m∕z 67.054 C5H6H+ (cyclopentadiene), which has substantial and variable interference from an isoprene fragment, and m∕z 153.127 C10H16OH+, which consists mainly of camphor in sagebrush fires and of other oxygenated monoterpenes in fires of other fuels. Additionally, in burns of Ceanothus, which was not sampled with GC-PTR-ToF, m∕z 133.065 C9H8OH+ was enhanced, did not correlate as well with benzofuran (m∕z 119.049 C8H6OH+), and may include a contribution from another isomer such as cinnamaldehyde.
The instantaneous speciation of isomers may also change over the course of a fire, especially as the fire shifts between various higher- and lower-temperature chemical processes. We used time series correlation to identify several masses that may have variable NMOG contributors. This analysis was done on Fire 2, which burned representative ponderosa pine forest-type fuels. This fire was selected because ponderosa pine was the most comprehensively measured fuel type during the FIREX 2016 experiment, this particular fire had distinctly different NMOG speciation at the beginning (higher temperature) and end (lower temperature) of the fire, and reagent ion depletion did not affect the results.
We identified three ions with a high signal whose NMOG contributors may be substantially different between high- and low-temperature processes in a fire: m∕z 109.065 C7H8OH+, which likely includes more 2-methylphenol from high-temperature processes and more anisole from lower-temperature processes, m∕z 112.039 C5H5NO2H+, which likely includes a greater contribution from methyl maleimide in high-temperature processes and more dihydroxy pyridine from low-temperature processes, and m∕z 123.080 C8H10OH+, which likely includes more C2 phenols from high-temperature processes and more methylanisole from low-temperature processes (similar to m∕z 109). Time series comparisons are shown in Fig. S2 in the Supplement.
These three pairs of identifications in Fig. S2 and their relative contributions to total ion signal are not well constrained. An additional instrument technique, such as a fast GC capable of separating substituted furans and aromatics or a better understanding of I− CIMS chemical specificity and more accurate calibration on both instruments, would be helpful. To convert the instrument signal (ncps) of these ions to mixing ratio, we applied the average calibration factor of the two isomers.
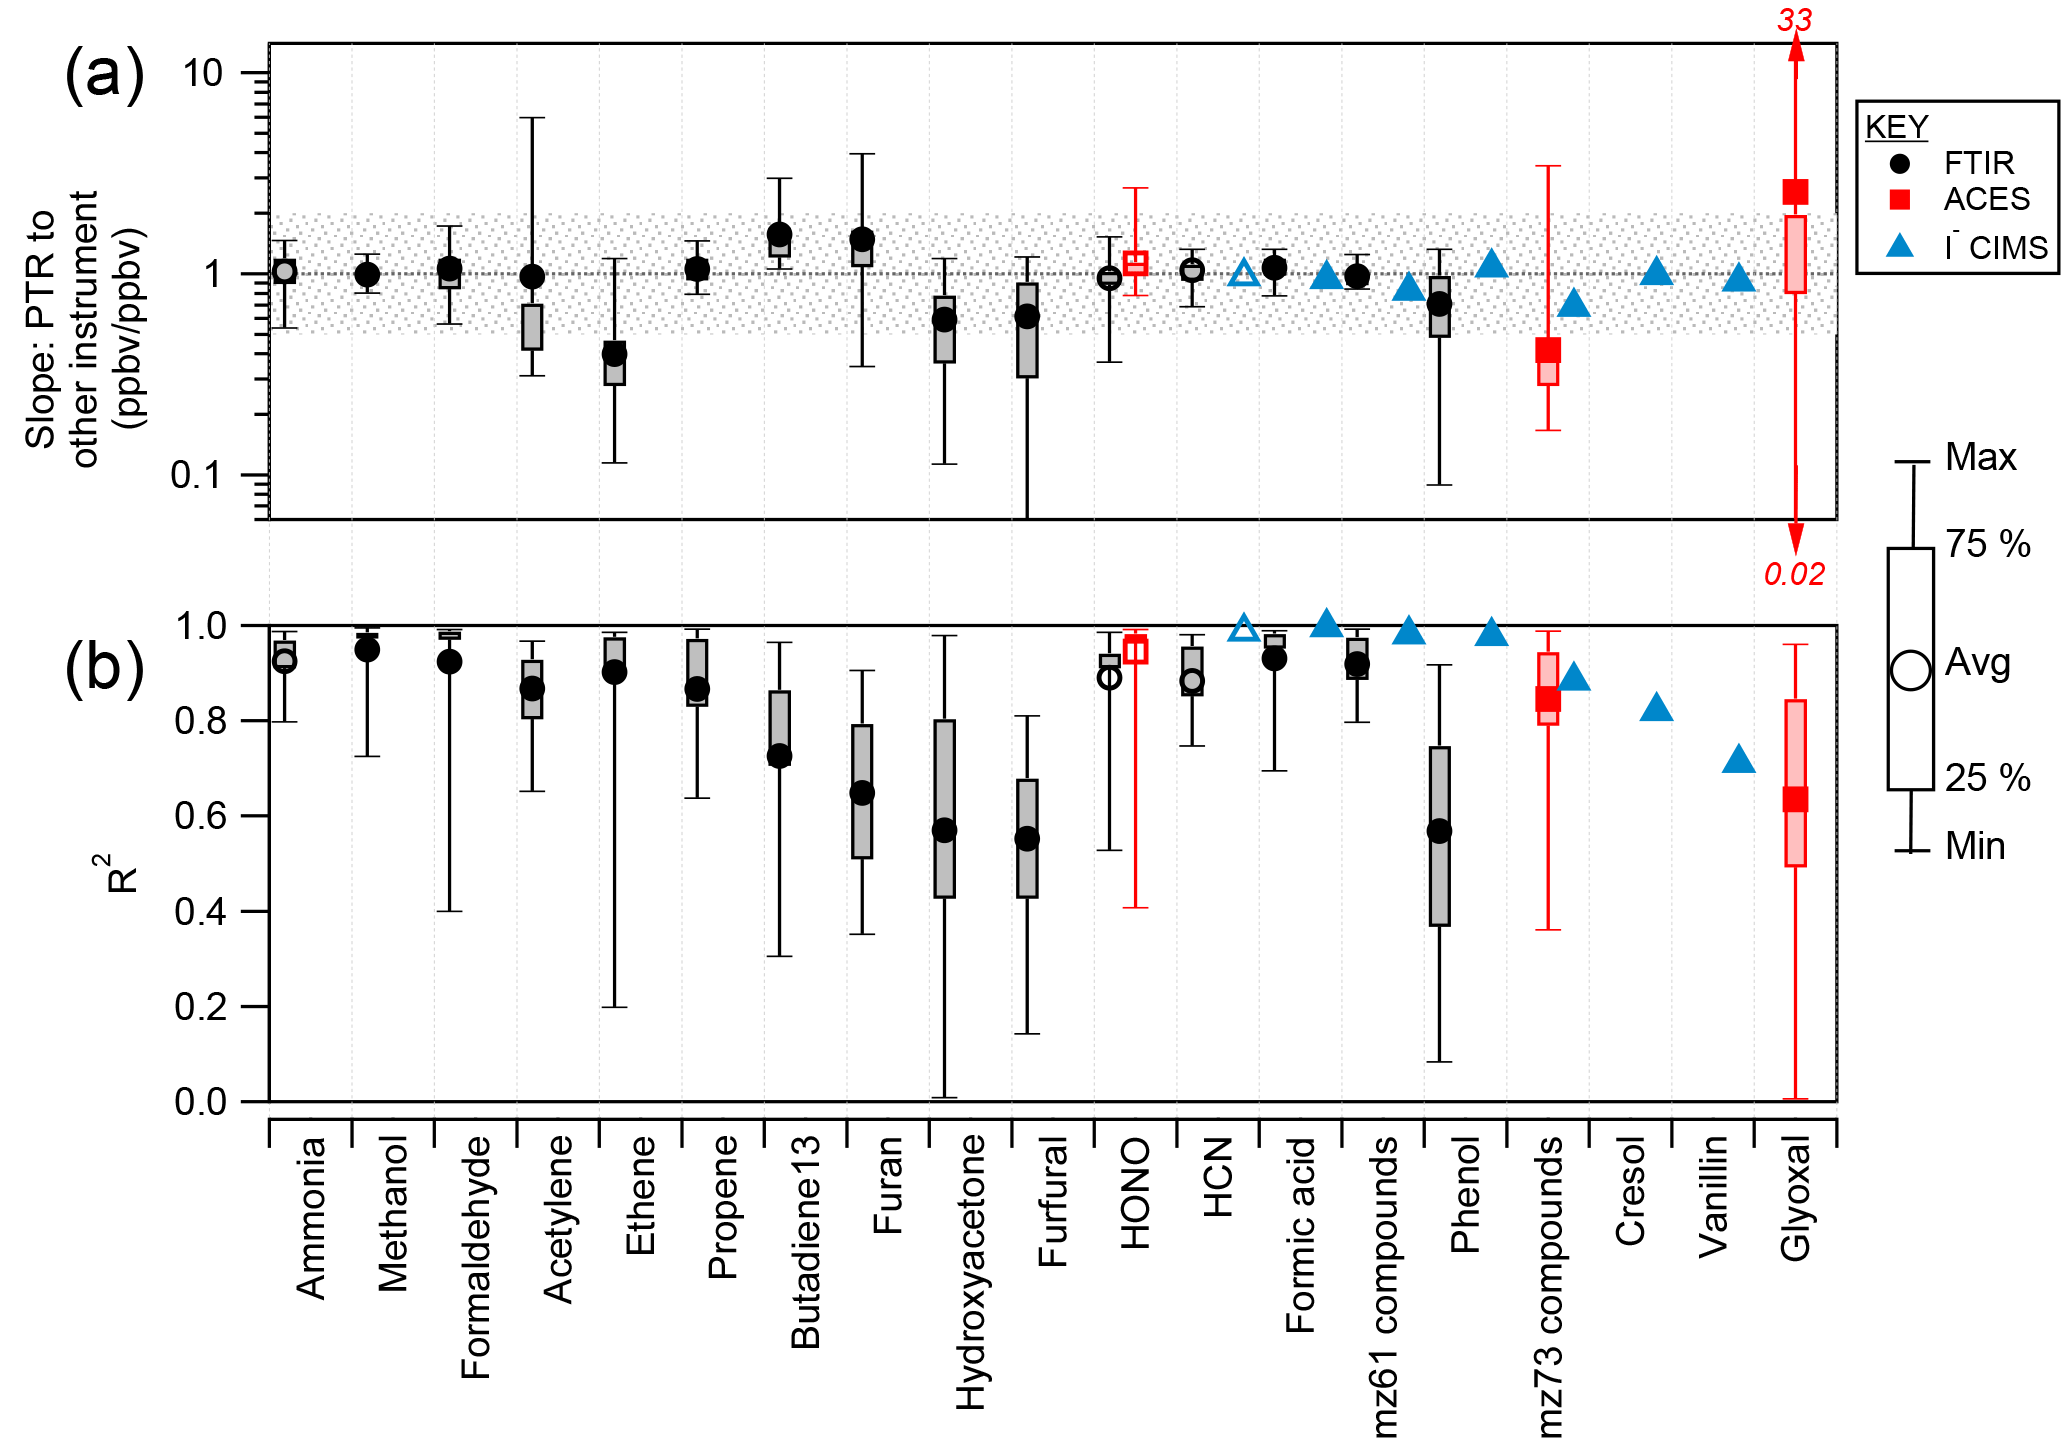
Figure 4(a) Slope of PTR-ToF measurement compared to other instruments for all stack burns (18 fuels). The open symbols indicate that PTR-ToF calibration factors for ammonia, HCN, and HONO were determined from the comparison with FTIR during Fire 72 (ponderosa pine). The shaded area shows a factor of 2. (b) R2 between the PTR-ToF instrument and other instruments. For “hydroxyacetone”, the PTR-ToF total mass 75.044 C3H6O2H+ (sum of methylacetate, ethylformate, hydroxyacetone) is compared to FTIR hydroxyacetone. For “mz 61 compounds”, the PTR-ToF total mass 61.028 C2H4O2H+ (sum of acetic acid and glycolaldehyde) is compared to the FTIR sum of glycolaldehyde and acetic acid and I− CIMS acetic acid. For “m∕z 73 compounds”, the PTR-ToF total mass 73.028 C3H4O2H+ (sum of methylglyoxal and acrylic acid) is compared to I− CIMS acrylic acid and ACES methyl glyoxal. For “cresol”, the PTR-ToF total mass 109.065 C7H8OH+ (sum of anisole and cresol) is compared to I− CIMS cresol. Methanol, formaldehyde, propene, furan, furfural, formic acid, acetic acid, phenol, anisole, and cresol were calibrated directly on the PTR-ToF instrument and have an uncertainty of 15 %. Ethene and acetylene were also directly calibrated, but are less certain due to variability in . 1,3-butadiene, methylacetate, ethylformate, hydroxyacetone, glycolaldehyde, methylglyoxal, acrylic acid, and glyoxal were calibrated using calculation, have an uncertainty of 50 %, and represent the lower bound of concentration.
3.3 Intercomparison with other instruments
Several species detected by the PTR-ToF instrument were also measured by other instruments. The intercomparison is summarized in Fig. 4. All slopes shown in the figure and discussed in the text are the orthogonal distance regression (ODR) slope of H3O+-CIMS to the other instrument; R2 values are from vertical distance regression of PTR-ToF against the other instrument. The scatter plots are shown in Figs. S3–S5 in the Supplement.
3.3.1 Comparison with OP-FTIR
Fifteen species were compared between the PTR-ToF and FTIR instruments (Fig. S4). Methanol, formaldehyde, formic acid, propene, acetic acid, ethene, acetylene, furan, phenol, and furfural were calibrated directly on the PTR-ToF instrument and have an uncertainty of 15 %. For HONO, HCN, and ammonia, we were not able to determine a calibration factor directly and so we set the calibration factors equal to the slope of the comparison between the FTIR and PTR-ToF instruments during Fire 72 (ponderosa pine with realistic fuel mixture, selected for early data availability, long burning time of 30 min, and mix of flaming and smoldering conditions). Sensitivity to HCN has strong humidity dependence (Knighton et al., 2009; Moussa et al., 2016), and this was experimentally determined and corrected. Glycolaldehyde was calibrated using the method from Sekimoto et al. (2017) with an uncertainty of 50 %; the PTR-ToF measurement of m∕z 61.028 C2H4O2H+ (sum of glycolaldehyde and acetic acid) has an uncertainty of 27 %. FTIR hydroxyacetone was compared to PTR-ToF m∕z 75.044 C3H6O2H+, which was calibrated using the Sekimoto et al. (2017) method and is the sum of methyl acetate (estimated 37 % of mixing ratio), ethyl formate (14 %), and hydroxyacetone (48 %), with an uncertainty 50 %. 1,3-Butadiene was calibrated with the Sekimoto et al. (2017) method and has an uncertainty of 50 %. The method from Sekimoto et al. (2017) provides the lower bound of concentration.
Methanol has agreed within stated uncertainties between PTR-MS and FTIR in several previous studies (Christian, 2004; Karl et al., 2007; Warneke et al., 2011; Stockwell et al., 2015), and this work shows an average slope of 0.99 and R2 of 0.95. The comparison of formaldehyde between PTR-ToF and FTIR has an average slope = 1.1 and average R2 = 0.94, which is consistent with the comparison shown in Warneke et al. (2011). Other compounds that compare within the stated uncertainty in slope and have correlation coefficient > 0.8 are ammonia, the sum of acetic acid and glycolaldehyde (compared to PTR-ToF m∕z 61.028 C2H4O2H+), formic acid, HONO, acetylene, propene, and HCN. HONO was sufficiently concentrated (900 ppbv max) in the fire, and the precision and accuracy of the FTIR HONO measurement were adequate to estimate a PTR-ToF 3σ LoD for HONO of about 9.5 ppbv. This is likely not sufficient to measure HONO in ambient air except in the most highly concentrated fresh biomass burning plumes.
The high degree of correlation between PTR-ToF and FTIR for acetylene and ethene is notable because these two compounds cannot be ionized by proton transfer from H3O+ as their proton affinities are too low. The detected NMOG product ions (acetylene, at m∕z 26.015 ) and ethene (m∕z 28.031 ) are most likely the product of charge transfer from contaminant from the ion source, which was high at 12 % of H3O+ during this experiment. The acetylene comparison has a higher degree of scatter (R2 = 0.83), which is likely an effect of interferences from fragments of other species as identified by GC-PTR-ToF. Ethene has a better correlation (R2 = 0.94); from the GC-PTR-ToF we observed that m∕z 28.031 is specific for ethene. The disagreement in slope may be due to variability in .
Other compounds, including 1,3-butadiene, furan, hydroxyacetone, phenol, and furfural, agreed within a factor of 2 (slopes of 1.6, 1.5, 0.6, 0.7, and 0.6, respectively) and average R2 values < 0.8. These species were often near the 0.73 Hz detection limit of the OP-FTIR instrument and the discrepancy in slopes and low correlation coefficients are sometimes an effect of including these data in the intercomparison. Another reason for the disagreement may be that these species have either more interference or weaker spectral features than other compounds reported from FTIR. Furan may have an interference in PTR-ToF measurements of some fuels (Table S7). Emission ratios and emission factors (EFs) are based on fire-integrated excess values that benefit from significant signal averaging. Many of the above species have EFs that agree between PTR-ToF and FTIR within 10 % (Selimovic et al., 2017; Table S8). Additionally, it has been shown that the FTIR fire-integrated emission factors derived for hydroxyacetone are in excellent agreement with that reported for real wildfires by Liu et al. (2017b; Selimovic et al., 2017).
3.3.2 Comparison with ACES
Three species were compared between the PTR-ToF and ACES instruments: HONO, glyoxal, and methylglyoxal (Fig. S3). HONO agrees with an average slope of 1.13 and R2 = 0.95. Since the PTR-ToF sensitivity factor for HONO was determined by comparison to FTIR, this slope indicates the agreement between FTIR and ACES. Methylglyoxal has a slope of 0.42 and R2 = 0.85. The poorer agreement for methylglyoxal is probably due to interferences on both instruments. The PTR-ToF instrument measures both methylglyoxal and acrylic acid at m∕z 73.028 C3H4O2H+; both were calibrated using the Sekimoto et al. (2017) method. The calculation has an uncertainty of 50 % and gives the lower bound of concentration. The ACES instrument measures a series of substituted α-dicarbonyls, including 2,3-butadione, from a relatively diffuse absorption band that is common to these species. The development of a specific measurement for methyl glyoxal is a target of future research because this compound is an important SOA precursor whose emission from biomass burning has not been well constrained (Hays et al., 2002; Fu et al., 2008). The methylglyoxal measurement may be improved with changes to the ACES resolution and spectral correction routines.
The comparison of glyoxal is similarly poor (slope = 2.56 and R2 = 0.64). This is probably because of the incomplete resolution of m∕z 59.013 C2H2O2H+ from m∕z 59.049 C3H6OH+ (acetone), which is a very large neighboring peak in the PTR-ToF mass spectrum. Poorly resolved peaks such as glyoxal are normally not reported (Sect. 2.2.1). PTR-MS has been shown to have low sensitivity to glyoxal (LoD = 250–700 pptv), with strong humidity dependence, and can be easily lost on inlet surfaces (Stönner et al., 2017). Additionally, the PTR-ToF glyoxal sensitivity was calculated and has an uncertainty of 50 %. The glyoxal measurement may be significantly improved with better PTR-ToF sensitivity and mass resolution.
3.3.3 Comparison with I− CIMS
Some data were compared to I− CIMS for one fire (Fire 72, ponderosa pine with realistic blend of fuel); a more detailed comparison will require significant additional analysis of the I− CIMS data set. Although many ion masses overlap between the PTR-ToF and I− CIMS instruments, we selected seven that have straightforward interpretation on both instruments: HCN, formic acid, phenol, vanillin, acetic acid and glycolaldehyde, acrylic acid and methylglyoxal, and cresol and anisole (Fig. S5). These compounds were all directly calibrated on the I- CIMS, with an uncertainty of ± 15 %. Formic acid, phenol, vanillin, acetic acid, cresol, and anisole were calibrated directly on the PTR-ToF instrument, and the HCN sensitivity was taken from the comparison to FTIR. Glycolaldehyde, acrylic acid, and methylglyoxal were calibrated using the Sekimoto et al. (2017) method with an uncertainty of 50 %. The comparison for HCN, formic acid, and phenol is excellent (slopes = 0.97, 0.94, and 1.08; R2 = 0.99, 0.99, 0.98, respectively). The vanillin measurements also agree quantitatively (slope = 0.92), but the I− CIMS measurement is noisier (R2 = 0.71). For the other three species, the I− CIMS measures only one isomer, while PTR-ToF measures a sum of several isomers. For all three, the comparison is within the stated uncertainties of both instruments, but the PTR-ToF measurement is lower than the I− CIMS measurement. The PTR-ToF measurement of acrylic acid plus methylglyoxal is 31 % lower than the I− CIMS measurement of acrylic acid, the PTR-ToF measurement of acetic acid plus glycolaldehyde is 17 % lower than the I− CIMS measurement of acetic acid, and the PTR-ToF measurement of cresol plus anisole is 1 % lower than the I− CIMS measurement of cresol. The low PTR-ToF measurement for the acrylic acid and cresol comparison is possibly due to uncertainty in the calculated calibration factors, which give the upper limit to sensitivity (and the lower limit to derived concentration). The acetic acid comparison is within the stated uncertainty (27 % for PTR-ToF m∕z 61.028 C2H4O2H+ and 15 % for I− CIMS acetic acid).
3.4 Emission factors, emission ratios, and emission chemistry
We quantified the emission ratios relative to CO and the emission factors in g kg−1 of fuel burned of both the identified and unidentified species. The emission ratio (ER) is calculated by using Eq. (2):
where the excess mixing ratios (ppbv above pre-fire chamber background) of the NMOG and of CO are integrated over the fire from time t=0 to t = end. The emission factors (EFs) are in units of gram NMOG emitted per kg of dry fuel burned and are derived from the emission ratios using the carbon mass balance (Akagi et al., 2011; Selimovic et al., 2017):
where EFNMOG is the emission factor of the NMOG, Fc is the carbon fraction of the fuel in g kg−1, MNMOG is the molecular mass of the NMOG, MC is the molecular mass of carbon, (ΔNMOG∕ΔCO) is the emission ratio of the NMOG relative to CO, NCx is the number of carbon in carbon-containing species x, and (ΔCx∕ΔCO) is the emission ratio of species x to CO; Δ indicates the excess mixing ratio above background, as is explicitly written in Eq. (2). This method assumes that all of the carbon lost from the fuel as it burns is emitted and measured, which is a reasonable approximation as CO, CO2, and CH4 account for most of the emitted carbon (Akagi et al., 2011). The denominator of the last term estimates total carbon relative to CO. Species Cx includes all species measured by PTR-ToF (excluding overlapped species with FTIR), all species measured by FTIR (including CO, CO2, and CH4), and black carbon as described by Selimovic et al. (2017). Emission ratios and factors were determined on a fire-by-fire basis, then averaged over all fires (Table 2) or all fires of a particular fuel type (Tables S2 and S3 in the Supplement).
Table 2Ion exact masses, formulas, and NMOG contributor(s); the emission ratios and emission factors of those contributors.
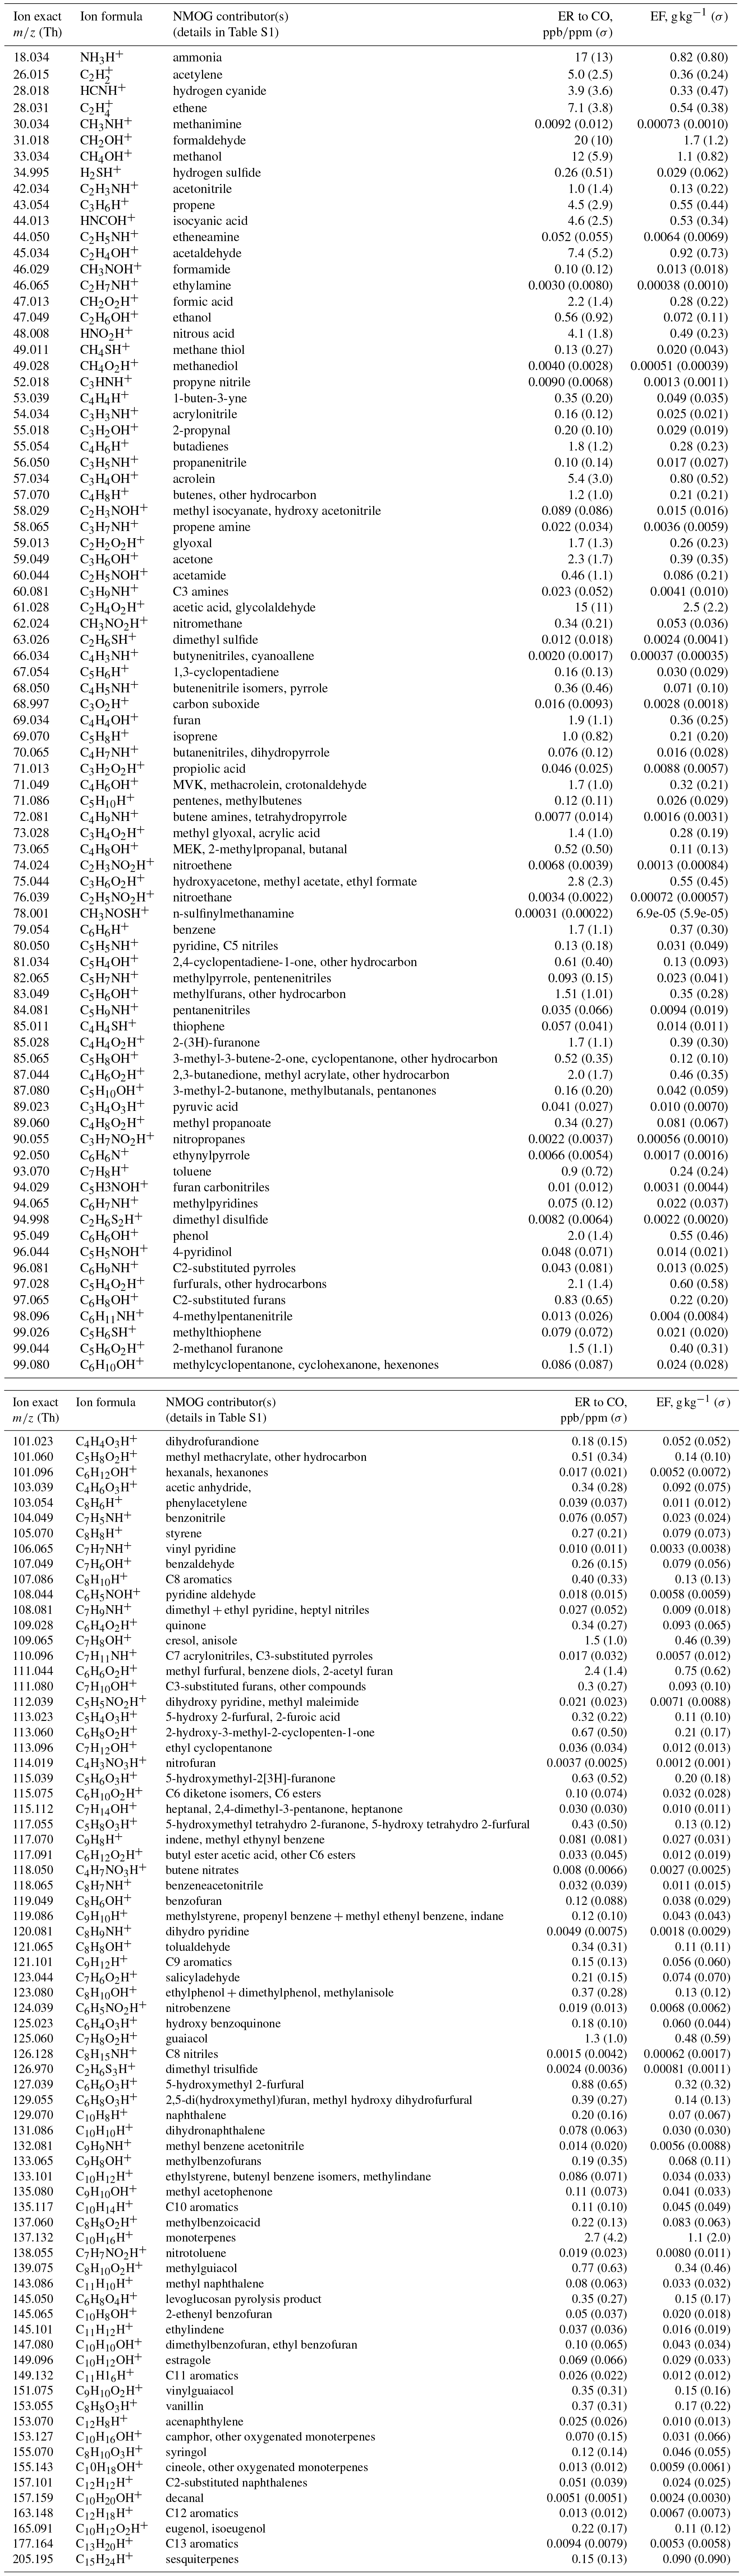
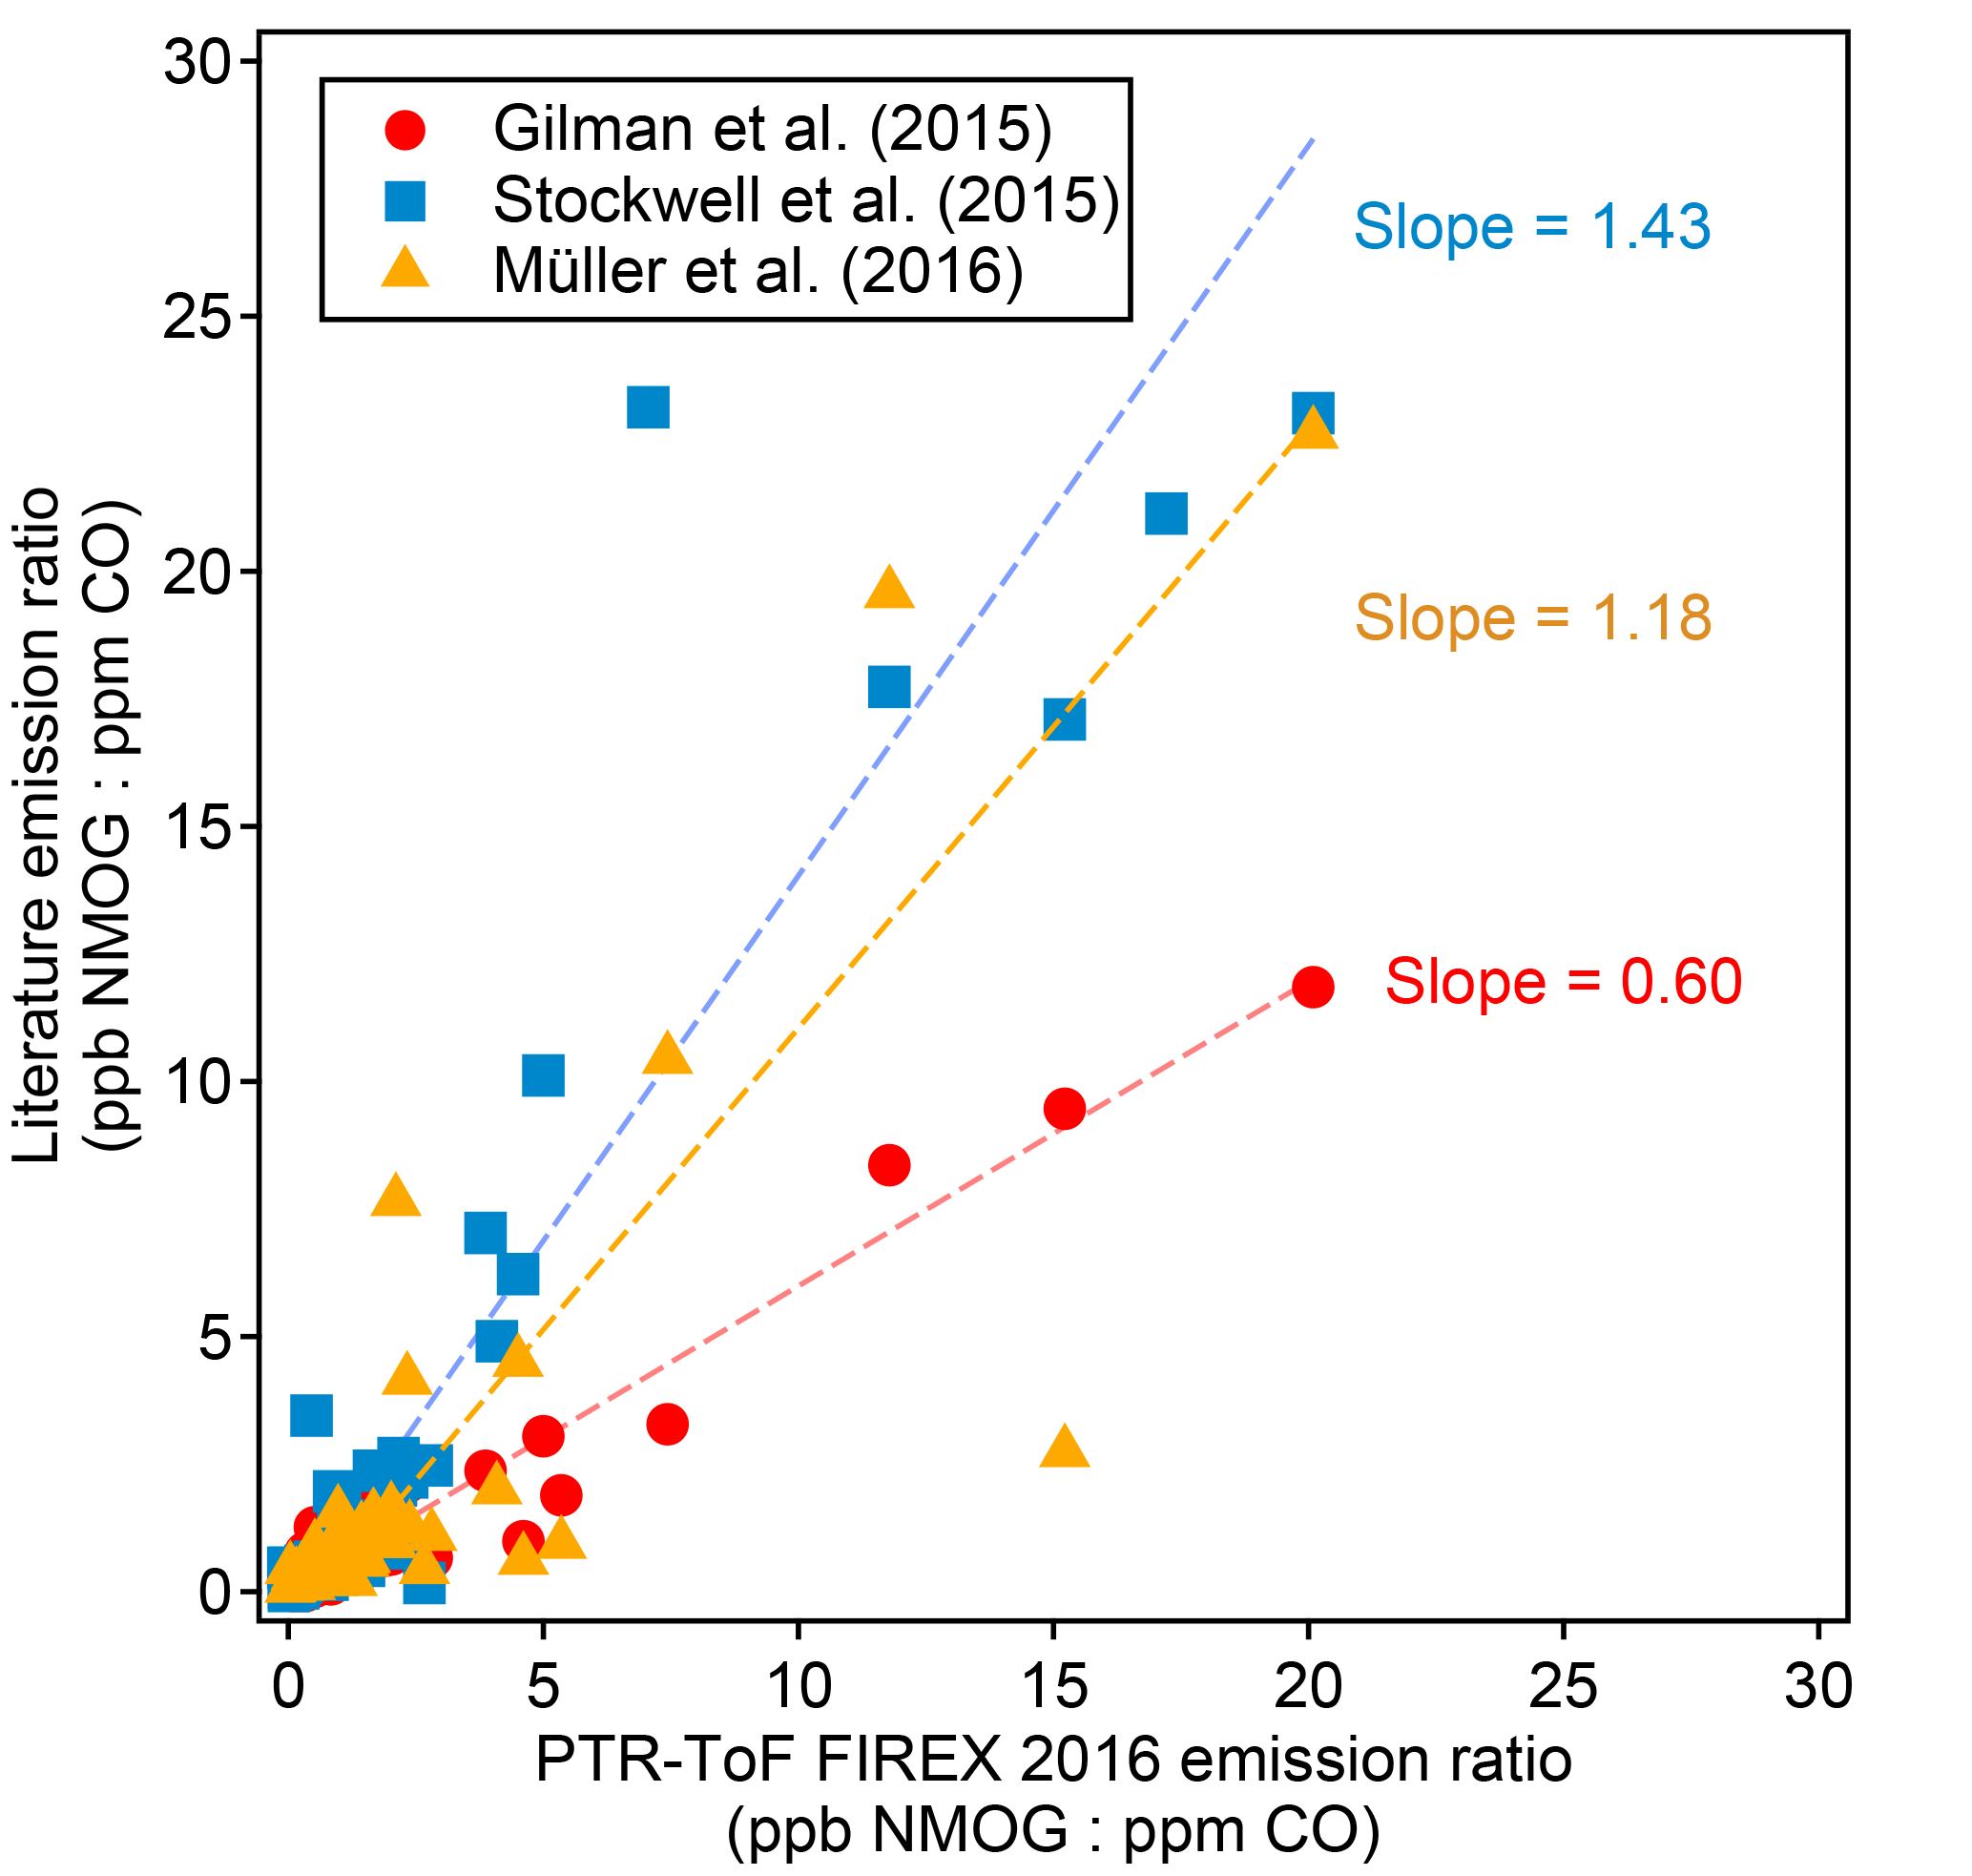
Figure 5Comparison of emission ratios (ppb NMOG : ppm CO, fire-integrated) between this work and several previously published studies. The emission ratios shown are various NMOGs averaged over all the fires and fuel types reported in each study.
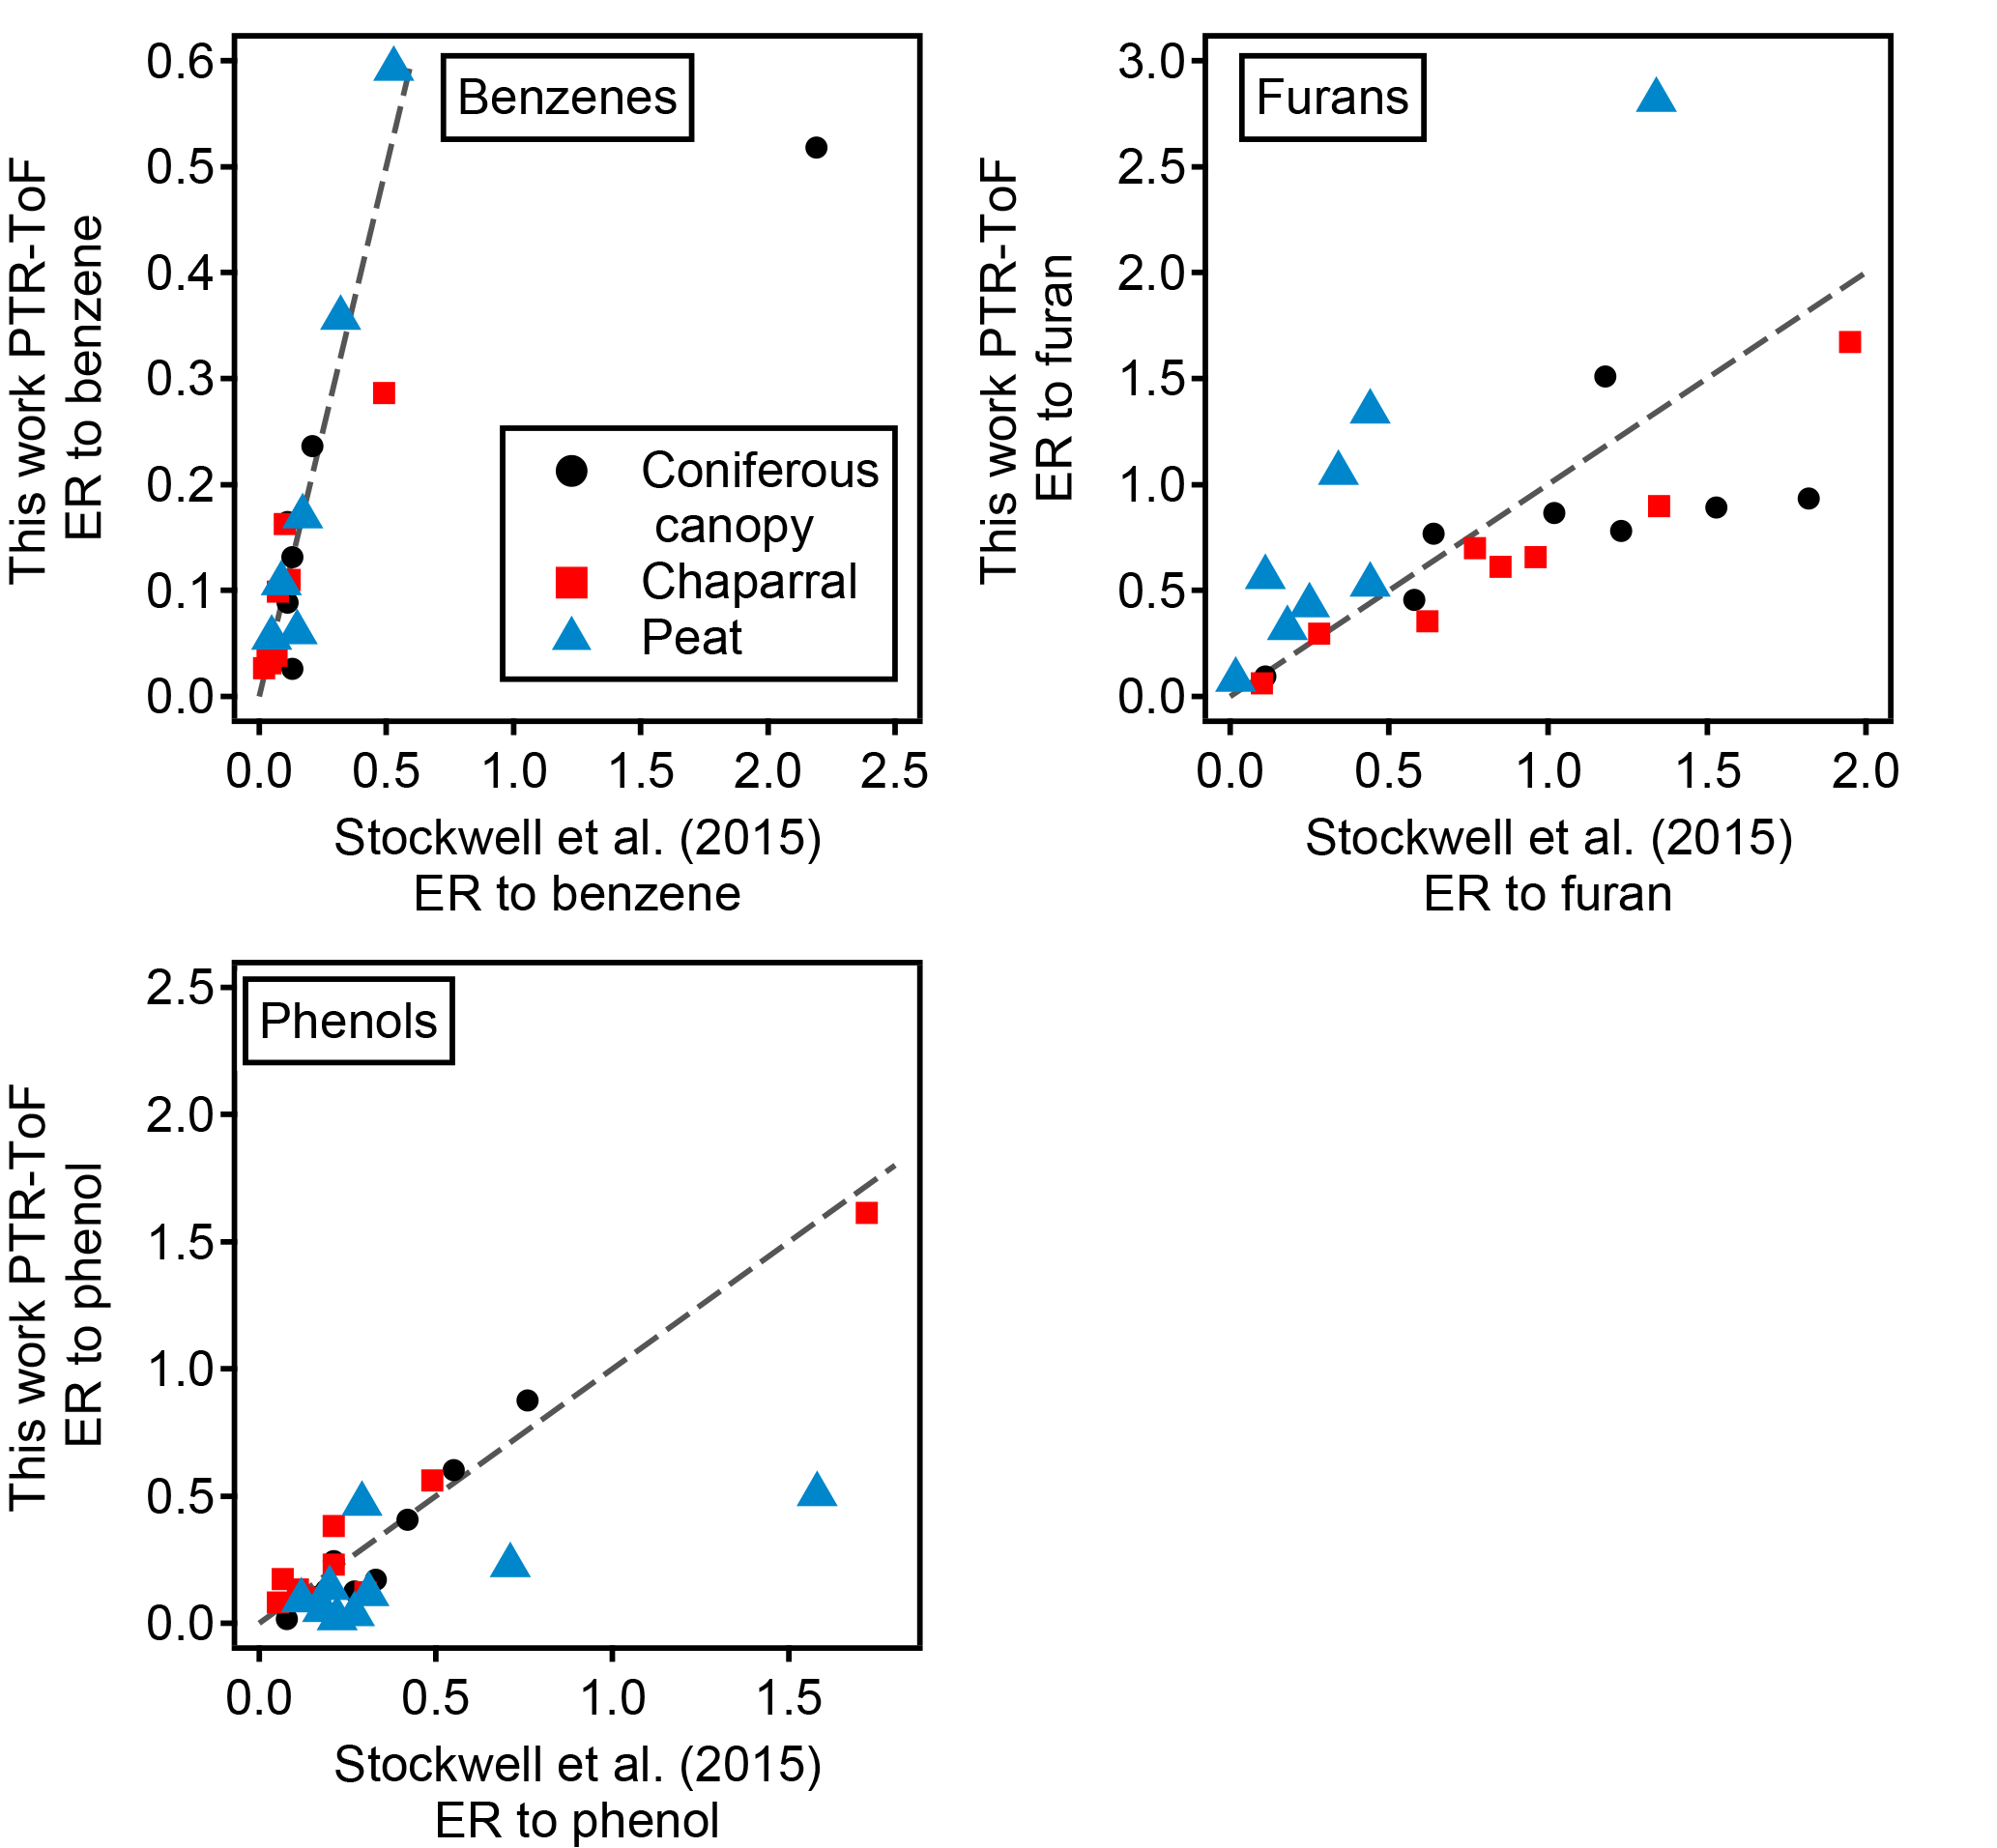
Figure 6Comparison of emission ratios to Stockwell et al. (2015). The dashed line in each panel shows a 1:1 line. The NMOGs are divided into three structural classes: benzenes, furans, and phenols. In each class, the emission ratio is taken against benzene, furan, and phenol, respectively. Three types of fuels (coniferous canopy, chaparral, and peat) were sampled in both this work and Stockwell et al. (2015) and the data shown are averaged over all the fires of a particular fuel type.
The emission ratios and emission factors of the identified compounds averaged over all fires are reported in Table 2. Emission ratios and emission factors of both identified and unidentified compounds for specific fuel types are given in Tables S2 and S3. The large relative SDs of both emission ratio and emission factor for each NMOG indicate large differences in emission composition between different fires. An analysis of the differences in emission composition between different fuels and combustion processes will be presented in a separate paper. Figure 5 compares the average emission ratios determined in this work to several other studies. Our emission ratios have similar values, ranging from a factor of 1.7 higher on average than Gilman et al. (2015) to 0.7 higher than the average of Stockwell et al. (2015). The differences in slopes and scatter are likely due to different fuel types, fire conditions, and sampling strategies. Stockwell et al. (2015) also reported detailed speciation within particular structural categories (non-oxygenated aromatics, phenols, and furans). We compared our speciation for comparable fuel types – coniferous canopy, chaparral, and peat – and the agreement for coniferous fuels and chaparral is within a factor of 2 despite differences in ion identification and calibration factor (Fig. 6). The ER to CO are likely the easiest way to incorporate this new NMOG data into models since CO emissions from wildfires are relatively well characterized (Liu et al., 2017b).
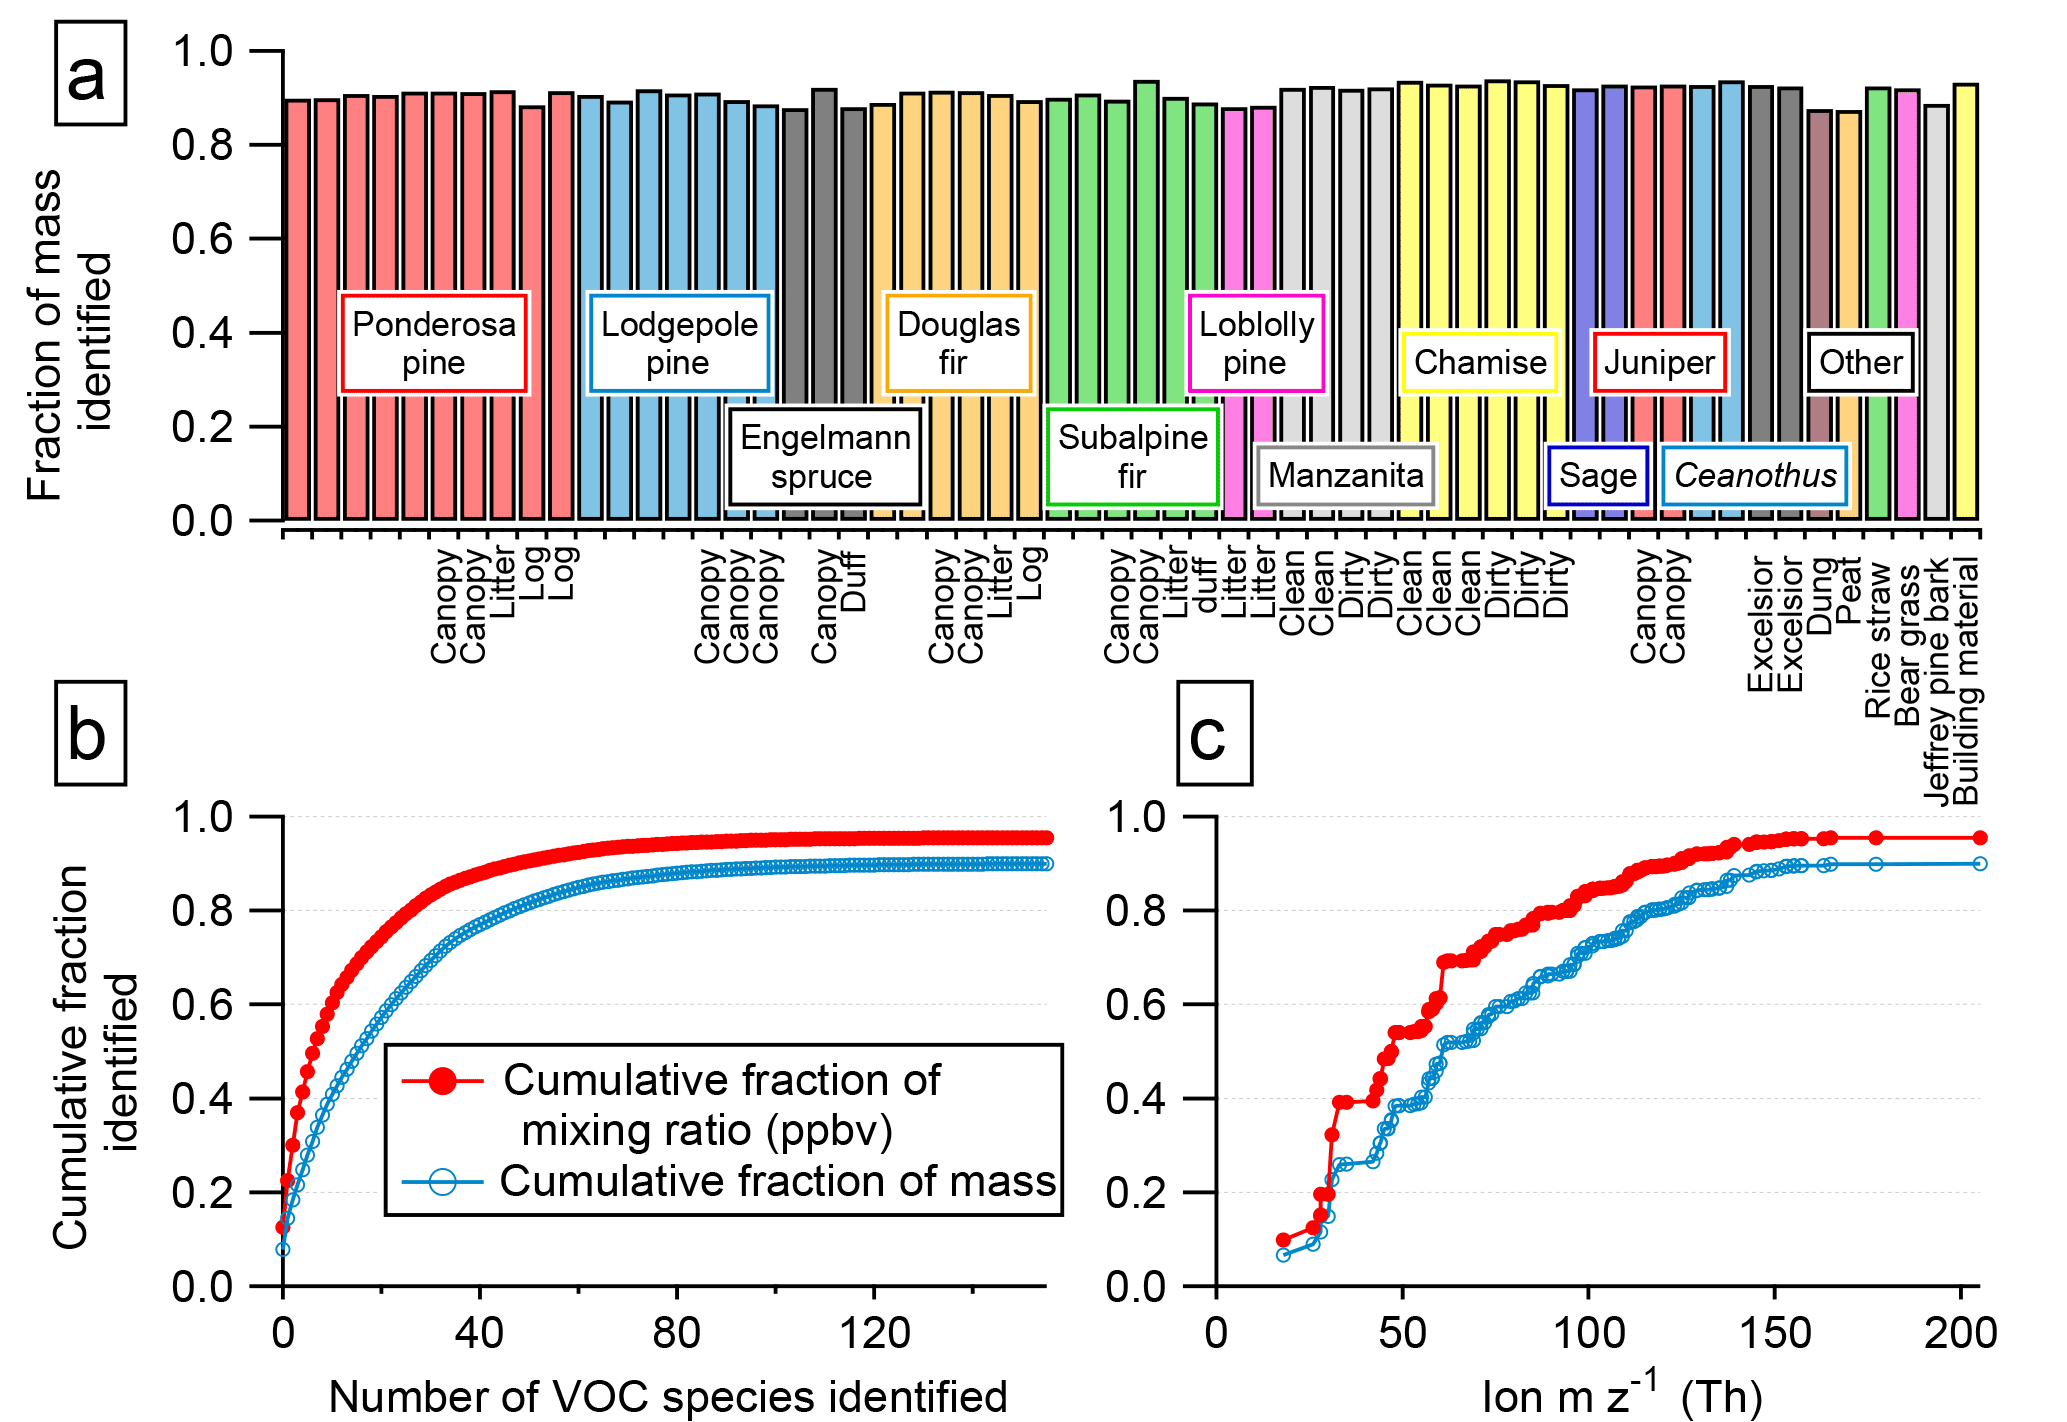
Figure 7(a) Fraction of detected NMOG mass accounted for by identified species. (b) The fraction of total detected NMOGs accounted for by identified species increases as additional ion masses are interpreted. (c) Identified fraction of total detected NMOG as a function of m∕z. Subplots (b and c) use data from Fire 2 (ponderosa pine with a realistic blend of fuel components).
The 156 PTR ions for which we have identified the NMOG contributors account for a significant fraction of the instrument signal and total NMOG detected by the PTR-ToF instrument in each fire. Across all 58 stack fires measured with PTR-ToF, an average of 90 % of the instrument signal from m∕z 12–m∕z 217 (excluding primary and contaminant ions) is explained by these ions and associated fragments. After calibration, an average of 92 % and a minimum of 88 % of the total NMOG mixing ratio detected by PTR-ToF consists of identified compounds (Fig. 7a). The mixing ratios of unidentified species were determined using a calibration factor calculated from the elemental composition of the ion. They are therefore a lower limit and the actual unidentified fraction could be higher (Sect. 2.3). The PTR-ToF instrument detects about 80–90 % of the total NMOG emissions (on a molar basis) based on the composition reported by Gilman et al. (2015).
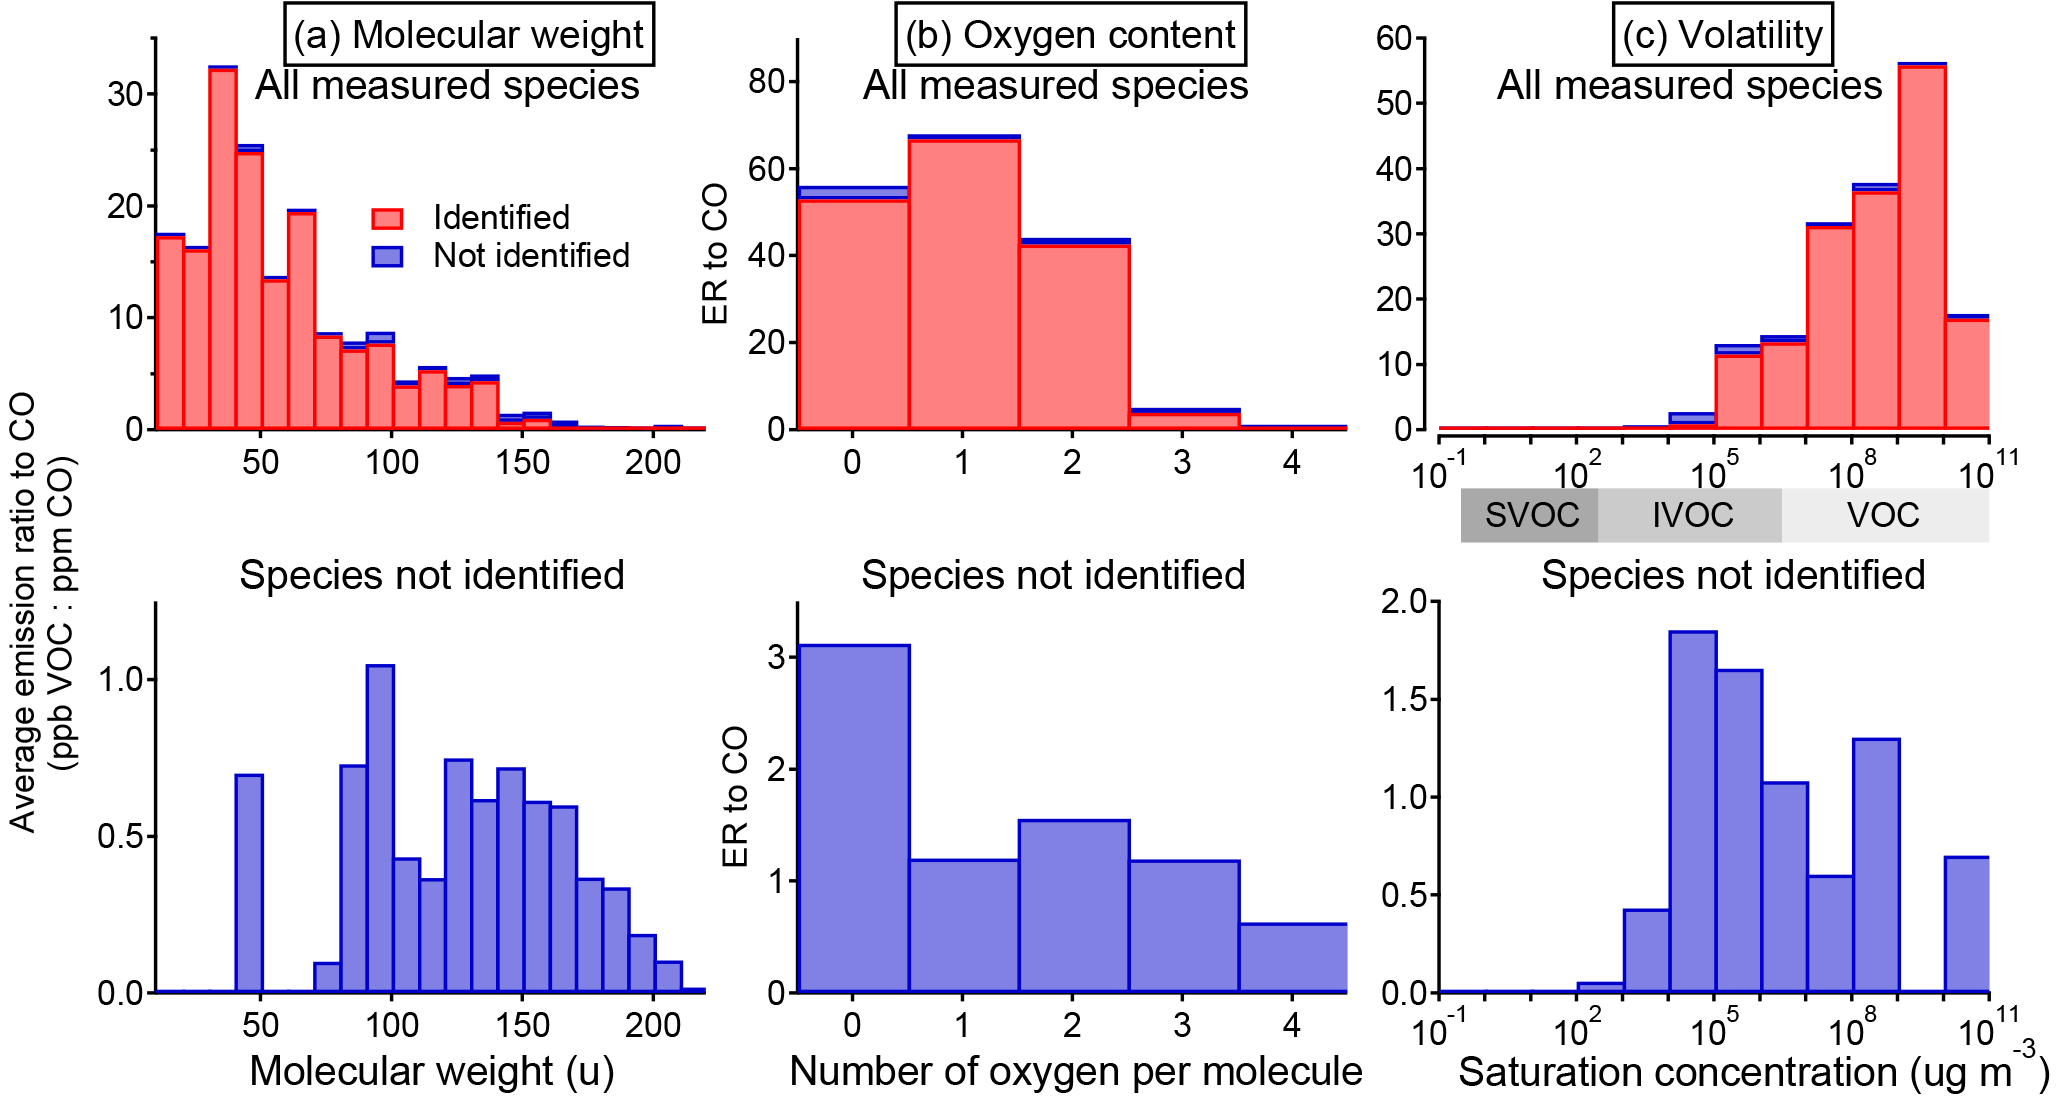
Figure 8Histogram of total emission (quantified as emission ratio to CO) of identified and unidentified NMOGs sorted by (a) molecular weight, (b) number of oxygen per molecule, and (c) saturation vapor concentration (C0 at 25 ∘C). The saturation concentrations are from the CRC Handbook, NIST Chemistry WebBook, and Yaws (2015) where available and estimated from the parameterization in Li et al. (2016) otherwise.
In terms of NMOG mass detected by PTR-ToF, an average of 88 % and a minimum of 82 % is accounted for by identified species (Fig. 7b). This is an improvement over Warneke et al. (2011), in which only 50–75 % of the detected mass was identified, and is comparable to Stockwell et al. (2015), with improved identification of emissions from peat and updated ion assignments (Table S6). Identifying the NMOG contributors to additional ions will not increase this by much because the remaining (unidentified) ions each account for only a small part of the remaining signal. The unidentified portion is a small fraction of the overall detected emissions, but compared to the identified portion, it consists of species that are heavier, contain more oxygen atoms, and are less volatile (Fig. 8). The average molecular mass of unidentified species is 120 u compared to 50 u for identified species, and species with three or more oxygen atoms comprise 24 % of unidentified NMOG emissions but only 2.5 % of identified NMOG emissions. Many of the unidentified emissions are of intermediate volatility, while most identified species are highly volatile. Species that could be efficient SOA precursors may therefore be underrepresented in the list of identified NMOGs. Additionally, the heavier, more polar unidentified compounds may be preferentially lost in inlet lines and could comprise a larger fraction of emissions than measured by the PTR-ToF instrument.

Figure 9(a) Relative abundance of NMOGs detected by PTR-ToF sorted by structural category. The abundance is given relative to CO (emission ratio is calculated as integrated mmol NMOG ∕ integrated mol CO). (b) Relative abundance of NMOGs (emission ratio to CO) sorted by functional group. Some NMOGs, such as guaiacol, have multiple functional group substitutions. These are counted once in each relevant category. The contributions from several compounds with high concentrations are indicated separately.
The detected and identified NMOGs fall into several broad structural categories: furan-type compounds, benzene-type compounds (aromatics), terpenes, non-aromatic molecules containing oxygen, nitrogen, or sulfur, and other hydrocarbons (mostly alkenes). We also included pyrroles, thiophenes, and pyridines as structural categories, but these account for less than 1 % of detected emissions on a molar basis. Terpenes include isoprene, monoterpenes, oxygenated monoterpenes, and sesquiterpenes. Non-aromatic oxygen-containing molecules include alkyl carbonyls, esters, and acids. Non-aromatic nitrogen-containing molecules include HCN, HONO, isocyanic acid, methyl isocyanate, amines (including ammonia), and nitriles. Aromatics and furans include alkyl-substituted and oxygenated derivatives of benzene and furan. On average over all fires, non-aromatic oxygenates were the most abundant, comprising 51 % of detected emissions (Fig. 9a). The compounds in each category include a range of functional groups, of which alcohols and carbonyls were the most abundant (Fig. 9b). Many compounds also include an alkene functional group. Some compounds, such as guaiacol, have several functional groups. In these cases, the NMOG was counted once in each category.
Compared to several previous laboratory studies reporting highly chemically detailed emissions using GC instruments (Hatch et al., 2015; Gilman et al., 2015; Hatch et al., 2017), we observed a similar range and type of speciation for non-oxygenated aromatics, thiophenes, pyrroles, pyridines, alkyl nitriles, alkyl ketones, alkyl esters, and small alcohols. However, this work and a previous PTR-MS study (Stockwell et al., 2015) also observed more highly substituted oxygen-containing aromatics and furans, such as hydroxymethylfuranone and syringol. These substituted compounds contribute significant additional reactivity. For example, Gilman et al. (2015), who studied similar fuels, reported OH reactivity of 1.3–5.5 for furans. In this study, the average OH reactivity of furans is 14.2 . The SOA yields of many of these compounds are unknown but they are likely important SOA precursors (Yee et al., 2013; Gilman et al., 2015; Hatch et al., 2017; Bruns et al., 2016).
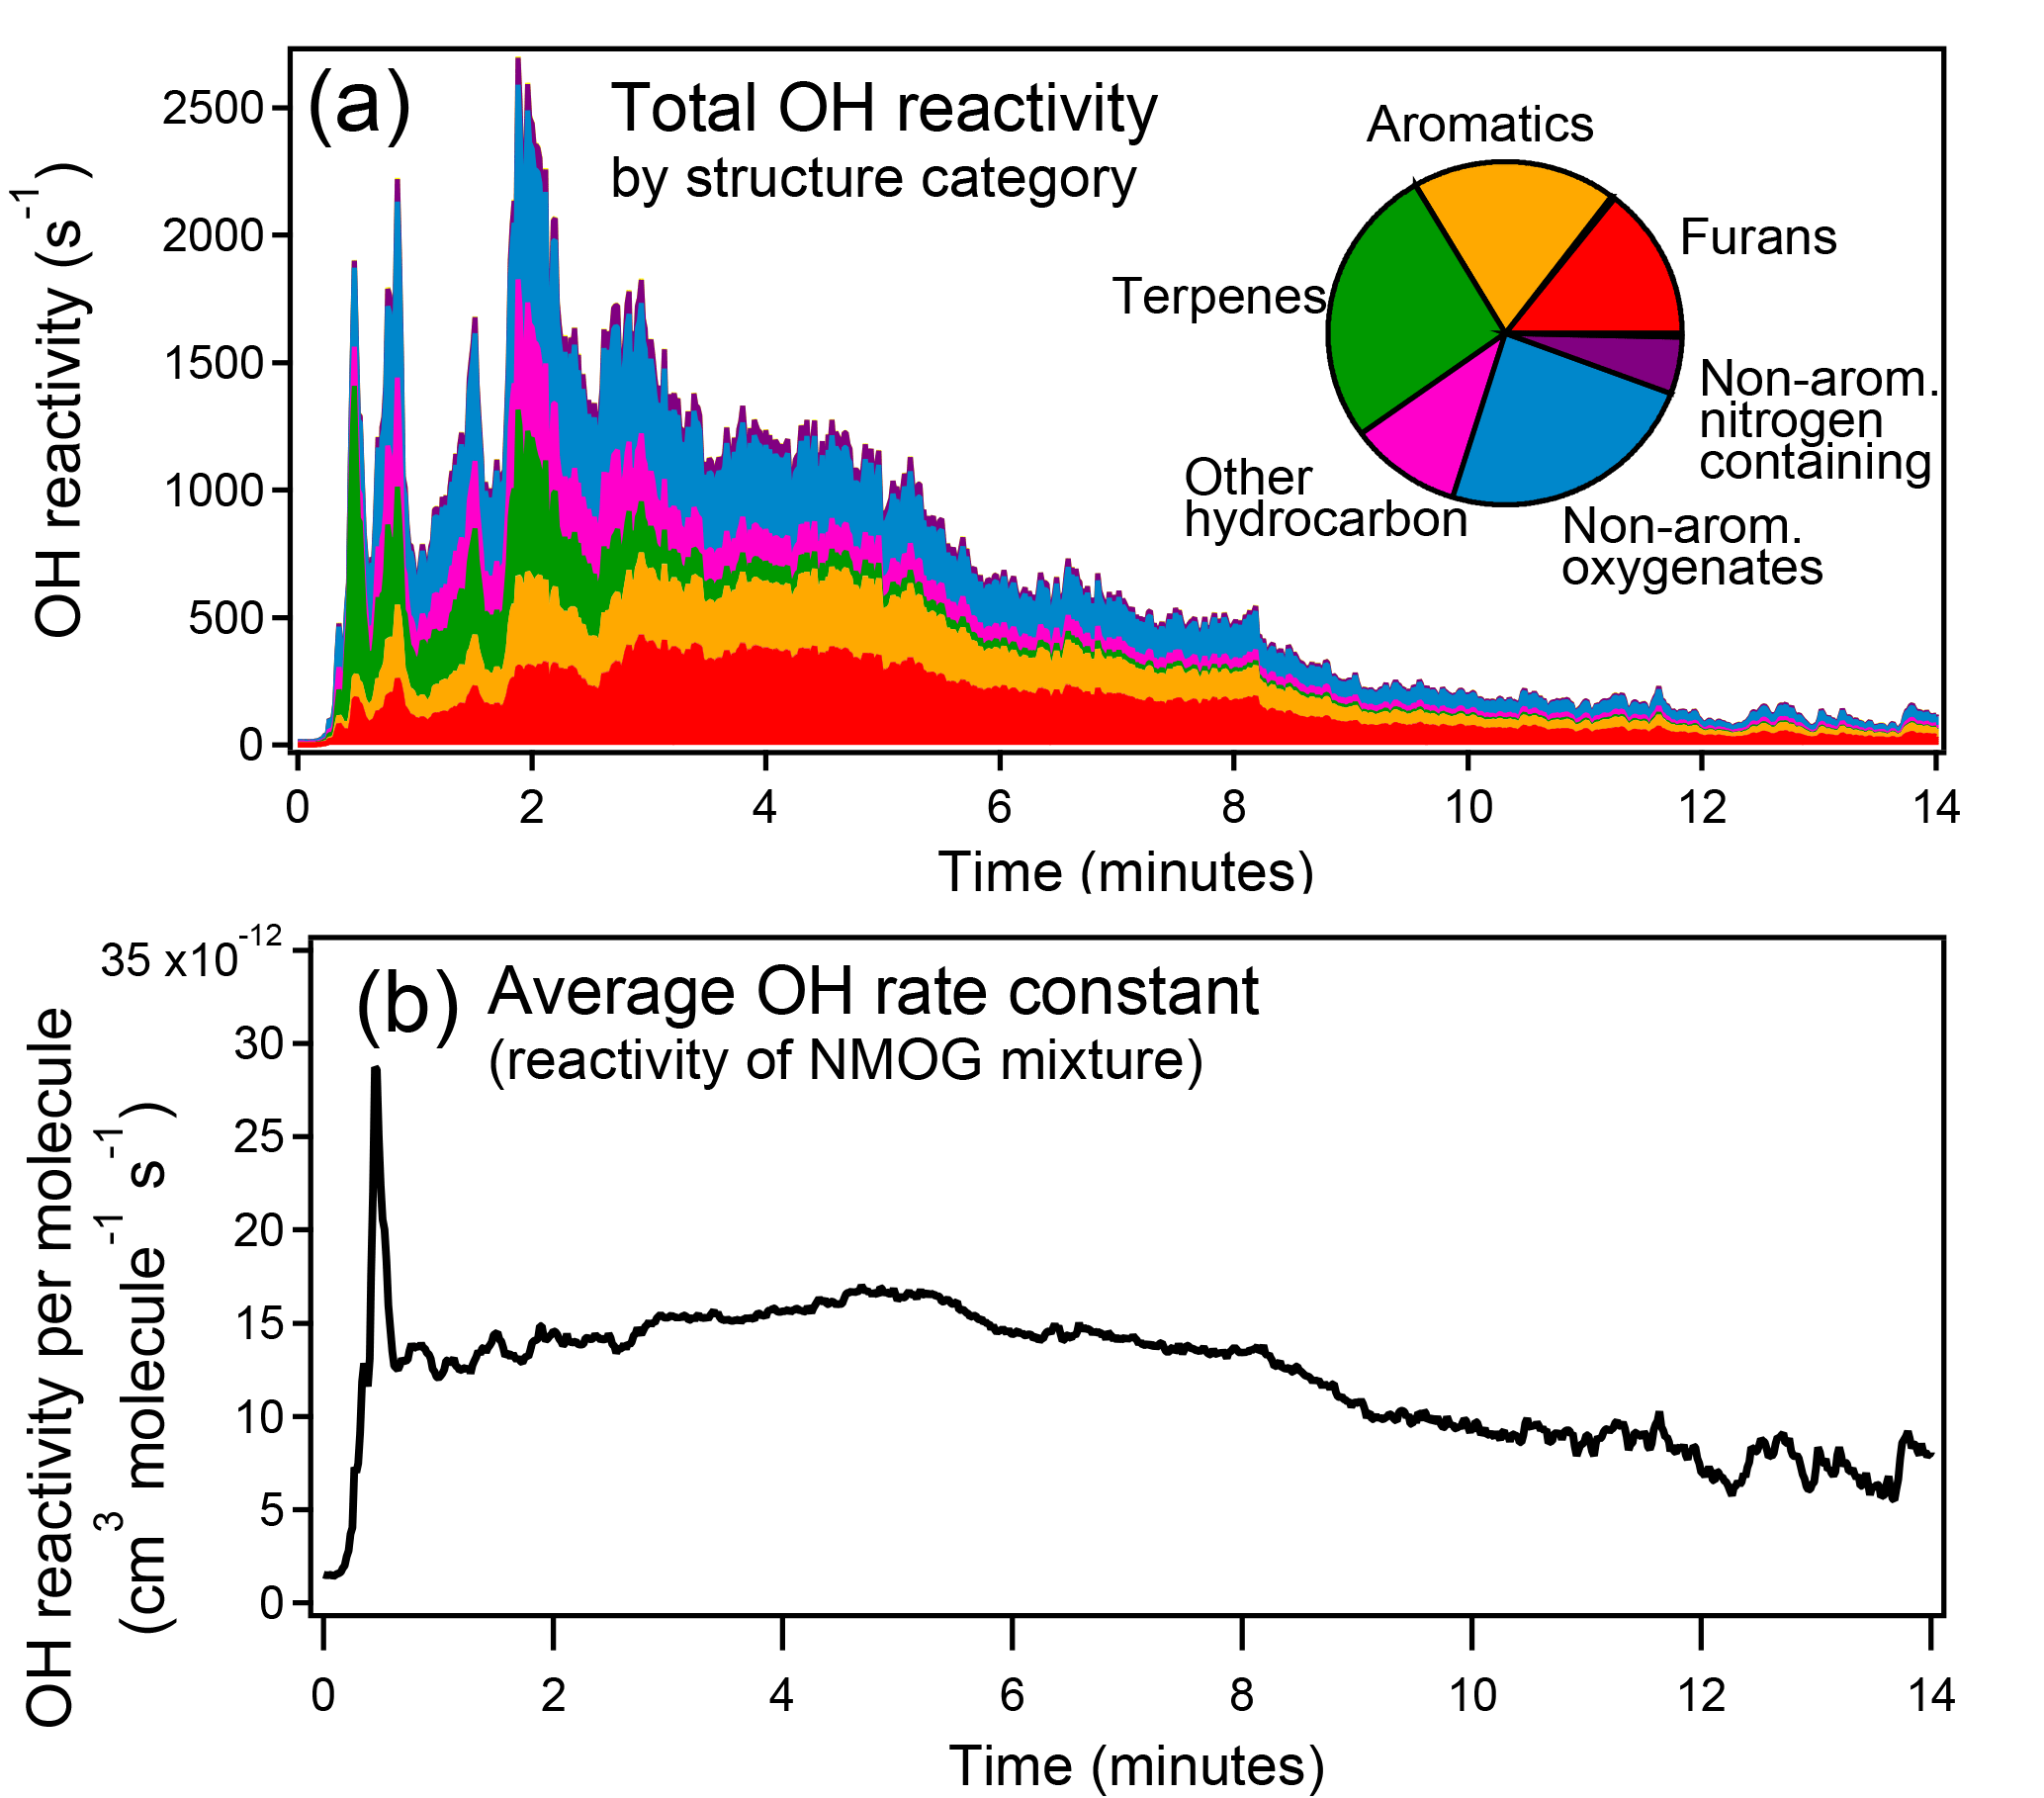
Figure 10(a) Total OH reactivity from NMOGs measured by PTR-ToF during Fire 2 (ponderosa pine). The inset pie chart shows the relative contribution to total OH reactivity of each structural category averaged over all fires during FIREX 2016. (b) Average rate constant with OH of NMOGs detected by PTR-ToF during Fire 2.
Reaction with the hydroxyl radical (• OH) is an important removal pathway for gas-phase biomass burning emissions in the atmosphere. NMOGs have been previously shown to be an important sink for the OH radical, despite comprising less than 1 % by mass of the total measured gas-phase emissions (Gilman et al., 2015). We compiled the rate constants with • OH of the identified species. Where an experimentally determined rate constant was not available, the rate constant of a structurally similar species was used (rate constants and citations in Table S5). On average, furans, aromatics, terpenes, and non-aromatic oxygenates contribute a roughly equal amount to total OH reactivity (Fig. 10a). It has been shown that the average reactivity of NMOG emissions can vary greatly among fuel types (Gilman et al., 2015); here, we show that the average reactivity and the types of compounds that contribute most to reactivity also vary greatly over the course of a fire (Fig. 10b). The spike in average reactivity at the beginning of the fire is due to the distillation of terpenes.
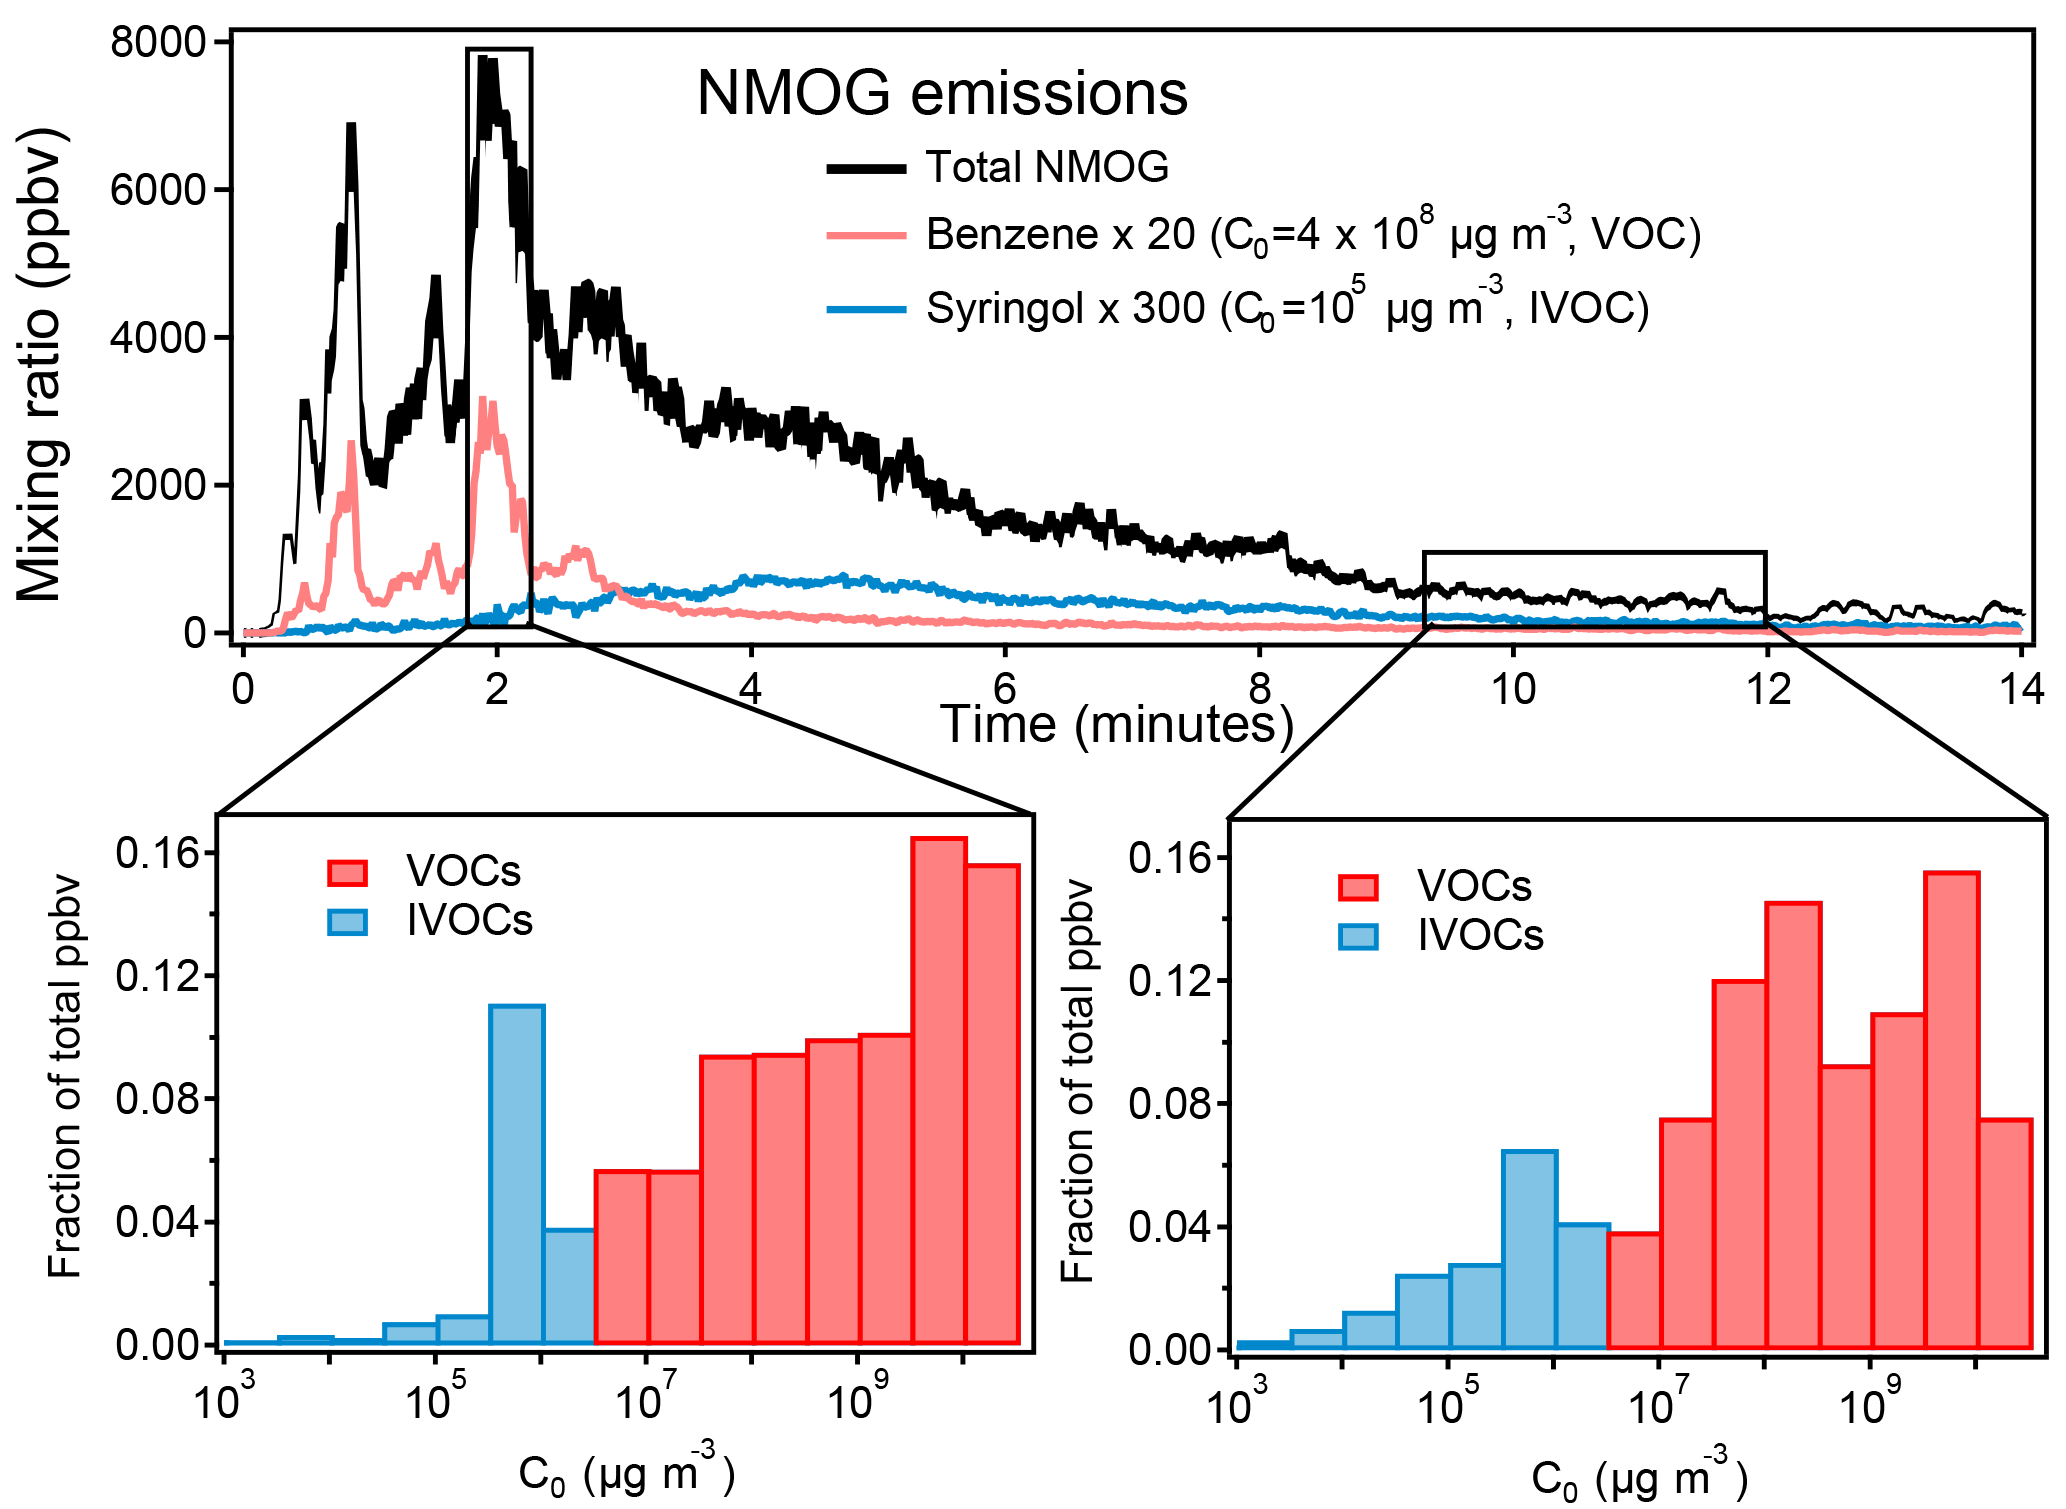
Figure 11Volatility of NMOGs during Fire 2 (ponderosa pine). For simplicity, ammonia is excluded from this figure because of its very high concentration (600 ppb) and volatility (C0 = 7 × 10⁹ µg m−3).
The volatility distribution of emitted species also changes over the course of these lab fires. We determined the saturation vapor concentration (C0, in µg m−3 at 25 ∘C) for each of the identified and unidentified species. The values were taken from databases (CRC Handbook, NIST Chemistry WebBook, Yaws, 2015) or estimated based on elemental composition via the parameterization described by Li et al. (2016). Species emitted from lower-temperature processes during the fire have a higher fraction of compounds with low volatility compared to the high-temperature processes (later and earlier in the fire shown in Fig. 11). Further discussion of chemical differences and low- and high-temperature processes will be presented in a separate paper (Sekimoto et al., 2018). The PTR-ToF instrument measures mostly species whose volatility is classified as volatile organic compounds (VOC, C0 > 3 × 10⁶ µg m−3), and a few intermediate volatility compounds (IVOC, 300 < C0 < 3 × 10⁶ µg m−3) and semivolatile compounds (SVOC, 0.3 < C0 < 300 µg m−3) are detected. Many more IVOC species have been measured by 2-D-GC (Hatch et al., 2017). It is expected that many species of C0 < 104 µg m−3 were not transmitted through the transfer inlet and instrument tubing quickly enough to be quantifiable by the PTR-MS (Pagonis et al., 2017).
Gas-phase emissions of NMOGs and some inorganic compounds were measured with a high-resolution PTR-ToF instrument during the FIREX 2016 laboratory intensive. Using a combination of techniques, including GC pre-separation, NO+ CIMS, and time series correlation, we have identified many more compounds with greater certainty than has been reported in previous PTR-MS studies of biomass burning emissions. We have identified the NMOG contributors to ∼ 90 % of the PTR-ToF signal, accounting for ∼ 90 % of the NMOG mass detected by the instrument, and determined the emission factors of these compounds. The NMOG ions not identified are in general larger, more oxygenated, and less volatile than the identified species. This should be considered if using PTR-ToF to study SOA precursors. Unidentified compounds may also be preferentially lost in inlets. The PTR-ToF measurement generally agrees well with other instrumentation for many species. However, small, multiply oxygenated species such as glyoxal and methylglyoxal may have significant interferences. We determined the reaction rate constant of each identified NMOG with the OH radical. Furans, aromatics, and terpenes are the most important reactive species measured by PTR-ToF instrument. We show that the reactivity of the emissions, volatility of the emissions, and the compounds that contribute to the reactivity can change considerably as different combustion processes occur.
This work provides a guide to interpreting PTR-ToF measurements of biomass burning that is strongly supported by the literature and complementary analytical techniques. This will serve as a foundation for future use of FIREX 2016 PTR-ToF data and interpretation of PTR-ToF field measurements. Finally, this work provides the best available emission factors and emission ratios to CO for many wildfire-generated NMOGs.
Data are available from the CSD NOAA archive at https://esrl.noaa.gov/csd/groups/csd7/measurements/2016firex/FireLab/DataDownload/ (NOAA, 2018).
The supplement related to this article is available online at: https://doi.org/10.5194/acp-18-3299-2018-supplement.
Joost de Gouw worked as a consultant for Aerodyne Research, Inc. during part of the preparation phase of this paper.
Abigail R. Koss acknowledges funding from the NSF Graduate Fellowship Program. Kanako Sekimoto acknowledges funding from
the Postdoctoral Fellowships for Research Abroad from the Japan Society for the Promotion of Science (JSPS) and a Grant-in-Aid
for Young Scientists (B) (15K16117) from the Ministry of Education, Culture, Sports, Science and Technology of
Japan. Robert J. Yokelson and Vanessa Selimovic were supported by NOAA-CPO grant NA16OAR4310100. Jordan R. Krechmer and
Jose L. Jimenez were supported by DOE (BER/ASR) DE-SC0016559. We thank the USFS Missoula Fire Sciences Laboratory for
their help in conducting these experiments. This work was also supported by NOAA's Climate Research and Health of the
Atmosphere initiative.
Edited by: Robert McLaren
Reviewed by: two anonymous referees
Akagi, S. K., Yokelson, R. J., Wiedinmyer, C., Alvarado, M. J., Reid, J. S., Karl, T., Crounse, J. D., and Wennberg, P. O.: Emission factors for open and domestic biomass burning for use in atmospheric models, Atmos. Chem. Phys., 11, 4039–4072, https://doi.org/10.5194/acp-11-4039-2011, 2011.
Alvarado, M. J., Wang, C., and Prinn, R. G.: Formation of ozone and growth of aerosols in young smoke plumes from biomass burning: 2. Three-dimensional Eulerian studies, J. Geophys. Res., 114, D09307, https://doi.org/10.1029/2008jd011186, 2009.
Alvarado, M. J., Lonsdale, C. R., Yokelson, R. J., Akagi, S. K., Coe, H., Craven, J. S., Fischer, E. V., McMeeking, G. R., Seinfeld, J. H., Soni, T., Taylor, J. W., Weise, D. R., and Wold, C. E.: Investigating the links between ozone and organic aerosol chemistry in a biomass burning plume from a prescribed fire in California chaparral, Atmos. Chem. Phys., 15, 6667–6688, https://doi.org/10.5194/acp-15-6667-2015, 2015.
Breitenlechner, M., Fischer, L., Hainer, M., Heinritzi, M., Curtius, J., and Hansel, A.: PTR3: an instrument for studying the lifecycle of reactive organic carbon in the atmosphere, Anal. Chem., 89, 5824–5831, https://doi.org/10.1021/acs.analchem.6b05110, 2017.
Brilli, F., Gioli, B., Ciccioli, P., Zona, D., Loreto, F., Janssens, I. A., and Ceulemans, R.: Proton Transfer Reaction Time-of-Flight Mass Spectrometric (PTR-TOF-MS) determination of volatile organic compounds (VOCs) emitted from a biomass fire developed under stable nocturnal conditions, Atmos. Environ., 97, 54–67, https://doi.org/10.1016/j.atmosenv.2014.08.007, 2014.
Bruns, E. A., El Haddad, I., Slowik, J. G., Kilic, D., Klein, F., Baltensperger, U., and Prevot, A. S.: Identification of significant precursor gases of secondary organic aerosols from residential wood combustion, Sci. Rep.-UK, 6, 27881, https://doi.org/10.1038/srep27881, 2016.
Bruns, E. A., Slowik, J. G., El Haddad, I., Kilic, D., Klein, F., Dommen, J., Temime-Roussel, B., Marchand, N., Baltensperger, U., and Prévôt, A. S. H.: Characterization of gas-phase organics using proton transfer reaction time-of-flight mass spectrometry: fresh and aged residential wood combustion emissions, Atmos. Chem. Phys., 17, 705–720, https://doi.org/10.5194/acp-17-705-2017, 2017.
Burling, I. R., Yokelson, R. J., Griffith, D. W. T., Johnson, T. J., Veres, P., Roberts, J. M., Warneke, C., Urbanski, S. P., Reardon, J., Weise, D. R., Hao, W. M., and de Gouw, J.: Laboratory measurements of trace gas emissions from biomass burning of fuel types from the southeastern and southwestern United States, Atmos. Chem. Phys., 10, 11115–11130, https://doi.org/10.5194/acp-10-11115-2010, 2010.
Christian, T. J.: Comprehensive laboratory measurements of biomass-burning emissions: 1. Emissions from Indonesian, African, and other fuels, J. Geophys. Res., 108, D23, https://doi.org/10.1029/2003jd003704, 2003.
Christian, T. J.: Comprehensive laboratory measurements of biomass-burning emissions: 2. First intercomparison of open-path FTIR, PTR-MS, and GC-MS/FID/ECD, J. Geophys. Res., 109, D02311, https://doi.org/10.1029/2003jd003874, 2004.
Collard, F.-X. and Blin, J.: A review on pyrolysis of biomass constituents: mechanisms and composition of the products obtained from the conversion of cellulose, hemiselluloses, and lignin, Renew. Sust. Energ. Rev., 38, 594–608, https://doi.org/10.1016/j.rser.2014.06.013, 2014.
Crutzen, P. J. and Andreae, M. O.: Biomass burning in the tropics: impact on atmospheric chemistry and biogeochemical cycles, Science, 250, 1669–1678, https://doi.org/10.1126/science.250.4988.1669, 1990.
de Gouw, J. and Warneke, C.: Measurements of volatile organic compounds in the earth's atmosphere using proton-transfer-reaction mass spectrometry, Mass. Spectrom. Rev., 26, 223–257, https://doi.org/10.1002/mas.20119, 2007.
Fu, T.-M., Jacob, D. J., Wittrock, F., Burrows, J. P., Vrekoussis, M., and Henze, D. K.: Global budgets of atmospheric glyoxal and methylglyoxal, and implications for formation of secondary organic aerosols, J. Geophys. Res., 113, D15303, https://doi.org/10.1029/2007JD009505, 2008.
Gilman, J. B., Lerner, B. M., Kuster, W. C., Goldan, P. D., Warneke, C., Veres, P. R., Roberts, J. M., de Gouw, J. A., Burling, I. R., and Yokelson, R. J.: Biomass burning emissions and potential air quality impacts of volatile organic compounds and other trace gases from fuels common in the US, Atmos. Chem. Phys., 15, 13915–13938, https://doi.org/10.5194/acp-15-13915-2015, 2015.
Grieshop, A. P., Logue, J. M., Donahue, N. M., and Robinson, A. L.: Laboratory investigation of photochemical oxidation of organic aerosol from wood fires 1: measurement and simulation of organic aerosol evolution, Atmos. Chem. Phys., 9, 1263–1277, https://doi.org/10.5194/acp-9-1263-2009, 2009.
Hatch, L. E., Luo, W., Pankow, J. F., Yokelson, R. J., Stockwell, C. E., and Barsanti, K. C.: Identification and quantification of gaseous organic compounds emitted from biomass burning using two-dimensional gas chromatography–time-of-flight mass spectrometry, Atmos. Chem. Phys., 15, 1865–1899, https://doi.org/10.5194/acp-15-1865-2015, 2015.
Hatch, L. E., Yokelson, R. J., Stockwell, C. E., Veres, P. R., Simpson, I. J., Blake, D. R., Orlando, J. J., and Barsanti, K. C.: Multi-instrument comparison and compilation of non-methane organic gas emissions from biomass burning and implications for smoke-derived secondary organic aerosol precursors, Atmos. Chem. Phys., 17, 1471–1489, https://doi.org/10.5194/acp-17-1471-2017, 2017.
Hays, M. D., Geron, C. D., Linna, K. J., Smith, N. D., and Schauer, J. J.: Speciation of gas-phase and fine particle emissions from burning of foliar fuels, Environ. Sci. Technol., 36, 2281–2295, https://doi.org/10.1021/es0111683, 2002.
Heald, C. L., Coe, H., Jimenez, J. L., Weber, R. J., Bahreini, R., Middlebrook, A. M., Russell, L. M., Jolleys, M., Fu, T.-M., Allan, J. D., Bower, K. N., Capes, G., Crosier, J., Morgan, W. T., Robinson, N. H., Williams, P. I., Cubison, M. J., DeCarlo, P. F., and Dunlea, E. J.: Exploring the vertical profile of atmospheric organic aerosol: comparing 17 aircraft field campaigns with a global model, Atmos. Chem. Phys., 11, 12673–12696, https://doi.org/10.5194/acp-11-12673-2011, 2011.
Heigenmoser, A., Liebner, F., Windeisen, E., and Richter, K.: Investigation of thermally treated beech (Fagus sylvatica) and spruce (Picea abies) by means of multifunctional analytical pyrolysis-GC/MS, J. Anal. Appl. Pyrol., 100, 117–126, https://doi.org/10.1016/j.jaap.2012.12.005, 2013.
Jaffe, D. A. and Wigder, N. L.: Ozone production from wildfires: a critical review, Atmos. Environ., 51, 1–10, https://doi.org/10.1016/j.atmosenv.2011.11.063, 2012.
Jathar, S. H., Gordon, T. D., Hennigan, C. J., Pye, H. O. T., Pouliot, G., Adams, P. J., Donahue, N. M., and Robinson, A. L.: Unspeciated organic emissions from combustion sources and their influence on the secondary organic aerosol budget in the United States, P. Natl. Acad. Sci. USA, 111, 10473–10478, https://doi.org/10.1073/pnas.1323740111, 2014.
Jordan, A., Haidacher, S., Hanel, G., Hartungen, E., Märk, L., Seehauser, H., Schottkowsky, R., Sulzer, P., and Märk, T. D.: A high resolution and high sensitivity proton-transfer-reaction time-of-flight mass spectrometer (PTR-TOF-MS), Int. J. Mass Spectrom., 286, 122–128, https://doi.org/10.1016/j.ijms.2009.07.005, 2009.
Karl, T. G., Christian, T. J., Yokelson, R. J., Artaxo, P., Hao, W. M., and Guenther, A.: The Tropical Forest and Fire Emissions Experiment: method evaluation of volatile organic compound emissions measured by PTR-MS, FTIR, and GC from tropical biomass burning, Atmos. Chem. Phys., 7, 5883–5897, https://doi.org/10.5194/acp-7-5883-2007, 2007.
Knighton, W. B., Fortner, E. C., Midey, A. J., Viggiano, A. A., Herndon, S. C., Wood, E. C., and Kolb, C. E.: HCN detection with a proton transfer reaction mass spectrometer, Int. J. Mass. Spectrom., 1–3, 112–121, 2009.
Koss, A. R., Warneke, C., Yuan, B., Coggon, M. M., Veres, P. R., and de Gouw, J. A.: Evaluation of NO+ reagent ion chemistry for online measurements of atmospheric volatile organic compounds, Atmos. Meas. Tech., 9, 2909–2925, https://doi.org/10.5194/amt-9-2909-2016, 2016.
Lee, B. H., Lopez-Hilfiker, F. D., Mohr, C., Kurtén, T., Worsnop, D. R., and Thornton, J. A.: An iodide-adduct high-resolution time-of-flight chemical-ionization mass spectrometer: application to atmospheric inorganic and organic compounds, Environ. Sci. Technol., 48, 6309–6317, https://doi.org/10.1021/es500362a, 2014.
Lerner, B. M., Gilman, J. B., Aikin, K. C., Atlas, E. L., Goldan, P. D., Graus, M., Hendershot, R., Isaacman-VanWertz, G. A., Koss, A., Kuster, W. C., Lueb, R. A., McLaughlin, R. J., Peischl, J., Sueper, D., Ryerson, T. B., Tokarek, T. W., Warneke, C., Yuan, B., and de Gouw, J. A.: An improved, automated whole air sampler and gas chromatography mass spectrometry analysis system for volatile organic compounds in the atmosphere, Atmos. Meas. Tech., 10, 291–313, https://doi.org/10.5194/amt-10-291-2017, 2017.
Li, Y., Pöschl, U., and Shiraiwa, M.: Molecular corridors and parameterizations of volatility in the chemical evolution of organic aerosols, Atmos. Chem. Phys., 16, 3327–3344, https://doi.org/10.5194/acp-16-3327-2016, 2016.
Liu, W.-J., Li, W.-W., Jiang, H., and Yu, H.-Q.: Fates of chemical elements in biomass during its pyrolysis, Chem. Rev., 117, 6367–6398, https://doi.org/10.1021/acs.chemrev.6b00647, 2017a.
Liu, X., Huey, L. G., Yokelson, R. J., Selimovic, V., Simpson, I. J., Müller, M., Jimenez, J. L., Campuzano-Jost, P., Beyersdorf, A. J., Blake, D. R., Butterfield, Z., Choi, Y., Crounse, J. D., Day, D. A., Diskin, G. S., Dubey, M. K., Fortner, E., Hanisco, T. F., Hu, W., King, L. E., Kleinman, L., Meinardi, S., Mikoviny, T., Onasch, T. B., Palm, B. B., Peischl, J., Pollack, I. B., Ryerson, T. B., Sachse, G. W., Sedlacek, A. J., Shilling, J. E., Springston, S., St. Clair, J. M., Tanner, D. J., Teng, A. P., Wennberg, P. O., Wisthaler, A., and G. M. Wolfe.: Airborne measurements of western U.S. wildfire emissions: comparison with prescribed burning and air quality implications, J. Geophys. Res.-Atmos., 122, 6108–6129, https://doi.org/10.1002/2016JD026315, 2017b.
Lu, Q., Yang, X.-C., Dong, C.-Q., Zhang, Z.-F., Zhang, X.-M., and Zhu, X.-F.: Influence of pyrolysis temperature and time on the cellulose fast pyrolysis products: analytical Py-GC/MS study, J. Anal. Appl. Pyrol., 92, 430–438, https://doi.org/10.1016/j.jaap.2011.08.006, 2011.
Min, K.-E., Washenfelder, R. A., Dubé, W. P., Langford, A. O., Edwards, P. M., Zarzana, K. J., Stutz, J., Lu, K., Rohrer, F., Zhang, Y., and Brown, S. S.: A broadband cavity enhanced absorption spectrometer for aircraft measurements of glyoxal, methylglyoxal, nitrous acid, nitrogen dioxide, and water vapor, Atmos. Meas. Tech., 9, 423–440, https://doi.org/10.5194/amt-9-423-2016, 2016.
Moussa, S. G., Leithead, A., Li, S.-M., Chan, T. W., Wentzell, J. J. B., Stroud, C., Zhang, J., Lee, P., Lu, G., Brook, J. R., Hayden, K., Narayan, J., and Liggio, J.: Emissions of hydrogen cyanide from on-road gasoline and diesel vehicles, Atmos. Environ., 131, 185–195, 2016.
Müller, M., Graus, M., Ruuskanen, T. M., Schnitzhofer, R., Bamberger, I., Kaser, L., Titzmann, T., Hörtnagl, L., Wohlfahrt, G., Karl, T., and Hansel, A.: First eddy covariance flux measurements by PTR-TOF, Atmos. Meas. Tech., 3, 387–395, https://doi.org/10.5194/amt-3-387-2010, 2010.
Müller, M., Anderson, B. E., Beyersdorf, A. J., Crawford, J. H., Diskin, G. S., Eichler, P., Fried, A., Keutsch, F. N., Mikoviny, T., Thornhill, K. L., Walega, J. G., Weinheimer, A. J., Yang, M., Yokelson, R. J., and Wisthaler, A.: In situ measurements and modeling of reactive trace gases in a small biomass burning plume, Atmos. Chem. Phys., 16, 3813–3824, https://doi.org/10.5194/acp-16-3813-2016, 2016.
Naeher, L. P., Brauer, M., Lipsett, M., Zelikoff, J. T., Simpson, C. D., Koenig, J. Q., and Smith, K. R.: Woodsmoke health effects: a review, Inhal. Toxicol., 19, 67–106, https://doi.org/10.1080/08958370600985875, 2007.
Pagonis, D., Krechmer, J. E., de Gouw, J., Jimenez, J. L., and Ziemann, P. J.: Effects of gas–wall partitioning in Teflon tubing and instrumentation on time-resolved measurements of gas-phase organic compounds, Atmos. Meas. Tech., 10, 4687–4696, https://doi.org/10.5194/amt-10-4687-2017, 2017.
Patwardhan, P. R., Satrio, J. A., Brown, R. C., and Shanks, B. H.: Product distribution from fast pyrolysis of glucose-based carbohydrates, J. Anal. Appl. Pyrol., 86, 323–330, https://doi.org/10.1016/j.jaap.2009.08.007, 2009.
Reddington, C. L., Spracklen, D. V., Artaxo, P., Ridley, D. A., Rizzo, L. V., and Arana, A.: Analysis of particulate emissions from tropical biomass burning using a global aerosol model and long-term surface observations, Atmos. Chem. Phys., 16, 11083–11106, https://doi.org/10.5194/acp-16-11083-2016, 2016.
Roberts, J. M., Veres, P., Warneke, C., Neuman, J. A., Washenfelder, R. A., Brown, S. S., Baasandorj, M., Burkholder, J. B., Burling, I. R., Johnson, T. J., Yokelson, R. J., and de Gouw, J.: Measurement of HONO, HNCO, and other inorganic acids by negative-ion proton-transfer chemical-ionization mass spectrometry (NI-PT-CIMS): application to biomass burning emissions, Atmos. Meas. Tech., 3, 981–990, https://doi.org/10.5194/amt-3-981-2010, 2010.
Sekimoto, K., Li, S.-M., Yuan, B., Koss, A., Coggon, M. M., Warnke, C., and de Gouw, J.: Calculation of the sensitivity of proton-transfer-reaction mass spectrometry (PTR-MS) for organic trace gases, Int. J. Mass Spectrom., 421, 71–94, https://doi.org/10.1016/j.ijms.2017.04.006, 2017.
Sekimoto, K., Koss, A. R., Gilman, J. B., Selimovic, V., Coggon, M. M., Zarzana, K. J., Yuan, B., Lerner, B. M., Brown, S. S., Warneke, C., Yokelson, R. J., Roberts, J. M., and de Gouw, J.: High- and low-temperature pyrolysis profiles describe volatile organic compound emissions from western US wildfire fuels, Atmos. Chem. Phys. Discuss., https://doi.org/10.5194/acp-2018-52, in review, 2018.
Selimovic, V., Yokelson, R. J., Warneke, C., Roberts, J. M., de Gouw, J., Reardon, J., and Griffith, D. W. T.: Aerosol optical properties and trace gas emissions by PAX and OP-FTIR for laboratory-simulated western US wildfires during FIREX, Atmos. Chem. Phys. Discuss., https://doi.org/10.5194/acp-2017-859, in review, 2017.
Shrivastava, M., Cappa, C. D., Fan, J., Goldstein, A. H., Guenther, A. B., Jimenez, J. L., Kuang, C., Laskin, A., Martin, S. T., Ng, N. L., Petaja, T., Pierce, J. R., Rasch, P. J., Roldin, P., Seinfeld, J. H., Shilling, J., Smith, J. N., Thornton, J. A., Volkamer, R., Wang, J., Worsnop, D. R., Zaveri, R. A., Zelenyuk, A., and Zhang, Q.: Recent advances in understanding secondary organic aerosol: implications for global climate forcing, Rev. Geophys., 55, 509–559, https://doi.org/10.1002/2016RG000540, 2017.
Stockwell, C. E., Yokelson, R. J., Kreidenweis, S. M., Robinson, A. L., DeMott, P. J., Sullivan, R. C., Reardon, J., Ryan, K. C., Griffith, D. W. T., and Stevens, L.: Trace gas emissions from combustion of peat, crop residue, domestic biofuels, grasses, and other fuels: configuration and Fourier transform infrared (FTIR) component of the fourth Fire Lab at Missoula Experiment (FLAME-4), Atmos. Chem. Phys., 14, 9727–9754, https://doi.org/10.5194/acp-14-9727-2014, 2014.
Stockwell, C. E., Veres, P. R., Williams, J., and Yokelson, R. J.: Characterization of biomass burning emissions from cooking fires, peat, crop residue, and other fuels with high-resolution proton-transfer-reaction time-of-flight mass spectrometry, Atmos. Chem. Phys., 15, 845–865, https://doi.org/10.5194/acp-15-845-2015, 2015.
Stockwell, C. E., Kupc, A., Witkowski, B., Talukdar, R. K., Liu, Y., Selimovic, V., Zarzana, K. J., Sekimoto, K., Warneke, C., Washenfelder, R. A., Yokelson, R. J., Middlebrook, A. M., and Roberts, J. M.: Characterization of a catalyst-based total nitrogen and carbon conversion technique to calibrate particle mass measurement instrumentation, Atmos. Meas. Tech. Discuss., https://doi.org/10.5194/amt-2017-419, in review, 2018.
Stönner, C., Derstroff, B., Klüpfel, T., Crowley, J. N., and Williams, J.: Glyoxal measurement with a proton transfer reaction time of flight mass spectrometer (PTR-TOF-MS): characterization and calibration, J. Mass Spectrom., 52, 30–35, https://doi.org/10.1002/jms.3893, 2017.
Veres, P., Gilman, J. B., Roberts, J. M., Kuster, W. C., Warneke, C., Burling, I. R., and de Gouw, J.: Development and validation of a portable gas phase standard generation and calibration system for volatile organic compounds, Atmos. Meas. Tech., 3, 683–691, https://doi.org/10.5194/amt-3-683-2010, 2010.
Veres, P., Roberts, J. M., Burling, I. R., Warneke, C., de Gouw, J., and Yokelson, R. J.: Measurements of gas-phase inorganic and organic acids from biomass fires by negative-ion proton-transfer chemical-ionization mass spectrometry, J. Geophys. Res., 115, D23302, https://doi.org/10.1029/2010jd014033, 2010b.
Warneke, C., de Gouw, J. A., Kuster, W. C., Goldan, P. D., and Fall, R.: Validation of atmospheric VOC measurements by proton-transfer-reaction mass spectrometry using a gas-chromatographic preseparation method, Environ. Sci. Technol., 37, 2494–2501, https://doi.org/10.1021/es026266i, 2003.
Warneke, C., Roberts, J. M., Veres, P., Gilman, J., Kuster, W. C., Burling, I., Yokelson, R., and de Gouw, J. A.: VOC identification and inter-comparison from laboratory biomass burning using PTR-MS and PIT-MS, Int. J. Mass Spectrom., 303, 6–14, https://doi.org/10.1016/j.ijms.2010.12.002, 2011.
Wiedinmyer, C., Akagi, S. K., Yokelson, R. J., Emmons, L. K., Al-Saadi, J. A., Orlando, J. J., and Soja, A. J.: The Fire INventory from NCAR (FINN): a high resolution global model to estimate the emissions from open burning, Geosci. Model Dev., 4, 625–641, https://doi.org/10.5194/gmd-4-625-2011, 2011.
Yaws, C. L.: The Yaws Handbook of Vapor Pressure: Antoine Coefficients, Elsevier Science, 2015.
Yee, L. D., Kautzman, K. E., Loza, C. L., Schilling, K. A., Coggon, M. M., Chhabra, P. S., Chan, M. N., Chan, A. W. H., Hersey, S. P., Crounse, J. D., Wennberg, P. O., Flagan, R. C., and Seinfeld, J. H.: Secondary organic aerosol formation from biomass burning intermediates: phenol and methoxyphenols, Atmos. Chem. Phys., 13, 8019–8043, https://doi.org/10.5194/acp-13-8019-2013, 2013.
Yokelson, R. J., Griffith, D. W. T., and Ward, D. E.: Open-path Fourier transform infrared studies of large-scale laboratory biomass fires, J. Geophys. Res., 101, 21067, https://doi.org/10.1029/96jd01800, 1996.
Yokelson, R. J., Crounse, J. D., DeCarlo, P. F., Karl, T., Urbanski, S., Atlas, E., Campos, T., Shinozuka, Y., Kapustin, V., Clarke, A. D., Weinheimer, A., Knapp, D. J., Montzka, D. D., Holloway, J., Weibring, P., Flocke, F., Zheng, W., Toohey, D., Wennberg, P. O., Wiedinmyer, C., Mauldin, L., Fried, A., Richter, D., Walega, J., Jimenez, J. L., Adachi, K., Buseck, P. R., Hall, S. R., and Shetter, R.: Emissions from biomass burning in the Yucatan, Atmos. Chem. Phys., 9, 5785–5812, https://doi.org/10.5194/acp-9-5785-2009, 2009.
Yokelson, R. J., Burling, I. R., Gilman, J. B., Warneke, C., Stockwell, C. E., de Gouw, J., Akagi, S. K., Urbanski, S. P., Veres, P., Roberts, J. M., Kuster, W. C., Reardon, J., Griffith, D. W. T., Johnson, T. J., Hosseini, S., Miller, J. W., Cocker III, D. R., Jung, H., and Weise, D. R.: Coupling field and laboratory measurements to estimate the emission factors of identified and unidentified trace gases for prescribed fires, Atmos. Chem. Phys., 13, 89–116, https://doi.org/10.5194/acp-13-89-2013, 2013.
Yuan, B., Warneke, C., Shao, M., and de Gouw, J. A.: Interpretation of volatile organic compound measurements by proton-transfer-reaction mass spectrometry over the deepwater horizon oil spill, Int. J. Mass Spectrom., 358, 43–48, https://doi.org/10.1016/j.ijms.2013.11.006, 2014.
Yuan, B., Koss, A., Warneke, C., Gilman, J. B., Lerner, B. M., Stark, H., and de Gouw, J. A.: A high-resolution time-of-flight chemical ionization mass spectrometer utilizing hydronium ions (H3O+ ToF-CIMS) for measurements of volatile organic compounds in the atmosphere, Atmos. Meas. Tech., 9, 2735–2752, https://doi.org/10.5194/amt-9-2735-2016, 2016.
Yuan, B., Koss, A. R., Warneke, C., Coggon, M., Sekimoto, K., and de Gouw, J. A.: Proton-Transfer-Reaction Mass Spectrometry, Applications in Atmospheric Sciences, Chem. Rev., 117, 13187–13229, doi:10.1021/acs.chemrev.7b00325, 2017.
Zhang, X., Yang, W., and Blasiak, W.: Thermal decomposition mechanism of levoglucosan during cellulose pyrolysis, J. Anal. Appl. Pyrol., 96, 110–119, https://doi.org/10.1016/j.jaap.2012.03.012, 2012.