the Creative Commons Attribution 4.0 License.
the Creative Commons Attribution 4.0 License.
 | 28 Feb 2018
α-Pinene secondary organic aerosol at low temperature: chemical composition and implications for particle viscosity
Wei Huang
Harald Saathoff
Aki Pajunoja
Xiaoli Shen
Karl-Heinz Naumann
Robert Wagner
Annele Virtanen
Thomas Leisner
Chemical composition, size distributions, and degree of oligomerization of secondary organic aerosol (SOA) from α-pinene (C10H16) ozonolysis were investigated for low-temperature conditions (223 K). Two types of experiments were performed using two simulation chambers at the Karlsruhe Institute of Technology: the Aerosol Preparation and Characterization (APC) chamber, and the Aerosol Interaction and Dynamics in the Atmosphere (AIDA) chamber. Experiment type 1 simulated SOA formation at upper tropospheric conditions: SOA was generated in the AIDA chamber directly at 223 K at 61 % relative humidity (RH; experiment termed “cold humid”, CH) and for comparison at 6 % RH (experiment termed “cold dry”, CD) conditions. Experiment type 2 simulated SOA uplifting: SOA was formed in the APC chamber at room temperature (296 K) and < 1 % RH (experiment termed “warm dry”, WD) or 21 % RH (experiment termed “warm humid”, WH) conditions, and then partially transferred to the AIDA chamber kept at 223 K, and 61 % RH (WDtoCH) or 30 % RH (WHtoCH), respectively. Precursor concentrations varied between 0.7 and 2.2 ppm α-pinene, and between 2.3 and 1.8 ppm ozone for type 1 and type 2 experiments, respectively. Among other instrumentation, a chemical ionization mass spectrometer (CIMS) coupled to a filter inlet for gases and aerosols (FIGAERO), deploying I− as reagent ion, was used for SOA chemical composition analysis.
For type 1 experiments with lower α-pinene concentrations and cold SOA formation temperature (223 K), smaller particles of 100–300 nm vacuum aerodynamic diameter (dva) and higher mass fractions (> 40 %) of adducts (molecules with more than 10 carbon atoms) of α-pinene oxidation products were observed. For type 2 experiments with higher α-pinene concentrations and warm SOA formation temperature (296 K), larger particles (∼ 500 nm dva) with smaller mass fractions of adducts (< 35 %) were produced.
We also observed differences (up to 20 ∘C) in maximum desorption temperature (Tmax) of individual compounds desorbing from the particles deposited on the FIGAERO Teflon filter for different experiments, indicating that Tmax is not purely a function of a compound's vapor pressure or volatility, but is also influenced by diffusion limitations within the particles (particle viscosity), interactions between particles deposited on the filter (particle matrix), and/or particle mass on the filter. Highest Tmax were observed for SOA under dry conditions and with higher adduct mass fraction; lowest Tmax were observed for SOA under humid conditions and with lower adduct mass fraction. The observations indicate that particle viscosity may be influenced by intra- and inter-molecular hydrogen bonding between oligomers, and particle water uptake, even under such low-temperature conditions.
Our results suggest that particle physicochemical properties such as viscosity and oligomer content mutually influence each other, and that variation in Tmax of particle desorptions may have implications for particle viscosity and particle matrix effects. The differences in particle physicochemical properties observed between our different experiments demonstrate the importance of taking experimental conditions into consideration when interpreting data from laboratory studies or using them as input in climate models.
- Article
(7525 KB) - Full-text XML
-
Supplement
(1329 KB) - BibTeX
- EndNote


Atmospheric aerosols have adverse impacts on human health (Nel, 2005; Rückerl et al., 2011) and rank among the main drivers of anthropogenic climate change (IPCC, 2013). Organic compounds make up a large fraction (20–90 %) of submicron particulate mass (Zhang et al., 2007; Murphy et al., 2006; Jimenez et al., 2009; Ehn et al., 2014). Organic aerosol (OA) particles can be directly emitted into the atmosphere from sources such as fossil fuel combustion and forest fires (primary organic aerosol, POA), or be formed in the atmosphere from the oxidation of gas-phase precursors (secondary organic aerosol, SOA). Secondary organic aerosol dominates the global budget of OA (Shrivastava et al., 2015), and its gaseous precursors (volatile organic compounds, VOCs) can be of both biogenic and anthropogenic origin. In the atmosphere, VOCs are oxidized by the hydroxyl radical (OH), ozone (O3), or the nitrate radical (NO3) into semi-volatile, low-volatility, and/or extremely low-volatility organic compounds (SVOC, LVOC/ELVOC), which can partition into the particle phase and lead to the formation of SOA (Jimenez et al., 2009; Hallquist et al., 2009; Jokinen et al., 2015; Ehn et al., 2014). Due to the wealth of precursors and formation mechanisms in both the gas and particle phase, SOA is very complex and can contain thousands of compounds with a wide range of functionalities, volatilities, and other physicochemical properties (Hallquist et al., 2009; Nozière et al., 2015).
Global estimates indicate that biogenic VOC emissions (539 Tg C a−1) dominate over anthropogenic VOC emissions (16 Tg C a−1), and that the global SOA production from biogenic VOCs (22.9 Tg C a−1) outpaces that from anthropogenic VOCs (1.4 Tg C a−1) as well (Heald et al., 2008). An important class of biogenic VOCs is monoterpenes (C10H16), emitted in substantial amounts (43 Tg C a−1; Heald et al., 2008) by vegetation (e.g., many coniferous trees, notably pine). One of the most abundant monoterpenes is α-pinene (24.8 % mass contribution to global monoterpenes emissions; Kanakidou et al., 2005). Secondary organic aerosol from monoterpenes is very important in the boreal regions in summertime, and the fraction of total SOA mass from monoterpene oxidation products is estimated to be ∼ 15 % globally (Heald et al., 2008).
SOA formation from α-pinene has been studied extensively in smog chambers (e.g., Kristensen et al., 2016; Denjean et al., 2015; McVay et al., 2016), although studies covering a wide temperature range are rare (Saathoff et al., 2009; Donahue et al., 2012). The reactions of α-pinene with O3 as well as radicals OH and NO3 lead to a large suite of oxygenated reaction products including aldehydes, oxy-aldehydes, carboxylic acids, oxy-carboxylic acids, hydroxy-carboxylic acids, dicarboxylic acids, organic nitrates, etc. (Winterhalter et al., 2003; Kanakidou et al., 2005). Aerosol yields vary for the different oxidants, and the most important process with regard to aerosol mass formation from the oxidation of α-pinene is the reaction with O3 (Kanakidou et al., 2005).
The molecular formulae of organic species accounting for ∼ 58–72 % of SOA mass from α-pinene ozonolysis have been identified, and can largely be grouped into monomers (C8−10H12−16O3−6, oxidation products from one α-pinene molecule) and dimers (C14−19H24−28O5−9, oxidation products from two α-pinene molecules; Zhang et al., 2015). Major dimers of the α-pinene SOA system have been structurally elucidated as a cis-pinyl-diaterpenyl ester (C17H26O8; MW 358; Yasmeen et al., 2010) and a cis-pinyl-hydroxypinonyl ester (C19H28O7; MW 368; Müller et al., 2008). Autoxidation processes can form highly oxidized molecules (HOM; elemental oxygen-to-carbon ratios of 0.7–1.3; Ehn et al., 2012), monomers and dimers, which have been shown to play an important role in atmospheric new particle formation (Ehn et al., 2014). Less oxygenated dimers (e.g., esters and other accretion products), some of which have similarly low volatility as HOM, and for many of which formation mechanisms are still not known, are major products in aerosol particles from α-pinene ozonolysis, and have been proposed to be key components in organic particle growth in field and laboratory (Kristensen et al., 2014, 2016; Tröstl et al., 2016; Zhang et al., 2015; Mohr et al., 2017).
SOA is highly dynamic and continually evolves in the atmosphere, becoming increasingly oxidized, less volatile, and more hygroscopic (Jimenez et al., 2009). As a consequence, SOA residence time in the atmosphere at different temperature (T) and relative humidity (RH) conditions strongly influences the particles' physicochemical properties such as phase state, and thus their effects on air quality and climate (Tsigaridis et al., 2006; Jimenez et al., 2009; Shiraiwa et al., 2017). Biogenic SOA has been shown to exist in phase states ranging from liquid to amorphous (semi-)solid in the atmosphere (Virtanen et al., 2010; Bateman et al., 2016; Shiraiwa et al., 2017). The phase state can affect gas uptake, gas–particle partitioning, diffusion, the particles' ability to act as cloud condensation nuclei (CCN) and/or ice nuclei (IN), and the particles' lifetime in the atmosphere (Shiraiwa et al., 2011; Price et al., 2015; Lienhard et al., 2015). Water diffusion coefficients in the water-soluble fraction of α-pinene SOA were measured for temperatures between 240 and 280 K. The results showed that water diffusion slowed down as temperature decreased, indicating increasing viscosity of SOA particles (Price et al., 2015). Diffusivity of organic molecules in SOA particles can show similar behavior, leading to large equilibration times under dry conditions (Shiraiwa et al., 2011) and/or cool conditions (Bastelberger et al., 2017). Observations of particle shape transformations (Järvinen et al., 2016), coalescence times (Pajunoja et al., 2014), and the particle bounce factor (BF; Virtanen et al., 2010; Pajunoja et al., 2015) are other parameters used to indicate the phase state and viscosity of particles. At dry conditions and at temperatures close to room temperature, the viscosity of α-pinene SOA is assumed to range from 105 to (higher than) 108 Pa s (Song et al., 2016; Renbaum-Wolff et al., 2013; Pajunoja et al., 2014), which corresponds to a semisolid state (Shiraiwa et al., 2011), whereas at an RH of about 90 % and room temperature its consistency is comparable to that of honey (∼ 10 Pa s: Renbaum-Wolff et al., 2013). Generally, SOA is more viscous in cool and dry conditions (shown, e.g., for α-pinene SOA at temperatures ranging from 235 to 295 K and RH ranging from 35 to 90 %; Song et al., 2016; Järvinen et al., 2016; Shiraiwa et al., 2011; Wang et al., 2015; Kidd et al., 2014).
Differences in α-pinene SOA chemical composition were observed for different SOA formation temperatures and RH conditions, such as lower oligomer content at higher RH (up to 87 %, Kidd et al., 2014) or lower temperature (285 K, Zhang et al., 2015). Given that the differences in physicochemical properties of SOA particles observed as a function of temperature and RH only cover part of the range of atmospheric values, it is of great importance for our understanding of SOA climate effects to expand the investigation of SOA evolution to atmospherically relevant conditions, especially at low temperature. More knowledge on SOA at temperature and RH conditions that are representative of the upper troposphere, where SOA particles can be transported to or formed in situ, is required in order to understand their potential importance for phase state, morphology, chemical composition, and thus ultimately SOA cloud formation potential (Zhang et al., 2015; Virtanen et al., 2010; Lienhard et al., 2015; Frege et al., 2018). However, such studies, particularly of SOA at low temperature, are still scarce.
In the present work, we investigate the chemical composition, size distributions, and degree of oligomerization of α-pinene SOA formed at four different conditions corresponding to temperatures of 223 and 296 K and RH between < 1 and 61 % in order to simulate SOA uplifting to and SOA formation in the upper troposphere. Samples for chemical ionization mass spectrometric analysis were taken from the Aerosol Interaction and Dynamics in the Atmosphere (AIDA) chamber at 223 K and collected on Teflon filters at two different times after starting the experiments. We discuss differences in these mass spectra and corresponding molecular desorption profiles when heating the filters from room temperature to 200 ∘C as well as possible implications for mutual interactions between particle chemical composition and viscosity.
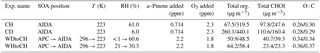
Table 1Experimental conditions and precursor concentrations for the four experiments discussed in this study: CH and CD (type 1); WDtoCH and WHtoCH (type 2). Total organic mass (Total org.), CHOI mass concentrations, and elemental oxygen to carbon (O : C) ratios are given for t0 and t1. RH values (with respect to water) from the APC chamber were measured at room temperature (296 K).
2.1 Environmental chambers and experimental design
The data for this study were acquired during a 2-month measurement campaign (SOA15) in October and November 2015 at environmental chambers of the Institute of Meteorology and Climate Research (IMK) at the Karlsruhe Institute of Technology (KIT). The measurement campaign investigated yields, physical properties, and chemical composition of SOA from α-pinene ozonolysis as a function of precursor concentration, temperature, RH, and the ice nucleation abilities of the SOA particles (Wagner et al., 2017). The focus on ice cloud formation allowed for the investigation of the particles' physicochemical properties at temperatures as low as 223 K (representative of conditions in the upper troposphere at 8–12 km altitude at the mid-latitudes), a range where detailed characterization is largely missing. Here, we discuss a subset (Table 1) of the large dataset of the SOA15 campaign that is based on experiments investigating the influence and mutual interaction of particle chemical composition and viscosity shortly after SOA formation and after a residence time of ∼ 3.5 h. Particles were formed at different temperatures (223–296 K) and RH (< 1–61 %) conditions using both environmental chambers available at IMK (see Fig. 1).

Figure 1Simple schematic and conditions for the two types of experiments (modified from Wagner et al., 2017). Both chambers at IMK (APC and AIDA) were used in this study. Instruments are annotated in green, blue, and orange, and precursor gases in red. More detailed information on the instruments and precursor gases are explained in the text.
The AIDA (Aerosol Interaction and Dynamics in the Atmosphere) aerosol and cloud chamber is an 84.3 m3 sized aluminum vessel. It can be operated in the temperature range of 183 to 333 K, pressure range of 1 to 1000 hPa, RH from close to 0 to 200 %, and at different warming and cooling rates (Schnaiter et al., 2016; Möhler et al., 2003; Saathoff et al., 2009).
The APC (Aerosol Preparation and Characterization) chamber (Möhler et al., 2008) is a 3.7 m3 sized stainless steel vessel, situated at a distance of 3 m from AIDA and connected to it with a 7 m stainless steel tube of 24 mm inner diameter. The APC chamber can only be operated at room temperature (296 K) and was used to prepare SOA particles in a reproducible manner (Wagner et al., 2017).
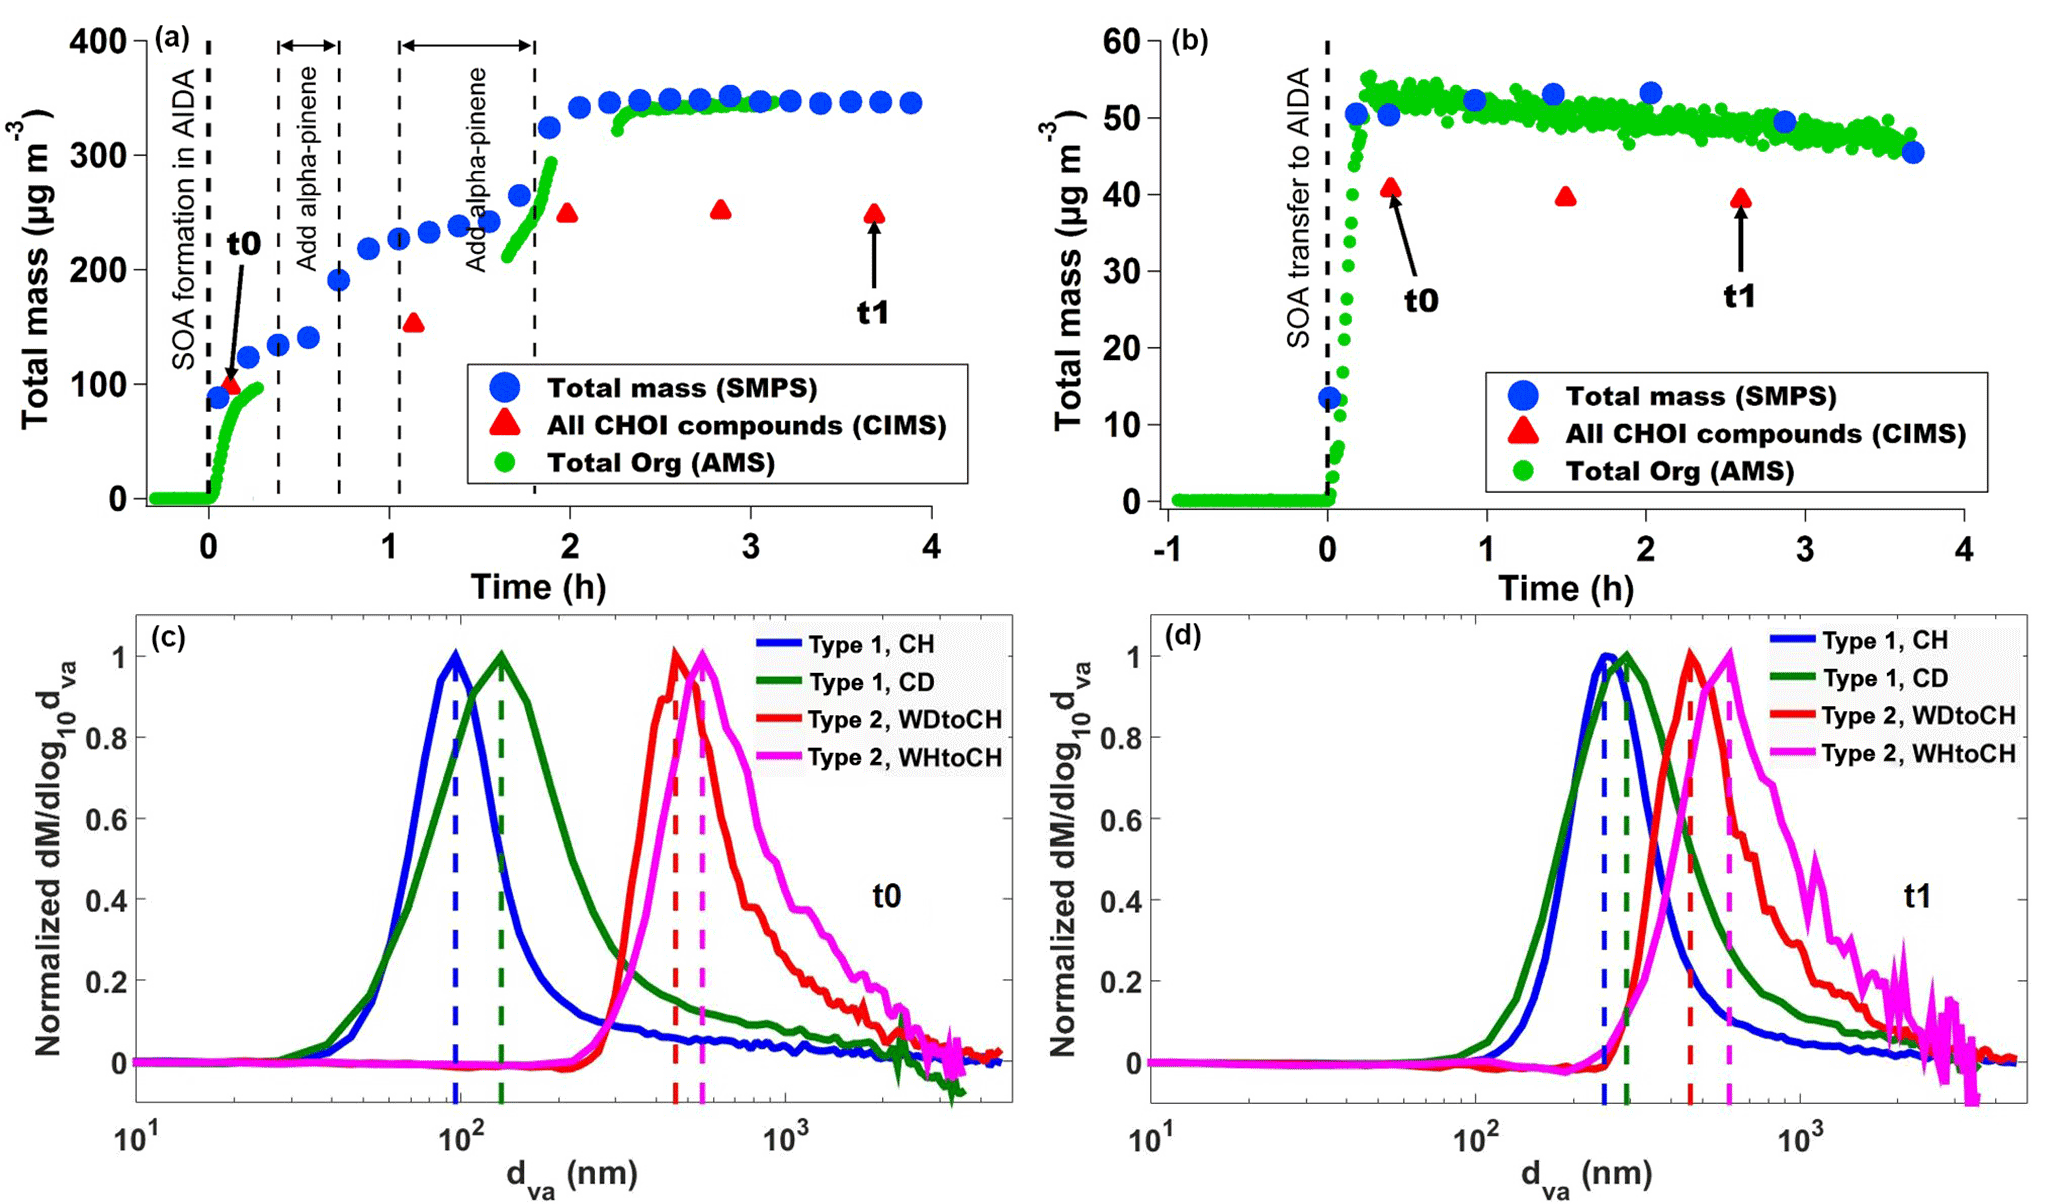
Figure 2(a) Particle mass concentrations derived from SMPS size distributions (blue circles), CHOI mass concentrations measured by CIMS (red triangles), and organic mass concentrations measured by AMS (green circles) representative of type 1 experiments (here CH), (b) representative of type 2 experiments (here WDtoCH). Data were not wall-loss-corrected. t0 and t1 indicate points in time used for comparisons in this study. Averaged size distributions measured by AMS at t0 (c) and (d) t1 for the four experiments.
We present two types of chamber experiments (Fig. 1): for the first type, SOA from α-pinene ozonolysis was directly formed at 223 K in the AIDA chamber. For the second type, SOA was first produced in the APC chamber kept at room temperature and then transferred to the AIDA chamber kept at 223 K. The second type of experiment thus represents a simplified simulation of particle formation in the boundary layer and subsequent uplifting of particles to higher altitudes with lower temperature conditions. We stress here that for both types of experiments, the particles were sampled from the cold AIDA chamber for chemical analysis. The detailed conditions for these two types of experiments are listed in Table 1. During the first type of chamber experiment, SOA was formed by reaction of an excess of O3 (initially 2.3 ppm generated by silent discharge in pure oxygen, Semozon 030.2 discharge generator, Sorbios GmbH) with α-pinene (initially 0.714 ppm, 99 %, Aldrich) in the dark AIDA chamber at 223 K at 61 % RH (experiment termed “cold humid”, CH) or 6 % RH (experiment termed “cold dry”, CD) conditions. For the second type of chamber experiment, SOA was first formed with an excess of O3 (initially 1.8 ppm) and 2.2 ppm α-pinene in the dark APC chamber at room temperature (296 K), < 1 % RH (experiment termed “warm dry”, WD) or 21 % RH (experiment termed “warm humid”, WH) conditions. After a residence time of 1–1.5 h in the APC chamber, its pressure was increased by 5 hPa compared to AIDA, and a fraction of the SOA particles was then transferred to the dark AIDA chamber kept at 223 K at 61 % RH (WDtoCH) or 30 % RH (WHtoCH), respectively, resulting in particle number concentrations ranging between 1500 and 2200 cm−3 in the AIDA chamber. No OH scavenger was used during SOA formation, and RH was kept constant in AIDA during the course of the experiments. The time series of total particle mass for experiment type 1 (particles formed in situ in AIDA, CH) and experiment type 2 (aerosols formed in APC and transferred to AIDA, WDtoCH) are shown in Fig. 2. The times t0 (right after SOA formation in CD and CH, or SOA transfer in WDtoCH and WHtoCH) and t1 (∼ 3.5 h later) indicate the points in experiment time which were used for the investigation of the physicochemical evolution of α-pinene SOA.
2.2 Temperature and relative humidity measurements
Temperature (T) in the AIDA chamber was measured by in-house thermocouples (NiCrNi) and in-house PT 100 temperature sensors with an accuracy of ±3 %, which are regularly calibrated with reference sensors traceable to standards of the National Institute of Standards and Technology (NIST). Under static conditions, gas temperature in the AIDA chamber deviated by less than 0.3 K in time and in space. Water vapor concentrations in the AIDA chamber were measured by a in-house tunable diode laser (TDL) spectrometer with an accuracy of ±5 % (Fahey et al., 2014; Skrotzki et al., 2013) and by a dew point mirror hygrometer (MBW373LX, MBW Calibration Ltd.) with an accuracy of ±1 % traceable to different national metrology standards including Federal Institution of Physical Technology (PTB), National Physical Laboratory (NPL), Federal Office of Metrology and Surveying (BEV) and NIST. Both instruments agree within ±2 %. RH in the AIDA chamber was calculated using the measured water vapor concentrations and temperature based on the saturation water vapor pressures given by Murphy and Koop (2005), resulting in an accuracy of ±5 %.
2.3 Particle and gas measurements
Number concentrations of SOA particles formed in APC or AIDA were recorded with two condensation particle counters (CPC3022, CPC3010; TSI Inc.) outside the temperature-controlled housing of the chambers via stainless steel tubes extending 35 cm into the AIDA chamber. The absolute uncertainty of the number concentrations is estimated to be ±20 % by comparison of the different CPCs with each other and with an electrometer (3068, TSI Inc.). Particle size distributions were sampled in the same way from both chambers with scanning mobility particle sizers (SMPS; differential mobility analyzer (DMA) 3071 connected to a CPC 3010, TSI Inc.). Mass concentrations were derived from integrated number size distributions and their conversions to mass using their corresponding calculated particle density (1.3–1.5 kg m−3). Particle densities were calculated using the ratio of vacuum aerodynamic diameter (dva) measured by a high-resolution time-of-flight aerosol mass spectrometer (HR-ToF-AMS, hereafter AMS; Aerodyne Research Inc.) and mobility diameter (dm) measured by the SMPS, assuming particle sphericity (shape factor = 1). O3 concentrations were measured by an O3 monitor (O3 41M, Environment S.A.). The AMS was connected to the AIDA chamber by a stainless steel tube of 1.35 m length (flow rate 0.1 L min−1, residence time 1.6 s). It was equipped with a high-pressure lens (HPL; Williams et al., 2013) and continuously measured total organic particle mass as a function of size (up to 2.5 µm particle dva) at a time resolution of 0.5 min. Elemental oxygen-to-carbon (O : C) and hydrogen-to-carbon (H : C) ratios were derived using the EALight_1_06 procedure in the AMS data analysis software package SQUIRREL (version 1.57H; Canagaratna et al., 2015). An AMS collection efficiency (CE) of 0.4–0.5 was used, except for the CH experiment where CE was 0.7, likely due to higher particle water content (Middlebrook et al., 2012). AMS mass concentrations compare well with the total mass derived from SMPS (slopes are between 0.87 and 1.04 except for the slope of 2.2 in the CD experiment, possibly due to the lower transmission efficiency in the aerodynamic lens of the AMS for sub-100 nm particles; Pearson's correlation coefficients are between 0.87 and 0.98 for the experiments presented here). Individual organic compounds in both the gas and particle phase were measured with a Filter Inlet for Gases and AEROsols coupled to a high-resolution time-of-flight chemical ionization mass spectrometer (FIGAERO-HR-ToF-CIMS, Aerodyne Research Inc., hereafter CIMS) deploying iodide ions (I−) as reagent ions (Lopez-Hilfiker et al., 2014; Lee et al., 2014). During the gas-phase measurement, gases were sampled via a fluorinated ethylene propylene (FEP) tube of 0.83 m length, while particles were simultaneously collected on a Teflon (Polytetrafluoroethylene, PTFE) filter via a separate sampling port (stainless steel tube of 0.66 m length, flow rate 5 L min−1, residence time 0.9 s). At regular intervals (5–20 min; see Table S1 in the Supplement), the gas-phase measurement was switched off and particles on the filter were desorbed by a flow of ultra-high-purity (99.999 %) nitrogen heated from room temperature to 200 ∘C over the course of 35 min. The resulting mass spectral signal evolutions as a function of desorption temperature are termed thermograms (Lopez-Hilfiker et al., 2014). Single-mode thermograms of a compound with signal maxima occurring at distinct desorption temperatures (Tmax), which correlate with the compound's enthalpy of sublimation, can be used to infer its saturation vapor pressure (Lopez-Hilfiker et al., 2015; Mohr et al., 2017). Multi-mode thermograms indicate contributions from isomers having different vapor pressures, or thermal fragmentation of larger molecules during the heating of the filter (Lopez-Hilfiker et al., 2015). Integration of thermograms of individual compounds yielded their total signal in counts per deposition, which were converted to mass concentrations using a sensitivity of 22 counts s−1 ppt−1 (collisional limit; Lopez-Hilfiker et al., 2016). For each experiment, backgrounds were determined by sampling from the AIDA chamber before adding any precursor gases. For type 2 experiments, backgrounds were negligible with initial particle number concentrations below 1 cm−3. For type 1 experiments, we observed a small increase in both gas mixing ratio and particle mass (< 0.01 µg m−3) after O3 addition, which was subtracted from the mass loadings presented here. However, the background and the increase induced by O3 addition were negligible compared to the increase by the SOA mass (> 1000-fold for particle mass).
All instruments were set up at room temperature, outside the temperature-controlled housing of AIDA. Despite inlet insulation with Armaflex, we calculated a theoretical temperature increase (Fitzer and Fritz, 1989) of ∼ 15 K for the particle inlet of the CIMS (the FIGAERO filter was thus presumably at 238 K during deposition), and cannot entirely rule out partial evaporation of water or semivolatile organic compounds, which is taken into account in our interpretation of results.
3.1 Organic particle mass and size distribution
Figure 2a–b show the time series of total particle mass derived from SMPS size distributions, total organic particle mass measured by AMS, and total mass of particulate oxygenated hydrocarbons (Cx>1Hy>1Oz>1 detected as clustered with I−, termed CHOI compounds) measured by CIMS for both types of experiments. Figure 2a depicts the CH experiment, representative of experiment type 1, where particles were directly formed in AIDA. Figure 2b shows experiment type 2, where aerosol was formed in the APC and transferred to AIDA (here the WDtoCH example; see Table 1). Note that the data were not wall-loss-corrected. Gaps in the AMS time series were due to filter measurements. To investigate the evolution of the SOA particles' physicochemical properties with time, we chose two points in time during the experiments, t0 and t1. t0 is the first FIGAERO filter deposition from AIDA after particle formation (experiment type 1) or particle transfer (experiment type 2), while t1 is approximately 3.5 h later. Averaged concentrations of total organics and total CHOI compounds, elemental O : C ratios at t0 and t1, and an overview of the experimental conditions including temperature (T), RH, and added precursor (α-pinene and O3) concentrations for all experiments discussed here (WDtoCH, WHtoCH, CH, and CD) are listed in Table 1. Particle size distributions measured by AMS for all four experiments at t0 and t1 are shown in Fig. 2c–d.
For SOA formed in AIDA (type 1 experiments), at t0 and t1, mean total organic mass concentrations and mean total concentrations of CHOI compounds were in the range of 67.5–440.1 µg m−3 and 97.8–247.6 µg m−3, respectively. When particles were transferred from the APC chamber (type 2 experiments), organic and CHOI mass concentrations in AIDA reached values of 48.5–64.2 µg m−3 and 23.3–40.7 µg m−3, respectively. We stress here that even though particle mass concentrations in AIDA were higher for the experiments of type 1 (particles formed at 223 K directly in AIDA), the α-pinene concentration for the type 2 experiments was higher by a factor of ∼ 3 (Fig. 2a–b and Table 1). This also led to larger particle sizes for the type 2 experiments. Due to additional α-pinene addition between t0 and t1 only for the CH experiment, we observed a step increase of total particle mass for this experiment (Fig. 2a).
The discrepancies between AMS and CIMS concentrations are likely due to the CIMS with I− as reagent ion being more sensitive to more polar oxygenated organic compounds (Lee et al., 2014), and thus only a potential subset of organic compounds are measured by CIMS. Evaporation losses of particulate compounds during filter deposition in the FIGAERO may play a minor role. In addition, by using the collisional limit for the CIMS data, we apply maximum sensitivity and thus present lower limits of CHOI compounds. The differences between the AMS- and SMPS-derived mass concentrations in Fig. 2a are likely due to the lower transmission of sub-100 nm particles in the aerodynamic lens of the AMS used here. The AMS measured lower concentrations than the SMPS at the beginning of the CH experiment (Fig. 2a), when the newly formed particles were much smaller (see Fig. 2c), compared to later in the experiment when they had grown in size (see Fig. 2d). For the WDtoCH experiment (Fig. 2b) with larger particles transferred from the APC to the AIDA chamber, AMS- and SMPS-derived mass concentrations agree very well. The slightly decreasing trend observed during both experiments was due to wall losses (Donahue et al., 2012).

Figure 3CIMS mass spectra (normalized to the sum of signal of all detected CHOI compounds) of experiments WDtoCH and CD (a), WHtoCH and CD (b), and CH and CD (c) at t0. Inserts show enlarged regions of dimers (left) and trimers (right).
3.2 Chemical characterization of SOA particles
3.2.1 Elemental oxygen-to-carbon ratios
Elemental O : C ratios were calculated using both AMS and CIMS data. The mean AMS O : C ratios for SOA formed in APC and AIDA were 0.34–0.36 and 0.26–0.30, respectively (Table 1). This is representative of O : C ratios for relatively fresh SOA measured in ambient studies (Mohr et al., 2012; Ge et al., 2012; Canagaratna et al., 2015). For CHOI compounds measured by CIMS, the calculated mean O : C ratios for SOA formed in APC and AIDA were 0.59–0.66 and 0.56–0.61, respectively. The AMS O : C ratio is expected to be lower than that of the CHOI compounds measured by iodide CIMS, as the latter is selective towards polar oxygenated compounds. The potential loss of semivolatiles from the filter during FIGAERO deposition may additionally increase the mass-averaged O : C ratio of compounds measured with this instrument. The O : C ratios of SOA formed in the APC were slightly higher than those formed in AIDA, likely a result of the difference in precursor concentrations and temperature and thus partitioning behavior of semivolatile SOA compounds during formation between the particles and chamber walls. We rule out a dilution effect when transferring particles from APC to AIDA since the dilution factor was orders of magnitude smaller than the decrease in saturation vapor pressure due to the temperature reduction from APC (296 K) to AIDA (223 K), and this was confirmed by the absence of a change in particle size after transfer. For all experiments, O : C ratios remained largely constant from t0 to t1.
3.2.2 CIMS mass spectra
Mass spectra of integrated desorptions from the CIMS are compared for the four experiments and two points in time, t0 and t1. Mass spectra shown were normalized to the sum of signal of all detected CHOI compounds. The corresponding mass loadings and sampling times (particle collection on filter) for the four experiments are listed in Table S1. Figure 3a, b, and c show a comparison of mass spectral patterns for the experiments WDtoCH and CD, for WHtoCH and CD, and for CH and CD, respectively, all at t0 (the same comparisons for t1 are to be found in Fig. S1). Overall, the mass spectral patterns across all experimental conditions and points in time were relatively similar. Monomers (CmHyOz compounds, m ≤ 10), dimers (CnHyOz compounds, ), and even trimers (CpHyOz compounds, ) clustered with I− were observed in the mass spectra at t0 and t1 for all occasions.
Monomers dominated the overall signal of detected compounds, with the largest signal at m∕z 327 (mainly C10H16O4I, likely hydroxy-pinonic acid clustered with I−). As we can see from Fig. 3, relatively higher contributions of monomers were measured at t0 for experiments WDtoCH and WHtoCH compared to CD. The difference in relative monomer contributions for experiments CH and CD was less distinct. At the same time, relatively larger contributions from dimers and trimers (inserts in Fig. 3) were observed for the experiment CD (and to a lesser extent for the CH). This was also the case for t1 (Fig. S1).
Figure 4 shows the relative mass contributions of monomers and adducts (this definition includes dimers, trimers, and oligomers in general) for the four experiments at both time points. As already observed in the mass spectral patterns, larger relative mass contributions from monomers were measured for the type 2 experiments (WDtoCH, WHtoCH), and larger relative mass contributions from adducts for the type 1 experiments (CH, CD). There was no significant change for the relative contributions and absolute concentrations of adducts (Fig. S2) between t0 and t1 for type 2 experiments (WDtoCH, WHtoCH). For type 1 experiments (CH and CD), absolute concentrations of monomers and adducts (Fig. S2) increased from t0 to t1 due to the addition of α-pinene after t0 and hence the continuing production of oxidation products and particle mass (compare to Fig. 2). However, the relative contributions of monomers for type 1 experiments increased from t0 to t1, which may be partially influenced by smaller FIGAERO sampling time and thus less evaporation losses of semivolatiles at t1 (see Table S1 and Supplement), but mostly by increased condensation of semivolatiles or lower-molecular-weight products with increasing particle size (compare Fig. 2c–d).
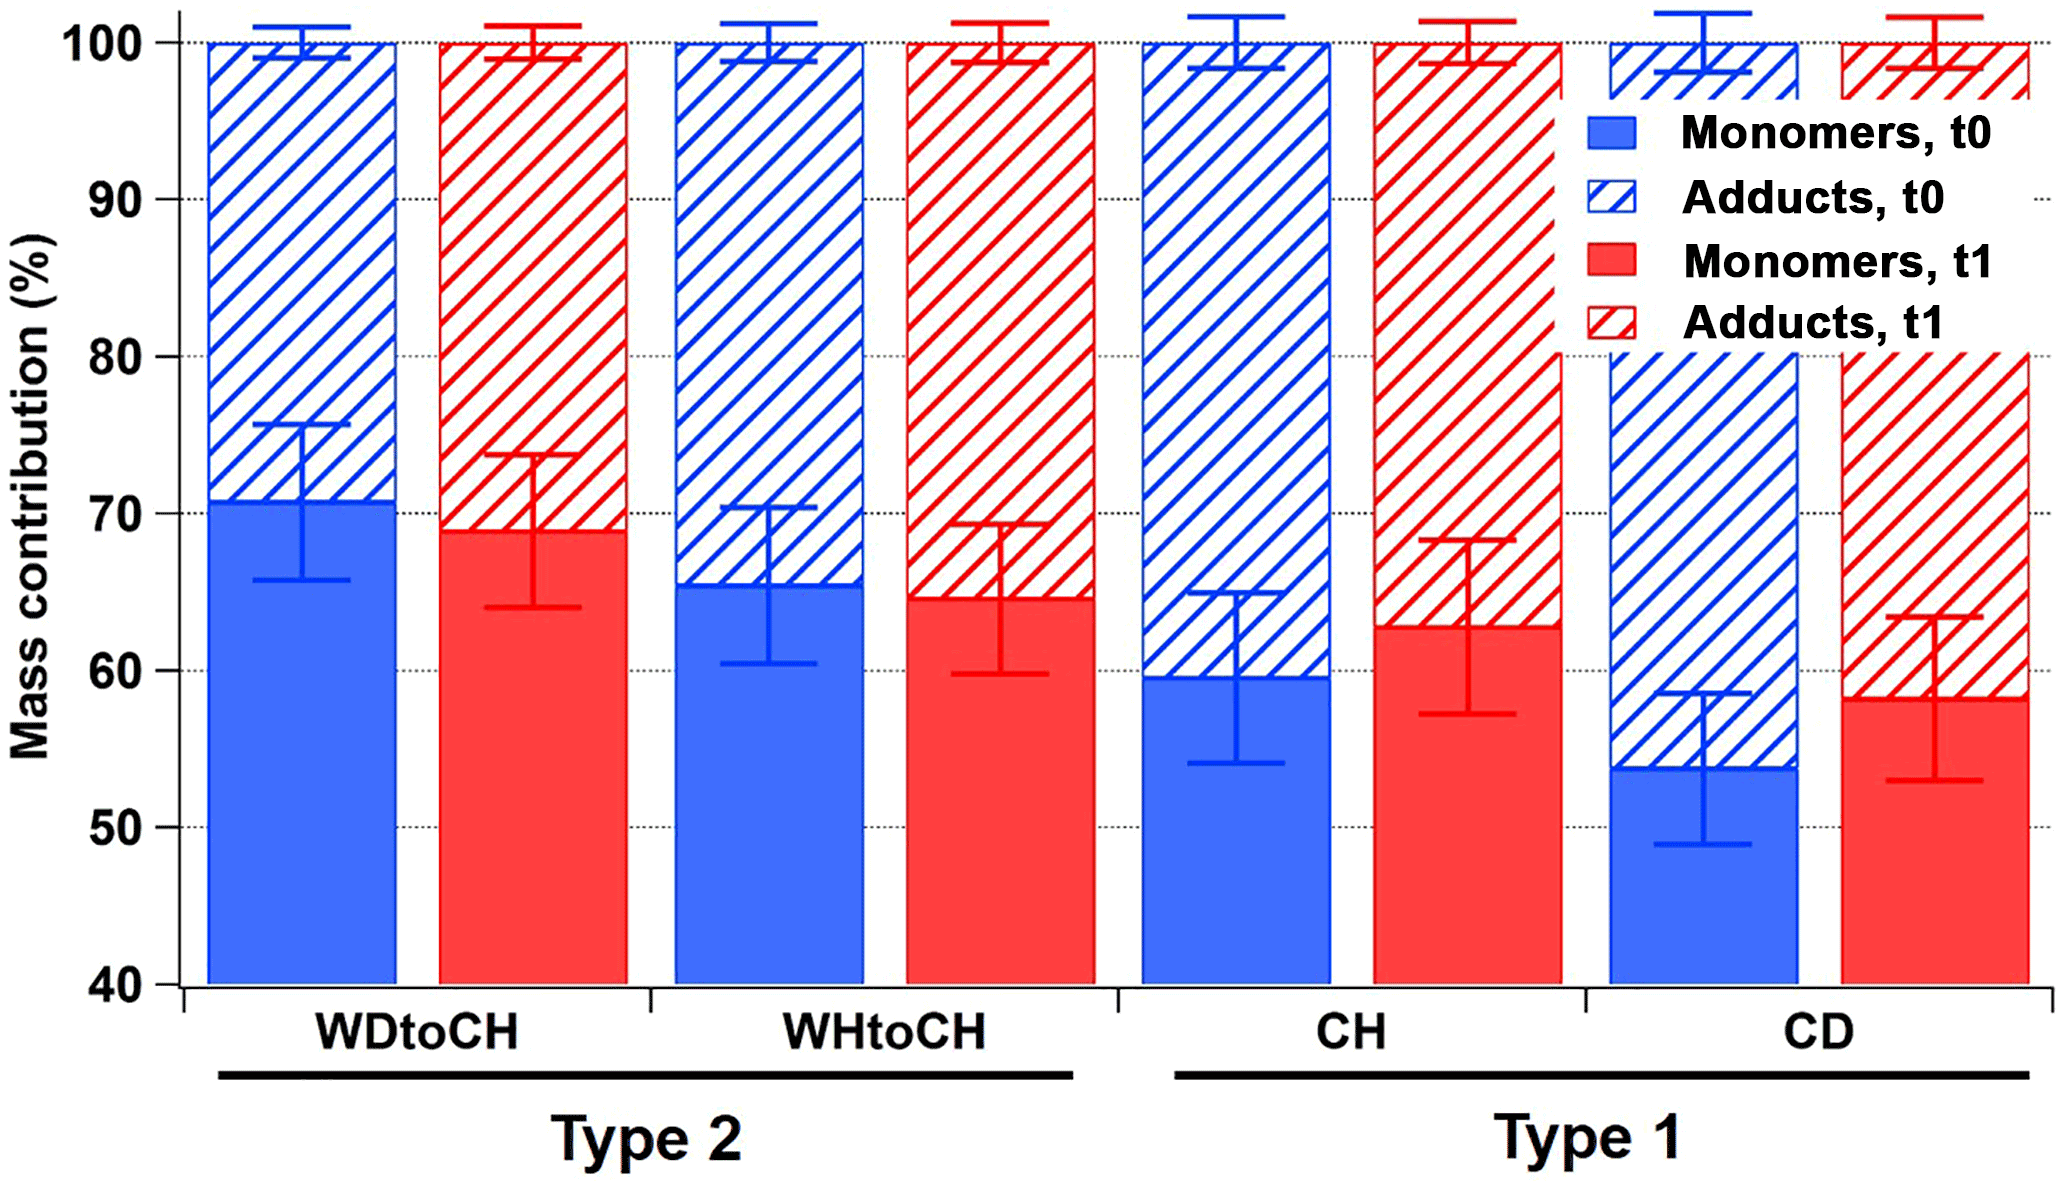
Figure 4Relative mass contributions of monomers and adducts with error bars at t0 (blue) and t1 (red).
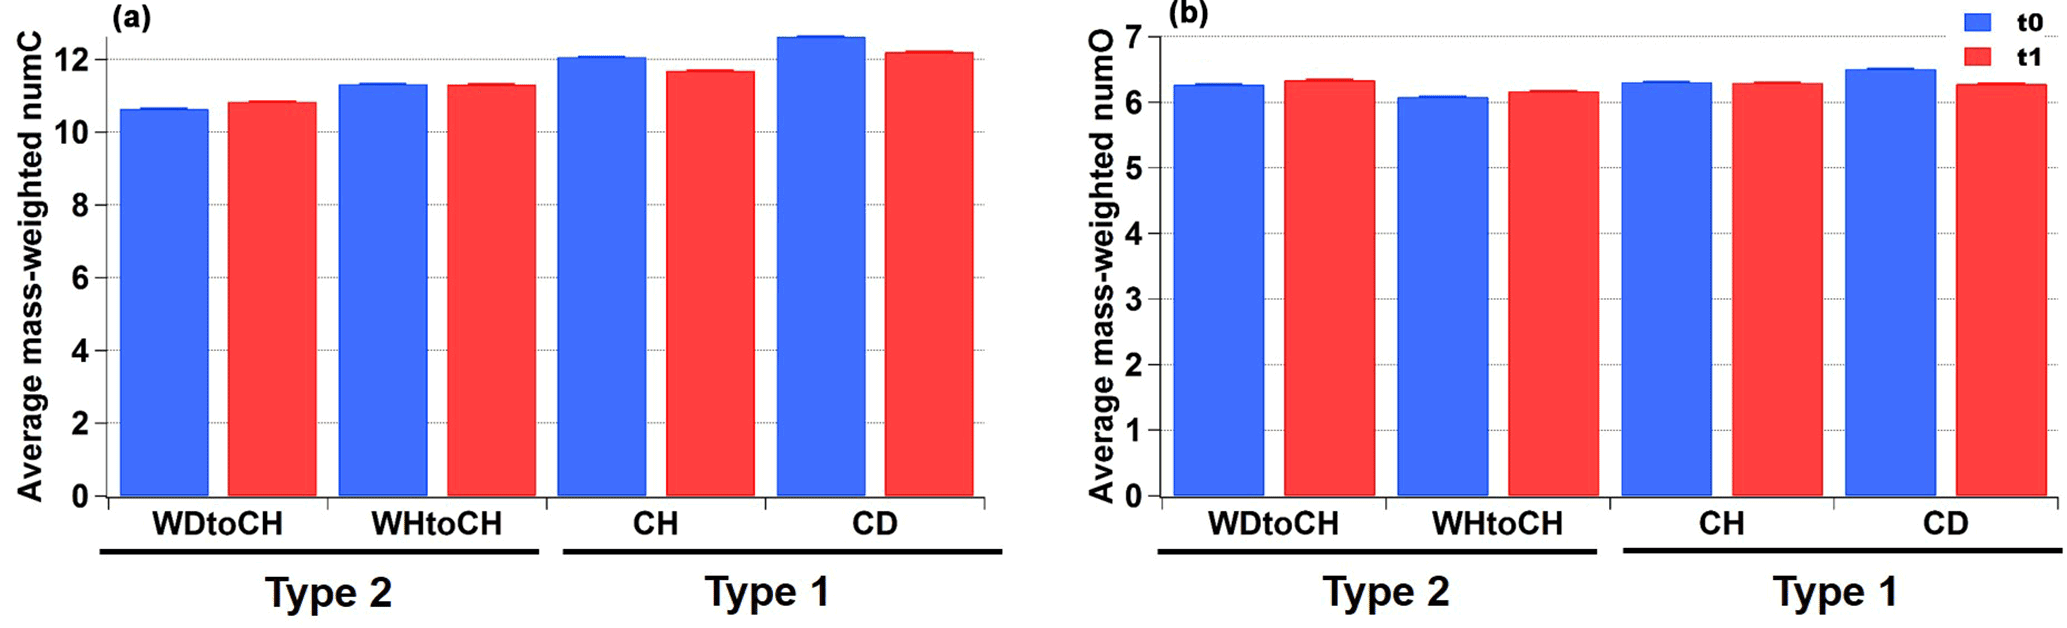
Figure 5(a) Average mass-weighted number of carbon atoms (numC) and (b) oxygen atoms (numO) with error bars at t0 (blue) and t1 (red).
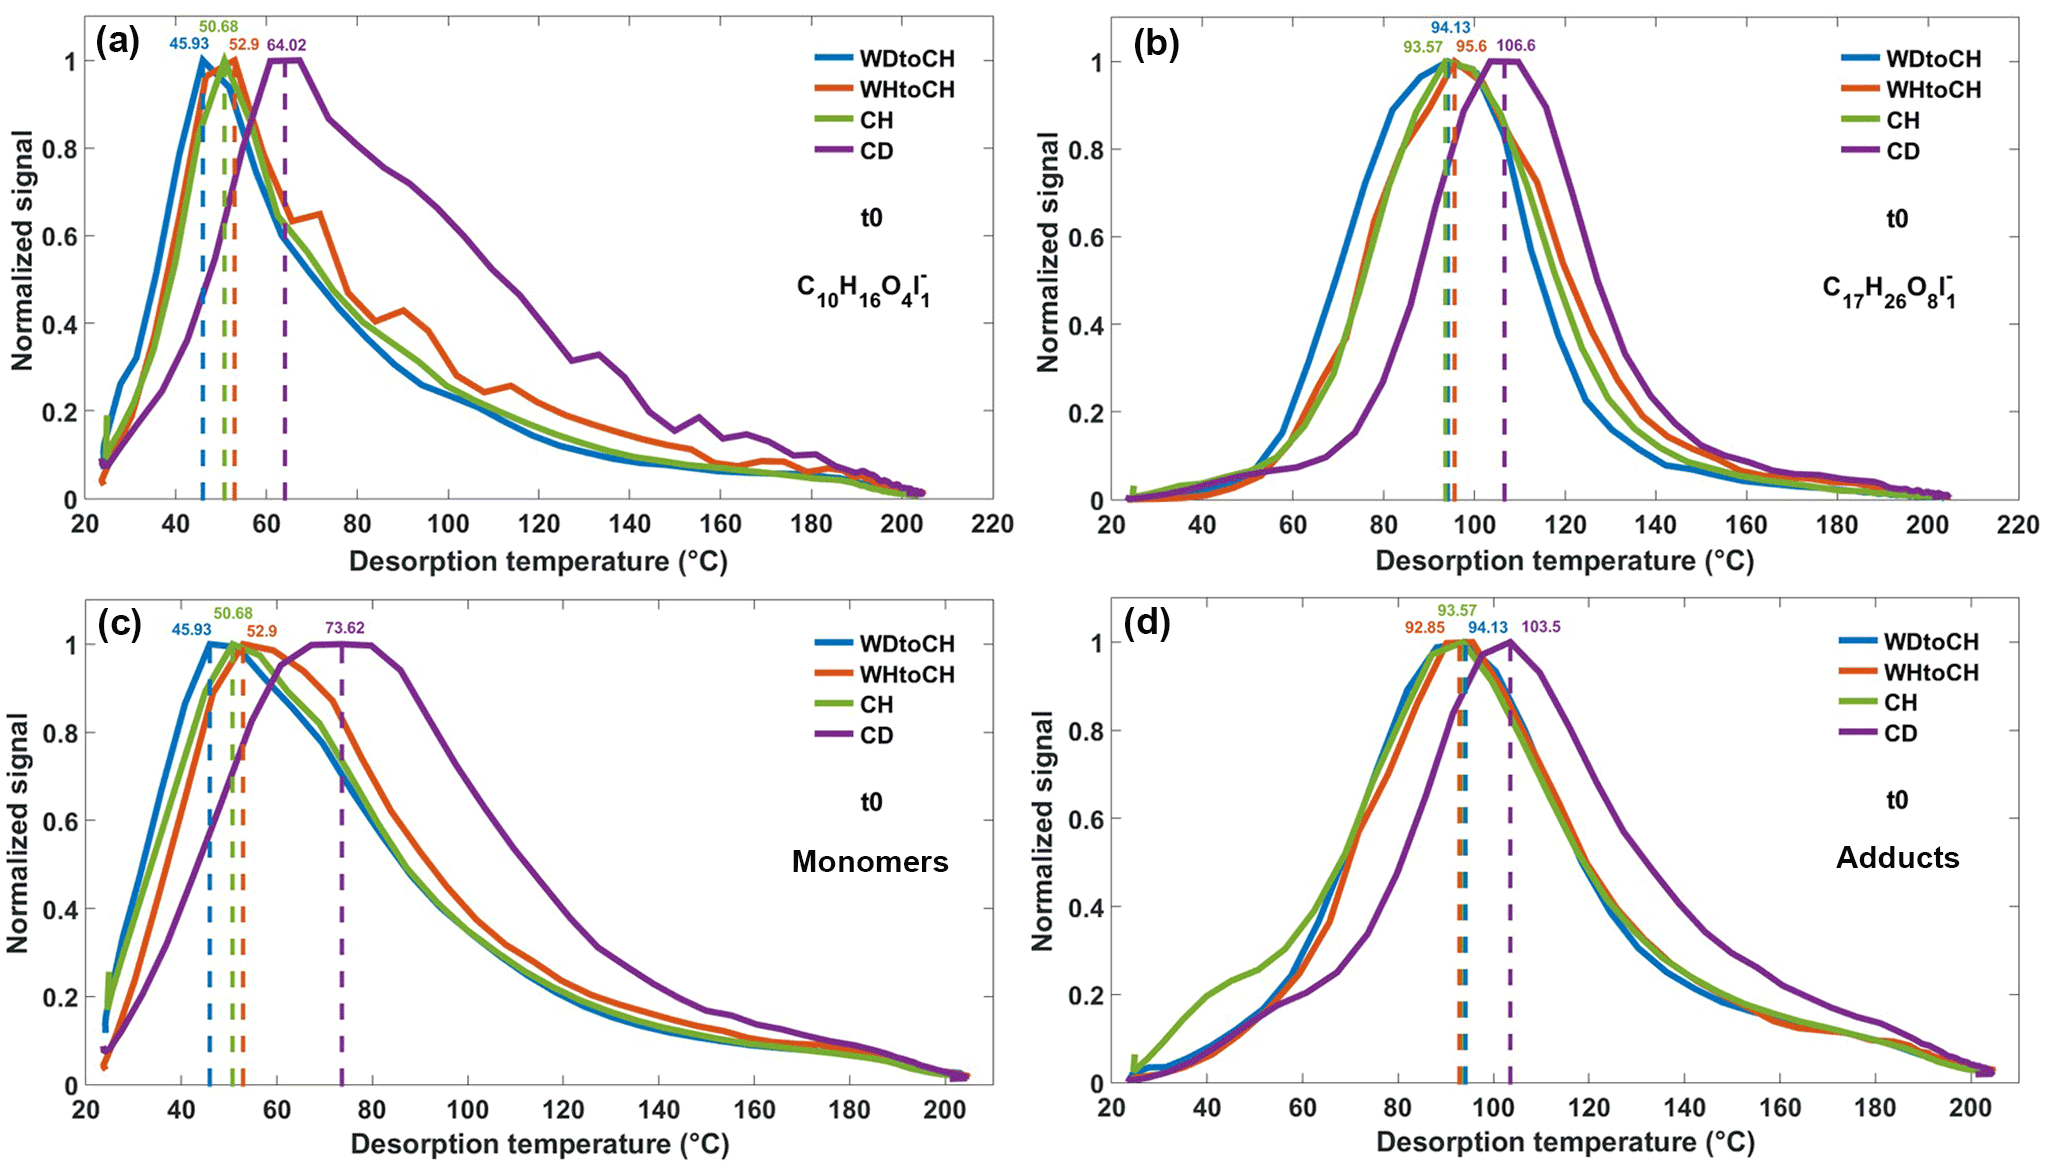
Figure 6Thermograms of monomer C10H16O4 (a) and adduct C17H26O8 (b), both clustered with I− at t0, and sum thermograms of monomers (c) and adducts (d) at t0. Dashed lines refer to the corresponding Tmax.
Figure 5 shows the average mass-weighted number of carbon atoms (numC) and oxygen atoms (numO) for CHOI compounds for the four experiments at t0 and t1. The corresponding average mass-weighted compounds' formulae for SOA generated in APC and AIDA were C10−12HyO6−7 and C11−13HyO6−7, respectively. Slightly bigger numC were observed for type 1 experiments (CH, CD) than type 2 experiments, with the largest value for experiment CD, followed by CH and WHtoCH. numC was smallest for WDtoCH. There was no obvious trend for numO.
In summary, smaller particles with slightly lower O : C ratios, bigger carbon numbers, and relatively more mass from adducts were observed for type 1 experiments (CH, CD), which had lower α-pinene concentrations and colder formation temperature (223 K) compared to the type 2 experiments. For type 2 experiments (WDtoCH, WHtoCH), higher α-pinene concentrations (by a factor of ∼ 3) and warmer formation temperature (296 K) produced larger particles with slightly higher O : C ratios, smaller carbon numbers, and relatively more mass from monomers. The slightly higher O : C ratio in type 2 experiments is thus not due to bigger oxygen numbers, but due to smaller carbon numbers (Fig. 5), indicating that relatively more small oxygenated molecules were formed for type 2 experiments. This is likely due to higher α-pinene concentrations and faster oxidation at 296 K leading to rapid condensation of monomers, providing enough gaseous oxidation products for the equilibrium of semivolatiles to be shifted into the particle phase. Type 1 experiments, on the other hand, were performed with lower α-pinene concentrations, and particles were formed in situ, favoring higher contributions of larger ELVOC/LVOC compounds, especially at the early stages of particle growth (Tröstl et al., 2016). At the same time, the low-temperature conditions may also have shifted equilibrium to the particle phase and led to condensation of compounds with a relatively lower degree of oxygenation (compared to warm temperature conditions). Overall, the differences observed in mass spectral patterns between the two types of experiments are a consequence of both temperature and precursor concentration differences. They underline the importance of experiment conditions when interpreting laboratory data or using them for modeling.
3.3 Thermograms: variation in Tmax of SOA compounds for different experiments
In addition to information on mass spectral patterns and mass loadings when peaks are integrated, the FIGAERO also provides signal curves as a function of desorption temperature (referred to as thermograms). Although Tmax can be used to infer the compound's saturation vapor pressure (Lopez-Hilfiker et al., 2015; Mohr et al., 2017), evaporative behavior and inferred volatility of a particle-bound compound are also influenced by the particles' physical phase state, particle-phase diffusivity, and viscosity (Yli-Juuti et al., 2017). Here we show that thermograms may also be used for qualitative information on particle viscosity.

Figure 7Tmax distribution for individual CHOI compounds of WDtoCH (a) and CD (b) experiments at t0 according to number of oxygen atoms (numO) vs. number of carbon atoms (numC). Dashed boxes specify the compounds with nominal molecular formulae C5−10HyO1−10I− and C15−25HyO11−20I− that had bigger Tmax differences.
Thermograms resulting from the thermal desorption of deposited SOA particles from the four experiments CH, CD, WDtoCH, and WHtoCH at both time points t0 and t1 were analyzed. Examples of the thermograms of a monomer (C10H16O4, molecular formula corresponding to hydroxy-pinonic acid identified by Zhang et al., 2017) and an adduct (C17H26O8, molecular structure identified in SOA from α-pinene ozonolysis as a cis-pinyl-diaterpenyl ester by Yasmeen et al., 2010; molecular formula identified in SOA from α-pinene ozonolysis by, e.g., Zhang et al., 2015; Mohr et al., 2017), both clustered with I− at t0 are shown in Fig. 6a–b. Figure 6c shows the sum of thermograms of all monomers, Fig. 6d shows the sum of all adduct thermograms at t0. The same plots for t1 can be found in Fig. S3. Thermograms and sums of thermograms were normalized to their maximum values. The corresponding mass loadings and sampling times (particle collection on filter) for the four experiments are listed in Table S1. For experiment CD, the C10H16O4I thermograms exhibited a multi-modal shape, indicative of contributions from isomers having different vapor pressures, or thermal decomposition of larger molecules. Different isomeric hydroxypinonic acids were found in α-pinene SOA (Zhang et al., 2017) and the decomposition of cis-pinyl-hydroxypinonyl diester could have a residue of cis-pinic acid and 7-hydroxypinonic acid (Müller et al., 2008). Based on previous FIGAERO data analyses (Lopez-Hilfiker et al., 2015; D'Ambro et al., 2017; Wang et al., 2016), we can safely presume that the first mode corresponds to the monomer.
Figure 6a–b show that Tmax of an individual compound varied by up to 20 ∘C, depending on experimental conditions. It has been shown earlier that thermograms and corresponding Tmax are highly reproducible for stable conditions (Lopez-Hilfiker et al., 2014). In our instrument, Tmax varied by 2 ∘C at most for the monomer, C10H16O4, and for another adduct, C16H24O6 (molecular formula identified in SOA from α-pinene ozonolysis by, e.g., Zhang et al., 2015) both clustered with I−, for six subsequent thermograms under stable conditions (Fig. S4). The variation in Tmax as a function of experiment types observed here thus indicates that the shape of a thermogram for a given compound and given FIGAERO configuration is not only defined by the compound's enthalpy of evaporation. For both C10H16O4I and C17H26O8I thermograms, Tmax was highest for experiment CD, followed by WHtoCH, CH, and WDtoCH. Similar trends were observed for all compounds measured by the CIMS, as shown by the sums of thermograms of all monomer compounds (Fig. 6c), and by the sums of thermograms of all adduct compounds (Fig. 6d). Sum Tmax of monomers and adducts varied from 46 ∘C (experiment WDtoCH) to 74 ∘C (experiment CH) to 93 ∘C (experiment WHtoCH) to 104 ∘C (experiment CD).
Variation in Tmax of the sum of CHOI compounds was larger for monomers (Fig. 6c) than for adducts (Fig. 6d). Monomers are thus the more important contributors to the shifts in Tmax, likely because at the higher temperatures where adducts desorb, particle matrix effects may become less important. Since the sum of thermograms and its Tmax is highly influenced by compounds with large signal, we also show a box and whisker diagram of Tmax for monomers and adducts (Fig. S5). The median Tmax values showed similar variation as the Tmax values based on thermogram sums. Examples of the Tmax distribution of individual CHOI compounds in numO vs. numC space at t0 are shown in Fig. 7 for the WDtoCH and CD experiments. Points were color-coded by Tmax. Compounds with nominal molecular formula C8−10HyO4−6I− were the main contributors to mass concentrations (data not shown), and thus also aggregated Tmax values. Generally, Tmax for CHOI compounds ranged from 25 to 165 ∘C, and increased with carbon numbers and oxygen numbers of compounds, as is to be expected given the relationship between enthalpy of evaporation and volatility of a compound (Lopez-Hilfiker et al., 2015; Mohr et al., 2017). The comparison between WDtoCH (Fig. 7a) and CD (Fig. 7b) experiments, however, showed differences in Tmax values for most compounds. Tmax values, especially of many compounds with nominal molecular formulae C5−10HyO1−10I− and C15−25HyO11−20I−, were higher for the CD experiment. The similar behavior in the variation of Tmax of most compounds measured by CIMS indicates that Tmax is not purely a function of a compound's vapor pressure or volatility, but is influenced by diffusion limitations within particles (particle viscosity; Vaden et al., 2011; Yli-Juuti et al., 2017), interactions between particles deposited on the filter (particle matrix), and/or particle mass on the filter. In the following we will discuss these implications in more detail.
Mass transport limitations within SOA particles, often measured or modeled as evaporation rates of specific compounds (Yli-Juuti et al., 2017; Wilson et al., 2015; Roldin et al., 2014), have been related to the particle viscosity (Vaden et al., 2011; Yli-Juuti et al., 2017). Particle viscosity is highly influenced by temperature and RH (Shiraiwa et al., 2017; Kidd et al., 2014), with higher viscosities at cool and/or dry conditions (Shiraiwa et al., 2011). Since the temperature was 223 K in AIDA for all experiments discussed here, the observed differences in Tmax, and presumed viscosity, cannot be directly explained by differences in temperature. In addition, during desorption of compounds with the FIGAERO, particles are actively heated (with heat transfer assumed to be immediate), and are not evaporating under equilibrium conditions. Presumed variations in particle viscosity based on observed variations in Tmax must therefore be due to variations in particle chemical composition, and/or RH differences.
The biggest Tmax difference in Fig. 6 was between WDtoCH and CD experiments, which was in accordance with the largest differences in mass spectra as discussed above (see Figs. 3a and 4). This is indicative of a relationship between Tmax in the thermograms and particle chemical composition. It has been shown earlier that the chemical properties of particulate compounds influence particle viscosity (Kidd et al., 2014; Hosny et al., 2016). Viscosity is expected to be higher with higher oligomer content, due to inter-component hydrogen bonding, especially at low RH (Kidd et al., 2014). This is in accordance with our results, which showed highest Tmax values for the CD experiment, which also had the highest contribution from adducts.
RH is an additional parameter that greatly influences particle viscosity (Kidd et al., 2014; Hosny et al., 2016; Renbaum-Wolff et al., 2013). Despite the fact that the SOA particles might be dried very quickly by the dry heated nitrogen during particle desorption, we suppose that RH might have a “memory effect” and still influence Tmax. RH conditions during the four experiments presented here ranged from 6 % (CD) to 30 % (WHtoCH) to 61 % (WDtoCH and CH). Note that these were the conditions of the measurement time in the AIDA chamber; for WDtoCH and WHtoCH, the RH conditions during SOA formation in the APC chamber were 1 and 21 %, respectively. We thus need to differentiate between RHformation and RHmeasurement. As shown in Fig. 8, there was no trend between RHformation and Tmax, indicating that the RH during particle formation did not play an important role in the observed viscosity variation. However, we observed a negative correlation of RHmeasurement and Tmax of all monomer compounds at t0, indicating that even under low-temperature conditions of 223 K there is particle water uptake, and an influence of RH on viscosity. Particle water uptake thus seems to influence particle viscosity even at such low temperature and on such short timescales (few hours). To what extent RH and particle water uptake, or chemical properties and adduct content, and their respective influence on water uptake via increased hygroscopicity, contribute to the observed differences in Tmax and presumed viscosity, we can only speculate. In the CH and WDtoCH experiments, RHmeasurement was ∼ 60 % for both. The adduct mass fraction was only slightly higher for SOA in the CH experiment, and so was Tmax and thus potentially particle viscosity. More controlled studies at low temperature are needed to separate these effects.
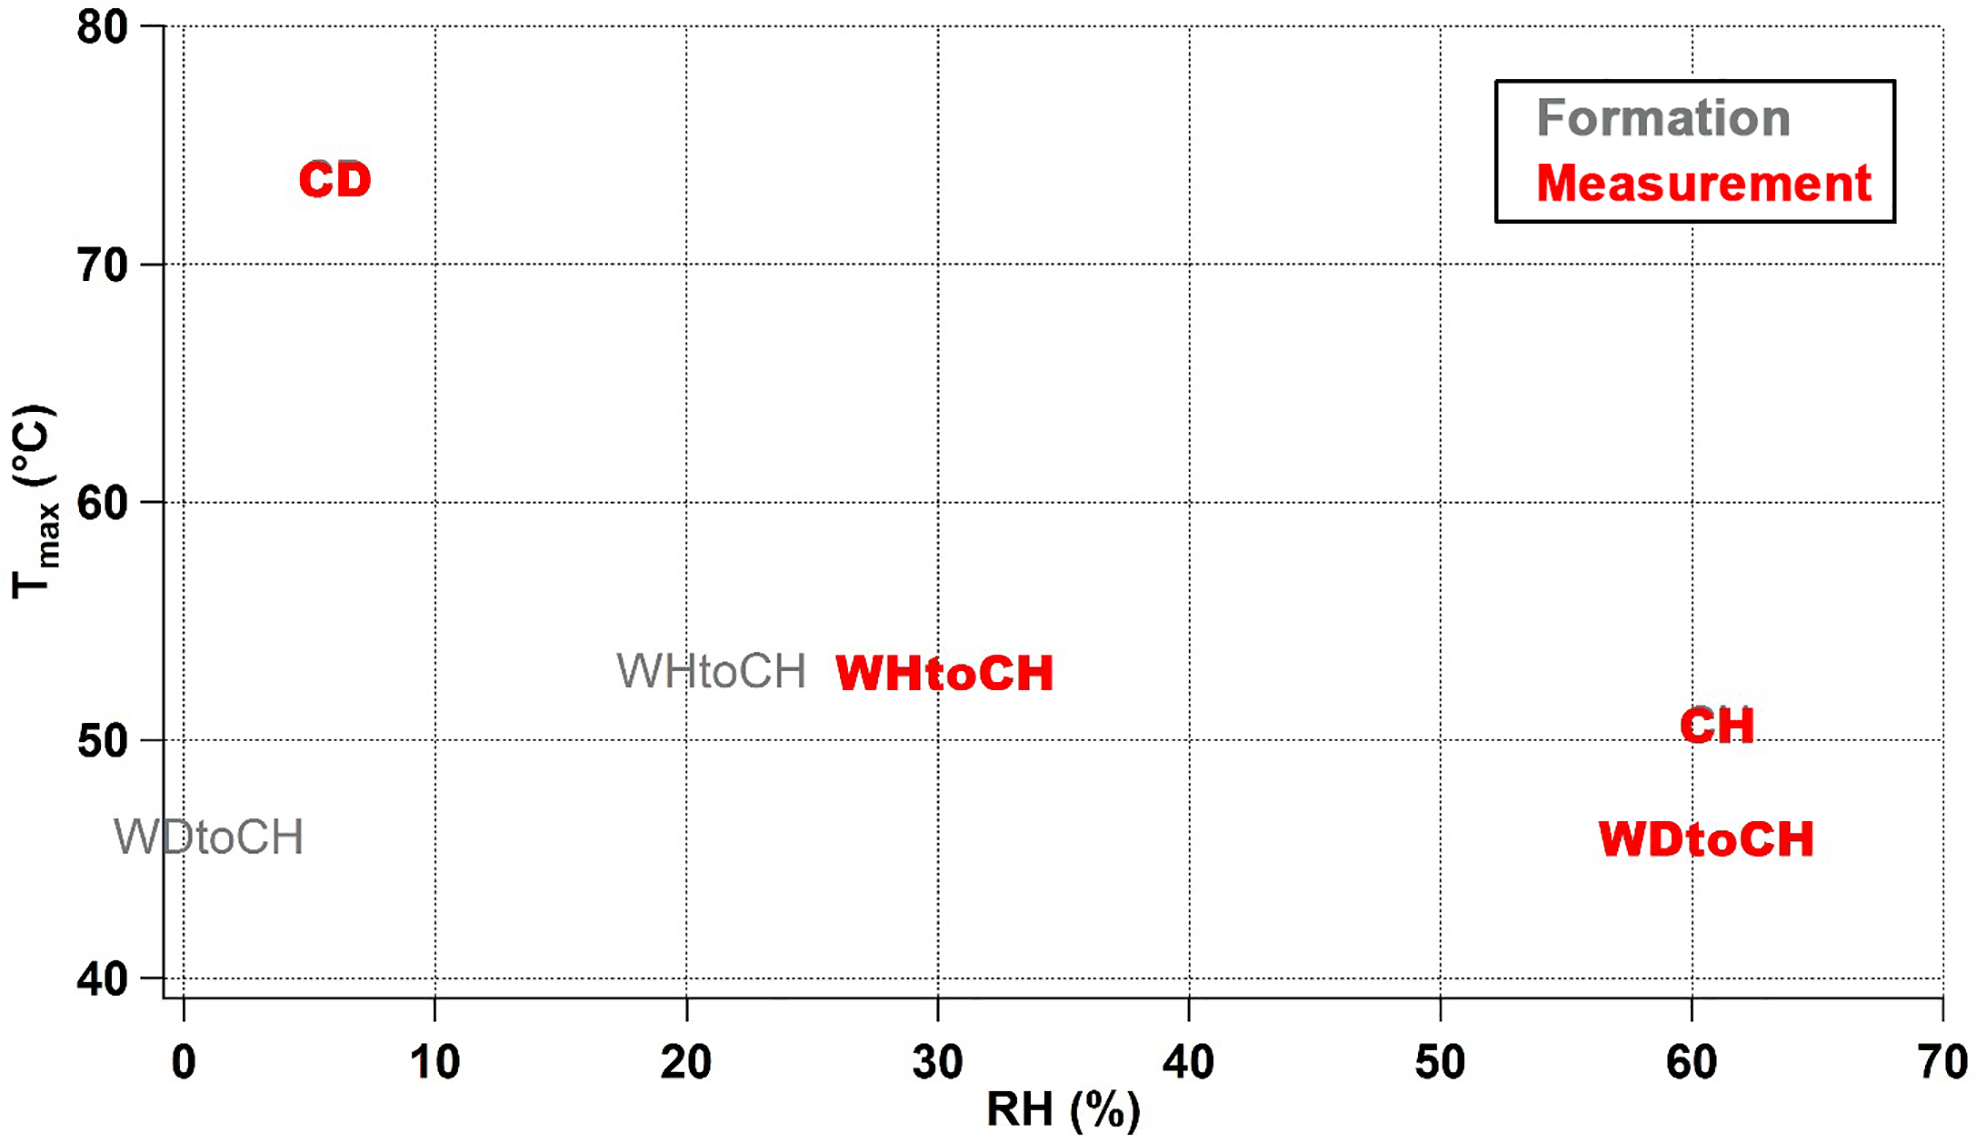
Figure 8Relationship of RHformation (gray), RHmeasurement (red), and Tmax of all CHOI monomer compounds for four experiments at t0.
We also noticed that different mass loadings on the filter due to different sampling times and/or sample concentrations influenced the shape of thermograms and thus Tmax. Tmax increased as a function of mass loading on the filter, likely due to the increase in heat capacity of the increasing mass of the particle matrix, and potential interactions between the particles. The dependency of Tmax on filter mass loading was not linear, and for our FIGAERO, it reached a plateau at mass loadings of 2–4 µg. Our results are therefore not affected by the mass loading effect, but we recommend taking it into account in analyses that involve Tmax. A detailed discussion can be found in the Supplement.
In this study, α-pinene SOA physicochemical properties such as chemical composition, size distributions, and degree of oligomerization were investigated at low temperature (223 K) and different relative humidity (RH) using two simulation chambers (APC and AIDA). Two types of experiments were performed: for type 1 experiments, SOA was directly generated in the AIDA chamber kept at 223 K at 61 % RH (experiment termed “cold humid”, CH) or 6 % RH (experiment termed “cold dry”, CD) conditions. For type 2 experiments, SOA was formed in the APC chamber at room temperature (296 K), < 1 % RH (experiment termed “warm dry”, WD) or 21 % RH (experiment termed “warm humid”, WH) conditions, and then partially transferred to the AIDA chamber kept at 223 K at 61 % RH (WDtoCH) or 30 % RH (WHtoCH) conditions, respectively, to simulate SOA uplifting.
For type 1 experiments (CH, CD) with lower α-pinene concentrations and cold SOA formation temperature (223 K), smaller particles with relatively more mass from adducts were observed. For type 2 experiments (WDtoCH, WHtoCH) with higher α-pinene concentrations (by a factor of ∼ 3) and warm SOA formation temperature (296 K), larger particles with relatively more mass from monomers were produced. The differences observed in mass spectral patterns between the two types of experiments are likely a consequence of both temperature and precursor concentration differences. Higher α-pinene concentrations and faster oxidation at 296 K during SOA formation in the APC chamber shifted the gas–particle equilibrium to the particles, resulting in larger mass fractions of semivolatile and/or monomer compounds. Low-temperature conditions in the AIDA chamber during SOA formation on the other hand may result in condensation of compounds with a relatively lower degree of oxygenation. Our results show that depending on where SOA formation takes place in the atmosphere (e.g., boundary layer or upper troposphere), chemical properties can vary, and with it, reactivity and lifetime.
In addition to the differences in mass spectral patterns for the different experiments, we also observed differences in the shape of thermograms resulting from the desorption of SOA particles collected on the FIGAERO filter: Tmax of an individual compound in the thermograms varied by up to 20 ∘C depending on experimental conditions, indicating that Tmax is not only influenced by a compound's vapor pressure or volatility, but also by diffusion limitations within the particles (particle viscosity). For both C10H16O4I and C17H26O8I thermograms, Tmax was highest for experiment CD, followed by WHtoCH, CH, and WDtoCH. We observed higher Tmax for α-pinene SOA particles with higher oligomer mass fractions, indicating the potential role of intra- and inter-molecular hydrogen bonds between these large and highly functionalized molecules for the increase in particle viscosity (Kidd et al., 2014). Furthermore, Tmax was negatively correlated with RH in the particle reservoir and particle water content, suggesting that hygroscopic properties and water uptake are important factors even at such low temperature. We also demonstrated an effect of mass deposited on the FIGAERO filter on Tmax, which needs to be taken into account for further studies relying on Tmax.
The results suggest that particle physicochemical properties such as viscosity and oligomer content mutually influence each other. More controlled experiments at low temperature are needed to separate the direct effects of RH and particle water uptake as well as chemical properties such as adduct content (i.e., oligomer content), and the indirect effects of chemical properties on water uptake via changes in hygroscopicity on the observed differences in Tmax and presumed viscosity. The differences in SOA physicochemical properties observed in our set of experiments as a function of temperature, RH, and precursor conditions demonstrate the importance of ambient and laboratory measurements at a wide range of atmospherically relevant conditions, and of taking experimental conditions into careful consideration when interpreting laboratory studies or using them as input in climate models.
Data are available upon request to the corresponding author.
The supplement related to this article is available online at: https://doi.org/10.5194/acp-18-2883-2018-supplement.
WH, HS, AP, XS, KHN, AV, TL, and CM designed research; WH, HS, AP, XS, RW, and CM performed research; WH, HS, AP, XS, and CM analyzed data; and WH and CM wrote the paper.
The authors declare that they have no conflict of interest.
Technical support by the AIDA staff at IMK-AAF, and financial support by the
European Research Council (ERC-StG QAPPA 335478), Academy of Finland (259005
and 272041), and China Scholarship Council (CSC) for Wei Huang and
Xiaoli Shen, is gratefully acknowledged.
The
article processing charges for this open-access
publication
were covered by a Research
Centre of the Helmholtz
Association.
Edited by: David
Topping
Reviewed by: two anonymous referees
Bastelberger, S., Krieger, U. K., Luo, B., and Peter, T.: Diffusivity measurements of volatile organics in levitated viscous aerosol particles, Atmos. Chem. Phys., 17, 8453–8471, https://doi.org/10.5194/acp-17-8453-2017, 2017.
Bateman, A. P., Gong, Z. H., Liu, P. F., Sato, B., Cirino, G., Zhang, Y., Artaxo, P., Bertram, A. K., Manzi, A. O., Rizzo, L. V., Souza, R. A. F., Zaveri, R. A., and Martin, S. T.: Sub-micrometre particulate matter is primarily in liquid form over Amazon rainforest, Nat. Geosci., 9, 34–37, 2016.
Canagaratna, M. R., Jimenez, J. L., Kroll, J. H., Chen, Q., Kessler, S. H., Massoli, P., Hildebrandt Ruiz, L., Fortner, E., Williams, L. R., Wilson, K. R., Surratt, J. D., Donahue, N. M., Jayne, J. T., and Worsnop, D. R.: Elemental ratio measurements of organic compounds using aerosol mass spectrometry: characterization, improved calibration, and implications, Atmos. Chem. Phys., 15, 253–272, https://doi.org/10.5194/acp-15-253-2015, 2015.
D'Ambro, E. L., Lee, B. H., Liu, J., Shilling, J. E., Gaston, C. J., Lopez-Hilfiker, F. D., Schobesberger, S., Zaveri, R. A., Mohr, C., Lutz, A., Zhang, Z., Gold, A., Surratt, J. D., Rivera-Rios, J. C., Keutsch, F. N., and Thornton, J. A.: Molecular composition and volatility of isoprene photochemical oxidation secondary organic aerosol under low- and high-NOx conditions, Atmos. Chem. Phys., 17, 159–174, https://doi.org/10.5194/acp-17-159-2017, 2017.
Denjean, C., Formenti, P., Picquet-Varrault, B., Camredon, M., Pangui, E., Zapf, P., Katrib, Y., Giorio, C., Tapparo, A., Temime-Roussel, B., Monod, A., Aumont, B., and Doussin, J. F.: Aging of secondary organic aerosol generated from the ozonolysis of α-pinene: effects of ozone, light and temperature, Atmos. Chem. Phys., 15, 883–897, https://doi.org/10.5194/acp-15-883-2015, 2015.
Donahue, N. M., Henry, K. M., Mentel, T. F., Kiendler-Scharr, A., Spindler, C., Bohn, B., Brauers, T., Dorn, H. P., Fuchs, H., Tillmann, R., Wahner, A., Saathoff, H., Naumann, K. H., Möhler, O., Leisner, T., Müller, L., Reinnig, M. C., Hoffmann, T., Salo, K., Hallquist, M., Frosch, M., Bilde, M., Tritscher, T., Barmet, P., Praplan, A. P., DeCarlo, P. F., Dommen, J., Prévôt, A. S. H., and Baltensperger, U.: Aging of biogenic secondary organic aerosol via gas-phase OH radical reactions, P. Natl. Acad. Sci. USA, 109, 13503–13508, 2012.
Ehn, M., Kleist, E., Junninen, H., Petäjä, T., Lönn, G., Schobesberger, S., Dal Maso, M., Trimborn, A., Kulmala, M., Worsnop, D. R., Wahner, A., Wildt, J., and Mentel, Th. F.: Gas phase formation of extremely oxidized pinene reaction products in chamber and ambient air, Atmos. Chem. Phys., 12, 5113–5127, https://doi.org/10.5194/acp-12-5113-2012, 2012.
Ehn, M., Thornton, J. A., Kleist, E., Sipilä, M., Junninen, H., Pullinen, I., Springer, M., Rubach, F., Tillmann, R., Lee, B., Lopez-Hilfiker, F., Andres, S., Acir, I. H., Rissanen, M., Jokinen, T., Schobesberger, S., Kangasluoma, J., Kontkanen, J., Nieminen, T., Kurtén, T., Nielsen, L. B., Jørgensen, S., Kjaergaard, H. G., Canagaratna, M., Dal Maso, M., Berndt, T., Petäjä, T., Wahner, A., Kerminen, V. M., Kulmala, M., Worsnop, D. R., Wildt, J., and Mentel, T. F.: A large source of low-volatility secondary organic aerosol, Nature, 506, 476–479, 2014.
Fahey, D. W., Gao, R.-S., Möhler, O., Saathoff, H., Schiller, C., Ebert, V., Krämer, M., Peter, T., Amarouche, N., Avallone, L. M., Bauer, R., Bozóki, Z., Christensen, L. E., Davis, S. M., Durry, G., Dyroff, C., Herman, R. L., Hunsmann, S., Khaykin, S. M., Mackrodt, P., Meyer, J., Smith, J. B., Spelten, N., Troy, R. F., Vömel, H., Wagner, S., and Wienhold, F. G.: The AquaVIT-1 intercomparison of atmospheric water vapor measurement techniques, Atmos. Meas. Tech., 7, 3177–3213, https://doi.org/10.5194/amt-7-3177-2014, 2014.
Fitzer, E. and Fritz, W.: Technische Chemie, 3rd ed., Springer, Berlin, 140 pp., 1989.
Frege, C., Ortega, I. K., Rissanen, M. P., Praplan, A. P., Steiner, G., Heinritzi, M., Ahonen, L., Amorim, A., Bernhammer, A.-K., Bianchi, F., Brilke, S., Breitenlechner, M., Dada, L., Dias, A., Duplissy, J., Ehrhart, S., El-Haddad, I., Fischer, L., Fuchs, C., Garmash, O., Gonin, M., Hansel, A., Hoyle, C. R., Jokinen, T., Junninen, H., Kirkby, J., Kürten, A., Lehtipalo, K., Leiminger, M., Mauldin, R. L., Molteni, U., Nichman, L., Petäjä, T., Sarnela, N., Schobesberger, S., Simon, M., Sipilä, M., Stolzenburg, D., Tomé, A., Vogel, A. L., Wagner, A. C., Wagner, R., Xiao, M., Yan, C., Ye, P., Curtius, J., Donahue, N. M., Flagan, R. C., Kulmala, M., Worsnop, D. R., Winkler, P. M., Dommen, J., and Baltensperger, U.: Influence of temperature on the molecular composition of ions and charged clusters during pure biogenic nucleation, Atmos. Chem. Phys., 18, 65–79, https://doi.org/10.5194/acp-18-65-2018, 2018.
Ge, X. L., Setyan, A., Sun, Y. L., and Zhang, Q.: Primary and secondary organic aerosols in Fresno, California during wintertime: Results from high resolution aerosol mass spectrometry, J. Geophys. Res.-Atmos., 117, D19301, https://doi.org/10.1029/2012jd018026, 2012.
Hallquist, M., Wenger, J. C., Baltensperger, U., Rudich, Y., Simpson, D., Claeys, M., Dommen, J., Donahue, N. M., George, C., Goldstein, A. H., Hamilton, J. F., Herrmann, H., Hoffmann, T., Iinuma, Y., Jang, M., Jenkin, M. E., Jimenez, J. L., Kiendler-Scharr, A., Maenhaut, W., McFiggans, G., Mentel, Th. F., Monod, A., Prévôt, A. S. H., Seinfeld, J. H., Surratt, J. D., Szmigielski, R., and Wildt, J.: The formation, properties and impact of secondary organic aerosol: current and emerging issues, Atmos. Chem. Phys., 9, 5155–5236, https://doi.org/10.5194/acp-9-5155-2009, 2009.
Heald, C. L., Henze, D. K., Horowitz, L. W., Feddema, J., Lamarque, J.-F., Guenther, A., Hess, P. G., Vitt, F., Seinfeld, J. H., Goldstein, A. H., and Fung, I.: Predicted change in global secondary organic aerosol concentrations in response to future climate, emissions, and land use change, J. Geophys. Res.-Atmos., 113, D05211, https://doi.org/10.1029/2007jd009092, 2008.
Hosny, N. A., Fitzgerald, C., Vyšniauskas, A., Athanasiadis, A., Berkemeier, T., Uygur, N., Pöschl, U., Shiraiwa, M., Kalberer, M., Pope, F. D., and Kuimova, M. K.: Direct imaging of changes in aerosol particle viscosity upon hydration and chemical aging, Chem. Sci., 7, 1357–1367, 2016.
IPCC: Climate change 2013: The physical scientific basis, Cambridge University Press, Cambridge, England, 622–623, 2013.
Järvinen, E., Ignatius, K., Nichman, L., Kristensen, T. B., Fuchs, C., Hoyle, C. R., Höppel, N., Corbin, J. C., Craven, J., Duplissy, J., Ehrhart, S., El Haddad, I., Frege, C., Gordon, H., Jokinen, T., Kallinger, P., Kirkby, J., Kiselev, A., Naumann, K.-H., Petäjä, T., Pinterich, T., Prevot, A. S. H., Saathoff, H., Schiebel, T., Sengupta, K., Simon, M., Slowik, J. G., Tröstl, J., Virtanen, A., Vochezer, P., Vogt, S., Wagner, A. C., Wagner, R., Williamson, C., Winkler, P. M., Yan, C., Baltensperger, U., Donahue, N. M., Flagan, R. C., Gallagher, M., Hansel, A., Kulmala, M., Stratmann, F., Worsnop, D. R., Möhler, O., Leisner, T., and Schnaiter, M.: Observation of viscosity transition in α-pinene secondary organic aerosol, Atmos. Chem. Phys., 16, 4423–4438, https://doi.org/10.5194/acp-16-4423-2016, 2016.
Jimenez, J. L., Canagaratna, M. R., Donahue, N. M., Prevot, A. S. H., Zhang, Q., Kroll, J. H., DeCarlo, P. F., Allan, J. D., Coe, H., Ng, N. L., Aiken, A. C., Docherty, K. S., Ulbrich, I. M., Grieshop, A. P., Robinson, A. L., Duplissy, J., Smith, J. D., Wilson, K. R., Lanz, V. A., Hueglin, C., Sun, Y. L., Tian, J., Laaksonen, A., Raatikainen, T., Rautiainen, J., Vaattovaara, P., Ehn, M., Kulmala, M., Tomlinson, J. M., Collins, D. R., Cubison, M. J., Dunlea, E. J., Huffman, J. A., Onasch, T. B., Alfarra, M. R., Williams, P. I., Bower, K., Kondo, Y., Schneider, J., Drewnick, F., Borrmann, S., Weimer, S., Demerjian, K., Salcedo, D., Cottrell, L., Griffin, R., Takami, A., Miyoshi, T., Hatakeyama, S., Shimono, A., Sun, J. Y., Zhang, Y. M., Dzepina, K., Kimmel, J. R., Sueper, D., Jayne, J. T., Herndon, S. C., Trimborn, A. M., Williams, L. R., Wood, E. C., Middlebrook, A. M., Kolb, C. E., Baltensperger, U., and Worsnop, D. R.: Evolution of organic aerosols in the atmosphere, Science, 326, 1525–1529, 2009.
Jokinen, T., Berndt, T., Makkonen, R., Kerminen, V.-M., Junninen, H., Paasonen, P., Stratmann, F., Herrmann, H., Guenther, A. B., Worsnop, D. R., Kulmala, M., Ehn, M., and Sipilä, M.: Production of extremely low volatile organic compounds from biogenic emissions: Measured yields and atmospheric implications, P. Natl. Acad. Sci. USA, 112, 7123–7128, 2015.
Kanakidou, M., Seinfeld, J. H., Pandis, S. N., Barnes, I., Dentener, F. J., Facchini, M. C., Van Dingenen, R., Ervens, B., Nenes, A., Nielsen, C. J., Swietlicki, E., Putaud, J. P., Balkanski, Y., Fuzzi, S., Horth, J., Moortgat, G. K., Winterhalter, R., Myhre, C. E. L., Tsigaridis, K., Vignati, E., Stephanou, E. G., and Wilson, J.: Organic aerosol and global climate modelling: a review, Atmos. Chem. Phys., 5, 1053–1123, https://doi.org/10.5194/acp-5-1053-2005, 2005.
Kidd, C., Perraud, V., Wingen, L. M., and Finlayson-Pitts, B. J.: Integrating phase and composition of secondary organic aerosol from the ozonolysis of α-pinene, P. Natl. Acad. Sci. USA, 111, 7552–7557, 2014.
Kristensen, K., Cui, T., Zhang, H., Gold, A., Glasius, M., and Surratt, J. D.: Dimers in α-pinene secondary organic aerosol: effect of hydroxyl radical, ozone, relative humidity and aerosol acidity, Atmos. Chem. Phys., 14, 4201–4218, https://doi.org/10.5194/acp-14-4201-2014, 2014.
Kristensen, K., Watne, Å. K., Hammes, J., Lutz, A., Petäjä, T., Hallquist, M., Bilde, M., and Glasius, M.: High-molecular weight dimer esters are major products in aerosols from α-pinene ozonolysis and the boreal forest, Environ. Sci. Tech. Let., 3, 280–285, 2016.
Lee, B. H., Lopez-Hilfiker, F. D., Mohr, C., Kurtén, T., Worsnop, D. R., and Thornton, J. A.: An iodide-adduct high-resolution time-of-flight chemical-ionization mass spectrometer: Application to atmospheric inorganic and organic compounds, Environ. Sci. Technol., 48, 6309–6317, 2014.
Lienhard, D. M., Huisman, A. J., Krieger, U. K., Rudich, Y., Marcolli, C., Luo, B. P., Bones, D. L., Reid, J. P., Lambe, A. T., Canagaratna, M. R., Davidovits, P., Onasch, T. B., Worsnop, D. R., Steimer, S. S., Koop, T., and Peter, T.: Viscous organic aerosol particles in the upper troposphere: diffusivity-controlled water uptake and ice nucleation?, Atmos. Chem. Phys., 15, 13599–13613, https://doi.org/10.5194/acp-15-13599-2015, 2015.
Lopez-Hilfiker, F. D., Mohr, C., Ehn, M., Rubach, F., Kleist, E., Wildt, J., Mentel, Th. F., Lutz, A., Hallquist, M., Worsnop, D., and Thornton, J. A.: A novel method for online analysis of gas and particle composition: description and evaluation of a Filter Inlet for Gases and AEROsols (FIGAERO), Atmos. Meas. Tech., 7, 983–1001, https://doi.org/10.5194/amt-7-983-2014, 2014.
Lopez-Hilfiker, F. D., Mohr, C., Ehn, M., Rubach, F., Kleist, E., Wildt, J., Mentel, Th. F., Carrasquillo, A. J., Daumit, K. E., Hunter, J. F., Kroll, J. H., Worsnop, D. R., and Thornton, J. A.: Phase partitioning and volatility of secondary organic aerosol components formed from a-pinene ozonolysis and OH oxidation: the importance of accretion products and other low volatility compounds, Atmos. Chem. Phys., 15, 7765–7776, https://doi.org/10.5194/acp-15-7765-2015, 2015.
Lopez-Hilfiker, F. D., Iyer, S., Mohr, C., Lee, B. H., D'Ambro, E. L., Kurtén, T., and Thornton, J. A.: Constraining the sensitivity of iodide adduct chemical ionization mass spectrometry to multifunctional organic molecules using the collision limit and thermodynamic stability of iodide ion adducts, Atmos. Meas. Tech., 9, 1505–1512, https://doi.org/10.5194/amt-9-1505-2016, 2016.
McVay, R. C., Zhang, X., Aumont, B., Valorso, R., Camredon, M., La, Y. S., Wennberg, P. O., and Seinfeld, J. H.: SOA formation from the photooxidation of a-pinene: systematic exploration of the simulation of chamber data, Atmos. Chem. Phys., 16, 2785–2802, https://doi.org/10.5194/acp-16-2785-2016, 2016.
Middlebrook, A. M., Bahreini, R., Jimenez, J. L., and Canagaratna, M. R.: Evaluation of composition-dependent collection efficiencies for the Aerodyne Aerosol Mass Spectrometer using field data, Aerosol. Sci. Tech., 46, 258–271, 2012.
Möhler, O., Stetzer, O., Schaefers, S., Linke, C., Schnaiter, M., Tiede, R., Saathoff, H., Krämer, M., Mangold, A., Budz, P., Zink, P., Schreiner, J., Mauersberger, K., Haag, W., Kärcher, B., and Schurath, U.: Experimental investigation of homogeneous freezing of sulphuric acid particles in the aerosol chamber AIDA, Atmos. Chem. Phys., 3, 211–223, https://doi.org/10.5194/acp-3-211-2003, 2003.
Möhler, O., Benz, S., Saathoff, H., Schnaiter, M., Wagner, R., Schneider, J., Walter, S., Ebert, V., and Wagner, S.: The effect of organic coating on the heterogeneous ice nucleation efficiency of mineral dust aerosols, Environ. Res. Lett., 3, 025007, https://doi.org/10.1088/1748-9326/3/2/025007, 2008.
Mohr, C., DeCarlo, P. F., Heringa, M. F., Chirico, R., Slowik, J. G., Richter, R., Reche, C., Alastuey, A., Querol, X., Seco, R., Peñuelas, J., Jiménez, J. L., Crippa, M., Zimmermann, R., Baltensperger, U., and Prévôt, A. S. H.: Identification and quantification of organic aerosol from cooking and other sources in Barcelona using aerosol mass spectrometer data, Atmos. Chem. Phys., 12, 1649–1665, https://doi.org/10.5194/acp-12-1649-2012, 2012.
Mohr, C., Lopez-Hilfiker, F. D., Yli-Juuti, T., Heitto, A., Lutz, A., Hallquist, M., D'Ambro, E. L., Rissanen, M. P., Hao, L. Q., Schobesberger, S., Kulmala, M., Mauldin, R. L., Makkonen, U., Sipilä, M., Petäjä, T., and Thornton, J. A.: Ambient observations of dimers from terpene oxidation in the gas phase: Implications for new particle formation and growth, Geophys. Res. Lett., 44, 2958–2966, 2017.
Müller, L., Reinnig, M.-C., Warnke, J., and Hoffmann, Th.: Unambiguous identification of esters as oligomers in secondary organic aerosol formed from cyclohexene and cyclohexene/a-pinene ozonolysis, Atmos. Chem. Phys., 8, 1423–1433, https://doi.org/10.5194/acp-8-1423-2008, 2008.
Murphy, D. M. and Koop, T.: Review of the vapour pressures of ice and supercooled water for atmospheric applications, Q. J. Roy. Meteor. Soc., 131, 1539–1565, 2005.
Murphy, D. M., Cziczo, D. J., Froyd, K. D., Hudson, P. K., Matthew, B. M., Middlebrook, A. M., Peltier, R. E., Sullivan, A., Thomson, D. S., and Weber, R. J.: Single-particle mass spectrometry of tropospheric aerosol particles, J. Geophys. Res.-Atmos., 111, D23S32, https://doi.org/10.1029/2006jd007340, 2006.
Nel, A.: Air pollution-related illness: Effects of particles, Science, 308, 804–806, 2005.
Nozière, B., Kaberer, M., Claeys, M., Allan, J., D'Anna, B., Decesari, S., Finessi, E., Glasius, M., Grgić, I., Hamilton, J. F., Hoffmann, T., Iinuma, Y., Jaoui, M., Kahno, A., Kampf, C. J., Kourtchev, I., Maenhaut, W., Marsden, N., Saarikoski, S., Schnelle-Kreis, J., Surratt, J. D., Szidat, S., Szmigielski, R., and Wisthaler, A.: The molecular identification of organic compounds in the atmosphere: State of the art and challenges, Chem. Rev., 115, 3919–3983, 2015.
Pajunoja, A., Malila, J., Hao, L. Q., Joutsensaari, J., Lehtinen, K. E. J., and Virtanen, A.: Estimating the viscosity range of SOA particles based on their coalescence Time, Aerosol. Sci. Tech., 48, i–iv, https://doi.org/10.1080/02786826.2013.870325, 2014.
Pajunoja, A., Lambe, A. T., Hakala, J., Rastak, N., Cummings, M. J., Brogan, J. F., Hao, L. Q., Paramonov, M., Hong, J., Prisle, N. L., Malila, J., Romakkaniemi, S., Lehtinen, K. E. J., Laaksonen, A., Kulmala, M., Massoli, P., Onasch, T. B., Donahue, N. M., Riipinen, I., Davidovits, P., Worsnop, D. R., Petäjä, T., and Virtanen, A.: Adsorptive uptake of water by semisolid secondary organic aerosols, Geophys. Res. Lett., 42, 3063–3068, 2015.
Price, H. C., Mattsson, J., Zhang, Y., Bertram, A. K., Davies, J. F., Grayson, J. W., Martin, S. T., O'Sullivan, D., Reid, J. P., Rickards, A. M. J., and Murray, B. J.: Water diffusion in atmospherically relevant α-pinene secondary organic material, Chem. Sci., 6, 4876–4883, 2015.
Renbaum-Wolff, L., Grayson, J. W., Bateman, A. P., Kuwata, M., Sellier, M., Murray, B. J., Shilling, J. E., Martin, S. T., and Bertram, A. K.: Viscosity of α-pinene secondary organic material and implications for particle growth and reactivity, P. Natl. Acad. Sci. USA, 110, 8014–8019, 2013.
Roldin, P., Eriksson, A. C., Nordin, E. Z., Hermansson, E., Mogensen, D., Rusanen, A., Boy, M., Swietlicki, E., Svenningsson, B., Zelenyuk, A., and Pagels, J.: Modelling non-equilibrium secondary organic aerosol formation and evaporation with the aerosol dynamics, gas- and particle-phase chemistry kinetic multilayer model ADCHAM, Atmos. Chem. Phys., 14, 7953–7993, https://doi.org/10.5194/acp-14-7953-2014, 2014.
Rückerl, R., Schneider, A., Breitner, S., Cyrys, J., and Peters, A.: Health effects of particulate air pollution: A review of epidemiological evidence, Inhal. Toxicol., 23, 555–592, 2011.
Saathoff, H., Naumann, K.-H., Möhler, O., Jonsson, Å. M., Hallquist, M., Kiendler-Scharr, A., Mentel, Th. F., Tillmann, R., and Schurath, U.: Temperature dependence of yields of secondary organic aerosols from the ozonolysis of a-pinene and limonene, Atmos. Chem. Phys., 9, 1551–1577, https://doi.org/10.5194/acp-9-1551-2009, 2009.
Schnaiter, M., Järvinen, E., Vochezer, P., Abdelmonem, A., Wagner, R., Jourdan, O., Mioche, G., Shcherbakov, V. N., Schmitt, C. G., Tricoli, U., Ulanowski, Z., and Heymsfield, A. J.: Cloud chamber experiments on the origin of ice crystal complexity in cirrus clouds, Atmos. Chem. Phys., 16, 5091–5110, https://doi.org/10.5194/acp-16-5091-2016, 2016.
Shiraiwa, M., Ammann, M., Koop, T., and Pöschl, U.: Gas uptake and chemical aging of semisolid organic aerosol particles, P. Natl. Acad. Sci. USA, 108, 11003–11008, 2011.
Shiraiwa, M., Li, Y., Tsimpidi, A. P., Karydis, V. A., Berkemeier, T., Pandis, S. N., Lelieveld, J., Koop, T., and Pöschl, U.: Global distribution of particle phase state in atmospheric secondary organic aerosols, Nat. Commun., 8, 15002, https://doi.org/10.1038/ncomms15002, 2017.
Shrivastava, M., Easter, R. C., Liu, X. H., Zelenyuk, A., Singh, B., Zhang, K., Ma, P.-L., Chand, D., Ghan, S., Jimenez, J. L., Zhang, Q., Fast, J., Rasch, P. J., and Tiitta, P.: Global transformation and fate of SOA: Implications of low-volatility SOA and gas-phase fragmentation reactions, J. Geophys. Res.-Atmos., 120, 4169–4195, 2015.
Skrotzki, J., Connolly, P., Schnaiter, M., Saathoff, H., Möhler, O., Wagner, R., Niemand, M., Ebert, V., and Leisner, T.: The accommodation coefficient of water molecules on ice – cirrus cloud studies at the AIDA simulation chamber, Atmos. Chem. Phys., 13, 4451–4466, https://doi.org/10.5194/acp-13-4451-2013, 2013.
Song, Y. C., Haddrell, A. E., Bzdek, B. R., Reid, J. P., Barman, T., Topping, D. O., Percival, C., and Cai, C.: Measurements and predictions of binary component aerosol particle viscosity, J. Phys. Chem. A, 120, 8123–8137, 2016.
Tröstl, J., Chuang, W. K., Gordon, H., Heinritzi, M., Yan, C., Molteni, U., Ahlm, L., Frege, C., Bianchi, F., Wagner, R., Simon, M., Lehtipalo, K., Williamson, C., Craven, J. S., Duplissy, J., Adamov, A., Almeida, J., Bernhammer, A.-K., Breitenlechner, M., Brilke, S., Dias, A., Ehrhart, S., Flagan, R. C., Franchin, A., Fuchs, C., Guida, R., Gysel, M., Hansel, A., Hoyle, C. R., Jokinen, T., Junninen, H., Kangasluoma, J., Keskinen, H., Kim, J., Krapf, M., Kürten, A., Laaksonen, A., Lawler, M., Leiminger, M., Mathot, S., Möhler, O., Nieminen, T., Onnela, A., Petäjä, T., Piel, F. M., Miettinen, P., Rissanen, M. P., Rondo, L., Sarnela, N., Schobesberger, S., Sengupta, K., Sipilä, M., Smith, J. N., Steiner, G., Tomè, A., Virtanen, A., Wagner, A. C., Weingartner, E., Wimmer, D., Winkler, P. M., Ye, P. L., Carslaw, K. S., Curtius, J., Dommen, J., Kirkby, J., Kulmala, M., Riipinen, I., Worsnop, D. R., Donahue, N. M., and Baltensperger, U.: The role of low-volatility organic compounds in initial particle growth in the atmosphere, Nature, 533, 527–531, 2016.
Tsigaridis, K., Krol, M., Dentener, F. J., Balkanski, Y., Lathière, J., Metzger, S., Hauglustaine, D. A., and Kanakidou, M.: Change in global aerosol composition since preindustrial times, Atmos. Chem. Phys., 6, 5143–5162, https://doi.org/10.5194/acp-6-5143-2006, 2006.
Vaden, T. D., Imre, D., Beránek, J., Shrivastava, M., and Zelenyuk, A.: Evaporation kinetics and phase of laboratory and ambient secondary organic aerosol, P. Natl. Acad. Sci. USA, 108, 2190–2195, 2011.
Virtanen, A., Joutsensaari, J., Koop, T., Kannosto, J., Yli-Pirilä, P., Leskinen, J., Mäkelä, J. M., Holopainen, J. K., Pöschl, U., Kulmala, M., Worsnop, D. R., and Laaksonen, A.: An amorphous solid state of biogenic secondary organic aerosol particles, Nature, 467, 824–827, 2010.
Wagner, R., Höhler, K., Huang, W., Kiselev, A., Möhler, O., Mohr, C., Pajunoja, A., Saathoff, H., Schiebel, T., Shen, X. L., and Virtanen, A.: Heterogeneous ice nucleation of α-pinene SOA particles before and after ice cloud processing, J. Geophys. Res.-Atmos., 122, 4924–4943, 2017.
Wang, B. B., O'Brien, R. E., Kelly, S. T., Shilling, J. E., Moffet, R. C., Gilles, M. K., and Laskin, A.: Reactivity of liquid and semisolid secondary organic carbon with chloride and nitrate in atmospheric aerosols, J. Phys. Chem. A, 119, 4498–4508, 2015.
Wang, M. Y., Yao, L., Zheng, J., Wang, X. K., Chen, J. M., Yang, X., Worsnop, D. R., Donahue, N. M., and Wang, L.: Reactions of atmospheric particulate stabilized Criegee intermediates lead to high-molecular-weight aerosol components, Environ. Sci. Technol., 50, 5702–5710, 2016.
Williams, L. R., Gonzalez, L. A., Peck, J., Trimborn, D., McInnis, J., Farrar, M. R., Moore, K. D., Jayne, J. T., Robinson, W. A., Lewis, D. K., Onasch, T. B., Canagaratna, M. R., Trimborn, A., Timko, M. T., Magoon, G., Deng, R., Tang, D., de la Rosa Blanco, E., Prévôt, A. S. H., Smith, K. A., and Worsnop, D. R.: Characterization of an aerodynamic lens for transmitting particles greater than 1 micrometer in diameter into the Aerodyne aerosol mass spectrometer, Atmos. Meas. Tech., 6, 3271–3280, https://doi.org/10.5194/amt-6-3271-2013, 2013.
Wilson, J., Imre, D., Beránek, J., Shrivastava, M., and Zelenyuk, A.: Evaporation kinetics of laboratory-generated secondary organic aerosols at elevated relative humidity, Environ. Sci. Technol., 49, 243–249, 2015.
Winterhalter, R., Van Dingenen, R., Larsen, B. R., Jensen, N. R., and Hjorth, J.: LC-MS analysis of aerosol particles from the oxidation of α-pinene by ozone and OH-radicals, Atmos. Chem. Phys. Discuss., https://doi.org/10.5194/acpd-3-1-2003, in review, 2003.
Yasmeen, F., Vermeylen, R., Szmigielski, R., Iinuma, Y., Böge, O., Herrmann, H., Maenhaut, W., and Claeys, M.: Terpenylic acid and related compounds: precursors for dimers in secondary organic aerosol from the ozonolysis of α- and β-pinene, Atmos. Chem. Phys., 10, 9383–9392, https://doi.org/10.5194/acp-10-9383-2010, 2010.
Yli-Juuti, T., Pajunoja, A., Tikkanen, O. P., Buchholz, A., Faiola, C., Väisänen, O., Hao, L. Q., Kari, E., Peräkylä, O., Garmash, O., Shiraiwa, M., Ehn, M., Lehtinen, K., and Virtanen, A.: Factors controlling the evaporation of secondary organic aerosol from α-pinene ozonolysis, Geophys. Res. Lett., 44, 2562–2570, 2017.
Zhang, Q., Jimenez, J. L., Canagaratna, M. R., Allan, J. D., Coe, H., Ulbrich, I., Alfarra, M. R., Takami, A., Middlebrook, A. M., Sun, Y. L., Dzepina, K., Dunlea, E., Docherty, K., DeCarlo, P. F., Salcedo, D., Onasch, T., Jayne, J. T., Miyoshi, T., Shimono, A., Hatakeyama, S., Takegawa, N., Kondo, Y., Schneider, J., Drewnick, F., Borrmann, S., Weimer, S., Demerjian, K., Williams, P., Bower, K., Bahreini, R., Cottrell, L., Griffin, R. J., Rautiainen, J., Sun, J. Y., Zhang, Y. M., and Worsnop, D. R.: Ubiquity and dominance of oxygenated species in organic aerosols in anthropogenically-influenced Northern Hemisphere midlatitudes, Geophys. Res. Lett., 34, L13801, https://doi.org/10.1029/2007gl029979, 2007.
Zhang, X., McVay, R. C., Huang, D. D., Dalleska, N. F., Aumont, B., Flagan, R. C., and Seinfeld, J. H.: Formation and evolution of molecular products in α-pinene secondary organic aerosol, P. Natl. Acad. Sci. USA, 112, 14168–14173, 2015.
Zhang, X., Lambe, A. T., Upshur, M. A., Brooks, W. A., Beì, A. G., Thomson, R. J., Geiger, F. M., Surratt, J. D., Zhang, Z. F., Gold, A., Graf, S., Cubison, M. J., Groessl, M., Jayne, J. T., Worsnop, D. R., and Canagaratna, M. R.: Highly oxygenated multifunctional compounds in α-pinene secondary organic aerosol, Environ. Sci. Technol., 51, 5932–5940, 2017.