the Creative Commons Attribution 4.0 License.
the Creative Commons Attribution 4.0 License.
 | 23 Feb 2018
Size distribution and coating thickness of black carbon from the Canadian oil sands operations
Yuan Cheng
Mark Gordon
Peter Liu
Black carbon (BC) plays an important role in the Earth's climate system. However, parameterizations of BC size and mixing state have not been well addressed in aerosol–climate models, introducing substantial uncertainties into the estimation of radiative forcing by BC. In this study, we focused on BC emissions from the oil sands (OS) surface mining activities in northern Alberta, based on an aircraft campaign conducted over the Athabasca OS region in 2013. A total of 14 flights were made over the OS source area, in which the aircraft was typically flown in a four- or five-sided polygon pattern along flight tracks encircling an OS facility. Another 3 flights were performed downwind of the OS source area, each of which involved at least three intercepting locations where the well-mixed OS plume was measured along flight tracks perpendicular to the wind direction. Comparable size distributions were observed for refractory black carbon (rBC) over and downwind of the OS facilities, with rBC mass median diameters (MMDs) between ∼ 135 and 145 nm that were characteristic of fresh urban emissions. This MMD range corresponded to rBC number median diameters (NMDs) of ∼ 60–70 nm, approximately 100 % higher than the NMD settings in some aerosol–climate models. The typical in- and out-of-plume segments of a flight, which had different rBC concentrations and photochemical ages, showed consistent rBC size distributions in terms of MMD, NMD and the corresponding distribution widths. Moreover, rBC size distributions remained unchanged at different downwind distances from the source area, suggesting that atmospheric aging would not necessarily change rBC size distribution. However, aging indeed influenced rBC mixing state. Coating thickness for rBC cores in the diameter range of 130–160 nm was nearly doubled (from ∼ 20 to 40 nm) within 3 h when the OS plume was transported over a distance of 90 km from the source area.
- Article
(4451 KB) -
Supplement
(492 KB) - BibTeX
- EndNote


Oil sands (OS), a type of unconventional petroleum deposit, are naturally occurring mixtures of bitumen (a viscous form of crude oil), sand, water and small amounts of other contaminants. The OS deposit in Alberta, Canada, is estimated to contain about 1.7 trillion barrels of bitumen. This deposit is distributed in the Athabasca, Cold Lake and Peace River regions, covering a total area of ∼ 1.42 × 10⁵ km2, of which about 10 % can be recovered economically with existing technologies (Government of Alberta, 2009). Bitumen can be recovered in two ways, i.e., surface mining for the shallow reserves (e.g., less than 75 m below the surface) and using in situ technologies for the deeper deposits. Surface mining can be applied to an area of only 4800 km2 area within the Athabasca region, and by 2013, about 19 % of this surface minable area had been disturbed (Alberta Energy, 2017). As demand for crude oil fluctuated, oil production from the Alberta oil sands experienced periods of rapid expansion and stabilized production over the last decade, with total OS production doubling between 2004 (1.1 million barrels per day, with about 66 % from surface mining) and 2014 (2.2 million barrels per day, with about 47 % from surface mining) (Alberta Energy, 2016).
The OS industry in Alberta has raised concerns of environmental impacts. For example, measurement results from Kelly et al. (2009, 2010) and Kurek et al. (2013) showed that the OS development contributed organic (e.g., polycyclic aromatic hydrocarbons, PAHs) and inorganic (e.g., mercury, nickel and thallium) pollutants to the Athabasca River watershed; model simulations by Parajulee and Wania (2014) indicated that the Canadian National Pollutant Release Inventory (NPRI) likely underestimated PAH emissions in the Athabasca OS region. Despite these studies, both the emissions and subsequent environmental impacts remain poorly understood for pollutants from the Alberta OS industry. To help address this lack of understanding, an aircraft campaign was conducted with measurements of an extensive set of air pollutants over the Athabasca OS region in the summer of 2013. Using results from the campaign, Shephard et al. (2015) validated profiles of ammonia, carbon monoxide, formic acid and methanol retrieved from the Tropospheric Emission Spectrometer (TES) satellite; Liggio et al. (2016, 2017) demonstrated the large OS surface mining facilities in Athabasca as a significant source of secondary organic aerosol (SOA) and gaseous organic acids, and Li et al. (2017) identified the surface mining facilities as a greater source of volatile organic compounds (VOCs) than previously realized.
In addition to gaseous pollutants and SOA, another focus of the 2013 aircraft campaign was black carbon (BC) emissions from the surface mining facilities and its transport downwind. BC is a distinct type of carbonaceous material formed during incomplete combustion of fossil and biomass fuels, which is strongly light-absorbing in the visible light spectral range, refractory, insoluble and typically appears as chain-like aggregates consisting of fewer than 10 to several hundred carbon spherules (Andreae and Gelencsér, 2006; Bond et al., 2013; Petzold et al., 2013; Buseck et al., 2014). BC plays a unique and important role in the Earth's climate system as an effective absorber of solar radiation. It has relatively short atmospheric residence times but can exert a strong warming effect on global and regional climate (Ramanathan and Carmichael, 2008; Bond et al., 2013; Myhre et al., 2013). Therefore, BC emission reduction has long been considered as an important near-term climate mitigation target. However, each step along the way between the source and environmental effect of BC is complex. For example, anthropogenic BC emissions and the resulting temporal and spatial variations of BC, which can be simulated by chemical transport models, remain highly uncertain (Samset et al., 2014); parameterizations of BC size and mixing state have not been well addressed in state-of-the-art radiative transfer models (Morgenstern et al., 2017). Both factors are recognized as important sources of uncertainties in the estimate of climate forcing by BC (IPCC, 2013).
For large-scale industrial activities such as the OS surface mining operations in Athabasca, key concerns regarding BC include (but are not limited to) the quantities of BC emitted into the atmosphere, size distribution and mixing state of the freshly emitted BC particles, evolution of the BC particles including their size, mixing state and optical properties as the OS plumes are transported downwind, and BC deposition. In this study, a total of 17 flights conducted during the 2013 aircraft campaign were investigated to characterize BC emissions from six major OS surface mining facilities in the Athabasca region, with focuses on the evolution of BC size distribution and mixing state. Airborne BC measurements were performed by a single-particle soot photometer (SP2). BC mass and number size distributions were determined and compared not only for different facilities but also for different downwind distances. BC mixing state was estimated by coating thickness retrieved from the SP2, based on which the influences of photochemical aging were illustrated. Limitations of using this coating thickness to represent BC mixing state were also discussed. These results can provide insights into the evolution of BC aerosol in the real atmosphere.
2.1 Aircraft campaign
The aircraft campaign was conducted over the Athabasca OS region in northern Alberta between 13 August and 7 September 2013 in support of the Joint Canada-Alberta Implementation Plan for Oil Sands Monitoring (JOSM). Using instruments installed aboard the National Research Council Institute for Aerospace Research Convair-580 research aircraft, an extensive set of air pollutants (including both gaseous and particulate species) were determined with high time resolutions (Gordon et al., 2015; Liggio et al., 2016; Li et al., 2017). During this campaign, 22 flights were made for a total of about 84 h, without the influences of wet removal and cloud processing. These flights were designed (1) to quantify emissions of air pollutants from six major OS surface mining facilities including Syncrude Mildred Lake (SML), Suncor Energy OSG (SUN), Canadian Natural Resources Limited Horizon (CNRL), Shell Albian and Jackpine (SAJ), Syncrude Aurora (SAU) and Imperial's Kearl oil sands mine (IKL), and (2) to determine atmospheric evolution of the primary pollutants. The details of the measurements, flight patterns and objectives of the flights were described in detail by Liggio et al. (2016) and Li et al. (2017). In 14 flights for emission quantitation, the aircraft was typically flown in a four- or five-sided polygon pattern encircling an OS surface mining facility, with level flight tracks at 8–10 altitudes increasing from 150 to 1370 m above ground and reaching above the mixed layer; these level flight tracks were stacked along the sides of the polygon to form a virtual box encasing the facility (Figs. 1a and S1a in the Supplement). Repeated emission flights were made over SML, SUN, CNRL and SAJ, whereas single flights were made over SAU and IKL.
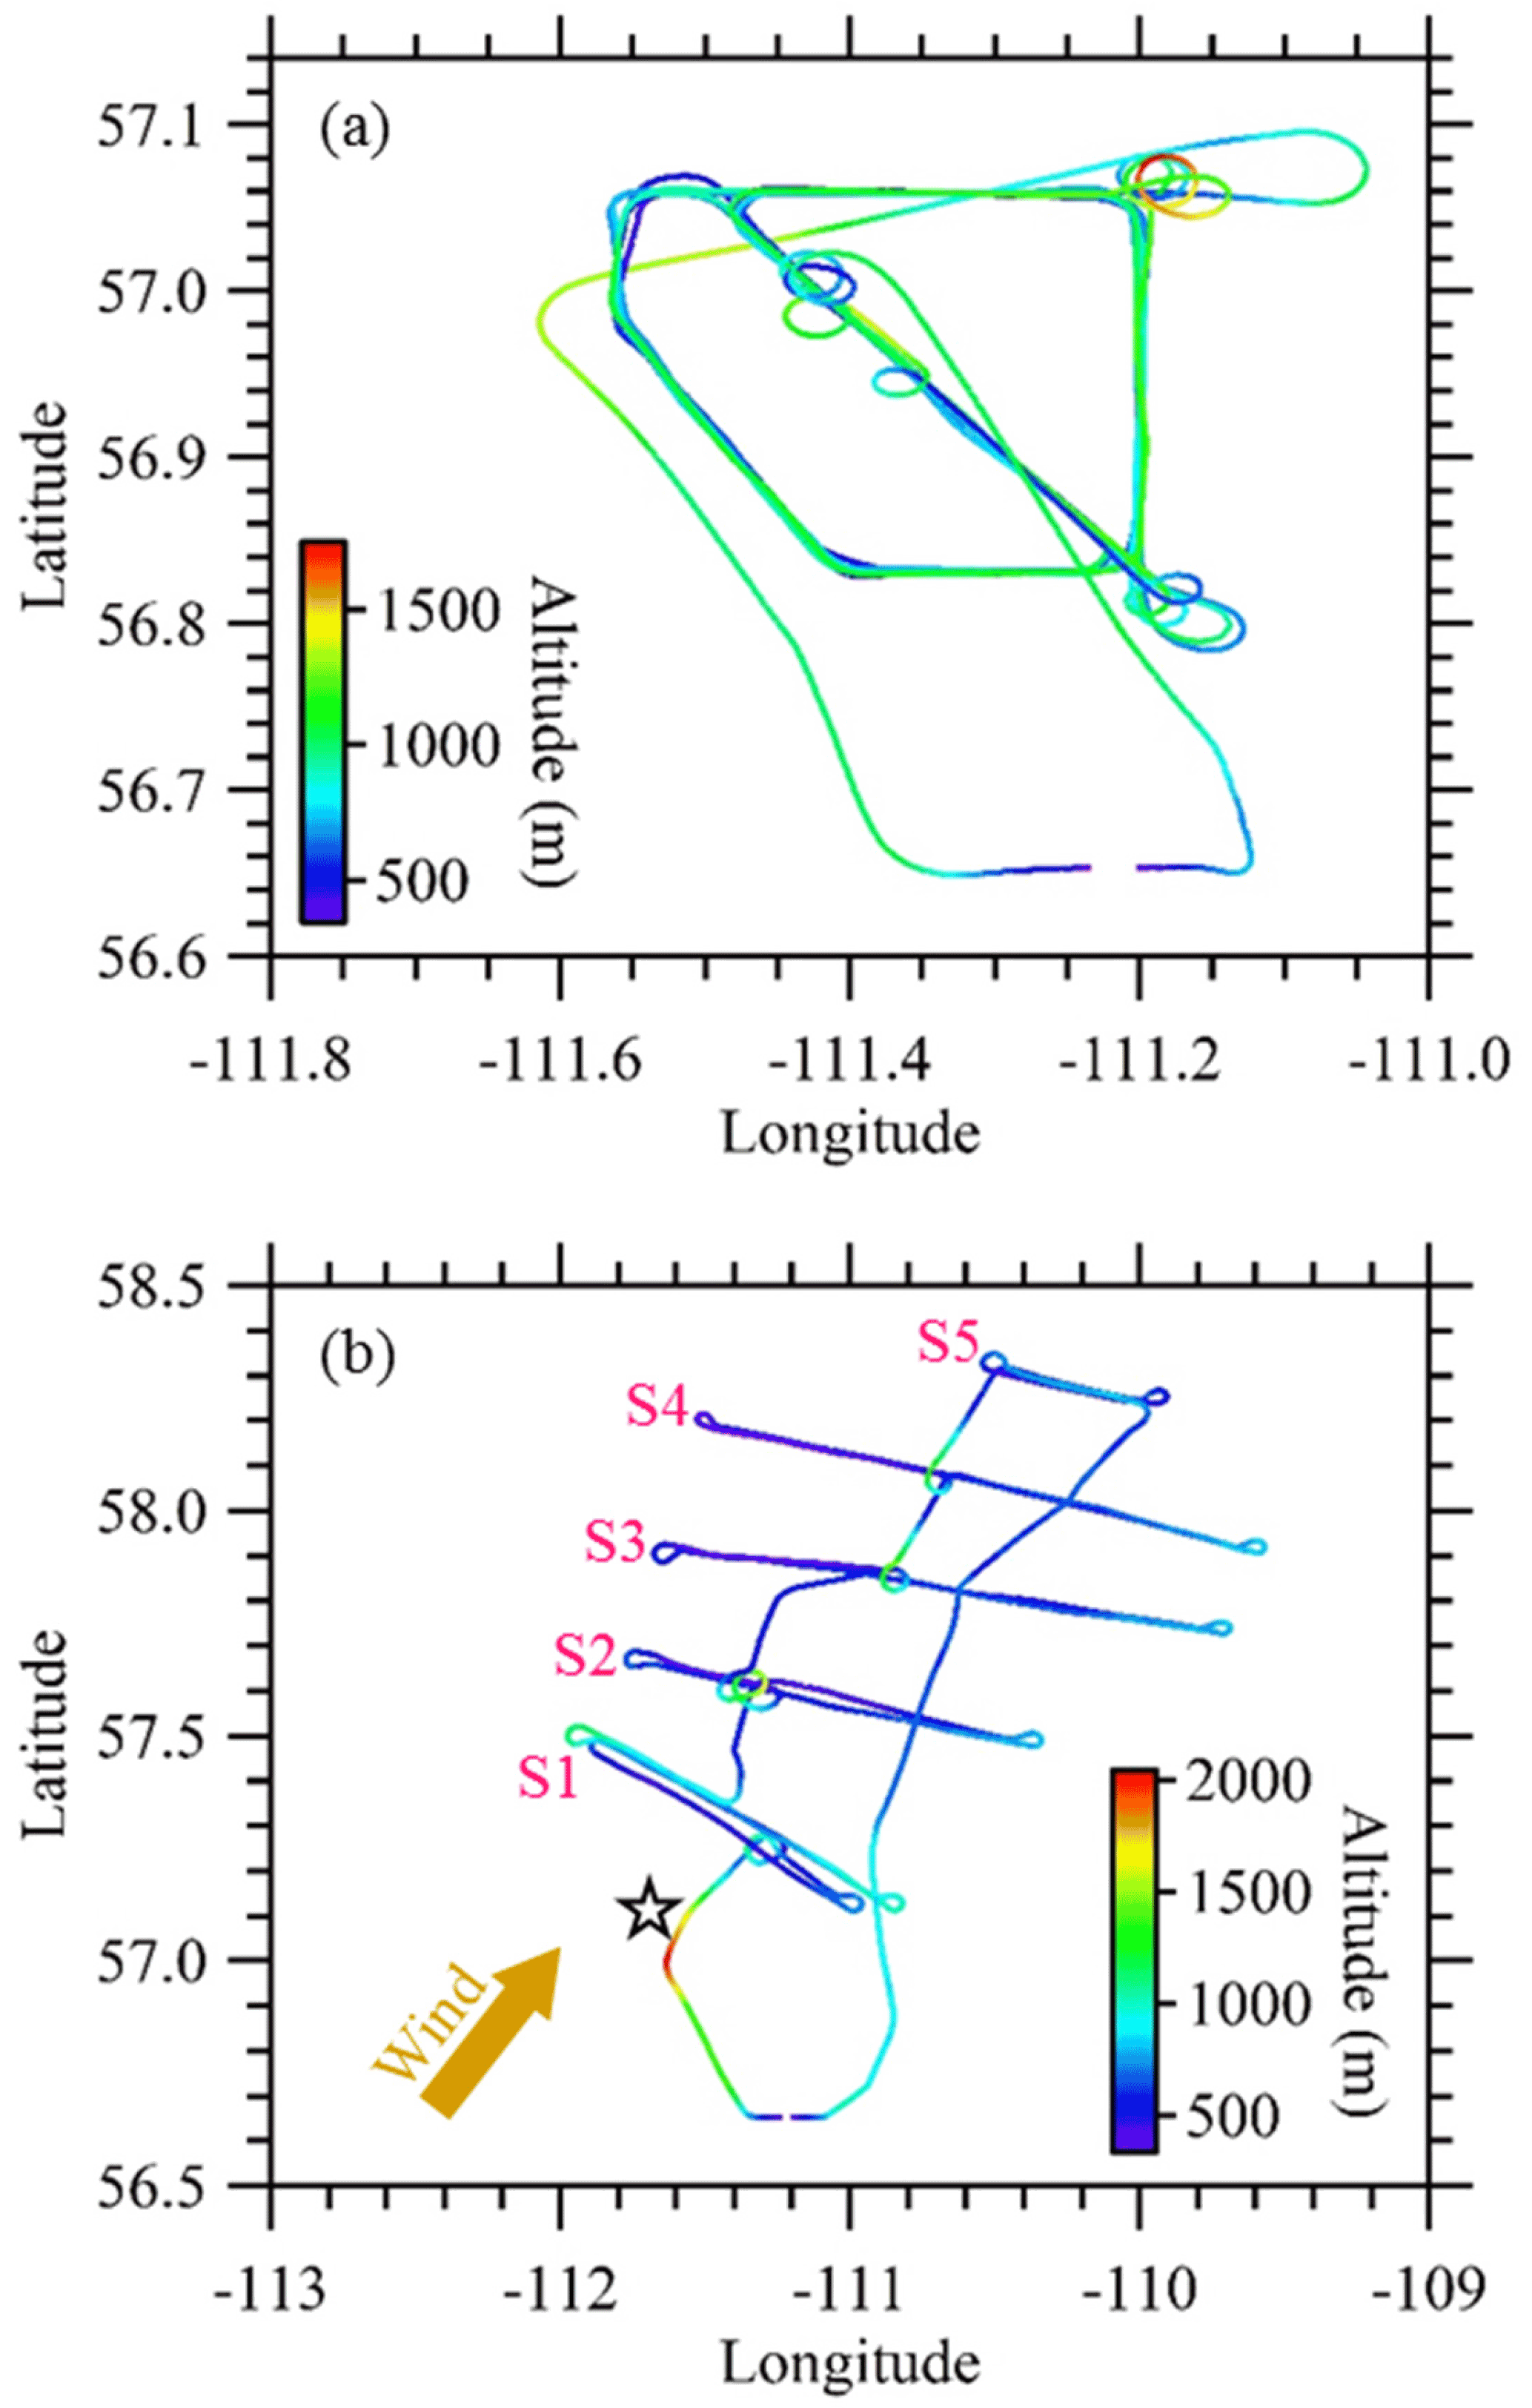
Figure 1Examples of flight tracks for (a) emission and (b) transformation flights, which were flown on 28 August (F_8/28) and September 4 (F_9/4), 2013, respectively. F_8/28 was flown in a five-sided polygon pattern, encircling the SUN facility. F_9/4 was conducted in a Lagrangian pattern, involving five virtual screens (S1 to S5). A virtual screen corresponds to a specific downwind distance from the OS source area and consists of level flight tracks perpendicular to the wind direction at multiple altitudes. Distances between the successive flight screens during F_9/4 were approximately 30 km, whereas distance between the OS center (shown approximately by the open star) and the first screen (i.e., S1, which was located at the downwind edge of the OS source region) was also about 30 km. Composite Google Earth images showing flight tracks are presented in Fig. S1 for F_8/28 and F_9/4. Altitude shown here indicates the ellipsoid height.
Three flights were designed to study transformation of air pollutants emitted from the OS surface mining facilities. They were conducted in a Lagrangian pattern such that the same OS plume was sampled at different time intervals (approximately 1 h apart) as it was transported downwind from the source area (Figs. 1b and S1b). Real-time wind speed and direction measurements were used to guide the intercepting locations. The first intercepting locations were chosen at about 1 h downwind of the majority of the OS facilities so that the emitted air pollutants were well mixed and merged into large plumes. At each intercepting position, the aircraft was flown along level flight tracks perpendicular to the wind direction at multiple altitudes; then these level flight tracks were stacked vertically to create a virtual screen downwind of the OS source area. At least three screens were created for each transformation flight, without industrial emissions in between.
2.2 Aerosol sampling
Aerosols were sampled through an isokinetic, shrouded solid diffuser inlet (Droplet Measurement Technologies Inc., Boulder, CO, USA) with a NASA design as described in Huebert et al. (2004). The inlet was shared by all aerosol instruments inboard the aircraft, including a high-resolution time-of-flight aerosol mass spectrometer (HR-ToF-AMS; Aerodyne Research Inc., Billerica, MA, USA), a condensation particle counter (CPC, Model 3775; TSI Inc., Shoreview, MN, USA), an ultra-high-sensitivity aerosol spectrometer (UHSAS) and a single-particle soot photometer (Droplet Measurement Technologies Inc., Boulder, CO, USA). The UHSAS measures particle number size distribution in the 0.06 to 1.0 µm diameter range. Aerosol number size distributions were also measured using a forward scattering spectrometer probe (FSSP, Model 300; Particle Measuring Systems Inc., Boulder, CO, USA) housed in a pod and mounted under the right wing of the aircraft. The FSSP has a nonintrusive inletless design and measures particle number size distribution in the 0.3 to 20 µm diameter range. A comparison of the measurement results from the UHSAS and FSSP in the overlapping size range of 0.3 to 1.0 µm showed an agreement in terms of both particle numbers and their size distributions (Fig. S2). This comparison suggests that in the inlet and sampling line, both the particle loss and the evaporation loss from the particles were minimal for the < 1.0 µm size range.
2.3 BC measurements by the SP2
From the common inlet and sampling line, a SP2 was used to measure the refractory black carbon (rBC) cores on a particle-by-particle basis based on incandescent light emitted from heated rBC cores when they cross and absorb energy from a laser beam (Stephens et al., 2003; Baumgardner et al., 2004; Schwarz et al., 2006; Moteki and Kondo, 2010; Laborde et al., 2012a). The SP2 used in this study detected single-particle rBC cores in the mass range of ∼ 0.3–16 fg, based on the calibration using regal black particles (Cappa et al., 2012). To account for the rBC cores outside this detection range, a lognormal fit was applied to the measured rBC size distribution and then extrapolated over 10–1000 nm (Schwarz et al., 2006). Here the rBC size refers to the mass equivalent diameter (DMEV) calculated as , where m and ρ are the mass and density of the rBC core, respectively. The value of ρ was assumed to be 1.8 g cm−3, which is the median ρ value recommended by Bond and Bergstrom (2006). Based on this ρ value, the SP2's detection range for single-particle rBC core mass (∼ 0.3–16 fg) corresponded to an rBC size detection range of ∼ 70–260 nm in terms of DMEV. For either rBC mass or number concentration, a scaling factor (FrBC) was calculated as Iwhole∕Idetected, where Iwhole indicates the integral of the lognormal fitting curve from 10 to 1000 nm, and Idetected indicates the integral of the curve from 70 to 260 nm. Subsequently, the final rBC concentration could be determined as FrBC × Cdetected, where Cdetected is the detected rBC concentration (either mass or number) derived from the SP2. All the rBC concentrations involved in this paper have been scaled by flight-specific FrBC.
In addition to emitting incandescent radiation, rBC-containing particles also scatter light when passing through the laser beam of the SP2. Coating thicknesses on rBC cores (Tcoating, in nanometers, nm) can be retrieved from the scattering signals on a particle-by-particle basis, using Mie theory calculation with a series of assumptions (Schwarz et al., 2008a, b; Laborde et al., 2012b). To calculate Tcoating for an rBC-containing particle, the internally mixed particle needs to be idealized as a two-component sphere with a concentric core-shell morphology. In this study, the rBC core was assumed to have a complex refractive index of 2.26–1.26i, which was initially suggested by Moteki et al. (2010) and subsequently confirmed by Taylor et al. (2015). The coating material on a rBC core was assumed to have a complex refractive index of 1.5–0i, which is representative of the corresponding values determined for inorganic salts (e.g., ammonium sulfate) and secondary organic aerosol (Schnaiter et al., 2005; Lambe et al., 2013). The core size was held fixed at DMEV of the rBC core, whereas the diameter of the whole particle was varied in the Mie calculation until the modeled scattering cross section matched the measurement. The measured scattering cross section was determined by a leading-edge-only (LEO) fit to the recorded scattering signal (Gao et al., 2007). Finally, Tcoating was calculated as the difference between the radii of the whole particle and the rBC core.
A key step in retrieving Tcoating of an rBC-containing particle from its scattering signal (S) is the LEO fit, which requires at least S can be properly measured (Schwarz et al., 2008a, b; Laborde et al., 2012b; Liu et al., 2014). The LEO fit cannot be performed when S is outside the SP2's detection range of scattering intensity. Thus, Tcoating cannot be calculated for relatively small rBC cores with thin coatings (i.e., rBC-containing particles with S below the lower detection limit of scattering intensity) or relatively large rBC cores with thick coatings (i.e., rBC-containing particles with S above the upper detection limit of scattering intensity) (Metcalf et al., 2012; Dahlkötter et al., 2014). This limitation prohibits a direct comparison of Tcoating across all rBC cores with different sizes.
Moreover, the retrieved Tcoating could be considerably influenced by uncertainties introduced by the LEO fit. These uncertainties can be evaluated using non-rBC-containing particles. The scattering signals of non-rBC-containing particles always have the shape of a full Gaussian curve, since they will not evaporate or change in size when passing through the SP2's laser beam. Thus, for non-rBC-containing particles, the LEO fit should in principle lead to the same scattering amplitude or the same optical size (Doptical) as that retrieved from a fit to the full scattering signal (i.e., the full-Gaussian fit) (Gao et al., 2007). In this study, the LEO and full-Gaussian fits agreed within approximately ±15 % in determining Doptical for non-rBC-containing particles (Fig. 2). Here Doptical were calculated from the fitted scattering amplitudes, by assuming a complex refractive index of 1.5–0i for non-rBC-containing particles. Doptical was used in Fig. 2 to evaluate the agreement between the LEO and full-Gaussian fits because it was more directly related to Tcoating compared to the scattering amplitude.
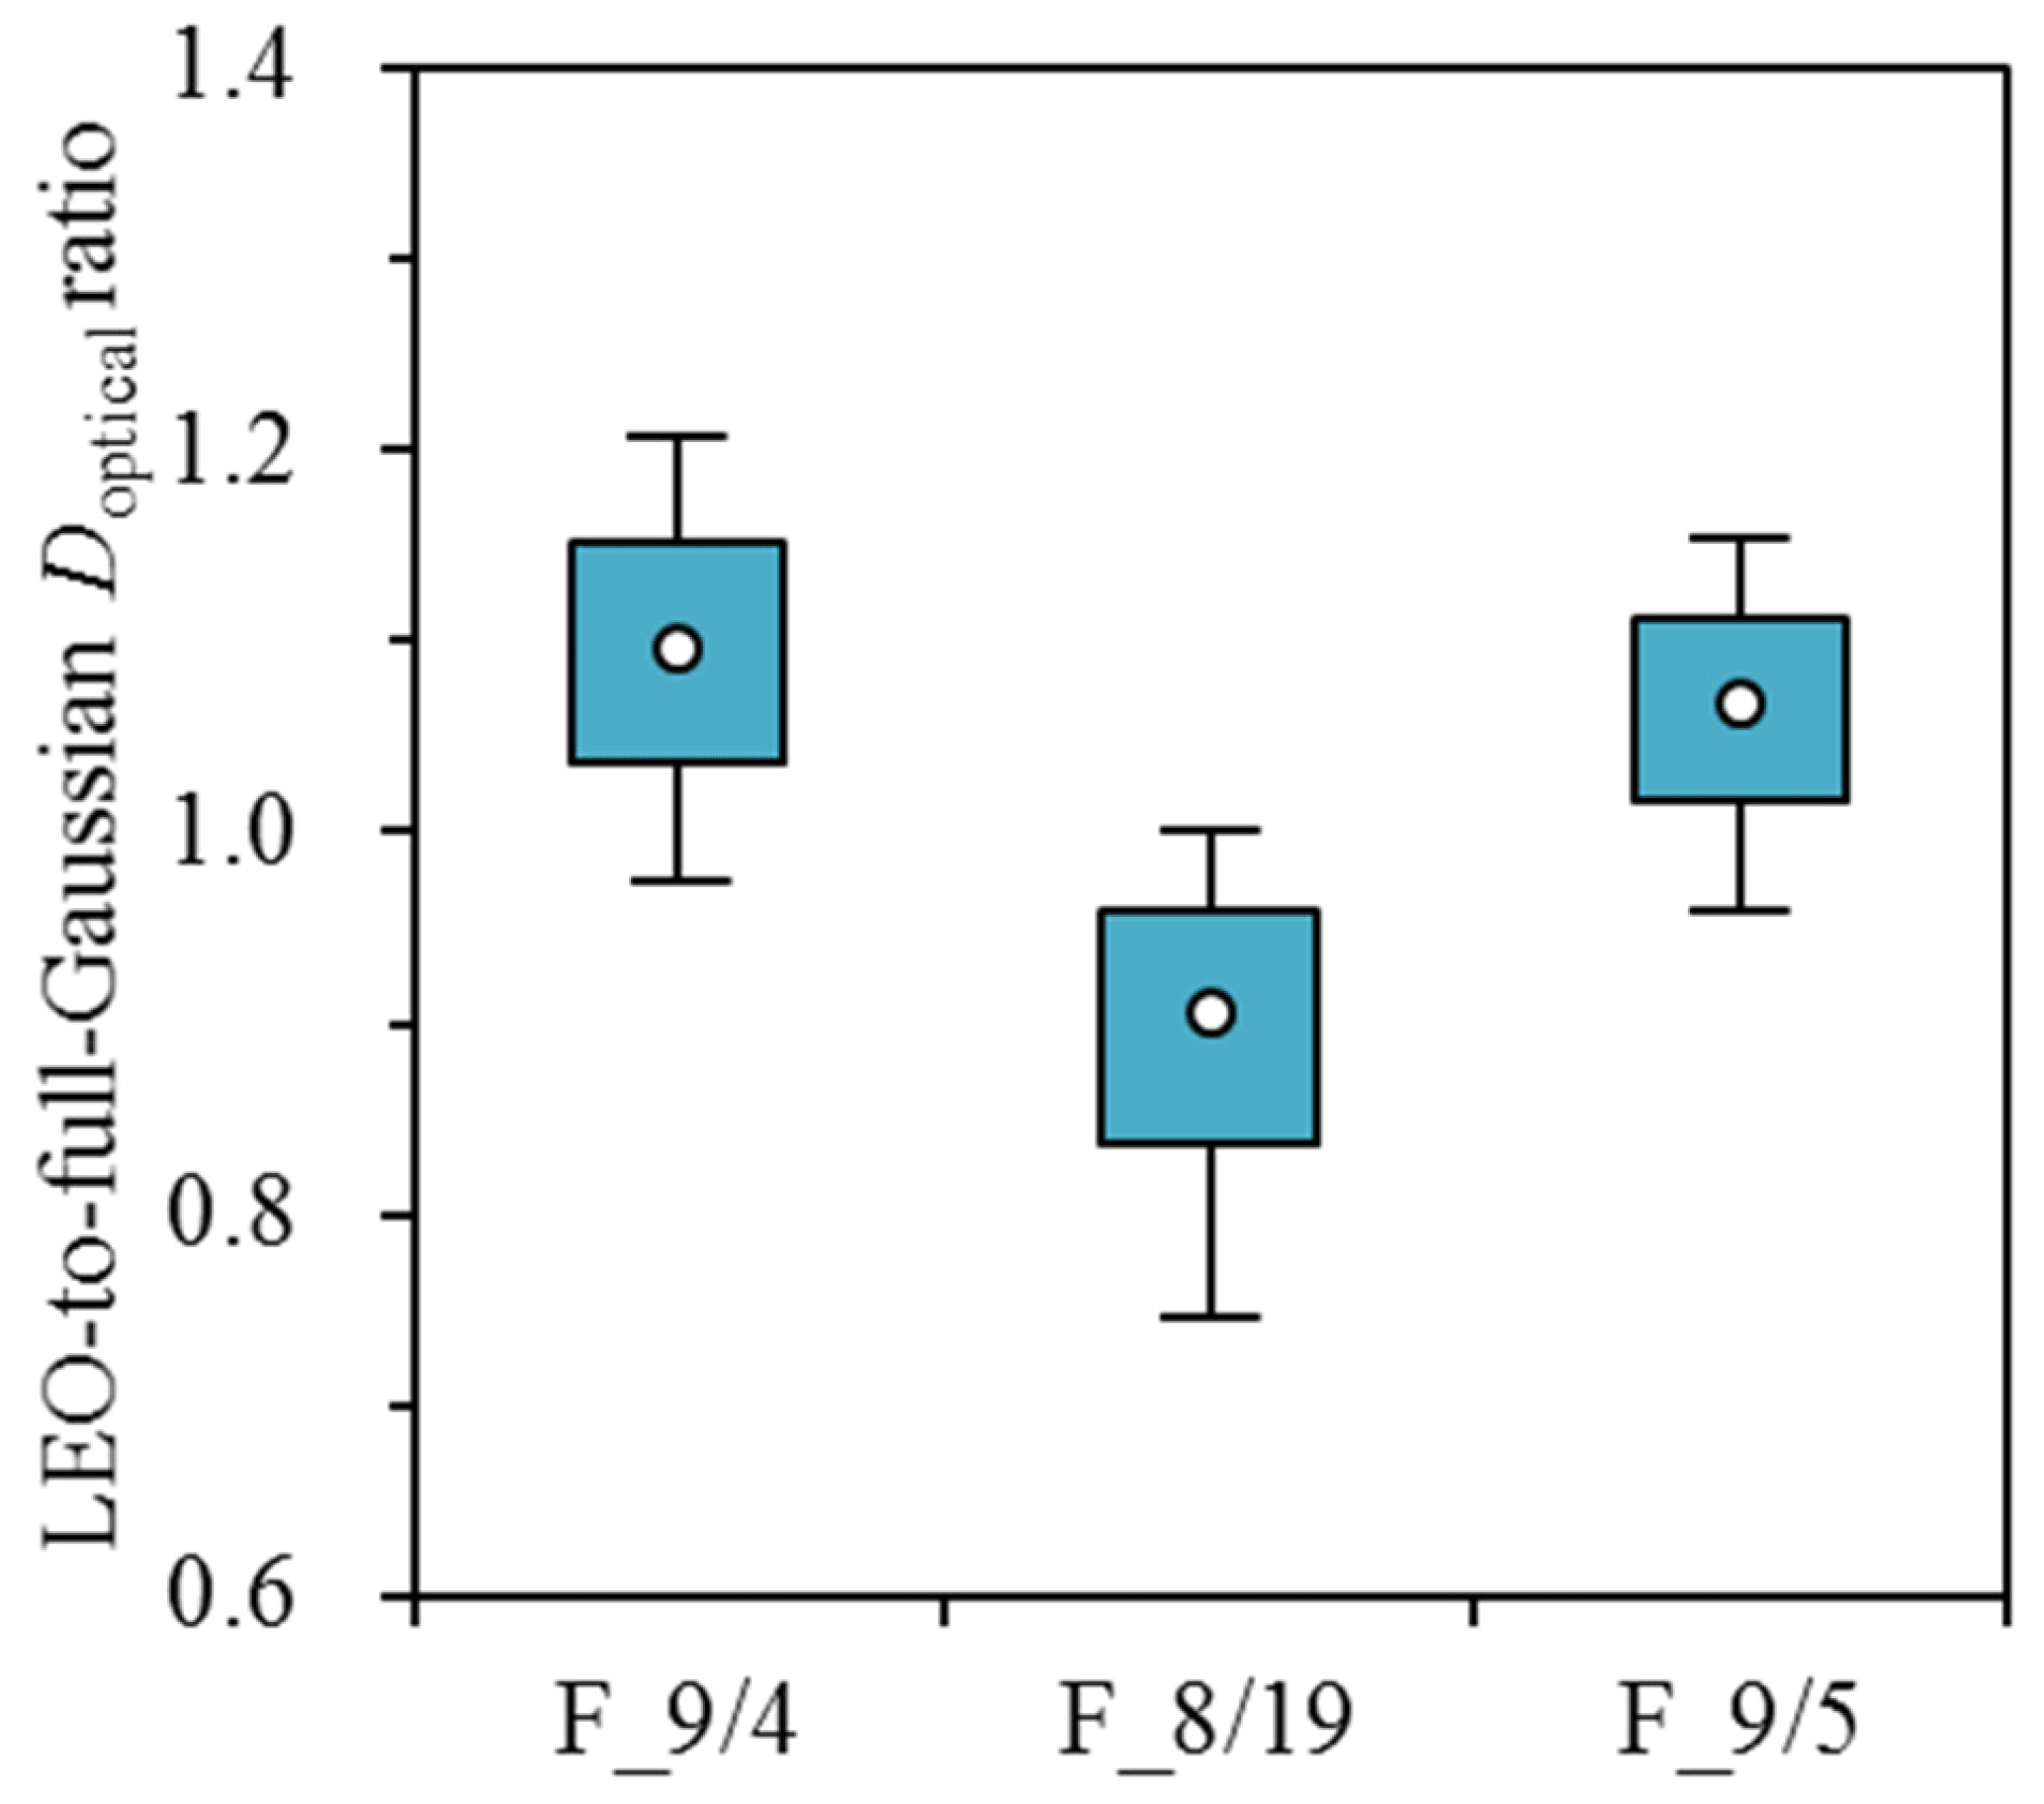
Figure 2Relationships between optical sizes (Doptical) retrieved from the LEO and full-Gaussian fits for non-rBC-containing particles observed during the three transformation flights conducted on 4 September (F_9/4), 19 August (F_8/19) and 5 September (F_9/5), 2013.

Figure 3Mass and number size distributions of rBC for the 14 emission flights conducted over the OS facilities. For each flight, measured masses of individual rBC cores are first grouped into different size bins and then fitted by a lognormal curve; rBC counts are processed similarly. Results from flight tracks between the airport and OS facilities are not involved in the analysis. Measurement dates and the targeted OS facilities (1–3) are also shown for each flight. MMD, NMD, mass and number distribution widths, which are determined by lognormal fits to the measurement results, are summarized in Supplement Table S1 for these emission flights.
2.4 Additional data sets used
Organic aerosol (OA) mass was measured with a time resolution of 10 s by the HR-ToF-AMS. Photochemical age was calculated as −log10(NOx ∕ NOy), where NOx is the sum of nitrogen monoxide and nitrogen dioxide (i.e., NO + NO2) and NOy refers to the total reactive oxidized nitrogen compounds (Kleinman et al., 2008). Measurements of OA, NOx and NOy during the aircraft campaign have been described elsewhere (Liggio et al., 2016).
3.1 rBC size distributions over the OS source region: facility-integrated results
For each flight, the measured masses of the individual rBC cores over the entire flight were first grouped into different size bins and then fitted by a lognormal curve:
where Amass, X1, mass and X2, mass are the fitting parameters. The fitting parameter X1, mass will be termed the mass median diameter (MMD), and the fitting parameter X2, mass will be loosely referred to as the mass distribution width (Widthmass) which can be converted to the standard deviation of the distribution (σmass) by . As can be seen from Eq. (1), Amass is proportional to the absolute value of rBC mass concentration and thus it is unimportant for describing the shape of a lognormal curve. This is particularly the case for comparison of rBC size distributions among different OS facilities. It should also be noted that the mass-based scaling factor (FrBC, mass), which accounts for the rBC masses outside the SP2's detection range, is independent of Amass. Therefore, Amass will not be further discussed in rBC size distribution. Similarly, rBC number size distribution could be expressed as follows:
where Anumber, X1, number and X2, number are the fitting parameters. X1, number and X2, number will be termed the number median diameter (NMD) and the number distribution width (Widthnumber), respectively. Widthnumber can be converted to the standard deviation of the rBC number size distribution (σnumber) by .
Mass and number size distributions of rBC are summarized in Fig. 3 for the 14 emission flights. As shown in Fig. 3, the rBC MMD and NMD were typically in the range of 135–145 and 60–70 nm, respectively, while both the mass and number distribution widths were approximately 0.7 (the corresponding σmass and σnumber were about 1.6). Most of the rBC from the surface mining facilities were from the heavy diesel trucks used to transport the mined oil sands ores to centralized locations in each facility for bitumen separation from the sands. In most cases, rBC emissions from the six major OS surface mining facilities exhibited similar size distributions. These rBC size distributions are comparable with those observed for urban emissions and source (or near-source) samples representing different types of engine exhausts (Table 1). For example, (1) during an airborne measurement conducted as part of the CalNex 2010 campaign, rBC MMD was estimated to be 122 nm over the Los Angeles Basin (Metcalf et al., 2012); (2) rBC MMD observed in urban outflows were typically in the range of 140–180 nm, as evidenced by ground-based measurement downwind of Tokyo (Shiraiwa et al., 2007), and by aircraft-based observations over Texas (Schwarz et al., 2008a), California (Sahu et al., 2012), and western and northern Europe (McMeeking et al., 2010); (3) when mainly impacted by traffic emissions, rBC MMDs were about 100 and 120 nm for a suburban site in Paris (Laborde et al., 2013) and an urban site in London (Liu et al., 2014), respectively; (4) rBC MMD measured at urban sites in Tokyo, Japan (Kondo et al., 2011b), and Sacramento, CA (Cappa et al., 2012), were between 140 and 150 nm; (5) a laboratory study showed that the MMD was about 125 nm for rBC cores emitted from a diesel car (Laborde et al., 2012b); (6) a MMD of 126 nm was observed for rBC at Cranfield Airport in the UK, attributable to aircraft engine exhausts (McMeeking et al., 2010). Although not all of these studies determined rBC MMD and NMD simultaneously, rBC NMD were typically in the range of ∼ 60 to 80 nm for urban emissions dominated by contributions from fossil fuel combustion (e.g., Schwarz et al., 2008a; Kondo et al., 2011b; Metcalf et al., 2012).
Table 1A summary of rBC MMDs representative of different types of emission sources. The calibration material and assumed density of rBC are also shown. The corresponding rBC NMDs are presented in parentheses when available.
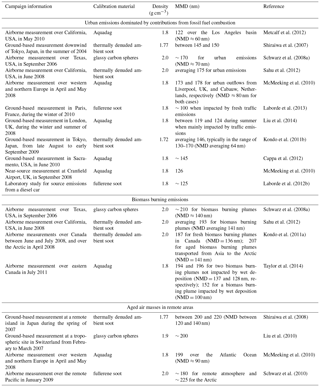
A comparison of rBC size distributions between this study and previous ones confirms the finding that rBC cores emitted from fossil fuel combustion were smaller in size compared to those from biomass burning (e.g., Schwarz et al., 2008a). The rBC MMDs and NMDs measured in biomass burning plumes were typically around 200 and 140 nm (Table 1), respectively, as supported by airborne measurements over Texas (Schwarz et al., 2008a), California (Sahu et al., 2012), Canada (Kondo et al., 2011a; Taylor et al., 2014) and the Arctic (Kondo et al., 2011a). However, wet deposition could lead to a large decrease (e.g., as much as 50 nm) in the MMD of rBC cores in biomass burning plumes (Taylor et al., 2014), suggesting that an rBC MMD substantially smaller than 200 nm does not exclude the possibility of biomass burning contributions.
Different assumptions have been made by aerosol–climate models for the size distribution of black carbon. For example, the NMD of black carbon emitted by fossil fuel combustion were assumed to be 30, 40 and 60 nm by Dentener et al. (2006; for AeroCom Phase I models), Heald et al. (2014; for a radiative transfer model coupled with GEOS-Chem) and Stier et al. (2005; for the aerosol–climate modeling system ECHAM5-HAM), respectively. According to the SP2 measurement results on rBC, including results from the present study, a NMD of 60 nm would be a more appropriate input parameter in the models for black carbon emissions from fossil fuel combustion. However, there is also a need to evaluate the unimodal assumption for black carbon size distribution (Liggio et al., 2012; Buffaloe et al., 2014), given the SP2's limited detection range of rBC core size.
3.2 rBC size distributions over the OS source region: time-resolved results
In addition to the facility-integrated results (Fig. 3), lognormal fits were also applied to 2 min intervals of rBC data derived from the SP2. Figures 4 and 5 show results from the emission flights conducted for CNRL on 26 August 2013 (i.e., F_8/26) and for SUN on 28 August 2013 (i.e., F_8/28), respectively. In both cases, the rBC mass and number size distributions did not exhibit major temporal variations, despite the minor fluctuations observed during F_8/28. The stable rBC size distribution within a flight can be more readily seen from Fig. 6a, which indicates that the rBC MMD, mass distribution width and therefore the mass-based scaling factor (FrBC, mass) were independent of rBC concentration. As shown in Fig. 6a and Table 2, the variations of rBC MMD, mass distribution width and FrBC, mass were within 5 % for F_8/26. Larger variations in rBC size distribution were observed for F_8/28, but the variations in these three parameters were still within 10 %. The variations of rBC NMD, number distribution width and number-based scaling factor (FrBC, number) were also within 10 % for both F_8/26 and F_8/28 (Table 2).
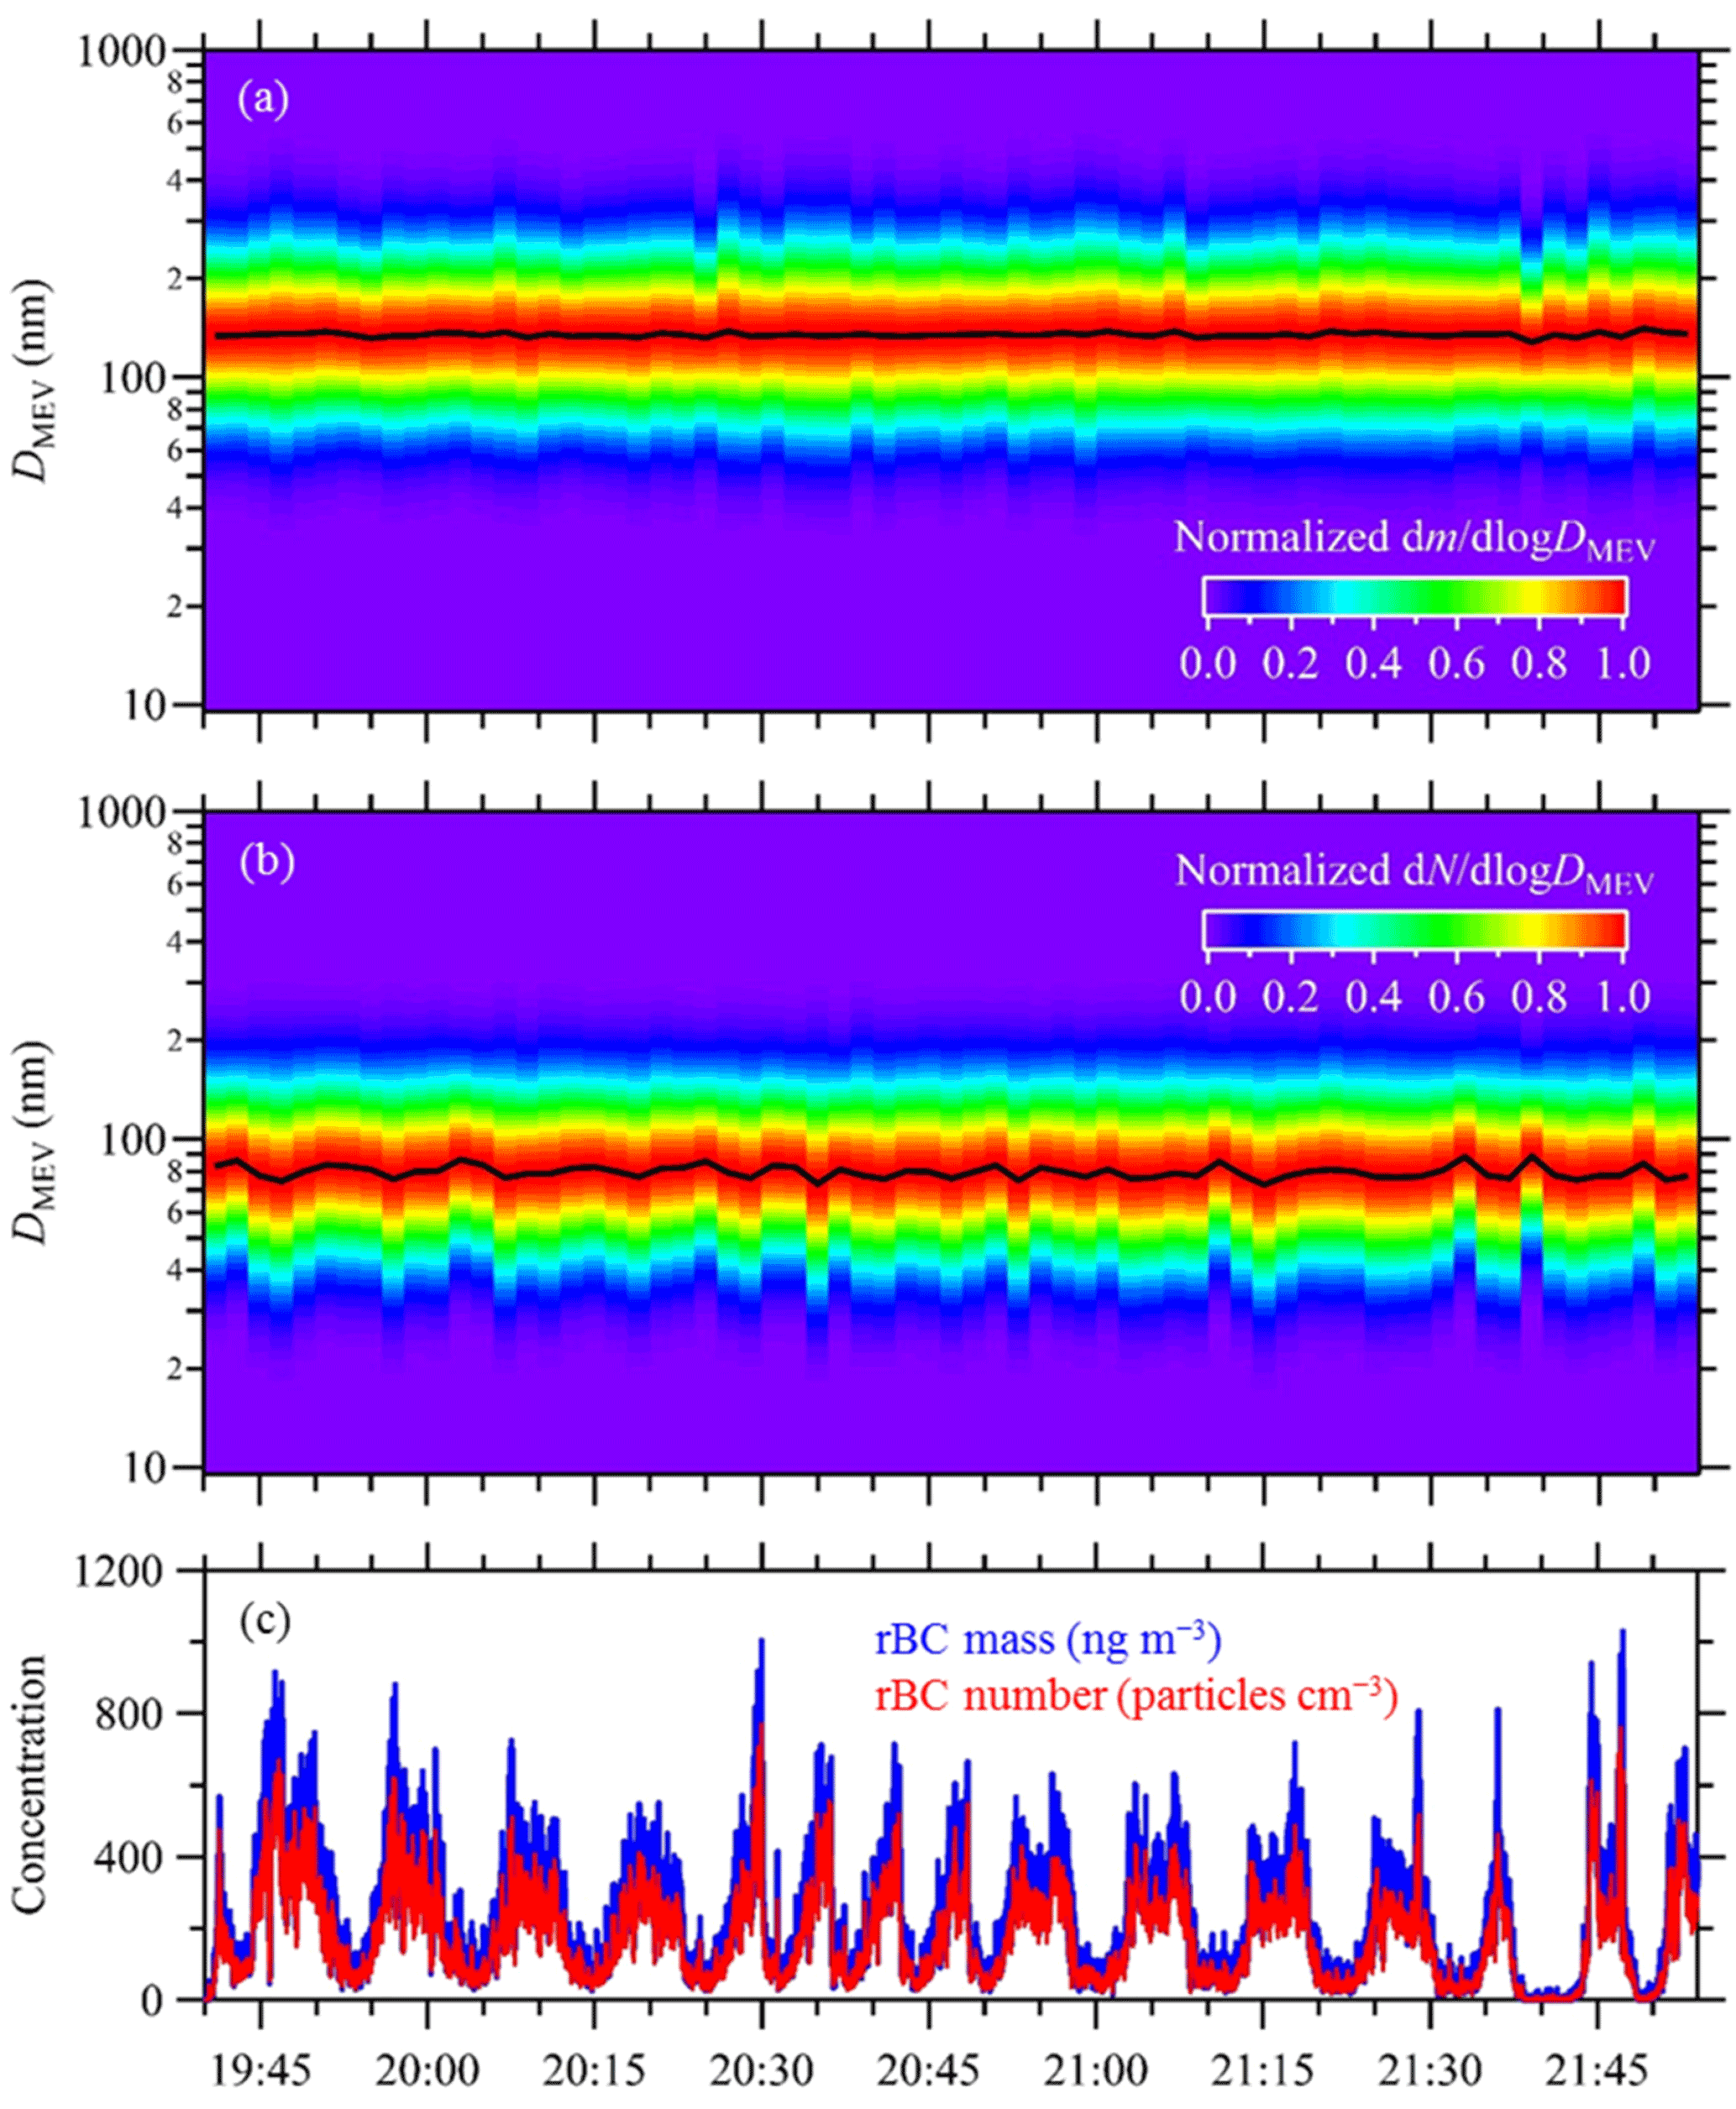
Figure 4Time-resolved rBC (a) mass size distribution, (b) number size distribution and (c) concentrations observed over the CNRL facility during F_8/26. Solid lines in (a) and (c) indicate MMD and NMD, respectively. The horizontal axis shows UTC time.
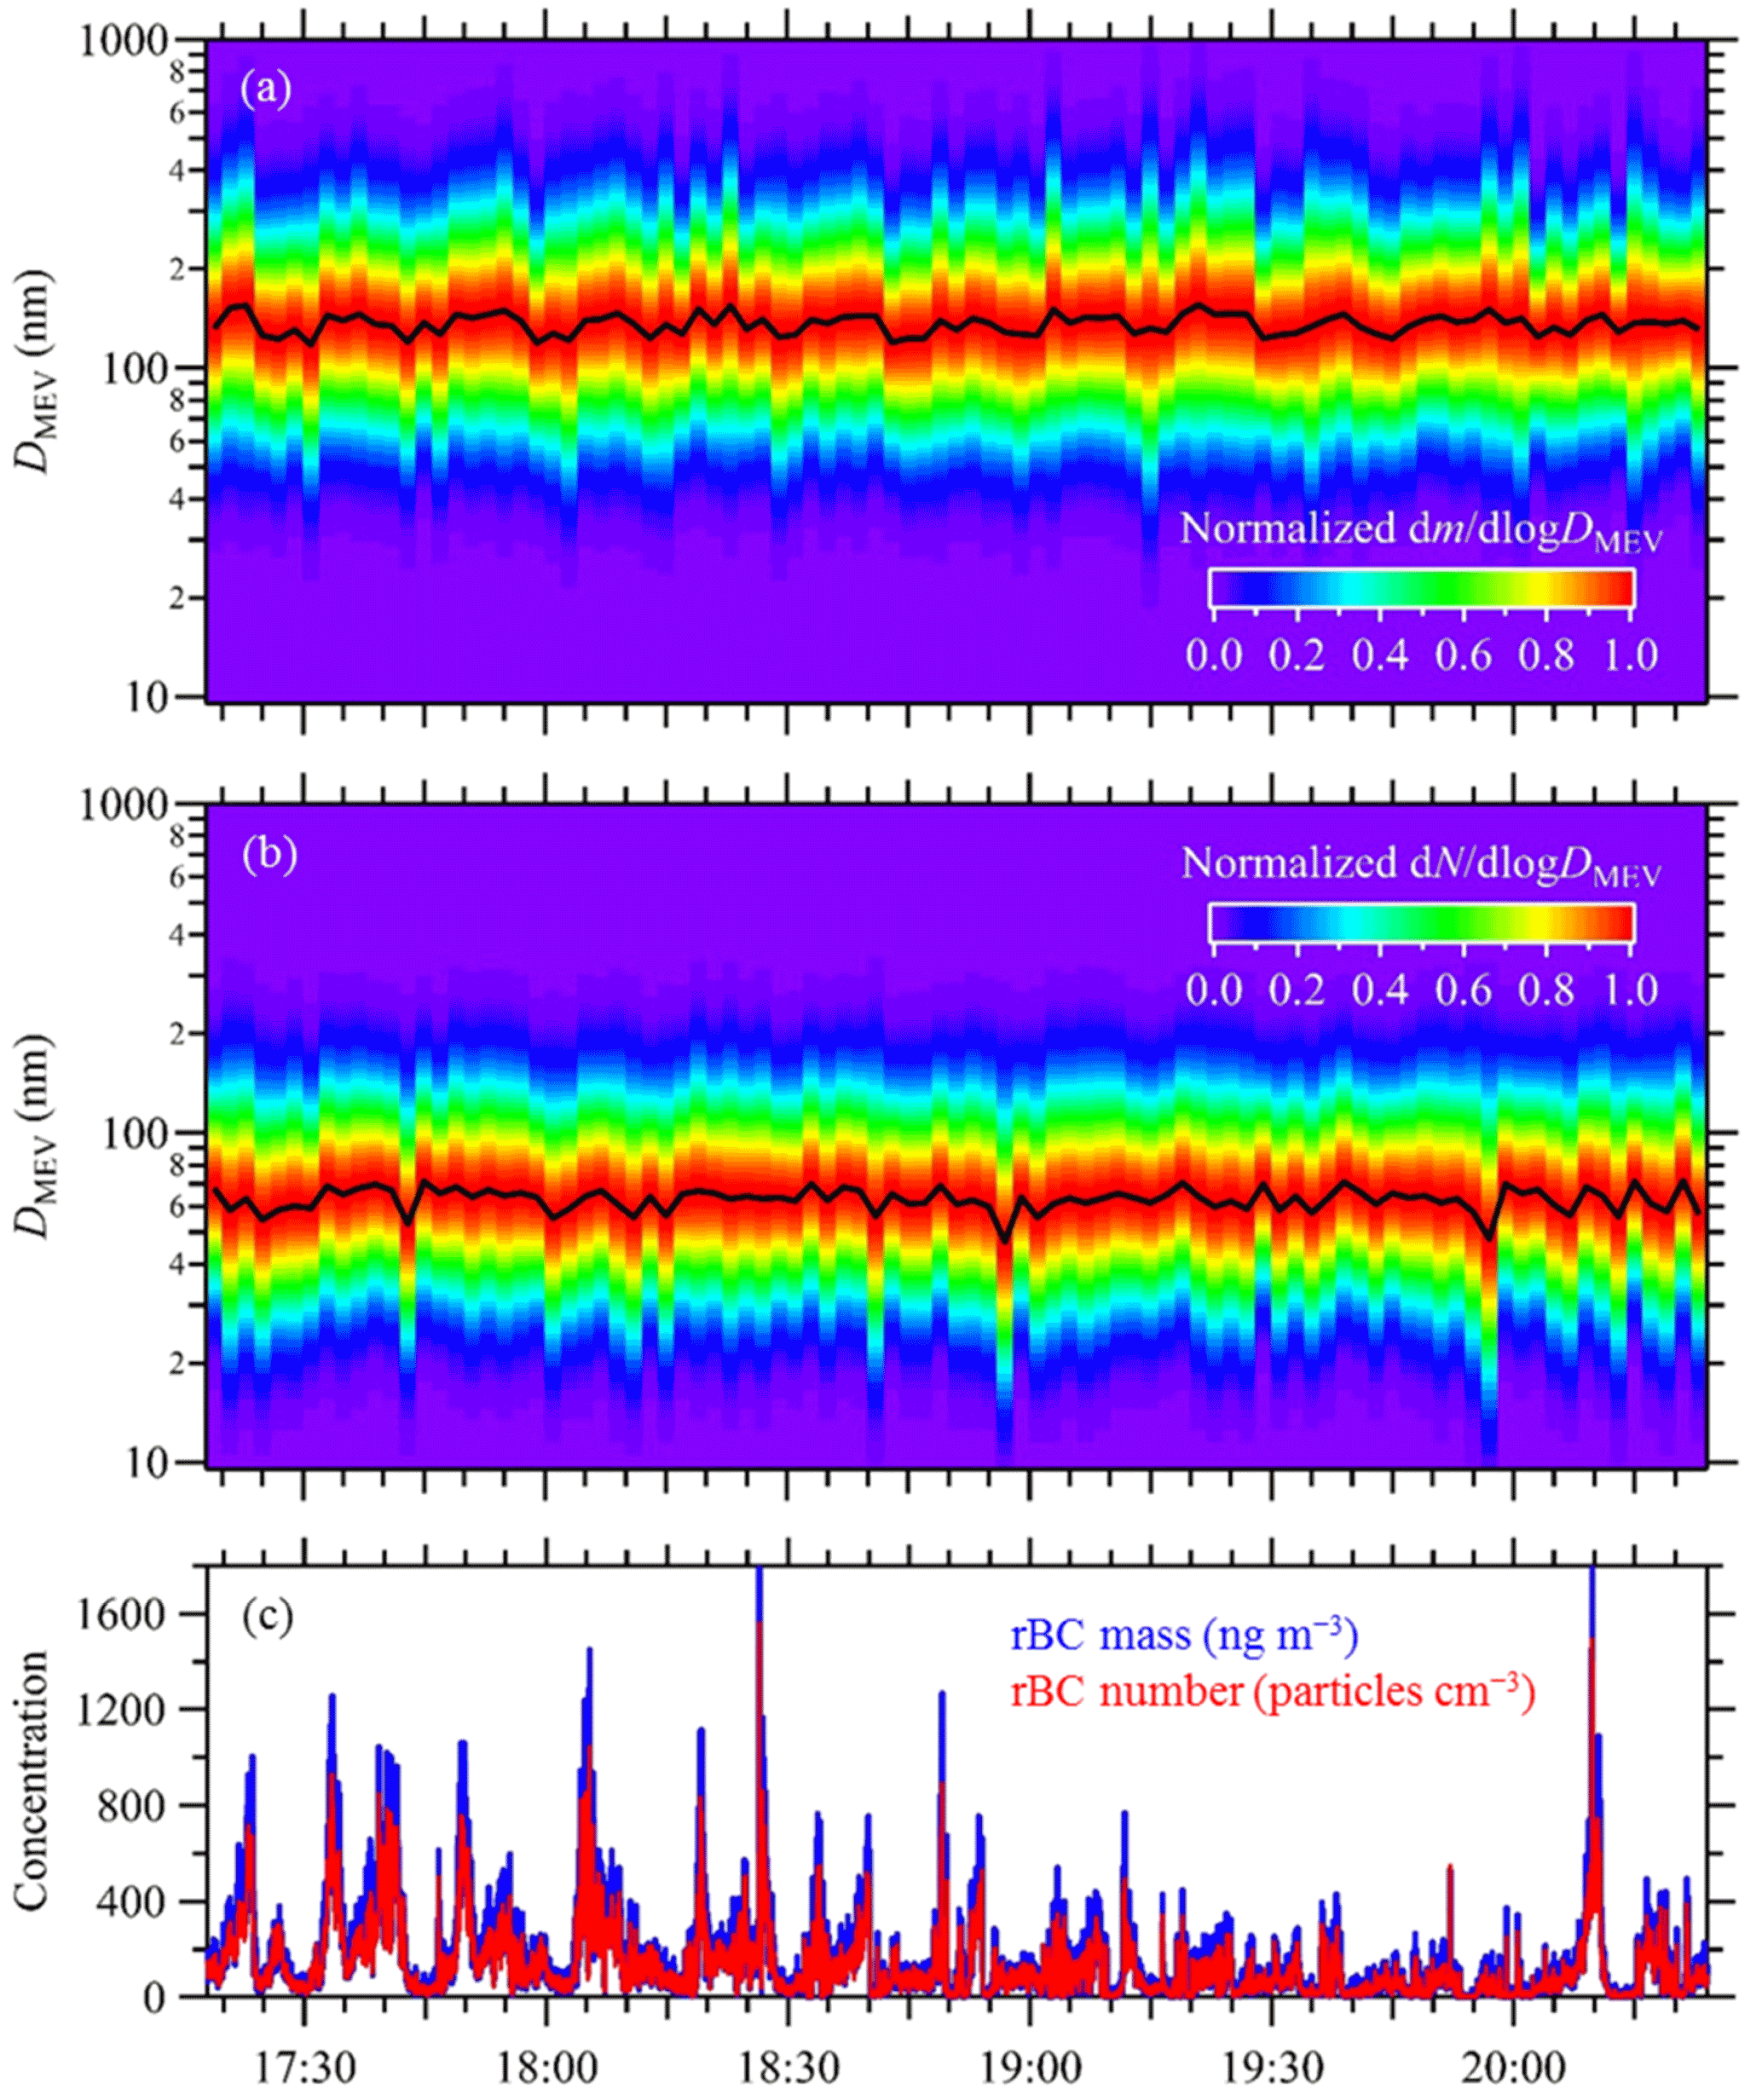
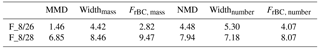
Figure 5Time-resolved rBC (a) mass size distribution, (b) number size distribution and (c) concentrations observed over the SUN facility during F_8/28. Solid lines in (a) and (c) indicate MMD and NMD, respectively. The horizontal axis shows UTC time. The flight track of F_8/28 is shown in Fig. 1a.
Table 2Variations of the parameters derived from time-resolved lognormal fits to single-particle rBC data measured during F_8/26 and F_8/28. Variations are determined as relative standard deviations (RSDs, in percentage).
The temporal variations of rBC concentration shown in Figs. 4 and 5 were mainly driven by the in- vs. out-of-plume differences. There was a sharp increase in rBC concentration when the aircraft flew into a plume, whereas the rBC concentration deceased rapidly when the aircraft left the plume. Therefore, the stable rBC size distributions observed for the emission flights, which were clearly independent of rBC concentration (e.g., Fig. 6a), signify negligible difference in the rBC size distribution between the in- and out-of-plume conditions over the OS source region. The size distribution consistency for rBC is observed regardless of the threshold rBC concentration used to distinguish the in- and out-of-plume conditions, which is flight-dependent (e.g., ∼ 0.1 µg m−3 in terms of 2 min averaged rBC mass concentration for F_8/26 as shown in Fig. S3). The implications of consistent size distributions for rBC near the sources are further discussed in Sect. 3.3 together with results from the transformation flights.

Figure 6Dependences of (a) rBC MMD, mass distribution width (Widthmass) and mass-based scaling factor (FrBC, mass), and (b) photochemical age on rBC concentration during F_8/26. Time resolution is 2 min for all the parameters shown here. Based on the temporal variation of 2 min averaged rBC mass concentration (Fig. S3), rBC ≤ 0.1 µg m−3 can be used as an indicator for typical out-of-plume conditions during F_8/26. Uncertainties introduced by lognormal fitting are within ±5 nm and ±0.06 for the time-resolved MMD and Widthmass, respectively.
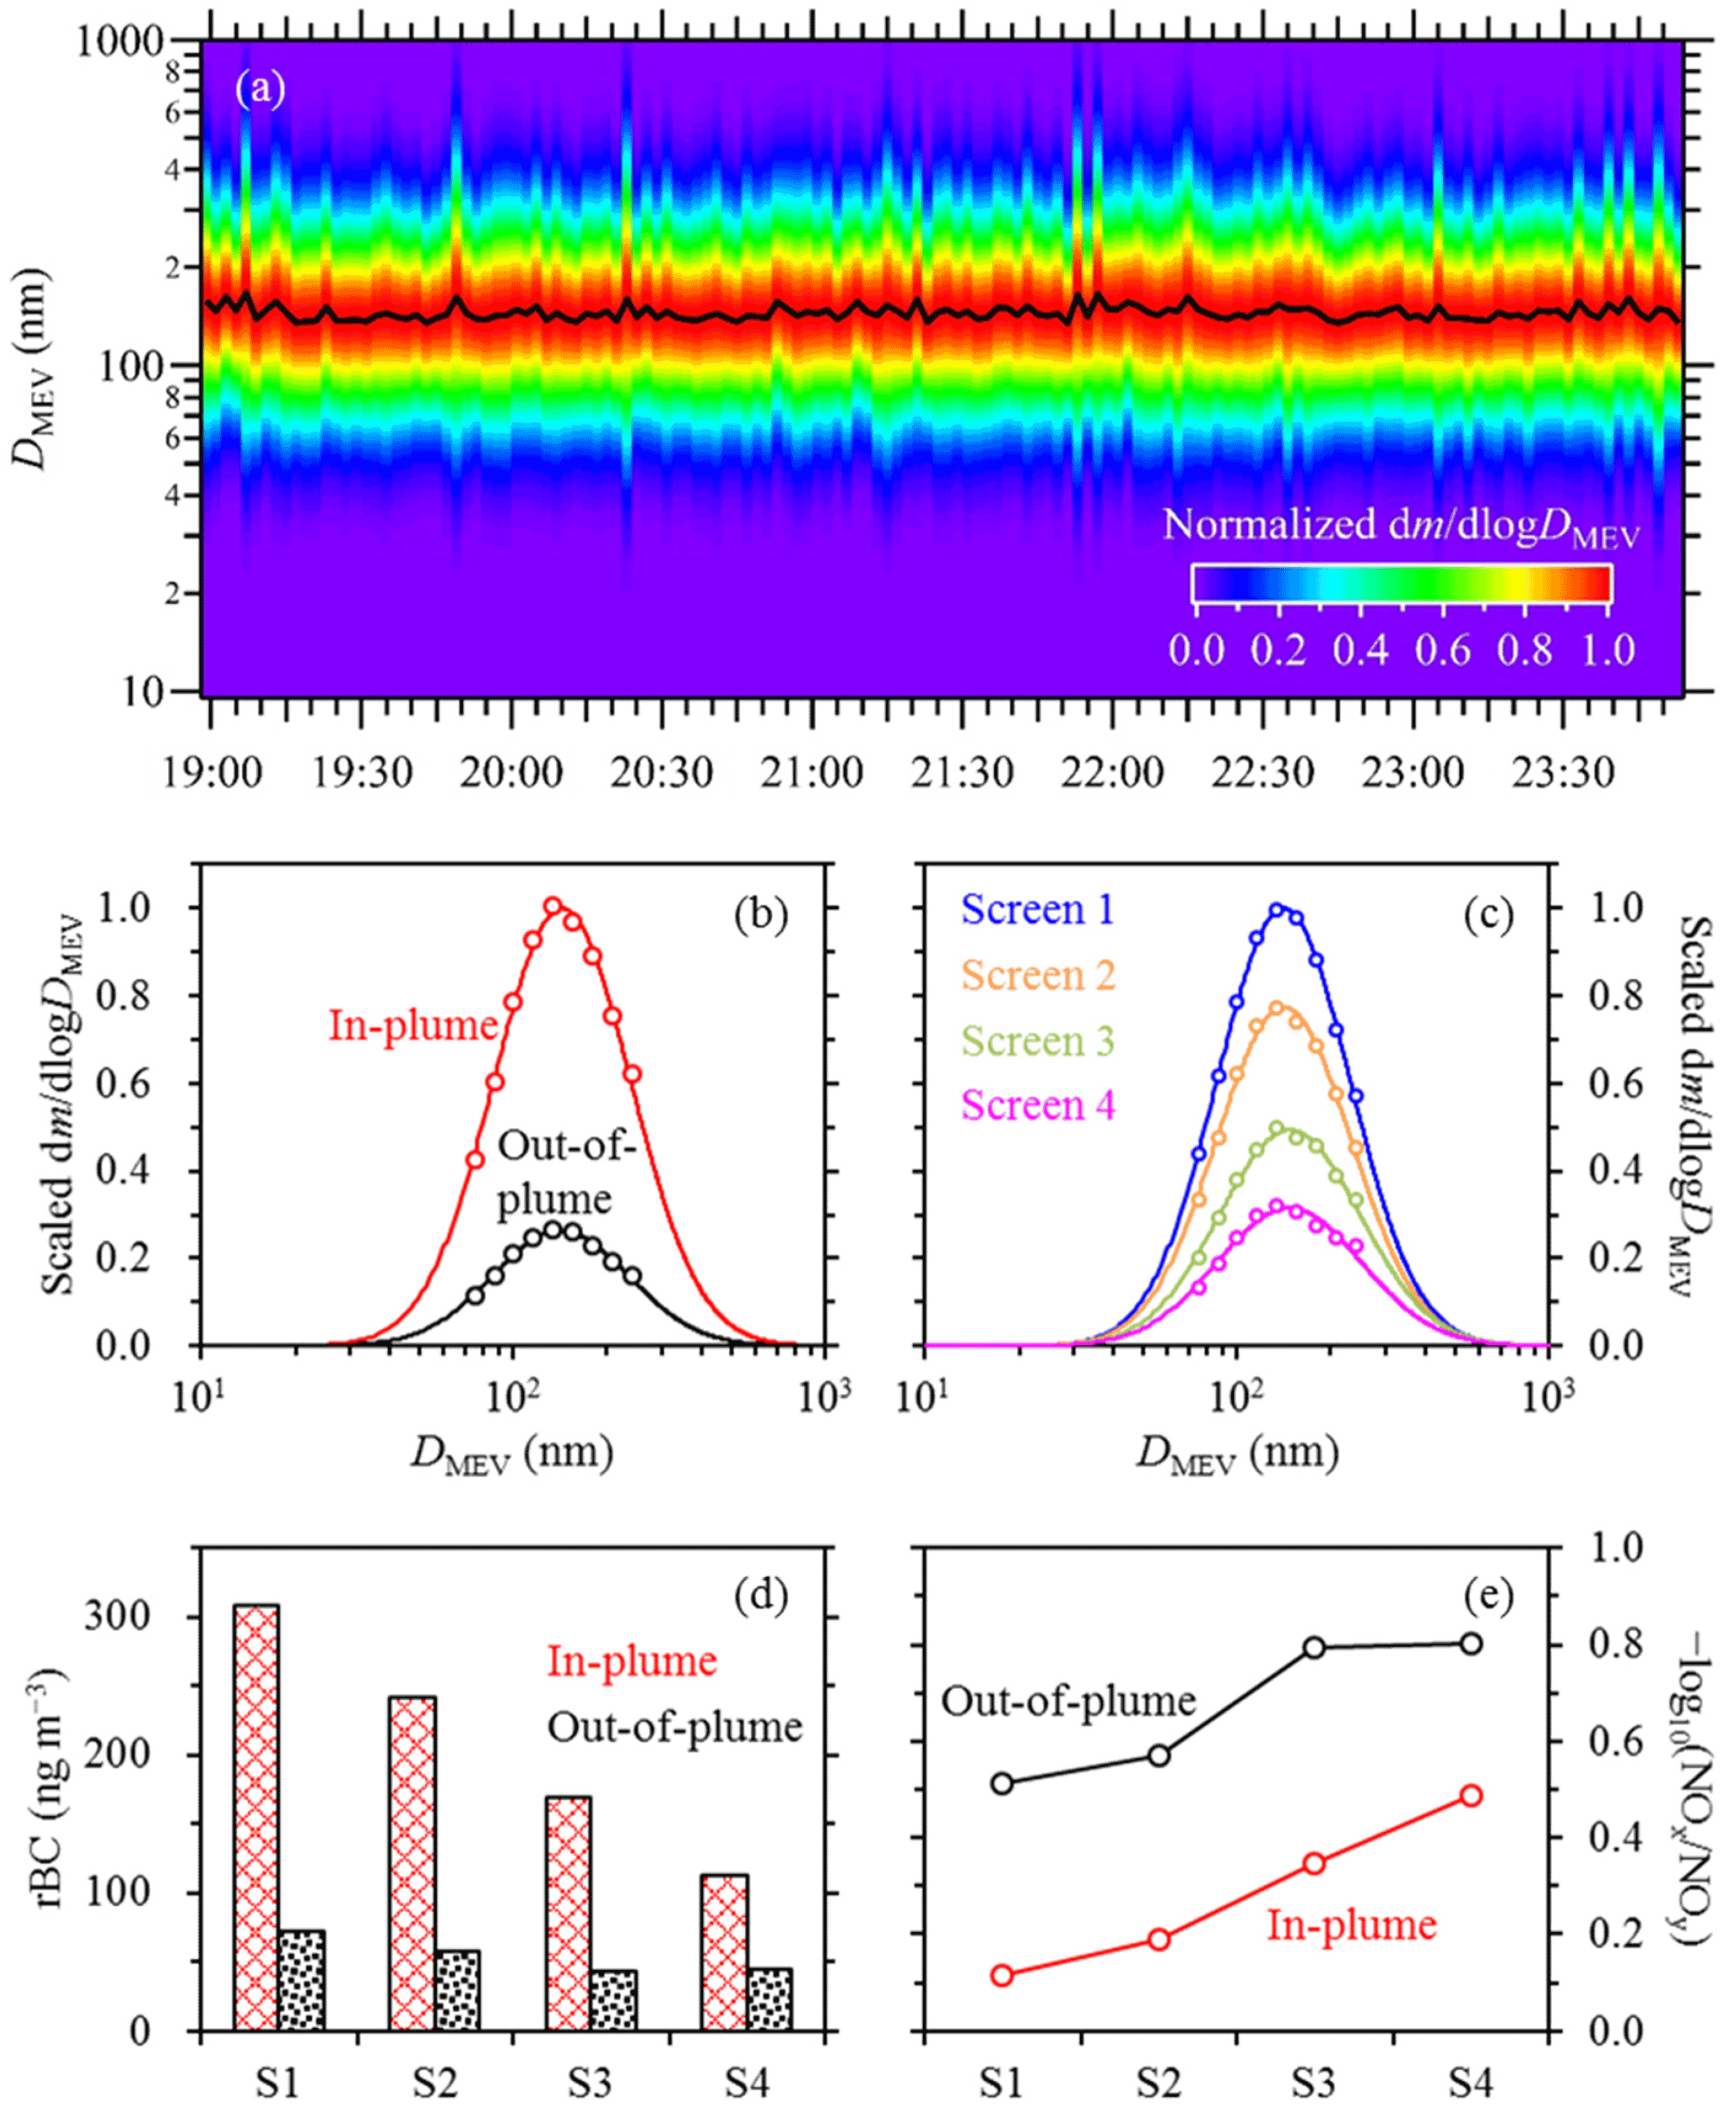
Figure 7(a) Time-resolved rBC mass size distribution observed during the transformation flight F_9/4, (b) comparison of rBC mass size distributions between typical in- and out-of-plume conditions, (c) comparison of in-plume rBC mass size distributions among successive flight screens, and evolutions of (d) average rBC mass concentration and (e) photochemical age from screen 1 (S1) to screen 4 (S4). Scaling of out-of-plume rBC size distribution in (b), scaling of rBC size distributions for screens 2 to 4 in (c), and reason for excluding results from screen 5 in (c) to (e) are explained in the text.
In addition to rBC concentration, the in- and out-of-plume air masses had different photochemical ages as indicated by their values of −log10(NOx ∕ NOy), determined from concurrent measurements of NOx and NOy. As shown in Fig. 6b, there was a robust negative correlation between the rBC mass concentration and photochemical age. Compared to the in-plume segments of a flight, the out-of-plume ones were characterized by not only lower rBC concentrations but also older photochemical ages. Given the clear dependence of rBC concentration on photochemical age (Fig. 6b) and the stable rBC size distribution across the whole rBC concentration range observed within an emission flight (Fig. 6a and Table 2), it could be inferred that rBC size distribution was independent of photochemical age over the OS source region.
3.3 rBC size distributions downwind of the OS source region
Mass and number size distributions of rBC are shown in Figs. 7 and 8, respectively, for the transformation flight conducted on 4 September 2013 (i.e., F_9/4) which reached a downwind distance of approximately 120 km (relative to the downwind edge of the OS source area; Fig. 1b). As can be seen from the time-resolved lognormal fitting results (Figs. 7a and 8a), both the rBC mass and number size distributions were fairly stable during F_9/4, without major temporal change patterns. For the typical in- and out-of-plume conditions of F_9/4, the rBC MMDs were 143 and 142 nm with mass distribution widths of 0.72 and 0.71, respectively (Fig. 7b); the rBC NMDs were 71 and 69 nm with number distribution widths of 0.68 and 0.69, respectively (Fig. 8b). These rBC size distributions (Figs. 7b and 8b) were derived from the SP2 measurements performed on the various virtual screens, where the aircraft was flown along level flight tracks (primarily at ∼ 450 and 600 m) perpendicular to the wind direction. For the level flight tracks, the typical in- and out-of-plume conditions (i.e., segments) were distinguished by rBC concentration (Fig. 9), i.e., the typical out-of-plume conditions were identified by relatively low and constant rBC concentrations whereas the typical in-plume conditions were characterized by sharp increases in rBC concentration above the out-of-plume level. In Fig. 7b, the rBC mass size distribution was scaled for the out-of-plume conditions to reveal their lower rBC concentrations compared to the in-plume conditions (Fig. 7d). When performing the scaling, the in-plume rBC size distribution was used as a reference (i.e., kept unchanged). The out-of-plume rBC size distribution was scaled to make the Iout-of-plume, scaled to Iin-plume ratio equal the rBCout-of-plume to rBCin-plume ratio, where the individual terms, in sequence, represent the integral of the scaled out-of-plume rBC size distribution curve, the integral of the reference in-plume rBC size distribution curve, the average out-of-plume rBC mass concentration (54 ng m−3, derived from Fig. 7d) and the average in-plume rBC concentration (208 ng m−3, derived from Fig. 7d). In Fig. 8b, the out-of-plume rBC number size distribution was scaled similarly. As can be seen from Figs. 7b and 8b, the in- vs. out-of-plume difference was negligible for rBC size distribution downwind of the OS region.
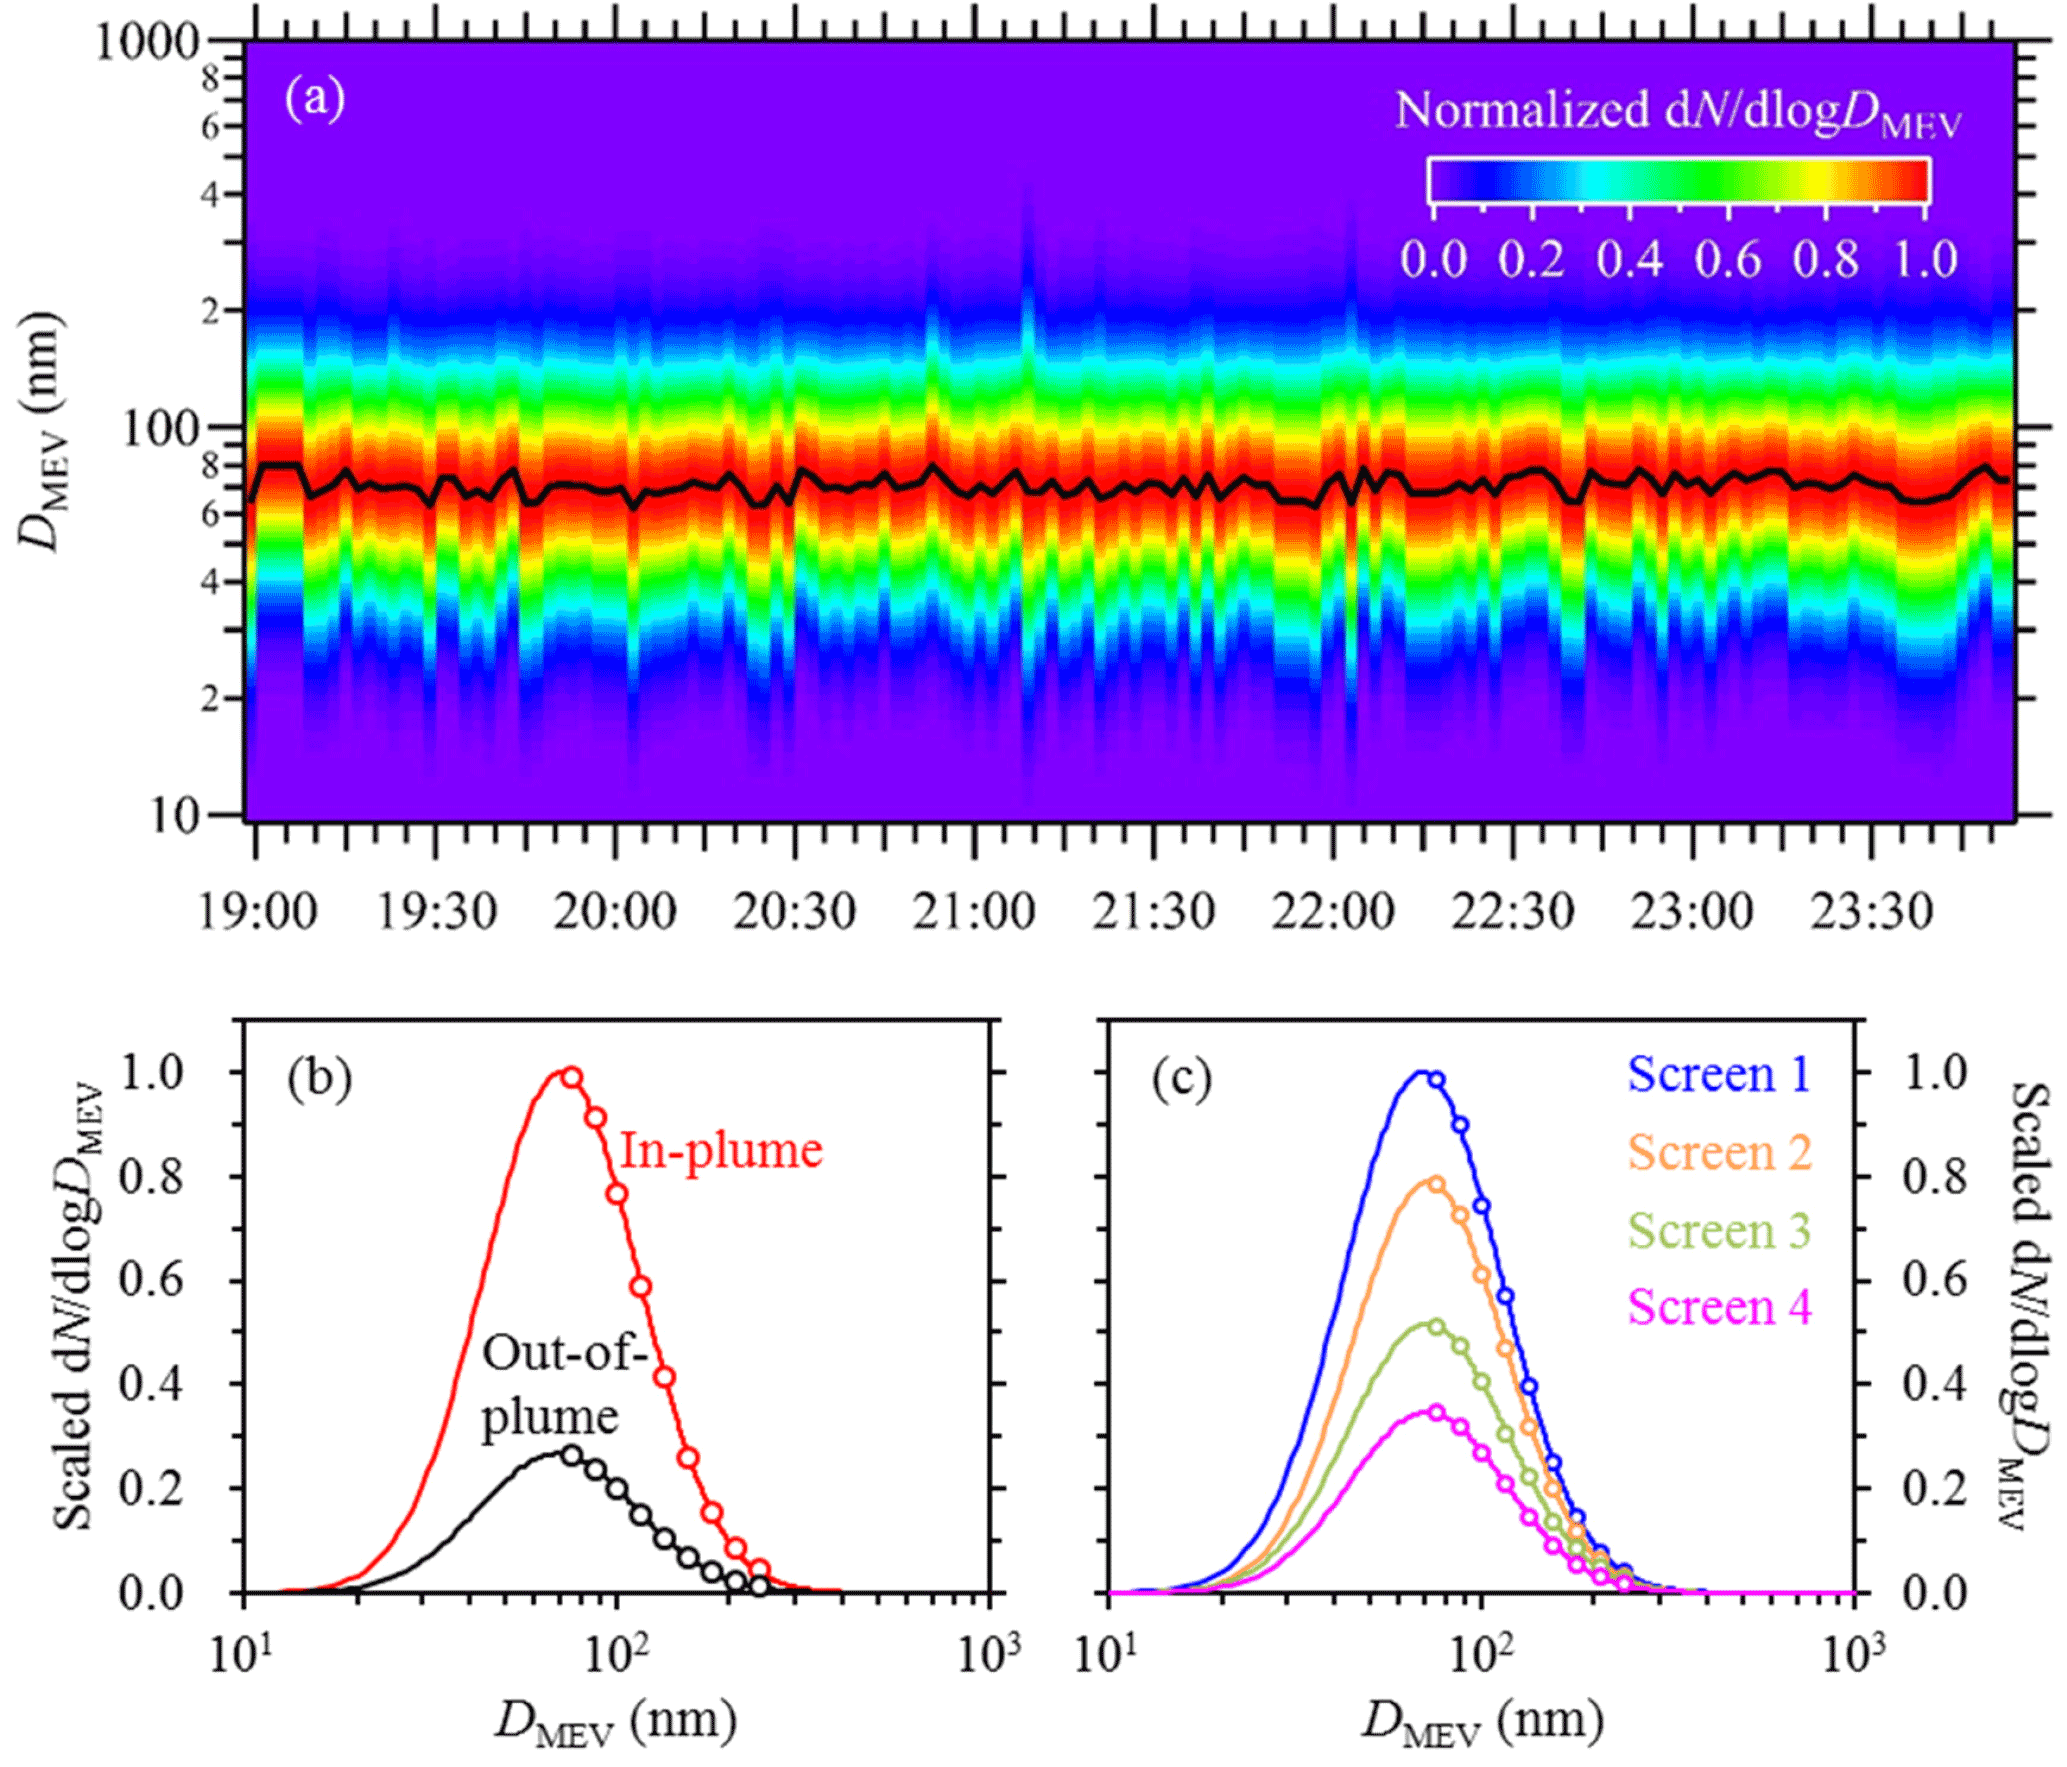
Figure 8(a) Time-resolved rBC number size distribution observed during the transformation flight F_9/4, (b) comparison of rBC number size distributions between typical in- and out-of-plume conditions, and (c) comparison of in-plume rBC number size distributions among successive flight screens. Scaling of out-of-plume rBC size distribution in (b) and scaling of rBC size distributions for screens 2 to 4 in (c) are explained in the text.
Photochemical ages were older for the out-of-plume conditions compared to the in-plume ones, by ∼ 0.3–0.5 in terms of −log10(NOx ∕ NOy) for different screens of F_ 9/4 (Fig. 7e). Therefore, the consistent rBC size distributions between the in- and out-of-plume conditions indicated that photochemical age had little influence on rBC size distribution downwind of the OS region. This conclusion was also strongly supported by the comparison of in-plume rBC size distributions among different downwind distances. As the OS plume was transported downwind, the in-plume rBC concentration decreased due to dilution (Fig. 7d), from ∼ 310 ng m−3 for the first screen (screen 1) to ∼ 110 ng m−3 for the fourth screen (screen 4); meanwhile, the in-plume photochemical age −log10(NOx ∕ NOy) increased (Fig. 7e), from ∼ 0.1 for screen 1 to ∼ 0.5 for screen 4. The last screen (screen 5) did not differ largely from screen 4 with respect to either in-plume rBC concentration or photochemical age, appearing to indicate that the dilution and aging processes had slowed down or even stopped since screen 4. However, it should be noted that, unlike the first four screens, screen 5 did not captured the full OS plume, i.e., the plume edges were missed. Compared to the central portion of the plume, the plume edges had lower rBC concentrations and older photochemical ages. Therefore, the average rBC concentration and −log10(NOx ∕ NOy) could not be compared directly between screen 5 and the first four screens, and consequently, results from screen 5 were not involved in Fig. 7d and e. Nonetheless, for all successive screens of F_9/4, the in-plume rBC MMDs and NMDs were found to fall into a narrow range of 140–145 and 69–72 nm, respectively, while both the mass and number distribution widths were about 0.7 (Figs. 7c, 8c and 10). In Figs. 7c and 8c, rBC size distributions derived from successive screens were scaled to reveal the decrease in rBC concentration caused by dilution, using the same approach as that described in detail for Fig. 7b. The scaling requires rBC concentration representative for the full plume and thus was not performed for screen 5. A direct comparison of rBC size distributions between screen 5 and the first four screens is provided by Fig. 10. Figure 10 also demonstrates consistent in-plume rBC size distributions among successive screens for the other two transformation flights that were conducted on 19 August and 5 September 2013, respectively (i.e., F_8/19 and F_9/5), providing further solid evidence for the negligible influence of atmospheric aging on rBC size distribution downwind of the OS source region.
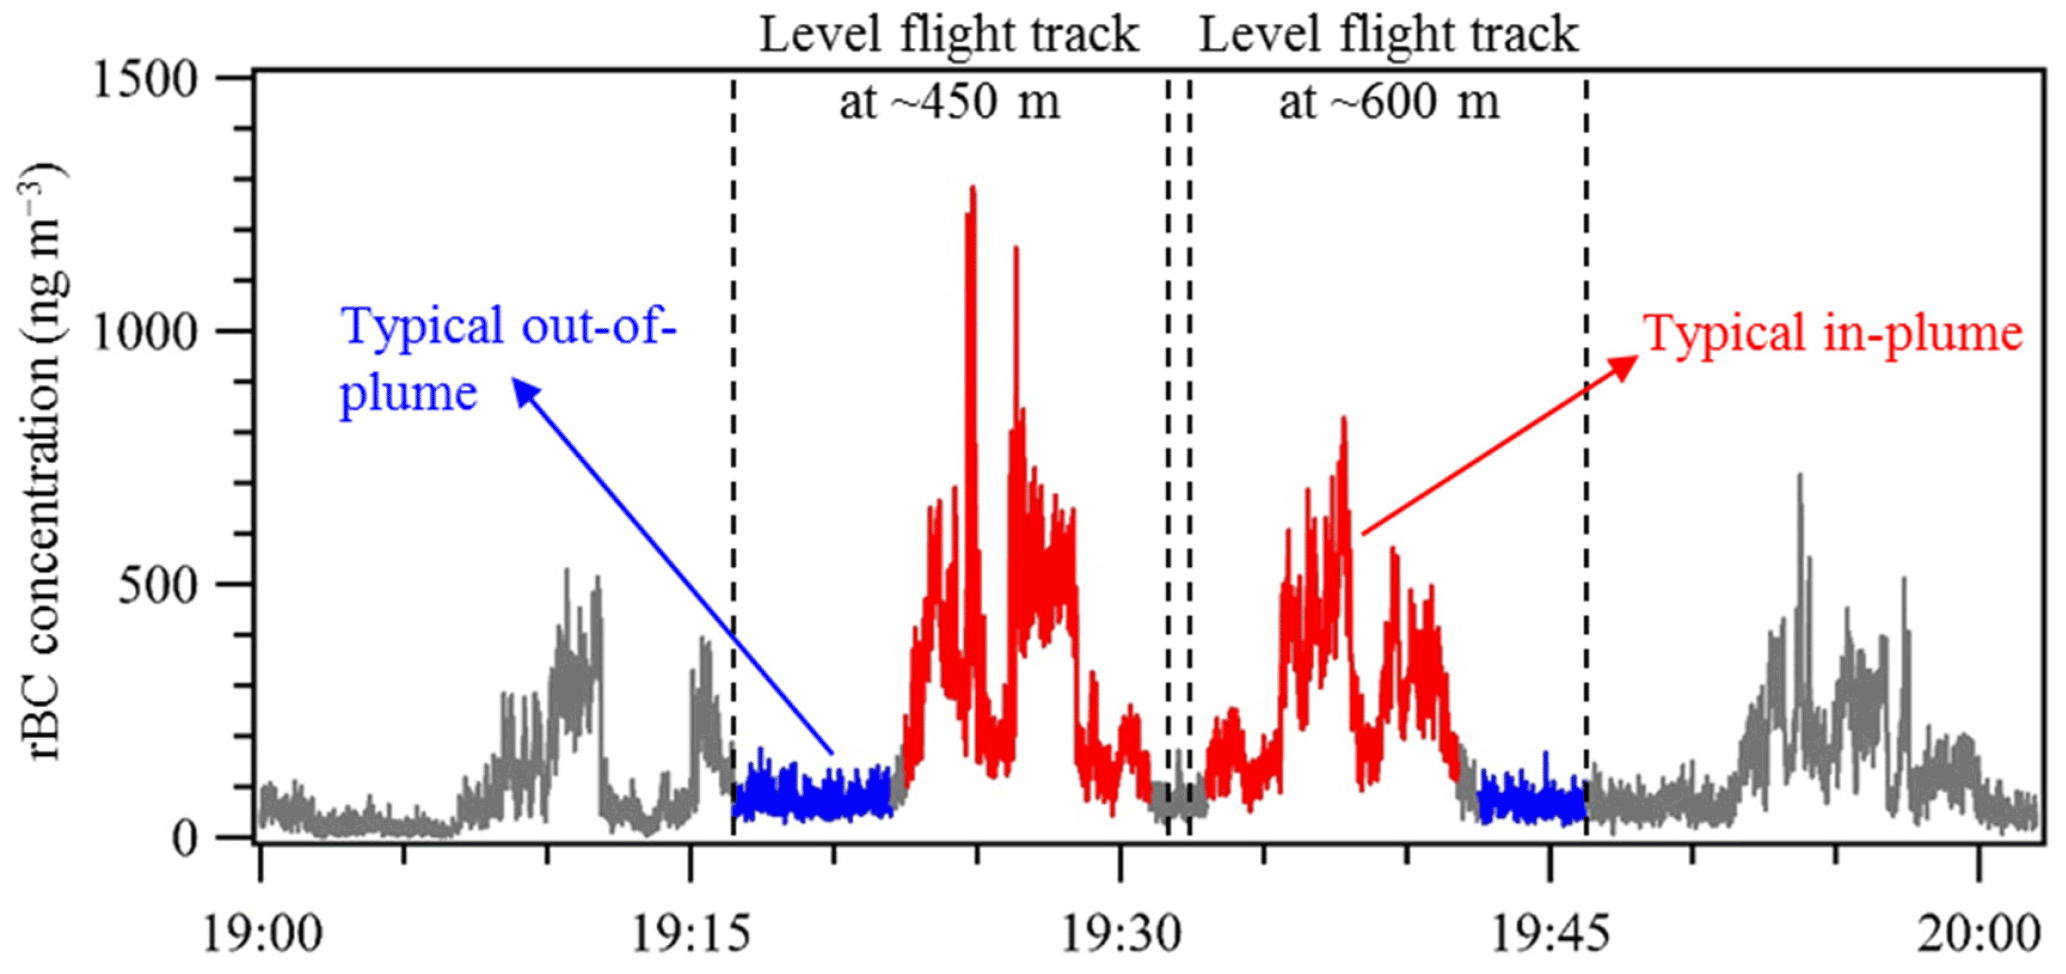
Figure 9Identification of typical in- and out-of-plume conditions for two level flight tracks at ∼ 450 and 600 m (in terms of ellipsoid height, equivalent to ∼ 150 and 300 m above ground) on the first virtual screen of the transformation flight F_9/4.
As shown in Table 1, previous studies conducted in remote areas (either ground- or aircraft-based) typically showed rBC MMD between 200 and 220 nm (Shiraiwa et al., 2008; Liu et al., 2010; McMeeking et al., 2010; Schwarz et al., 2010), substantially higher than those observed over urban areas (e.g., 122 nm over the Los Angeles basin; Metcalf et al., 2012) or at urban locations (e.g., 146 nm in Tokyo, Japan; Kondo et al., 2011b). Moreover, the rBC MMD was found to be 20 nm larger for aged urban plumes from Nagoya, Japan, compared to fresh emissions from the same urban area (Moteki et al., 2007). Therefore, it has been argued that rBC size distribution tends to shift toward larger sizes during aging (e.g., McMeeking et al., 2010). Results from the present study, especially the comparison of rBC size distributions among successive flight screens (Fig. 10), indicate that this is not necessarily the case. It is inferred that not all aging processes will change rBC size distribution and instead, influences of aging on rBC size distribution may partially depend on the presence of atmospheric processes that can lead to increased rBC core mass and size in a single particle (e.g., rBC coagulation and evaporation of cloud droplets containing multiple rBC particles). In this study, it appears that no such processes were at play, and within the photochemical ages encountered, rBC core masses and sizes did not change.
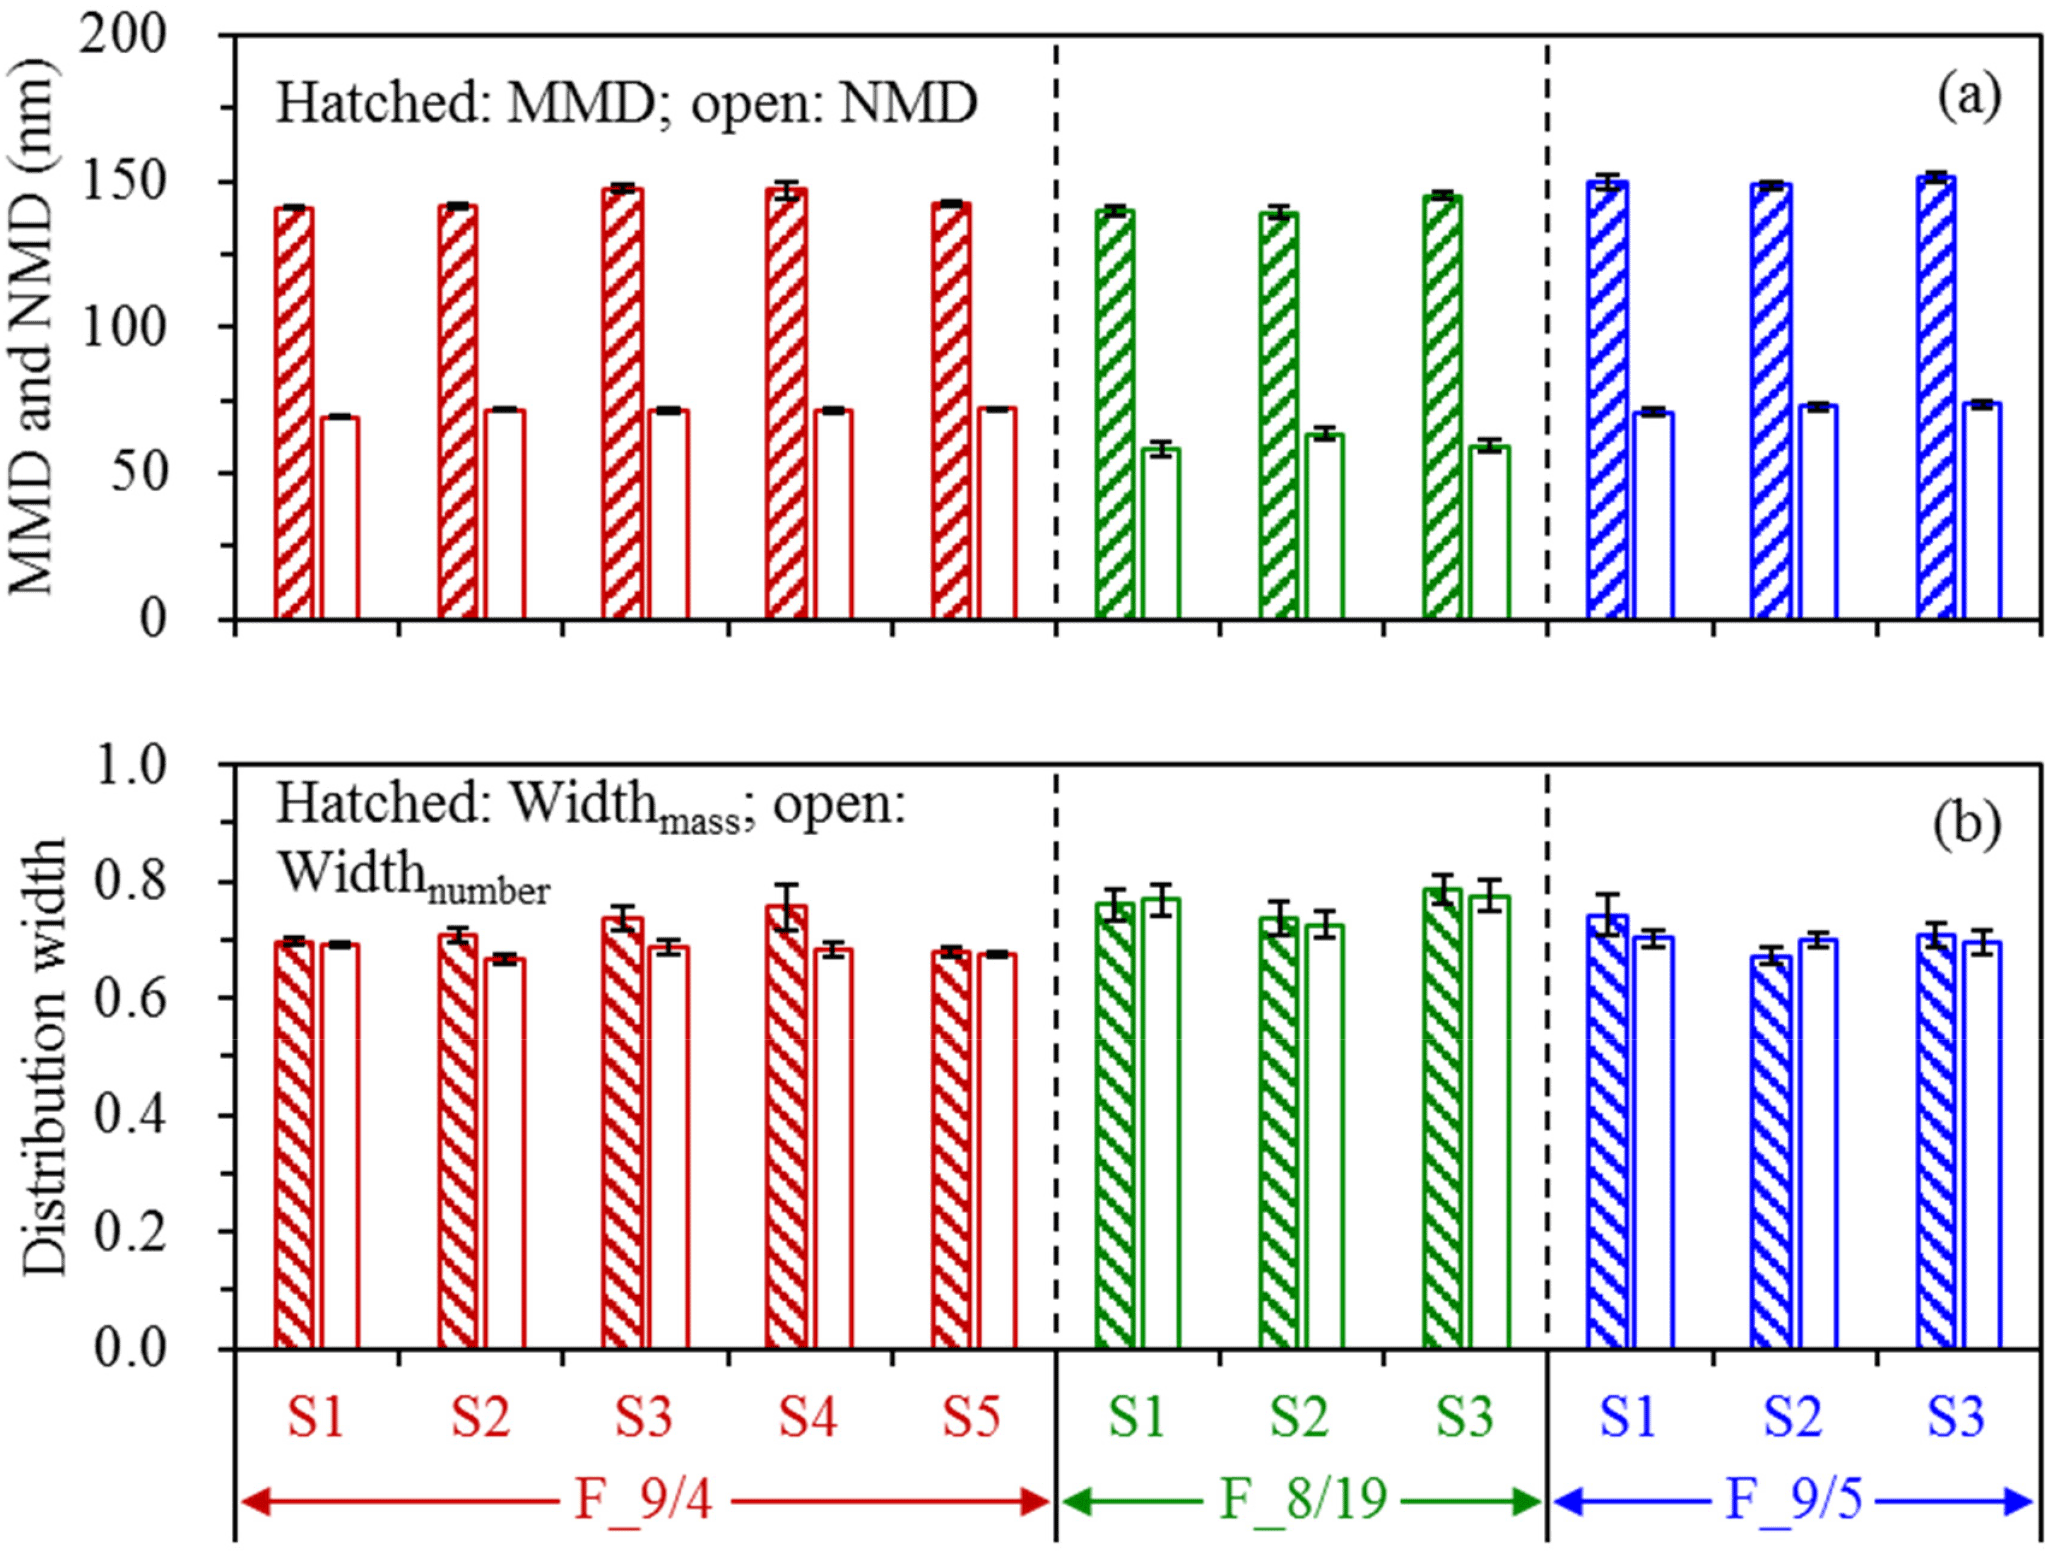
Figure 10In-plume rBC MMD and NMD (a), and mass and number distribution widths (Widthmass and Widthnumber; b) derived from successive flight screens of the three transformation flights. The results are also available in Table S2.
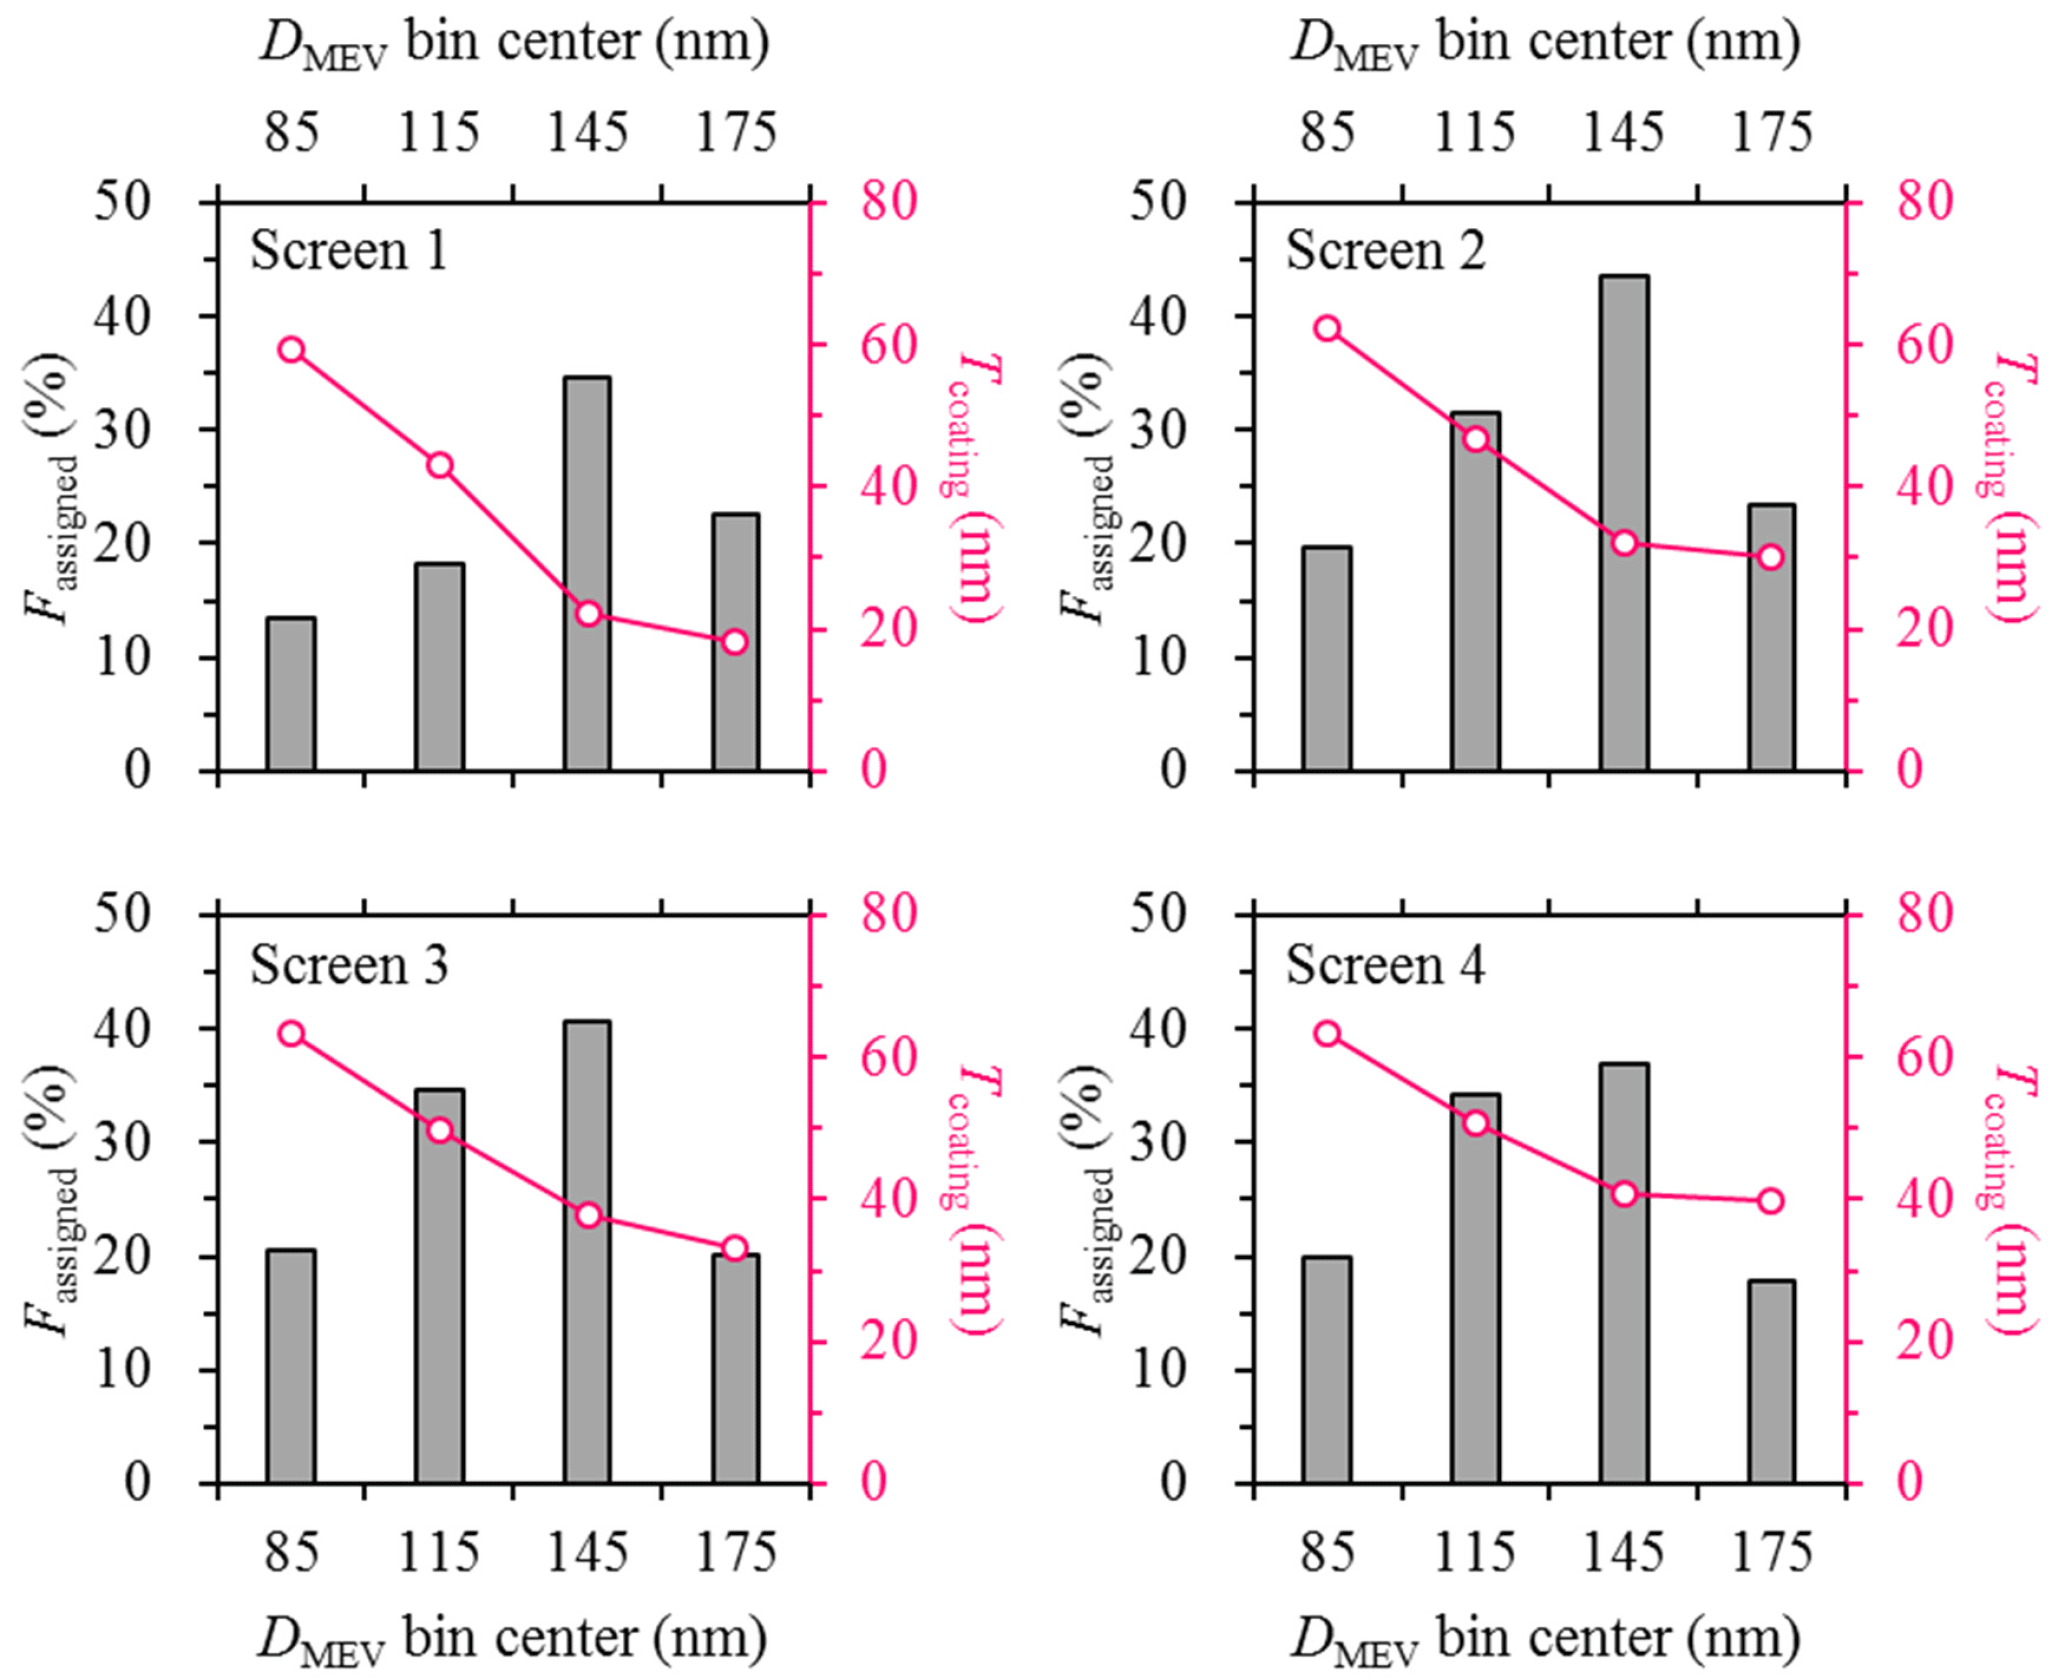
Figure 11Dependence of coating thickness (Tcoating) on rBC core size (DMEV) for successive flight screens of the transformation flight F_9/4. To derive the dependence, rBC-containing particles detected by the SP2 are divided into four equal-width bins according to their core sizes (DMEV), the centers of which are 85, 115, 145 and 175 nm, respectively. The lower edge of the first DMEV bin is 70 nm, corresponding to the SP2's lower detection limit of DMEV; the upper edge of the last DMEV bin is 190 nm. The DMEV range of 70 to 190 nm accounts for approximately 95 % of the detected rBC cores. For each DMEV bin, the fraction of rBC cores that can be assigned a coating thickness (Fassigned, in percentage) is also shown.
In addition to the evolution of in-plume rBC concentration, Fig. 7d shows that the out-of-plume rBC concentration decreased until screen 3. This decrease was associated with an increase in −log10(NOx ∕ NOy) for the out-of-plume conditions (Fig. 7e). For screen 4, both the out-of-plume rBC concentration and photochemical age were nearly the same as the respective values observed for screen 3. Therefore, the out-of-plume conditions identified for screens 3 and 4 should be more representative of the background. For screens 3 and 4, rBC size distributions agreed well between the in- and out-of-plume conditions, within ±3 nm in terms of MMD or NMD, indicating that the background did not differ significantly from the OS emissions with respect to rBC size distribution. Consistent in- and out-of-plume rBC size distributions observed at smaller downwind distances (i.e., for screens 1 and 2) and over the OS source area (i.e., for the emission flights) pointed to the same conclusion, although the out-of-plume conditions in these cases were less representative of the background. The rBC cores in the background could be from the OS emissions and/or long-range transported urban emissions that had not been influenced by atmospheric processes that can change single-particle rBC core size. These two kinds of emissions did not differ largely in rBC size distribution (as discussed in Sect. 3.1) and therefore they were difficult to further distinguish by rBC size only.
3.4 Evolution of rBC mixing state
Coating thickness (Tcoating) was found to exhibit a decreasing trend with the increase in rBC DMEV for both the transformation (Fig. 11) and emission flights (Fig. S4). This trend was primarily attributed to the limitation that the detection range of Tcoating is rBC DMEV dependent (as explained in Sect. 2.3), rather than indicating that relatively small rBC cores were more thickly coated than larger ones. Besides Tcoating, the fraction of rBC cores that can be assigned a coating thickness (Fassigned, in percentage) was also rBC DMEV dependent such that Fassigned was found to be the highest (between ∼ 35–45 %) for rBC cores in the DMEV range of 130–160 nm (Figs. 11 and S4). The rBC-containing particles in this DMEV range were selected for further discussions on Tcoating (their Tcoating will be specified as T*), with a focus on the evolution of rBC mixing state as the OS plumes were transported downwind.
As shown in Fig. 12a for the transformation flight F_9/4, the in-plume T* exhibited an increasing trend with the increase in downwind distance or transport time, e.g., from ∼ 22 nm for screen 1 to ∼ 41 nm for screen 4. This trend is not surprising given the continuous formation of SOA during transport of the OS plumes (Liggio et al., 2016). For rBC near the sources, T* was close to zero as observed from the emission flights over the OS facilities. For example, T* was derived at ∼ 3 nm for F_9/3 (Fig. S4). These freshly emitted rBC cores grew a coating of ∼ 20 nm thickness in the first hour after emission, when the OS plume was transported from the sources in the OS facilities to the downwind edge of the OS region.
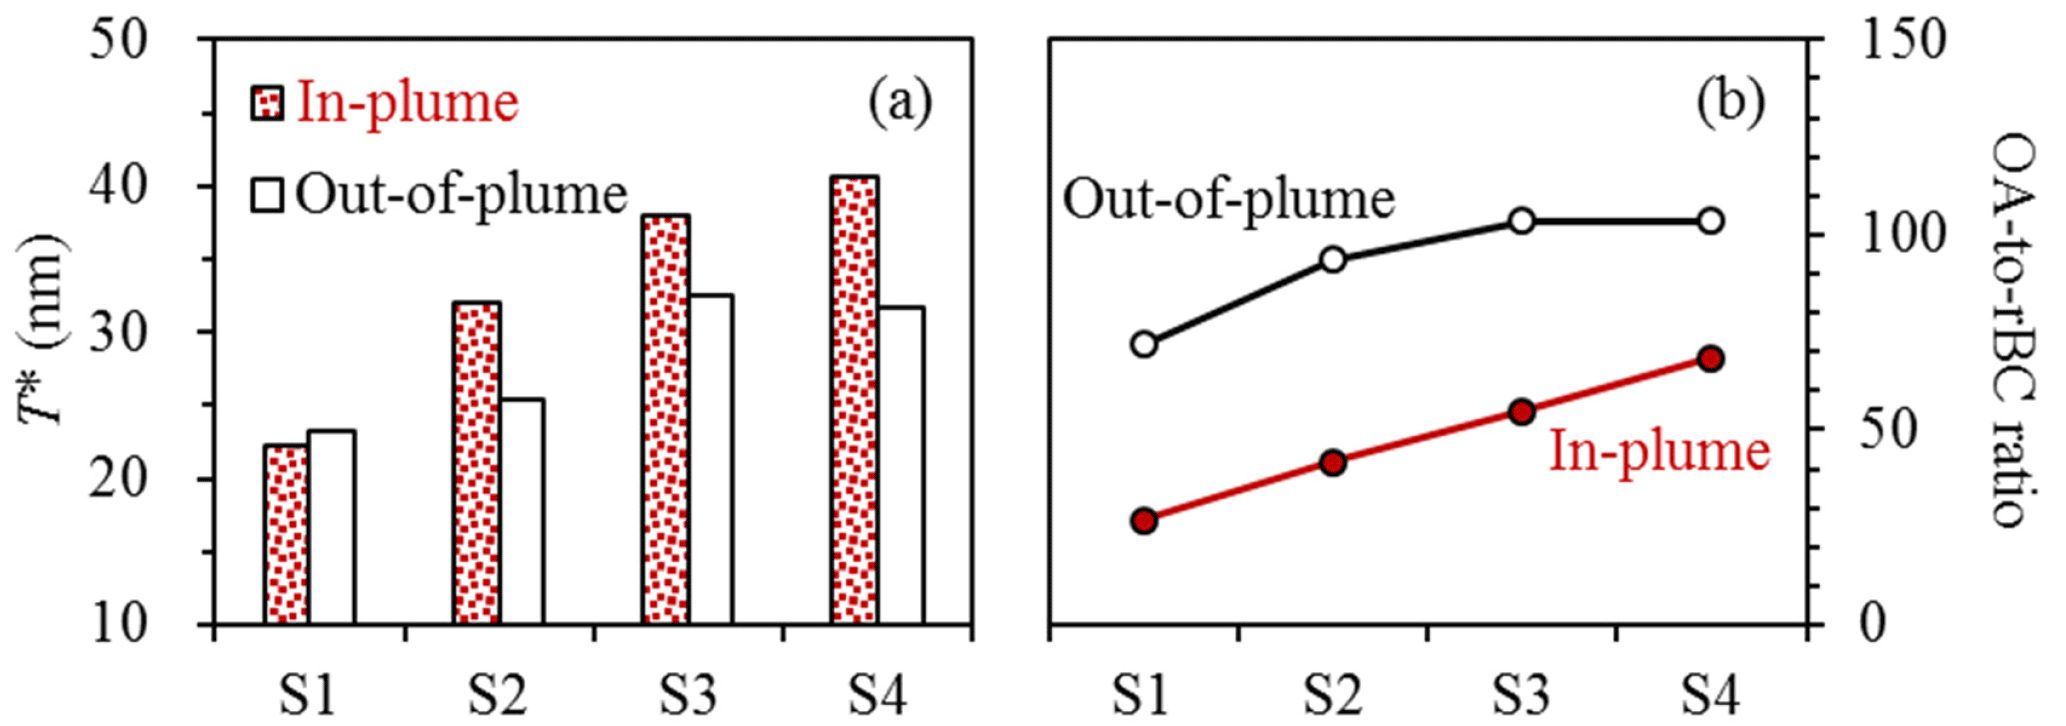
Figure 12Evolutions of (a) coating thickness for rBC cores in the DMEV range of 130–160 nm (T*) and (b) OA-to-rBC mass ratio (OA ∕ rBC) during the transformation flight F_9/4. Only median values are shown for T* and OA ∕ rBC. Quantitative discussions on OA ∕ rBC have been presented elsewhere (Liggio et al., 2016), whereas statistical results are shown in Fig. S5 for T* measured during F_9/4 (together with T* measured during the other two transformation flights). Evolution of coating thickness for rBC cores in the DMEV range of 160–190 nm (Fig. S6) exhibits the same pattern as that shown in (a). It should also be noted that the out-of-plume OA are dominated by preexisting secondary organic aerosols formed from biogenic precursors (Liggio et al., 2016), which do not contribute to the formation of coating materials on rBC cores. This explains why the out-of-plume conditions have higher OA ∕ rBC ratios but in general lower T* compared to in plumes.
T* were found to be comparable between the in- and out-of-plume conditions for screen 1, which were ∼ 22 and 23 nm, respectively (Fig. 12a). It is unlikely that the out-of-plume T* could be as low as ∼ 23 nm, if the majority of the out-of-plume rBC cores were from long-range transport. Therefore, the rBC cores observed in the out-of-plume conditions should also be influenced by emissions in the oil sands region, albeit at much lower air concentrations compared to the plumes, such as from on-road traffic that was not part of any oil sands surface mining facility.
Compared to in plumes, the increase in T* was smaller for the out-of-plume conditions as the OS plume was further transported from screen 1 (Fig. 12a) and moreover, the out-of-plume T* stopped increasing after screen 3 such that it was ∼ 32 nm for both screens 3 and 4. One explanation for the different evolution patterns of the in- and out-of-plume T*, which had comparable initial values (i.e., those for screen 1), is the less effective formation of coating materials (e.g., SOA and sulfate) for the out-of-plume conditions than in plumes. Coating precursors (volatile organic compounds and sulfur dioxide) were much more abundant in the plumes, from which fast formation of SOA was observed (Liggio et al., 2016). As shown in Fig. 12b, the in-plume OA-to-rBC mass ratio exhibited a robust increasing trend with the increase in downwind distance (e.g., by ∼ 150 % for screen 4 relative to screen 1), whereas the increase in OA-to-rBC ratio was less significant for the out-of-plume conditions (e.g., by only ∼ 45 % for screen 4 compared to screen 1) which was negligible between screens 3 and 4.
We did not compare Tcoating measured in this study with results from previous ones due to the following reasons. (1) The detection range of Tcoating and therefore the estimated Tcoating depend on the SP2's detection range of scattering intensity, which could differ among different SP2 instruments. This dependency indicates that different SP2 instruments might lead to different Tcoating estimates even for the same ensemble of rBC-containing particles. (2) The detection range of Tcoating and therefore the estimated Tcoating also depend on the rBC core size (i.e., DMEV). Quite different DMEV ranges have been used by previous studies to estimate Tcoating, e.g., 190–210 nm by Schwarz et al. (2008a, b) vs. 162–185 nm by Langridge et al. (2012), indicating that these Tcoating estimates are not directly comparable. (3) Comparison of the LEO and full-Gaussian fits for the determination of Doptical or scattering amplitude, which should be done using non-rBC-containing particles, was not presented in many previous publications reporting Tcoating. This is a concern because the LEO fit has been considered reliable as long as the LEO-to-full-Gaussian ratios are relatively constant (not necessarily around 1.0) for the fitted scattering amplitudes (e.g., Metcalf et al., 2012). Since an agreement between the LEO and full-Gaussian fits was not always required, previously reported Tcoating might be biased by the LEO-induced uncertainty to different extents, adding to the difficulties in comparing Tcoating across studies.
An aircraft campaign was conducted over the Athabasca oil sands region in the summer of 2013, during which the size distribution and coating thickness of refractive black carbon cores were studied as they were emitted from the sources and as they were transported downwind. The rBC size distributions were found to be comparable at the six major OS surface mining facilities, typically with mass median diameters of 135–145 nm and number median diameters of 60–70 nm that were characteristic of fresh urban emissions dominated by contributions from fossil fuel combustion. The observed rBC size distributions were consistent (in terms of MMD, NMD and the corresponding distribution widths) not only for the typical in- and out-of-plume segments of a flight but also for different downwind distances from the OS source area, indicating little dependence of the rBC size distribution on atmospheric aging within 4 to 5 h from the point of emission.
The coating thicknesses (Tcoating) were retrieved for rBC-containing particles from their scattering signals, on a particle-by-particle basis. The uncertainty of the LEO fit, a key step to compute Tcoating, was evaluated using non-rBC-containing particles. The LEO fit and the reference full-Gaussian fit were found to agree within approximately ±15 % in determining the optical size of non-rBC-containing particles. Mainly due to the SP2's limited detection range of scattering intensity, however, Tcoating could not be calculated for all the detected rBC cores. The fraction of rBC cores that can be assigned a coating thickness was found to be the highest but still lower than 50 % for those in the diameter range of 130–160 nm. It is not surprising that Tcoating increased as the OS plumes were transported downwind, resulting from the formation mainly of secondary organic aerosols but also of sulfate. Such a coating increase with aging can significantly change the optical properties of the rBC-containing particles and hence their potentials for radiative forcing. Therefore, to resolve the coating impact on rBC radiative forcing, secondary organic aerosol and sulfate on the global basis need to be well quantified along with accurately determined black carbon emission rates.
The rBC size distribution and coating thickness data involved in this paper can be found in the Supplement.
The supplement related to this article is available online at: https://doi.org/10.5194/acp-18-2653-2018-supplement.
The authors declare that they have no conflict of interest.
This article is part of the special issue “Atmospheric emissions from oil sands development and their transport, transformation and deposition (ACP/AMT inter-journal SI)”. It is not associated with a conference.
We would like to thank the National Research Council of Canada flight crew
of the Convair-580, the technical support staff of the Air Quality Research
Division and Stewart Cober for the management of the study. This
project was supported by Environment and Climate Change Canada's Climate and
Clean Air Programme (CCAP) and the Canada-Alberta Oil Sands Monitoring
program.
Edited by: John Liggio
Reviewed by: Darrel Baumgardner and two anonymous referees
Alberta Energy: Oil Sands Production Profile: 2004–2014, available at: https://open.alberta.ca/dataset/cd892173-c37f-4c68-bf5d-f79ef7d49e72/resource/ebd6b451-dfda-4218-b855-1416d94306fd/download/InitiativeOSPP.pdf (last access: 15 February 2018), 2016.
Alberta Energy: Oil Sands Facts and Statistics, available at: http://www.energy.alberta.ca/OS/AOS/Pages/FAS.aspx (last access: 15 February 2018), 2017.
Andreae, M. O. and Gelencsér, A.: Black carbon or brown carbon? The nature of light-absorbing carbonaceous aerosols, Atmos. Chem. Phys., 6, 3131–3148, https://doi.org/10.5194/acp-6-3131-2006, 2006.
Baumgardner, D., Kok, G., and Raga, G.: Warming of the Arctic lower stratosphere by light absorbing particles, Geophys. Res. Lett., 31, L06117, https://doi.org/10.1029/2003GL018883, 2004.
Bond, T. C. and Bergstrom, R. W.: Light absorption by carbonaceous particles: an investigative review, Aerosol Sci. Tech., 40, 27–67, 2006.
Bond, T. C., Doherty, S. J., Fahey, D. W., Forster, P. M., Berntsen, T., DeAngelo, B. J., Flanner, M. G., Ghan, S., Kärcher, B., Koch, D., Kinne, S., Kondo, Y., Quinn, P. K., Sarofim, M. C., Schultz, M. G., Schulz, M., Venkataraman, C., Zhang, H., Zhang, S., Bellouin, N., Guttikunda, S. K., Hopke, P. K., Jacobson, M. Z., Kaiser, J. W., Klimont, Z., Lohmann, U., Schwarz, J. P., Shindell, D., Storelvmo, T., Warren, S. G., and Zender, C. S.: Bounding the role of black carbon in the climate system: a scientific assessment, J. Geophys. Res., 118, 5380–5552, https://doi.org/10.1002/jgrd.50171, 2013.
Buffaloe, G. M., Lack, D. A., Williams, E. J., Coffman, D., Hayden, K. L., Lerner, B. M., Li, S.-M., Nuaaman, I., Massoli, P., Onasch, T. B., Quinn, P. K., and Cappa, C. D.: Black carbon emissions from in-use ships: a California regional assessment, Atmos. Chem. Phys., 14, 1881–1896, https://doi.org/10.5194/acp-14-1881-2014, 2014.
Buseck, P. R., Adachi, K., Gelencsér, A., Tompa, É., and Pósfai, M.: Ns-Soot: a material-based term for strongly light-absorbing carbonaceous particles, Aerosol Sci. Tech., 48, 777–788, 2014.
Cappa, C. D., Onasch, T. B., Massoli, P., Worsnop, D. R., Bates, T. S., Cross, E. S., Davidovits, P., Hakala, J., Hayden, K. L., Jobson, B. T., Kolesar, K. R., Lack, D. A., Lerner, B. M., Li, S. M., Mellon, D., Nuaaman, I., Olfert, J. S., Petäjä, T., Quinn, P. K., Song, C., Subramanian, R., Williams, E. J., and Zaveri, R. A.: Radiative absorption enhancements due to the mixing state of atmospheric black carbon, Science, 337, 1078–1081, 2012.
Dahlkötter, F., Gysel, M., Sauer, D., Minikin, A., Baumann, R., Seifert, P., Ansmann, A., Fromm, M., Voigt, C., and Weinzierl, B.: The Pagami Creek smoke plume after long-range transport to the upper troposphere over Europe – aerosol properties and black carbon mixing state, Atmos. Chem. Phys., 14, 6111–6137, https://doi.org/10.5194/acp-14-6111-2014, 2014.
Dentener, F., Kinne, S., Bond, T., Boucher, O., Cofala, J., Generoso, S., Ginoux, P., Gong, S., Hoelzemann, J. J., Ito, A., Marelli, L., Penner, J. E., Putaud, J.-P., Textor, C., Schulz, M., van der Werf, G. R., and Wilson, J.: Emissions of primary aerosol and precursor gases in the years 2000 and 1750 prescribed data-sets for AeroCom, Atmos. Chem. Phys., 6, 4321–4344, https://doi.org/10.5194/acp-6-4321-2006, 2006.
Gao, R. S., Schwarz, J. P., Kelly, K. K., Fahey, D. W., Watts, L. A., Thompson, T. L., Spackman, J. R., Slowik, J. G., Cross, E. S., Han, J. H., Davidovits, P., Onasch, T. B., and Worsnop, D. R.: A novel method for estimating light-scattering properties of soot aerosols using a modified Single-Particle Soot Photometer, Aerosol Sci. Tech., 41, 125–135, 2007.
Gordon, M., Li, S.-M., Staebler, R., Darlington, A., Hayden, K., O'Brien, J., and Wolde, M.: Determining air pollutant emission rates based on mass balance using airborne measurement data over the Alberta oil sands operations, Atmos. Meas. Tech., 8, 3745–3765, https://doi.org/10.5194/amt-8-3745-2015, 2015.
Government of Alberta: Environmental Management of Alberta's Oil Sands, available at: https://documents.techno-science.ca/documents/EnvironmentAlbertsoilsandsenvironmentalmanagement.pdf (last access: 15 February 2018). 2009.
Heald, C. L., Ridley, D. A., Kroll, J. H., Barrett, S. R. H., Cady-Pereira, K. E., Alvarado, M. J., and Holmes, C. D.: Contrasting the direct radiative effect and direct radiative forcing of aerosols, Atmos. Chem. Phys., 14, 5513–5527, https://doi.org/10.5194/acp-14-5513-2014, 2014.
Huebert, B. J., Howell, S. G., Covert, D., Bertram, T., Clarke, A., Anderson, J. R., Lafleur, B. G., Seebaugh, W. R., Wilson, J. C., Gesler, D., Blomquist, B., and Fox, J.: PELTl: measuring the passing efficiency of an airborne low turbulence aerosol inlet, Aerosol Sci. Tech., 38, 803–826, 2004.
IPCC: Climate Change 2013: The Physical Science Basis. Contribution of Working Group I to the Fifth Assessment Report of the Intergovernmental Panel on Climate Change, edited by: Stocker, T. F., Qin, D., Plattner, G. K., Tignor, M., Allen, S. K., Boschung, J., Nauels, A., Xia, Y., Bex, V., and Midgley, P. M., Cambridge University Press, Cambridge, UK and New York, NY, USA, 2013.
Kelly, E. N., Short, J. W., Schindler, D. W., Hodson, P. V., Ma, M., Kwan, A. K., and Fortin, B. L.: Oil sands development contributes polycyclic aromatic compounds to the Athabasca River and its tributaries, P. Natl. Acad. Sci. USA, 106, 22346–22351, 2009.
Kelly, E. N., Schindler, D. W., Hodson, P. V., Short, J. W., Radmanovich, R., and Nielsen, C. C.: Oil sands development contributes elements toxic at low concentrations to the Athabasca River and its tributaries, P. Natl. Acad. Sci. USA, 107, 16178–16183, 2010.
Kleinman, L. I., Springston, S. R., Daum, P. H., Lee, Y.-N., Nunnermacker, L. J., Senum, G. I., Wang, J., Weinstein-Lloyd, J., Alexander, M. L., Hubbe, J., Ortega, J., Canagaratna, M. R., and Jayne, J.: The time evolution of aerosol composition over the Mexico City plateau, Atmos. Chem. Phys., 8, 1559–1575, https://doi.org/10.5194/acp-8-1559-2008, 2008.
Kondo, Y., Matsui, H., Moteki, N., Sahu, L., Takegawa, N., Kajino, M., Zhao, Y., Cubison, M. J., Jimenez, J. L., Vay, S., Diskin, G. S., Anderson, B., Wisthaler, A., Mikoviny, T., Fuelberg, H. E., Blake, D. R., Huey, G., Weinheimer, A. J., Knapp, D. J., and Brune, W. H.: Emissions of black carbon, organic, and inorganic aerosols from biomass burning in North America and Asia in 2008, J. Geophys. Res., 116, D08204, https://doi.org/10.1029/2010JD015152, 2011a.
Kondo, Y., Sahu, L., Moteki, N., Khan, F., Takegawa, N., Liu, X., Koike, M., and Miyakawa, T.: Consistency and traceability of black carbon measurements made by laser-induced incandescence, thermal-optical transmittance, and filter-based photo-absorption techniques, Aerosol Sci. Tech., 45, 295–312, 2011b.
Kurek, J., Kirk, J. L., Muir, D. C. G., Wang, X., Evans, M. S., and Smol, J. P.: Legacy of a half century of Athabasca oil sands development recorded by lake ecosystems, P. Natl. Acad. Sci. USA, 110, 1761–1766, 2013.
Laborde, M., Mertes, P., Zieger, P., Dommen, J., Baltensperger, U., and Gysel, M.: Sensitivity of the Single Particle Soot Photometer to different black carbon types, Atmos. Meas. Tech., 5, 1031–1043, https://doi.org/10.5194/amt-5-1031-2012, 2012a.
Laborde, M., Schnaiter, M., Linke, C., Saathoff, H., Naumann, K.-H., Möhler, O., Berlenz, S., Wagner, U., Taylor, J. W., Liu, D., Flynn, M., Allan, J. D., Coe, H., Heimerl, K., Dahlkötter, F., Weinzierl, B., Wollny, A. G., Zanatta, M., Cozic, J., Laj, P., Hitzenberger, R., Schwarz, J. P., and Gysel, M.: Single Particle Soot Photometer intercomparison at the AIDA chamber, Atmos. Meas. Tech., 5, 3077–3097, https://doi.org/10.5194/amt-5-3077-2012, 2012b.
Laborde, M., Crippa, M., Tritscher, T., Jurányi, Z., Decarlo, P. F., Temime-Roussel, B., Marchand, N., Eckhardt, S., Stohl, A., Baltensperger, U., Prévôt, A. S. H., Weingartner, E., and Gysel, M.: Black carbon physical properties and mixing state in the European megacity Paris, Atmos. Chem. Phys., 13, 5831–5856, https://doi.org/10.5194/acp-13-5831-2013, 2013.
Lambe, A. T., Cappa, C. D., Massoli, P., Onasch, T. B., Forestieri, S. D., Martin, A. T., Cummings, M. J., Croasdale, D. R., Brune, W. H.,Worsnop, D. R., and Davidovits, P.: Relationship between oxidation level and optical properties of secondary organic aerosol, Environ. Sci. Technol., 47, 6349–6357, 2013.
Langridge, J. M., Lack, D., Brock, C. A., Bahreini, R., Middlebrook, A. M., Neuman, J. A., Nowak, J. B., Perring, A. E., Schwarz, J. P., Spackman, J. R., Holloway, J. S., Pollack, I. B., Ryerson, T. B., Roberts, J. M., Warneke, C., de Gouw, J. A., Trainer, M. K., and Murphy, D. M.: Evolution of aerosol properties impacting visibility and direct climate forcing in an ammonia-rich urban environment, J. Geophys. Res., 117, D00V11, https://doi.org/10.1029/2011JD017116, 2012.
Li, S. M., Leithead, A., Moussa, S. G., Liggio, J., Moran, M. D., Wang, D., Hayden, K., Darlington, A., Gordon, M, Staebler, R., Makar, P. A., Stroud, C. A., McLaren, R., Liu, P., O'Brien, J., Mittermeier, R. L., Zhang, J., Marson, G., Cober, S. G., Wolde, M., and Wentzell, J.: Differences between measured and reported volatile organic compound emissions from oil sands facilities in Alberta, Canada, P. Natl. Acad. Sci. USA, 114, E3756–E3765, 2017.
Liggio, J., Gordon, M., Smallwood, G., Li, S. M., Stroud, C., Staebler, R., Lu, G., Lee, P., Taylor, B., and Brook, J. R.: Are emissions of black carbon from gasoline vehicles underestimated? Insights from near and on-road measurements, Environ. Sci. Technol., 46, 4819–4828, 2012.
Liggio, J., Li, S. M., Hayden, K., Taha, Y. M., Stroud, C., Darlington, A., Drollette, B. D., Gordon, M., Lee, P., Liu, P., Leithead, A., Moussa, S. G., Wang, D., O'Brien, J., Mittermeier, R. L., Brook, J. R., Lu, G., Staebler, R. M., Han, Y., Tokarek, T. W., Osthoff, H. D., Makar, P. A., Zhang, J., Plata, D. L., and Gentner, D. R.: Oil sands operations as a large source of secondary organic aerosols, Nature, 534, 91–94, 2016.
Liggio, J., Moussa, S. G., Wentzell, J., Darlington, A., Liu, P., Leithead, A., Hayden, K., O'Brien, J., Mittermeier, R. L., Staebler, R., Wolde, M., and Li, S.-M.: Understanding the primary emissions and secondary formation of gaseous organic acids in the oil sands region of Alberta, Canada, Atmos. Chem. Phys., 17, 8411–8427, https://doi.org/10.5194/acp-17-8411-2017, 2017.
Liu, D., Flynn, M., Gysel, M., Targino, A., Crawford, I., Bower, K., Choularton, T., Jurányi, Z., Steinbacher, M., Hüglin, C., Curtius, J., Kampus, M., Petzold, A., Weingartner, E., Baltensperger, U., and Coe, H.: Single particle characterization of black carbon aerosols at a tropospheric alpine site in Switzerland, Atmos. Chem. Phys., 10, 7389–7407, https://doi.org/10.5194/acp-10-7389-2010, 2010.
Liu, D., Allan, J. D., Young, D. E., Coe, H., Beddows, D., Fleming, Z. L., Flynn, M. J., Gallagher, M. W., Harrison, R. M., Lee, J., Prevot, A. S. H., Taylor, J. W., Yin, J., Williams, P. I., and Zotter, P.: Size distribution, mixing state and source apportionment of black carbon aerosol in London during wintertime, Atmos. Chem. Phys., 14, 10061–10084, https://doi.org/10.5194/acp-14-10061-2014, 2014.
McMeeking, G. R., Hamburger, T., Liu, D., Flynn, M., Morgan, W. T., Northway, M., Highwood, E. J., Krejci, R., Allan, J. D., Minikin, A., and Coe, H.: Black carbon measurements in the boundary layer over western and northern Europe, Atmos. Chem. Phys., 10, 9393–9414, https://doi.org/10.5194/acp-10-9393-2010, 2010.
Metcalf, A. R., Craven, J. S., Ensberg, J. J., Brioude, J., Angevine, W., Sorooshian, A., Duong, H. T., Jonsson, H. H., Flagan, R. C., and Seinfeld, J. H.: Black carbon aerosol over the Los Angeles Basin during CalNex, J. Geophys. Res., 117, D00V13, https://doi.org/10.1029/2011JD017255, 2012.
Morgenstern, O., Hegglin, M. I., Rozanov, E., O'Connor, F. M., Abraham, N. L., Akiyoshi, H., Archibald, A. T., Bekki, S., Butchart, N., Chipperfield, M. P., Deushi, M., Dhomse, S. S., Garcia, R. R., Hardiman, S. C., Horowitz, L. W., Jöckel, P., Josse, B., Kinnison, D., Lin, M., Mancini, E., Manyin, M. E., Marchand, M., Marécal, V., Michou, M., Oman, L. D., Pitari, G., Plummer, D. A., Revell, L. E., Saint-Martin, D., Schofield, R., Stenke, A., Stone, K., Sudo, K., Tanaka, T. Y., Tilmes, S., Yamashita, Y., Yoshida, K., and Zeng, G.: Review of the global models used within phase 1 of the Chemistry-Climate Model Initiative (CCMI), Geosci. Model Dev., 10, 639–671, https://doi.org/10.5194/gmd-10-639-2017, 2017.
Moteki, N. and Kondo, Y.: Dependence of laser-induced incandescence on physical properties of black carbon aerosols: measurements and theoretical interpretation, Aerosol Sci. Tech., 44, 663–675, 2010.
Moteki, N., Kondo, Y., Miyazaki, Y., Takegawa, N., Komazaki, Y., Kurata, G., Shirai, T., Blake, D. R., Miyakawa, T., and Koike, M.: Evolution of mixing state of black carbon particles: aircraft measurements over the western Pacific in March 2004, Geophys. Res. Lett., 34, L11803, https://doi.org/10.1029/2006GL028943, 2007.
Moteki, N., Kondo, Y., and Nakamura, S.: Method to measure refractive indices of small nonspherical particles: application to black carbon particles, J. Aerosol Sci., 41, 513–521, 2010.
Myhre, G., Samset, B. H., Schulz, M., Balkanski, Y., Bauer, S., Berntsen, T. K., Bian, H., Bellouin, N., Chin, M., Diehl, T., Easter, R. C., Feichter, J., Ghan, S. J., Hauglustaine, D., Iversen, T., Kinne, S., Kirkevåg, A., Lamarque, J.-F., Lin, G., Liu, X., Lund, M. T., Luo, G., Ma, X., van Noije, T., Penner, J. E., Rasch, P. J., Ruiz, A., Seland, Ø., Skeie, R. B., Stier, P., Takemura, T., Tsigaridis, K., Wang, P., Wang, Z., Xu, L., Yu, H., Yu, F., Yoon, J.-H., Zhang, K., Zhang, H., and Zhou, C.: Radiative forcing of the direct aerosol effect from AeroCom Phase II simulations, Atmos. Chem. Phys., 13, 1853–1877, https://doi.org/10.5194/acp-13-1853-2013, 2013.
Parajulee, A. and Wania, F.: Evaluating officially reported polycyclic aromatic hydrocarbon emissions in the Athabasca oil sands region with a multimedia fate model, P. Natl. Acad. Sci. USA, 111, 3344–3349, 2014.
Petzold, A., Ogren, J. A., Fiebig, M., Laj, P., Li, S.-M., Baltensperger, U., Holzer-Popp, T., Kinne, S., Pappalardo, G., Sugimoto, N., Wehrli, C., Wiedensohler, A., and Zhang, X.-Y.: Recommendations for reporting “black carbon” measurements, Atmos. Chem. Phys., 13, 8365–8379, https://doi.org/10.5194/acp-13-8365-2013, 2013.
Ramanathan, V. and Carmichael G.: Global and regional climate changes due to black carbon, Nat. Geosci., 1, 221–227, 2008.
Sahu, L. K., Kondo, Y., Moteki, N., Takegawa, N., Zhao, Y., Cubison, M. J., Jimenez, J. L., Vay, S., Diskin, G. S., Wisthaler, A., Mikoviny, T., Huey, L. G., Weinheimer, A. J., and Knapp, D. J.: Emission characteristics of black carbon in anthropogenic and biomass burning plumes over California during ARCTAS-CARB 2008, J. Geophys. Res., 117, D16302, https://doi.org/10.1029/2011JD017401, 2012.
Samset, B. H., Myhre, G., Herber, A., Kondo, Y., Li, S.-M., Moteki, N., Koike, M., Oshima, N., Schwarz, J. P., Balkanski, Y., Bauer, S. E., Bellouin, N., Berntsen, T. K., Bian, H., Chin, M., Diehl, T., Easter, R. C., Ghan, S. J., Iversen, T., Kirkevåg, A., Lamarque, J.-F., Lin, G., Liu, X., Penner, J. E., Schulz, M., Seland, Ø., Skeie, R. B., Stier, P., Takemura, T., Tsigaridis, K., and Zhang, K.: Modelled black carbon radiative forcing and atmospheric lifetime in AeroCom Phase II constrained by aircraft observations, Atmos. Chem. Phys., 14, 12465–12477, https://doi.org/10.5194/acp-14-12465-2014, 2014.
Schnaiter, M., Linke, C., Möhler, O., Naumann, K. H., Saathoff, H., Wagner, R., Schurath, U., and Wehner, B.: Absorption amplification of black carbon internally mixed with secondary organic aerosol, J. Geophys. Res., 110, D19204, https://doi.org/10.1029/2005JD006046, 2005.
Schwarz, J. P., Gao, R. S., Fahey, D. W., Thomson, D. S., Watts, L. A., Wilson, J. C., Reeves, J. M., Darbeheshti, M., Baumgardner, D. G., Kok, G. L., Chung, S. H., Schulz, M., Hendricks, J., Lauer, A., Karcher, B., Slowik, J. G., Rosenlof, K. H., Thompson, T. L., Langford, A. O., Loewenstein, M., and Aikin, K. C.: Single-particle measurements of midlatitude black carbon and light-scattering aerosols from the boundary layer to the lower stratosphere, J. Geophys. Res., 111, D16207, https://doi.org/10.1029/2006JD007076, 2006.
Schwarz, J. P., Gao, R. S., Spackman, J. R., Watts, L. A., Thomson, D. S., Fahey, D. W., Ryerson, T. B., Peischl, J., Holloway, J. S., Trainer, M., Frost, G. J., Baynard, T., Lack, D. A., de Gouw, J. A., Warneke, C., and Del Negro, L. A.: Measurement of the mixing state, mass, and optical size of individual black carbon particles in urban and biomass burning emissions, Geophys. Res. Lett., 35, L13810, https://doi.org/10.1029/2008GL033968, 2008a.
Schwarz, J. P., Spackman, J. R., Fahey, D. W., Gao, R. S., Lohmann, U., Stier, P., Watts, L. A., Thomson, D. S., Lack, D. A., Pfister, L., Mahoney, M. J., Baumgardner, D., Wilson, J. C., and Reeves, J. M.: Coatings and their enhancement of black carbon light absorption in the tropical atmosphere, J. Geophys. Res., 113, D03203, https://doi.org/10.1029/2007JD009042, 2008b.
Schwarz, J. P., Spackman, J. R., Gao, R. S., Watts, L. A., Stier, P., Schulz, M., Davis, S. M., Wofsy, S. C., and Fahey, D. W.: Global-scale black carbon profiles observed in the remote atmosphere and compared to models, Geophys. Res. Lett., 37, L18812, https://doi.org/10.1029/2010GL044372, 2010.
Shephard, M. W., McLinden, C. A., Cady-Pereira, K. E., Luo, M., Moussa, S. G., Leithead, A., Liggio, J., Staebler, R. M., Akingunola, A., Makar, P., Lehr, P., Zhang, J., Henze, D. K., Millet, D. B., Bash, J. O., Zhu, L., Wells, K. C., Capps, S. L., Chaliyakunnel, S., Gordon, M., Hayden, K., Brook, J. R., Wolde, M., and Li, S.-M.: Tropospheric Emission Spectrometer (TES) satellite observations of ammonia, methanol, formic acid, and carbon monoxide over the Canadian oil sands: validation and model evaluation, Atmos. Meas. Tech., 8, 5189–5211, https://doi.org/10.5194/amt-8-5189-2015, 2015.
Shiraiwa, M., Kondo, Y., Moteki, N., Takegawa, N., Miyazaki, Y., and Blake, D. R.: Evolution of mixing state of black carbon in polluted air from Tokyo, Geophys. Res. Lett., 34, L16803, https://doi.org/10.1029/2007GL029819, 2007.
Shiraiwa, M., Kondo, Y., Moteki, N., Takegawa, N., Sahu, L. K., Takami, A., Hatakeyama, S., Yonemura, S., and Blake, D. R.: Radiative impact of mixing state of black carbon aerosol in Asian outflow, J. Geophys. Res., 113, D24210, https://doi.org/10.1029/2008JD010546, 2008.
Stephens, M., Turner, N., and Sandberg, J.: Particle identification by laser-induced incandescence in a solid-state laser cavity, Appl. Optics, 42, 3726–3736, 2003.
Stier, P., Feichter, J., Kinne, S., Kloster, S., Vignati, E., Wilson, J., Ganzeveld, L., Tegen, I., Werner, M., Balkanski, Y., Schulz, M., Boucher, O., Minikin, A., and Petzold, A.: The aerosol-climate model ECHAM5-HAM, Atmos. Chem. Phys., 5, 1125–1156, https://doi.org/10.5194/acp-5-1125-2005, 2005.
Taylor, J. W., Allan, J. D., Allen, G., Coe, H., Williams, P. I., Flynn, M. J., Le Breton, M., Muller, J. B. A., Percival, C. J., Oram, D., Forster, G., Lee, J. D., Rickard, A. R., Parrington, M., and Palmer, P. I.: Size-dependent wet removal of black carbon in Canadian biomass burning plumes, Atmos. Chem. Phys., 14, 13755–13771, https://doi.org/10.5194/acp-14-13755-2014, 2014.
Taylor, J. W., Allan, J. D., Liu, D., Flynn, M., Weber, R., Zhang, X., Lefer, B. L., Grossberg, N., Flynn, J., and Coe, H.: Assessment of the sensitivity of core / shell parameters derived using the single-particle soot photometer to density and refractive index, Atmos. Meas. Tech., 8, 1701–1718, https://doi.org/10.5194/amt-8-1701-2015, 2015.