the Creative Commons Attribution 4.0 License.
the Creative Commons Attribution 4.0 License.
 | 10 Jan 2018
Feedback effects of boundary-layer meteorological factors on cumulative explosive growth of PM2.5 during winter heavy pollution episodes in Beijing from 2013 to 2016
Junting Zhong
Xiaoye Zhang
Yunsheng Dong
Yaqiang Wang
Cheng Liu
Jizhi Wang
Yangmei Zhang
Haochi Che
In January 2013, February 2014, December 2015 and December 2016 to 10 January 2017, 12 persistent heavy aerosol pollution episodes (HPEs) occurred in Beijing, which received special attention from the public. During the HPEs, the precise cause of PM2.5 explosive growth (mass concentration at least doubled in several hours to 10 h) is uncertain. Here, we analyzed and estimated relative contributions of boundary-layer meteorological factors to such growth, using ground and vertical meteorological data. Beijing HPEs are generally characterized by the transport stage (TS), whose aerosol pollution formation is primarily caused by pollutants transported from the south of Beijing, and the cumulative stage (CS), in which the cumulative explosive growth of PM2.5 mass is dominated by stable atmospheric stratification characteristics of southerly slight or calm winds, near-ground anomalous inversion, and moisture accumulation. During the CSs, observed southerly weak winds facilitate local pollutant accumulation by minimizing horizontal pollutant diffusion. Established by TSs, elevated PM2.5 levels scatter more solar radiation back to space to reduce near-ground temperature, which very likely causes anomalous inversion. This surface cooling by PM2.5 decreases near-ground saturation vapor pressure and increases relative humidity significantly; the inversion subsequently reduces vertical turbulent diffusion and boundary-layer height to trap pollutants and accumulate water vapor. Appreciable near-ground moisture accumulation (relative humidity> 80 %) would further enhance aerosol hygroscopic growth and accelerate liquid-phase and heterogeneous reactions, in which incompletely quantified chemical mechanisms need more investigation. The positive meteorological feedback noted on PM2.5 mass explains over 70 % of cumulative explosive growth.
- Article
(7022 KB) -
Supplement
(292 KB) - BibTeX
- EndNote


Since a persistent heavy fog and haze event occurred in eastern China in January 2013, fine particulate matter smaller than 2.5 µm in diameter (PM2.5), as a key component of pollution episodes, has drawn wide attention all over China. Elevated PM2.5 leads a sharp decrease in visibility that affects economic activities by causing traffic disruptions and contains toxic substances that affect the respiratory and circulatory system (Chen et al., 2013; Bai et al., 2007). The interaction between aerosol and radiation directly and indirectly affects weather and climate (Zhang et al., 2013; R. Y. Zhang et al., 2015; Wei et al., 2011; Boucher et al., 2013; Wang et al., 2010). China has experienced heavy aerosol pollution episodes recently, with PM2.5 reaching unprecedentedly high levels in many cities, particularly Beijing and its vicinity (BIV), which is one of the nation's most polluted regions (Zhang et al., 2012).
To elucidate the causes of such heavy-pollution episodes, a variety of explanations have been proposed (Huang et al., 2014; Y. Sun et al., 2014; Y. L. Sun et al., 2014; X. Wang et al., 2014; Z. Wang et al., 2014). Previous studies found that atmospheric conditions represented one critical parameter in regulating the cycles of pollution episodes in Beijing in autumn 2013 (Guo et al., 2014; Zhang et al., 2009) and in the North China Plain and other areas in China (X. Y. Zhang et al., 2015). During one pollution episode, an analysis of atmospheric background fields revealed dynamic and thermodynamic effects substantially affected pollution formation (Zhang et al., 2014). Specifically, aerosol pollution in Beijing was possibly contributed by a southerly–southwesterly surface wind (Z. B. Wang et al., 2013). This likely attribution was further confirmed by source apportionment from the Beijing Environmental Protection Bureau in 2012–2013. In addition, aerosol pollution can be formed by secondary aerosol formation through atmospheric chemical reactions, including liquid-phase reactions, in which aqueous SO2 is oxidized by NO2, H2O2 and O3 to form sulfate, and heterogeneous reactions, in which NO2 and N2O5 form nitrates with water (B. Zheng et al., 2015; Cheng et al., 2016).
Although these cited studies existed, the formation mechanism during different stages for heavy aerosol pollution in Beijing, especially the explosive growth stage of PM2.5 mass concentration, is still not clear. Previous studies focused more on whether unfamiliar chemical mechanisms were not or inadequately considered in Beijing, a region with high concentrations of various aerosol components (X. Wang et al., 2014). This view was questioned by subsequent research, suggesting that such rapid growth is mainly attributable to the regional transport of clean and polluted air mass, which derived from the comparison between surface meteorological factors and the PM2.5 mass concentration in several cities of the North China Plain (G. J. Zheng et al., 2015). However, the attribution of such growth's drivers is unreasonable occasionally because the rapid growth may occur with weak surface winds and stable stratification, which are unfavorable for transport. Then vertical meteorological variations in the boundary layer (BL) in one autumnal episode, which significantly affect the PM2.5 mass concentration near the ground, have been analyzed (Hua et al., 2016). However, in the absence of long-term observations of meteorological factors and pollutant concentrations, most research concerning pollution causes focuses on one or several consecutive pollution episodes at a certain time, and almost no research attempts to investigate, conclude on and quantify the contributions of meteorological factors to the majority of heavy-pollution episodes since 2013, particularly the feedback effect of meteorological factors during explosive growth processes. Such investigations will definitely provide a clearer understanding of roles that various vertical meteorological factors play in heavy-pollution episodes. Therefore, this paper primarily uses vertical measurements of meteorological factors in the BL from 2013 to 2016, investigates their contributions to the explosive growth of PM2.5 during the heavy-pollution episodes in Beijing and also attempts to quantify the effect of meteorological factors on the explosive growth of PM2.5 levels.

Figure 1Temporal variations in urban mean PM2.5 and vertical distributions of meteorological factors in January 2013. (a) PM2.5 mass concentration (dark gray or gray: Beijing; light gray: Baoding); (b) winds (vectors; red vectors: southwesterly winds) and wind velocity (shadings; units: m s−1); (c) temperature (shadings; units: ∘C); (d) RH (shadings; units: %). Green boxes: rising processes; red boxes: cumulative explosive processes.
In this study, the following data are used. (1) Hourly PM2.5 mass concentration measured by state-controlled stations of the Ministry of Environmental Protection in Beijing and Baoding. PM2.5 mass concentrations of urban stations were averaged to represent urban pollution conditions. (2) Atmospheric vertical observations twice daily at 08:00 Beijing Time (BJT) and 20:00 BJT, including winds, temperature and relative humidity (RH), measured using an L-band radiosonde radar at the observatory (54 511) in southern Beijing from 1 to 31 January 2013, 1 to 28 February 2014, 26 November to 31 December 2015 and 21 December 2016 to 10 January 2017. The observatory is located at the edge of the urban area of Beijing, so it could be used to represent urban vertical meteorological conditions to some degree due to the regional-change characteristics of air masses. (3) Hourly ground-level meteorological observations from automatic weather stations (AWSs) were provided by the National Meteorological Information Center of the China Meteorological Administration. (4) Lidar observations were measured every 15 min by one Mie-elastic backscatter polarization lidar emitting short pulses of 20 Hz at 532 nm at the Institute of Atmospheric Physics, located in the northern urban area of Beijing. The optical parameters of the aerosol particles were retrieved by the backscattering signals. Then the vertical profiles of the aerosol extinction coefficient and linear depolarization ratio were obtained based on the assumptive lidar ratios of 50 for aerosols using Fernald's method (Fernald, 1984; Lv et al., 2017). (5) A parameterized index, PLAM (Parameter Linking Aerosol Pollution and Meteorological Elements), was calculated with the observations from the observatory (54 511). PLAM was built as a function of the following parameters:
where p, t, w, rh, e, s and c′ represent air pressure, air temperature, winds, relative humidity, evaporability, stability and effective parameter associated with the contribution of air pollution β(c′), respectively. PLAM is further attributed to two major separate factors: (1) initial meteorological conditions α(m) associated with the atmospheric condensation processes and (2) a dynamic effective parameter associated with the initial contribution of air pollution β(c′):
It mainly indicates the regional atmospheric stability and air condensation ability. The details of its calculation are presented in previous studies (J. Wang et al., 2013; X. Y. Zhang et al., 2015; Zhang et al., 2009; Wang et al., 2012).
3.1 Characteristics of explosive growth in heavy-pollution episodes
A period during which the PM2.5 level is less than 35 µg m−3 is defined as a clean period based on the PM2.5 daily mean mass concentration limit in the primary standard of China's national environmental quality standards, while a pollution episode is referred to as an episode during which the PM2.5 exceeds 80 µg m3 for 3 consecutive days between two clean periods. Pollution episodes with peak PM2.5 values less than 300 µg m−3 or more than 400 µg m−3 are termed light-pollution episodes (LPEs) or heavy-pollution episodes (HPEs), respectively.
Based on the urban PM2.5 monthly mean mass concentration in winter in Beijing from 2013 to 2016, the months with the highest mass concentration each year were selected to represent severe PM2.5 pollution conditions in winter; these months are January in 2013, February in 2014, December in 2015 and December in 2016. These months are termed the wintertime pollution period (WPP) for the convenience of further investigation.
During the WPP, 12 HPEs occur in total (Figs. 1–4; dark gray), whose PM2.5 mass concentration is 244.3 µg m−3 on average. The maximum mean value (307.4 µg m−3) appears in HPE1, which has been analyzed in detail in a variety of papers (Zhang et al., 2013, 2014). The concentrations of HPE6 and HPE10 are 304.2 and 294.5 µg m−3, respectively, which is slightly lower than HPE1. The minimum mean concentration of PM2.5 occurs in HPE8 (160.4 µg m−3), which is, nevertheless, nearly twice as much as the mean annual mass concentration of PM2.5 in 2015.
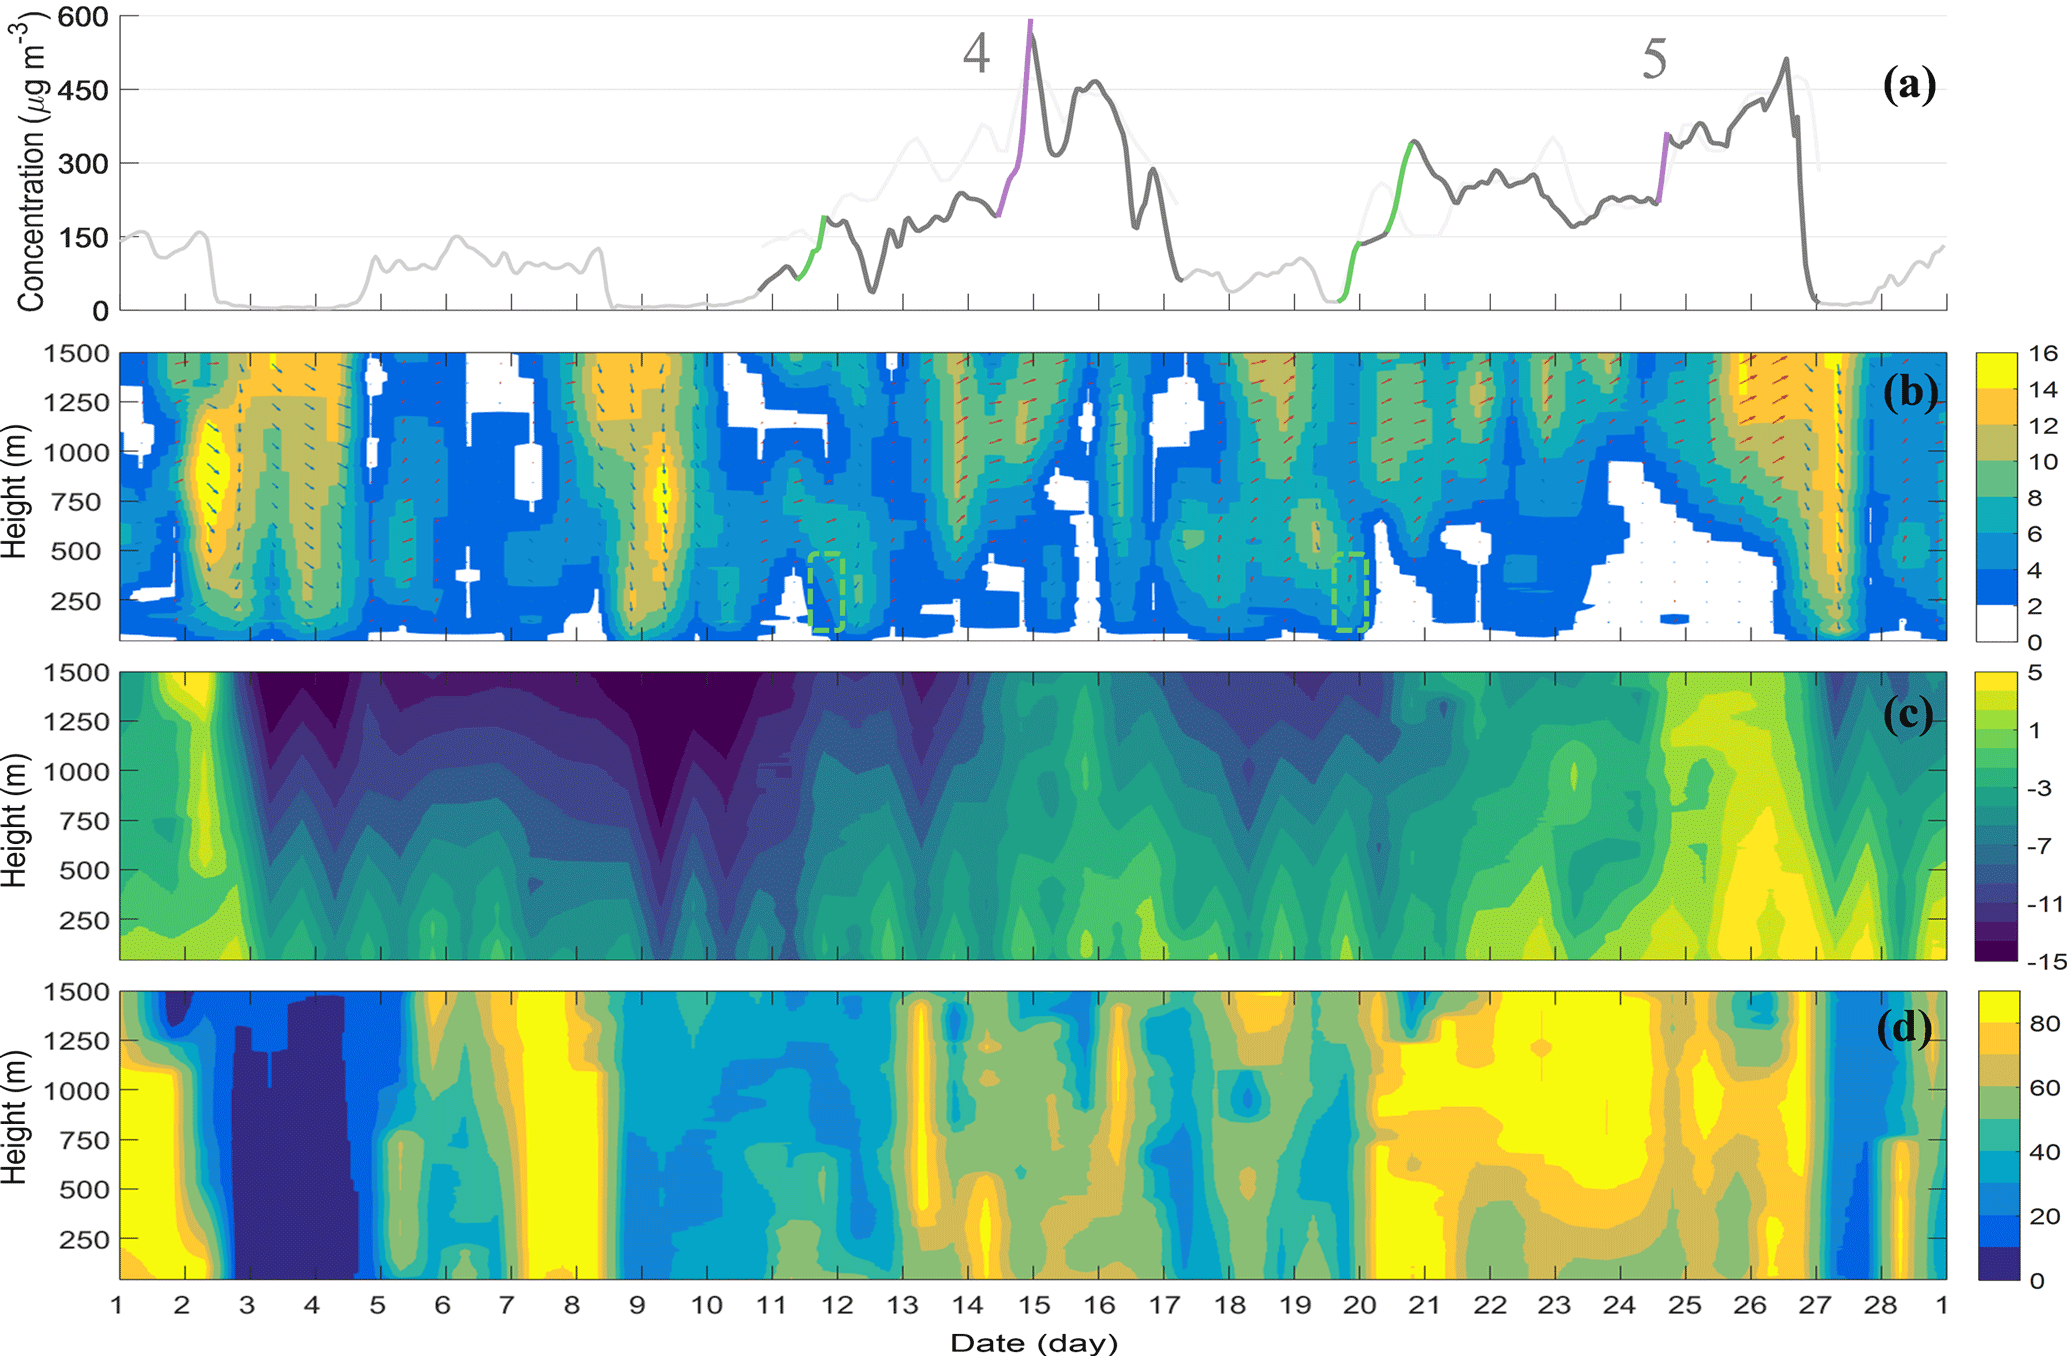
Figure 2Temporal variations in urban mean PM2.5 and vertical distributions of meteorological factors in February 2014. (a) PM2.5 mass concentration (dark gray or gray: Beijing; light gray: Baoding); (b) winds (vectors; red vectors: southwesterly winds) and wind velocity (shadings; units: m s−1); (c) temperature (shadings; units: ∘C); (d) RH (shadings; units: %). Green boxes: rising processes.
Typical PM2.5 rising processes (see color-coding in the figures) in HPEs were selected, which appeared in 11 of the 12 HPEs. The processes marked in green are tentatively referred to as rising processes, since they generally keep rising consistently with relatively strong southerly winds compared with subsequent growth and vary sensitively and rapidly in response to the wind shifting from a northerly to a southerly direction in the BL. During HPEs, the growth processes in which the PM2.5 mass concentration is at least doubled in several or ten hours in the later period of HPEs are termed explosive growth processes. The explosive growth processes marked in red are tentatively termed cumulative explosive growth processes because of anomalous inversion facilitating pollutant accumulation. The explosive growth processes marked in purple are tentatively known as convergent explosive growth processes, for local wind convergence occurs (Fig. 6) with weak wind velocity and no anomalous inversion. The early stages of HPEs during which PM2.5 keeps rising are defined as transport stages (TSs), while the later stages during which cumulative/convergent explosive growth appears are termed cumulative stages (CSs).
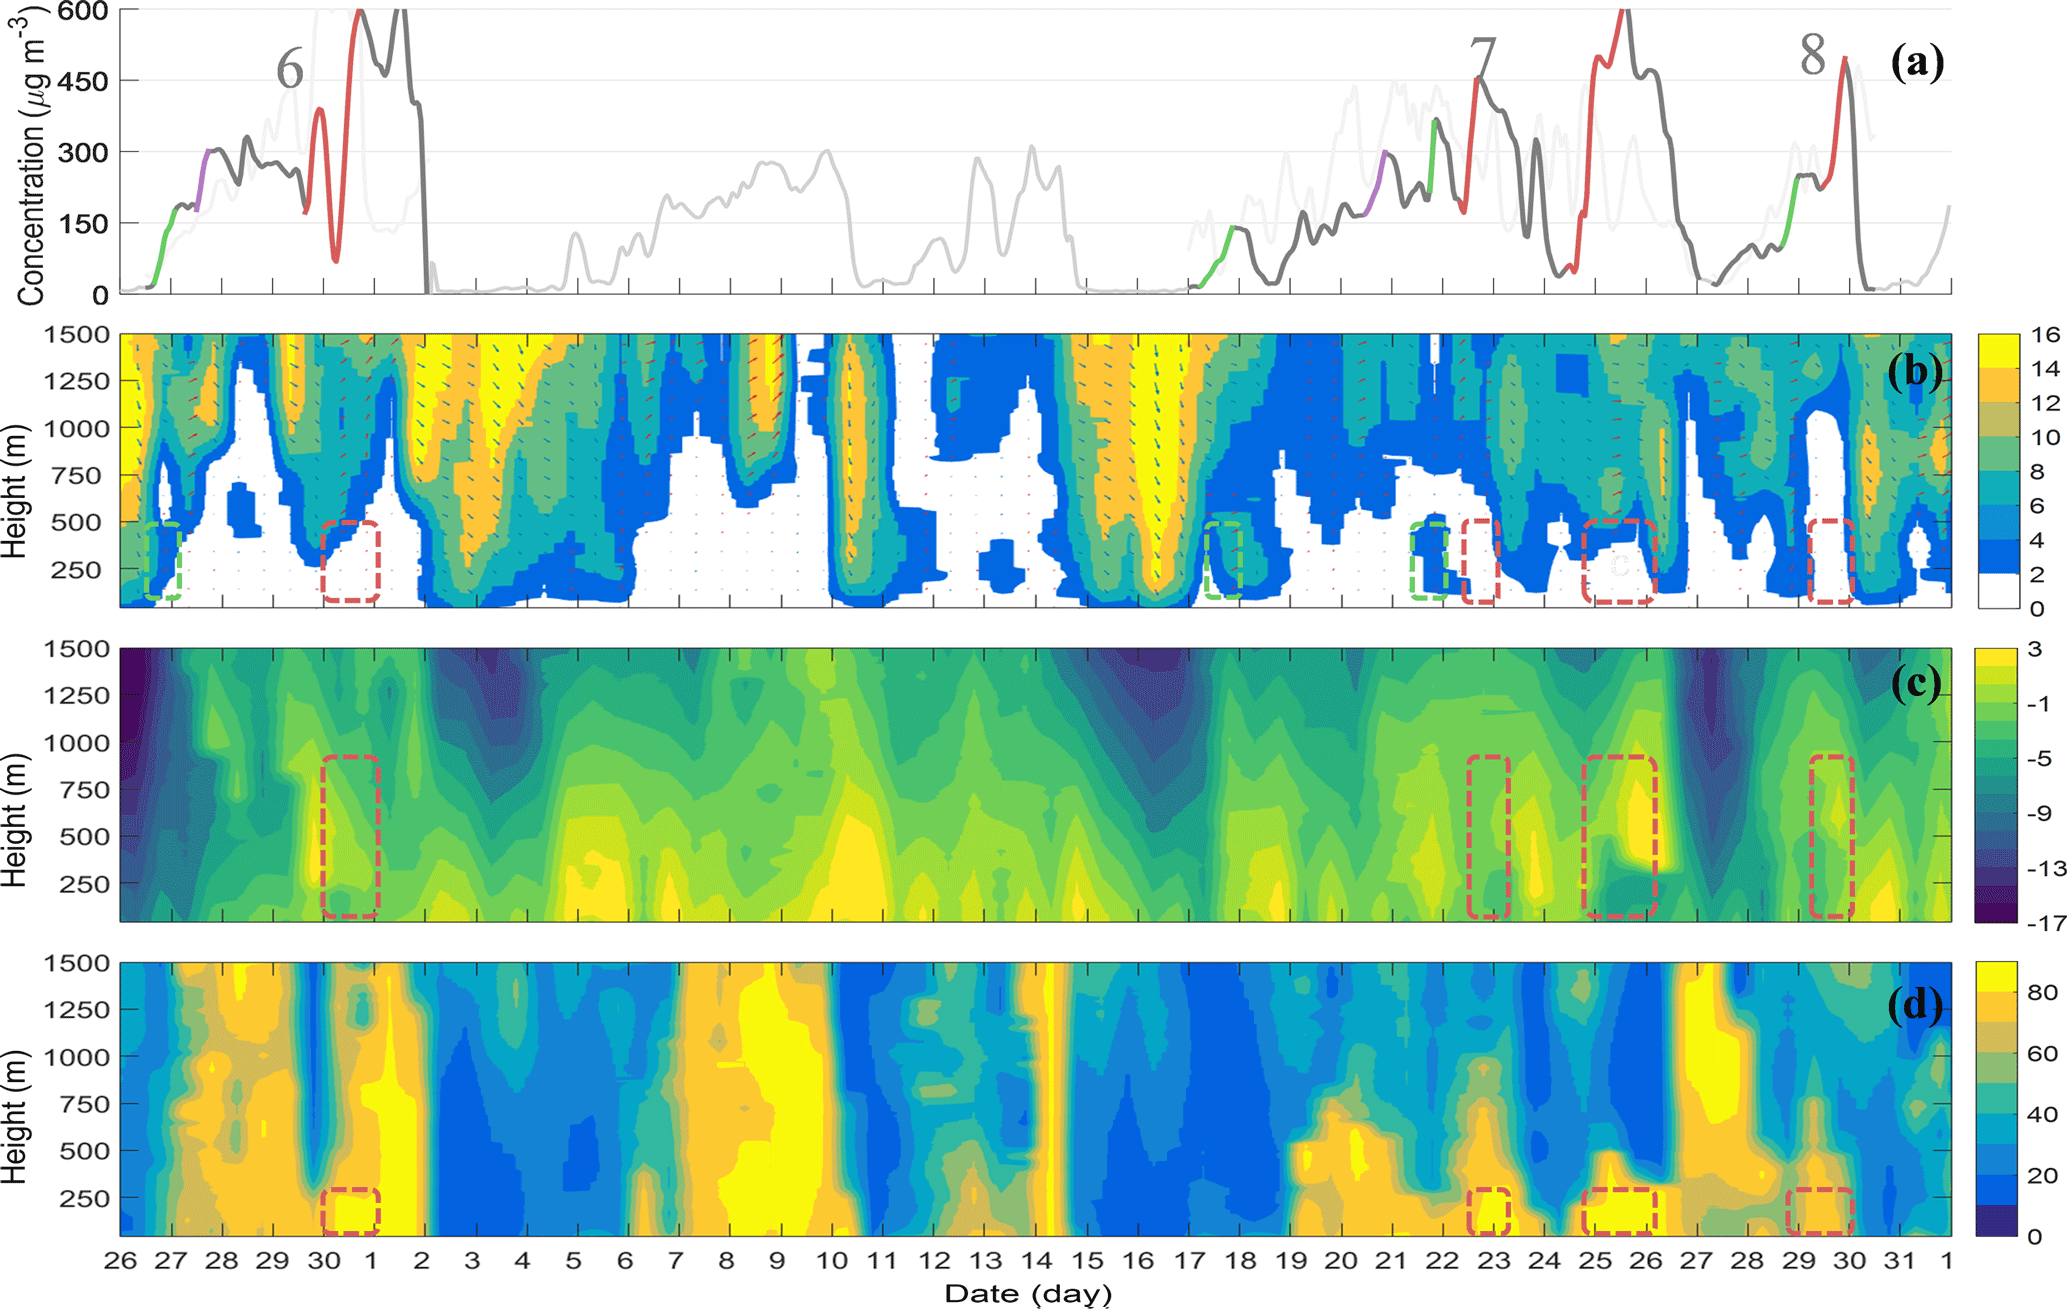
Figure 3Temporal variations in urban mean PM2.5 and vertical distributions of meteorological factors in December 2015. (a) PM2.5 mass concentration (dark gray or gray: Beijing; light gray: Baoding); (b) winds (vectors; red vectors: southwesterly winds) and wind velocity (shadings; units: m s−1); (c) temperature (shadings; units: ∘C); (d) RH (shadings; units: %). Green boxes: rising processes; red boxes: cumulative explosive processes.
3.2 Meteorological causes of the explosive growth in HPEs
3.2.1 PM2.5 pollution formation is primarily caused by pollutants transported from the south of Beijing, which subsequently worsens weather conditions
We found that, during clean periods, mostly strong northwesterly winds occur whose velocity increases with height; during the HPEs, the southwesterly winds with dramatically decreased velocity were most frequent (Figs. 1–4a, b). Strong northerly winds and weak southerly winds closely correspond to the clean periods and the HPEs, respectively, because northwesterly winds, which are from less populated northern mountainous areas, carry unpolluted air masses while southerly winds carry polluted air masses from more populated and polluted southern industrial regions (Jia et al., 2008; Liu et al., 2013; Guo et al., 2014).
During the TSs with southerly winds, air temperature and moisture substantially increase compared with clean periods with northerly winds (Figs. 1–4b, c, d), which indicates the warm and humid southerly airflow transports more water vapor and heat into Beijing. During 15 rising processes (green lines), nearly no striking near-ground (< 250 m) moisture accumulation appears; no anomalous inversion appears except for brief weak inversion, which suggest that vertical variations in temperature and RH are unlike to primarily cause such rising. Nevertheless, weak inversion and more near-ground moisture favor growth.
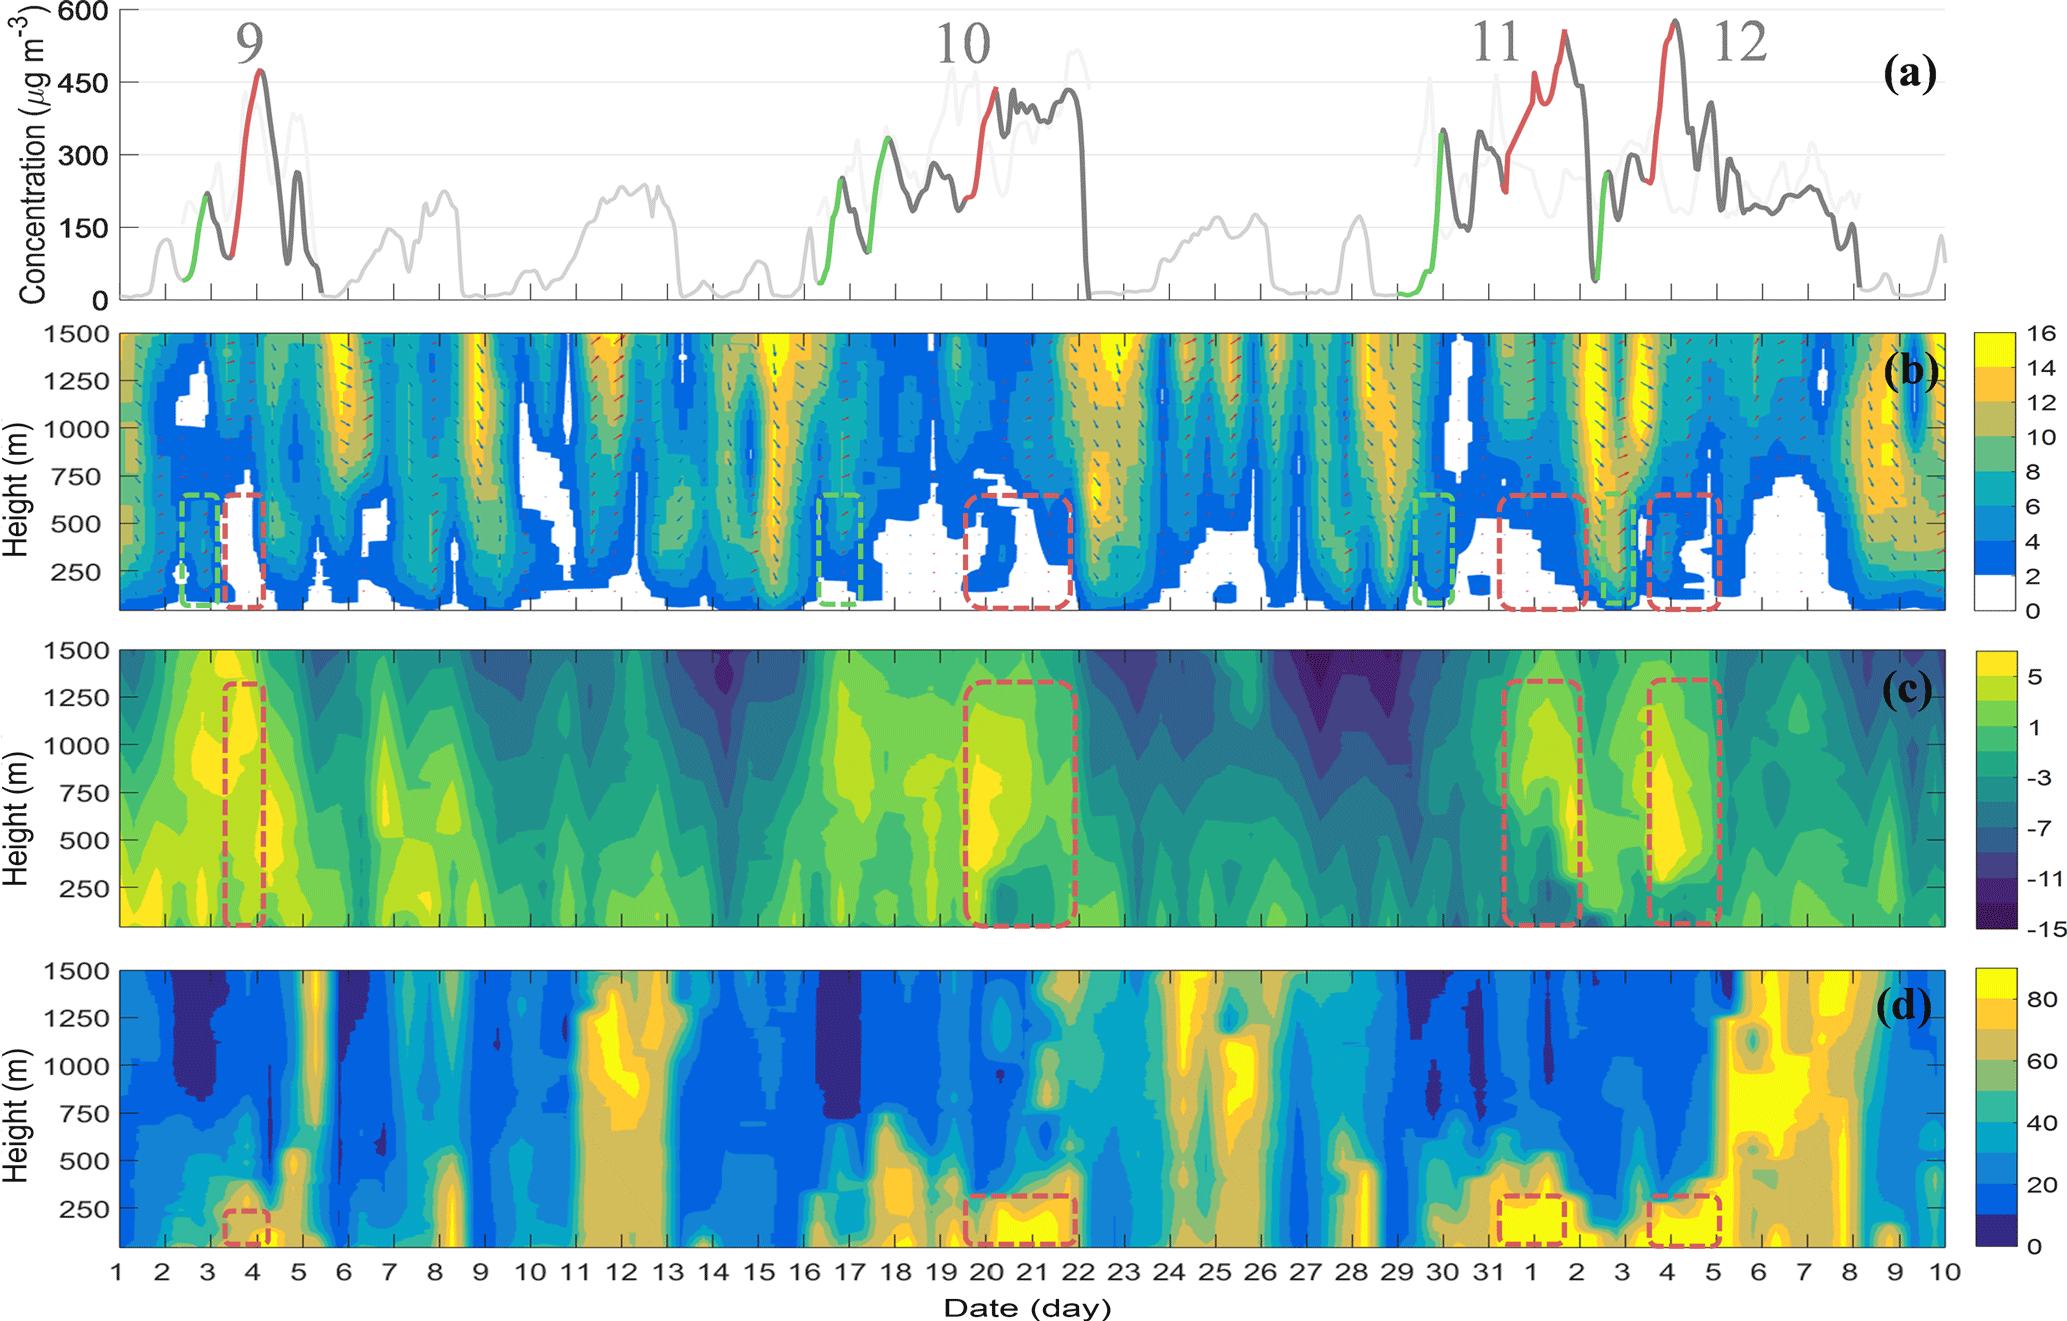
Figure 4Temporal variations in urban mean PM2.5 and vertical distributions of meteorological factors in December 2016. (a) PM2.5 mass concentration (dark gray or gray: Beijing; light gray: Baoding); (b) winds (vectors; red vectors: southwesterly winds) and wind velocity (shadings; units: m s−1); (c) temperature (shadings; units: ∘C); (d) RH (shadings; units: %). Green boxes: rising processes; red boxes: cumulative explosive processes.
If we assume that the primary cause of this rising is pollution accumulation due to local emissions, the rising needs to coincide with light (0.3–1.5 m s−1) or calm (0–0.2 m s−1) air observed during the later TSs instead of the slight (1.6–3.3 m s−1) or gentle (3.4–5.4 m s−1) breeze observed during the early TSs because weaker winds result in a stagnant condition, which is more favorable for local accumulation. However, the majority of later TSs with calm air do not exhibit such rising (Figs. 1–4a, b), which suggests local emissions under weak winds are likely conducive but not dominant with respect to rising.
Before rising processes during HPE1∼2, the urban PM2.5 mass concentration of Baoding (light gray lines), which is typically representative of pollution conditions in the south of Beijing, was much higher than in Beijing; the winds in Beijing rapidly shifted from northerly to southerly. Then the rising (green lines) occurred, consistently with southerly slight or gentle breezes in the BL (green boxes). The southerly air mass moved more than 288 km d−1 below 500 m (estimated from the measured wind speed), which is fast enough to transport pollutants to Beijing. Similar conditions appeared in eight of other nine HPEs with rising. Such processes indicate that southerly pollutant transport is primarily responsible for the rising, given the pollution transport pathway of the southwest wind belt determined by the unique geographic features of the North China Plain, with the Taihang Shan and the Yan Shan strengthening the southwest wind belt and leading to the convergence of pollutant transport in Beijing. (Su et al., 2004). Governed by this transport pathway, PM2.5 mass concentration increased by ∼ 400 µg m−3 from less than 35 µg m−3 in 10 h on 22 January 2013 when winds shifted from northerly to southerly with much higher PM2.5 concentrations in Baoding.
Pollutants transported from the south of Beijing primarily result in PM2.5 pollution formation in the urban area of Beijing, to which possible weak inversion and the near-surface moisture accumulation is conducive. Warm and humid airflow from the south transports more water vapor and pollutants to the North China Plain, which creates the requisite moisture and pollution accumulation conditions for subsequently cumulative explosive growth.
3.2.2 Worsening meteorological conditions primarily cause cumulative explosive growth
Feedback of anomalous inversion on pollutant accumulation
Anomalous inversion occurs during 10 of 12 HPEs (Figs. 1–4a, c). The factors that cause inversion in Beijing include topography, advection and radiation. With the Taihang Shan and the Yan Shan lying north of Beijing, a cold air mass flows down into the urban area of Beijing from the mountain peaks, which occasionally causes topography inversion; advection inversion occurs when a warm and less dense air mass moves over a cold and dense air mass. However, during most cumulative stages, the anomalous inversion appears with slight or calm winds, which suggests that the movement of air masses is not striking, so the contribution of topography and advection to such inversion is limited. The ground emits long-wave radiation at night to reduce near-ground temperature to facilitate inversion occasionally. However, almost no anomalous inversion occurs without pre-existing high PM2.5 mass concentration in the WPP (Figs. 1–4), which suggests that the ground radiation is likely conducive to weak/normal inversion but not dominant with respect to anomalous inversion.
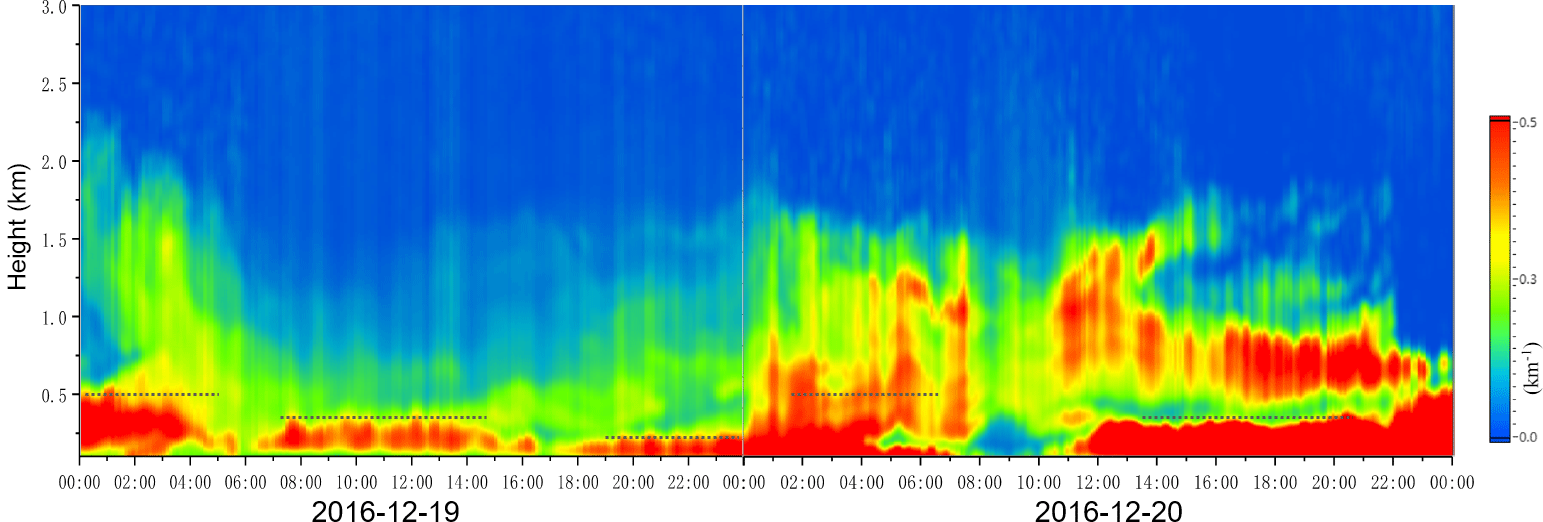
Figure 5Time series of vertical distributions of the extinction coefficient of aerosols observed in the northern urban area of Beijing from 19 to 20 December 2016. Dashed lines: the approximate boundary-layer height.
The anomalous inversion noted is preceded by existing relatively high PM2.5 levels generally established by the rising processes. Before the cumulative explosive growth, existing aerosols are concentrated below 500 m (Fig. 5). These low-layer aerosols backscatter amounts of radiation to space (J. Wang et al., 2014; Gao et al., 2015) and cause a significant reduction in radiation reaching the ground, which further reduces near-ground temperature. These findings indicate that anomalous inversion is primarily due to the radiation cooling effect of preexisting aerosols. Below the inversion, near-ground temperature reduction cools down plumes or thermals of originally warm surface air to decrease thermal turbulence; observed weakened vertical shear of horizontal winds (Figs. 1–4b) produces less vorticity to reduce mechanical turbulence, which further strengthens the existing inversion.
Anomalous inversion traps pollution-laden air beneath it due to its strong static stability (Wallace and Hobbs, 2006). It facilitates pollutant accumulation by suppressing vertical air mixing and reducing BL height. During the cumulative explosive growth with anomalous inversion in the HPE10, the turbulent diffusion coefficient rapidly decreases from 100 to 50 m2 s−1 (model output of CUACE/Chem, the mesoscale China Meteorological Administration (CMA) Unified Atmospheric Chemistry modeling system, Hong Wang, personal communication, 2016), and similar conditions of turbulent diffusion have been modeled in another pollution episode in Beijing (Wang et al., 2015a, b); the BL height decreases from ∼ 500 m in the early morning, to ∼ 350 m at noon even to ∼ 250 m at night (Fig. 5), which coincide with the increase of PM2.5 from ∼ 200 to ∼ 450 µg m−3 (Fig. 4a). The striking layered structure in the BL occurs at the height of ∼ 300 m on 20 December 2016 (Fig. 5), which is consistent with the lower edge of anomalous inversion (Fig. 4), which confirms the strong inhibition of anomalous inversion. Additionally, a short cold air mass invades the northern urban area of Beijing in the early morning on 20 December 2016. The enhanced movement increases the BL height and reduces the PM2.5 mass concentration in part of the northern urban area (Fig. 5), which slightly reduces the urban mean mass concentration of PM2.5 in the early morning of that day (Fig. 4a). However, the anomalous inversion rapidly restores its original structure to facilitate pollutant accumulation.
The occurrence of anomalous inversion in nine HPEs coincides with cumulative explosive growth of PM2.5 levels (F1 ∼ 4a, c), which confirms the suppression of anomalous inversion to pollutants. Note that no cumulative explosive growth of PM2.5 levels appears in HPE3 despite anomalous inversion, partly because the height of the lowest inversion layer in HPE3 (∼ 750 m) is much higher than that in the nine HPEs (∼ 250 m), which suggests that near-ground inversion is more favorable for pollutant accumulation.
Anomalous inversion results in near-surface moisture accumulation
During clean periods, the moisture is evenly distributed in the BL with RH of less than 40 %, while during the HPEs, RH is over 60 % (even 80 %) in the lower or upper BL (Figs. 1–4c, d). During the HPEs, in the absence of temperature inversion, moisture vertically distributes in the BL, and the RH in the upper BL is occasionally higher than that of the near-ground surface; in the presence of weak inversion, the lower edge of the inversion layer is in approximate agreement with the RH contour of 60 %. In the presence of anomalous inversion (red boxes in Figs. 1–4c) in the BL, the lower edge of the strong inversion layer frequently coincides with an RH contour of 80 % (red boxes in Figs. 1–4d), which is observed in most cumulative explosive growth processes.
The relation of vertical temperature and RH previously noted indicates that anomalous inversion results in appreciable near-surface moisture accumulation by suppressing the vertical mixing of the water vapor (Wallace and Hobbs, 2006). The vertical diffusion of the near-surface water vapor as the anomalous inversion disappeared on 1 December 2016, 26 December 2016 and 5 January 2017 confirms the cited research outcome. Note that the mentioned near-ground temperature reduction caused by cooling effects of aerosols is also conducive to moisture accumulation by decreasing near-ground saturation vapor pressure to increase RH.
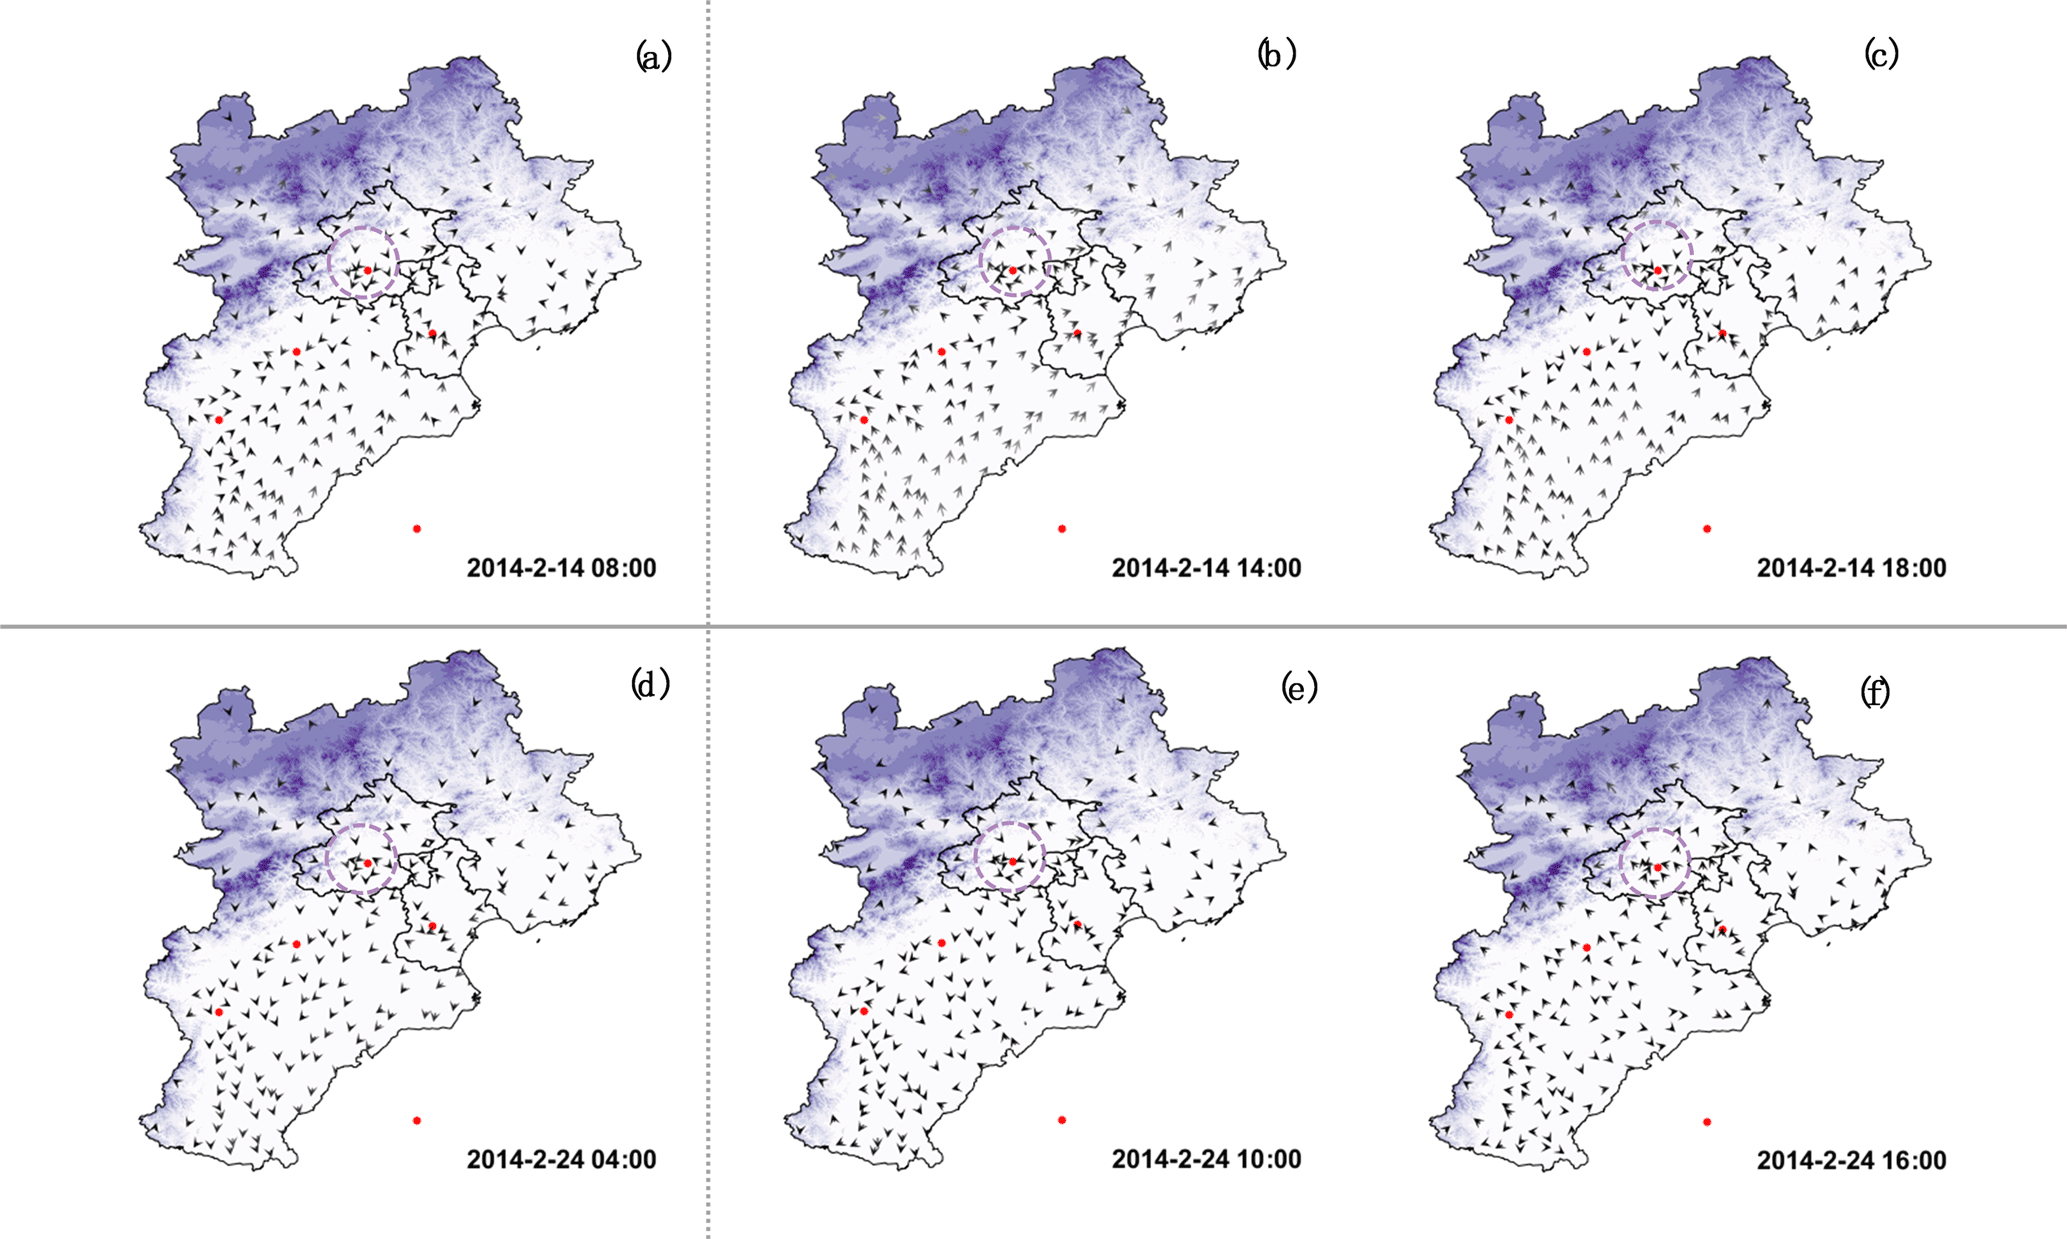
Figure 6Surface wind distributions before (a, d) and during (b, c; d, e) two convergent explosive growth processes in February 2014 on the North China Plain.
Moisture accumulation facilitates aerosol hygroscopic growth and additional secondary aerosol formation
Strongly absorbent aerosol particles absorb and grow when additional water vapor appears in the air (L. Zhang et al., 2015). The mass concentrations of organic aerosols, sulfate, nitrate and ammonium rapidly increase with RH (Fig. S1 in the Supplement). After moisture absorption in North China, aerosol particle size increases by 20–60 % (Pan et al., 2009) and aerosol direct radiative forcing increases by ∼ 50 % (L. Zhang et al., 2015). As a key component of atmospheric aerosols, aerosol water serves as a medium that enables aqueous-phase reactions (Pilinis et al., 1989; Seinfeld and Pandis, 1986; Ervens et al., 2011). For example, aerosol water serves as a reactor in which alkaline aerosol components trap SO2, which is then oxidized by NO2 to form sulfate in northern China (Cheng et al., 2016). The ratio of SO2 to SO ranges from less than 0.1 at RH< 20 % to 1.1 at RH > 90 %, exhibiting an exponential increase with RH (Wang et al., 2016). In addition, high RH facilitates heterogeneous chemical processes to aggravate air pollution (Zhu et al., 2011). For example, the net reaction probability of HNO3 uptake on CaCO3 particles was found to increase with relative humidity from ∼ 0.003 at 10 to 0.21 at 80 % (Liu et al., 2008).
The stable atmospheric stratification characteristic of southerly light or calm winds, anomalous inversion, and near-ground (< 250 m) moisture accumulation (RH > 80 %) dominates the cumulative explosive growth of PM2.5.
During the HPEs, nearly all 10 cumulative explosive growth processes (Figs. 1–4) occur concurrently with stable atmospheric stratification primarily characterized by southerly light or calm winds, near-ground anomalous inversion, and cumulative moisture (RH > 80 %). The weak southerly winds, increased with height, are conducive to the growth because relatively strong southerly winds in the upper BL (∼ 1000 m) transport pollutants from the south of Beijing, while low-level (∼ 250 m) southerly light or calm winds limiting the invasion of northerly cold winds facilitate local pollution accumulation by minimizing horizontal pollutant diffusion. The anomalous inversion facilitates vertical pollutant accumulation by suppressing convection activities. During the cumulative growth process in HPE10, the turbulent diffusion coefficient rapidly decreases from 100 to 50 m2 s−1 and the BL height decreases from 500 to ∼ 250 m, which is extremely favorable for pollutant accumulation. The additional suppression of vertical mixing of water by inversion and the decreased saturation vapor pressure previously noted cause near-surface moisture accumulation (RH > 80 %). This accumulated moisture facilitates secondary aerosol formation in liquid-phase and heterogeneous reactions to increase PM2.5 levels.
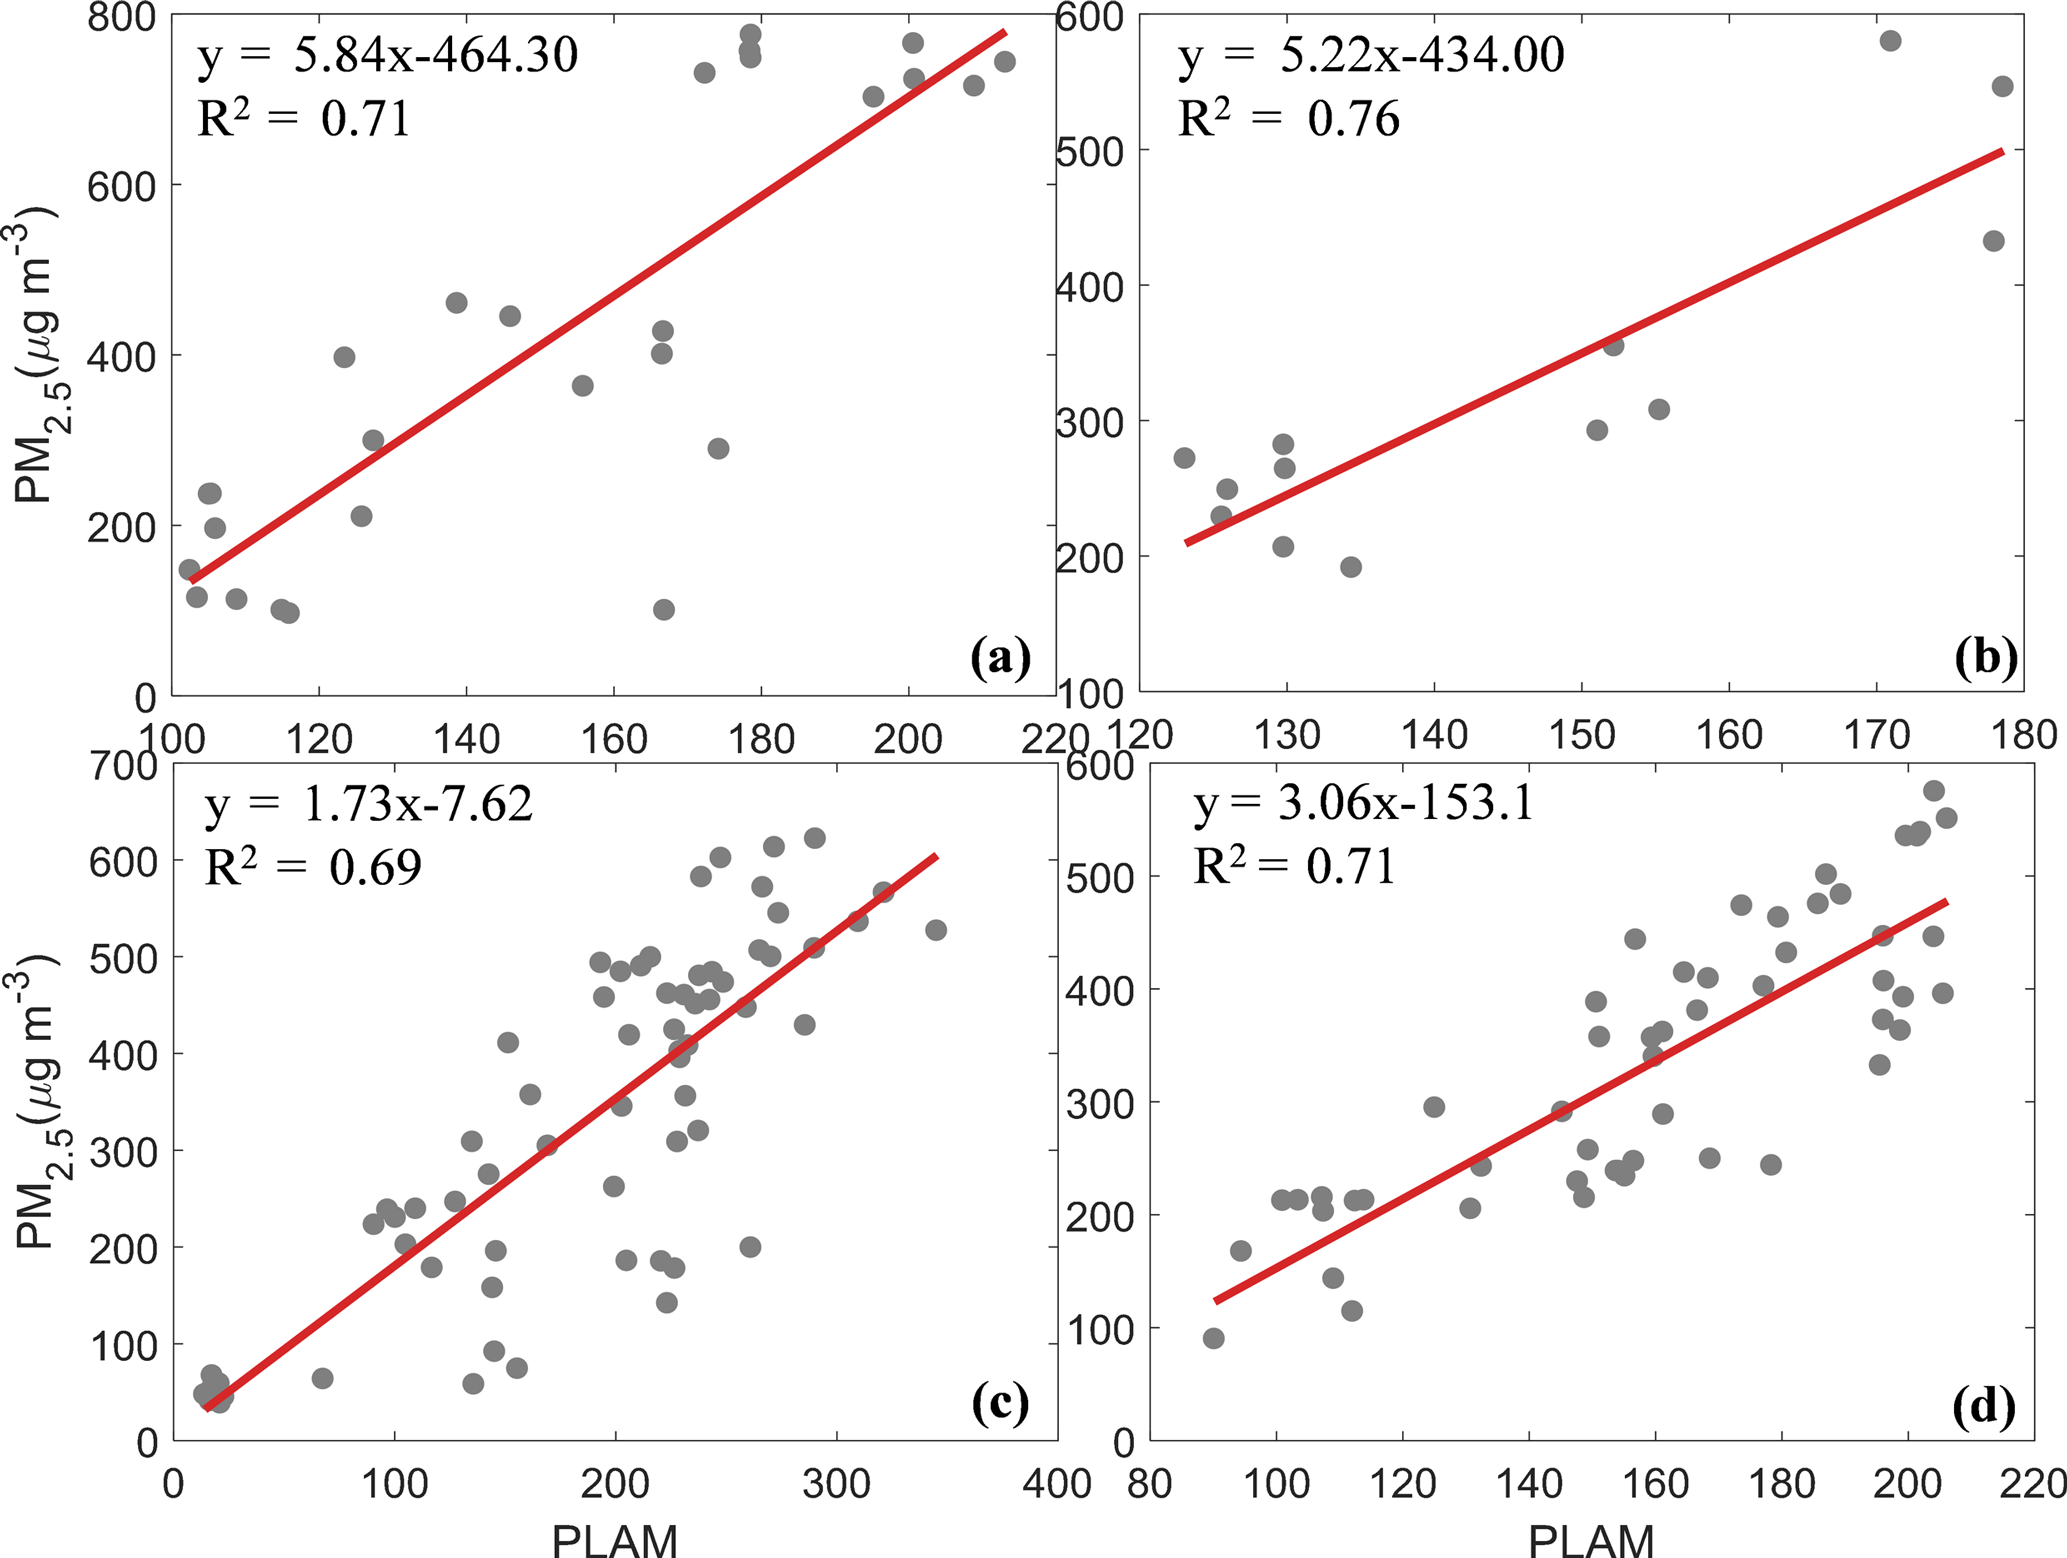
Figure 7Correlation between PLAM and PM2.5 during the cumulative explosive growth processes in January 2013 (a), December 2015 (c) and December 2016 (d) and the convergent explosive growth processes in February 2014 (b).
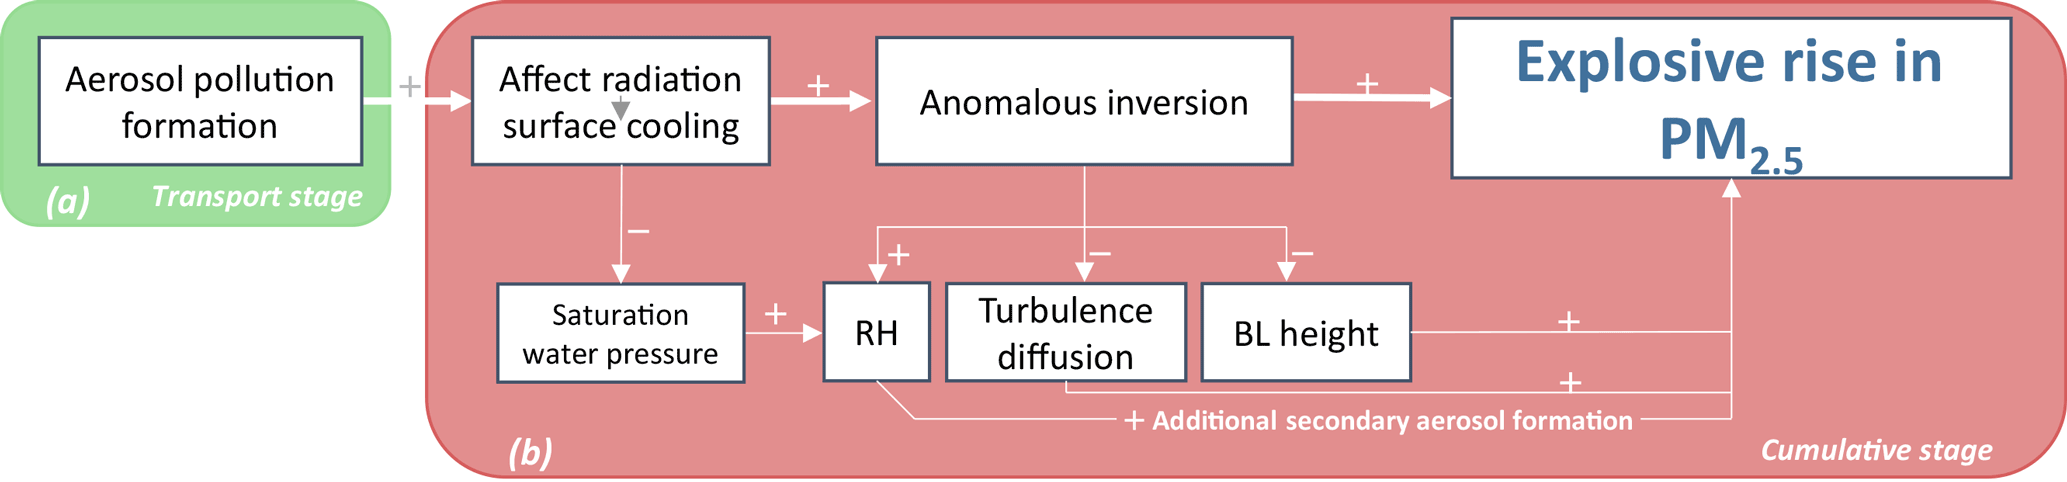
Figure 8A schematic figure of the formation mechanism for winter heavy-pollution episodes in Beijing, which consist of the transport stage (green background) and the cumulative stage (red background).
It is likely that it is primarily merely weak southerly winds or near-ground anomalous inversion that can cause cumulative explosive growth. However, the growth does not occur in the polluted process from 4 to 15 December 2015 with weak southerly winds, which indicates that weak southerly winds do not suffice to cause cumulative explosive growth in the absence of anomalous inversion; even with anomalous inversion, no explosive growth appeared on 14 and 24 January 2013, which suggests that anomalous inversion cannot cause explosive growth without weak southerly winds. Therefore, cumulative explosive growth in CSs primarily resulted from the joint effects of southerly light or calm winds, near-ground anomalous inversion and moisture accumulation.
Note that the cumulative explosive growth at 20:00 BJT on 3 January was accompanied by a southerly gentle breeze (3.4–5.4 m s−1), which suggests that low-level southerly pollutant transport occasionally exerts an important impact on growth, with anomalous inversion and near-ground moisture accumulation.
Feedback of cumulative pollutants on worsening meteorological conditions
Established from cumulative explosive growth, exceedingly high PM2.5 levels further decrease the near-ground temperature by reflecting and scattering more solar radiation, which strengthens the existing anomalous inversion and subsequently results in additional pollutant accumulation until the next synoptic process occurs. The near-surface temperature decreased from 3∘C at 20:00 BJT on 19 December to −3∘C at 08:00 BJT on 20 December after elevated ground PM2.5 levels (Fig. 4d). Then, it remained at ∼ −1∘C, with PM2.5 of more than 400 µg m−3 until northerly strong and clean winds blew the pollution away on 22 December. Similar processes also occurred in the CSs of other HPEs, which confirms the outcome.
3.2.3 Local air convergence is favorable for convergent explosive growth
The explosive growth of PM2.5 appears in HPE4−5 without inversion and near-ground moisture accumulation (Fig. 2), which suggests that stable atmospheric stratification noted previously does not primarily cause the growth. Weak winds in convergent explosive growth processes, particularly the process in HPE5, eliminate the likely contributions of southerly transport pollution. A comparison of surface wind distributions in the North China Plain before (Fig. 6a, d) and during (Fig. 6b, c, d, e) the convergent explosive growth processes in HPE4−5 shows that the urban area of Beijing is dominated by northerly winds before the growth, while is characterized by local air convergence during the processes, which suggests that the persistent local convergence is conducive to the explosive growth by causing pollutants to further accumulate locally. The convergent explosive growth in HPE6−7 with air convergence (Fig. S2) also confirms the outcome.
3.3 Quantification of meteorological contributions to PM2.5 cumulative explosive growth
Cooling effects of elevated PM2.5 levels established from TSs worsen meteorological conditions, which primarily causes cumulative explosive growth. To approximately quantify this atmospheric feedback on the growth, PLAM (Parameter Linking Aerosol Pollution and Meteorological Elements) was used, which was derived from the relationship of PM2.5 with key meteorological parameters. The PLAM index, whose details of calculation have been described in J. Wang et al. (2013) and Wang et al. (2012), primarily reflects the stability of the air mass and the condensation rate of water vapor on aerosol particles. It has been employed to identify the contribution of specific meteorological factors to a 10 d haze–fog event in 2013 (Zhang et al., 2013) and to evaluate the contribution of meteorological factors to changes in atmospheric composition and optical properties over Beijing during the 2008 Olympic Games (Zhang et al., 2009). During cumulative explosive growth processes, the hourly variation in urban mean PM2.5 mass concentration is in close linear agreement with that of PLAM for Beijing (Fig. 7a–d). The squared correlation coefficients between hourly PLAM and PM2.5 in 2013, 2015 and 2016 are 0.71, 0.69 and 0.71, respectively, exceeding the 0.05 significance level. The mean value of four coefficients is over 0.70, which suggests that the previously noted feedback of worsening meteorological conditions on PM explains over 70 % in cumulative explosive growth of PM2.5. In addition, the squared correlation coefficient between PLAM and PM2.5 in 2014 is 0.76, which indicates that enhanced regional atmospheric stability facilitate convergent explosive growth of PM2.5.
We have characterized different stages of 12 HPEs during the WPPs in Beijing and typical explosive growth of PM2.5, including cumulative and convergent explosive growth. Meteorological causes for such growth are elucidated, based on observations of vertical meteorological factors within the BL (Fig. 8). Beijing HPEs can generally be divided into the TS, whose rising processes is primarily caused by pollutants transported from the south of Beijing, and the CS, in which stable atmospheric stratification dominates the cumulative explosive growth of PM2.5.
Polluted and humid airflow from the south of Beijing transports water vapor and pollutants to Beijing, which primarily causes rising processes and creates the requisite moisture and pollution accumulation conditions for CSs. Elevated PM2.5 levels established from the TS reduce near-ground temperature by backscattering shortwave solar radiation. This temperature reduction very likely results in anomalous inversion, which is enhanced by the reduced mechanical turbulence that results from less vorticity caused by the observed weakened vertical shear of horizontal winds in the lower BL during the later TSs and decreased thermal turbulence with cooling plumes or thermals of originally warm surface air that result from the decreased near-ground temperature. Anomalous inversion reduces turbulent diffusion and decreases the BL height to trap pollutants. The similar suppression of anomalous inversion to the vertical mixing of water vapor and decreased saturation water vapor pressure caused by the temperature reduction noted result in appreciable near-surface moisture accumulation (RH > 80 %). The accumulated moisture facilitates pollutant accumulation by enhancing hygroscopic growth and accelerating liquid-phase and heterogeneous reactions. However, specific reaction mechanisms have not been fully quantified and require additional investigation, particularly their contributions to the explosive growth and the maintenance of PM2.5 during CSs. Note that the observed southerly weak winds facilitate local pollutant accumulation by minimizing horizontal pollutant diffusion. The joint effects of southerly weak winds, near-ground anomalous inversion and moisture accumulation dominate the cumulative explosive growth of PM2.5. Nearly 70 % of the growth is attributable to the meteorological feedback noted, based on correlation analysis between PM2.5 and the PLAM index during cumulative explosive growth processes. Note that sporadic local air convergence also causes pollutants to further accumulate.
Established as a result of cumulative explosive growth, exceedingly high PM2.5 levels further decrease the near-ground temperature to strengthen the existing anomalous inversion, which results in additional pollutant accumulation until the next synoptic process occurs.
The data that support the findings of this study are available from the corresponding author upon reasonable request.
The supplement related to this article is available online at: https://doi.org/10.5194/acp-18-247-2018-supplement.
XZ and YW designed the research; XZ, JZ and HC carried out the analysis of observations. YD provided and analyzed laser radar data. YZ provided aerosol species data. JW provided PLAM data. JZ wrote the first draft of the manuscript and XZ revised the manuscript. All authors read and approved the final version.
The authors declare that they have no conflict of interest.
This research is supported by the National Key Project of MOST
(2016YFC0203306), the Atmospheric Pollution Control of the Prime Minister
Fund (DQGG0104), and the Basic Scientific Research Progress of the Chinese Academy of
Meteorological Sciences (2016Z001).
Edited by: Qiang Zhang
Reviewed by: two anonymous referees
Bai, N., Khazaei, M., van Eeden, S. F., and Laher, I.: The pharmacology of particulate matter air pollution-induced cardiovascular dysfunction, Pharmacol. Therapeut., 113, 16–29, 2007.
Boucher, O., Randall, D., Artaxo, P., Bretherton, C., Feingold, G., Forster, P., Kerminen, V. V. M., Kondo, Y., Liao, H., Lohmann, U., Rasch, P., Satheesh, S. K., Sherwood, S., Stevens, B., and Zhang, X. Y.: Clouds and Aerosols, in: Climate Change 2013: The Physical Science Basis, Contribution of Working Group I to the Fifth Assessment Report of the Intergovernmental Panel on Climate Change, edited by: Stocker, T. F., Qin, D., Plattner, G.-K., Tignor, M., Allen, S. K., Boschung, J., Nauels, A., Xia, Y., Bex, V., and Midgley, P. M., Cambridge University Press, Cambridge, United Kingdom and New York, NY, USA, 571–658, 2013.
Chen, Y., Ebenstein, A., Greenstone, M., and Li, H.: Evidence on the impact of sustained exposure to air pollution on life expectancy from China's Huai River policy, P. Natl. Acad. Sci. USA, 110, 12936–12941, https://doi.org/10.1073/pnas.1300018110, 2013.
Cheng, Y., Zheng, G., Chao, W., Mu, Q., Bo, Z., Wang, Z., Meng, G., Qiang, Z., He, K., and Carmichael, G.: Reactive nitrogen chemistry in aerosol water as a source of sulfate during haze events in China, Science Advances, 2, https://doi.org/10.1126/sciadv.1601530, 2016.
Ervens, B., Turpin, B. J., and Weber, R. J.: Secondary organic aerosol formation in cloud droplets and aqueous particles (aqSOA): a review of laboratory, field and model studies, Atmos. Chem. Phys., 11, 11069–11102, https://doi.org/10.5194/acp-11-11069-2011, 2011.
Fernald, F. G.: Analysis of atmospheric lidar observations: some comments, Appl. Opt., 23, 652–653, https://doi.org/10.1364/AO.23.000652, 1984.
Gao, Y., Zhang, M., Liu, Z., Wang, L., Wang, P., Xia, X., Tao, M., and Zhu, L.: Modeling the feedback between aerosol and meteorological variables in the atmospheric boundary layer during a severe fog-haze event over the North China Plain, Atmos. Chem. Phys., 15, 4279–4295, https://doi.org/10.5194/acp-15-4279-2015, 2015.
Guo, S., Hu, M., Zamora, M. L., Peng, J. F., Shang, D. J., Zheng, J., Du, Z. F., Wu, Z., Shao, M., Zeng, L. M., Molina, M. J., and Zhang, R. Y.: Elucidating severe urban haze formation in China, P. Natl. Acad. Sci. USA, 111, 17373–17378, https://doi.org/10.1073/pnas.1419604111, 2014.
Hua, Y., Wang, S., Wang, J., Jiang, J., Zhang, T., Song, Y., Kang, L., Zhou, W., Cai, R., Wu, D., Fan, S., Wang, T., Tang, X., Wei, Q., Sun, F., and Xiao, Z.: Investigating the impact of regional transport on PM2.5 formation using vertical observation during APEC 2014 Summit in Beijing, Atmos. Chem. Phys., 16, 15451–15460, https://doi.org/10.5194/acp-16-15451-2016, 2016.
Huang, R.-J., Zhang, Y., Bozzetti, C., Ho, K.-F., Cao, J.-J., Han, Y., Daellenbach, K. R., Slowik, J. G., Platt, S. M., and Canonaco, F.: High secondary aerosol contribution to particulate pollution during haze events in China, Nature, 514, 218–222, 2014.
Jia, Y., Rahn, K. A., He, K., Wen, T., and Wang, Y.: A novel technique for quantifying the regional component of urban aerosol solely from its sawtooth cycles, J. Geophys. Res.-Atmos., 113, 6089–6098, 2008.
Liu, X. G., Li, J., Qu, Y., Han, T., Hou, L., Gu, J., Chen, C., Yang, Y., Liu, X., Yang, T., Zhang, Y., Tian, H., and Hu, M.: Formation and evolution mechanism of regional haze: a case study in the megacity Beijing, China, Atmos. Chem. Phys., 13, 4501–4514, https://doi.org/10.5194/acp-13-4501-2013, 2013.
Liu, Y., Gibson, E. R., Cain, J. P., Wang, H., Grassian, V. H., and Laskin, A.: Kinetics of heterogeneous reaction of CaCO3 particles with gaseous HNO3 over a wide range of humidity, J. Phys. Chem. A, 112, 1561–1571, 2008.
Lv, L., Liu, W., Zhang, T., Chen, Z., Dong, Y., Fan, G., Xiang, Y., Yao, Y., Yang, N., and Chu, B.: Observations of particle extinction, PM2.5 mass concentration profile and flux in north China based on mobile lidar technique, Atmos. Environ., 164, 360–369, https://doi.org/10.1016/j.atmosenv.2017.06.022, 2017.
Pan, X. L., Yan, P., Tang, J., Ma, J. Z., Wang, Z. F., Gbaguidi, A., and Sun, Y. L.: Observational study of influence of aerosol hygroscopic growth on scattering coefficient over rural area near Beijing mega-city, Atmos. Chem. Phys., 9, 7519–7530, https://doi.org/10.5194/acp-9-7519-2009, 2009.
Pilinis, C., Seinfeld, J. H., and Grosjean, D.: Water content of atmospheric aerosols, Atmos. Environ., 23, 1601–1606, 1989.
Seinfeld, J. H. and Pandis, S. N.: Atmospheric Chemistry and Physics: From Air Pollution to Climate Change, John Wiley & Sons, USA, 1986.
Su, F., Gao, Q., Zhang, Z., Ren, Z.-H., and Yang, X.-X.: Transport pathways of pollutants from outside in atmosphere boundary layer, Research of Environmental Sciences, 1, 26–29, 2004.
Sun, Y., Jiang, Q., Wang, Z., Fu, P., Li, J., Yang, T., and Yin, Y.: Investigation of the sources and evolution processes of severe haze pollution in Beijing in January 2013, J. Geophys. Res.-Atmos., 119, 4380–4398, 2014.
Sun, Y. L., Jiang, Q., Wang, Z. F., Fu, P. Q., Li, J., Yang, T., and Yin, Y.: Investigation of the sources and evolution processes of severe haze pollution in Beijing in January 2013, J. Geophys. Res.-Atmos., 119, 4380–4398, https://doi.org/10.1002/2014jd021641, 2014.
Wallace, J. M. and Hobbs, P. V.: Atmospheric science: an introductory survey, Elsevier, 2006.
Wang, G., Zhang, R., Gomez, M. E., Yang, L., Levy Zamora, M., Hu, M., Lin, Y., Peng, J., Guo, S., Meng, J., Li, J., Cheng, C., Hu, T., Ren, Y., Wang, Y., Gao, J., Cao, J., An, Z., Zhou, W., Li, G., Wang, J., Tian, P., Marrero-Ortiz, W., Secrest, J., Du, Z., Zheng, J., Shang, D., Zeng, L., Shao, M., Wang, W., Huang, Y., Wang, Y., Zhu, Y., Li, Y., Hu, J., Pan, B., Cai, L., Cheng, Y., Ji, Y., Zhang, F., Rosenfeld, D., Liss, P. S., Duce, R. A., Kolb, C. E., and Molina, M. J.: Persistent sulfate formation from London Fog to Chinese haze, P. Natl. Acad. Sci. USA, 113, 13630–13635, https://doi.org/10.1073/pnas.1616540113, 2016.
Wang, H., Zhang, X., Gong, S., Chen, Y., Shi, G., and Li, W.: Radiative feedback of dust aerosols on the East Asian dust storms, J. Geophys. Res., 115, 6696–6705, 2010.
Wang, H., Shi, G. Y., Zhang, X. Y., Gong, S. L., Tan, S. C., Chen, B., Che, H. Z., and Li, T.: Mesoscale modelling study of the interactions between aerosols and PBL meteorology during a haze episode in China Jing-Jin-Ji and its near surrounding region – Part 2: Aerosols' radiative feedback effects, Atmos. Chem. Phys., 15, 3277–3287, https://doi.org/10.5194/acp-15-3277-2015, 2015a.
Wang, H., Xue, M., Zhang, X. Y., Liu, H. L., Zhou, C. H., Tan, S. C., Che, H. Z., Chen, B., and Li, T.: Mesoscale modeling study of the interactions between aerosols and PBL meteorology during a haze episode in Jing-Jin-Ji (China) and its nearby surrounding region – Part 1: Aerosol distributions and meteorological features, Atmos. Chem. Phys., 15, 3257–3275, https://doi.org/10.5194/acp-15-3257-2015, 2015b.
Wang, J., Wang, Y., Liu, H., Yang, Y., Zhang, X., Li, Y., Zhang, Y., and Deng, G.: Diagnostic identification of the impact of meteorological conditions on PM2.5 concentrations in Beijing, Atmos. Environ., 81, 158–165, https://doi.org/10.1016/j.atmosenv.2013.08.033, 2013.
Wang, J., Wang, S., Jiang, J., Ding, A., Zheng, M., Zhao, B., Wong, D. C., Zhou, W., Zheng, G., Wang, L., Pleim, J. E., and Hao, J.: Impact of aerosol–meteorology interactions on fine particle pollution during China's severe haze episode in January 2013, Environ. Res. Lett., 9, 094002, https://doi.org/10.1088/1748-9326/9/9/094002, 2014.
Wang, J. Z., Gong, S., Zhang, X. Y., Yang, Y. Q., Hou, Q., Zhou, C., and Wang, Y.: A parameterized method for air-quality diagnosis and its applications, Adv. Meteorol., 2012, 1–10, https://doi.org/10.1155/2012/238589, 2012.
Wang, X., Chen, J., Sun, J., Li, W., Yang, L., Wen, L., Wang, W., Wang, X., Collett, J. L., and Shi, Y.: Severe haze episodes and seriously polluted fog water in Ji'nan, China, Sci. Total Environ., 493, 133–137, 2014.
Wang, Z., Li, J., Wang, Z., Yang, W., Tang, X., Ge, B., Yan, P., Zhu, L., Chen, X., and Chen, H.: Modeling study of regional severe hazes over mid-eastern China in January 2013 and its implications on pollution prevention and control, Science China Earth Sciences, 57, 3–13, 2014.
Wang, Z. B., Hu, M., Wu, Z. J., Yue, D. L., He, L. Y., Huang, X. F., Liu, X. G., and Wiedensohler, A.: Long-term measurements of particle number size distributions and the relationships with air mass history and source apportionment in the summer of Beijing, Atmos. Chem. Phys., 13, 10159–10170, https://doi.org/10.5194/acp-13-10159-2013, 2013.
Wei, P., Cheng, S. Y., Li, J. B., and Su, F. Q.: Impact of boundary-layer anticyclonic weather system on regional air quality, Atmos. Environ., 45, 2453–2463, https://doi.org/10.1016/j.atmosenv.2011.01.045, 2011.
Zhang, L., Sun, J. Y., Shen, X. J., Zhang, Y. M., Che, H., Ma, Q. L., Zhang, Y. W., Zhang, X. Y., and Ogren, J. A.: Observations of relative humidity effects on aerosol light scattering in the Yangtze River Delta of China, Atmos. Chem. Phys., 15, 8439–8454, https://doi.org/10.5194/acp-15-8439-2015, 2015. 2015.
Zhang, R. H., Li, Q., and Zhang, R. N.: Meteorological conditions for the persistent severe fog and haze event over eastern China in January 2013, Science China Earth Sciences, 57, 26–35, 2014.
Zhang, R. Y., Wang, G. H., Guo, S., Zarnora, M. L., Ying, Q., Lin, Y., Wang, W. G., Hu, M., and Wang, Y.: Formation of Urban Fine Particulate Matter, Chem. Rev., 115, 3803–3855, https://doi.org/10.1021/acs.chemrev.5b00067, 2015.
Zhang, X., Sun, J., Wang, Y., Li, W., Zhang, Q., Wang, W., Quan, J., Cao, G., Wang, J., Yang, Y., and Zhang, Y.: Factors contributing to haze and fog in China, Chinese Science Bulletin (Chinese Version), 58, 1178–1187, https://doi.org/10.1360/972013-150, 2013.
Zhang, X. Y., Wang, Y. Q., Lin, W. L., Zhang, Y. M., Zhang, X. C., Gong, S., Zhao, P., Yang, Y. Q., Wang, J. Z., and Hou, Q.: Changes of Atmospheric Composition and Optical Properties Over BEIJING–2008 Olympic Monitoring Campaign, B. Am. Meteorol. Soc., 90, 1633–1651, 2009.
Zhang, X. Y., Wang, Y. Q., Niu, T., Zhang, X. C., Gong, S. L., Zhang, Y. M., and Sun, J. Y.: Atmospheric aerosol compositions in China: spatial/temporal variability, chemical signature, regional haze distribution and comparisons with global aerosols, Atmos. Chem. Phys., 12, 779–799, https://doi.org/10.5194/acp-12-779-2012, 2012.
Zhang, X. Y., Wang, J. Z., Wang, Y. Q., Liu, H. L., Sun, J. Y., and Zhang, Y. M.: Changes in chemical components of aerosol particles in different haze regions in China from 2006 to 2013 and contribution of meteorological factors, Atmos. Chem. Phys., 15, 12935–12952, https://doi.org/10.5194/acp-15-12935-2015, 2015.
Zheng, B., Zhang, Q., Zhang, Y., He, K. B., Wang, K., Zheng, G. J., Duan, F. K., Ma, Y. L., and Kimoto, T.: Heterogeneous chemistry: a mechanism missing in current models to explain secondary inorganic aerosol formation during the January 2013 haze episode in North China, Atmos. Chem. Phys., 15, 2031–2049, https://doi.org/10.5194/acp-15-2031-2015, 2015.
Zheng, G. J., Duan, F. K., Su, H., Ma, Y. L., Cheng, Y., Zheng, B., Zhang, Q., Huang, T., Kimoto, T., Chang, D., Pöschl, U., Cheng, Y. F., and He, K. B.: Exploring the severe winter haze in Beijing: the impact of synoptic weather, regional transport and heterogeneous reactions, Atmos. Chem. Phys., 15, 2969–2983, https://doi.org/10.5194/acp-15-2969-2015, 2015.
Zhu, T., Shang, J., and Zhao, D. F.: The roles of heterogeneous chemical processes in the formation of an air pollution complex and gray haze, Science China Chemistry, 54, 145–153, 2011.