the Creative Commons Attribution 3.0 License.
the Creative Commons Attribution 3.0 License.
Long-term series and trends in surface solar radiation in Athens, Greece
Dimitra Founda
Basil E. Psiloglou
Harry Kambezidis
Nickolaos Mihalopoulos
Arturo Sanchez-Lorenzo
Charikleia Meleti
Panagiotis I. Raptis
Fragiskos Pierros
Pierre Nabat
We present a long-term series of surface solar radiation (SSR) from the city of Athens, Greece. SSR measurements were performed from 1954 to 2012, and before that (1900–1953) sunshine duration (SD) records were used in order to reconstruct monthly SSR. Analysis of the whole data set (1900–2012) mainly showed very small (0.02 %) changes in SSR from 1900 to 1953, including a maximum decrease of −2.9 % decade−1 in SSR during the 1910 to 1940 period, assuming a linear change. For the dimming period 1955–1980, −2 % decade−1 was observed that matches various European long-term SSR-measurement-related studies. This percentage in Athens is in the lower limit, compared to other studies in the Mediterranean area. For the brightening period 1980–2012 we calculated +1.5 % decade−1, which is also in the lower limit of the reported positive changes in SSR around Europe. Comparing the 30-year periods 1954–1983 and 1983–2012, we found a difference of 4.5 %. However, measurements of the first 30-year period are associated with higher uncertainties than those of the second period, especially when looking at year-to-year changes. The difference between the two periods was observed for all seasons except winter. Analyzing SSR calculations of all-sky and clear-sky (cloudless) conditions/days, we report that most of the observed changes in SSR after 1954 can be attributed partly to cloudiness and mostly to aerosol load changes.
- Article
(3523 KB) - Full-text XML
- BibTeX
- EndNote


In recent decades surface solar radiation (SSR) and the transmission of the atmosphere have been of increasing interest because of the related impacts on climate. Most of the energy in the Earth–atmosphere system is introduced by solar radiation. It provides heating, which creates pressure gradients and ultimately wind and triggers water, carbon and oxygen cycles through evaporation and photosynthesis. These processes define the climatological conditions, and changes of incoming solar radiation rapidly affect the energy balance (Wild et al., 2015). Interest in solar radiation changes has also been raised after the development of solar energy applications, which are continuously growing in number over the recent years. Changes in SSR have been recorded over the last century and can be caused either by natural events such as volcanic eruptions or human-related activities, mainly in polluted regions (Wild, 2016). On longer scales (thousands of years) changes in SSR may be caused by changes in the Earth's orbit and Sun solar output (Lean, 1997; Ohmura, 2006).
Systematic continuous measurements of SSR were established in the middle of the 20th century at selected meteorological observatories. Solar variations have been investigated in several studies using ground-based SSR measurements from various monitoring networks worldwide (e.g., Ohmura, 2009) and also by satellite-derived estimations (e.g., Kambezidis et al., 2010). Overall, most of these studies (Gilgen et al., 1998; Noris and Wild, 2009; Wild, 2009 and 2016; and references therein) have reported a worldwide decrease of solar incoming radiation in the period 1960–1985 (known as dimming period), followed by an increase (brightening period). These changes were reported to be higher in more polluted and urban areas but have also been recorded in isolated regions such as the Arctic (Stanhill, 1995) and Antarctica (Stanhill and Cohen, 1997). Other recent studies have investigated the effect of urbanization on global brightening and dimming, and found no marked differences among urban and rural SSR time series (Tanaka et al., 2016) and Imamovic et al. (2016). Changes in atmospheric transmission due to variations in cloudiness and aerosol concentration are the main factors to investigate in order to determine the possible causes of such trends in SSR (Wild, 2009). However, due to the aerosol–cloud interactions and the aerosol indirect effect on SSR, the two factors (clouds and aerosols) are not completely mutually exclusive in explaining SSR changes.
The cloud and aerosol radiative effects on solar radiation variations over the past decades have been investigated in numerous studies in recent years. The interannual variations in cloudiness is crucial for studying SSR time series, but its decadal variability is not always connected with the widespread dimming and brightening effects (Wang et al., 2012; Wild, 2016). Aerosols play a significant role in incoming radiation, by scattering and absorbing light and by acting as cloud-condensation nuclei. Over the 20-year dimming phase (from 1960 to 1980) and the 15-year brightening phase (from 1990 to 2005), aerosol effects (direct and indirect) were found to have played the most important role in SSR variation (Dudok de Wit et al., 2015). Concerning central Europe, Ruckstuhl et al. (2008) suggested that the brightening phase under cloud-free conditions is in line with decreasing anthropogenic aerosol emissions (Streets et al., 2006). Nabat et al. (2013), using a blending of remote sensing and model products, showed a decreasing aerosol optical depth (AOD) trend of 0.05 decade−1 in Europe for the period of their study (1979–2009). In addition, Nabat et al. (2014) reported that the anthropogenic aerosol decline in Europe from 1980 to 2012 statistically explains 81 ± 16 % of the observed brightening. Overall, changes in anthropogenic aerosol emissions are now considered to be the primary cause of brightening and dimming effects (Wild, 2016). The gaseous and particulate air pollutants may reduce solar radiation by up to 40 % during air pollution episodes (Jauregui and Luyando, 1999). Aerosol-related attenuation is much larger during forest fires, dust events and volcanic eruptions. Vautard et al. (2009) also reported a decline in the frequency of low-visibility conditions such as fog, mist and haze in Europe over the past 30 years, suggesting a significant contribution of air-quality improvements
Long-term series of SSR measurements are essential for such studies. One of the main constraints in studying SSR temporal changes is the small number of sites with reliable long-term records, even over areas with a relatively high density of stations such as Europe, Japan or the USA. In Europe for example, there are currently less than 80 stations with more than 40 years of homogeneous data (Sanchez-Lorenzo et al., 2015), with very few of them operating over southern Europe. Recently, a high-quality data set of SSR was set up over Italy (Manara et al., 2016), but there is still a lack of high-quality long-term trends in other countries around the Mediterranean Basin.
In addition, measurements taken before the 1950s were even more sporadic (Stanhill and Ahiman, 2017); the few studies of them have pointed out an SSR increase in the first decades of the 20th century and a maximum around 1950 (Ohmura, 2006, 2009). This topic is still controversial due to the few long-term series available (Antón et al., 2014). Recently, there have been efforts to reconstruct SSR series in periods with no direct measurements available, using other variables such as sunshine duration (SD), which is available in a large number of sites starting from the late 19th century (e.g., Stanhill and Cohen, 2005, for USA; Sanchez-Lorenzo and Wild, 2012, for Switzerland; Matuszko, 2014, for Poland). For example, Sanchez-Lorenzo and Wild (2012) used data from 17 stations in Switzerland, considered SD as a proxy and successfully reconstructed SSR time series beginning in the late 19th century. They calculated that the variability in SSR monthly anomalies can be explained by SD anomalies in the range of 76–96 %, and a monthly root mean squared error of 4.2 W m−2 between recorded and estimated SSR for all-sky conditions and of 5.5 W m−2 for clear-sky conditions. Other studies have tried to use pan evaporation as a proxy of SSR, for the first half of the 20th century (Stanhill and Möller, 2008). Kambezidis et al. (2016) used monthly re-analysis data sets from the Modern Era Retrospective-Analysis for Research and Applications (MERRA) and calculated shortwave radiation trends over the period 1979–2012 for the Mediterranean basin. They reported an increase in MERRA of +0.36 W m−2 decade−1, with higher rates over the western Mediterranean (+0.82 W m−2 decade−1).
A few studies discuss the brightening/dimming effect in the southeastern Mediterranean. Zerefos et al. (2009) studied the ultraviolet A (UVA) changes for the area of Thessaloniki (Greece) from 1984 to 2008. They calculated a positive trend of +5 % decade−1 linked to a negative trend in aerosol optical depth (AOD) for the area due to air pollution abatement strategies. The variability in shortwave downward solar irradiance received at Earth's surface over Thessaloniki, Greece, for the period 1993–2011 (Bais et al., 2013), showed an upward trend in SSR after 1990 (+0.33 % year−1). They also reported signs of a slowdown in the upward trend in SSR during the beginning of the 2000s. Founda et al. (2014) studied the SD long-term variability over the Athens area. They reported a −7 % decline in the annual SD over 1951–1982 and a 3 % increase over 1983–2011 under all-sky conditions. Under near-clear-sky conditions, these percentages are −7 % and +9 % for the dimming and brightening periods, respectively. Similarly, Founda et al. (2016) analyzed long-term SD and total cloud cover time series over 15 sites in Greece (the oldest one beginning in 1897). They showed an increase in SD at almost all stations since the mid-1980s, which in certain areas of southeastern Greece amounts to an increase of 20 h year−1. This increase is not accompanied with synchronous decrease in total cloud cover, possibly evidencing decreasing aerosol loads, despite the fact that their impact on SD should be lower than on SSR (Sanchez-Romero et al., 2014). Yildirim et al. (2013) analyzed 41 years of SD measurements in 36 stations in Turkey. They reported a decreasing trend (between 1970 to about 1990) at most of the stations. After 1990, they observed either zero trend variation or a reduction in the decreasing rate of SD at most of the locations. They concluded that the decreasing period might be attributed to human-induced air pollution. Founda et al. (2017) have investigated the visibility trends over the Athens area from 1931 to 2013. They reported a deterioration in the visibility up to 2004 and a slight recovery afterwards, negatively/positively correlated with relative humidity/wind speed and positively correlated with AOD from 2000 to 2013. Finally, Alexandri et al. (2017) studied the spatiotemporal variability in SSR over the eastern Mediterranean for the 1983–2013 period, using the Satellite Application Facility on Climate Monitoring Solar surfAce RAdiation Heliosat satellite-based product (SAF). They reported a positive (brightening) and statistically significant SSR trend at the 95 % confidence level (0.2±0.05 W m−2 year−1 or (0.1±0.02 % year−1) being almost the same over land and sea.
In this work, measurements of SSR, recorded over 60 years in the center of Athens, are presented. In addition, with the use of the SD measurements, which have been conducted in Athens since 1900, we were able to reconstruct the time series of SSR during the first half of the 20th century. These time series (1900–2012) are the oldest uninterrupted and high-quality SSR time series in the SE Mediterranean and one of the oldest in Europe, providing unique information about the variations and trends in the area for recent past decades. Time series of SSR over Athens are presented to try answering questions such as the following:
-
Are the dimming–brightening patterns observed in Europe over the past century also observed, to the same extent, over the eastern Mediterranean?
-
Is SSR variability during the first decades of the 20th century in Athens in line with the trends reported at other locations over this period?
-
Can we verify that anthropogenic aerosols play the most important role in the brightening/dimming observed SSR after 1950, in agreement with results from other European regions?
2.1 SSR data collection and analysis
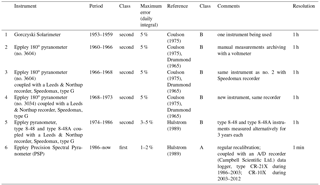
The SSR data used in this study cover the period from December 1953 to December 2012 and were measured by a series of pyranometers that are mentioned in Table 1. These instruments have operated continuously at the Actinometric Station of the National Observatory of Athens (ASNOA; Pnyx Hill, Thissio, Athens), which is located near the center of Athens, Greece (38.00∘ N, 23.73∘ E; 110 m above mean sea level). Table 1 presents the instruments and the period of operation, as well as the maximum error on the integrated daily values. References mentioned in Table 1 describe the exact type of errors and uncertainties related to the sensors. In the period 1953–1986, the maximum daily error was about 5 %, and 2 % afterwards. The spectral response of the sensors is in the range of 285–2800 nm; since 1986 a first-class Eppley PSP pyranometer (WMO, 1983) has been in operation at ASNOA. Since 1992, frequent calibration (every 2 years) has been performed by the NOA Laboratory of Meteorological Device Calibration (LMDC; Basil E. Psiloglou, personal communication, 2016) in order to ensure high-quality measurements. LMDC follows the standard calibration procedure for thermopile pyranometers (ISO 9847, 1992), with exposure to real sunlight conditions and comparison with a standard thermopile pyranometer (Secondary Standard). LMDC's reference pyranometer, a Kipp & Zonen CM21, is regularly calibrated in PMOD/WRC, Davos, Switzerland.
Table 1History of SSR instruments used at ASNOA. SSR measurements refer to the total solar radiation on a horizontal surface.
SSR data are processed using a set of quality-control (QC) tests in order to ensure the quality of the data set. The QC procedures include rejection of the following:
-
measurements for solar elevation angles less than 5∘;
-
SSR values equal to or less than 5 W m−2, during sunrise and sunset, due to the pyranometers' sensitivity;
-
SSR values greater than 120 % of the seasonally corrected solar constant.
After the initiation of diffuse horizontal radiation measurements at ASNOA in 1991, the following quality criteria were added for rejection:
-
diffuse horizontal values greater than the corresponding SSR ones;
-
diffuse horizontal values greater than 80 % of the seasonally correct solar constant;
-
direct-beam solar component exceeding the extraterrestrial solar irradiance.
Also, both total and diffuse horizontal measurements are corrected for the nighttime dark-signal offset of the pyranometers.
Mean daily SSR values were calculated from the data set of this study (December 1953–December 2012); only months with more than 20 days of measurements were considered in the analysis. During the 60 years of measurements, only three months (January and February 1998 and March 2012) did not fulfill these criteria.
When trying to use such long-term series, it is evident that the data quality differs as instrument performance has improved, quality-assurance and quality-control procedures have been standardized and finally the information flow on the day-to-day instrument performance issues is much more complete at the present. At ASNOA (after 1986 only) the instruments were calibrated or checked with a reference instrument on a yearly basis to identify changes in the calibration and drifts. As reported, the addition of diffuse irradiance measuring instruments also provided the opportunity to improve minute-based measurement quality. Before 1986, the instruments reported in Table 1 were used. According to the log books there has always been a certain overlap when changing from one instrument to another. Reports mention that there were instrument drifts that were corrected with no further information from 1953 to 1970. Instrument overlaps after 1986 were used to eliminate possible instrument-related offsets. However, instrument differences (e.g., thermal offset of PSP instrument compared with a model 8–48 pyranometer; Vignola et al., 2012) could theoretically have an effect on the order of 1–2 W m−2 on the series continuation. In this case the subtraction of the nighttime dark signal (more specifically, the mean of the previous and next night signal was subtracted for a specific day) reduces the problem by at least half. The remaining offset was not considered in our analysis, partly because it was tackled through the overlapping measurements/homogenization procedures. In addition, the inclusion of diffuse radiation in the quality-assurance tests after 1991 may be the cause of the major improvement in the newest data compared with the older ones. However, this recent improvement in quality control cannot be linked with a systematic impact on SSR measurements and changes compared to the past, other than higher uncertainty in the integrated (monthly, yearly) SSR values. For the 1953–1986 time series there are a number of publications that have used the SSR-NOA time series. In particular, Macris (1959) used the 1954–1956 SSR measurements to identify the relationship between SSR and sunshine duration. Katsoulis and Papachristopoulos (1978) used the SSR data from 1960 to 1976 in order to calculate SSR statistics for daily, seasonal and yearly solar radiation levels in Athens, Greece. Notaridou and Lalas (1978) used the 1954–1976 SSR data in order to verify an empirical formula on global net radiation over Greece. Flocas (1980) used the 1961–1975 SSR time series to compare them with sunshine duration data for the same period. Kouremenos et al. (1985) used the SSR data from 1955 to 1980 in order to correlate their changes with various atmospheric parameters. Zabara (1986) used the 1965–1980 time series to verify a monthly solar radiation calculation method. Katsoulis and Leontaris (1981) used the 1960–1977 data to verify tools describing the solar radiation distribution over Greece. Finally, the percentages of errors reported in Table 1 are not directly linked with possible instrument drifts that can impact the SSR time series analysis. Thus, results of measurements before 1986 have to be used with caution and accompanied by a report on the different level of uncertainties of the past and recent data.
Figure 1 shows the intra-annual variability of SSR at ASNOA based on the measurements from all instruments during the period 1953–2012. Daily SSR in Athens ranges between approximately 6 and 27 MJ m−2 during the year. Mean and standard deviations were calculated using the 60-year record for each day.
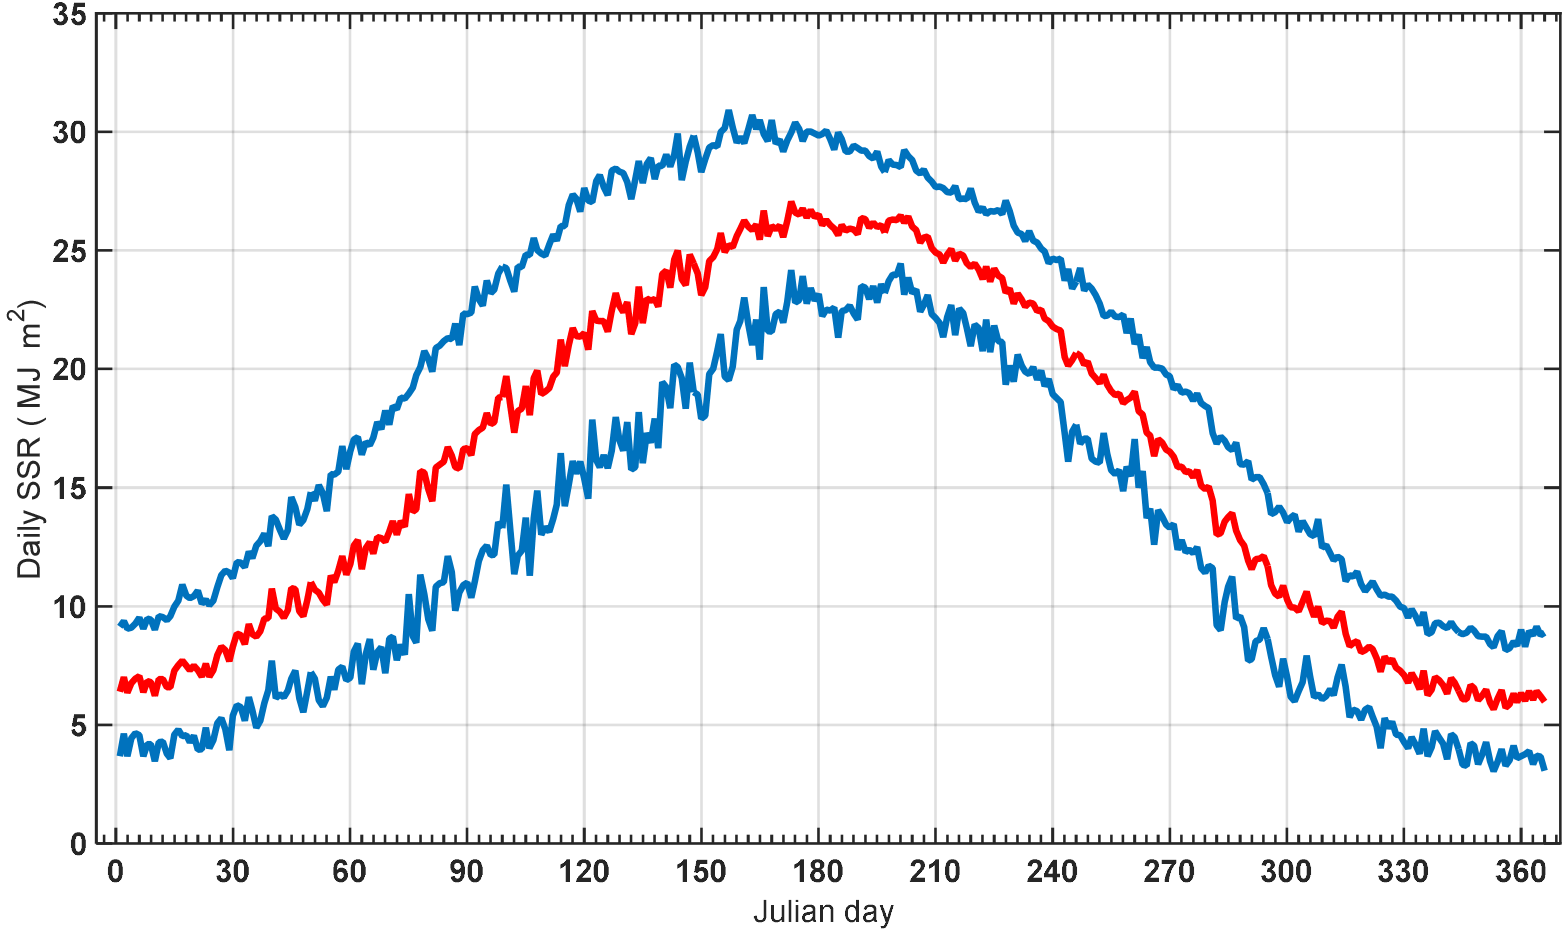
Figure 1Average intra-annual variability of surface solar radiation (SSR) at the Actinometric Station of the National Observatory of Athens (red), along with the interannual variability for a given day (±1 standard deviation, blue), calculated over the period 1953–2012.
The results of Fig. 1 show the average yearly pattern of SSR at ASNOA. The day-to-day variability that is shown as “noise” in the plotted blue line comes from the 60-year averaging of each day and is mostly related with the amount of cloudiness for each of the averaged days. Minimum and maximum SSR at solstices, compared to a cloudless sky aerosol-free model, is also related with the highest probability of the presence of clouds during winter months. For the calculation of each of the daily averages the available data points vary from 55 to the possible maximum of 60.
Concerning the data availability for SSR and SD data, SSR monthly means calculated here were retrieved from daily calculated SSR. Over the 59 years (708 months) of SSR data, 98 % of the months had 0 or 1 days missing, 3 months had 10–20 missing days and 2 months 20–30 missing days. For SD, the 1931–1940 monthly data used were taken from the NOA measurement annals. From 1940 on, hourly measurements were used in order to derive daily and monthly measurements. The SD time series have no gaps with only 6 missing days, during December 1944 (Founda et al., 2014).
2.2 Sunshine duration data
In addition, collocated measurements of SD recorded at ASNOA were used. According to WMO (2010), the SD during a given period is defined as the sum of the sub-periods for which the direct solar irradiance exceeds 120 W m−2. In Athens, SD was recorded using classical Campbell–Stokes heliographs (starting in 1894) and was replaced by electronic instrumentation in 1998 (EKO, MS-091 analog SD sensor). Monthly SD values starting from January 1900 were used in this study. A more analytical study of these time series can be found in Founda et al. (2014).
Complementary to this study, cloud-cover observations from the Hellenic National Meteorological Service (HNMS) from 1954 through the present are also used. These observations are recorded at a site 7 km away from ASNOA. All cloud observations at HNMS are conducted every 3 h and are expressed in octas.
2.3 Aerosol optical depth (AOD)
In order to examine the AOD impact on SSR, we used the longest satellite-based AOD series available for the area. This is the AOD time series from Advanced Very High Resolution Radiometer (AVHRR). AOD retrievals at 630 nm over global oceans at spatial resolution of and one overpass per day were used. Aerosol optical thickness data were downloaded from NOAA Climate Data Record (CDR) version 2 (Zho and Chan, 2014) and cover the period from August 1981 to December 2009. AVHRR AOD embodies a large variety of uncertainties, including radiance calibration, systematic changes in single scattering albedo and ocean reflectance (Mishchenko et al., 2007). Current data set radiances have been recalibrated using more accurate MODIS data (Chan et al., 2013). We used daily data from the region around Athens (37.5–38.2∘ N, 23.2–24.4∘ E), which includes 50 active available (ocean) grid points. The above region was selected based on data availability on each grid, within 50 km from ASNOA.
To complement the analysis on the evolution of aerosols, the recent climatology developed by Nabat et al. (2013) was considered over the period 1979–2012. This product provides monthly averages of AOD at 550 nm over the Mediterranean region at 50 km resolution. It is based on a combination of satellite-derived (MODIS instrument) and model-simulated products (MACC reanalysis and RegCM-4 simulations), which have been selected from among many available data sets, from an evaluation against ground-based measurements of the AERONET network. Thus this climatology is able to give the best possible atmospheric aerosol content over the period 1979–2012. For the present work, the AOD time series over the grid cell of the ASNOA (38.00∘ N, 23.73∘ E) was extracted and is referred to as the ChArMEx data.
2.4 Clear-sky SSR
For the determination of the clear-sky (defined here as the cloudless) days, we used both the cloud octas and SD data. Daily observations were used for this analysis. We defined a clear-sky day as one that fulfills the following criteria:
-
the mean daily cloudiness (in octas) should be less than 1.5;
-
the total daily SD should be higher than 90 % of its theoretical (astronomical) value.
The procedure for calculating a single mean cloud octa value for each day was the following: we first excluded nighttime cloud observations, and then we weighted each observation based on the hour of the observation. Weights were calculated based on the solar radiation contribution of the specific time slot and day of the month, compared with the daily clear-sky SSR integral of the particular day and month.
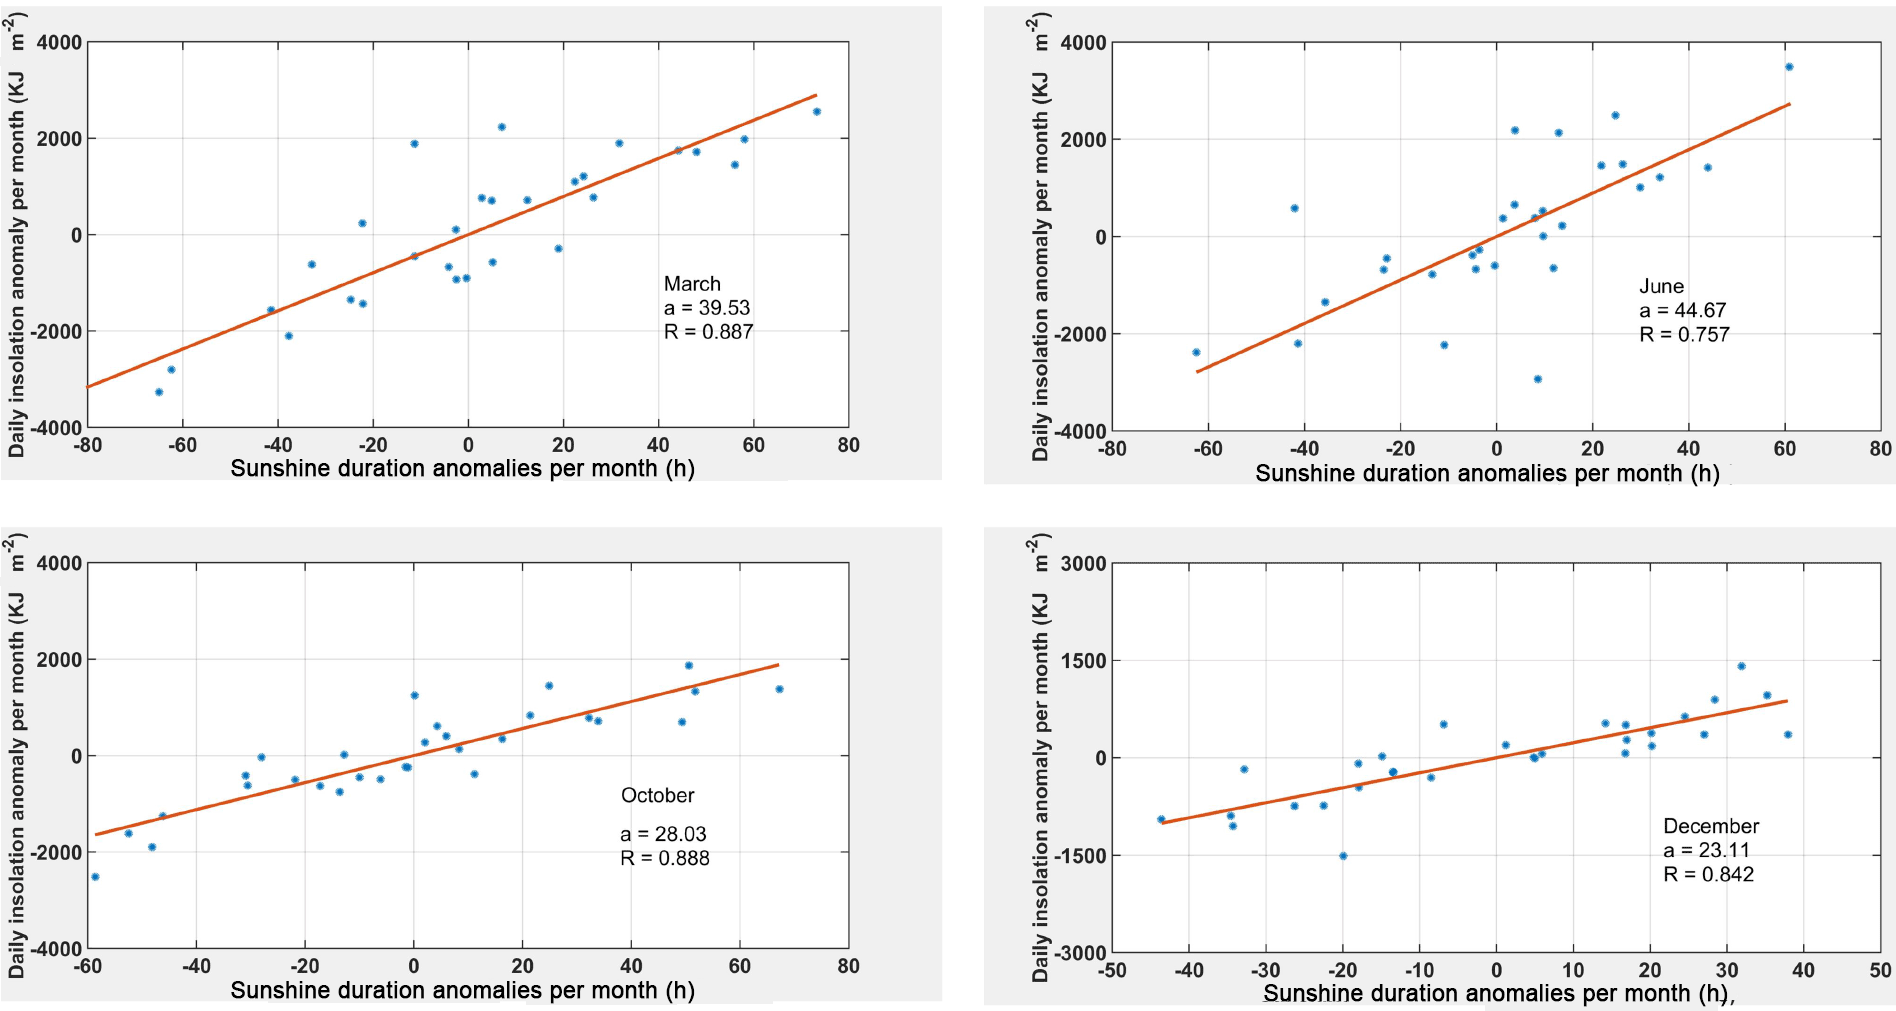
Figure 2Linear regression of SSR and SD anomalies for March, June, October and December 1983–2012.
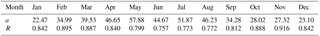
Table 2Monthly regression statistics of SSR vs. SD anomalies (see Eq. 1).
2.5 Reconstruction of SSR from SD
We used the 1900–2012 SD time series in order to extend our SSR time series back to 1900.
There are different methods that are used in order to estimate SSR values from SD. In this work we have tried two methods based on the linear regression between SSR and SD (Sanchez-Lorenzo and Wild, 2012). For all-sky conditions the monthly anomalies of SSR and SD, obtained as differences from the 1983–2012 mean, were calculated. Then for each month a linear regression was used to estimate the relationship between the SSR and the SD:
Figure 2 shows 4 out of the total 12 regressions together with their statistics.
The correlation coefficients (R) vary from 0.75 to 0.91. This implies that the SD monthly anomalies explain between 56 and 83 % of the variability of the SSR monthly anomalies. It should be noted that coefficient b is less than 10−3 for all months.
The second method to derive a relationship between SD and SSR is based on the broadly accepted formula of Ångström (1924):
where SSRmax and SDmax refer to the theoretical extra-terrestrial value of SSR and the astronomical value of SD, respectively, while c and d are constants usually defined monthly. This formula can only be used in large data sets as a statistical approach. That is because for different cloud heights, thicknesses and positioning, the constants can show large variability (Angell, 1990). The 1983–2012 period was chosen for determining the SSR vs. SD relationship as SSR measurements have lower uncertainties compared with the 1953–2012 period. We thus calculated c=0.237 and d=0.458 and an R2 equal to 0.81.
We also followed the same procedure to calculate the coefficients of the Ångström formula separately for each month and for each season during the control period 1983–2012. For individual months, calculated SSR∕SSRmax vs. SDU∕SDUmax coefficients of determination ranged from 0.5 to 0.65 for winter months, 0.32 to 0.67 for spring months, 0.47 to 0.53 for autumn months and 0.1 to 0.38 for summer months. Thus, coefficients of determination using the monthly based data were much lower than the first method reported. The low coefficients for the summer period are related with the small range of values of SDU∕SDUmax and SSR∕SSRmax that are related with the absence of clouds.
We used both the monthly regression coefficients from the first method and the yearly based Ångström formulas in order to investigate the impact of the different methods on the SSR reconstruction. Results of the reconstructed SSR yearly values from 1900 to 1953 showed maximum differences of 1 % in the calculated SSR percent anomalies, while for monthly values the higher difference was 2 %. In order to avoid the use of theoretical normalization values such as SDUmax and SSRmax needed for the second method, we reconstructed the SSR time series based on the monthly based results of the first method as proposed in Sanchez-Lorenzo and Wild (2012).
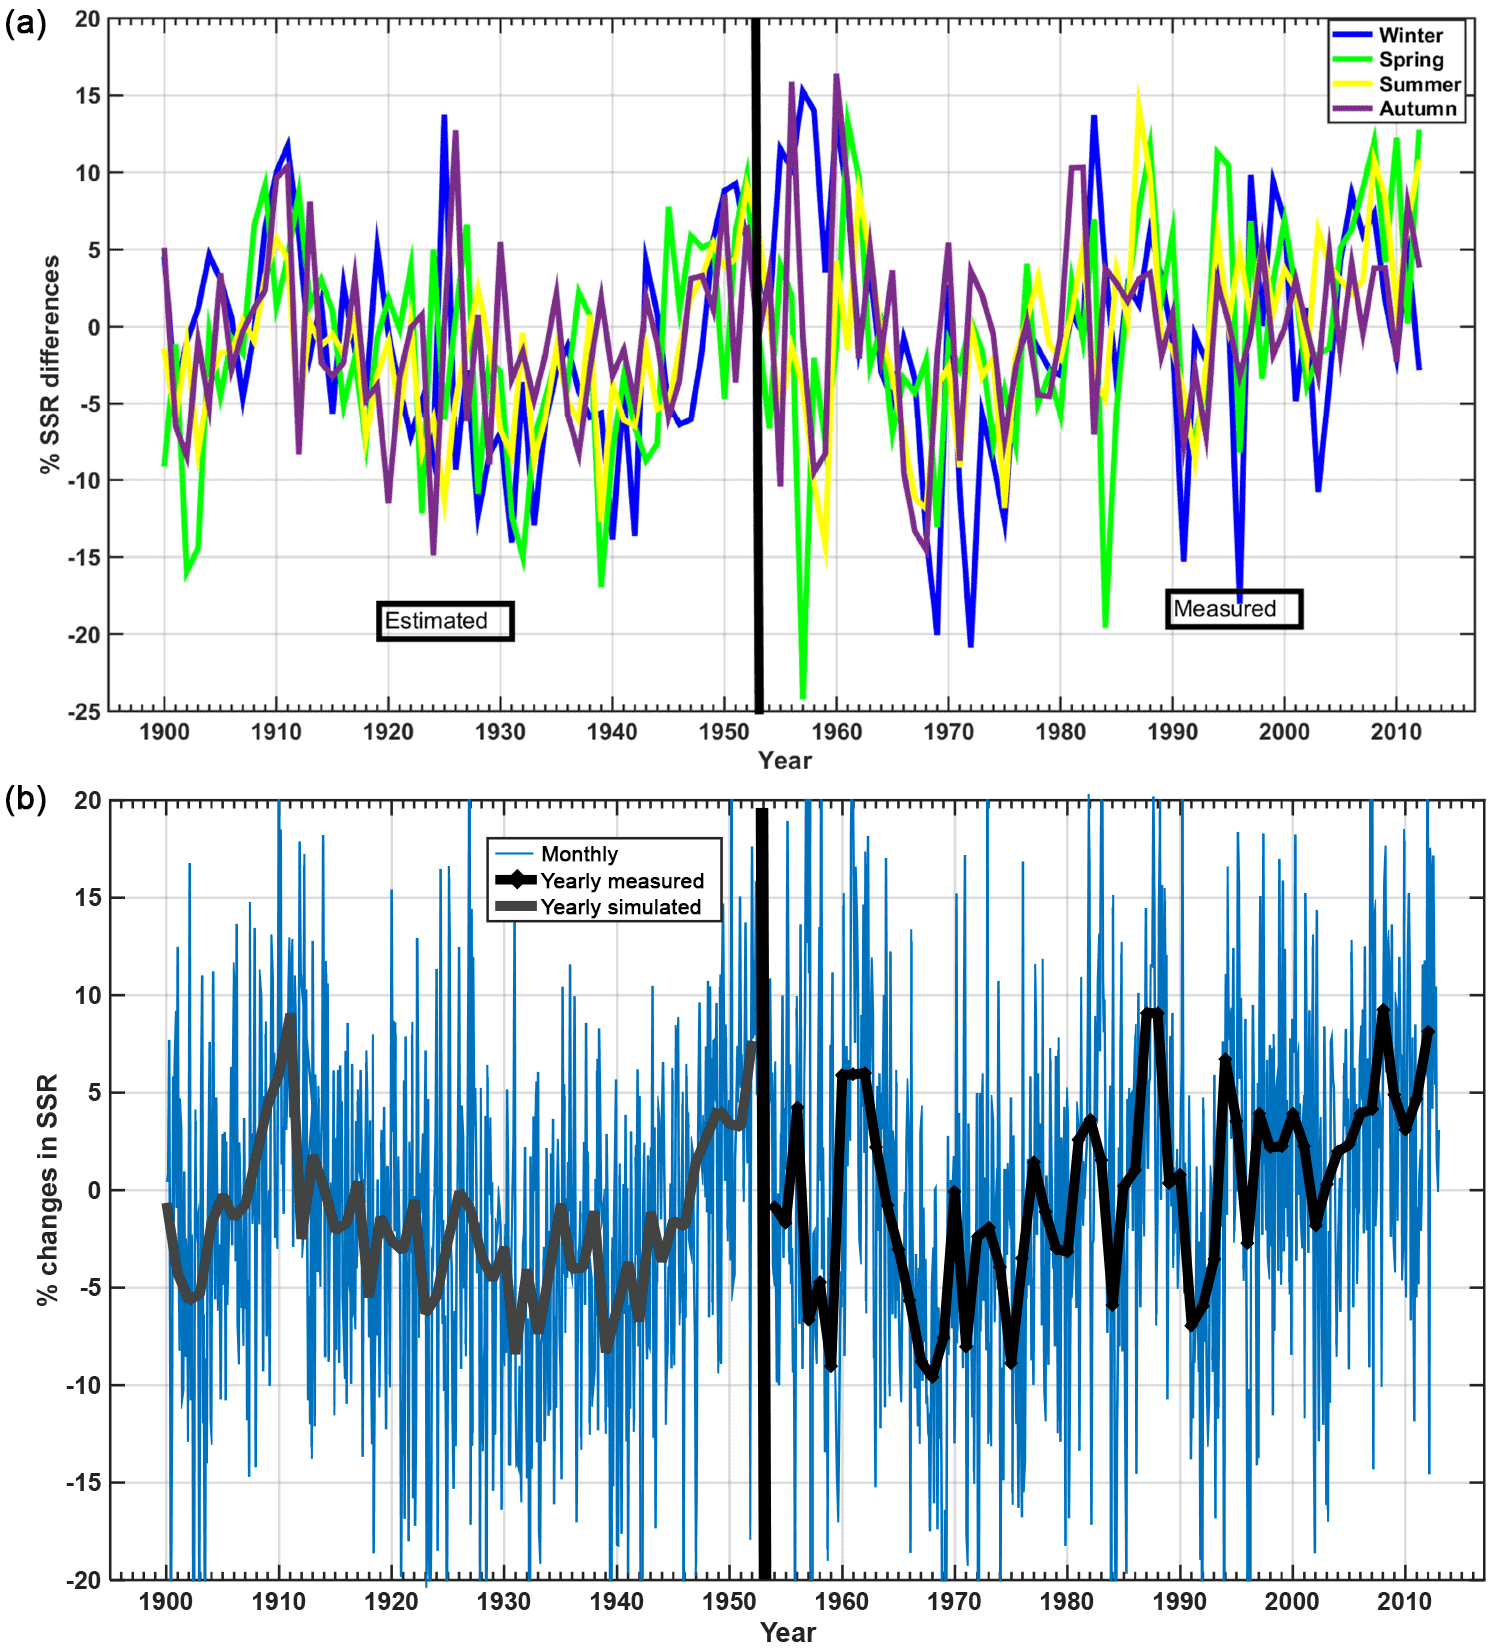
Figure 3Full time series of de-seasonalized SSR percent changes (using the 1900–2012 monthly averages). (a) Different colors represent seasonal analysis; (b) the black bold line represents the annual series and light blue line the mean monthly values.
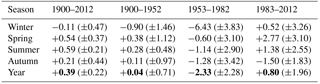
Table 3Annual and seasonal SSR trends in percent per decade over the period 1900–2012 and different sub-periods. Percentages in parentheses show the limits of the 95 % confidence bounds and in bold the yearly trends.
3.1 Long-term variations and trends (1900–2012)
Based on methods described in Sect. 2, we reconstructed monthly SSR from 1900 to 1953. Using the full data set of reconstructed (1900–1953) and measured SSR (1954–2012) we calculated the mean monthly SSR values and used them for de-seasonalizing the results shown in Fig. 3. The de-seasonalizing was determined by the following two steps: (1) calculating the average SSR (SSRmi) for each month (i) out of the 12 months of the given year, for all years between 1983 and 2012 and (2) calculating the changes in percent in SSR (SSR% (i, y)) for each month (i) of each year (y) as follows:
According to Fig. 3, the month-to-month variation (shown with light grey line) can reach more than 30 % in comparison with the mean monthly average of the whole data set. Annual means show a 10–12 % (peak to peak) decrease in SSR from 1910 to late 1930s and then an increase of +12 % from 1940 to early 1950s. The simulated SSR results follow the observed decline of SD reported in Founda et al. (2014), where a decrease from 1910 to 1940s is shown.
Subsequently, there is a decrease during the late 1950s and then a positive change on the order of +20 % through the present with an episode in the early 1990s that shows low SSR values. Measured SSR in the 1991–1993 period differs by 5 % compared with the one in 1990. The SSR values for 1993 can be linked with the Pinatubo volcanic eruption and its known effect in the SSR (e.g., Zerefos et al., 2012).
Analytical linear trends of each of the sub-periods and for every season are presented in Table 3. It should be noted that the trend determination and its statistical significance do not take into account measurement- or SSR-reconstruction-related uncertainties, which are different for different periods.
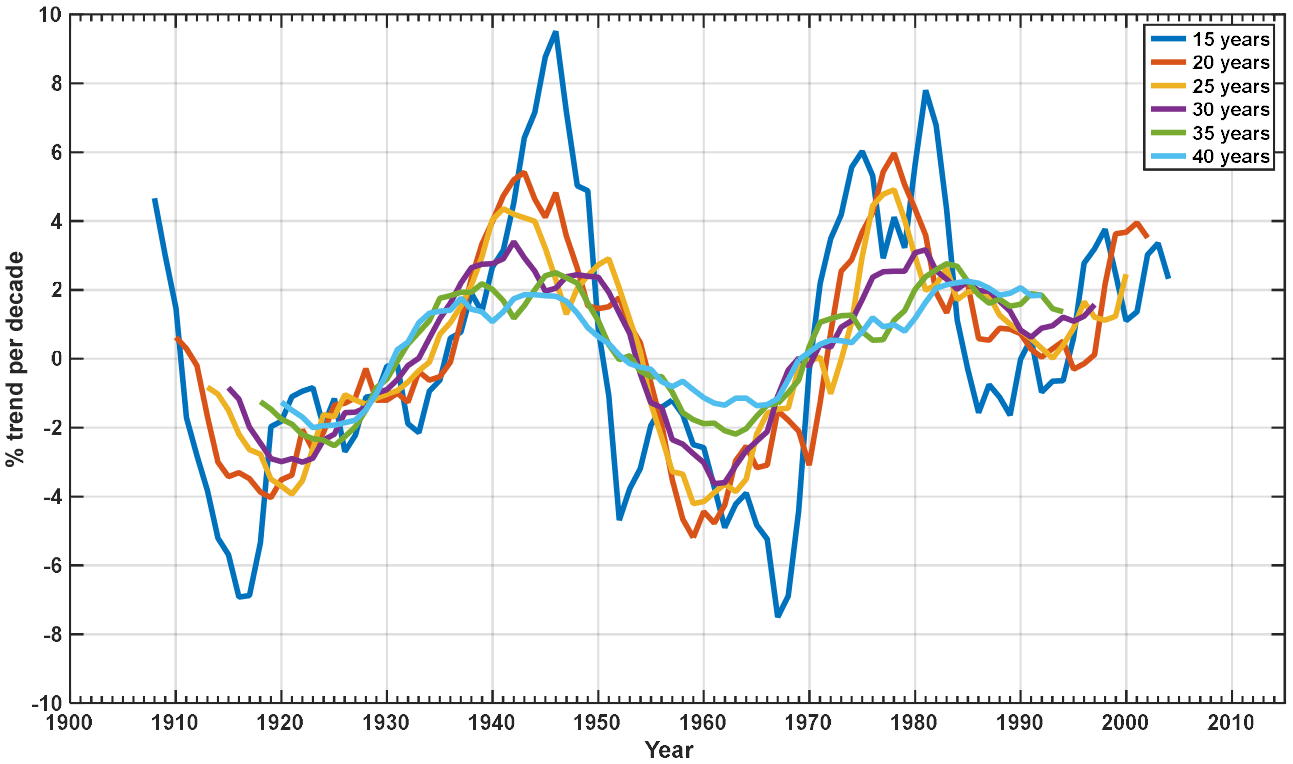
Figure 4Trends in SSR (% decade−1) calculated for different sliding time windows. The value of the trend was calculated at the central year of each time window.
Looking at the 1900–2012 period the seasonal and annual linear trends in SSR are less than 1 % decade−1. A positive change of +0.39 % decade−1 was calculated from annual values. For the whole data set, all seasons show positive trends, except winter. For the periods with simulated SSR values (1900–1952), even smaller trends were detected for spring and summer. The measuring period of 1954–2012 was split into two sub-periods of 1954–1982 and 1983–2012. The first sub-period shows a negative annual change of −2.33 % decade−1 in SSR, which is also reflected in all seasons with predominant changes during winter (−6.43 % decade−1). The second sub-period shows a positive trend of +0.80 % decade−1 with the highest ones in spring (+2.77 % decade−1) and summer (+1.38 % decade−1) and negative in autumn (−1.50 % decade−1). Looking at the trend significance described by the 95 % confidence bounds, we can see significant positive trends for 1900–2012 (yearly, summer and spring) and significant negative trends for yearly analysis and winter of 1953–1982.
In order to have a better understanding of the SSR changes over the 113-year period (1900–2012), we calculated the decadal SSR trends for different time windows (15 to 40 years). Figure 4 shows the results of this analysis.
There is a decrease in SSR in the first 2 decades of the 20th century, in line with other long-term SD series as recently shown by Stanhill and Ahiman (2016). Then, in all calculations an increase is shown from mid-1930s to late 1940s, in line with the early brightening effect pointed out by other authors (Ohmura, 2009; Sanchez-Lorenzo et al., 2008). It should be reminded that this period is based on estimations of SSR from SD measurements, which thus include additional uncertainties. Nevertheless, early dimming and brightening periods were reported in Stanhill and Ahiman (2016). The results can be partly supported by trends in anthropogenic black carbon (McConnell et al., 2007; Lamarque et al., 2010) and biomass-burning (Lamarque et al., 2010) emissions in Europe. The dimming period from 1950s to 1970s can be observed in all time windows with a brightening effect after late 1970s.
The 40- and 30-year time windows in the analysis presented in Fig. 5 show the maximum rate of increase in the early 1940s (resulting in an increase of +2 and +3 % decade−1, respectively). Then a maximum rate of decrease is observed in early to middle 1960s, followed by a positive rate of increase after 1990s. Shorter time windows (15 years) are also interesting as they are able to capture the Pinatubo effect in early 1990s.
3.2 Variations and trends in SSR for the 1954–2012 measurement period
In order to further analyze the whole 59-year SSR data set of this study, we divided it into two 30-year climatological sub-periods: 1954–1983 and 1983–2012 (the common year is to allow for equal durations for both periods). Investigating a possible seasonal dependence, the relative difference in SSR for every month from its mean monthly value over the whole measurement (1954–2012) period was calculated.
Figure 5 shows the mean daily insolation for each month for the two sub-periods and the whole 59-year period. Examining the monthly average differences between the two periods, we observe that for spring and summer months these are on the order of 6 %. In addition, for all months SSR differences of the 1983–2012 period compared to the 1954–1983 period are positive with an exception of November (−1.9 %) and December (−1.2 %). In general, the second measurement period shows a 3 to 8 % larger monthly SSR than the first measurement period.

Figure 5Intra-annual variability of monthly mean daily SSR over the sub-periods of 1954–1983 (blue line) and 1983–2012 (red line) and the entire period of 1954–2012 (black line). The green line (right axis) represents the monthly relative difference between the two 30-year sub-periods (recent minus older period).
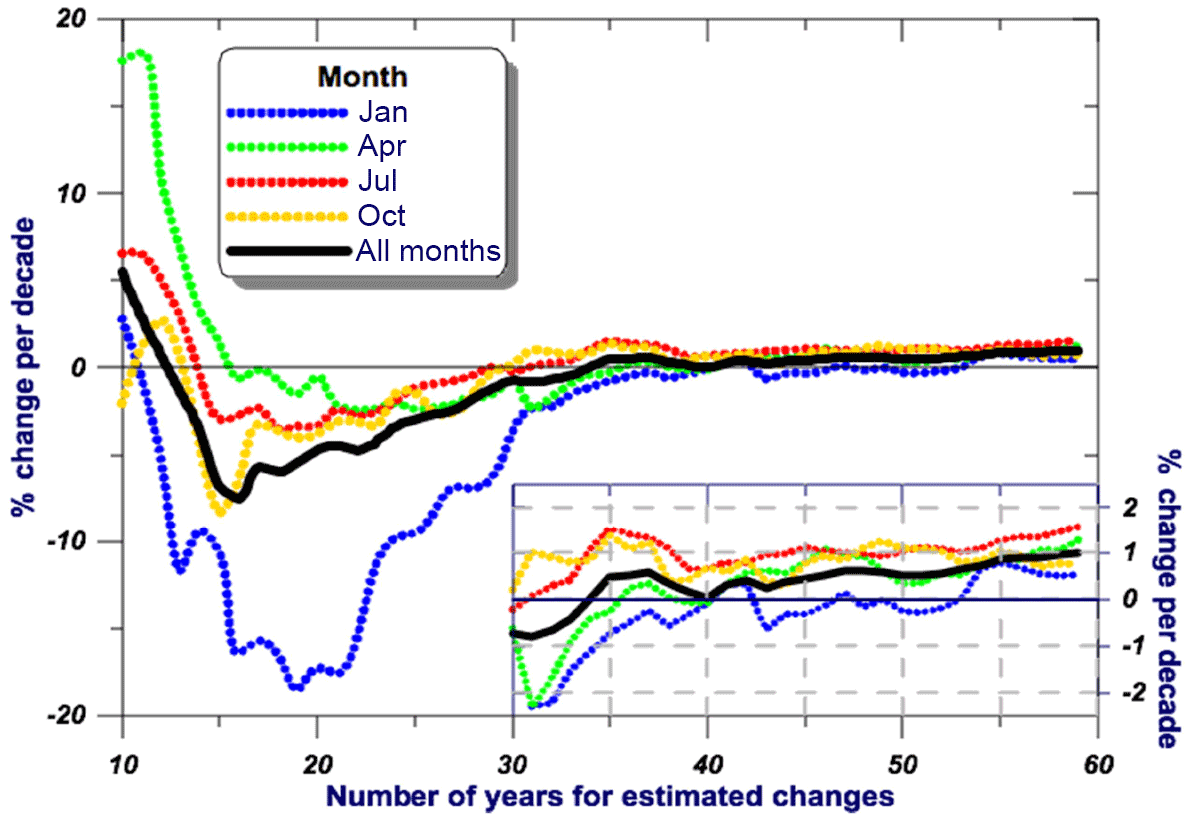
Figure 6Percent change per decade for different timescales and different months using 1954 as the starting year (the last 30-year period is magnified with changes presented as percent per decade).
Figure 6 shows the SSR change per decade for the months of January, April, July and October as well as the yearly average (all months). The figure shows a trend analysis for the entire data set with time windows from 10 to 59 years, where each time window starts from 1953. For all months SSR changes become positive for time windows of 35 years and greater (1953–1988 time window and any larger window starting from 1953). Negative trends calculated from 1954 to any given year up to 1989 are mainly due to the large negative changes during the winter period. In particular, during the 1954–1974 period, winter SSR changes show an −18 % decade−1 decrease. Linear trends in SSR from 1954 to 2012 showed a positive trend on the order of +1 % decade−1, while individual months vary from +0.5 to +1.5 % decade−1. Mostly positive trends can be detected using any time window centered after 1975. Larger trends are calculated for time windows centered at 1975 to 1980 and after 2000 (on the order of 5 % decade−1 using the 15-year time window). For the period 1954 to 1970 mainly negative trends are shown.
We used the 59-year data set (1954–2012) in order to quantify the factors controlling the SSR variations in Athens, Greece, focusing mainly on two known dominant factors, clouds and aerosol load.
4.1 The role of clouds
Figure 7 shows the 1954–2012 time series of yearly anomalies based on daily SSR, together with yearly total cloud coverage in weighted octas. The yearly de-seasonalized SSR values for all-sky conditions show a drop of ∼14 % from 1960 to 1970 and then a continuous increase excluding the Pinatubo period in the early 1990s. The most pronounced positive changes can be seen during the last 15 years with a change on the order of about 15 %.

Figure 7De-seasonalized yearly percent deviations from mean for SSR (black line) and cloud octas. Grey lines show measurements with possible uncertainties/drifts.
Going back to the measurement uncertainties for the 1954–1983 period where a number of instruments were used in order to build the presented time series; we tried to investigate possible instrument drifts and their effect on the calculated long-term trends. In order to try to indirectly tackle this issue, we included a shaded area in Fig. 7 representing a possible (one-directional) “uncertainty” based on reconstructing the 1954–1983 series using the 1984–2012 measured SSR data and the sunshine duration data for 1954–1983. The reconstruction was performed in the same way as the 1900–1953 one. The one-directional “uncertainty” points out possible drifts and instrument-exchange-related uncertainties. However, that does not mean that we believe the series reconstructed through sunshine duration in 1954–1983 more than the actual SSR measurements. If this was the case, we would have presented a 1983–2012 high-quality measuring period and a 1900–1983 reconstructed period. There have been various such papers published quite recently using small measuring periods compared with the reconstructed ones: Garcia et al. (2014) using 1992–2013 measurements reconstructed back to 1933 and Anton et al. (2017) using the 1887–1950 period with radiative transfer modeling. In our case we tried to use, and not reconstruct, the historical SSR measurements of NOA during the 1954–1983 period.
Using the 1984–2012 measurements and the 1900–1983 reconstruction data set we recalculated all trends presented in Fig. 4 and Table 2. Differences for the 15-year window differences on the calculated trends outside the 1954–1983 period are less than 1 %, with maximum differences in the late 1960s 1–3 %. For the 30-year window maximum differences are on the order of 1–2 %, while for the 40-year window, maximum differences are less than 1 %.
This particular exercise cannot be defined as an uncertainty assessment on the 1954–1983 measurements, as reconstructed data cannot be used as a reference. Moreover, SSR is much more sensitive than SD to aerosol optical depth change. Thus, in locations where the number of cloudless days is relatively high, SD reconstruction tends to “smooth” the SSR variability; however, the opposite can be said in cases with constant cloudiness.
Figure 8 shows the correlation between annual mean SSR and cloud cover. From the best-fit linear regression line it is deduced that a −1.54 MJ m−2 (or −9.6 %) change in mean daily insolation accounts for a change of 1 octa in cloud cover.
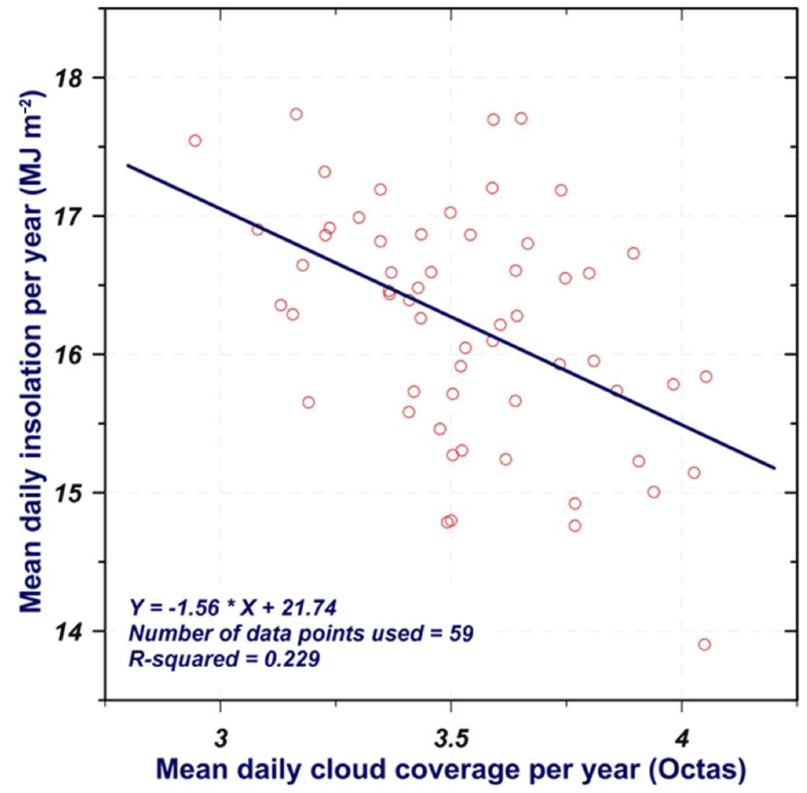
Figure 8Correlation between annual means of daily insolation and cloud cover over the period 1954–2012. The straight line represents the best-fit regression line to the data points. The year 1953 has not been included in the analysis since it does not include measurements for all months.
However, the great scatter of the data points and the low correlation of the two parameters in Fig. 8 (R2=0.229) indicate that the cloud cover can only partly explain the changes in SSR. In addition, there is no significant change in cloudiness over the 59-year period for Athens, Greece. Calculating linear changes of cloudiness from data shown in Fig. 8 results in a non-significant change of −0.4 % decade−1 which, in practice, has a limited effect on SSR changes during the examined period.
Nevertheless, it is worth mentioning that different cloud properties like cloud optical thickness and cloud phase, not described by the measurements of cloud cover, can influence SSR.
4.2 Clear-sky records
In order to minimize the cloud influence and investigate the possible role of direct aerosol effects on Athens SSR series, we had to select clear-sky (or cloudless) days. We used daily SSR measurements from 1954 to 2012 and separated the cloudless days according to the criteria mentioned in Sect. 2.2.
For considering the SSR seasonality, we calculated a fifth-degree polynomial derived from the maximum daily SSR (for all years of the data set), as a function of the day of the year (Fig. 9). Afterwards we calculated the ratio of the daily SSR to the SSR calculated by this function. Seasonal and yearly means of this ratio were estimated and used to describe cloudless-sky SSR percentage changes on a seasonal and yearly basis. This approach was chosen since averaging a random set of cloudless days, within each month during the 59-year period, could cause solar-elevation-related (due to the change of maximum solar elevation within each month) discrepancies, when calculating the monthly average SSR. We emphasize that the clear-sky selection criterion could possibly eliminate a few cases with very high aerosol optical depth.
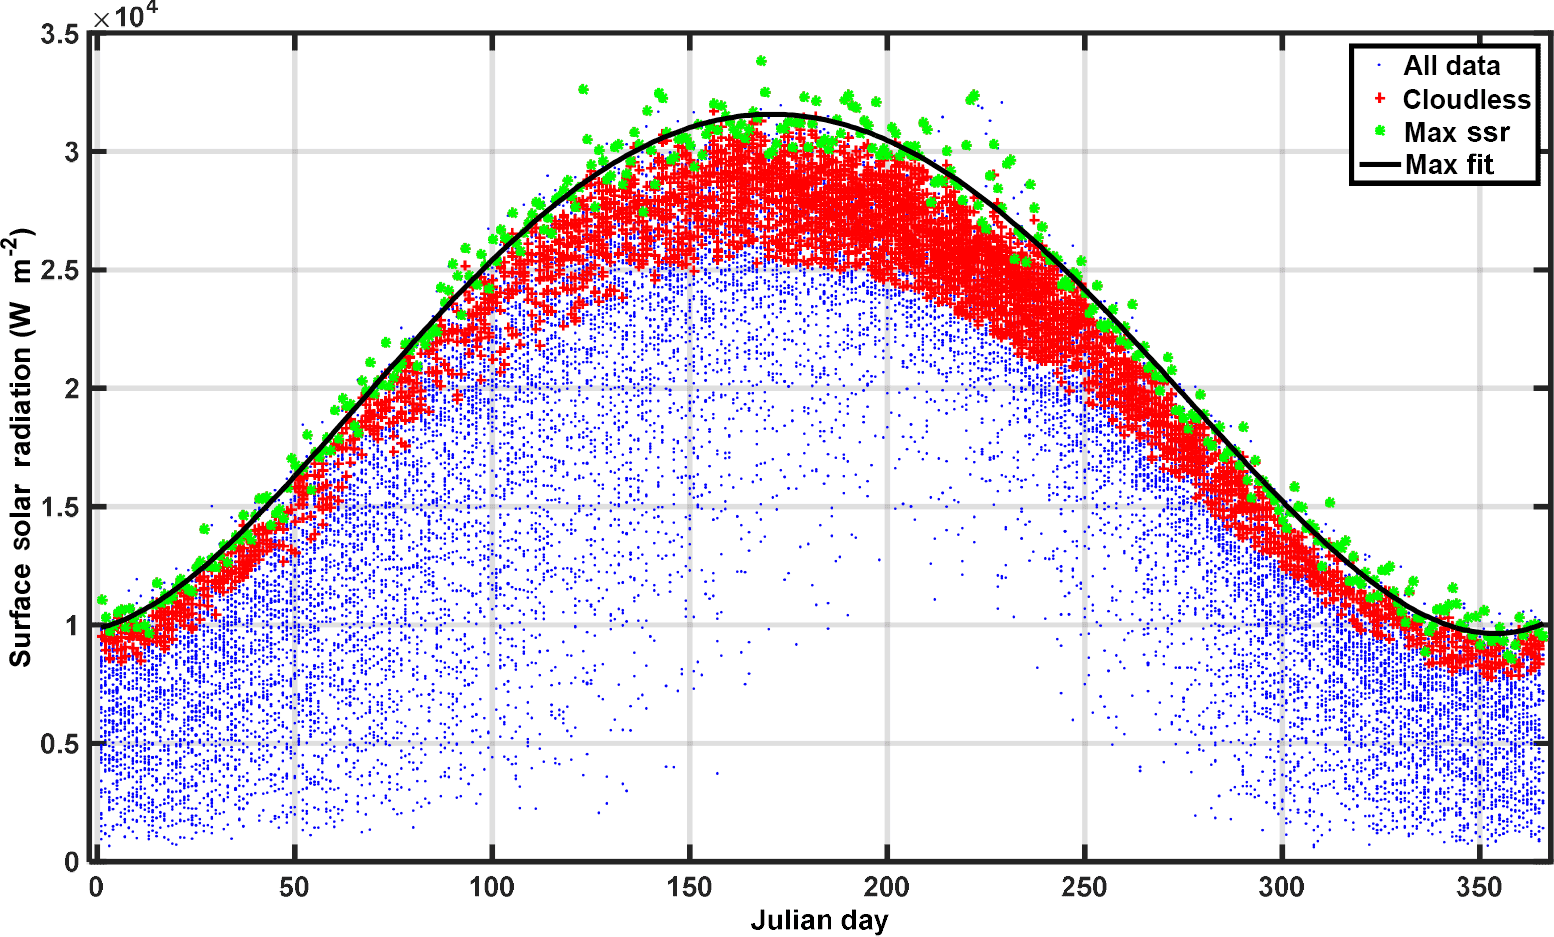
Figure 9Clear-sky SSR measurements (red dots) and all-sky SSR measurements (blue dots) derived with the cloud octa (cloudiness <1.5) and sunshine-duration-related criteria (SD >0.9). The black line represents the polynomial fit to the daily SSRmax values.
Seasonal and yearly averages of SSR were calculated using clear-sky conditions. Seasonal SSR was introduced instead of monthly SSR in order to improve the averaging SSR-related statistics, since the average number of cloudless days (per year) can be relatively low especially during the winter months. For all cases the ratios of the mean daily cloudless SSR to the SSRmax derived from the daily best-fit curve in Fig. 9 were calculated, and deviations of this ratio from its 59-year mean were calculated for each year.
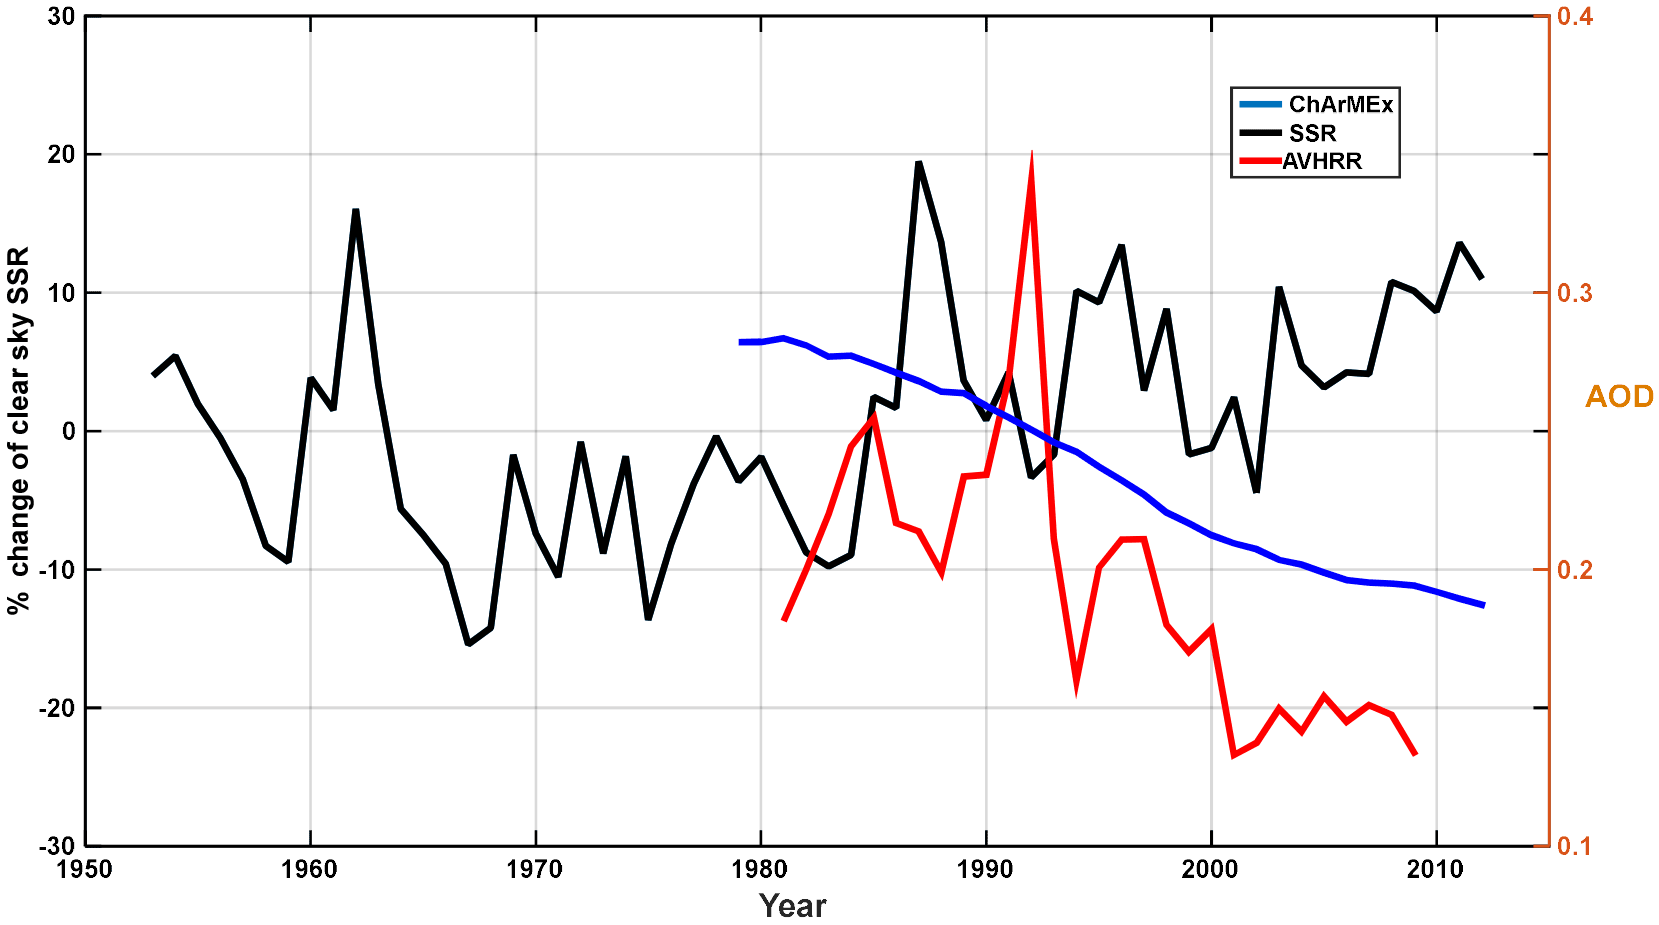
Figure 10Changes in yearly mean SSR to relative to the 1954–2012 average for cloudless sky (in percent; black). AVHRR AOD series (red) and ChArMEx AOD climatology (blue; Nabat et al., 2013) for the Athens area is shown in the right axis.
Figure 10 shows that most of the SSR variation observed for the measuring period has to be explained by factors other than changes in cloudiness (see Fig. 7 for variations due to cloudiness). Different seasons with the exception of wintertime show similar patterns to the year-to-year variability. Individual seasonal calculated SSR variability does not exceed the SSR variability of all-sky data by more than ±5 %, with the exception of the winter season. Comparing clear-sky and all-sky yearly mean SSR, we find a high correlation (R2=0.71), which can be explained by a combination of aerosol changes driving the SSR changes and the number of clear-sky days during the year. There is a decrease of more than −15 % in the clear-sky SSR from the start of the series to the end of 1960s. A decline after 1983 could possibly be related with El Chichón volcanic eruption.
All-sky SSR measurements and AOD from AVHRR were used in order to find the AOD effect in all-sky data. For yearly AOD and SSR averages from 1981 to 2009, we calculated a correlation coefficient of −0.55 with a rate of SSR reduction per 0.1 units of AOD equal with −3.8 %. For monthly based comparisons, all months revealed a correlation coefficient of −0.2 with a rate of −1.5 % per 0.1 AOD with better results for summer and autumn months (−0.30, −2.2 % and 0.1 AOD; −0.30, −1.5 % and 0.1 AOD)
The Pinatubo-related drop of −6 % from the early 1990s to the mid-1993 can also be seen in both cloudless and all-sky data sets and also in the increase in AOD in the AVHRR data set (Fig. 10).
Since the ∼6 % drop from 1990 to 1991–1993 is shown for all seasons, we argue that it describes the effect of the eruption on SSR data for the Athens station. However, as shown in Fig. 7, cloudiness for 1991 is also high, while it is much lower for 1992 and 1993. Combined with the stratospheric AOD figure, it seems that the 1991 decrease is also related with cloud increase, while the 1992 and 1993 decrease is related with aerosol effects from Pinatubo.
Table 4Clear-sky and all-sky data trend comparison for the whole 1953–2012 period and the two 30-year sub-periods (% decade−1). Percentages in parentheses show the limits of the 95 % confidence bounds and in bold the yearly trends.
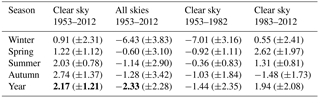
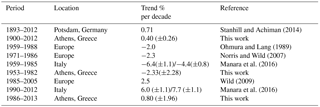
Table 5Summary of percent SSR changes per decade for various locations.
Concerning the stratospheric AOD in Athens the ChArMEx AOD data set revealed two main peaks of 0.12 for 1983 and 0.09 for 1992 due to El Chichón and Pinatubo eruptions, respectively, while stratospheric AOD after 1995 is lower than 0.01. These two peaks are possibly associated with decreases in SSR as measured at ASNOA.
Finally, the ∼13 % change from 1995 to 2012 shown for all skies (Fig. 7) and clear skies (Fig. 10) is accompanied with a drop of ∼25 % in AOD measured by AVHRR. The year-to-year variations of clear-sky SSR series and the AVHRR-related AOD show an anti-correlation with (N=29), verifying the hypothesis that clear-sky SSR changes are associated with aerosol load changes, at least within the common AVHRR measurement period (1982–2009).
Similar to the AVHRR data the ChArMEx 4-D aerosol climatology is shown in Fig. 10, providing similar conclusions, namely the negative AOD trend of −0.03 or −14 % decade−1 from 1979 to 2012.
Differences between the AVHRR and ChArMEx data can be explained in part by the different AOD wavelengths presented here (630 vs. 550 nm) and also by a general negative bias of AVHRR over the Mediterranean compared to AERONET (Nabat et al., 2014). The smooth decline in the ChArMEx AOD data is due to the method used to build this product and uses the trend and not the interannual variability, which is not included in the global model that was used.
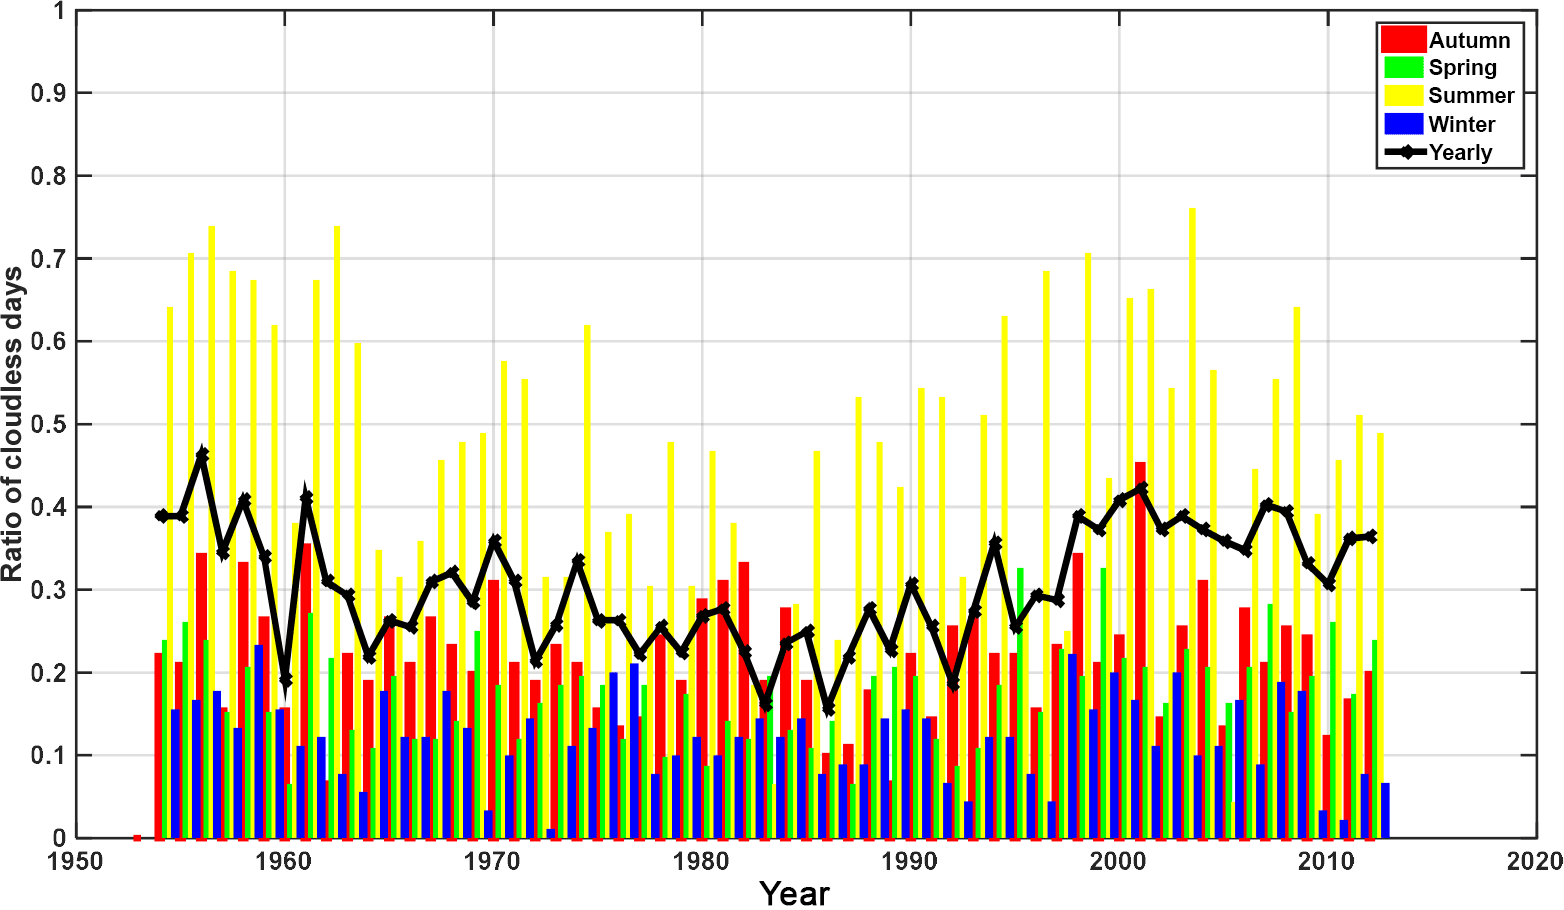
In addition to Fig. 10, Fig. 11 shows the ratio of cloudless days to all available days for each season and for each year. Figure 11 shows a minimum (less than 30 % during a year) number of cloudless days from mid-1970s to early 1990s. It is mostly linked with the decrease of cloudless days during summer months. The figure provides evidence of the relative SSR changes observed during this period, but it cannot directly interpret year-to-year SSR changes as they also depend on cloud fraction and properties for cloudy days. In addition, it can only partly be linked with Fig. 10 as aerosol effects on cloudless-sky-calculated SSR depend mostly on AOD levels and not on the number of days included in the calculations.
Differences in the ratio of cloudless days shown in Fig. 11 and in the almost constant cloud octa variability shown in Fig. 7 are partly attributed to the different definition of a cloudless day that is based on the cloud radiative effect for Fig. 11 and on observation of cloud percentage in the sky for Fig. 7. However, this could also be an indication of changes in cloud properties (e.g., a change in optically thin clouds could have a small radiation effect but would be marked as cloudy conditions by the observer).
In Table 4 we calculated the linear trends for the 1953–2012 period and for both clear-sky and all-sky measurements and the 1953–1982 and 1983–2012 sub-periods for clear-sky measurements. Results show comparable changes per decade (2 % for the clear-sky and 1.5 % for the all-sky cases). Seasonal analysis show that clear-sky trends for summer, autumn and winter months are higher than the ones derived for all skies. Such differences are linked with the seasonal variability and long-term changes in cloudiness for the specific seasons.
Clear-sky results for the 1953–2012 period show significant positive changes in SSR for all seasons except winter. Looking individually at the 1953–1982 and 1983–2012 periods, we calculated significant negative trends for only the winter for the former, and for only summer and spring for the latter.
The effect of various parameters on SSR was discussed by Kambezidis et al. (2016) in their study about the global dimming/brightening effect over the Mediterranean in the period 1979–2012. They show that the influence of parameters related to the atmospheric transparency, like water vapor, aerosols and trace gases, as well as changes in the surface albedo on SSR, were larger in the southern parts of the Mediterranean, over the Balkan countries and central Turkey. This outcome is in agreement with the conclusion of the present study that factors other than cloudiness play a significant role in the SSR variations.
A comparison of the SSR results in Athens with visibility observations stretching back to 1931 (Founda et al., 2017) did not show any correlation among SSR and horizontal visibility. For the first part of the common data set (1930–1959) the visibility decline is accompanied with an SSR increase. However from 1950 through the present, visibility shows a monotonical decrease. The steep visibility decrease from 1931 to the early 1990s is not accompanied by a relative SSR decrease excluding individual sub-periods. However, simulated SSR is driven purely by changes in sunshine duration; in this case the SD variability in Founda et al. (2014) is almost stable after 1950, so SD cannot be also linked with the visibility reported decrease. Studying the literature for similar cases, similar conclusions were drawn by Liepert and Kukla (1997), showing an SSR decrease over 30 years of measurements accompanied by a visibility increase and no significant changes in the cloud cover conditions in Germany. This Athens SSR vs. visibility relationship can be partly explained by the fact that SSR and visibility have different responses to cloud conditions, water vapor and rainfall, and also by the fact that visibility is affected by aerosols only in the first few hundred meters above the surface, while SSR is affected by the columnar AOD, which in the case of Athens can be significantly different due to long-range aerosol transport at altitude (e.g., Saharan dust; Leìon et al., 1999).
Surface solar radiation (SSR) at National Observatory of Athens, in the center of the city, is presented using a unique data set covering a period of 59 years (1954–2012). Sunshine duration (SD) records for another 54 years were used as a proxy to reconstruct SSR time series for the period from 1900 to 2012.
The accuracy of such historical radiation data sets is difficult to assess, especially when looking at the 1950s and 1960s, when instruments, operational procedures and quality control were not at the same level as in the past 30 years. Quality-assessment procedures in the presented time series were applied with criteria based on instrument characteristics and the availability of additional collocated measurements. Year-to-year fluctuations of the measured SSR, in addition to the reversal of the downward tendencies at the ASNOA site, adds credibility to the measured variations. That is because radiometers typically lose sensitivity with time, indicating spurious downward trends but not upward trends. The more recent (after 1986) SSR measurements can be characterized as high-quality radiation data with known accuracy. Concerning the measurements from 1954 to 1970, there have been sporadic reports mentioning the homogenization and calibration procedures, while for 1970 to 1986 there is more information on the instrument quality control.
Reporting of the results from the 1954–1986 period should be accompanied by noting that the uncertainties of the measurements of this period are linked with higher uncertainties than after 1986. For the reconstruction of the 1900–1953 series, only the 1983–2012 SSR and SD measurements were used in order not to link possible instrument uncertainties to the extrapolated period. However, reconstruction of the 1900–1983 time series using the 1984–2012 data set leads to small differences in the determination of the long-term trends, especially for running average windows of greater than 20 years.
De-seasonalized SSR data analysis from 1900 to 2012 showed high month-to-month variability reached up to 25 %, mainly related with monthly cloudiness variations. During the period from 1910 to the mid-1930s, for which only few data sets have worldwide SSR results, we observe a −2.9 % decade−1 (a total of −8.7 %) decrease in SSR, assuming linear changes in SSR during this period. This early dimming was followed by a +5 % decade−1 increase from 1930 to the 1950s. Similar results have been found in Washington, DC, USA, and in Potsdam, Germany (Stanhill and Achiman, 2016). They reported an early brightening at both locations in the 1930s. For the SSR measurement period of 1953 to 1980, European studies presented in Wild (2009) showed a −1 to −7 % decade−1 in SSR measurements over various European sites (dimming period). For the Mediterranean region, Manara et al. (2016) showed a decrease on the order of −2 to −4 % decade−1 in Italy. We report a change in SSR of −2 % decade−1 in Athens. Finally, for the brightening (1990–2012) phase again Wild et al. (2009) reported a +1.6 to +4.7 % decade−1 positive change in SSR while we calculated a +1.5 % decade−1, which is lower than the + (3–6) % decade−1 reported in Manara et al. (2016) for Italy. A summary of the above findings can be seen in Table 5.
The decadal variations of SSR measured starting in 1954 in Athens, Greece, originate from the alterations in the atmosphere's transparency (namely by clouds and aerosols). Using an analysis of SSR calculations of all-sky and clear-sky (cloudless) days, we note that since cloud cover changes during the 59-year period were very small, most of the observed decadal changes might be related with changes in the aerosol load of the area. Additional evidence in support of this conclusion is the high correlation of clear-sky and all-sky yearly SSR. We also found an anti-correlation between clear-sky and all-sky SSR measurements and AOD time series from AVHRR (1981–2009) and ChArMEx (1979–2012). Looking at linear trends over the 59-year period, clear-sky changes per decade were +2 %, while they were +1.5 % for all-sky conditions. The most pronounced changes were calculated for summer and autumn seasons (+2 and +2.7 %, respectively).
NOA-related surface solar radiation, sunshine duration and cloud octa data are available upon request from NOA/IERSD director Nickolaos Mihalopoulos. ChArMEx AOD data are available upon request from Pierre Nabat.
The authors declare that they have no conflict of interest.
This article is part of the special issue “CHemistry and AeRosols Mediterranean EXperiments (ChArMEx) (ACP/AMT inter-journal SI)”. It is not associated with a conference.
The authors wish to thank all past and present NOA staff members
who carefully collected and archived the long-term data used in this
study. This study contributes to the Chemistry-Aerosol Mediterranean
Experiment (ChArMEx) work package 6 on trends. The work was partly
funded by the Greek national project “Aristotelis”, work package
1: “Study of long term variations of Solar Radiation in the region
of Athens”. Arturo Sanchez-Lorenzo was supported by postdoctoral
fellowships (JCI-2012–12508 and RYC-2016–20784) and a project
(CGL2014-55976-R) funded by the Spanish Ministry of Economy,
Industry and Competitiveness. We would like to thank the anonymous
reviewers, Katsumasa Tanaka and the editor, François Dulac, for their efforts on
substantially improving this work.
Edited by: François Dulac
Reviewed by: Katsumasa Tanaka and two anonymous referees
Alexandri, G., Georgoulias, A. K., Meleti, C., Balis, D., Kourtidis, K. A., Sanchez-Lorenzo, A., Trentmann, J. und Zanis, P.: A high resolution satellite view of surface solar radiation over the climatically sensitive region of Eastern Mediterranean, Atmos. Res., 188, 107–121, https://doi.org/10.1016/j.atmosres.2016.12.015, 2017.
Angell, J. K.: Variation in United States cloudiness and sunshine duration between 1950 and the drought year of 1988, J. Climate, 3, 296–308, 1990.
Ångström, A.: Solar and terrestrial radiation, Report to the international commission for solar research on actinometric investigations of solar and atmospheric radiation, Q. J. Roy. Meteor. Soc., 50, 121–126, 1924.
Anton, M., Vaquero, J. M., and Aparicio, A. J. P.: The controversial early brightening in the first half of 20th century: a contribution from pyrheliometer measurements in Madrid (Spain), Global Planet. Change, 115, 71–75, https://doi.org/10.1016/j.gloplacha.2014.01.013, 2014.
Anton, M., Roman, R., Sanchez-Lorenzo, A., Calbo, J., and Vaquero, J. M.: Variability analysis of the reconstructed daily global solar radiation under all-sky and cloud-free conditions in Madrid during the period 1887–1950, Atmos. Res., 191, 94–100, https://doi.org/10.1016/j.atmosres.2017.03.013, 2017.
Bais, A. F., Drosoglou, T., Meleti, C., Tourpali, K., and Kouremeti, N.: Changes in surface shortwave solar irradiance from 1993 to 2011 at Thessaloniki (Greece), Int. J. Climatol., 33, 2871–2876, https://doi.org/10.1002/joc.3636, 2013.
Chan, P. K., Zhao, X. P., and Heidinger, A. K.: Long-term aerosol climate data record derived from operational AVHRR satellite observations, dataset Papers in Geosciences, 140791, https://doi.org/10.7167/2013/140791, 2013.
Coulson, K. L.: Solar and Terrestrial Radiation: Methods and Measurements, Academic Press, New York, 1975.
Drummond, A. J. and Roche, J. J.: Corrections to be applied to measurements made with Eppley (and other) spectral radiometers when used with Schott colored glass filters, J. App. Meteor., 4, 741–744, https://doi.org/10.1175/1520-0450(1965)004<0741:CTBATM>2.0.CO;2, 1965.
Dudok de Wit, T., Ermolli, I., Haberreiter, M., Kambezidis, H., Lam, M., Lilensten, J., Matthes, K., Mironova, I., Schmidt, H., Seppäla, A., Tanskanen, E., Tourpali, K., and Yair, Y. (Eds.): Earth's Climate Response to a Changing Sun, Les Ulis CEDEX: EDP Sciences, https://doi.org/10.1051/978-2-7598-1733-7, 2015.
Flocas, A.: Estimation and prediction of global solar radiation over Greece, Sol. Energy, 24, 63–70, https://doi.org/10.1016/0038-092X(80)90021-3, 1980.
Founda, D., Kalimeris, A., and Pierros, F.: Multi annual variability and climatic signal analysis of sun-shine duration at a large urban area of Mediterranean (Athens), Urban Climate, 10, 815–830, https://doi.org/10.1016/j.uclim.2014.09.008, 2014.
Founda, D., Kazadzis, S., Mihalopoulos, N., Gerasopoulos, E., Lianou, M., and Raptis, P. I.: Long-term visibility variation in Athens (1931–2013): a proxy for local and regional atmospheric aerosol loads, Atmos. Chem. Phys., 16, 11219–11236, https://doi.org/10.5194/acp-16-11219-2016, 2016.
Founda, D., Pierros, F., and Sarantopoulos, A.: Evidence of Dimming/Brightening Over Greece from Long-Term Observations of Sunshine Duration and Cloud Cover, in: Perspectives on Atmospheric Sciences, edited by: Karacostas, T., Bais, A., and Nastos, P., Springer Atmospheric Sciences, Springer, Cham, https://doi.org/10.1007/978-3-319-35095-0_108, 2017.
García, R. D., Cuevas, E., García, O. E., Cachorro, V. E., Pallé, P., Bustos, J. J., Romero-Campos, P. M., and de Frutos, A. M.: Reconstruction of global solar radiation time series from 1933 to 2013 at the Izaña Atmospheric Observatory, Atmos. Meas. Tech., 7, 3139–3150, https://doi.org/10.5194/amt-7-3139-2014, 2014.
Gilgen, H., Wild, M., and Ohmura, A.: Means and trends of shortwave irradiance at the surface estimated from global energy balance archive data, J. Climate, 11, 2042–2061, 1998.
Hulstrom, R. L. (Ed.): Solar Resources, Solar Heat Technologies: Fundamentals and Applications 2, The MIT Press, Cambridge, 1989.
Imamovic, A., Tanaka, K., Folini, D., and Wild, M.: Global dimming and urbanization: did stronger negative SSR trends collocate with regions of population growth?, Atmos. Chem. Phys., 16, 2719–2725, https://doi.org/10.5194/acp-16-2719-2016, 2016.
ISO 9847: Solar Energy – Calibration of Field Pyranometers by Comparison to a Reference Pyranometer, International Organization for Standardization, 1992,
Jauregui, E. and Luyando., E.: Global radiation attenuation by air pollution and its effects on the thermal climate in Mexico City, Int. J. Climatol., 19, 683–694, 1999.
Kambezidis, H., Demetriou, D., Kaskaoutis, D., and Nastos, P.: Solar dimming/brightening in the Mediterranean, EGU General Assembly 2010, Vienna, Austria, 2–7 May 2010, p. 10023, 2010.
Kambezidis, H., Kaskaoutis, D., Kalliampakos, G., Rashki, A., and Wild, M.: The solar dimming/brightening effect over the Mediterranean Basin in the period 1979–2012, J. Atmos. Sol.-Terr. Phys., 150–151, 31–46, https://doi.org/10.1016/j.jastp.2016.10.006, 2016.
Katsoulis, B. and Leontaris, S.: The distribution over Greece of global solar radiation on a horizontal surface, Agr. Methodol., 23, 217–229, https://doi.org/10.1016/0002-1571(81)90106-0, 1981.
Katsoulis, B. and Papachristopoulos, E.: Analysis of solar radiation measurements at Athens observatory and estimates of solar radiation in Greece, Sol. Energy, 21, 217–226, https://doi.org/10.1016/0038-092x(78)90024-5, 1978.
Kouremenos, D., Antonopoulos, K., and Domazakis, E.: Solar radiation correlations for Athens, Sol. Energy, 35, 259–269, https://doi.org/10.1016/0038-092x(85)90105-7, 1985.
Lamarque, J.-F., Bond, T. C., Eyring, V., Granier, C., Heil, A., Klimont, Z., Lee, D., Liousse, C., Mieville, A., Owen, B., Schultz, M. G., Shindell, D., Smith, S. J., Stehfest, E., Van Aardenne, J., Cooper, O. R., Kainuma, M., Mahowald, N., McConnell, J. R., Naik, V., Riahi, K., and van Vuuren, D. P.: Historical (1850–2000) gridded anthropogenic and biomass burning emissions of reactive gases and aerosols: methodology and application, Atmos. Chem. Phys., 10, 7017–7039, https://doi.org/10.5194/acp-10-7017-2010, 2010.
Lean, J.: The Sun's variable duration and its relevance for earth, Annu. Rev. Astron. Astr., 35, 33–67, 1997.
Léon, J., Chazett, P., and Dulac, F.: Retrieval and monitoring of aerosol optical thickness over an urban area by spaceborne and ground-based remote sensing, Appl. Optics, 38, 6918–6926, 1999.
Liepert, B. and Kukla, G.: Decline in global solar radiation with increased horizontal visibility in Germany between 1964 and 1990, J. Climate, 10, 2391–2401, https://doi.org/10.1175/1520-0442(1997)010<2391:DIGSRW>2.0.CO;2, 1997.
Macris, G. J.: Solar energy and sunshine hours in Athens, Greece, Mon. Weather Rev., 87, 29–32, 1959.
Manara, V., Brunetti, M., Celozzi, A., Maugeri, M., Sanchez-Lorenzo, A., and Wild, M.: Detection of dimming/brightening in Italy from homogenized all-sky and clear-sky surface solar radiation records and underlying causes (1959–2013), Atmos. Chem. Phys., 16, 11145–11161, https://doi.org/10.5194/acp-16-11145-2016, 2016.
Matuszko, D.: Long-term variability in solar radiation in Krakow based on measurements of sunshine duration, Int. J. Climatol., 34, 228–234, https://doi.org/10.1002/joc.3681, 2014.
McConnell, J. R., Edwards, R., Kok, G. L., Flanner, M. G., Zender, C. S., Saltzman, E. S., Banta, J. R., Pasteris, D. R., Carter, M. M., and Kahl, J. D. W.: 20th century industrial black carbon emissions altered Arctic climate forcing, Science, 317, 5843, https://doi.org/10.1126/science.1144856, 2007.
Mishchenko, M. I., Geogdzhayev, I. V., Rossow, W. B., Cairns, B., Carlson, B. E., Lacis, A. A., Liu, L., and Travis, L. D.: Long-term satellite record reveals likely recent aerosol trend, Science, 315, 1543, https://doi.org/10.1126/science.1136709, 2007.
Nabat, P., Somot, S., Mallet, M., Chiapello, I., Morcrette, J. J., Solmon, F., Szopa, S., Dulac, F., Collins, W., Ghan, S., Horowitz, L. W., Lamarque, J. F., Lee, Y. H., Naik, V., Nagashima, T., Shindell, D., and Skeie, R.: A 4-D climatology (1979–2009) of the monthly tropospheric aerosol optical depth distribution over the Mediterranean region from a comparative evaluation and blending of remote sensing and model products, Atmos. Meas. Tech., 6, 1287–1314, https://doi.org/10.5194/amt-6-1287-2013, 2013.
Nabat, P., Somot, S., Mallet, M., Sanchez-Lorenzo, A., and Wild, M.: Contribution of anthropogenic sulfate aerosols to the changing Euro-Mediterranean climate since 1980, Geophys. Res. Lett., 41, 5605–5611, https://doi.org/10.1002/2014GL060798, 2014.
Norris, J. R. and Wild, M.: Trends in aerosol radiative effects over Europe inferred from observed cloud cover, solar “dimming,” and solar “brightening”, J. Geophys. Res., 112, D08214, https://doi.org/10.1029/2006JD007794, 2007.
Notaridou, V. and Lalas, D.: The distribution of global and net radiation over Greece, Sol. Energy, 22, 504–514, https://doi.org/10.1016/0038-092X(79)90022-7, 1978.
Ohmura, A.: Observed long-term variations of solar irradiances at the Earth's surface, Space Sci. Rev., 125, 111–128, https://doi.org/10.1007/s11214-006-9050-9, 2006.
Ohmura, A.: Observed decadal variations in surface solar radiation and their causes, J. Geophys. Res., 114, D00D05, https://doi.org/10.1029/2008JD011290, 2009.
Ohmura, A. and Lang, H.: Secular variation of global radiation over Europe, in: Current Problems in Atmospheric Radiation, edited by: Lenoble, J. and Geleyn, J. F., Deepak, Hampton, Va., 98–301, 1989.
Ruckstuhl, C., Philipona, R., Behrens, K., Collaud Coen, M., Durr, B., Heimo, A., Matzler, C., Nyeki, S., Ohmura, A., Vuilleumier, L., Weller, M., Wehrli, C., and Zelenka, A.: Aerosol and cloud effects on solar brightening and the recent rapid warming, Geophys. Res. Lett., 35, L12708, https://doi.org/10.1029/2008gl034228, 2008.
Sanchez-Lorenzo, A., Calbó, J., and Martin-Vide, J.: Spatial and temporal trends in sunshine duration over Western Europe (1938–2004), J. Climate, 21, 6089–6098, https://doi.org/10.1175/2008JCLI2442.1, 2008.
Sanchez-Lorenzo, A. and Wild, M.: Decadal variations in estimated surface solar radiation over Switzerland since the late 19th century, Atmos. Chem. Phys., 12, 8635–8644, https://doi.org/10.5194/acp-12-8635-2012, 2012.
Sanchez-Lorenzo, A., Wild, M., Brunetti, M., Guijarro, J. A., Hakuba, M. Z., Calbó, J., Mystakidis, S., and Bartok, S.: Reassessment and update of long-term trends in downward surface shortwave radiation over Europe (1939–2012), J. Geophys. Res.-Atmos., 120, 9555–9569, https://doi.org/10.1002/2015JD023321, 2015.
Sanchez-Romero, A., Sanchez-Lorenzo, A., Calbó, J., González, J. A., and Azorin-Molina, C.: The signal of aerosol-induced changes in sunshine duration records: a review of the evidence, J. Geophys. Res.-Atmos., 119, 4657–4673, https://doi.org/10.1002/2013JD021393, 2014.
Stanhill, G.: Global irradiance, air pollution and temperature changes in the Arctic, Philos. T. R. Soc. A, 352, 247–258, https://doi.org/10.1098/rsta.1995.0068, 1995.
Stanhill, G. and Ahiman, O.: Radiative forcing and temperature change at Potsdam between 1893 and 2012, J. Geophys. Res.-Atmos., 119, 9376–9385, https://doi.org/10.1002/2014JD021877, 2014.
Stanhill, G. and Ahiman, O.: Early global radiation measurements: a review, Int. J. Climatol., 37, 1665–1671, https://doi.org/10.1002/joc.4826, 2017.
Stanhill, G. and Cohen, S.: Recent changes in solar irradiance in Antarctica, J. Climate, 10, 2078–2086, https://doi.org/10.1175/1520-0442(1997)010<2078:RCISII>2.0.CO;2, 1997.
Stanhill, G. and Cohen, S.: Solar radiation changes in the United States during the twentieth century: evidence from sunshine duration measurements, J. Climate, 18, 1503–1512, https://doi.org/10.1175/JCLI3354.1, 2005.
Stanhill, G. and Möller, M.: Evaporative climate change in the British Isles, Int. J. Climatol., 28, 1127–1137, 2008.
Streets, D. G., Wu, Y., and Chin, M.: Two-decadal aerosol trends as a likely explanation of the global dimming/brightening transition, Geophys. Res. Lett., 33, L15806, https://doi.org/10.1029/2006GL026471, 2006.
Tanaka, K., Ohmura, A., Folini, D., Wild, M., and Ohkawara, N.: Is global dimming and brightening in Japan limited to urban areas?, Atmos. Chem. Phys., 16, 13969–14001, https://doi.org/10.5194/acp-16-13969-2016, 2016.
Vautard, R. and Yiou, P.: Control of recent European surface climate change by atmospheric flow, Geophys. Res. Lett., 36, L22702, https://doi.org/10.1029/2009GL040480, 2009.
Vignola, F., Michalsky, J., and Stoffel., T.: Solar and infrared radiation measurements, Chapter 1, CRC Press, ISBN: 1439851891/9781439851890, 2012.
Wang, K. C., Dickinson, R. E., Wild, M., and Liang, S.: Atmospheric impacts on climatic variability of surface incident solar radiation, Atmos. Chem. Phys., 12, 9581–9592, https://doi.org/10.5194/acp-12-9581-2012, 2012.
Wild, M.: Global dimming and brightening: a review, J. Geophys. Res., 114, D00D16, https://doi.org/10.1029/2008JD011470, 2009.
Wild, M.: Decadal changes in radiative fluxes at land and ocean surfaces and their relevance for global warming, WIRES Clim. Change, 7, 91–107, https://doi.org/10.1002/wcc.372, 2016.
Wild, M., Folini, D., Hakuba, M. Z., Schär, C., Seneviratne, S. I, Kato, S., Rutan, D., Ammann, C., Wood, E. F., and König-Langlo, G.: The energy balance over land and oceans: an assessment based on direct observations and CMIP5 climate models, Clim. Dynam., 44, 3393–3429, https://doi.org/10.1007/s00382-014-2430-z, 2015.
WMO: Measurement of radiation, in: Guide to Meteorological Instrument and Observing Practices, Chapter 9, fifth Edn., WMO No. 8, ISBN 978-92-63-100085, World Meteorological Organization, 1983.
WMO: Scientific Assessment of Ozone Depletion: 2010, report 52, World Meteorological Organization (WMO), Global Ozone Research and Monitoring Project, Geneva, Switzerland; National Oceanic and Atmospheric Administration (NOAA), Washington, DC, USA; National Aeronautics and Space Administration (NASA), Washington, DC, USA; United Nations Environment Program (UNEP), Nairobi, Kenya; and the European Commission, Research Directorate General, Brussels, Belgium, 2010.
Yildirim, U., Yilmaz, I. O., and Akinoğlu, B. G.: Trend analysis of 41 years of sunshine duration data for Turkey, Turkish Journal of Eng. Env. Sci., 37, 286–305, https://doi.org/10.3906/muh-1301-11, 2013.
Zabara, K.: Estimation of the global solar radiation in Greece, Sol. & Wind Tech., 3, 267–272, 1986.
Zerefos, C. S., Eleftheratos, K., Meleti, C., Kazadzis, S., Romanou, A., Ichoku, C., Tselioudis, G., and Bais, A.: Solar dimming and brightening over Thessaloniki, Greece, and Beijing, China, Tellus B, 61, 657–665, https://doi.org/10.1111/j.1600-0889.2009.00425.x, 2009.
Zerefos, C. S., Tourpali, K., Eleftheratos, K., Kazadzis, S., Meleti, C., Feister, U., Koskela, T., and Heikkilä, A.: Evidence of a possible turning point in solar UV-B over Canada, Europe and Japan, Atmos. Chem. Phys., 12, 2469–2477, https://doi.org/10.5194/acp-12-2469-2012, 2012.
Zhao, X., Chan, P., and NOAA CDR Program: NOAA Climate Data Record (CDR) of AVHRR Daily and Monthly Aerosol Optical Thickness over Global Oceans, Version 2.0.AOT1, NOAA National Centers for Environmental Information, 2014.