the Creative Commons Attribution 4.0 License.
the Creative Commons Attribution 4.0 License.
 | 18 Dec 2018
Representing sub-grid scale variations in nitrogen deposition associated with land use in a global Earth system model: implications for present and future nitrogen deposition fluxes over North America
Sergey Malyshev
Tran Nguyen
John D. Crounse
Elena Shevliakova
Larry W. Horowitz
Reactive nitrogen (N) emissions have increased over the last 150 years as a result of greater fossil fuel combustion and food production. The resulting increase in N deposition can alter the function of ecosystems, but characterizing its ecological impacts remains challenging, in part because of uncertainties in model-based estimates of N dry deposition. Here, we use the Geophysical Fluid Dynamics Laboratory (GFDL) atmospheric chemistry–climate model (AM3) coupled with the GFDL land model (LM3) to estimate dry deposition velocities. We leverage the tiled structure of LM3 to represent the impact of physical, hydrological, and ecological heterogeneities on the surface removal of chemical tracers. We show that this framework can be used to estimate N deposition at more ecologically relevant scales (e.g., natural vegetation, water bodies) than from the coarse-resolution global model AM3. Focusing on North America, we show that the faster removal of N over forested ecosystems relative to cropland and pasture implies that coarse-resolution estimates of N deposition from global models systematically underestimate N deposition to natural vegetation by 10 % to 30 % in the central and eastern US. Neglecting the sub-grid scale heterogeneity of dry deposition velocities also results in an underestimate (overestimate) of the amount of reduced (oxidized) nitrogen deposited to water bodies. Overall, changes in land cover associated with human activities are found to slow down the removal of N from the atmosphere, causing a reduction in the dry oxidized, dry reduced, and total (wet+dry) N deposition over the contiguous US of 8 %, 26 %, and 6 %, respectively. We also find that the reduction in the overall rate of removal of N associated with land-use change tends to increase N deposition on the remaining natural vegetation and facilitate N export to Canada. We show that sub-grid scale differences in the surface removal of oxidized and reduced nitrogen imply that projected near-term (2010–2050) changes in oxidized (−47 %) and reduced (+40 %) US N emissions will cause opposite changes in N deposition to water bodies (increase) and natural vegetation (decrease) in the eastern US, with potential implications for acidification and ecosystems.
- Article
(3118 KB) -
Supplement
(2882 KB) - BibTeX
- EndNote


Fossil fuel combustion and food production release reactive nitrogen (N) to the atmosphere (Fowler et al., 2013). Once in the atmosphere, N can be transported over long distances before it is removed by dry and wet deposition, providing greater N inputs to otherwise pristine regions (e.g., national parks, boreal forests) (Malm et al., 2016; Paulot et al., 2014). Since N can be a limiting nutrient, the increase in N deposition may promote ecosystem productivity, (Devaraju et al., 2015; Dezi et al., 2010; Magnani et al., 2007; Pregitzer et al., 2008; Reay et al., 2008; Townsend et al., 1996; Wårlind et al., 2014) especially in boreal regions (Fleischer et al., 2015; Gundale et al., 2014; Högberg, 2012). Increasing N deposition can also cause adverse environmental impacts for terrestrial ecosystems including soil acidification, loss of biodiversity, and eutrophication (Bobbink et al., 2010; Erisman et al., 2013; Pardo et al., 2011; Phoenix et al., 2012; Sheppard et al., 2011; Simkin et al., 2016; Stevens et al., 2004; Sutton et al., 2011; de Vries et al., 2015). In the US, oxidized N deposition is projected to decrease as a result of effective controls on NO emissions, but deposition of reduced N (), primarily from agricultural emissions of NH3, is projected to remain elevated or even increase (Dentener et al., 2006; Ellis et al., 2013; Lamarque et al., 2013; Li et al., 2016; Paulot et al., 2013). This raises concerns of irreversible damage to sensitive biomes (Dise, 2011; Grizzetti, 2011; Meunier et al., 2016; Pardo et al., 2011), such as high-elevation lakes (Baron et al., 2012; Lepori and Keck, 2012; Wolfe et al., 2003) and organisms (e.g., lichen; Johansson et al., 2012).
Significant challenges remain in quantifying the long-term impacts of N deposition on ecosystems in a changing climate (Högberg, 2012; Phoenix et al., 2012; Storkey et al., 2015; Sutton et al., 2008; Wu and Driscoll, 2010; de Vries et al., 2015), including uncertainties in the speciation, magnitude, and spatial distribution of the N deposition flux itself (Fleischer et al., 2013; Jickells et al., 2013; Ochoa-Hueso et al., 2011; Sutton et al., 2008). Many approaches have been developed to provide high-resolution, ecosystem-relevant estimates of both wet and dry N deposition, including statistical models (Dore et al., 2007, 2012; Singles et al., 1998; Weathers et al., 2006), a high-resolution nested chemical transport model (≃ 4 km × 4 km; Simkin et al., 2016; Vieno et al., 2009), and hybrid approaches that combine high-resolution regional chemical transport models with observed N fluxes and atmospheric concentrations (e.g., using the Community Multiscale Air Quality Modeling System; Bytnerowicz et al., 2015; Schwede and Lear, 2014; Williams et al., 2017). However, the elevated computational requirement associated with high-resolution atmospheric models makes such approaches impractical for assessing the long-term impact of N deposition on ecosystems, its sensitivity to climate change, and ultimately its coupling with the carbon cycle (Dirnböck et al., 2017; Fleischer et al., 2013, 2015; Smith et al., 2014; Zaehle et al., 2010). For such questions, estimates of N deposition are generally derived from global models with coarse resolution (≃100 km; Dentener et al., 2006; Lamarque et al., 2013). This introduces a large uncertainty (Hertel, 2011) in N deposition estimates especially for dry deposition, which can vary over short distances (∼1 km) in response to changes in the physical, hydrological, and ecological state of the surface (De Schrijver et al., 2008; Hicks, 2006, 2008; Ponette-González et al., 2010; Templer et al., 2014; Tulloss and Cadenasso, 2015; Weathers et al., 2000).
The goal of this study is to develop a framework to diagnose ecosystem-specific N dry deposition fluxes within a global chemistry climate model on decadal to centennial timescales. First we describe the coupling of the Geophysical Fluid Dynamics Laboratory (GFDL) land model (LM3) to the GFDL atmospheric chemistry–climate model (AM3) to represent the impact of natural (e.g., vegetation type, soil, and canopy wetness) and man-made (e.g., deforestation, cropping) heterogeneities on dry deposition. We then show that the tiled structure of LM3 can be leveraged to derive N deposition on a more ecologically relevant scale (e.g., deposition on water bodies or natural vegetation). Finally, we discuss how this framework can be used to better represent the impact of land-use change and future trends in N emissions on N deposition.
2.1 Model description
We use an updated version of the GFDL-AM3 (Donner et al., 2011; Naik et al., 2013; Paulot et al., 2016) to simulate atmospheric dynamics and chemistry. Except for the treatment of dry deposition, the model configuration is identical to the one recently described by Paulot et al. (2016) and Paulot et al. (2017), including updates to wet deposition and the chemistry of sulfate and nitrate. The horizontal resolution of the model is 200 km with 48 vertical levels.
In AM3, the surface removal of chemical tracers is calculated using a prescribed monthly climatology of dry deposition velocities (Naik et al., 2013; Paulot et al., 2016). The lack of a dynamic representation of dry deposition reduces the ability of the model to capture the impact of past and future variability in environmental conditions (e.g., drought, climate change; Wu et al., 2016) and land-use change on atmospheric chemistry. We note that these limitations are not specific to AM3 but affect all chemical transport models that do not include a comprehensive land model (Ellis et al., 2013; Ran et al., 2017).
Here, we describe the development of a new model, in which dry deposition of gaseous and aerosol species is calculated within the dynamic vegetation model LM3 (Milly et al., 2014; Shevliakova et al., 2009). The combined model will be referred to as AM3-LM3-DD hereafter.
LM3 is a comprehensive climate land model that includes detailed representations of vegetation dynamics and hydrology and is designed to be run over decadal to centennial timescales under both historical and future conditions. LM3 can be run both coupled with AM3 and in stand-alone mode with prescribed meteorological fields (Milly et al., 2014).
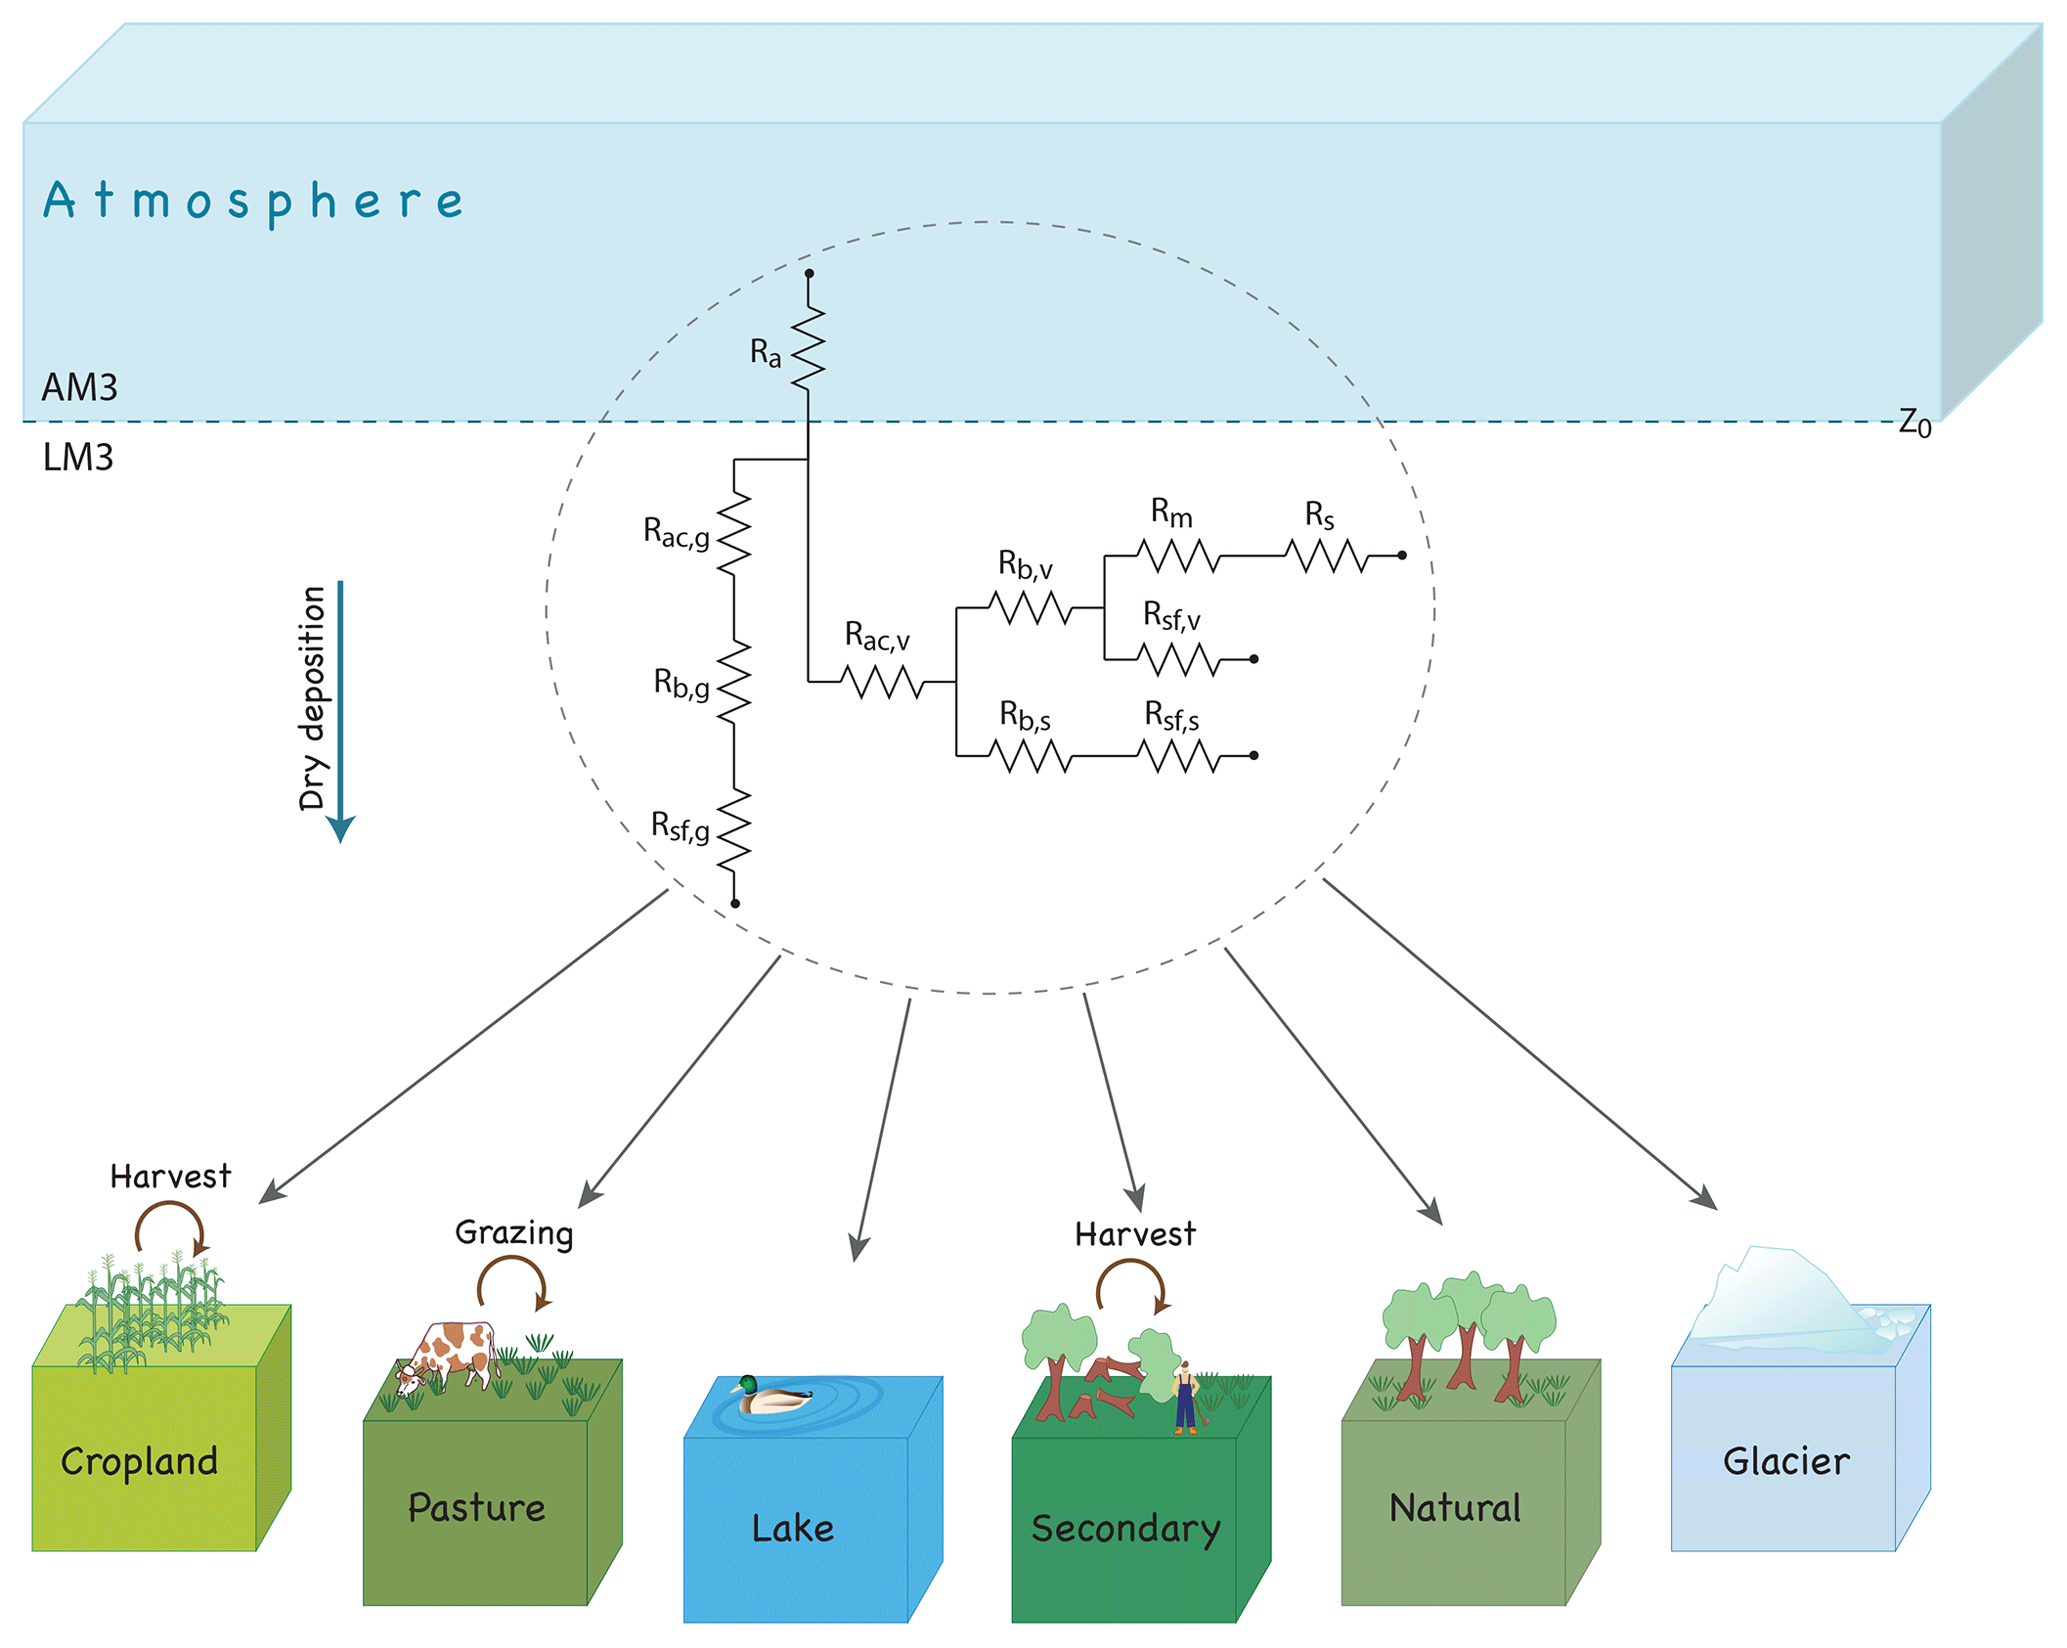
Figure 1Schematic representation of the resistance scheme used to represent the dry deposition of gaseous tracers for each tile. Ra, Rb,i, Rac, Rm, Rs, and Rsf,i are the aerodynamic resistance, laminar resistance, canopy aerodynamic resistance, mesophyll resistance, stomatal resistance, and surface resistance, respectively. The g, s, and v indexes (i) refer to ground, stem, and vegetation. Note that for clarity, deposition on soil and vegetation that are covered by snow or liquid water are not shown.
In LM3, the heterogeneity of the land surface and vegetation is represented using a sub-grid mosaic of tiles (Malyshev et al., 2015; Shevliakova et al., 2009) as illustrated in Fig. 1. Each tile has distinct energy and moisture balances for a vegetation–snow–soil column, biophysical properties, and exchanges of radiant and turbulent fluxes with the overlying atmosphere. LM3 predicts physical, biogeochemical, and ecological characteristics for each sub-grid land surface tile from the top of the vegetation canopy to the bottom of the soil column, including leaves and canopy temperature, canopy-air specific humidity, stomatal conductance, snow cover and depth, runoff, vertical distribution of soil moisture, ice, and temperature. The land-use history is prescribed from the Hurtt et al. (2011) reconstruction for each grid cell in terms of annual transition rates among four distinct land-use types: undisturbed (hereafter referred to as natural), crops, pastures, and secondary vegetation. Secondary vegetation is defined in LM3 as the vegetation recovering after land-use and land-cover changes and not currently managed. This includes all abandoned agricultural land as well as the land where wood was harvested at least once in prior years. The model keeps track of different recovery states by creating a secondary vegetation tile every time a disturbance occurs and simulating the subsequent vegetation regrowth in the tile. To avoid unrestricted growth of the number of tiles, the number of secondary vegetation tiles is limited to 10 per grid cell in the configuration of LM3 used here. When more than 10 secondary vegetation titles exist in a grid cell, secondary vegetation tiles with similar properties are merged (Shevliakova et al., 2009), while preserving water, energy, and carbon balances. Land properties that affect the surface removal of chemical tracers, such as snow cover, canopy liquid water and snow mass, surface and canopy temperature, leaf area index (LAI), stomatal conductance, and vegetation height are all prognostic (Shevliakova et al., 2009). Vegetation carbon is partitioned into five pools: leaves, fine roots, sapwood, heartwood, and labile storage. The model simulates changes in vegetation and soil carbon pools, as well as the carbon exchange among these pools and the atmosphere. The sizes of the pools are modified daily depending on the carbon uptake according to a set of allocation rules. Additionally, the model simulates changes in the vegetation carbon pools due to phenological processes, natural mortality, and fire. LAI is determined by vegetation leaf biomass and specific leaf area, prescribed for each vegetation type. Each vegetated tile has a unique vegetation type (C3 grass, C4 grass, temperate deciduous, coniferous, or tropical vegetation), which is determined based on biogeographical rules that take into account environmental conditions as well as vegetation biomass in each tile (Shevliakova et al., 2009). The fraction of the canopy covered by liquid water (fl) and snow (fs) are estimated from the intercepted canopy liquid water mass (wl) and snow mass (ws) following Bonan (1996):
where kg m−2 and kg m−2 are the maximum liquid water and snow holding capacities, respectively. If both snow and liquid water are present simultaneously, water and snow are assumed to be distributed independently of each other.
The representation of management practices is important in determining the impact of land-use change on dry deposition, as it affects the vegetation type, and the seasonality of the vegetation cover. In LM3, crop harvesting and pasture grazing are performed annually at the end of the calendar year (Malyshev et al., 2015). Previous work has shown that this treatment contributes to an underestimate of the impact of management on land cover (Malyshev et al., 2015). To address these biases, we make the following modifications. For pasture, we assume that 10 % of leaf biomass is removed daily by grazing, provided LAI exceeds 2 to avoid overgrazing. This higher grazing frequency and intensity are needed to avoid the excessive growth of vegetation biomass on pasture in the tropics and midlatitudes, a problem which was noted in previous versions of LM3 (Malyshev et al., 2015) leading to misclassification of pasture vegetation cover as forests (Malyshev et al., 2015). LM3 does not estimate the cropping schedule (e.g., Bondeau et al., 2007), so we specify planting and harvesting dates from the global monthly irrigated and rainfed crop area climatology (Portmann et al., 2010). The impact of management practices on the timing and magnitude of agricultural emissions (e.g., Paulot et al., 2014) is not accounted for in AM3-LM3-DD.
The tiled structure of LM3 is especially useful to diagnose fluxes to areas, such as natural vegetation or water bodies, which are generally not well represented by the average properties of the grid box, in which they are located, because of their small geographical extent (Fig. S1 in the Supplement).
The dry deposition velocity (vd(X)) for species X is calculated independently for each tile following the widely used electrical circuit analogy (Fig. 1) (Hicks et al., 1987; Wesely, 1989; Zhang et al., 2001, 2003).
Briefly, the aerodynamic resistance (Ra) to the exchange of tracers between the canopy and the atmosphere is determined using the Monin–Obukhov similarity theory. Within the canopy, the aerodynamic resistances to the ground (Rac,g) and to the vegetation (Rac,v) are independent of the chemical tracer and taken from Erisman (1994) and Choudhury and Monteith (1988), respectively.
where SAI, h, V, and u⋆ are the stem area index (unitless), the height of the vegetation (in meters), the normalized wind (m s−1) at the top of the canopy, and the friction velocity (m s−1), respectively. Note that unlike Erisman (1994), we include SAI in the calculation of Rac,g, which tends to reduce deposition to the ground in winter.
We focus next on the representation of the dry deposition of gases, which is much faster than that of fine particles (Zhang et al., 2002).
Table 1Model runs.
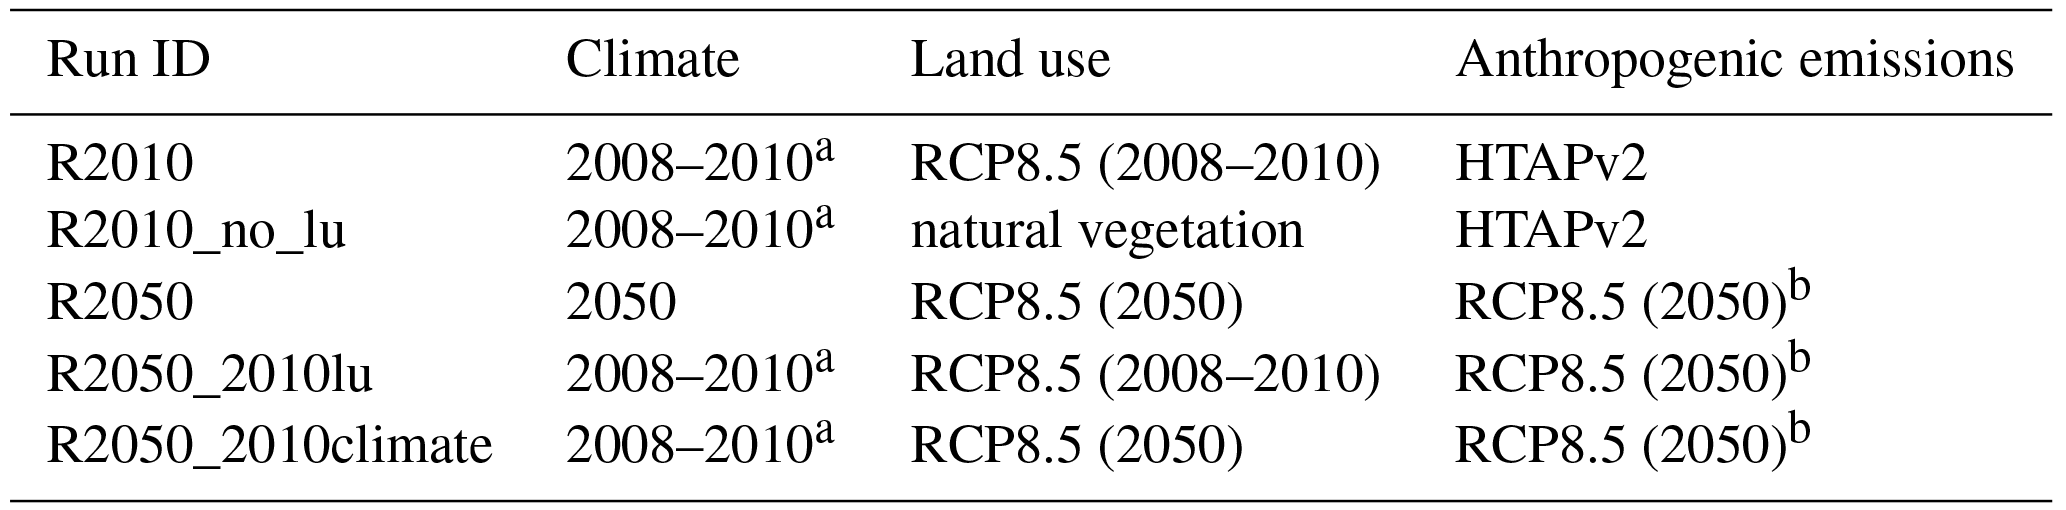
a Horizontal winds are nudged to NCEP. b Those with modified NH3 emissions following Paulot et al. (2016)
Following Jensen and Hummelshøj (1995) and Jensen and Hummelshøj (1997), the canopy laminar resistance (Rb,v) is defined as
where lw is the characteristic obstacle length of the canopy (in m, Table S1), ν is the kinematic viscosity, and DX is the diffusivity of species X. Following Hicks et al. (1987), the stem laminar resistance is
where Pr is the Prandtl number, Sc(X) is the Schmidt number, i.e., the ratio of the kinematic to the mass diffusivity (), and κ is the von Kármán constant (κ=0.4). Similarly, the ground surface laminar resistance is
where ug⋆ is the friction velocity near the ground (Loubet et al., 2006).
The mesophyll resistance is expressed following Wesely (1989):
The stomatal resistance (Rs(X)) is calculated as
where M(X) is the molecular weight of species X and Rs(H2O) is the stomatal resistance for water vapor, calculated according to the Leuning model (Leuning, 1995; Milly et al., 2014). This model accounts for the impact of water stress and CO2 concentration, which have been shown to modulate the response of surface ozone to drought (Huang et al., 2016) and CO2 increase (Sanderson et al., 2007). Cuticle (v), stem (s), and ground (g) resistances for species X are parameterized based on SO2 and O3:
where Rsf,i(SO2) and Rsf,i(O3) are tabulated resistances (Table S1) for each surface type, α(X) and β(X) are weighting factors (Table S2) estimated using the solubility (for α) and reactivity (for β) of X (Wesely, 1989; Zhang et al., 2002), s(T) is a temperature adjustment factor (Zhang et al., 2003), and γ(X) is a co-deposition adjustment, which reflects changes in Rsf,i(X) associated with surface acidity (Erisman et al., 1994; Massad et al., 2010; Neirynck et al., 2011; Wu et al., 2016). Here, we use the parameterizations of Massad et al. (2010) for NH3 and Simpson et al. (2003) for SO2:
To avoid unrealistic oscillations in vd(NH3) and vd(SO2), we estimate the acid ratio (rSN) using the ratio of the 24 h integrated total dry deposition of acids to the dry deposition of ammonia and ammonium, rather than using the ratio of their surface concentrations (Massad et al., 2010; Simpson et al., 2003).
The bidirectional exchange of ammonia is not represented in AM3-LM3-DD (Flechard et al., 2013; Massad et al., 2010). This reflects in part uncertainties in the emission potential of vegetation and the lack of detailed treatment of agricultural activities in LM3 (Riddick et al., 2016). We thus expect AM3-LM3-DD to overestimate NH3 dry deposition in source regions (Sutton et al., 2007; Zhu et al., 2015).
2.2 Experimental design
We perform two sets of global simulations representative of present-day (circa 2010) and future (2050) conditions. For present-day conditions, AM3-LM3-DD is run from 2007 to 2010 using 2007 as a spin-up. The model is forced with observed sea surface temperatures and sea ice cover, and land use from the Representative Concentration Pathway 8.5 scenario (RCP8.5; Riahi et al., 2011). Anthropogenic emissions are from the Hemispheric Transport of Air Pollution 2 (HTAPv2; Janssens-Maenhout et al., 2015). Natural emissions are based on Naik et al. (2013), except for isoprene emissions, which are calculated interactively using the Model of Emissions of Gases and Aerosols from Nature (MEGAN; Guenther et al., 2006). This simulation will be referred to as R2010 hereafter. An additional sensitivity experiment is performed (R2010_no_lu) in which natural vegetation is assumed to cover all vegetated tiles (i.e., no human land use). In both experiments, horizontal winds are nudged to those from the National Centers for Environmental Prediction reanalysis (Kalnay et al., 1996) to minimize meteorological variability between R2010 and R2010_no_lu.
For 2050, we use the vegetation, sea surface temperatures, and sea ice cover simulated by the GFDL-CM3 model under the RCP8.5 scenario in 2050 (Levy et al., 2013). RCP8.5 anthropogenic emissions for 2050 are used (Lamarque et al., 2011) except for NH3, where we use the spatial distribution and seasonality of HTAPv2 emissions following Paulot et al. (2016). The model is run for 10 years with land use fixed to year 2050, and we use the average of the last 9 years to minimize the impact of internal variability. This simulation will be referred to as R2050 hereafter. We perform two additional sensitivity experiments to characterize how land-use change (R2050_2010lu) and climate (R2050_2010climate) contribute to the change in deposition velocity between R2010 and R2050. The different model runs are summarized in Table 1.

Figure 2Simulated deposition velocity of NH3 and SO2 over a coniferous forest (LAI =5, m s−1, RH =80 %) at different canopy wetness and temperatures. To facilitate comparison across models, we use the same Ra=20 s m−1, Rb (Hicks et al., 1987), and Rs (Wesely, 1989) for all models. Solar irradiation increases linearly from 0 to 800 W m−2 with temperature. We neglect deposition to the ground and stems. Codep refers to the decrease in Rsf,v(SO2) and Rsf,v(NH3) associated with base and acid deposition, respectively. For illustrative purposes, the ratio of acid to base deposition is set to 0.5 for SO2 and 2 for NH3. The lifetimes of SO2 and NH3 are estimated assuming a boundary layer height of 900 m. GEOS-Chem and AM3-LM3–DD produce identical results for SO2 under dry conditions.
3.1 Evaluation of simulated vd against observations
The resistance approach for calculating dry deposition velocities implemented in AM3-LM3-DD is similar to that used in most chemical transport models. However differences in implementations can result in large differences between simulated deposition velocities (Wu et al., 2018). To illustrate these differences, Fig. 2 shows the sensitivity of vd(SO2) and vd(NH3) to temperature, wetness, and surface acidity in three global models: MOZART (Emmons et al., 2010), GEOS-Chem (Wang et al., 1998), and AM3-LM3–DD. Under dry conditions, GEOS-Chem and AM3-LM3–DD produce identical results for vd(SO2), with the temperature dependence driven by that of the stomatal conductance. At low and high temperatures, vd(NH3) is faster in AM3-LM3–DD than GEOS-Chem, which reflects small differences in the assumed surface pH (6.35 and 6.6, respectively). In contrast, MOZART assumes a surface pH =5 and accounts for changes in the effective solubility of SO2 and NH3 with temperature, similar to Nguyen et al. (2015). The increase in solubility with decreasing temperature results in faster vd(X) at cold temperatures in MOZART, while the lower pH increases vd(NH3) and decreases vd(SO2). The impact of surface wetness on vd(X) is only considered in MOZART and AM3-LM3 DD. In MOZART the presence of dew more than doubles vd(SO2) but reduces vd(NH3) below 25 ∘C. In contrast, both vd(NH3) and vd(SO2) increase in AM3-LM3–DD when the canopy is wet, which is supported by observations (Erisman et al., 1994, 1999; Massad et al., 2010). AM3-LM3–DD also accounts for the modulation of Rsf,v(SO2) and Rsf,v(NH3) by the acidity of the surface. Our results suggest that when αSN=2 , i.e., when the deposition of acids is twice as large as the deposition of bases, the impact of co-deposition can be greater than that of canopy wetness. Our comparison suggests that the implementation of the Wesely scheme in MOZART, AM3-LM3 DD, and GEOS-Chem produce similar vd(SO2) and vd(NH3) (within 50 %) under dry conditions and for temperatures close to 20 ∘C. However, differences in the sensitivity of vd(SO2) and vd(NH3) to environmental conditions (temperature, wetness, acidity) can result in large differences (>2). Such differences highlight the need for detailed evaluation of vd(X) across a wide range of conditions and chemical species (Wu et al., 2018).
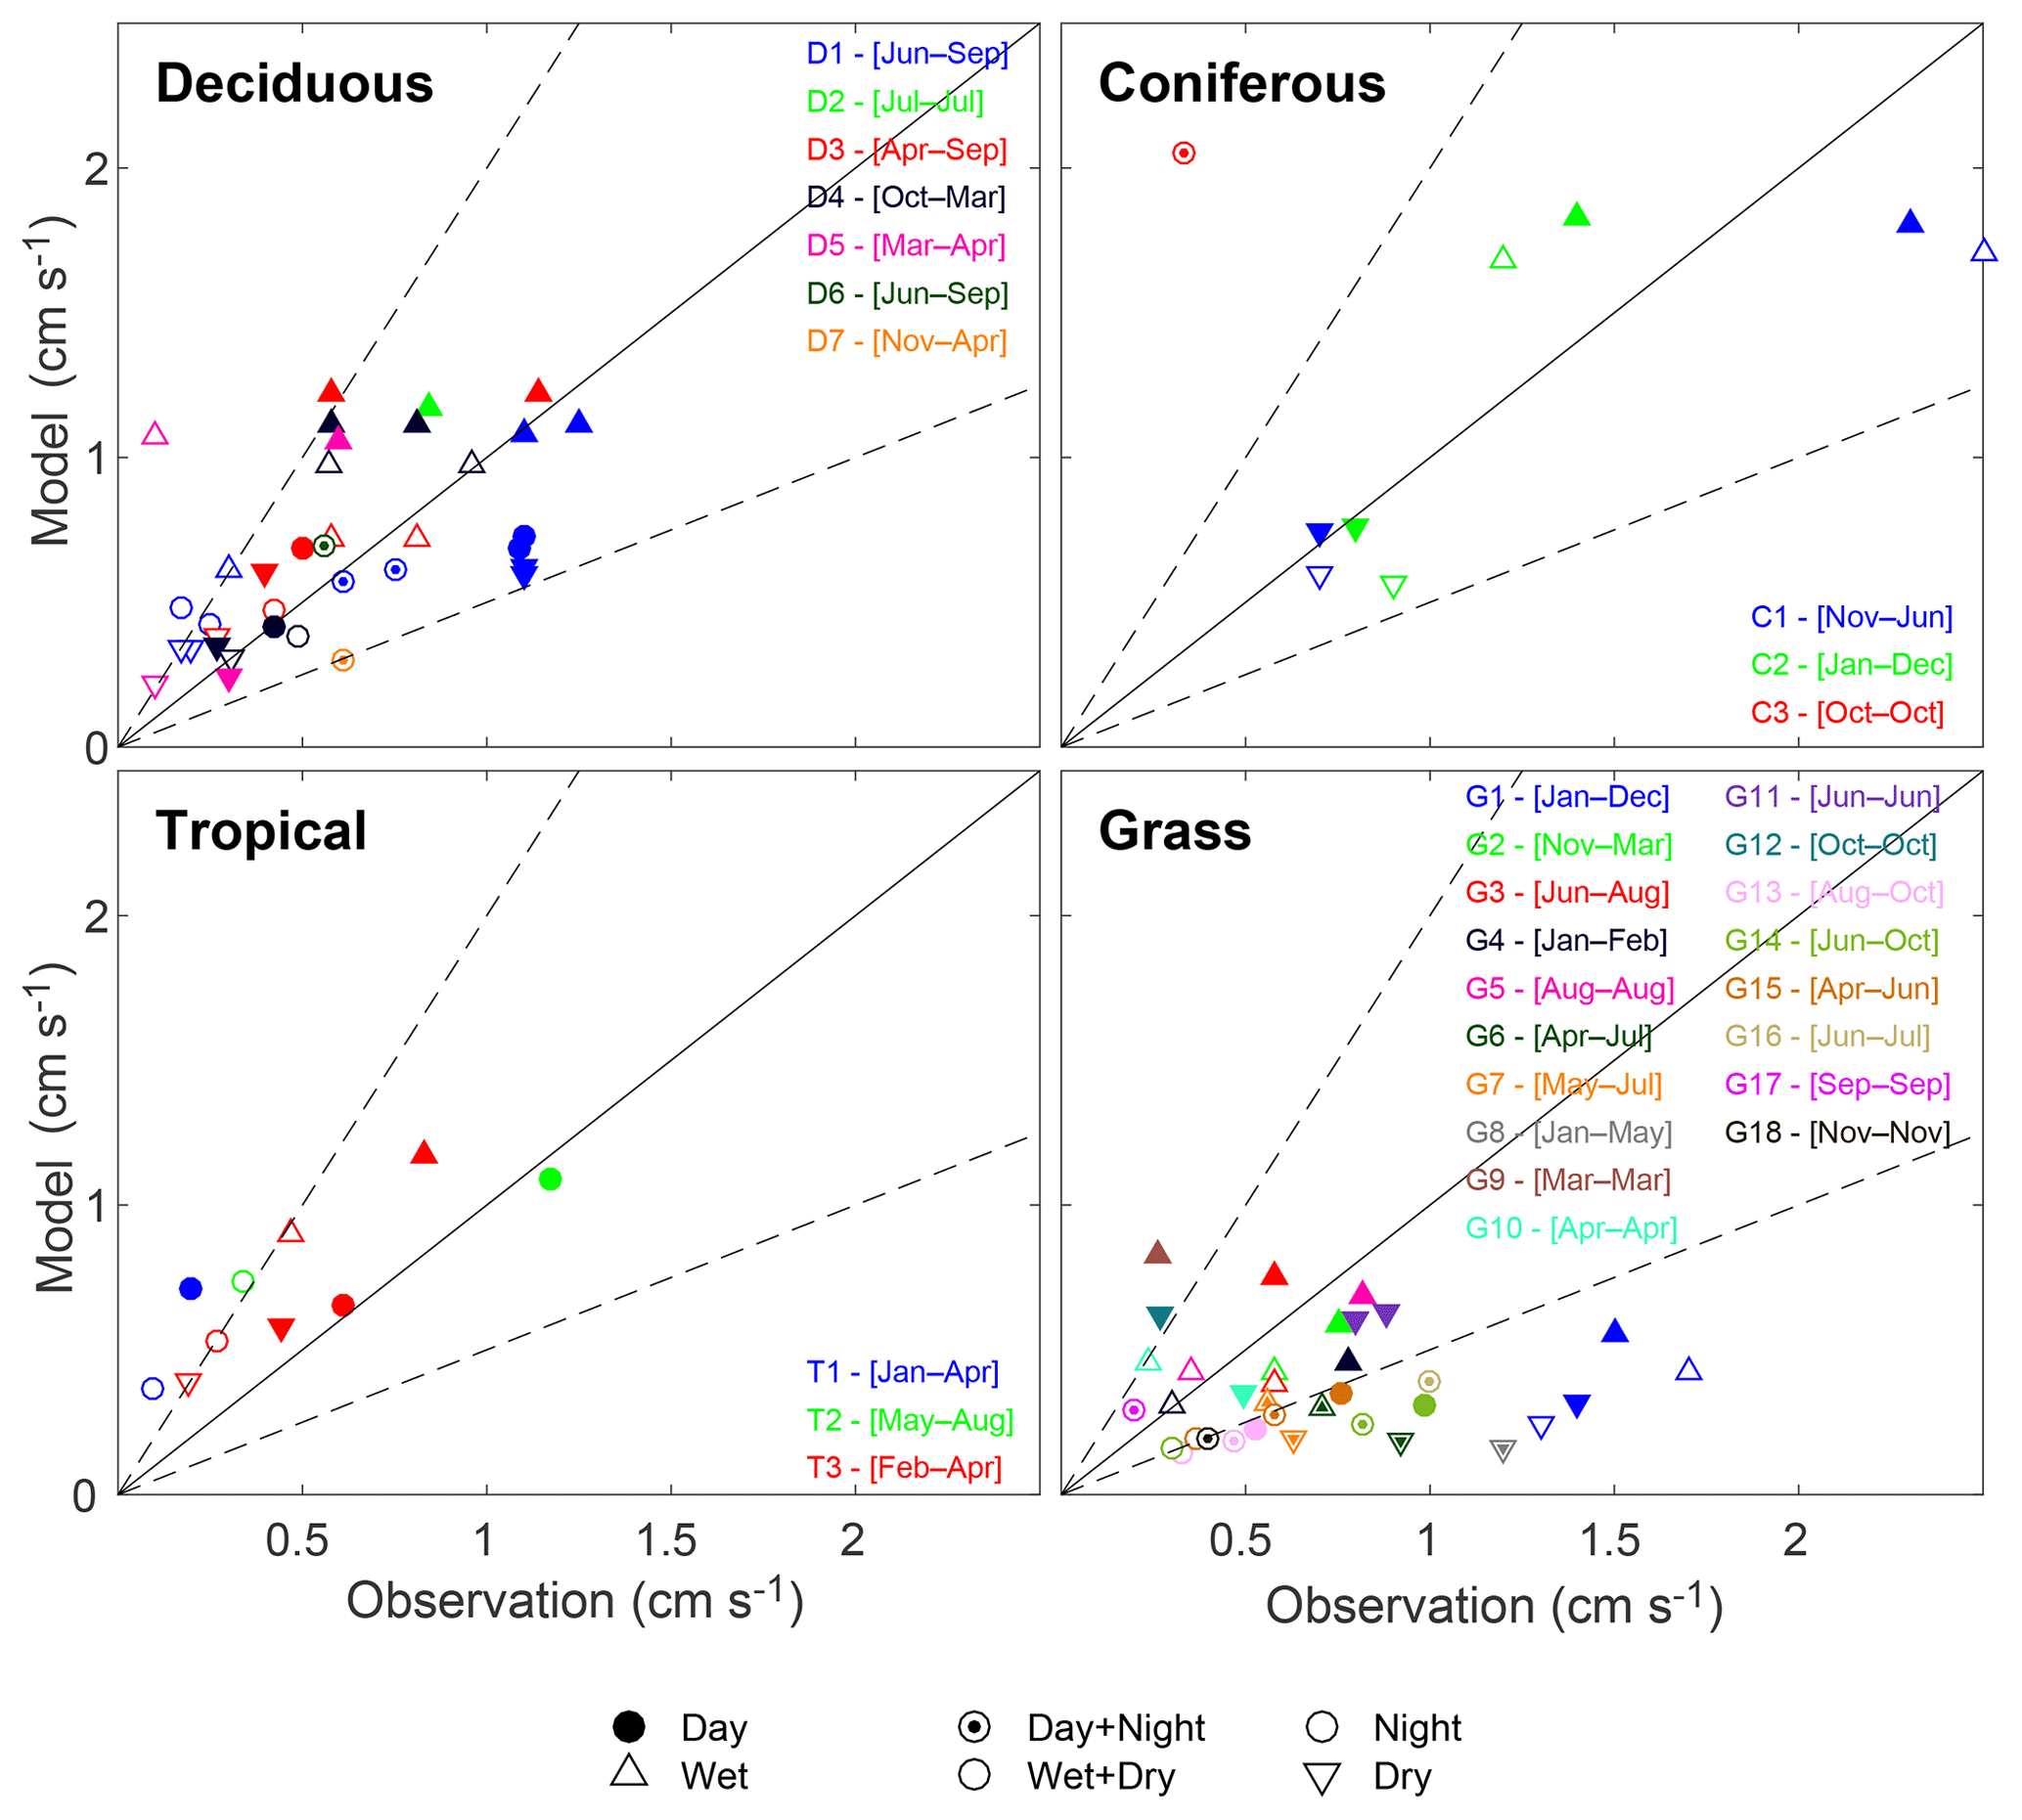
Figure 3Observed and simulated deposition velocities of SO2 for different vegetation types. The symbol shape indicates the canopy status: wet (upward pointing triangle), dry (downward point triangle), and circle (average). The symbol fill indicates the time period: filled (day), half-filled (day+night), and empty (night). The monthly diurnal cycle of deposition velocities simulated by AM3-LM3-DD (R2010 simulation) is sampled at each observation site in the tile that best represents the observed ecosystem accounting for the month, time of day, and canopy wetness status when the observations were collected. References for the different sites are given in Table S3.
3.1.1 vd(SO2)
We first evaluate the simulated present-day (R2010) vd(SO2) against a compilation of field-based vd(SO2) observations (Table S3). We sample the simulated monthly vd(SO2) at the location of the measurements in the tile that best represents the type of vegetation reported in the observations. When observations are available, we further distinguish between daytime and nighttime as well as wet and dry conditions. For daytime and nighttime observations, we sample the model from 08:00 LT to 17:00 LT and 22:00 LT to 04:00 LT, respectively. For wet conditions, we sample the model when the canopy wetness is greater than 10 %.
Figure 3 shows observed and simulated vd(SO2) grouped among the four types of vegetation simulated by LM3 (deciduous, coniferous, tropical, and grass).
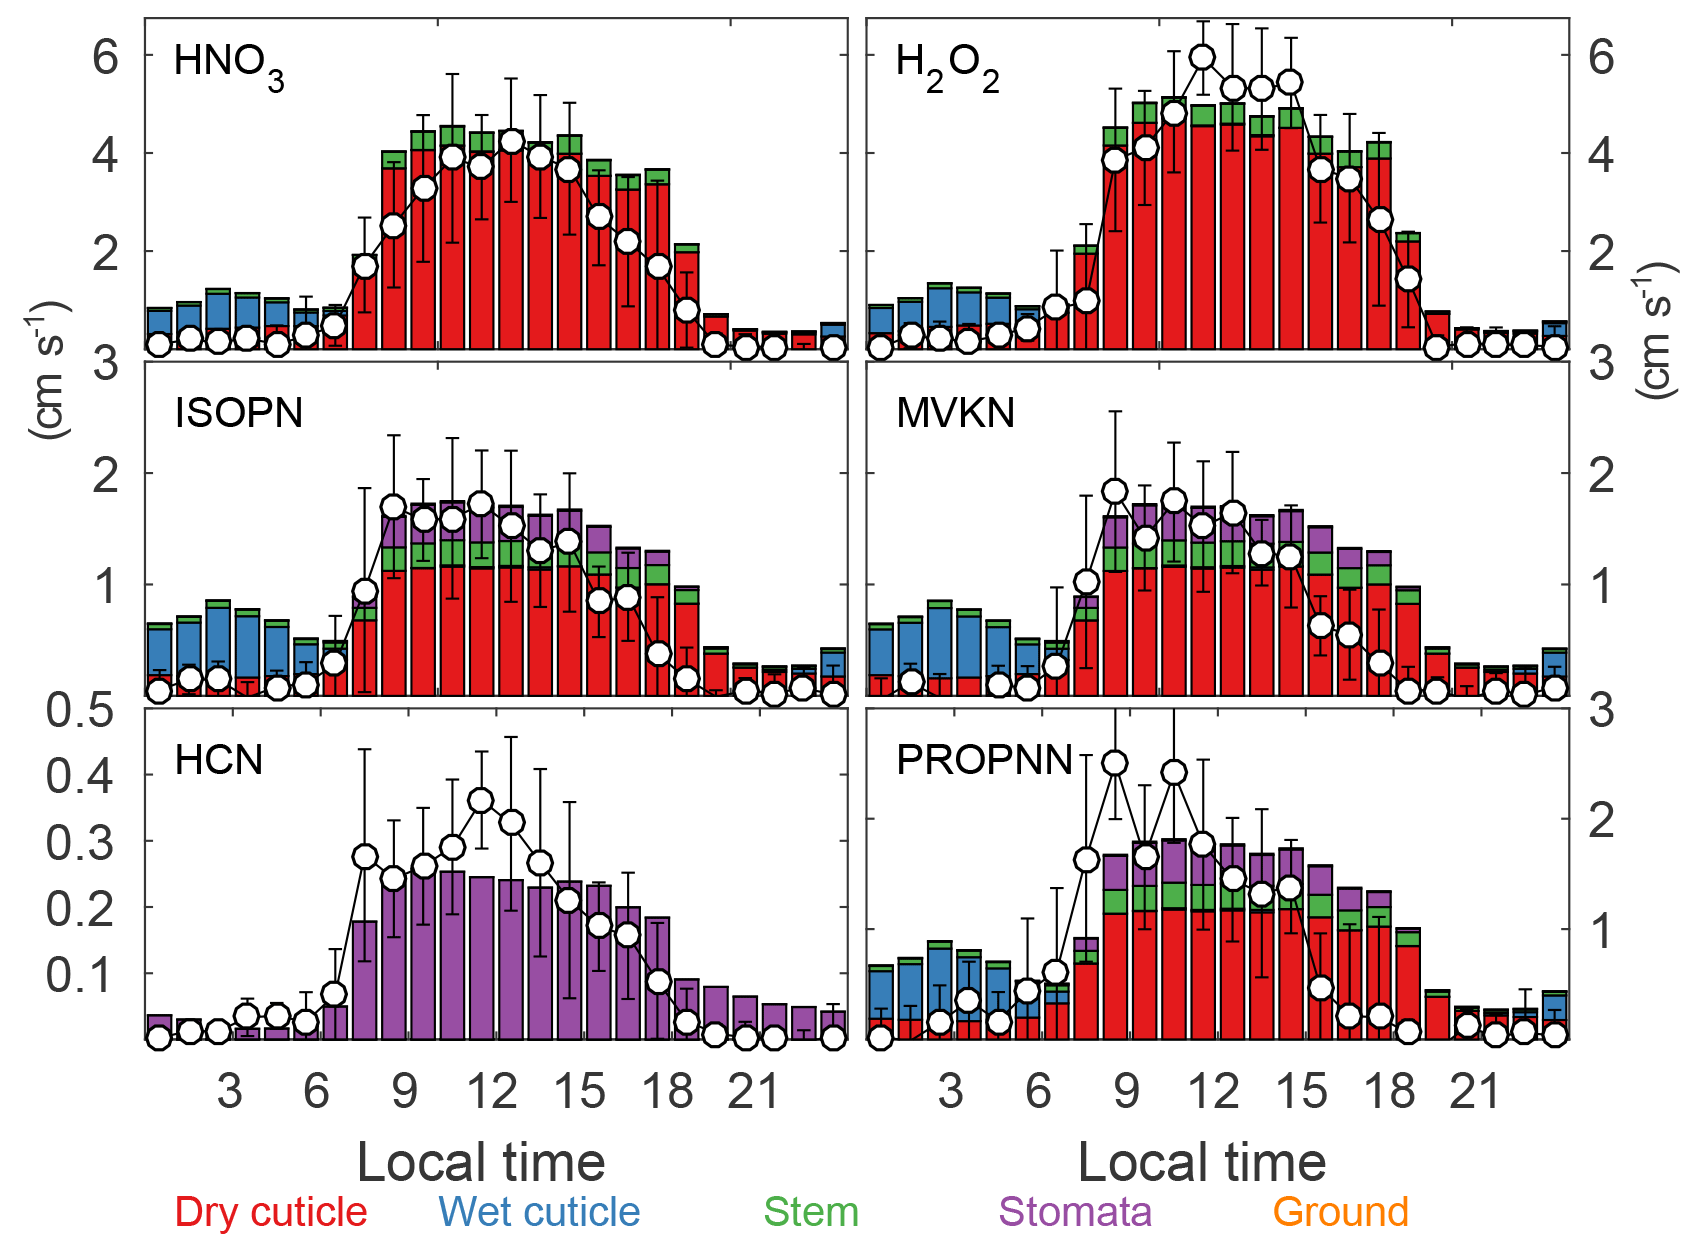
Figure 4Observed (circles ± standard deviation) and simulated (bars) dry deposition velocities for several nitrogen-containing species and hydrogen peroxide over the Talladega National Forest (southeastern US) in June 2013 (5 days; Nguyen et al., 2015). The bar colors indicate the contribution of the different surfaces to the overall surface removal of the chemical tracer.
Simulated deposition velocities generally fall within a factor of 2 of the observations, with better agreement during the day than at night, when the model is biased high. This uncertainty range is similar to that reported by Wu et al. (2018) in different dry deposition models. More specifically, AM3-LM3-DD qualitatively captures the range of deposition velocities over forested ecosystems, including the slower deposition of SO2 in winter than in summer and under dry than under wet conditions in deciduous forests, and the fast removal of SO2 over coniferous forests. However, the model fails to capture the elevated vd(SO2) (>1 cm s−1) reported by several studies over grasslands. This may reflect uncertainties in the representation of ammonia emissions (e.g., no sub-grid heterogeneity), which could result in an underestimate of SO2-NH3 co-deposition over crops or fertilized grasslands (Flechard et al., 2013; Nemitz et al., 2001).
3.1.2
Figure 4 shows the observed deposition velocities for HNO3, a range of organic nitrates (ISOPN, MVKN, PROPNN) derived from isoprene photooxidation (Paulot et al., 2009), HCN, and H2O2. We refer the reader to Nguyen et al. (2015) for information regarding the site and Caltech observations. We compare these observations with the simulated deposition velocities at this site decomposed into its stomatal, cuticle (wet and dry), stem, and ground components.
To facilitate the comparison between simulated and observed deposition velocities, we use meteorological fields (wind speed, temperature, precipitation, and downward radiation) from the Modern-Era Retrospective analysis for Research and Applications (MERRA) (Rienecker et al., 2011) to drive a stand-alone version of LM3-DD. This provides a more accurate representation of the site conditions than using meteorological fields simulated by AM3.
The compounds measured by Nguyen et al. (2015) have different chemical properties, allowing us to evaluate the representation of different deposition pathways in AM3-LM3–DD. In particular, HNO3 and H2O2 have negligible cuticular resistance () (Nguyen et al., 2015), such that (ground deposition is negligible). Figure 4 shows that LM3-DD captures both vd(H2O2) and vd(HNO3) well, including the faster deposition of H2O2 relative to HNO3, consistent with the dependence of Rb on (Eq. 5). In contrast, the low solubility and low reactivity at the leaf surface of HCN produces a large non-stomatal resistance ( s m−1, Nguyen et al., 2015), such that . A comparison of observed and modeled vd(HCN) suggests that the Leuning model captures the stomatal conductance well at this site. Since Ra, Rb,v, and Rs are well represented over the measurement period, we use observations of vd(ISOPN), vd(MVKN), and vd(PROPNN) at this site to estimate α and β for these organic nitrates (Eq. 10). We find that α=7 and β=1 provide a reasonable fit for all organic nitrates. These parameters imply that the deposition of isoprene-derived organic nitrates is primarily controlled by dry cuticles with small contributions of stomata and stems. We note that these parameters imply a much greater solubility and reactivity of organic nitrogen than in other models (e.g., α=0, β=0.5 in AURAMS; Zhang et al., 2002). While we use these parameters globally, such large differences warrant further investigations, as the deposition of organic nitrogen may account for over 25 % of the overall N deposition but remains rarely measured (Jickells et al., 2013).
Finally, we note that the comparison against SOAS observations points to a significant high bias in simulated nighttime deposition velocity. During this time period, the deposition is dominated by wet cuticles, which reflects the formation of dew in LM3. Since this bias is found for all species including those with little surface resistance (H2O2 and HNO3), it is likely to be associated with an underestimate of the stability of the nocturnal boundary layer.
3.2 Impact of land heterogeneities on present-day N deposition
Figure 5 shows the simulated dry deposition of oxidized N (dominated by HNO3) and reduced N (dominated by NH3) as well as the total N deposition (wet+dry) in North America. As noted in previous studies (Lamarque et al., 2013; Zhang et al., 2012), the overall pattern of N deposition mirrors the underlying distribution of NH3 and NO emissions, with high deposition in the Northeast and a greater contribution of reduced nitrogen to N deposition in the US Midwest and North Carolina than elsewhere in the eastern US.
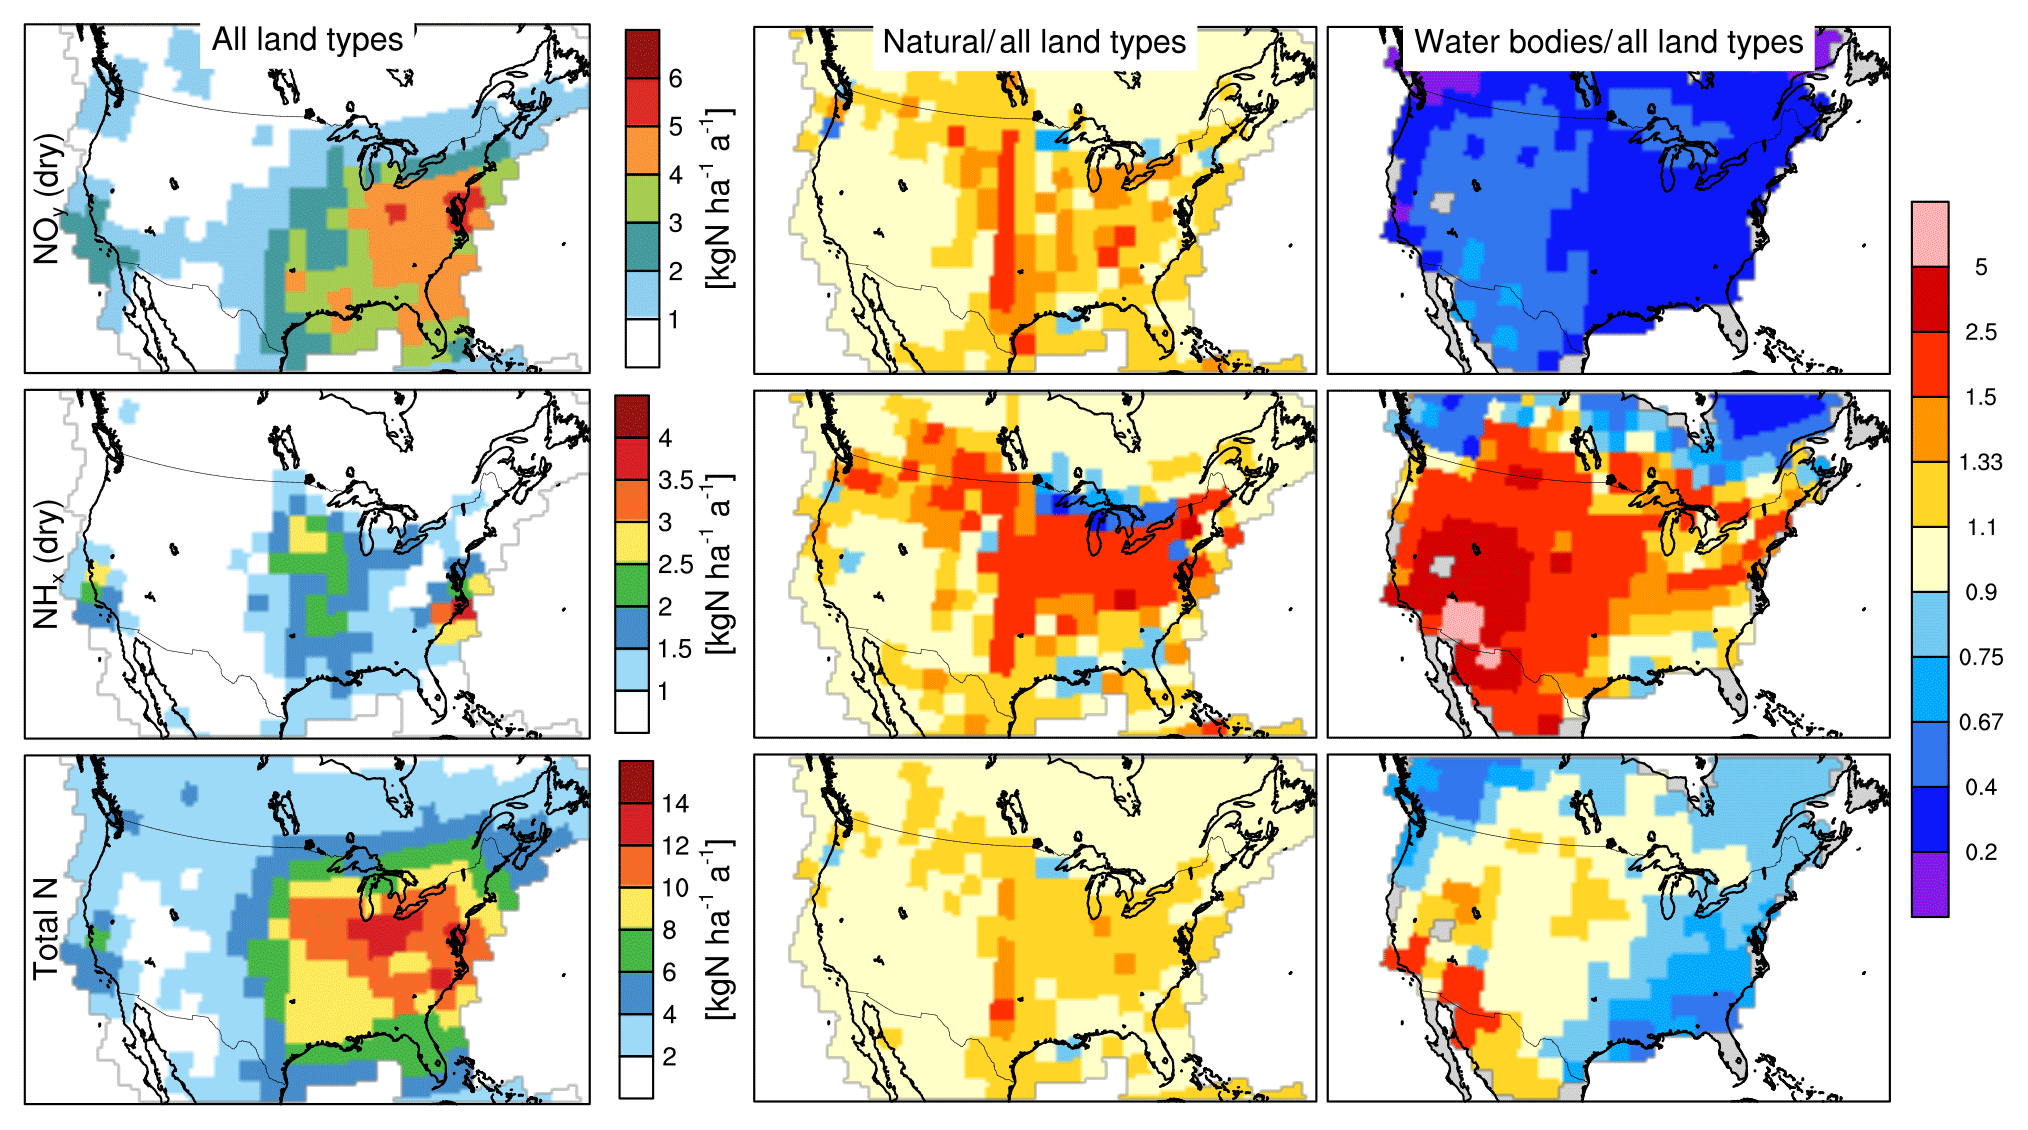
Figure 5Simulated reactive nitrogen deposition (left column) from dry oxidized nitrogen deposition (top row), dry reduced nitrogen deposition (middle row), and total nitrogen deposition (bottom row) over the 2008–2010 period. The ratio between the deposition on selected land types and the grid cell average deposition is shown in the middle (for natural vegetation) and right columns (water bodies).
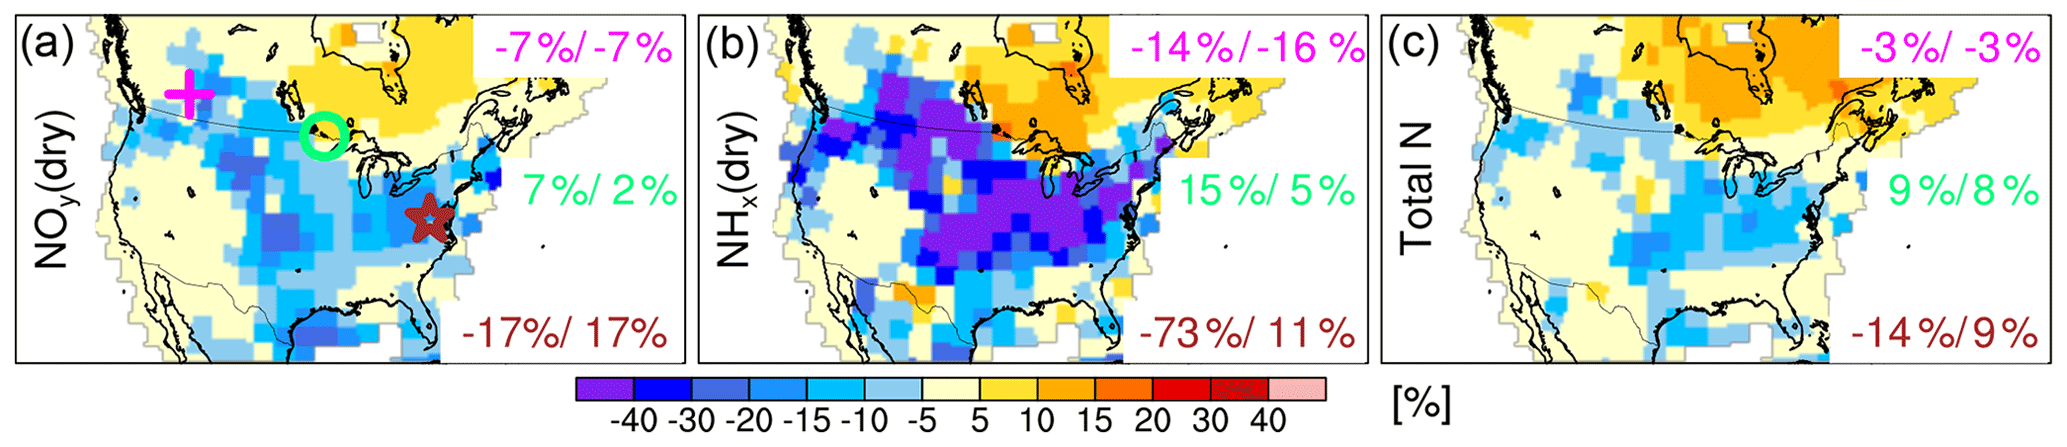
Figure 6Relative change in the 2008–2010 average land deposition of dry oxidized nitrogen (a), dry reduced nitrogen (b), and total nitrogen (c) associated with anthropogenic land-use change. The relative change is shown as (with land use − without land use) ∕ with land use. From top right to bottom right, the percentages indicate the change in N deposition at Banff National Park (cross), Voyageurs National Park (circle), and Shenandoah National Park (star) at the grid-box level and on natural vegetation, a better proxy for these parks.
The grid-cell average dry deposition represents the area-weighted sum of the deposition fluxes to the tiles that comprise each grid cell. Figure 5 (middle column) shows that N deposition over natural vegetation is generally greater than the grid-cell average, which is consistent with faster deposition velocities over forests relative to grasslands (Finkelstein, 2001; Hicks, 2006; and Fig. S1). Overall, the simulated total N deposition to natural ecosystems exceeds the grid-box average deposition by 10 % to 30 % over most of the eastern and central US. This enhancement is largest in regions where land-use change has caused a large decrease in vegetation height and LAI (e.g., in the US Midwest and Northeast, Fig. S2) and smallest in regions with little agricultural activity (e.g., most of Canada) or where managed vegetation differs little in height and LAI from natural vegetation (e.g., in the western US, Fig. S2). Figure 5 (middle column) also shows that the dry deposition of NHx exhibits a greater enhancement over natural vegetation than the dry deposition of NOy, consistent with the greater sensitivity of vd(NH3) than vd(HNO3) to surface properties (Fig. S3). The enhancements of the dry deposition of NHx over natural vegetation is likely to be underestimated in AM3-LM3-DD as the surface bidirectional exchange of NH3 tends to reduce its deposition in source regions.
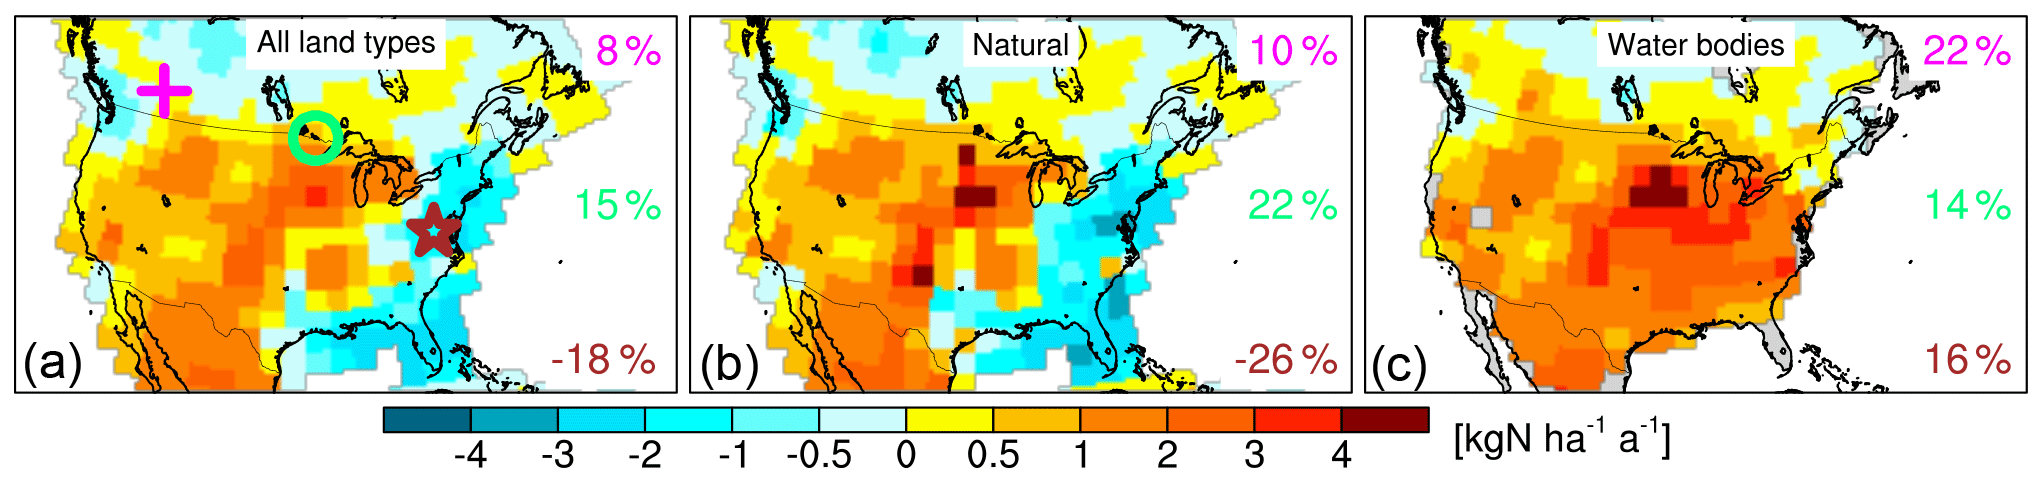
Figure 7Simulated change in reactive nitrogen deposition from 2010 to 2050 in the RCP8.5 scenario at the grid-box level (a), on natural tiles (b), and on water bodies (c). From top right to bottom right, the percentages indicate the change in N deposition at Banff National Park (cross), Voyageurs National Park (circle), and Shenandoah National Park (star) for each land type. The fractional change in N deposition over the contiguous US is indicated in the inset (bottom left).
Figure 5 (right column) also shows that water bodies receive more reduced N but less oxidized N through dry deposition than the grid-box average. These differences can be attributed to the large effective solubility of NH3 in freshwater, which results in lower Rsf,g(NH3) than over vegetated surfaces (Rsf,g(HNO3) is low over all surfaces). Our model suggests that vd(HNO3) is generally slower over water bodies than over vegetated surfaces because of the lower roughness height of water bodies (see Fig. S3). The westward increase in the ratio of NH3 to NO emissions thus results in water bodies receiving less N than the average grid cell in the eastern US and Canada but more in the central and western US.
3.3 Impact of anthropogenic land-use change on present-day N deposition
Figure 6 shows the change in dry NOy, dry NHx, and total N deposition associated with anthropogenic land-use change, which is estimated by comparing R2010 and R2010_no_lu. We find that anthropogenic land-use change reduces dry NOy, dry NHx, and total N deposition over the contiguous US by 8 %, 26 %, and 6 %, respectively. The reduction in N deposition associated with anthropogenic land-use change is largest in the central and eastern US, where deforestation has caused a large reduction in LAI and vegetation height (Fig. S2).
While anthropogenic land use is estimated to reduce the overall N deposition in the contiguous US, we find that it tends to increase the surface concentration of reactive nitrogen species, which leads to greater N deposition on the remaining natural vegetation. Figure 6 shows that land use has important implications for N deposition at national parks, which are best represented by natural vegetation tiles. For instance, we find that anthropogenic land-use change is associated with a 14 % reduction in the overall N deposition in the region of Shenandoah National Park, but an increase of 9 % on natural vegetation in the same grid box. The slower removal of N near source regions also facilitates N export to remote regions, such as eastern Canada, where N deposition (primarily through wet deposition) increases by more than 10 %. This suggests that anthropogenic land-use change in North America has contributed to the increase of N deposition to natural ecosystems both near source regions and in remote receptor regions.
3.4 Implications for future N deposition
Figure 7 shows the simulated difference between N deposition in 2008–2010 (R2010) and 2050 (R2050). This difference reflects changes in anthropogenic emissions as well as changes in climate and land properties induced by climate and land-use change. Total N deposition is projected to increase by 9 % over the contiguous US. Most of the increase is driven by greater deposition in the Midwest and western US associated with higher NH3 emissions (+40 %). In contrast, N deposition is projected to decrease in the eastern US following the decrease of NO emissions (−47 %, mostly in the eastern US).
We find a small increase (<10 %) in the deposition velocity of HNO3 over most of the US between R2010 and R2050 (Fig. S4). This is attributed to a reduction in the land fraction devoted to agriculture in RCP8.5 between 2010 and 2050 (Davies-Barnard et al., 2014), which results in taller vegetation and higher LAI. The impact of this change in land use between 2010 and 2050 is larger for vd(NH3), which increases by more >10 % over most of the Midwest and eastern US. However, in the eastern and Midwest US, this increase is more than compensated by a reduction in acid deposition, which results in an overall decrease of vd(NH3) of 10 % to 20 % over most of the eastern US. This highlights the need to better characterize the impact of the co-deposition of acids and ammonia on the removal of ammonia to improve projection of future N deposition.
Figure 7 also shows that trends in N deposition simulated for all land types tend to be amplified over natural vegetation, because of the faster deposition velocities as discussed earlier. In contrast, water bodies are projected to experience an increase in N deposition over most of the US, including in regions which experience an overall decrease in N deposition. This contrast is driven by the faster removal of NH3 over water relative to managed vegetation, which results in greater sensitivity to changes in the emissions of reduced N. The different responses of N deposition on natural tiles and water tiles are important for projections of N deposition in national parks, where N deposition to both vegetation and water bodies is of concern. For instance, the changes in N deposition to natural vegetation from 2010 to 2050 at Voyageurs and Shenandoah national parks are 30 % greater than simulated in the grid box where they are located, while N deposition to water bodies in the Shenandoah region is projected to increase by 16 %, even though overall N deposition for the grid decreases by 18 % in this region.
Our study highlights the importance of accounting for surface heterogeneities and anthropogenic land use in modulating the magnitude and trend of N deposition. Here, we leverage the tiled structure of the GFDL land model to efficiently represent the sub-grid scale heterogeneity of surface properties and their evolution in a changing climate. We have shown that the shift of N emissions from oxidized to reduced N in North America will exacerbate the sensitivity of N deposition to small-scale heterogeneities, which highlights the need to improve the representation of non-stomatal surface resistances (Rsf,v, Rsf,s, and Rsf,g) including their modulation by canopy wetness and acidity (Flechard et al., 2013; Wentworth et al., 2016; Wu et al., 2018).
Our approach is best suited to long timescales (decadal to centennial) and is complementary to ongoing efforts to improve the representation of present-day N deposition using a combination of high-resolution models and observations (Schwede and Lear, 2014). Future work will aim at coupling the representation of dry deposition presented here to the N cycle in the GFDL land model (Gerber et al., 2010), which will enable us to represent the bidirectional exchange of NH3 (Bash et al., 2013; Flechard et al., 2013; Nemitz et al., 2001) and improve our understanding of the impact of N deposition on ecosystems and carbon cycling (Fleischer et al., 2013, 2015; Janssens et al., 2010; Magnani et al., 2007).
Model outputs are available upon request to Fabien Paulot. Instruction to run the AM3 model are available at https://www.gfdl.noaa.gov/am3/ (last access: 14 December 2018).
The supplement related to this article is available online at: https://doi.org/10.5194/acp-18-17963-2018-supplement.
FP designed the research, developed and implemented the dry deposition model with help from SM, and performed the simulations and analysis. TN and JDC collected the observations at SOAS and estimated the deposition velocities. FP wrote the paper with inputs from SM, TN, JDC, ES, and LWH.
The authors declare that they have no conflict of interest.
The statements, findings, conclusions, and recommendations are those of the authors and do not necessarily reflect the views of NOAA.
This study was supported by the NOAA Climate Program Office's Atmospheric
Chemistry, Carbon Cycle, and Climate program (grant no. NA14OAR4320106). Caltech observations and John D. Crounse
were supported by the NSF (grant no. AGS-1240604). We thank Vaishali Naik, Arlene Fiore,
Jordan Schnell, and three anonymous reviewers
for helpful comments.
Edited by: Ronald Cohen
Reviewed by: three anonymous referees
Baron, J. S., Hall, E. K., Nolan, B. T., Finlay, J. C., Bernhardt, E. S., Harrison, J. A., Chan, F., and Boyer, E. W.: The interactive effects of excess reactive nitrogen and climate change on aquatic ecosystems and water resources of the United States, Biogeochemistry, 114, 71–92, https://doi.org/10.1007/s10533-012-9788-y, 2012. a
Bash, J. O., Cooter, E. J., Dennis, R. L., Walker, J. T., and Pleim, J. E.: Evaluation of a regional air-quality model with bidirectional NH3 exchange coupled to an agroecosystem model, Biogeosciences, 10, 1635–1645, https://doi.org/10.5194/bg-10-1635-2013, 2013. a
Bobbink, R., Hicks, K., Galloway, J., Spranger, T., Alkemade, R., Ashmore, M., Bustamante, M., Cinderby, S., Davidson, E., Dentener, F., Emmett, B., Erisman, J.-W., Fenn, M., Gilliam, F., Nordin, A., Pardo, L., and De Vries, W.: Global assessment of nitrogen deposition effects on terrestrial plant diversity: a synthesis, Ecol. Appl., 20, 30–59, 2010. a
Bonan, G. B.: Land surface model (LSM version 1.0) for ecological, hydrological, and atmospheric studies: Technical description and users guide, Technical note, Tech. rep., National Center for Atmospheric Research, Boulder, CO (United States), Climate and Global Dynamics Div., 1996. a
Bondeau, A., Smith, P., Zaehle, S., Schaphoff, S., Lucht, W., Cramer, W., Gerten, D., Lotze-Campen, H., Müller, C., Reichstein, M., et al.: Modelling the role of agriculture for the 20th century global terrestrial carbon balance, Glob. Change Biol., 13, 679–706, 2007. a
Bytnerowicz, A., Johnson, R., Zhang, L., Jenerette, G., Fenn, M., Schilling, S., and Gonzalez-Fernandez, I.: An empirical inferential method of estimating nitrogen deposition to Mediterranean-type ecosystems: the San Bernardino Mountains case study, Environ. Pollut., 203, 69–88, https://doi.org/10.1016/j.envpol.2015.03.028, 2015. a
Choudhury, B. J. and Monteith, J. L.: A four-layer model for the heat budget of homogeneous land surfaces, Q. J. Roy. Meteor. Soc., 114, 373–398, https://doi.org/10.1002/qj.49711448006, 1988. a
Davies-Barnard, T., Valdes, P. J., Singarayer, J. S., Pacifico, F. M., and Jones, C. D.: Full effects of land use change in the representative concentration pathways, Environ. Res. Lett., 9, 114014, https://doi.org/10.1088/1748-9326/9/11/114014, 2014. a
Dentener, F., Drevet, J., Lamarque, J. F., Bey, I., Eickhout, B., Fiore, A. M., Hauglustaine, D., Horowitz, L. W., Krol, M., Kulshrestha, U. C., Lawrence, M., Galy-Lacaux, C., Rast, S., Shindell, D., Stevenson, D., Van Noije, T., Atherton, C., Bell, N., Bergman, D., Butler, T., Cofala, J., Collins, B., Doherty, R., Ellingsen, K., Galloway, J., Gauss, M., Montanaro, V., Müller, J. F., Pitari, G., Rodriguez, J., Sanderson, M., Solmon, F., Strahan, S., Schultz, M., Sudo, K., Szopa, S., and Wild, O.: Nitrogen and sulfur deposition on regional and global scales: A multimodel evaluation, Global Biogeochem. Cy., 20, B4003, https://doi.org/10.1029/2005GB002672, 2006. a, b
De Schrijver, A., Staelens, J., Wuyts, K., Van Hoydonck, G., Janssen, N., Mertens, J., Gielis, L., Geudens, G., Augusto, L., and Verheyen, K.: Effect of vegetation type on throughfall deposition and seepage flux, Environ. Pollut., 153, 295–303, 2008. a
de Vries, W., Hettelingh, J.-P., and Posch, M. (Eds.): Critical Loads and Dynamic Risk Assessments, vol. 25 of Environmental Pollution, Springer Netherlands, Dordrecht, 2015. a, b
Devaraju, N., Bala, G., Caldeira, K., and Nemani, R.: A model based investigation of the relative importance of CO2-fertilization, climate warming, nitrogen deposition and land use change on the global terrestrial carbon uptake in the historical period, Clim. Dynam., 47, 173–190, https://doi.org/10.1007/s00382-015-2830-8, 2015. a
Dezi, S., Medlyn, B. E., Tonon, G., and Magnani, F.: The effect of nitrogen deposition on forest carbon sequestration: a model-based analysis, Glob. Change Biol., 16, 1470–1486, 2010. a
Dirnböck, T., Foldal, C., Djukic, I., Kobler, J., Haas, E., Kiese, R., and Kitzler, B.: Historic nitrogen deposition determines future climate change effects on nitrogen retention in temperate forests, Climatic Change, 144, 221–235, https://doi.org/10.1007/s10584-017-2024-y, 2017. a
Dise, N. B.: The European Nitrogen Assessment: Sources, Effects and Policy Perspectives, chap. 20, Cambridge University Press, 2011. a
Donner, L. J., Wyman, B. L., Hemler, R. S., Horowitz, L. W., Ming, Y., Zhao, M., Golaz, J.-C., Ginoux, P., Lin, S.-J., Schwarzkopf, M. D., Austin, J., Alaka, G., Cooke, W. F., Delworth, T. L., Freidenreich, S. M., Gordon, C. T., Griffies, S. M., Held, I. M., Hurlin, W. J., Klein, S. A., Knutson, T. R., Langenhorst, A. R., Lee, H.-C., Lin, Y., Magi, B. I., Malyshev, S. L., Milly, P. C. D., Naik, V., Nath, M. J., Pincus, R., Ploshay, J. J., Ramaswamy, V., Seman, C. J., Shevliakova, E., Sirutis, J. J., Stern, W. F., Stouffer, R. J., Wilson, R. J., Winton, M., Wittenberg, A. T., and Zeng, F.: The Dynamical Core, Physical Parameterizations, and Basic Simulation Characteristics of the Atmospheric Component AM3 of the GFDL Global Coupled Model CM3, J. Climate, 24, 3484–3519, 2011. a
Dore, A., Vieno, M., Tang, Y., Dragosits, U., Dosio, A., Weston, K., and Sutton, M.: Modelling the atmospheric transport and deposition of sulphur and nitrogen over the United Kingdom and assessment of the influence of SO2 emissions from international shipping, Atmos. Environ., 41, 2355–2367, https://doi.org/10.1016/j.atmosenv.2006.11.013, 2007. a
Dore, A. J., Kryza, M., Hall, J. R., Hallsworth, S., Keller, V. J. D., Vieno, M., and Sutton, M. A.: The influence of model grid resolution on estimation of national scale nitrogen deposition and exceedance of critical loads, Biogeosciences, 9, 1597–1609, https://doi.org/10.5194/bg-9-1597-2012, 2012. a
Ellis, R. A., Jacob, D. J., Sulprizio, M. P., Zhang, L., Holmes, C. D., Schichtel, B. A., Blett, T., Porter, E., Pardo, L. H., and Lynch, J. A.: Present and future nitrogen deposition to national parks in the United States: critical load exceedances, Atmos. Chem. Phys., 13, 9083–9095, https://doi.org/10.5194/acp-13-9083-2013, 2013. a, b
Emmons, L. K., Walters, S., Hess, P. G., Lamarque, J.-F., Pfister, G. G., Fillmore, D., Granier, C., Guenther, A., Kinnison, D., Laepple, T., Orlando, J., Tie, X., Tyndall, G., Wiedinmyer, C., Baughcum, S. L., and Kloster, S.: Description and evaluation of the Model for Ozone and Related chemical Tracers, version 4 (MOZART-4), Geosci. Model Dev., 3, 43–67, https://doi.org/10.5194/gmd-3-43-2010, 2010. a
Erisman, J. W.: Evaluation of a surface resistance parametrization of sulphur dioxide, Atmos. Environ., 28, 2583–2594, 1994. a, b
Erisman, J. W., Pul, A. V., and Wyers, P.: Parametrization of surface resistance for the quantification of atmospheric deposition of acidifying pollutants and ozone, Atmos. Environ., 28, 2595–2607, https://doi.org/10.1016/1352-2310(94)90433-2, 1994. a, b
Erisman, J. W., Hogenkamp, J. E. M., Putten, E. M. v., Uiterwijk, J. W., Kemkers, E., Wiese, C. J., and Mennen, M. G.: Long-term Continuous Measurements of SO2 Dry Deposition over the Speulder Forest, Water Air Soil Poll., 109, 237–262, https://doi.org/10.1023/A:1005097722854, 1999. a
Erisman, J. W., Galloway, J. N., Seitzinger, S., Bleeker, A., Dise, N. B., Petrescu, A. M. R., Leach, A. M., and Vries, W. D.: Consequences of human modification of the global nitrogen cycle, Philos. T. R. Soc. B, 368, 1621, https://doi.org/10.1098/rstb.2013.0116, 2013. a
Finkelstein, P. L.: Deposition Velocities of SO2 and O3 over Agricultural and Forest Ecosystems, Water Air Soil Poll., 1, 49–57, 2001. a
Flechard, C. R., Massad, R.-S., Loubet, B., Personne, E., Simpson, D., Bash, J. O., Cooter, E. J., Nemitz, E., and Sutton, M. A.: Advances in understanding, models and parameterizations of biosphere-atmosphere ammonia exchange, Biogeosciences, 10, 5183–5225, https://doi.org/10.5194/bg-10-5183-2013, 2013. a, b, c, d
Fleischer, K., Rebel, K. T., van der Molen, M. K., Erisman, J. W., Wassen, M. J., van Loon, E. E., Montagnani, L., Gough, C. M., Herbst, M., Janssens, I. A., Gianelle, D., and Dolman, A. J.: The contribution of nitrogen deposition to the photosynthetic capacity of forests, Global Biogeochem. Cy., 27, 187–199, 2013. a, b, c
Fleischer, K., Wårlind, D., van der Molen, M. K., Rebel, K. T., Arneth, A., Erisman, J. W., Wassen, M. J., Smith, B., Gough, C. M., Margolis, H. A., Cescatti, A., Montagnani, L., Arain, A., and Dolman, A. J.: Low historical nitrogen deposition effect on carbon sequestration in the boreal zone, J. Geophys. Res.-Biogeo., 120, 2542–2561, https://doi.org/10.1002/2015jg002988, 2015. a, b, c
Fowler, D., Coyle, M., Skiba, U., Sutton, M. A., Cape, J. N., Reis, S., Sheppard, L. J., Jenkins, A., Grizzetti, B., Galloway, J. N., Vitousek, P., Leach, A., Bouwman, A. F., Butterbach-Bahl, K., Dentener, F., Stevenson, D., Amann, M., and Voss, M.: The global nitrogen cycle in the twenty-first century, Philos. T. R. Soc. Lon. B, 368, 20130164, https://doi.org/10.1098/rstb.2013.0164, 2013. a
Gerber, S., Hedin, L. O., Oppenheimer, M., Pacala, S. W., and Shevliakova, E.: Nitrogen cycling and feedbacks in a global dynamic land model, Global Biogeochem. Cy., 24, GB1001, https://doi.org/10.1029/2008gb003336, 2010. a
Grizzetti, B.: The European Nitrogen Assessment: Sources, Effects and Policy Perspectives, chap. 17, Cambridge University Press, 2011. a
Guenther, A., Karl, T., Harley, P., Wiedinmyer, C., Palmer, P. I., and Geron, C.: Estimates of global terrestrial isoprene emissions using MEGAN (Model of Emissions of Gases and Aerosols from Nature), Atmos. Chem. Phys., 6, 3181–3210, https://doi.org/10.5194/acp-6-3181-2006, 2006. a
Gundale, M. J., From, F., Bach, L. H., and Nordin, A.: Anthropogenic nitrogen deposition in boreal forests has a minor impact on the global carbon cycle, Glob. Change Biol., 20, 276–286, 2014. a
Hertel, O.: The European Nitrogen Assessment: Sources, Effects and Policy Perspectives, chap. 14, Cambridge University Press, 2011. a
Hicks, B. B.: Dry deposition to forests – On the use of data from clearings, Agr. Forest Meteorol., 136, 214–221, https://doi.org/10.1016/j.agrformet.2004.06.013, 2006. a, b
Hicks, B. B.: On Estimating Dry Deposition Rates in Complex Terrain, J. Appl. Meteorol. Clim., 47, 1651–1658, 2008. a
Hicks, B. B., Baldocchi, D. D., Meyers, T. P., Hosker, R. P., and Matt, D. R.: A preliminary multiple resistance routine for deriving dry deposition velocities from measured quantities, Water Air Soil Poll., 36, 311–330, 1987. a, b, c
Högberg, P.: What is the quantitative relation between nitrogen deposition and forest carbon sequestration?, Glob. Change Biol., 18, 1–2, 2012. a, b
Huang, L., McDonald-Buller, E. C., McGaughey, G., Kimura, Y., and Allen, D. T.: The impact of drought on ozone dry deposition over eastern Texas, Atmos. Environ., 127, 176–186, https://doi.org/10.1016/j.atmosenv.2015.12.022, 2016. a
Hurtt, G. C., Chini, L. P., Frolking, S., Betts, R. A., Feddema, J., Fischer, G., Fisk, J. P., Hibbard, K., Houghton, R. A., Janetos, A., Jones, C. D., Kindermann, G., Kinoshita, T., Goldewijk, K. K., Riahi, K., Shevliakova, E., Smith, S., Stehfest, E., Thomson, A., Thornton, P., Vuuren, D. P. V., and Wang, Y. P.: Harmonization of land-use scenarios for the period 1500–2100: 600 years of global gridded annual land-use transitions, wood harvest, and resulting secondary lands, Climatic Change, 109, 117–161, 2011. a
Janssens, I. A., Dieleman, W., Luyssaert, S., Subke, J.-A., Reichstein, M., Ceulemans, R., Ciais, P., Dolman, A. J., Grace, J., Matteucci, G., Papale, D., Piao, S. L., Schulze, E.-D., Tang, J., and Law, B.: Reduction of forest soil respiration in response to nitrogen deposition, Nat. Geosci., 3, 315–322, 2010. a
Janssens-Maenhout, G., Crippa, M., Guizzardi, D., Dentener, F., Muntean, M., Pouliot, G., Keating, T., Zhang, Q., Kurokawa, J., Wankmüller, R., Denier van der Gon, H., Kuenen, J. J. P., Klimont, Z., Frost, G., Darras, S., Koffi, B., and Li, M.: HTAP_v2.2: a mosaic of regional and global emission grid maps for 2008 and 2010 to study hemispheric transport of air pollution, Atmos. Chem. Phys., 15, 11411–11432, https://doi.org/10.5194/acp-15-11411-2015, 2015. a
Jensen, N. O. and Hummelshøj, P.: Derivation of canopy resistance for water vapour fluxes over a spruce forest, using a new technique for the viscous sublayer resistance, Agr. Forest Meteorol., 73, 339–352, 1995. a
Jensen, N. O. and Hummelshøj, P.: Erratum to “Derivation of canopy resistance for water vapour fluxes over a spruce forest using a new technique for the viscous sublayer resistance”, Agr. Forest Meteorol., 85, p. 289, https://doi.org/10.1016/S0168-1923(97)00024-5, 1997. a
Jickells, T., Baker, A. R., Cape, J. N., Cornell, S. E., and Nemitz, E.: The cycling of organic nitrogen through the atmosphere, Philos. T. R. Soc. Lon. B, 368, 20130115, https://doi.org/10.1098/rstb.2013.0115, 2013. a, b
Johansson, O., Palmqvist, K., and Olofsson, J.: Nitrogen deposition drives lichen community changes through differential species responses, Glob. Change Biol., 18, 2626–2635, 2012. a
Kalnay, E., Kanamitsu, M., Kistler, R., Collins, W., Deaven, D., Gandin, L., Iredell, M., Saha, S., White, G., Woollen, J., Zhu, Y., Leetmaa, A., Reynolds, R., Chelliah, M., Ebisuzaki, W., Higgins, W., Janowiak, J., Mo, K. C., Ropelewski, C., Wang, J., Jenne, R., and Joseph, D.: The NCEP/NCAR 40-Year Reanalysis Project, B. Am. Meteorol. Soc., 77, 437–471, 1996. a
Lamarque, J.-F., Kyle, G., Meinshausen, M., Riahi, K., Smith, S., van Vuuren, D., Conley, A., and Vitt, F.: Global and regional evolution of short-lived radiatively-active gases and aerosols in the Representative Concentration Pathways, Climatic Change, 109, 191–212, https://doi.org/10.1007/s10584-011-0155-0, 2011. a
Lamarque, J.-F., Dentener, F., McConnell, J., Ro, C.-U., Shaw, M., Vet, R., Bergmann, D., Cameron-Smith, P., Dalsoren, S., Doherty, R., Faluvegi, G., Ghan, S. J., Josse, B., Lee, Y. H., MacKenzie, I. A., Plummer, D., Shindell, D. T., Skeie, R. B., Stevenson, D. S., Strode, S., Zeng, G., Curran, M., Dahl-Jensen, D., Das, S., Fritzsche, D., and Nolan, M.: Multi-model mean nitrogen and sulfur deposition from the Atmospheric Chemistry and Climate Model Intercomparison Project (ACCMIP): evaluation of historical and projected future changes, Atmos. Chem. Phys., 13, 7997–8018, https://doi.org/10.5194/acp-13-7997-2013, 2013. a, b, c
Lepori, F. and Keck, F.: Effects of Atmospheric Nitrogen Deposition on Remote Freshwater Ecosystems, Ambio, 41, 235–246, https://doi.org/10.1007/s13280-012-0250-0, 2012. a
Leuning, R.: A critical appraisal of a combined stomatal-photosynthesis model for C3 plants, Plant Cell Environ., 18, 339–355, 1995. a
Levy, H., Horowitz, L. W., Schwarzkopf, M. D., Ming, Y., Golaz, J.-C., Naik, V., and Ramaswamy, V.: The roles of aerosol direct and indirect effects in past and future climate change, J. Geophys. Res.-Atmos., 118, 4521–4532, 2013. a
Li, Y., Schichtel, B. A., Walker, J. T., Schwede, D. B., Chen, X., Lehmann, C. M. B., Puchalski, M. A., Gay, D. A., and Collett, J. L.: Increasing importance of deposition of reduced nitrogen in the United States, P. Natl. Acad. Sci. USA, 113, 5874–5879, https://doi.org/10.1073/pnas.1525736113, 2016. a
Loubet, B., Cellier, P., Milford, C., and Sutton, M. A.: A coupled dispersion and exchange model for short-range dry deposition of atmospheric ammonia, Q. J. Roy. Meteor. Soc., 132, 1733–1763, 2006. a
Magnani, F., Mencuccini, M., Borghetti, M., Berbigier, P., Berninger, F., Delzon, S., Grelle, A., Hari, P., Jarvis, P. G., Kolari, P., Kowalski, A. S., Lankreijer, H., Law, B. E., Lindroth, A., Loustau, D., Manca, G., Moncrieff, J. B., Rayment, M., Tedeschi, V., Valentini, R., and Grace, J.: The human footprint in the carbon cycle of temperate and boreal forests, Nature, 447, 849–851, 2007. a, b
Malm, W. C., Rodriguez, M. A., Schichtel, B. A., Gebhart, K. A., Thompson, T. M., Barna, M. G., Benedict, K. B., Carrico, C. M., and Collett Jr., J. L.: A hybrid modeling approach for estimating reactive nitrogen deposition in Rocky Mountain National Park, Atmos. Environ., 126, 258–273, https://doi.org/10.1016/j.atmosenv.2015.11.060, 2016. a
Malyshev, S., Shevliakova, E., Stouffer, R. J., and Pacala, S. W.: Contrasting Local versus Regional Effects of Land-Use-Change-Induced Heterogeneity on Historical Climate: Analysis with the GFDL Earth System Model, J. Climate, 28, 5448–5469, 2015. a, b, c, d, e
Massad, R.-S., Nemitz, E., and Sutton, M. A.: Review and parameterisation of bi-directional ammonia exchange between vegetation and the atmosphere, Atmos. Chem. Phys., 10, 10359–10386, https://doi.org/10.5194/acp-10-10359-2010, 2010. a, b, c, d, e
Meunier, C. L., Gundale, M. J., Sánchez, I. S., and Liess, A.: Impact of nitrogen deposition on forest and lake food webs in nitrogen-limited environments, Glob. Change Biol., 22, 164–179, https://doi.org/10.1111/gcb.12967, 2016. a
Milly, P. C. D., Malyshev, S. L., Shevliakova, E., Dunne, K. A., Findell, K. L., Gleeson, T., Liang, Z., Phillipps, P., Stouffer, R. J., and Swenson, S.: An Enhanced Model of Land Water and Energy for Global Hydrologic and Earth-System Studies, J. Hydrometeorol., 15, 1739–1761, 2014. a, b, c
Naik, V., Horowitz, L. W., Fiore, A. M., Ginoux, P., Mao, J., Aghedo, A. M., and Levy, H.: Impact of preindustrial to present-day changes in short-lived pollutant emissions on atmospheric composition and climate forcing, J. Geophys. Res.-Atmos., 118, 8086–8110, 2013. a, b, c
Neirynck, J., Flechard, C. R., and Fowler, D.: Long-term (13 years) measurements of SO2 fluxes over a forest and their control by surface chemistry, Agr. Forest Meteorol., 151, 1768–1780, 2011. a
Nemitz, E., Milford, C., and Sutton, M. A.: A two-layer canopy compensation point model for describing bi-directional biosphere-atmosphere exchange of ammonia, Q. J. Roy. Meteor. Soc., 127, 815–833, 2001. a, b
Nguyen, T. B., Crounse, J. D., Teng, A. P., Clair, J. M. S., Paulot, F., Wolfe, G. M., and Wennberg, P. O.: Rapid deposition of oxidized biogenic compounds to a temperate forest, P. Natl. Acad. Sci. USA, 112, E392–E401, https://doi.org/10.1073/pnas.1418702112, 2015. a, b, c, d, e, f
Ochoa-Hueso, R., Allen, E. B., Branquinho, C., Cruz, C., Dias, T., Fen, M. E., Manrique, E., Pérez-Corona, M. E., Sheppard, L. J., and Stock, W. D.: Nitrogen deposition effects on Mediterranean-type ecosystems: An ecological assessment, Environ. Pollut., 159, 2265–2279, 2011. a
Pardo, L. H., Fenn, M. E., Goodale, C. L., Geiser, L. H., Driscoll, C. T., Allen, E. B., Baron, J. S., Bobbink, R., Bowman, W. D., Clark, C. M., Emmett, B., Gilliam, F. S., Greaver, T. L., Hall, S. J., Lilleskov, E. A., Liu, L., Lynch, J. A., Nadelhoffer, K. J., Perakis, S. S., Robin-Abbott, M. J., Stoddard, J. L., Weathers, K. C., and Dennis, R. L.: Effects of nitrogen deposition and empirical nitrogen critical loads for ecoregions of the United States, Ecol. Appl., 21, 3049–3082, 2011. a, b
Paulot, F., Crounse, J. D., Kjaergaard, H. G., Kroll, J. H., Seinfeld, J. H., and Wennberg, P. O.: Isoprene photooxidation: new insights into the production of acids and organic nitrates, Atmos. Chem. Phys., 9, 1479–1501, https://doi.org/10.5194/acp-9-1479-2009, 2009. a
Paulot, F., Jacob, D. J., and Henze, D. K.: Sources and Processes Contributing to Nitrogen Deposition: An Adjoint Model Analysis Applied to Biodiversity Hotspots Worldwide, Environ. Sci. Technol., 47, 3226–3233, 2013. a
Paulot, F., Jacob, D. J., Pinder, R. W., Bash, J. O., Travis, K., and Henze, D. K.: Ammonia emissions in the United States, European Union, and China derived by high-resolution inversion of ammonium wet deposition data: Interpretation with a new agricultural emissions inventory (MASAGE_NH3), J. Geophys. Res.-Atmos., 119, 4343–4364, 2014. a, b
Paulot, F., Ginoux, P., Cooke, W. F., Donner, L. J., Fan, S., Lin, M.-Y., Mao, J., Naik, V., and Horowitz, L. W.: Sensitivity of nitrate aerosols to ammonia emissions and to nitrate chemistry: implications for present and future nitrate optical depth, Atmos. Chem. Phys., 16, 1459–1477, https://doi.org/10.5194/acp-16-1459-2016, 2016. a, b, c, d, e
Paulot, F., Fan, S., and Horowitz, L. W.: Contrasting seasonal responses of sulfate aerosols to declining SO2 emissions in the Eastern U.S.: Implications for the efficacy of SO2 emission controls, Geophys. Res. Lett., 44, 455–464, https://doi.org/10.1002/2016GL070695, 2017. a
Phoenix, G. K., Emmett, B. A., Britton, A. J., Caporn, S. J. M., Dise, N. B., Helliwell, R., Jones, L., Leake, J. R., Leith, I. D., Sheppard, L. J., Sowerby, A., Pilkington, M. G., Rowe, E. C., Ashmore, M. R., and Power, S. A.: Impacts of atmospheric nitrogen deposition: responses of multiple plant and soil parameters across contrasting ecosystems in long-term field experiments, Glob. Change Biol., 18, 1197–1215, 2012. a, b
Ponette-González, A. G., Weathers, K. C., and Curran, L. M.: Tropical land-cover change alters biogeochemical inputs to ecosystems in a Mexican montane landscape, Ecol. Appl., 20, 1820–1837, 2010. a
Portmann, F. T., Siebert, S., and Döll, P.: MIRCA2000 – Global monthly irrigated and rainfed crop areas around the year 2000: A new high-resolution data set for agricultural and hydrological modeling, Global Biogeochem. Cy., 24, GB1011, https://doi.org/10.1029/2008GB003435, 2010. a
Pregitzer, K. S., Burton, A. J., Zak, D. R., and Talhelm, A. F.: Simulated chronic nitrogen deposition increases carbon storage in Northern Temperate forests, Glob. Change Biol., 14, 142–153, 2008. a
Ran, L., Pleim, J., Song, C., Band, L., Walker, J. T., and Binkowski, F. S.: A photosynthesis-based two-leaf canopy stomatal conductance model for meteorology and air quality modeling with WRF/CMAQ PX LSM, J. Geophys. Res.-Atmos., 122, 1930–1952, https://doi.org/10.1002/2016jd025583, 2017. a
Reay, D. S., Dentener, F., Smith, P., Grace, J., and Feely, R. A.: Global nitrogen deposition and carbon sinks, Nat. Geosci., 1, 430–437, 2008. a
Riahi, K., Rao, S., Krey, V., Cho, C., Chirkov, V., Fischer, G., Kindermann, G., Nakicenovic, N., and Rafaj, P.: RCP 8.5 – A scenario of comparatively high greenhouse gas emissions, Climatic Change, 109, 33–57, 2011. a
Riddick, S., Ward, D., Hess, P., Mahowald, N., Massad, R., and Holland, E.: Estimate of changes in agricultural terrestrial nitrogen pathways and ammonia emissions from 1850 to present in the Community Earth System Model, Biogeosciences, 13, 3397–3426, https://doi.org/10.5194/bg-13-3397-2016, 2016. a
Rienecker, M. M., Suarez, M. J., Gelaro, R., Todling, R., Bacmeister, J., Liu, E., Bosilovich, M. G., Schubert, S. D., Takacs, L., Kim, G.-K., Bloom, S., Chen, J., Collins, D., Conaty, A., da Silva, A., Gu, W., Joiner, J., Koster, R. D., Lucchesi, R., Molod, A., Owens, T., Pawson, S., Pegion, P., Redder, C. R., Reichle, R., Robertson, F. R., Ruddick, A. G., Sienkiewicz, M., and Woollen, J.: MERRA: NASA's Modern-Era Retrospective Analysis for Research and Applications, J. Climate, 24, 3624–3648, 2011. a
Sanderson, M. G., Collins, W. J., Hemming, D. L., and Betts, R. A.: Stomatal conductance changes due to increasing carbon dioxide levels: Projected impact on surface ozone levels, Tellus B, 59, 404–411, https://doi.org/10.3402/tellusb.v59i3.17002, 2007. a
Schwede, D. B. and Lear, G. G.: A novel hybrid approach for estimating total deposition in the United States, Atmos. Environ., 92, 207–220, 2014. a, b
Sheppard, L. J., Leith, I. D., Mizunuma, T., Neil Cape, J., Crossley, A., Leeson, S., Sutton, M. A., van Dijk, N., and Fowler, D.: Dry deposition of ammonia gas drives species change faster than wet deposition of ammonium ions: evidence from a long-term field manipulation, Glob. Change Biol., 17, 3589–3607, https://doi.org/10.1111/j.1365-2486.2011.02478.x, 2011. a
Shevliakova, E., Pacala, S. W., Malyshev, S., Hurtt, G. C., Milly, P. C. D., Caspersen, J. P., Sentman, L. T., Fisk, J. P., Wirth, C., and Crevoisier, C.: Carbon cycling under 300 years of land use change: Importance of the secondary vegetation sink, Global Biogeochem. Cy., 23, GB2022, https://doi.org/10.1029/2007GB003176, 2009. a, b, c, d, e
Simkin, S. M., Allen, E. B., Bowman, W. D., Clark, C. M., Belnap, J., Brooks, M. L., Cade, B. S., Collins, S. L., Geiser, L. H., Gilliam, F. S., Jovan, S. E., Pardo, L. H., Schulz, B. K., Stevens, C. J., Suding, K. N., Throop, H. L., and Waller, D. M.: Conditional vulnerability of plant diversity to atmospheric nitrogen deposition across the United States, P. Natl. Acad. Sci. USA, 113, 4086–4091, https://doi.org/10.1073/pnas.1515241113, 2016. a, b
Simpson, D., Fagerli, H., Jonson, J., Tsyro, S., Wind, P., and Tuovinen, J.: The EMEP Unified Eulerian Model. Model Description, EMEP MSC-W Report 12003, The Norwegian Meteorological Institute, Oslo, Norway, 2003. a, b
Singles, R., Sutton, M., and Weston, K.: A multi-layer model to describe the atmospheric transport and deposition of ammonia in Great Britain, Atmos. Environ., 32, 393–399, https://doi.org/10.1016/s1352-2310(97)83467-x, 1998. a
Smith, B., Wårlind, D., Arneth, A., Hickler, T., Leadley, P., Siltberg, J., and Zaehle, S.: Implications of incorporating N cycling and N limitations on primary production in an individual-based dynamic vegetation model, Biogeosciences, 11, 2027–2054, https://doi.org/10.5194/bg-11-2027-2014, 2014. a
Stevens, C. J., Dise, N. B., Mountford, J. O., and Gowing, D. J.: Impact of Nitrogen Deposition on the Species Richness of Grasslands, Science, 303, 1876–1879, 2004. a
Storkey, J., Macdonald, A. J., Poulton, P. R., Scott, T., Köhler, I. H., Schnyder, H., Goulding, K. W. T., and Crawley, M. J.: Grassland biodiversity bounces back from long-term nitrogen addition, Nature, 528, 401–404, https://doi.org/10.1038/nature16444, 2015. a
Sutton, M., Nemitz, E., Erisman, J., Beier, C., Bahl, K. B., Cellier, P., de Vries, W., Cotrufo, F., Skiba, U., Marco, C. D., Jones, S., Laville, P., Soussana, J., Loubet, B., Twigg, M., Famulari, D., Whitehead, J., Gallagher, M., Neftel, A., Flechard, C., Herrmann, B., Calanca, P., Schjoerring, J., Daemmgen, U., Horvath, L., Tang, Y., Emmett, B., Tietema, A., Peñuelas, J., Kesik, M., Brueggemann, N., Pilegaard, K., Vesala, T., Campbell, C., Olesen, J., Dragosits, U., Theobald, M., Levy, P., Mobbs, D., Milne, R., Viovy, N., Vuichard, N., Smith, J., Smith, P., Bergamaschi, P., Fowler, D., and Reis, S.: Challenges in quantifying biosphere–atmosphere exchange of nitrogen species, Environ. Pollut., 150, 125–139, https://doi.org/10.1016/j.envpol.2007.04.014, 2007. a
Sutton, M. A., Simpson, D., Levy, P. E., Smith, R. I., Reis, S., Van Oijen, M., and De Vries, W.: Uncertainties in the relationship between atmospheric nitrogen deposition and forest carbon sequestration, Glob. Change Biol., 14, 2057–2063, 2008. a, b
Sutton, M. A., Howard, C. M., Erisman, J. W., Billen, G., Bleeker, A., Grennfelt, P., Grinsven, H. V., and Grizzetti, B. (Eds.): The European Nitrogen Assessment: Sources, Effects and Policy Perspectives, Cambridge University Press, 2011. a
Templer, P. H., Weathers, K. C., Lindsey, A., Lenoir, K., and Scott, L.: Atmospheric inputs and nitrogen saturation status in and adjacent to Class I wilderness areas of the northeastern US, Oecologia, 177, 5–15, 2014. a
Townsend, A. R., Braswell, B. H., Holland, E. A., and Penner, J. E.: Spatial and Temporal Patterns in Terrestrial Carbon Storage Due to Deposition of Fossil Fuel Nitrogen, Ecol. Appl., 6, 806–814, 1996. a
Tulloss, E. M. and Cadenasso, M. L.: Nitrogen deposition across scales: hotspots and gradients in a California savanna landscape, Ecosphere, 6, 167, https://doi.org/10.1890/es14-00440.1, 2015. a
Vieno, M., Dore, A. J., Wind, P., Marco, C. D., Nemitz, E., Phillips, G., Tarrasón, L., and Sutton, M. A.: Application of the EMEP Unified Model to the UK with a Horizontal Resolution of 5×5 km2, in: Atmospheric Ammonia, Springer Netherlands, 367–372, https://doi.org/10.1007/978-1-4020-9121-6_21, 2009. a
Wang, Y., Jacob, D. J., and Logan, J. A.: Global simulation of tropospheric O3−NOx-hydrocarbon chemistry 1. Model formulation, J. Geophys. Res., 103, 10713–10726, 1998. a
Wårlind, D., Smith, B., Hickler, T., and Arneth, A.: Nitrogen feedbacks increase future terrestrial ecosystem carbon uptake in an individual-based dynamic vegetation model, Biogeosciences, 11, 6131–6146, https://doi.org/10.5194/bg-11-6131-2014, 2014. a
Weathers, K. C., Lovett, G. M., Likens, G. E., and Lathrop, R.: The Effect of Landscape Features on Deposition to Hunter Mountain, Catskill Mountains, New York, Ecol. Appl., 10, 528–540, https://doi.org/10.2307/2641112, 2000. a
Weathers, K. C., Simkin, S. M., Lovett, G. M., and Lindberg, S. E.: Empirical Modeling of Atmospheric Deposition in Mountainous Landscapes, Ecol. Appl., 16, 1590–1607, 2006. a
Wentworth, G. R., Murphy, J. G., Benedict, K. B., Bangs, E. J., and Collett Jr., J. L.: The role of dew as a night-time reservoir and morning source for atmospheric ammonia, Atmos. Chem. Phys., 16, 7435–7449, https://doi.org/10.5194/acp-16-7435-2016, 2016. a
Wesely, M. L.: Parameterization of surface resistances to gaseous dry deposition in regional-scale numerical models, Atmos. Environ., 23, 1293–1304, 1989. a, b, c, d
Williams, J. J., Chung, S. H., Johansen, A. M., Lamb, B. K., Vaughan, J. K., and Beutel, M.: Evaluation of atmospheric nitrogen deposition model performance in the context of U.S. critical load assessments, Atmos. Environ., 150, 244–255, https://doi.org/10.1016/j.atmosenv.2016.11.051, 2017. a
Wolfe, A. P., Van Gorp, A. C., and Baron, J. S.: Recent ecological and biogeochemical changes in alpine lakes of Rocky Mountain National Park (Colorado, USA): a response to anthropogenic nitrogen deposition, Geobiology, 1, 153–168, 2003. a
Wu, W. and Driscoll, C. T.: Impact of Climate Change on Three-Dimensional Dynamic Critical Load Functions, Environ. Sci. Technol., 44, 720–726, 2010. a
Wu, Z., Staebler, R., Vet, R., and Zhang, L.: Dry deposition of O3 and SO2 estimated from gradient measurements above a temperate mixed forest, Environ. Pollut., 210, 202–210, https://doi.org/10.1016/j.envpol.2015.11.052, 2016. a, b
Wu, Z., Schwede, D. B., Vet, R., Walker, J. T., Shaw, M., Staebler, R., and Zhang, L.: Evaluation and intercomparison of five North American dry deposition algorithms at a mixed forest site, J. Adv. Model. Earth Sy., 10, 1571–1586, https://doi.org/10.1029/2017ms001231, 2018. a, b, c, d
Zaehle, S., Friend, A. D., Friedlingstein, P., Dentener, F., Peylin, P., and Schulz, M.: Carbon and nitrogen cycle dynamics in the O-CN land surface model: 2. Role of the nitrogen cycle in the historical terrestrial carbon balance, Global Biogeochem. Cy., 24, 803–822, https://doi.org/10.1029/2009gb003522, 2010. a
Zhang, L., Gong, S., Padro, J., and Barrie, L.: A size-segregated particle dry deposition scheme for an atmospheric aerosol module, Atmos. Environ., 35, 549–560, 2001. a
Zhang, L., Moran, M. D., Makar, P. A., Brook, J. R., and Sunling, G.: Modelling gaseous dry deposition in AURAMS: a unified regional air-quality modelling system, Atmos. Environ., 36, 537–560, 2002. a, b, c
Zhang, L., Brook, J. R., and Vet, R.: A revised parameterization for gaseous dry deposition in air-quality models, Atmos. Chem. Phys., 3, 2067–2082, https://doi.org/10.5194/acp-3-2067-2003, 2003. a, b
Zhang, L., Jacob, D. J., Knipping, E. M., Kumar, N., Munger, J. W., Carouge, C. C., van Donkelaar, A., Wang, Y. X., and Chen, D.: Nitrogen deposition to the United States: distribution, sources, and processes, Atmos. Chem. Phys., 12, 4539–4554, https://doi.org/10.5194/acp-12-4539-2012, 2012. a
Zhu, L., Henze, D., Bash, J., Jeong, G.-R., Cady-Pereira, K., Shephard, M., Luo, M., Paulot, F., and Capps, S.: Global evaluation of ammonia bidirectional exchange and livestock diurnal variation schemes, Atmos. Chem. Phys., 15, 12823–12843, https://doi.org/10.5194/acp-15-12823-2015, 2015. a