the Creative Commons Attribution 4.0 License.
the Creative Commons Attribution 4.0 License.
 | 18 Dec 2018
Rapid SO2 emission reductions significantly increase tropospheric ammonia concentrations over the North China Plain
Mingxu Liu
Xin Huang
Yu Song
Tingting Xu
Shuxiao Wang
Zhijun Wu
Lin Zhang
Qiang Zhang
Yuepeng Pan
Xuejun Liu
The North China Plain has been identified as a significant hotspot of ammonia (NH3) due to extensive agricultural activities. Satellite observations suggest a significant increase of about 30 % in tropospheric gas-phase NH3 concentrations in this area during 2008–2016. However, the estimated NH3 emissions decreased slightly by 7 % because of changes in Chinese agricultural practices, i.e., the transition in fertilizer types from ammonium carbonate fertilizer to urea, and in the livestock rearing system from free-range to intensive farming. We note that the emissions of sulfur dioxide (SO2) have rapidly declined by about 60 % over the recent few years. By integrating measurements from ground and satellite, a long-term anthropogenic NH3 emission inventory, and chemical transport model simulations, we find that this large SO2 emission reduction is responsible for the NH3 increase over the North China Plain. The simulations for the period 2008–2016 demonstrate that the annual average sulfate concentrations decreased by about 50 %, which significantly weakens the formation of ammonium sulfate and increases the average proportions of gas-phase NH3 within the total NH3 column concentrations from 26 % (2008) to 37 % (2016). By fixing SO2 emissions of 2008 in those multi-year simulations, the increasing trend of the tropospheric NH3 concentrations is not observed. Both the decreases in sulfate and increases in NH3 concentrations show highest values in summer, possibly because the formation of sulfate aerosols is more sensitive to SO2 emission reductions in summer than in other seasons. Besides, the changes in NOx emissions and meteorological conditions both decreased the NH3 column concentrations by about 3 % in the study period. Our simulations suggest that the moderate reduction in NOx emissions (16 %) favors the formation of particulate nitrate by elevating ozone concentrations in the lower troposphere.
- Article
(2520 KB) -
Supplement
(1795 KB) - BibTeX
- EndNote


Ammonia (NH3) is considered the most important alkaline gas in the atmosphere. On both a global and regional scale, NH3 is mostly emitted from agricultural activities, mainly including the fertilization and livestock industry (Bouwman et al., 1997). Gas-phase NH3 can react with ambient sulfuric and nitric acids to form ammonium sulfate/bisulfate and ammonium nitrate aerosols (SNAs), which constitute a significant fraction of atmospheric fine particles (PM2.5) associated with potential human health impacts (Pope et al., 2009; Seinfeld and Pandis, 2006). Ammonia and ammonium () is ultimately deposited back to the earth surface, contributing to acid deposition and eutrophication (Asman, 1998; Behera et al., 2013; Pozzer et al., 2017).
As a major agricultural country, China is one of the world's largest emitters of NH3, the amount of which (∼10 Tg yr−1) exceeds the sum of those in Europe (∼4.0 Tg yr−1) and North America (∼4.0 Tg yr−1) (Huang et al., 2012; Bouwman et al., 1997; Paulot et al., 2014). Fertilizer application and livestock manure management contribute to nearly 90 % of China's NH3 emissions (Huang et al., 2012; Zhang et al., 2018). Until now, NH3 emissions have not been regulated by the Chinese government, although they serve as an important contributor to haze pollution in China.
The North China Plain (the spatial definition of this area is illustrated in Fig. S1 in the Supplement) is a hotspot of NH3 loadings, as revealed by satellite detection and ground measurements (Clarisse et al., 2009; Pan et al., 2018). Interestingly, satellite observations over the past decade have shown an increase in tropospheric columns of gaseous NH3 in this area (Warner et al., 2017). But no sensitivity studies have been performed to explain it, especially from a modeling perspective. A long-term bottom-up inventory indicates that NH3 emissions in China have displayed a slightly decreasing tendency (Kang et al., 2016). During 2006–2016, ammonium bicarbonate for crop fertilization was replaced by urea fertilizer (its fraction of application increasing from 60 % to 90 % of all mineral nitrogen fertilizers). In the meantime, the traditional free-range livestock system was gradually replaced by the intensive animal rearing system (i.e., raising livestock in confinement at a high stocking density) in the livestock industry (increasing from 21 % in 2006 to 48 % in 2016; shown in Table S1 in the Supplement). These changes in agricultural practices have lowered the volatilization rates of NH3 (Kang et al., 2016).
Several studies have proposed that reduction in SO2 emissions or NOx emissions is an important factor in determining the increase in atmospheric NH3 concentrations on the global and regional scales (Warner et al., 2017; Yu et al., 2018; Saylor et al., 2015). Through the widespread use of the flue gas desulfurization in power plants since 2006 in China, SO2 emissions have gradually decreased (Lu et al., 2011; Li et al., 2010). Li et al. (2017) found it was reduced by 70 % from the peak year (around 2006) to 2016 based on satellite observations and bottom-up methods. Specifically, the initiation of the Action Plan for Air Pollution Prevention and Control (referred to as the national Ten Measures for Air) since 2013 resulted in a rapid reduction of about 50 % over recent few years, from ∼30 Tg in 2012 to ∼14 Tg in 2016 according to the Multi-resolution Emission Inventory for China (MEIC) (Zheng et al., 2018). To our knowledge, such a strong decrease in SO2 emissions is only found in China. In contrast, emissions of nitrogen oxides (NOx) in MEIC peaked around 2012 with only a moderate decrease of ∼20 % from 2012 to 2016 (Liu et al., 2016).
Here, we hypothesize that the rapid SO2 emission reduction is the main cause of the increase in tropospheric NH3 concentrations over the North China Plain. To verify this, we first used observation datasets from the ground and space to infer the relationship between the trends in NH3 and SO2 concentrations. A comprehensive long-term NH3 emission inventory, developed by our recent studies based on bottom-up methods, was also used to demonstrate the inter-annual variations of NH3 emissions in this region. Then, we performed multi-year simulations with a chemical transport model to examine the impact of changes in SO2 emissions on tropospheric NH3 concentrations in terms of the magnitude and seasonal variation. Besides, other potential mechanisms (NOx emission and meteorology) were discussed.
2.1 Observation datasets
Observations from space and ground stations were used in this study. Tropospheric vertical column densities (VCDs) of NH3 were derived from the measurements of Infrared Atmospheric Sounding Interferometer (IASI) on board MetOp-A (Van Damme et al., 2015, 2017; Clarisse et al., 2009). We determined the annual averages of NH3 column concentrations over the North China Plain on a 0.25∘ × 0.25∘ grid during 2008–2016, based on the relative error weighting mean method (Van Damme et al., 2014). The monthly NH3 concentrations were measured using passive NH3 diffusive samplers (Analyst, CNR Institute of Atmospheric Pollution, Rome, Italy), from September 2015 to August 2016 at 11 sites over northern China (Pan et al., 2018). The SO2 VCDs were provided by the Ozone Monitoring Instrument (OMI) measurements to test the trend of SO2 concentrations. They were derived from the Level-3 Aura/OMI Global SO2 Data Products (OMSO2e), released by the NASA Goddard Earth Sciences Data and Information Services Center (Krotkov et al., 2015). Besides, daily PM2.5 was sampled by quartz-fiber filters at an urban atmosphere environment monitoring station in Peking University (39.99∘ N, 116.3∘ E) of Beijing, China, since 2013. The major water-soluble inorganic compounds (e.g., , , and ) were analyzed by ion chromatography.
2.2 WRF-Chem simulations
In this study, the simulations with the Weather Research and Forecasting Model coupled with Chemistry (Grell et al., 2005) version 3.6.1 (WRF-Chem) were conducted for the domain of the North China Plain for the years 2008, 2010, 2012, 2014, 2015, and 2016 (referred to as Run_08–16). We ran the model with a horizontal resolution of 30 × 30 km and 24 vertical layers, extending from the surface to 50 hPa. The initial and boundary meteorological condition was derived from 6 h National Centers for Environmental Prediction reanalysis data. The detailed model configurations were described in our previous study (Huang et al., 2014). The anthropogenic emissions from power plant, industrial, residential, and vehicle sectors were taken from the MEIC database. The MEIC data show that the annual SO2 emissions in the North China Plain were reduced by about 60 %, from 9.9 Tg in 2008 to 4.2 Tg in 2016, while NOx emissions first increased from 8.0 to 8.8 Tg during 2008–2012, and then decreased to 6.7 Tg in 2016.
2.3 NH3 emission inventory
A high-resolution NH3 emission inventory (1 km × 1 km, month) was developed based on the bottom-up method. The emission factors were parameterized with regional farming practices, ambient temperature, soil pH, and wind speeds. The full details can be found in studies by Kang et al. (2016), Huang et al. (2012), and Huo et al. (2015). The inventory has similar spatial features with recent satellite observations (Van Damme et al., 2014), and its amount is close to the emission estimated by the inversion model using ammonium wet deposition data (Paulot et al., 2014). Recent modeling results also showed its good performance by comparing with ammonium observations in China (Huang et al., 2015). The inventory has covered the period from 1980 to 2016 and considered the inter-annual variability in activity levels and agricultural practices. It shows a distinct seasonal feature in NH3 emissions over the North China Plain. A total of 75 % of annual NH3 emissions are released in the spring and summer months (March–September), during which intensive agricultural fertilization and elevated ambient temperature facilitate the volatilization rates of NH3. Moreover, to integrate this inventory into WRF-Chem simulations, we adopted a diurnal profile with 80 % of NH3 emissions in the daytime, following previous studies (Zhu et al., 2015; Asman, 2001; Paulot et al., 2016).
3.1 Trends in emissions and concentrations of NH3 vs. SO2
According to the measurements by IASI, the North China Plain showed the highest VCDs of NH3 in China, which mostly ranged from 15 to 30 × 1015 molecules cm−2 during 2008–2014 and increased to above 30 × 1015 molecules cm−2 in 2015 and 2016 (Fig. S1 in the Supplement). We found the annual NH3 column concentrations increased significantly (p value < 0.05) over the North China Plain between 2008 and 2016 (Fig. 1a). The average tropospheric NH3 columns first fluctuated between 2008 and 2013, and then rapidly increased from 21 × 1015 molecules cm−2 in 2013 to 27 × 1015 molecules cm−2 in 2016. It showed an overall increase of 30 %, or an average annual increase of 0.9 × 10¹⁵ molecules cm−2 yr−1. Seasonally, the increase in NH3 columns was more pronounced in summertime (June–August, JJA), with an annual increase rate of 1.8 × 10¹⁵ molecules cm−2 yr−1 between 2008 and 2016, which was much higher than in other seasons (< 1 × 10¹⁵ molecules cm−2 yr−1).
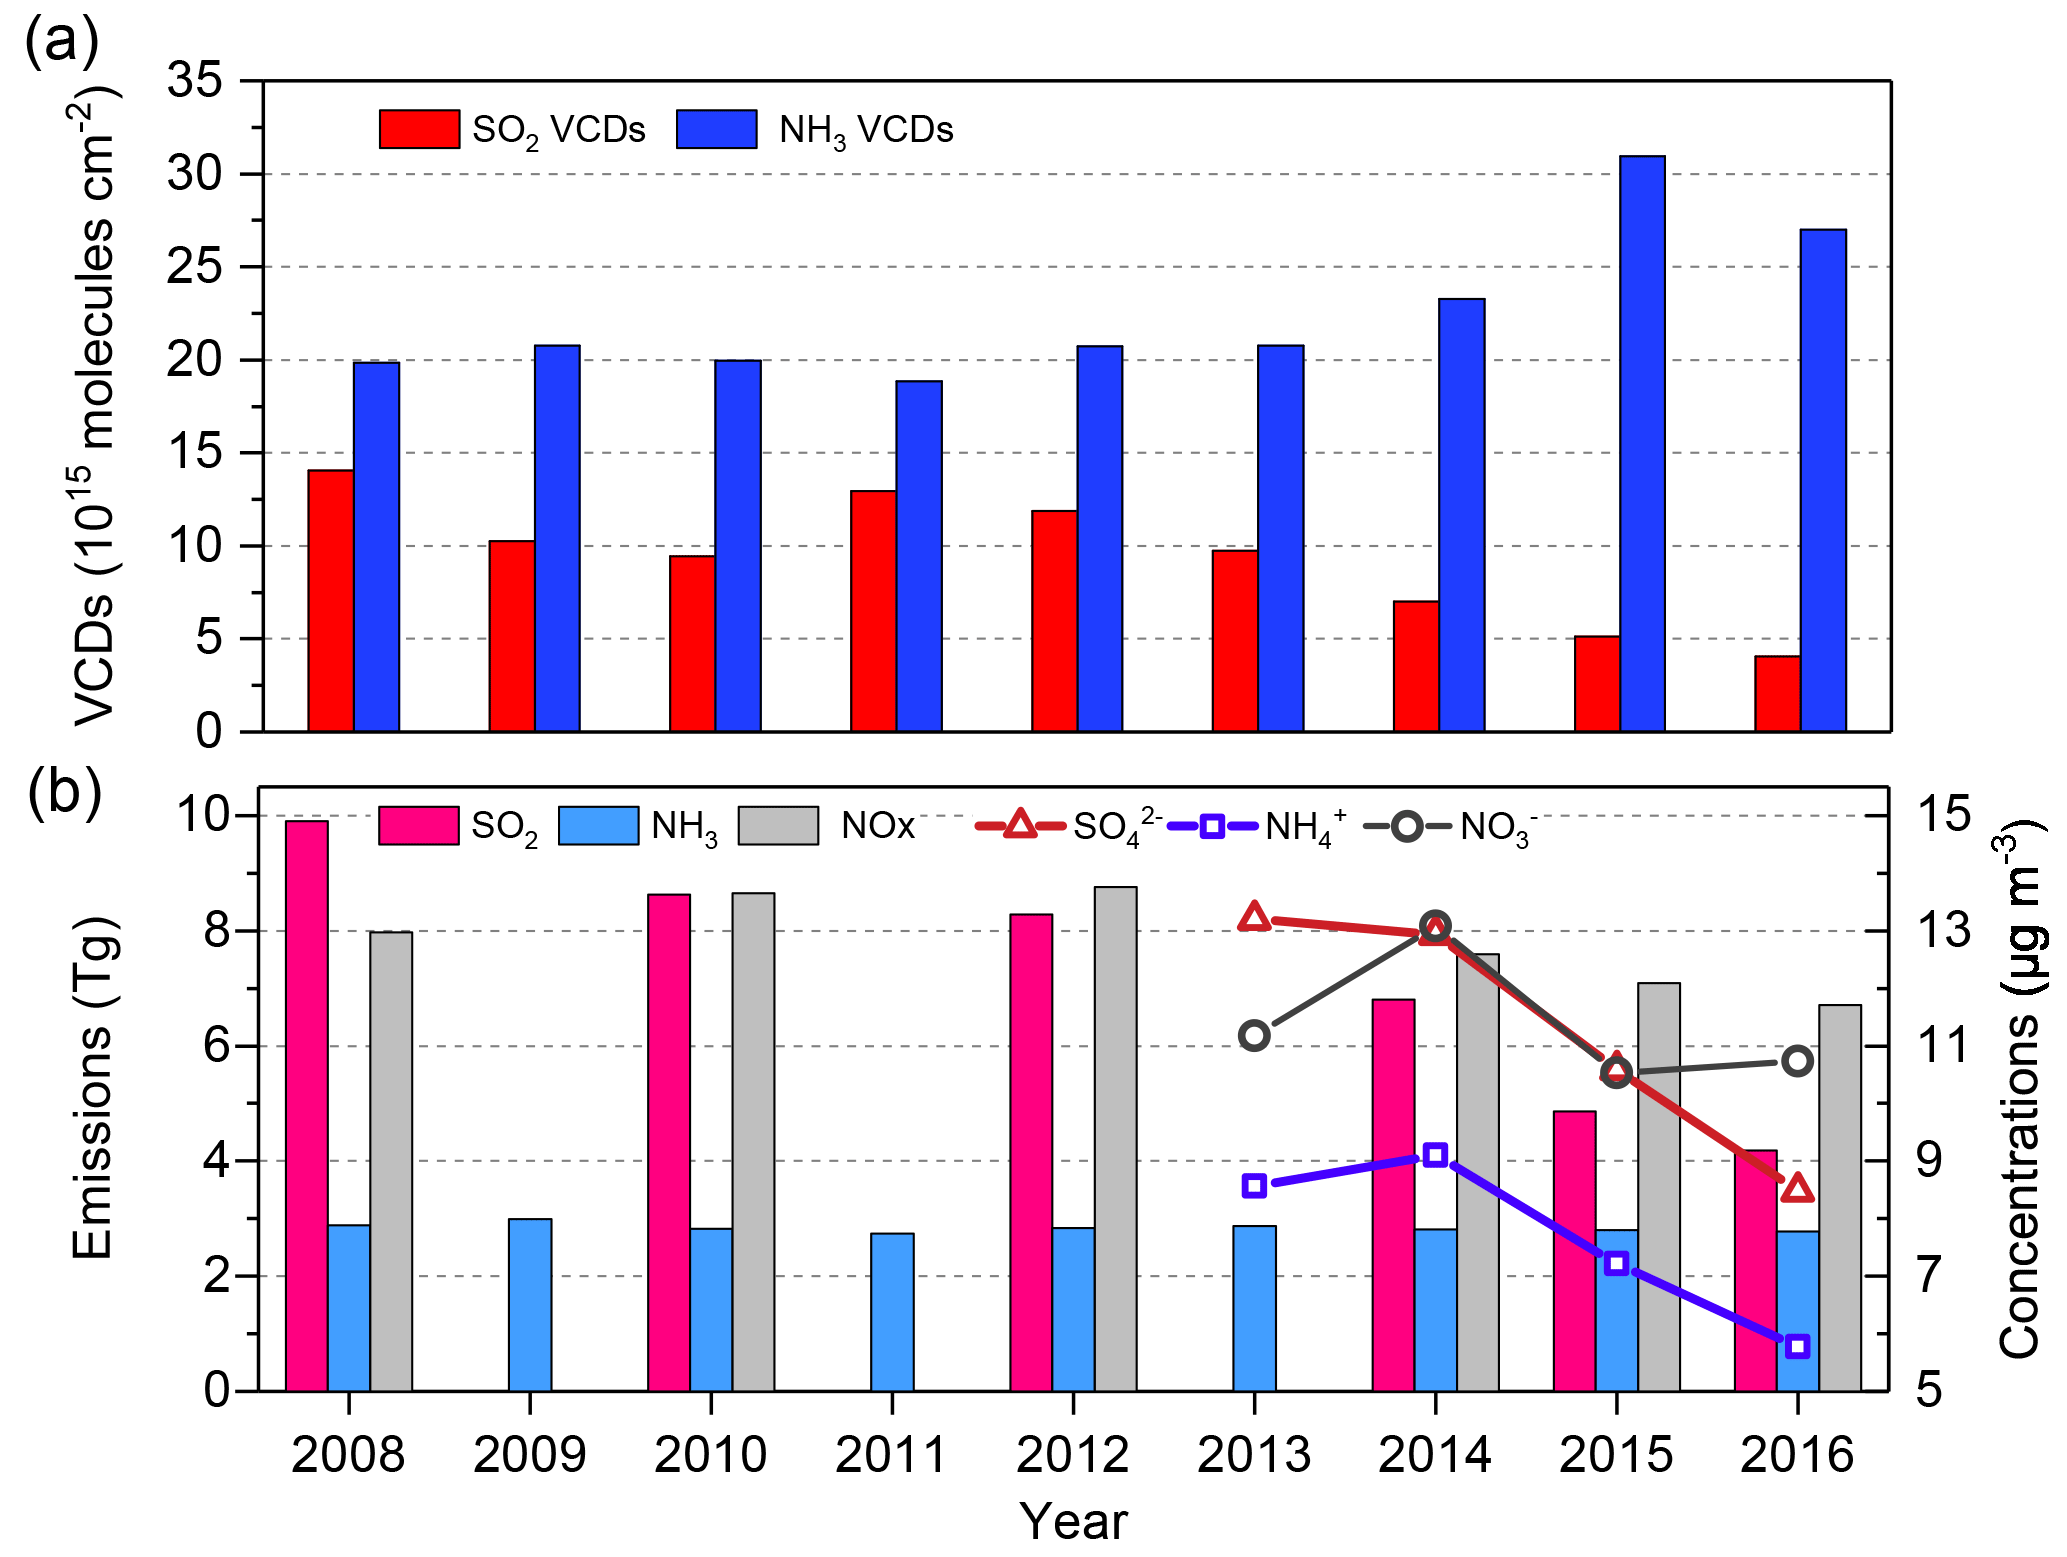
Figure 1(a) Inter-annual trends of SO2 and NH3 VCDs averaged over the North China Plain from 2008 to 2016. (b) Inter-annual trends of emissions of SO2 NH3, and NOx in the North China Plain from 2008 to 2016, and annual mean concentrations of PM2.5 sulfate, ammonium, and nitrate derived from measurements at an urban station (Beijing, 39.99∘ N, 116.3∘ E) in the North China Plain from 2013 to 2016.
In contrast to the trends in tropospheric NH3 concentrations, the annual NH3 emissions first experienced a decreasing tendency from 2008 to 2011 (3.0 Tg in 2009 to 2.8 Tg in 2011) and then remained constant at around 2.8 Tg yr−1 during 2011–2016 over the North China Plain (Fig. 1b). The overall trend of NH3 emissions demonstrated a decrease of about 7 %. It is because the changes in mineral fertilizer use and livestock rearing practices have lowered NH3 emission rates. The increasing use of urea fertilizer (from 4.7 to 5.2 Tg yr−1) and compound fertilizers (from 1.2 to 1.7 Tg yr−1) but decreased ammonium bicarbonate (from 1.5 to 0.4 Tg yr−1) led to a 20 % reduction in NH3 emissions from fertilizer application during 2008–2016 (Table S1 in the Supplement). On the other hand, the number of some major livestock increased (beef −20 %, dairy +39 %, goat −23 %, sheep +55 %, pig +18 %, and poultry +19 %; see Table S1 in the Supplement for details), while the proportion of intensive animal rearing systems rises to nearly half of the livestock industry in 2016, compared to only 28 % in 2008 (Table S1 in the Supplement). The intensive systems are characterized with more effective livestock manure management in favor of lower volatilization rates of NH3 (Kang et al., 2016). The transition from the free-range to the intensive system in livestock animal rearing offsets the effect of increased animals on the NH3 emissions, thereby resulting in the annual livestock emissions in the North China Plain being almost constant (around 1.2 Tg yr−1). Overall, the decreasing NH3 emissions cannot track the upward trend of tropospheric NH3 concentrations.
During 2008–2016, SO2 column concentrations were subject to a dramatic decline (p < 0.01) due to a 60 % decrease in SO2 emissions. The annual mean SO2 VCDs were reduced from 14 × 1015 molecules cm−2 (2008) to 4 × 10¹⁵ molecules cm−2 (2016), showing a percent reduction of nearly 70 %. Especially during 2012–2016, the decreases in SO2 emissions and VCDs accelerated owing to the implementation of the Action Plan for Air Pollution Prevention and Control by the Chinese government (Zheng et al., 2018). The ground measurements in a typical urban station in the North China Plain indicated that the annual average concentration in PM2.5 decreased by 35 % (2013–2016) along with rapid SO2 reductions, which was accompanied by a 33 % decrease in particulate (Fig. 1b). Seasonally, the decrease in ground-level reached 60 % during summertime (JJA), which was much higher than in other seasons.
3.2 Simulations of increasing trend in NH3 columns
We performed numerical simulations with WRF-Chem to interpret the cause of the NH3 increase. We first evaluated model results against measurements of surface NH3 concentrations available in the North China Plain as well as the satellite-retrieved NH3 columns. The simulated monthly averaged surface NH3 concentrations at 11 stations (mean + standard deviation: 13.5 ± 6.8 µg m−3) generally agreed with corresponding observations (13.4 ± 9.7 µg m−3) with a correlation coefficient of 0.57. More than 70 % of the comparisons differed within a factor of 2 (Fig. 2). Both simulations and observations show high NH3 concentrations of about 30 µg m−3 in warm seasons (March–October) due to enhanced NH3 volatilization and frequent fertilization activities, as well as lower values (mostly < 15 µg m−3) in other months (Fig. 3). Spatially, the hotspot of NH3 was mainly concentrated in Hebei, Shandong, and Henan provinces, which have the most intensive agricultural production in China and thus emit considerable gas-phase NH3 into the atmosphere. We note that the simulated monthly NH3 concentrations were underestimated by 25 %–70 % in several stations in wintertime (January, February, and December). Recently, NH3 emissions from the residential coal and biomass combustion for heating are considered to be a potentially important source of NH3 in suburban and rural areas during wintertime (Li et al., 2016), but it has not been fully included in our bottom-up inventory, which was partially responsible for such deviation between the model and observations.

Figure 2Comparison of modeled gaseous NH3 concentrations with corresponding monthly measurements of NH3 from September 2015 to August 2016. The 1:2 and 2:1 dashed lines are shown for reference and the Pearson correlation coefficient (r) is shown inset.
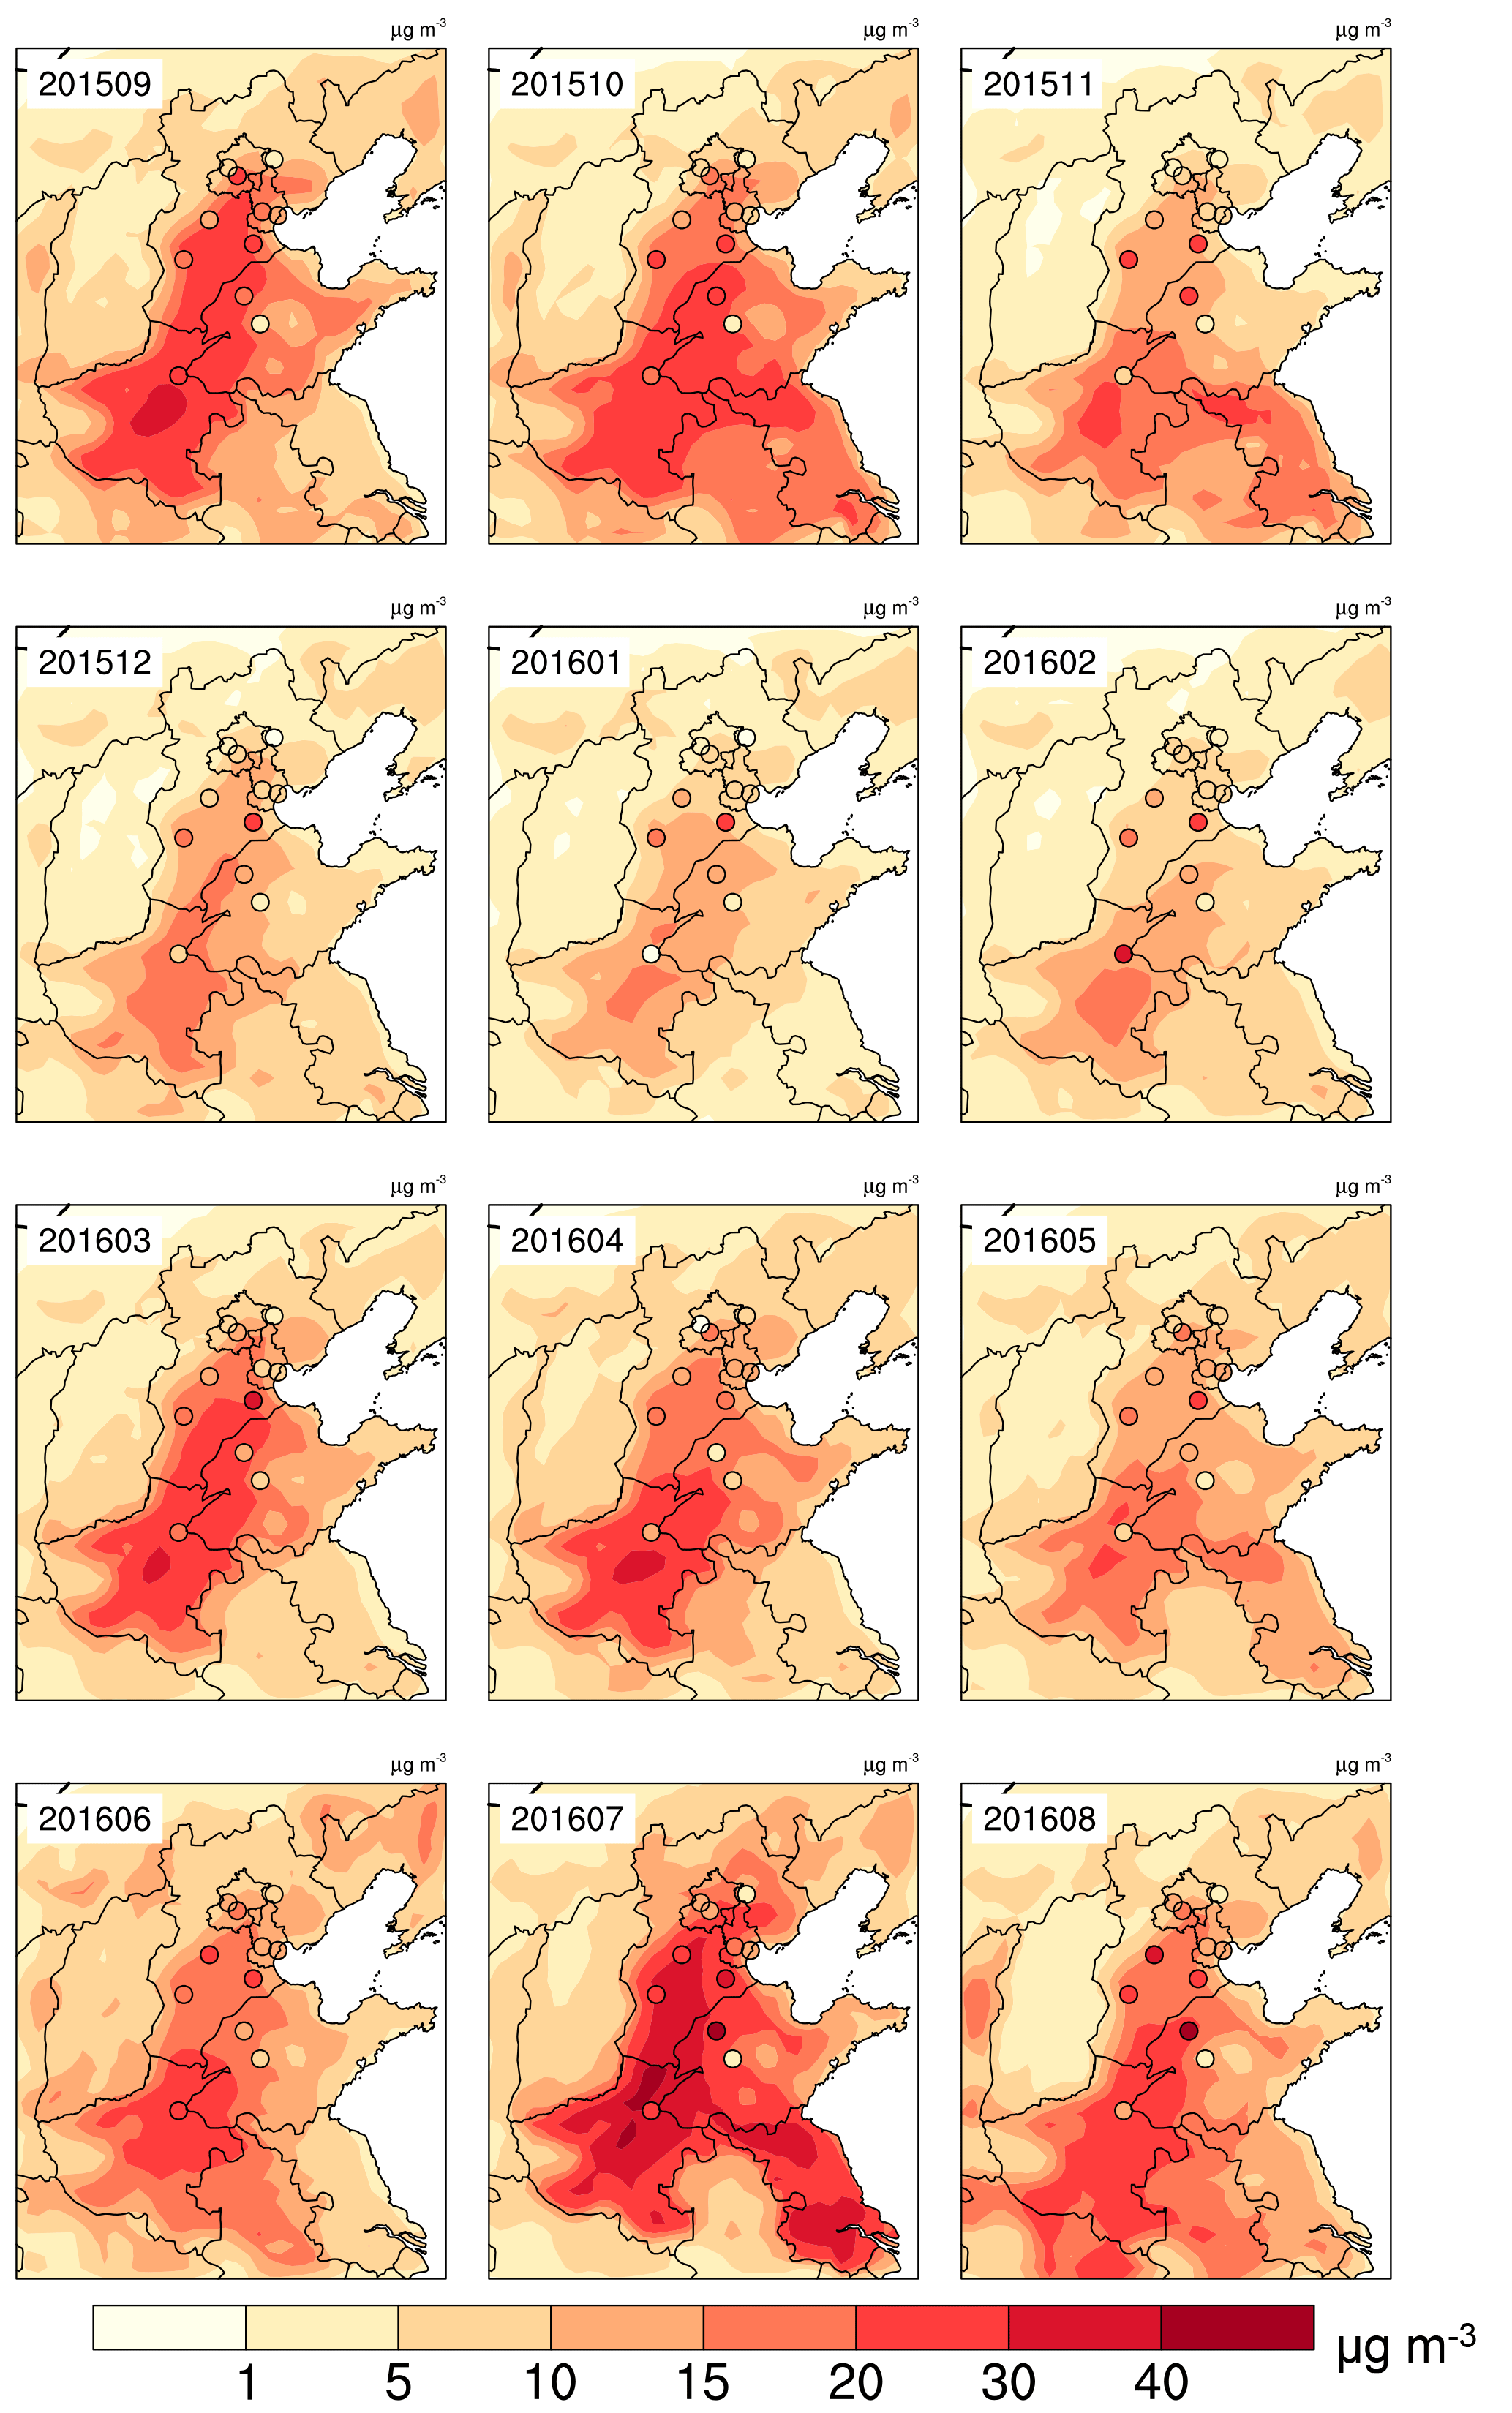
Figure 3Spatial distribution of modeled ground NH3 concentrations (µg m−3) and monthly measurements over the North China Plain from September 2015 (201509) to August 2016 (201608).
We calculated the NH3 VCDs from the simulations by integrating NH3 molecular concentrations from the surface level to the top of the troposphere. The results agreed well with the observed NH3 columns of 2016 on the magnitude and spatiotemporal patterns (Fig. S2 in the Supplement). Both IASI measurements and the WRF-Chem simulation showed high annual mean NH3 column concentrations in Hebei, Shandong, and Henan provinces, reaching above 30 × 1015 molecules cm−2. Moreover, we evaluated the modeled SNA concentrations using the filter-based PM2.5 samples at an urban atmospheric monitoring station in the North China Plain during 2014–2016 (Fig. S3 in the Supplement). The model generally reproduced the observed SNA concentrations, with a small annual mean bias for sulfate (−2 %) and ammonium (−13 %) and a relatively large bias for nitrate (−24 %). Overall, the model performed well in modeling the concentrations in tropospheric NH3 as well as secondary inorganic aerosols, which provides high confidence for the following interpretation of the NH3 increases.
The model successfully reproduced the observed increasing trend in NH3 columns over the North China Plain during 2008–2016 (Fig. 4). The modeled NH3 columns were systemically lower than the measurements because the relative error weighting mean method always biased a high result due to the smaller relative error in a larger column (Van Damme et al., 2014; Whitburn et al., 2016). An overall increase of 39 % in NH3 columns with an average annual increase of 0.8 × 10¹⁵ molecules cm−2 yr−1 was found in the simulations between 2008 and 2016, and meanwhile the SO2 columns averaged over the North China Plain decreased by approximately 50 % in this period. These results were close to the measurements.
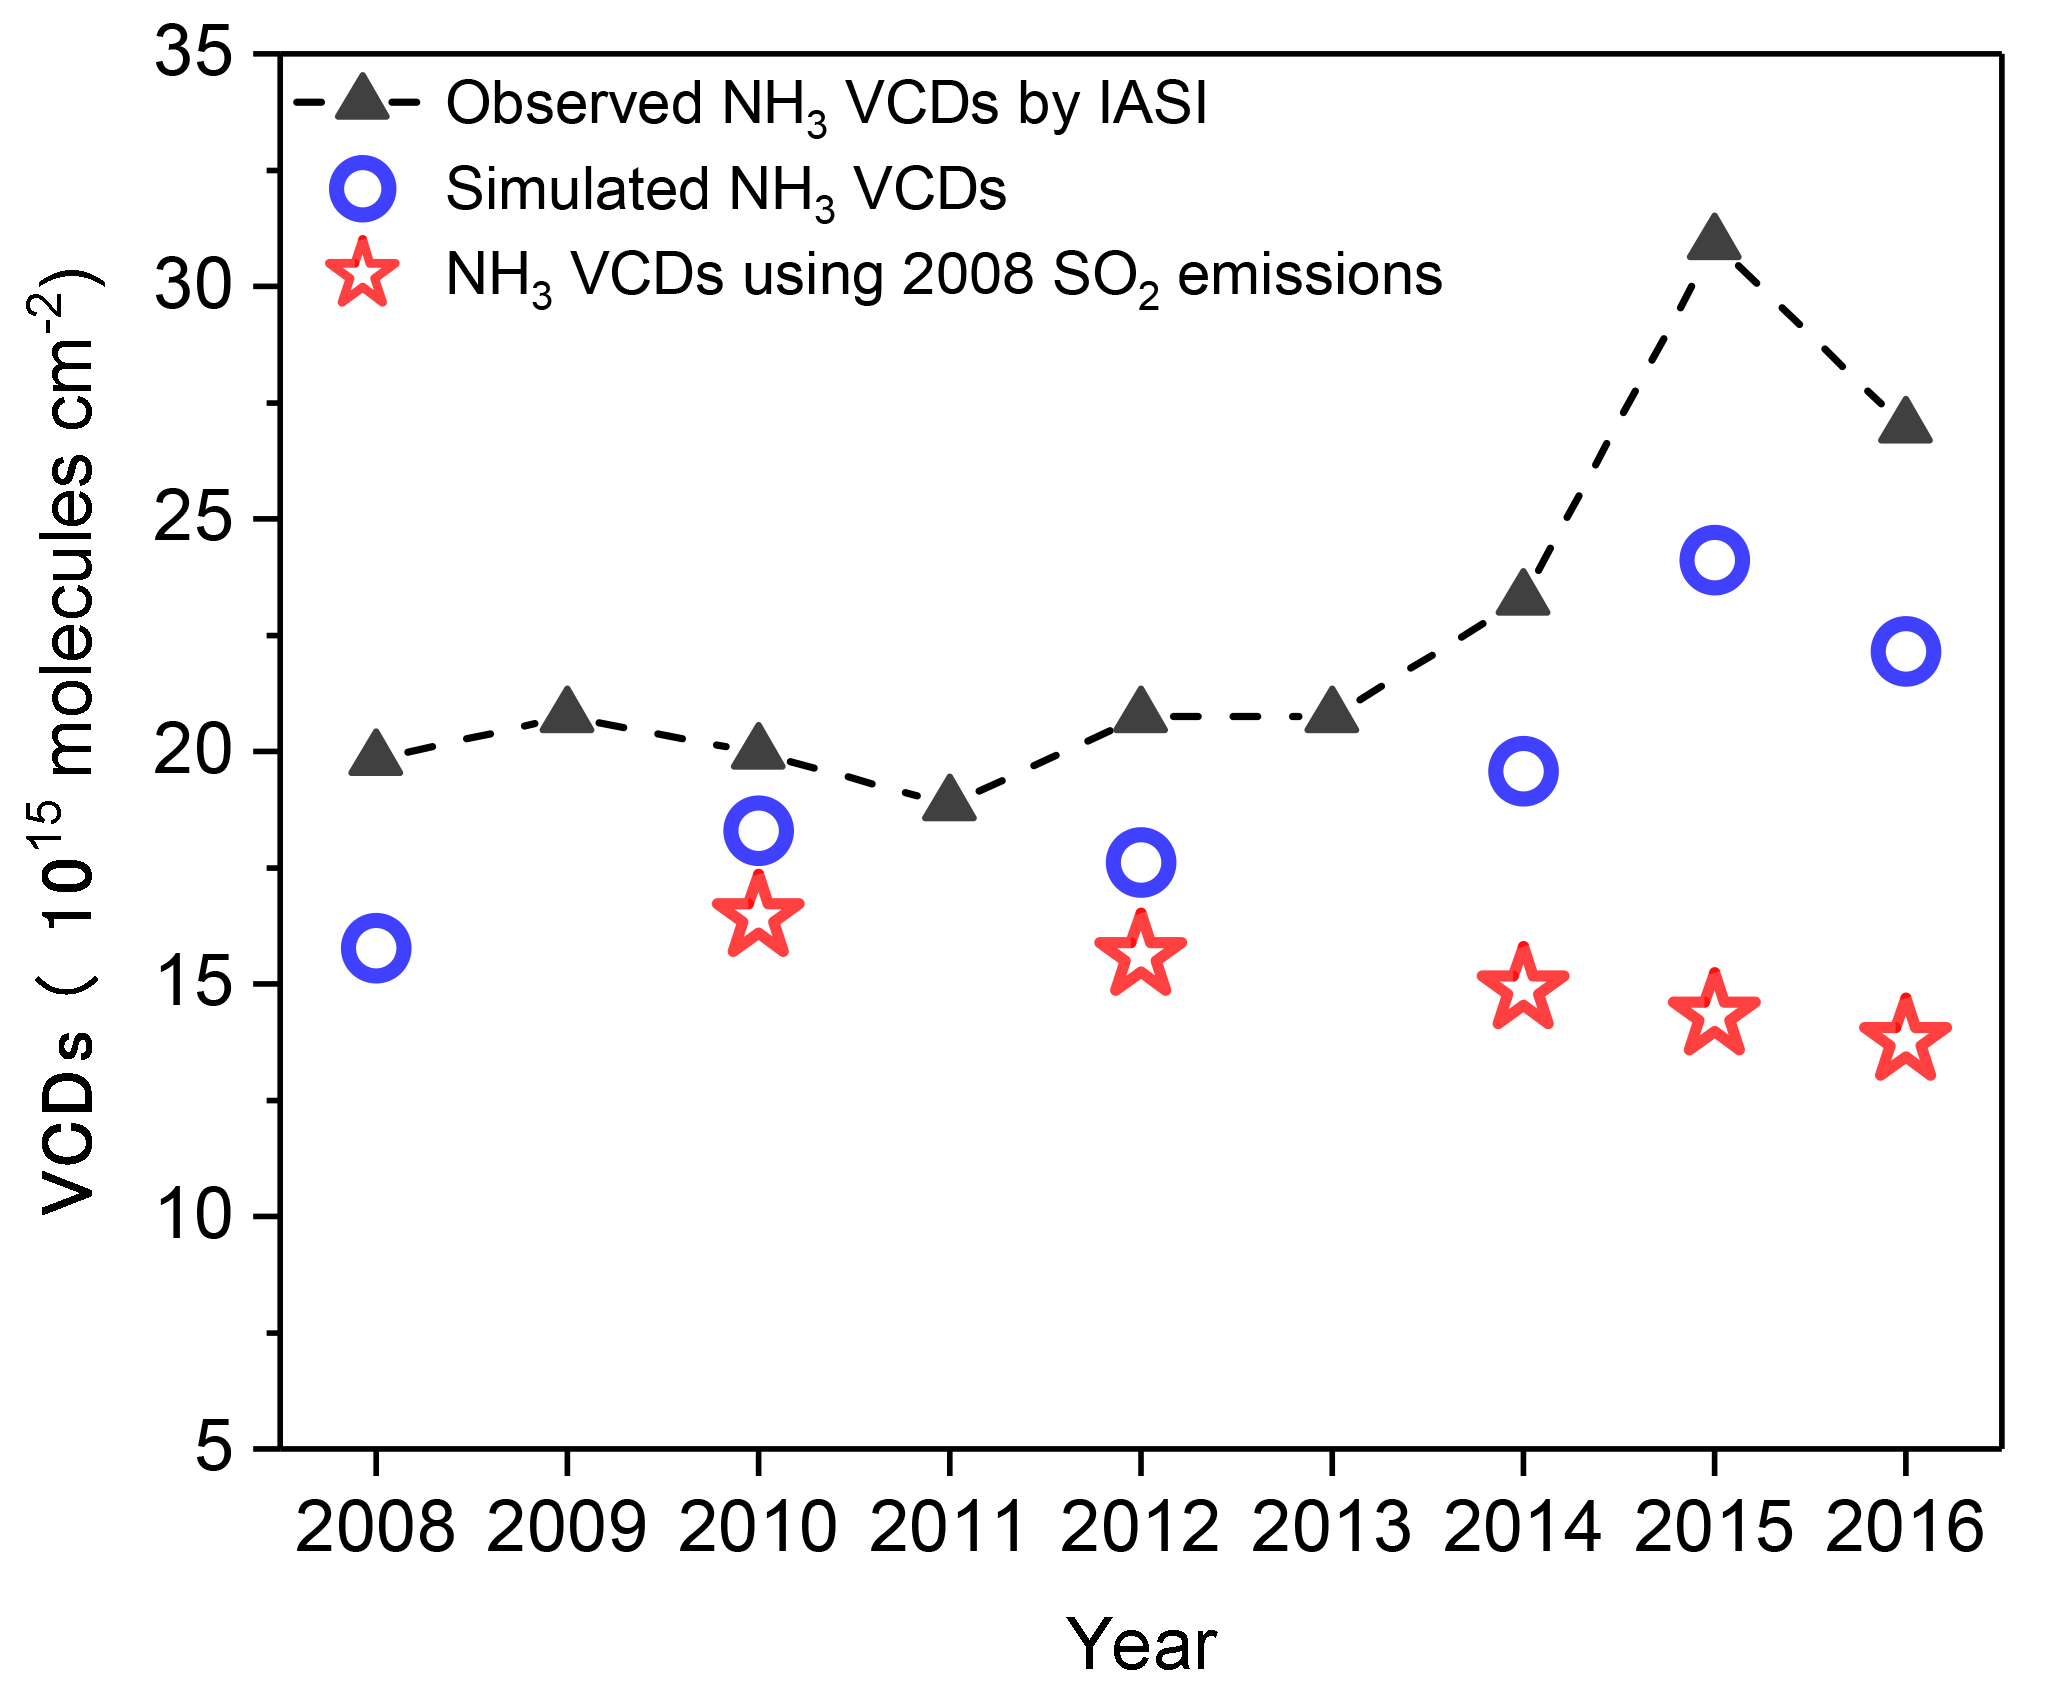
Figure 4Trends in the annual averages of observed and simulated NH3 columns over the North China Plain. The red stars denote the simulated NH3 columns under the 2008 SO2 emissions levels (i.e., Run_10_S08 to Run_16_S08).
To verify our hypothesis, we replaced SO2 emissions during 2010–2016 by those in 2008 and repeated the simulations (referred to as Run_10_S08 to Run_16_S08). It was noticeable that, under these conditions, the increasing trend of NH3 column concentrations was not observed, and even a decrease of 13 % took place (Fig. 4). The largest differences were found in 2015 and 2016, when the annual NH3 columns in these sensitivity simulations were about 40 % (8–10 × 1015 molecules cm−2) lower than those in the baseline cases, corresponding to the 60 % reduction in SO2 emissions between 2008 and 2016. By comparing the results among Run_08, Run_16, and Run_16_S08, we found that the reduction in SO2 emissions increased the NH3 column concentrations by 52 % during 2008–2016, which was even higher than the overall increase (39 %) in the baseline cases. Therefore, we deduce that the rapid SO2 emission reductions are responsible for the increased NH3 levels during 2008–2016, while other mechanisms may be negative contributors. More details on these effects are shown in the following.
3.3 Influence of SO2 emission reductions on tropospheric NH3 concentrations
As we indicated above, was observed to be decreasing over recent years in response to the reductions of SO2 emissions. This was also reproduced by our simulations, which showed that the annual average sulfate concentrations decreased by almost 50 % in the lower troposphere. This decreasing trend was especially pronounced after 2013 owing to the very effective SO2 emission reductions. Given that the vapor pressure of H2SO4(g) is practically zero over atmospheric particles, atmospheric is predominately in the particle phase and can combine with NH3 available in air, forming sulfate salts (mostly ammonium sulfate/bisulfate) (Seinfeld and Pandis, 2006). Since the North China Plain is typically under rich NH3 regimes, is mainly in the form of ammonium sulfate (Meng et al., 2011; Huang et al., 2017); and the aforementioned reductions would therefore increase atmospheric NH3 concentrations by driving the phase state of NH3 from particulate to gaseous.
By assuming that a 1 mol decrease in simulated would lead to a 2 mol increase in ambient gaseous NH3 in this region, the average annual increase in the tropospheric NH3 columns due to the reductions of was estimated to be approximately 1.5 × 10¹⁵ molecules cm−2 yr−1 over the North China Plain during 2008–2016. This is comparable with or higher than the simulated results from Run_08 to Run_16, as well as the IASI observations (0.9 × 10¹⁵ molecules cm−2 yr−1). By neglecting the deposition processes, we found that the rapid SO2 emission reduction of 50 % from 2012 to 2016 resulted in a 55 % increase in the NH3 columns, compared to that of 30 % recorded by IASI observations. Overall, the estimation results confirmed that the increasing trend of NH3 was mainly determined by the SO2 emission reductions.
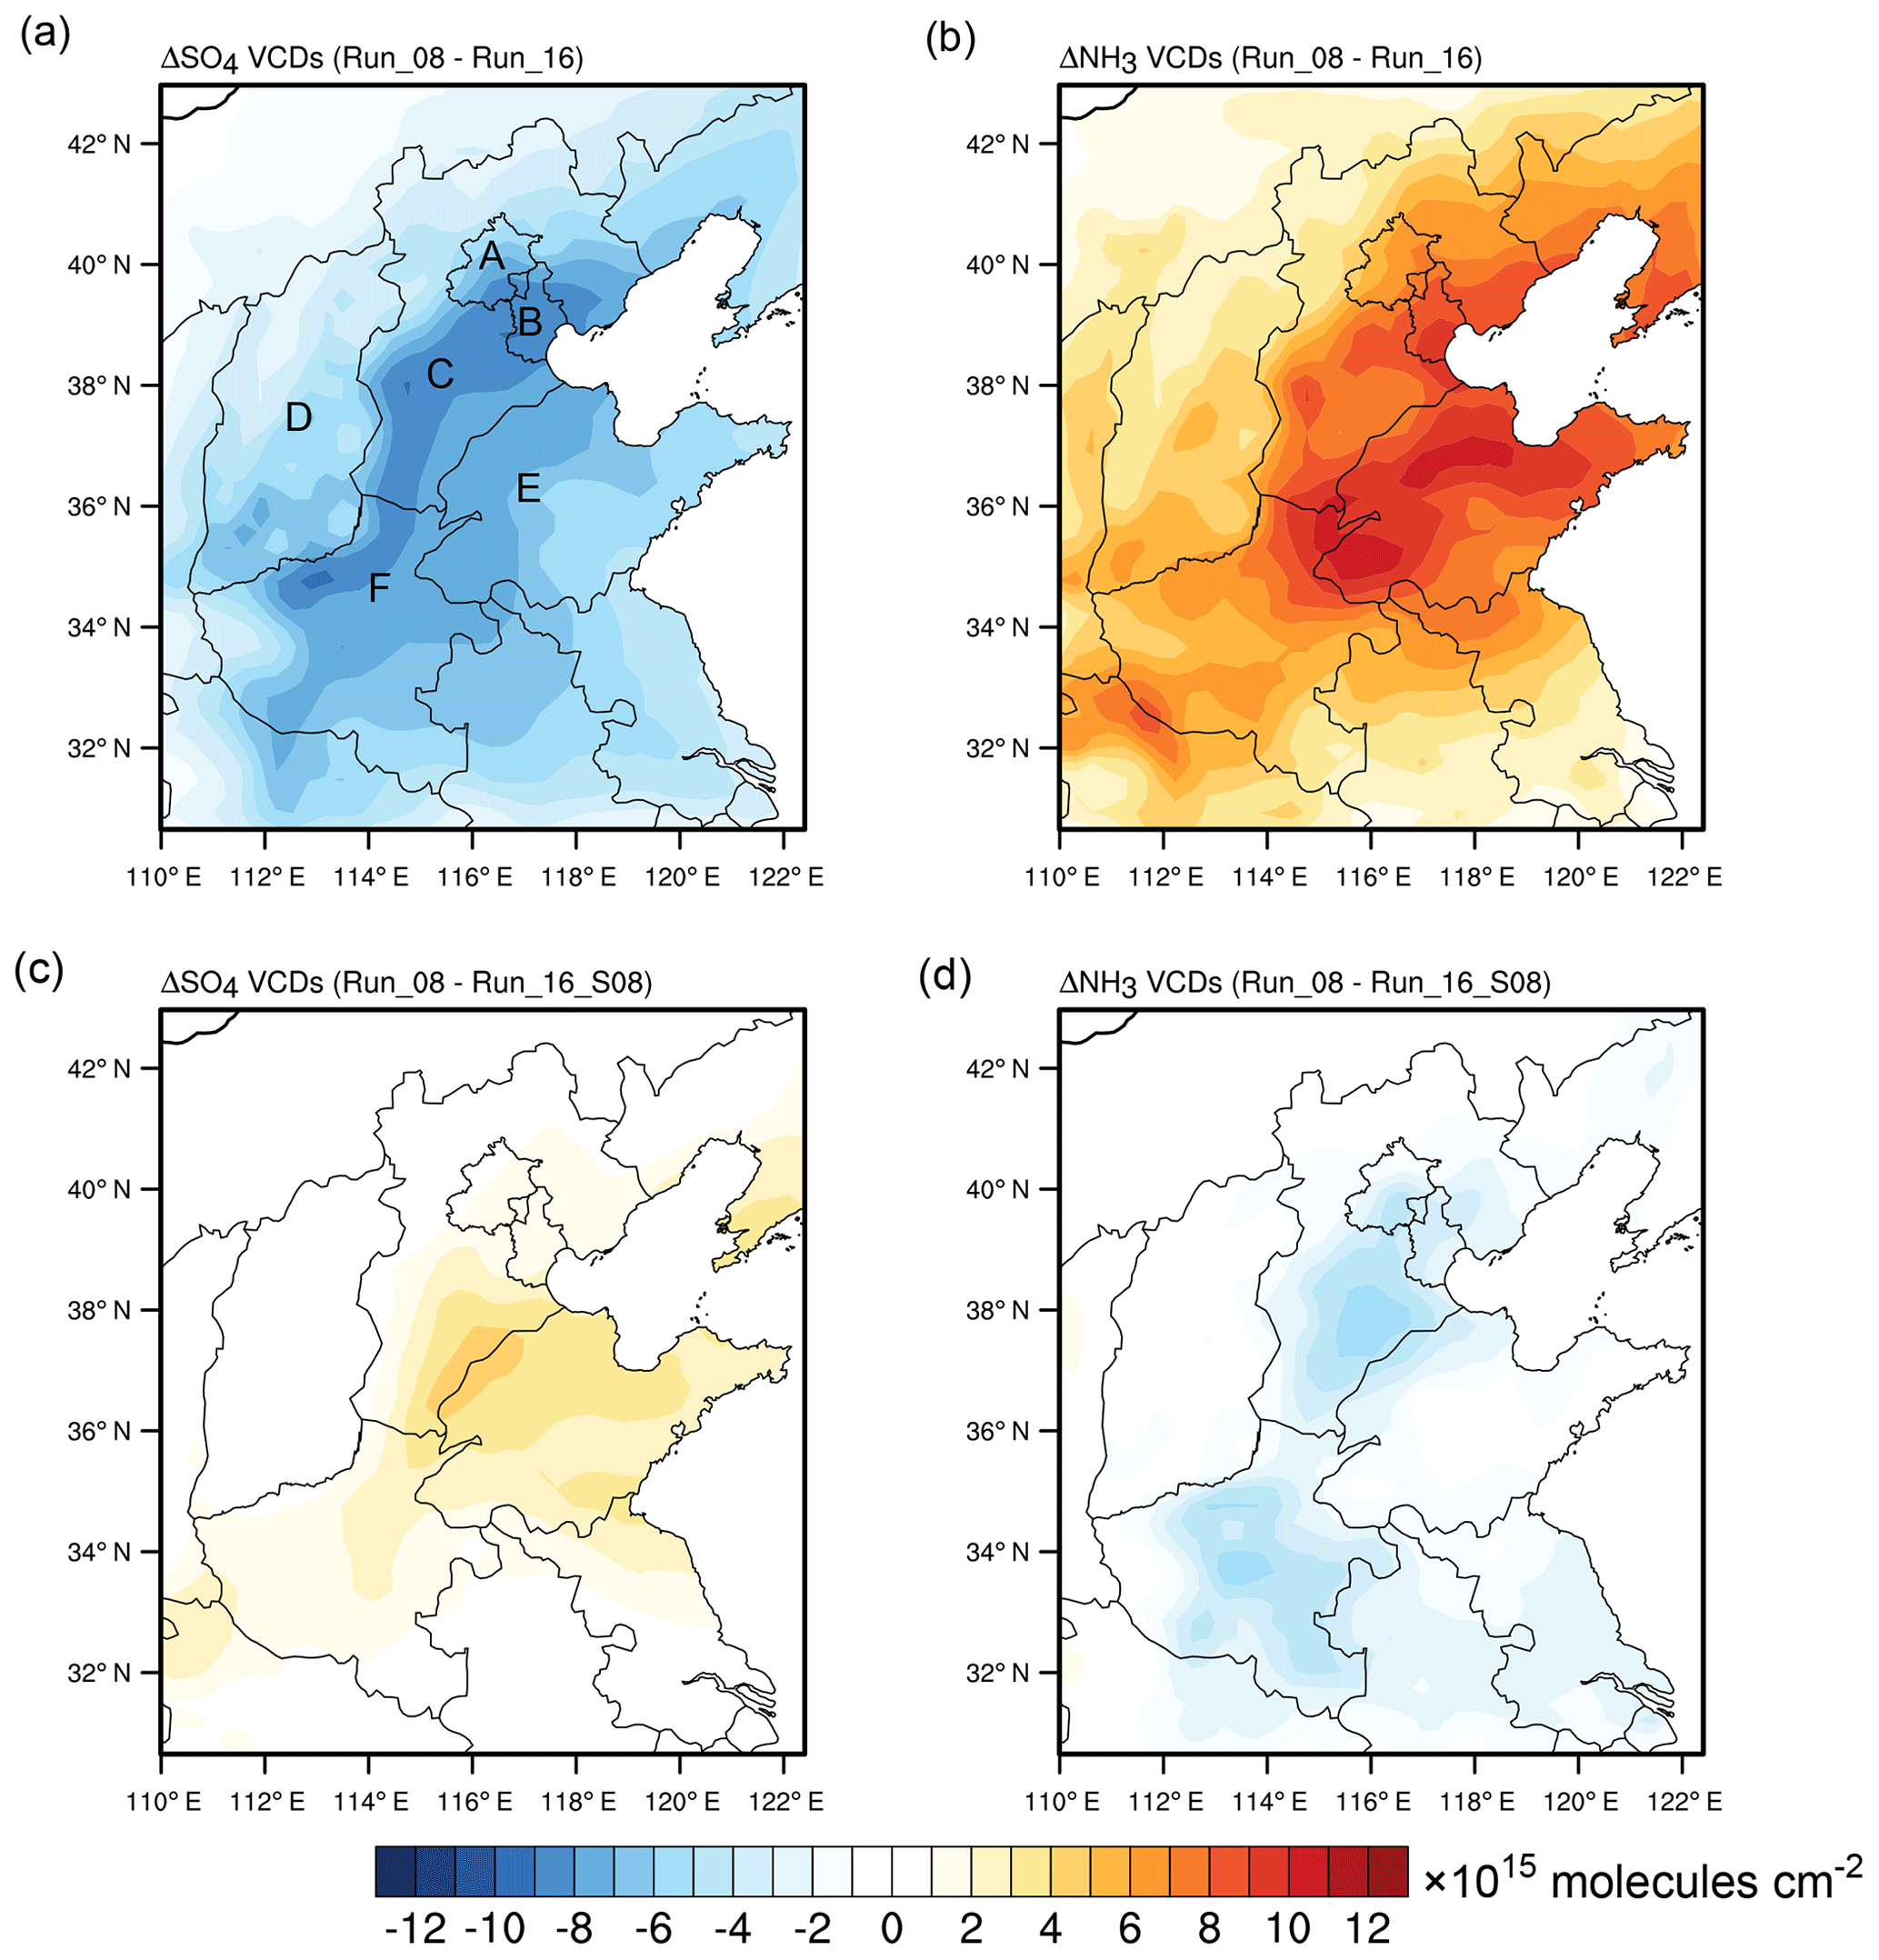
Figure 5The differences between Run_08 and Run_16 (a, b), and between Run_08 and Run_16_S08 (c, d). A–F in a denote the Beijing, Tianjin, Hebei, Shanxi, Shandong, and Henan Provinces, respectively.
We compared the spatial patterns of decreased and increased NH3 between 2008 and 2016 (Run_08 vs. Run_16). Large reductions of 6–10 × 1015 molecules cm−2 in annual averages of sulfate columns were concentrated in Hebei, Shandong, and Henan provinces, the area subject to high SO2 loadings and stringent emission controls (Fig. 5a). Meanwhile, the simulated increases in NH3 columns reached more than 8 × 10¹⁵ molecules cm−2 in most parts of the North China Plain (Fig. 5b) and were comparable with those observed by the IASI (8–16 × 1015 molecules cm−2). In addition, we found that concentrations have decreased with a similar magnitude to the increases in gas-phase NH3 levels between Run_08 and Run_16. The proportion of NH3 in the total () increased on average from 26 % in 2008 to 37 % in 2016 over the North China Plain. Figure 5c and d illustrate that, without the large SO2 emission reductions between 2008 and 2016 (i.e., replacing SO2 emissions in 2016 by those in 2008, Run_08 vs. Run_16_S08), the sulfate columns partly increased. Correspondingly, the NH3 columns remained constant or decreased by about 5 × 10¹⁵ molecules cm−2 (−13 % relative to the 2008 level) in parts of the North China Plain. Thus, the increase in the tropospheric NH3 columns was the result of a transition in NH3 phase partitioning, which was strongly associated with the decreased formation of ammonium sulfate due to SO2 emission reductions.
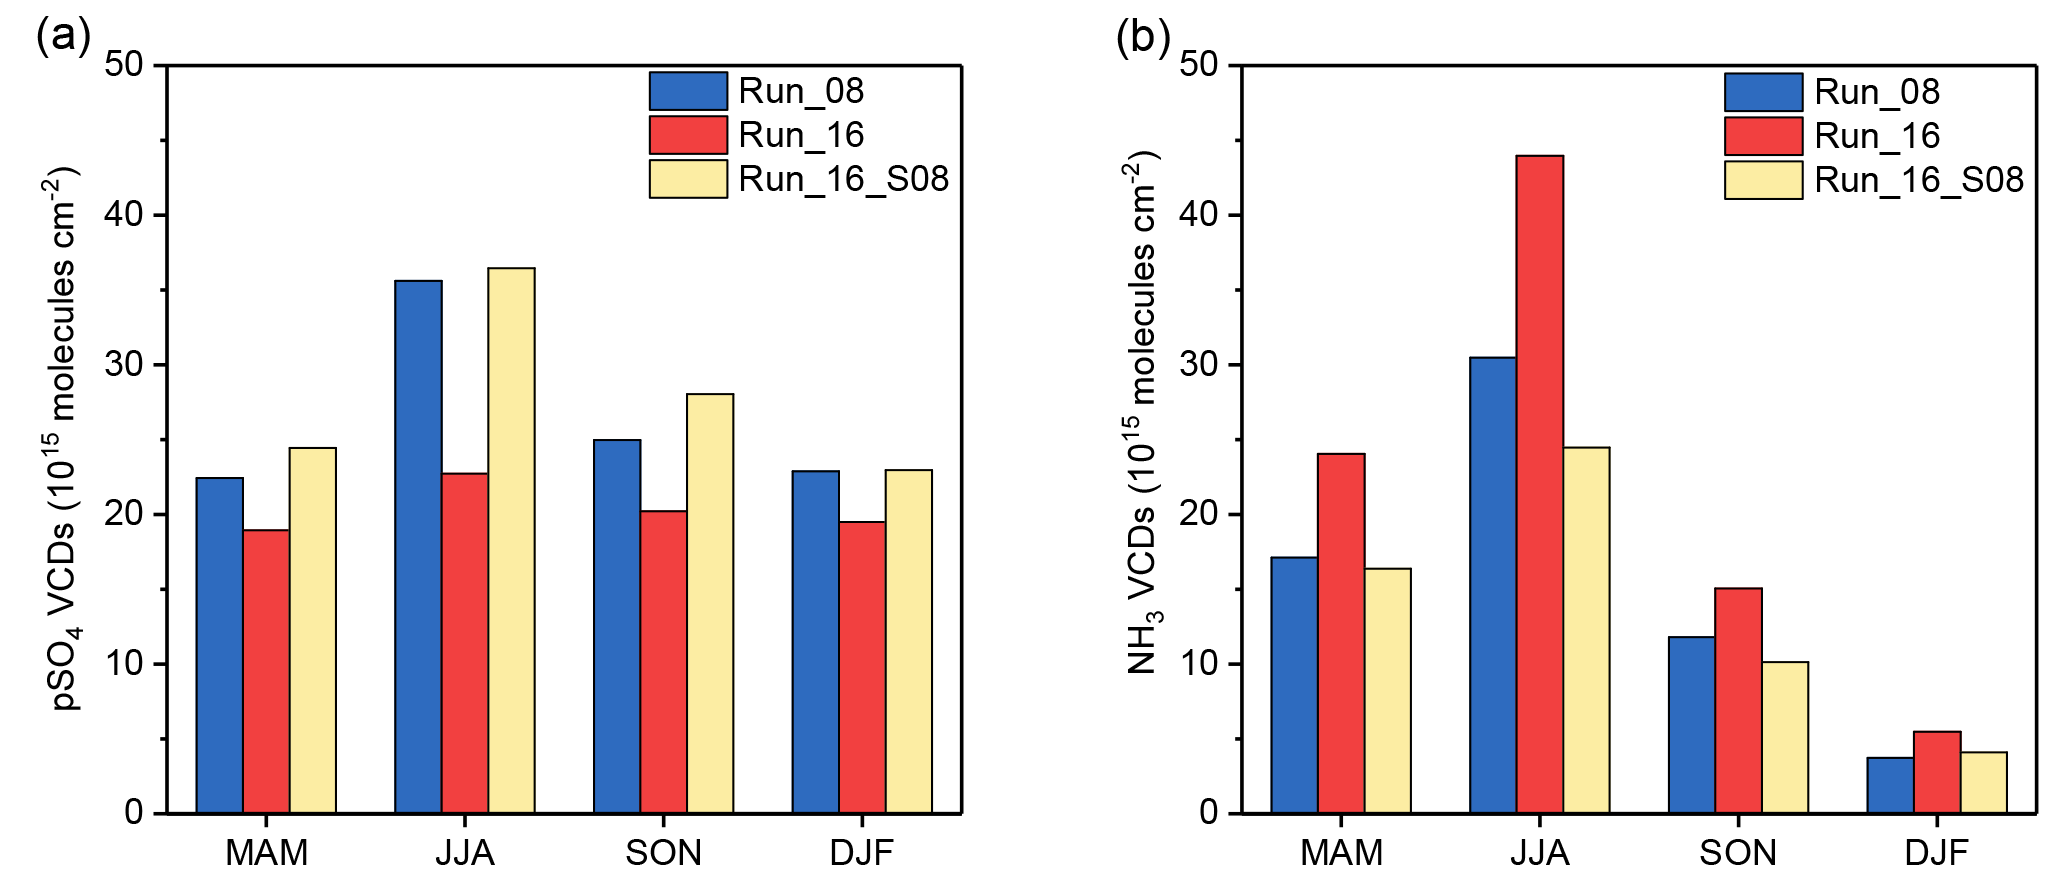
Figure 6Seasonal patterns of simulated (a) and NH3 (b) columns for Run_08, Run_16, and Run_16_S08 (the simulation for 2016 with SO2 emissions in 2008) cases. MAM, JJA, SON, and DJF represent spring (March, April, and May), summer (June, July, and August), autumn (September, October, and November), and winter (December, January, and February) months.
The seasonal variations in decreases and NH3 increases were consistent (Fig. 6). We can see that the reduction of sulfate column concentrations between the Run_08 and Run_16 reached 1.3 × 10¹⁵ molecules cm−2 in summer (JJA), which was about 3 times larger than in other seasons. The corresponding percent reductions ranged from 15 % in DJF to 36 % in JJA. As aforementioned, the observations of PM2.5 in Beijing also showed the highest decrease in sulfate in summer. Considering that the SO2 emission reductions were uniform throughout the year, this seasonal pattern was likely attributed to the conversion efficiency of SO2 to H2SO4. Our simulations showed that a 1 mol decrease in SO2 corresponded to an approximately 0.7 mol decrease in particulate sulfate in summer over the North China Plain, but the values dropped to below 0.4 in other seasons. It is known that the photochemical oxidation of SO2 by OH radical is most active in summertime due to high atmospheric oxidizing capacity, and it dominates the formation of , which makes the response of concentrations to SO2 emission reductions more sensitive (Paulot et al., 2017; Huang et al., 2014). The comparison of modeled NH3 columns also showed a markedly higher increase in summer months than during other seasons, driven by the variations in . Furthermore, by comparing the model results between the Run_16 and Run_16_S08 cases, we found that, without considering the SO2 emission reductions, the seasonal increases in NH3 columns and decreases in concentrations were not observed.
Since the chemical formation of particulate ammonium nitrate also affects the gas–particle partitioning of NH3, the role of NOx emissions should be discussed. We noted that, unlike the trend of particulate sulfate in PM2.5, the simulated concentrations of particulate nitrate in PM2.5 increased on average by 28 % over the North China Plain between 2008 and 2016, despite a 16 % reduction in NOx emissions (Fig. S4 in the Supplement). This trend can be partially explained by the increased NH3 in the atmosphere that would facilitate the formation of ammonium nitrate. To quantitatively understand the effect of NOx emission on the trend of NH3, we performed a sensitivity experiment by repeating the simulation of 2016 with the NOx emissions in 2008 (Run_16_08N). By comparing the results among Run_16, Run_16_08N, and Run_08, we found that the reduction in NOx emissions (16 % from 2008 to 2016) decreased the gaseous NH3 concentrations by about 3 % (Fig. S5 in the Supplement). Specifically, because the reduced NOx in this period promoted the transition of ozone (O3) photochemistry from a volatile organic compound (VOC)-limited to a transitional regime with high O3 production efficiency (Jin and Holloway, 2015), the simulated annual mean O3 concentrations were elevated by 3.7 ppb over the North China Plain between the Run_16_08N and Run_16 cases. The resultant enhancement in atmospheric oxidizing capacity would favor the conversion of NO2 to and therefore derive more NH3 partitioning from gaseous to particulate phases via aerosol thermodynamic equilibrium. Moreover, the measurements at an urban station of Beijing indicated a fluctuating trend of the annual mean concentrations during 2013–2016 (Fig. 1). Overall, the limited reduction in NOx emissions cannot be responsible for the increased NH3, because the concentrations of particulate nitrate has remained high over the North China Plain during recent years.
Besides, meteorological conditions are known to have an influence on NH3 concentrations. Both Warner et al. (2017) and Fu et al. (2017) found that elevated annual surface temperature has partially contributed to the increase in NH3 in eastern China over the past decade. In this work, we tested the effects of meteorological conditions on NH3 variations by a simulation with meteorological fields in 2016 and anthropogenic emissions in 2012 (Run_12_M16). We selected these 2 years because NH3 concentrations experienced a rapid increase during the period. This change in meteorological fields for the Run_12_M16 resulted in a decrease of about 3 % in annual mean NH3 concentrations relative to the Run_12 (Fig. S6 in the Supplement). Therefore, the inter-annual variability in meteorological conditions cannot explain the observed significant increase over the North China Plain.
Interestingly, increasing trends of gas-phase NH3 in the atmosphere have also been observed in the last 20 years in the Midwest of the United States and Western Europe by satellite retrievals and ground measurements (Saylor et al., 2015; Warner et al., 2017; Ferm and Hellsten, 2012). The marked decreases in SO2 and NOx emissions were largely responsible for these increases, as confirmed by the corresponding trends of particulate sulfate and nitrate concentrations. Warner et al. (2017) infer that SO2 emission reduction in China may be a leading cause of the increased NH3. More recently, Yu et al. (2018) quantified the contributions of the acid gases on the trends of NH3 and found that emissions of SO2 contributed to two-thirds and NOx to one-third of the change in NH3 over the United States from 2001 to 2016. In this work, we demonstrate that the rapid reduction in SO2 emissions was responsible for the increase in NH3 over the North China Plain during 2008–2016, while other potential pathways (NH3 emissions, NOx emissions, and meteorological conditions) decreased its concentrations by approximately 13 % for this period.
By integrating chemical model simulations and ground and satellite observations, this study investigates an increase (∼ 30 %) in tropospheric NH3 column concentrations that was observed from the space over the North China Plain during 2008–2016. First, the long-term NH3 emission inventory presents a decreasing tendency of −7 % in the emission, and therefore it cannot explain the NH3 increase. The meteorological variations and the change in NOx emissions in the study period decreased the NH3 column concentrations both by about 3 %. Our work strongly indicates that the rapid SO2 emission reductions (60 %) from 2008 to 2016 were responsible for the NH3 increase. The multi-year WRF-Chem simulations capture the increasing trend of NH3 and decreasing trend of particulate sulfate well. Simulation results demonstrate that the SO2 emission reductions decreased the regional mean concentrations by about 50 % in the lower troposphere, which reduced the formation of ammonium sulfate particles and consequently increased the average proportions of gas-phase NH3 from 26 % (2008) to 37 % (2016) within the total NH3 column concentrations. The sensitivity simulations by fixing SO2 emissions of 2008 show that, without the reductions in SO2 emissions, the increase in NH3 is not observed during 2008–2016, and even a decrease of 13 % takes place, which is associated with the effects of other mechanisms (NH3 emissions, NOx emission, and meteorology). Seasonally, both simulation and observations show the highest decrease in sulfate concentrations, making the increasing trend of NH3 more pronounced in this season. This is likely due to a more sensitive response of sulfate concentrations to SO2 emission reductions in summer than in other seasons.
Given the ongoing stringent controls on SO2 emissions in China, a continued increase in NH3 concentrations is anticipated if NH3 emissions are not regulated. The increased tropospheric NH3 levels may have a significant impact on air pollution and nitrogen deposition in China. For instance, the elevated NH3 would facilitate ammonium nitrate formation based on the aerosol thermodynamic equilibrium and negatively impact PM2.5 control. That is supported by the fact that concentrations remain high in northern China and have become increasingly important in contributing to PM2.5 pollution (Wen et al., 2018; Li et al., 2018), despite a moderate NOx emission reduction. The increased proportion of gas-phase NH3 within the total can increase ammonium–nitrogen deposition since gas-phase ammonia deposits more rapidly than particle ammonium. This may alter the spatial pattern of regional nitrogen deposition with higher levels of NH3 deposited near emission sources. These effects are important for human and ecosystem health and need to be investigated in future studies.
NH3 vertical column density data are freely available through the AERIS database: http://iasi.aeris-data.fr/NH_3/ (last access: 13 September 2017) (Whitburn et al., 2017). The SO2 vertical column density retrieved from the Ozone Monitoring Instrument is available from the Level-3 Aura/OMI Global SO2 Data Products (OMSO2e) released by the NASA Goddard Earth Sciences Data and Information Service Center (https://disc.sci.gsfc.nasa.gov/ (last access: 1 March 2018) (Krotkov et al., 2015). Anthropogenic emissions in industry, power plants, transportation, and residential sectors are obtained from the Multi-resolution Emission Inventory for China (MEIC, http://www.meicmodel.org/, last access: 15 May 2018) (Zheng et al., 2018). The PKU-NH3 emission inventory is freely available from the corresponding author Yu Song (songyu@pku.edu.cn) upon reasonable request.
The supplement related to this article is available online at: https://doi.org/10.5194/acp-18-17933-2018-supplement.
YS, MH, and TZ designed the study. ZW and MH conducted measurements of aerosol chemical compositions. YP conducted measurements of gas-phase ammonia concentrations. QZ developed the MEIC emission database. ML, XH, and XL contributed to the development of the ammonia emission inventory. ML, XH, YS, TX, SW, LZ, and TZ analyzed the data. ML led the writing with input from all co-authors.
The authors declare that they have no conflict of interest.
This study was funded by the National Key R&D
Program of China (2016YFC0201505), National Natural Science Foundation of
China (NSFC) (91644212 and 41675142), and National Research Program for Key
Issues in Air Pollution Control (DQGG0208).
Edited by:
Marc von Hobe
Reviewed by: two anonymous referees
Asman, W. A. H.: Modelling the atmospheric transport and deposition of ammonia and ammonium: an overview with special reference to Denmark, Atmos. Environ., 35, 1969–1983, https://doi.org/10.1016/S1352-2310(00)00548-3, 2001.
Asman, W. A. H., Sutton, M. A., and Schjørring, J. K.: Ammonia: emission, atmospheric transport and deposition, New Phytol., 139, 27–48, https://doi.org/10.1046/j.1469-8137.1998.00180.x, 1998.
Behera, S. N., Sharma, M., Aneja, V. P., and Balasubramanian, R.: Ammonia in the atmosphere: a review on emission sources, atmospheric chemistry and deposition on terrestrial bodies, Environ. Sci. Pollut. Res. Int., 20, 8092–8131, https://doi.org/10.1007/s11356-013-2051-9, 2013.
Bouwman, A. F., Lee, D. S., Asman, W. A. H., Dentener, F. J., Van Der Hoek, K. W., and Olivier, J. G. J.: A global high-resolution emission inventory for ammonia, Global Biogeochem. Cy., 11, 561–587, https://doi.org/10.1029/97gb02266, 1997.
Clarisse, L., Clerbaux, C., Dentener, F., Hurtmans, D., and Coheur, P.-F.: Global ammonia distribution derived from infrared satellite observations, Nat. Geosci., 2, 479–483, https://doi.org/10.1038/ngeo551, 2009.
Ferm, M. and Hellsten, S.: Trends in atmospheric ammonia and particulate ammonium concentrations in Sweden and its causes, Atmos. Environ., 61, 30–39, https://doi.org/10.1016/j.atmosenv.2012.07.010, 2012.
Fu, X., Wang, S., Xing, J., Zhang, X., Wang, T., and Hao, J.: Increasing Ammonia Concentrations Reduce the Effectiveness of Particle Pollution Control Achieved via SO2 and NOX Emissions Reduction in East China, Environ. Sci. Tech. Lett., 4, 221–227, https://doi.org/10.1021/acs.estlett.7b00143, 2017.
Grell, G. A., Peckham, S. E., Schmitz, R., McKeen, S. A., Frost, G., Skamarock, W. C., and Eder, B.: Fully coupled “online” chemistry within the WRF model, Atmos. Environ., 39, 6957–6975, https://doi.org/10.1016/j.atmosenv.2005.04.027, 2005.
Huang, X., Song, Y., Li, M., Li, J., Huo, Q., Cai, X., Zhu, T., Hu, M., and Zhang, H.: A high-resolution ammonia emission inventory in China, Global Biogeochem. Cy., 26, GB1030, https://doi.org/10.1029/2011GB004161, 2012.
Huang, X., Song, Y., Zhao, C., Li, M., Zhu, T., Zhang, Q., and Zhang, X.: Pathways of sulfate enhancement by natural and anthropogenic mineral aerosols in China, J. Geophys. Res.-Atmos., 119, 14165–14179, https://doi.org/10.1002/2014JD022301, 2014.
Huang, X., Song, Y., Zhao, C., Cai, X., Zhang, H., and Zhu, T.: Direct Radiative Effect by Multicomponent Aerosol over China, J. Climate, 28, 3472–3495, https://doi.org/10.1175/JCLI-D-14-00365.1, 2015.
Huang, X., Liu, Z., Liu, J., Hu, B., Wen, T., Tang, G., Zhang, J., Wu, F., Ji, D., Wang, L., and Wang, Y.: Chemical characterization and source identification of PM2.5 at multiple sites in the Beijing–Tianjin–Hebei region, China, Atmos. Chem. Phys., 17, 12941–12962, 10.5194/acp-17-12941-2017, 2017.
Huo, Q., Cai, X., Kang, L., Zhang, H., Song, Y., and Zhu, T.: Estimating ammonia emissions from a winter wheat cropland in North China Plain with field experiments and inverse dispersion modeling, Atmos. Environ., 104, 1–10, https://doi.org/10.1016/j.atmosenv.2015.01.003, 2015.
Jin, X. and Holloway, T.: Spatial and temporal variability of ozone sensitivity over China observed from the Ozone Monitoring Instrument, J. Geophys. Res.-Atmos., 120, 7229–7246, https://doi.org/10.1002/2015JD023250, 2015.
Kang, Y., Liu, M., Song, Y., Huang, X., Yao, H., Cai, X., Zhang, H., Kang, L., Liu, X., Yan, X., He, H., Zhang, Q., Shao, M., and Zhu, T.: High-resolution ammonia emissions inventories in China from 1980 to 2012, Atmos. Chem. Phys., 16, 2043–2058, https://doi.org/10.5194/acp-16-2043-2016, 2016.
Krotkov, N. A., Li, C., and Leonard, P.: OMI/Aura Sulfur Dioxide (SO2) Total Column L3 1 day Best Pixel in 0.25 degree × 0.25 degree V3, Greenbelt, MD, USA, Goddard Earth Sciences Data and Information Services Center (GES DISC), available at: https://disc.sci.gsfc.nasa.gov/ (last access: 1 March 2018), https://doi.org/10.5067/Aura/OMI/DATA3008, 2015.
Li, C., Zhang, Q., Krotkov, N. A., Streets, D. G., He, K., Tsay, S.-C., and Gleason, J. F.: Recent large reduction in sulfur dioxide emissions from Chinese power plants observed by the Ozone Monitoring Instrument, Geophys. Res. Lett., 37, L08807, https://doi.org/10.1029/2010gl042594, 2010.
Li, C., McLinden, C., Fioletov, V., Krotkov, N., Carn, S., Joiner, J., Streets, D., He, H., Ren, X., Li, Z., and Dickerson, R. R.: India Is Overtaking China as the World's Largest Emitter of Anthropogenic Sulfur Dioxide, Sci. Rep., 7, 14304, https://doi.org/10.1038/s41598-017-14639-8, 2017.
Li, H., Zhang, Q., Zheng, B., Chen, C., Wu, N., Guo, H., Zhang, Y., Zheng, Y., Li, X., and He, K.: Nitrate-driven urban haze pollution during summertime over the North China Plain, Atmos. Chem. Phys., 18, 5293–5306, https://doi.org/10.5194/acp-18-5293-2018, 2018.
Li, Q., Jiang, J., Cai, S., Zhou, W., Wang, S., Duan, L., and Hao, J.: Gaseous Ammonia Emissions from Coal and Biomass Combustion in Household Stoves with Different Combustion Efficiencies, Environ. Sci. Tech. Lett., 3, 98–103, https://doi.org/10.1021/acs.estlett.6b00013, 2016.
Liu, F., Zhang, Q., van der A, R. J., Zheng, B., Tong, D., Yan, L., Zheng, Y., and He, K.: Recent reduction in NOx emissions over China: synthesis of satellite observations and emission inventories, Environ. Res. Lett., 11, 114002, https://doi.org/10.1088/1748-9326/11/11/114002, 2016.
Lu, Z., Zhang, Q., and Streets, D. G.: Sulfur dioxide and primary carbonaceous aerosol emissions in China and India, 1996–2010, Atmos. Chem. Phys., 11, 9839–9864, https://doi.org/10.5194/acp-11-9839-2011, 2011.
Meng, Z. Y., Lin, W. L., Jiang, X. M., Yan, P., Wang, Y., Zhang, Y. M., Jia, X. F., and Yu, X. L.: Characteristics of atmospheric ammonia over Beijing, China, Atmos. Chem. Phys., 11, 6139–6151, https://doi.org/10.5194/acp-11-6139-2011, 2011.
Pan, Y., Tian, S., Zhao, Y., Zhang, L., Zhu, X., Gao, J., Huang, W., Zhou, Y., Song, Y., Zhang, Q., and Wang, Y.: Identifying Ammonia Hotspots in China Using a National Observation Network, Environ. Sci. Technol., 52, 3926–3934, https://doi.org/10.1021/acs.est.7b05235, 2018.
Paulot, F., Jacob, D. J., Pinder, R. W., Bash, J. O., Travis, K., and Henze, D. K.: Ammonia emissions in the United States, European Union, and China derived by high-resolution inversion of ammonium wet deposition data: Interpretation with a new agricultural emissions inventory (MASAGE_NH3), J. Geophys. Res.-Atmos., 119, 4343–4364, https://doi.org/10.1002/2013jd021130, 2014.
Paulot, F., Ginoux, P., Cooke, W. F., Donner, L. J., Fan, S., Lin, M.-Y., Mao, J., Naik, V., and Horowitz, L. W.: Sensitivity of nitrate aerosols to ammonia emissions and to nitrate chemistry: implications for present and future nitrate optical depth, Atmos. Chem. Phys., 16, 1459–1477, https://doi.org/10.5194/acp-16-1459-2016, 2016.
Paulot, F., Fan, S., and Horowitz, L. W.: Contrasting seasonal responses of sulfate aerosols to declining SO2 emissions in the Eastern U.S.: Implications for the efficacy of SO2 emission controls, Geophys. Res. Lett., 44, 455–464, https://doi.org/10.1002/2016gl070695, 2017.
Pope, C. A. I., Ezzati, M., and Dockery , D. W.: Fine-Particulate Air Pollution and Life Expectancy in the United States, N. Engl. J. Med., 360, 376–386, https://doi.org/10.1056/NEJMsa0805646, 2009.
Pozzer, A., Tsimpidi, A. P., Karydis, V. A., de Meij, A., and Lelieveld, J.: Impact of agricultural emission reductions on fine-particulate matter and public health, Atmos. Chem. Phys., 17, 12813–12826, https://doi.org/10.5194/acp-17-12813-2017, 2017.
Saylor, R., Myles, L., Sibble, D., Caldwell, J., and Xing, J.: Recent trends in gas-phase ammonia and PM2.5 ammonium in the Southeast United States, J. Air Waste Manag. Assoc., 65, 347–357, https://doi.org/10.1080/10962247.2014.992554, 2015.
Seinfeld, J. H. and Pandis, S. N.: Atmospheric Chemistry and Physics: From Air Pollution to Climate Change, 2nd ed., John Wiley & Sons, Hoboken, New Jersey, USA, 2006.
Van Damme, M., Clarisse, L., Heald, C. L., Hurtmans, D., Ngadi, Y., Clerbaux, C., Dolman, A. J., Erisman, J. W., and Coheur, P. F.: Global distributions, time series and error characterization of atmospheric ammonia (NH3) from IASI satellite observations, Atmos. Chem. Phys., 14, 2905–2922, https://doi.org/10.5194/acp-14-2905-2014, 2014.
Van Damme, M., Clarisse, L., Dammers, E., Liu, X., Nowak, J. B., Clerbaux, C., Flechard, C. R., Galy-Lacaux, C., Xu, W., Neuman, J. A., Tang, Y. S., Sutton, M. A., Erisman, J. W., and Coheur, P. F.: Towards validation of ammonia (NH3) measurements from the IASI satellite, Atmos. Meas. Tech., 8, 1575–1591, https://doi.org/10.5194/amt-8-1575-2015, 2015.
Van Damme, M., Whitburn, S., Clarisse, L., Clerbaux, C., Hurtmans, D., and Coheur, P.-F.: Version 2 of the IASI NH3 neural network retrieval algorithm: near-real-time and reanalysed datasets, Atmos. Meas. Tech., 10, 4905–4914, https://doi.org/10.5194/amt-10-4905-2017, 2017.
Warner, J. X., Dickerson, R. R., Wei, Z., Strow, L. L., Wang, Y., and Liang, Q.: Increased atmospheric ammonia over the world's major agricultural areas detected from space, Geophys. Res. Lett., 44, 2875–2884, https://doi.org/10.1002/2016gl072305, 2017.
Wen, L., Xue, L., Wang, X., Xu, C., Chen, T., Yang, L., Wang, T., Zhang, Q., and Wang, W.: Summertime fine particulate nitrate pollution in the North China Plain: increasing trends, formation mechanisms and implications for control policy, Atmos. Chem. Phys., 18, 11261–11275, https://doi.org/10.5194/acp-18-11261-2018, 2018.
Whitburn, S., Van Damme, M., Clarisse, L., Bauduin, S., Heald, C. L., Hadji-Lazaro, J., Hurtmans, D., Zondlo, M. A., Clerbaux, C., and Coheur, P. F.: A flexible and robust neural network IASI-NH3 retrieval algorithm, J. Geophys. Res.-Atmos., 121, 6581-6599, https://doi.org/10.1002/2016jd024828, 2016.
Whitburn, S., Clarisse, L., Van Damme, M., and Coheur, P.-F.: Ammonia total columns retrieved from IASI measurements, Greenbelt, Universite Libre de Bruxelles (ULB)/Laboratoire atmosphères, milieux et observations spatiales (LATMOS), available at: https://iasi.aeris-data.fr/nh3/ (last access: 13 September 2017), 2017.
Yu, F., Nair, A. A., and Luo, G.: Long-term trend of gaseous ammonia over the United States: Modeling and comparison with observations, J. Geophys. Res.-Atmos., 123, 8315–8325, https://doi.org/10.1029/2018JD028412, 2018.
Zhang, L., Chen, Y., Zhao, Y., Henze, D. K., Zhu, L., Song, Y., Paulot, F., Liu, X., Pan, Y., Lin, Y., and Huang, B.: Agricultural ammonia emissions in China: reconciling bottom-up and top-down estimates, Atmos. Chem. Phys., 18, 339–355, https://doi.org/10.5194/acp-18-339-2018, 2018.
Zheng, B., Tong, D., Li, M., Liu, F., Hong, C., Geng, G., Li, H., Li, X., Peng, L., Qi, J., Yan, L., Zhang, Y., Zhao, H., Zheng, Y., He, K., and Zhang, Q.: Trends in China's anthropogenic emissions since 2010 as the consequence of clean air actions, Atmos. Chem. Phys., 18, 14095–14111, https://doi.org/10.5194/acp-18-14095-2018, 2018.
Zhu, L., Henze, D., Bash, J., Jeong, G.-R., Cady-Pereira, K., Shephard, M., Luo, M., Paulot, F., and Capps, S.: Global evaluation of ammonia bidirectional exchange and livestock diurnal variation schemes, Atmos. Chem. Phys., 15, 12823–12843, https://doi.org/10.5194/acp-15-12823-2015, 2015.