the Creative Commons Attribution 4.0 License.
the Creative Commons Attribution 4.0 License.
 | 14 Dec 2018
Principal component analysis of summertime ground site measurements in the Athabasca oil sands with a focus on analytically unresolved intermediate-volatility organic compounds
Travis W. Tokarek
Charles A. Odame-Ankrah
Jennifer A. Huo
Robert McLaren
Alex K. Y. Lee
Max G. Adam
Megan D. Willis
Jonathan P. D. Abbatt
Cristian Mihele
Andrea Darlington
Richard L. Mittermeier
Kevin Strawbridge
Katherine L. Hayden
Jason S. Olfert
Elijah G. Schnitzler
Duncan K. Brownsey
Faisal V. Assad
Gregory R. Wentworth
Alex G. Tevlin
Douglas E. J. Worthy
Shao-Meng Li
John Liggio
Jeffrey R. Brook
In this paper, measurements of air pollutants made at a ground site near Fort McKay in the Athabasca oil sands region as part of a multi-platform campaign in the summer of 2013 are presented. The observations included measurements of selected volatile organic compounds (VOCs) by a gas chromatograph–ion trap mass spectrometer (GC-ITMS). This instrument observed a large, analytically unresolved hydrocarbon peak (with a retention index between 1100 and 1700) associated with intermediate-volatility organic compounds (IVOCs). However, the activities or processes that contribute to the release of these IVOCs in the oil sands region remain unclear.
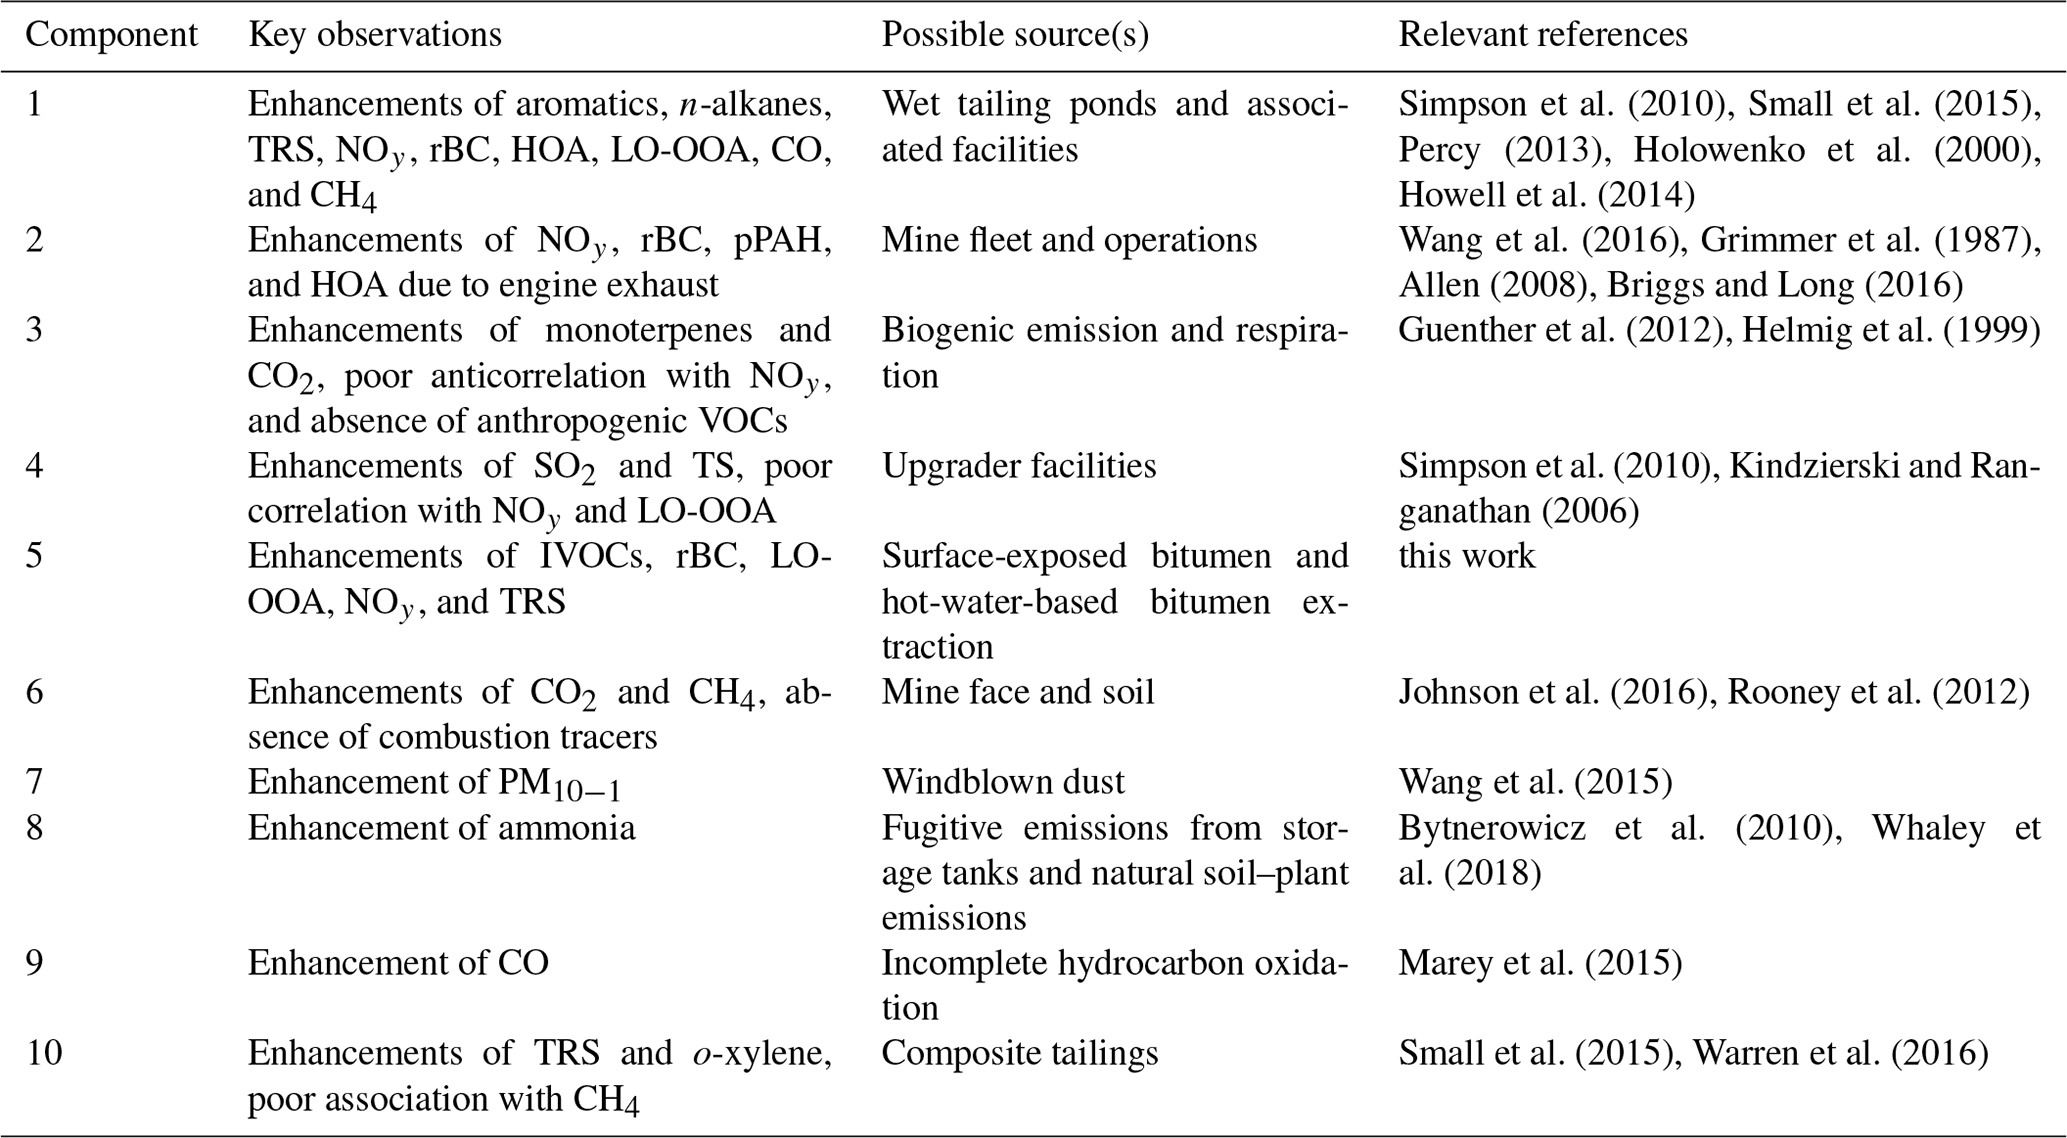
Principal component analysis (PCA) with varimax rotation was applied to elucidate major source types impacting the sampling site in the summer of 2013. The analysis included 28 variables, including concentrations of total odd nitrogen (NOy), carbon dioxide (CO2), methane (CH4), ammonia (NH3), carbon monoxide (CO), sulfur dioxide (SO2), total reduced-sulfur compounds (TRSs), speciated monoterpenes (including α- and β-pinene and limonene), particle volume calculated from measured size distributions of particles less than 10 and 1 µm in diameter (PM10−1 and PM1), particle-surface-bound polycyclic aromatic hydrocarbons (pPAHs), and aerosol mass spectrometer composition measurements, including refractory black carbon (rBC) and organic aerosol components. The PCA was complemented by bivariate polar plots showing the joint wind speed and direction dependence of air pollutant concentrations to illustrate the spatial distribution of sources in the area. Using the 95 % cumulative percentage of variance criterion, 10 components were identified and categorized by source type. These included emissions by wet tailing ponds, vegetation, open pit mining operations, upgrader facilities, and surface dust. Three components correlated with IVOCs, with the largest associated with surface mining and likely caused by the unearthing and processing of raw bitumen.
- Article
(3270 KB) -
Supplement
(3880 KB) - BibTeX
- EndNote


The Athabasca oil sands region of Northern Alberta, Canada, has seen extraordinary expansion of its oil sands production and processing facilities (CAPP, 2016) and associated emissions of air pollutants over the last several decades (Englander et al., 2013; Bari and Kindzierski, 2015). Air emissions from these facilities have been impacting surrounding communities, including the city of Fort McMurray and the community of Fort McKay (WBEA, 2013). To assess the impact of these emissions on human health, visibility, climate, and the ecosystems downwind, it is critical to obtain an understanding of the source types from all activities associated with oil sands operations (ECCC, 2016).
Prior to 2013, there had been only a single industry-independent study of trace gas emissions from the Athabasca oil sands mining operations (Simpson et al., 2010; Howell et al., 2014). The data showed elevated concentrations in n-alkanes (30 % of the total quantified hydrocarbon emissions), cycloalkanes (49 %), and aromatics (15 %) in plumes from an oil sands surface mining facility intercepted from a single aircraft flight. These compounds are associated with oil and gas developments including mining, upgrading, and transportation of bitumen (Siddique et al., 2006). Specifically, these activities involve the use of naphtha, a complex mixture of aliphatic and aromatic hydrocarbons in the range of C3- to C14-containing n-alkanes (e.g., n-heptane, n-octane, and n-nonane) and benzene, toluene, ethylbenzene, and xylenes (BTEX).
In August 2013, a comprehensive air quality study as a part of the Joint Oil Sands Monitoring (JOSM) plan (JOSM, 2012), referred to here as the 2013 JOSM intensive study, was conducted. This study was performed in northern Alberta at two ground sites in and near Fort McKay in close proximity (as close as 3.5 km) to oil sands mining operations and from a National Research Council of Canada (NRC) Convair 580 research aircraft to characterize oil sands emissions and their downwind physical and chemical transformations (Gordon et al., 2015; Liggio et al., 2016; Li et al., 2017).
One ground site, located at Wood Buffalo Environmental Association (WBEA) air monitoring station (AMS) 13 (Fig. 1), was equipped with a comprehensive set of instrumentation to measure concentrations of a wide range of trace gases and aerosols (Table 1), yielding a unique and new data set, parts of which are presented in this paper for the first time. As part of this effort, a gas chromatograph equipped with an ion trap mass spectrometer (GC-ITMS) was deployed at AMS 13. When air masses passing over regions with industrial activities were observed (as judged from a combination of local wind direction and tracer measurements), the total ion chromatogram showed an analytically unresolved hydrocarbon signal associated with intermediate-volatility organic compounds (IVOCs) with a saturation concentration (C*) in the range of 105 µg m µg m−3 (Liggio et al., 2016).
Emission estimates for analytically unresolved hydrocarbons range from 5×10⁶ to 14×106 kg yr−1 for the two facilities that reported such emissions (Li et al., 2017). Using aircraft measurements during the 2013 study, Liggio et al. (2016) showed that IVOCs contributed to the majority of the observed secondary organic aerosol (SOA) mass production in a fashion similar to how anthropogenic VOCs contributed to SOA production during the Deepwater Horizon oil spill (de Gouw et al., 2011) and rivaling the magnitude of SOA formation observed downwind of megacities (Liggio et al., 2016), though ultimately it has remained unclear which activities are associated with IVOC emissions.
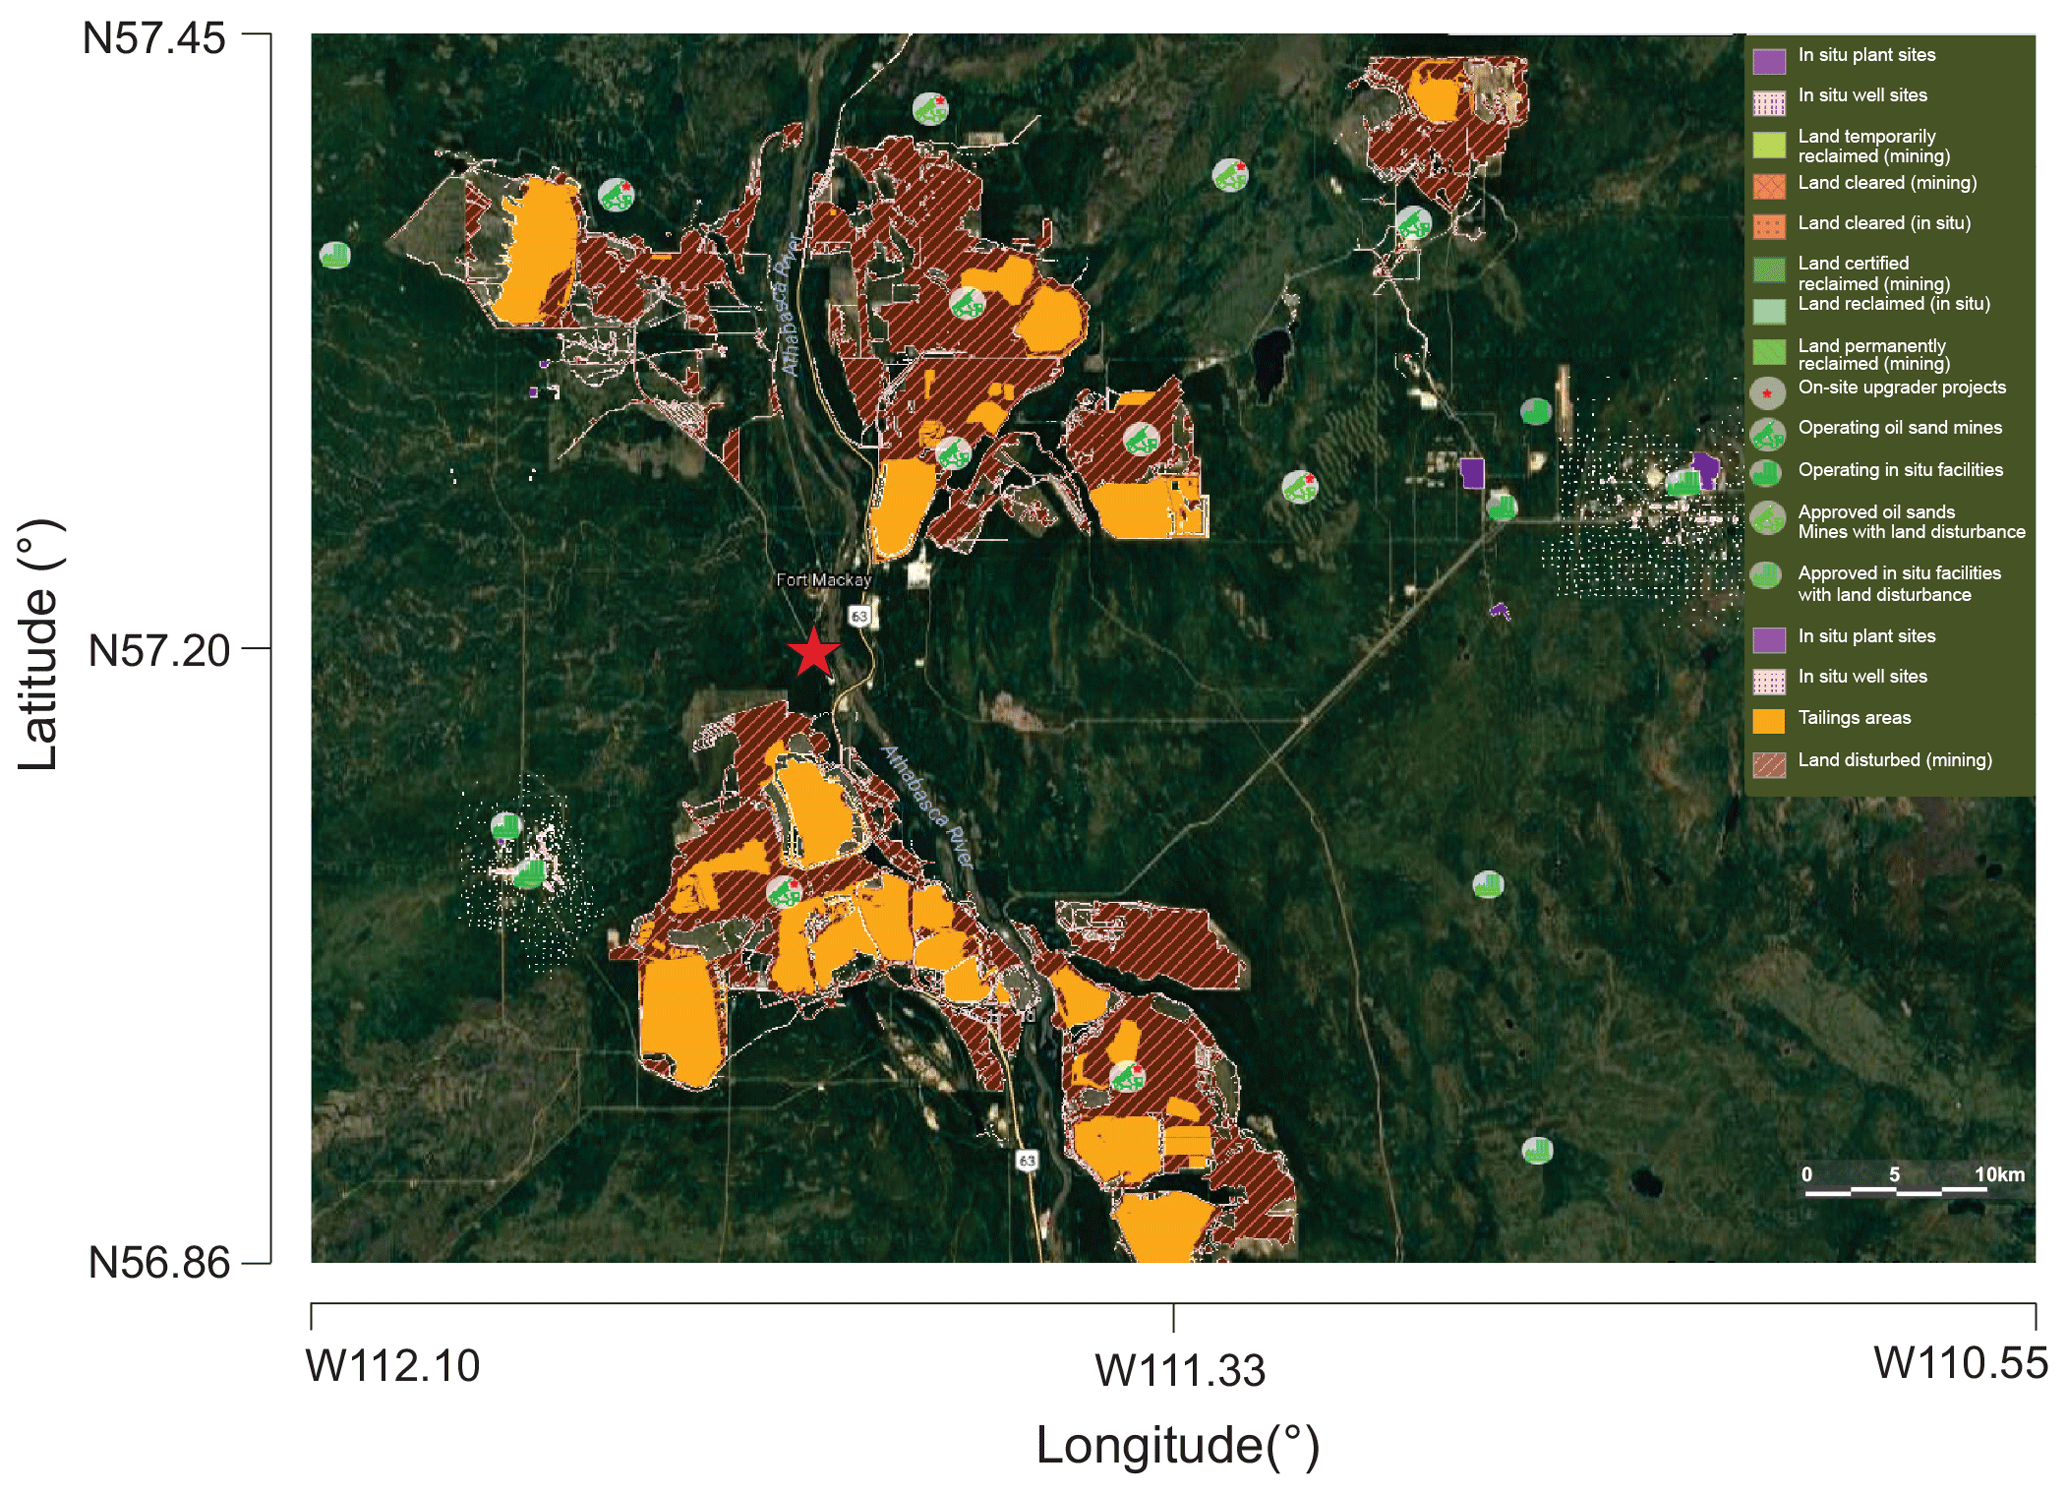
Figure 1Map of oil sands facilities showing locations of surface mines and tailing ponds, downloaded from the Oil Sands Information Portal (Alberta, 2017). The red star indicates the location of AMS 13.
In this paper, concurrent measurements of air pollutants at the AMS 13 ground site during the 2013 JOSM intensive study are presented. The analytically unresolved hydrocarbon signal was integrated and is presented as a time series and used as an input variable in a principal component analysis (PCA) to elucidate the origin of IVOCs in the Athabasca oil sands by association. The analysis presented here is a receptor analysis focusing on the normalized variability in pollutants impacting the AMS 13 ground site and hence does not constitute a comprehensive emission profile analysis of the oil sands facilities as a whole, for which aircraft-based measurements and/or direct plume or stack measurements are more suitable. PCA was chosen over the more popular positive matrix factorization (PMF) method (Paatero and Tapper, 1994) because it yields a unique solution and is particularly suited as an exploratory tool for identification of components without a priori constraints (Jolliffe and Cadima, 2016). The PCA was complemented by bivariate polar plots (Carslaw and Ropkins, 2012; Carslaw and Beevers, 2013) to show the spatial distribution of sources in the region as a function of locally measured wind direction and speed. A second PCA was performed to investigate which components correlate with (and generate) secondary pollutants, i.e., pollutants that are formed by atmospheric processes. Potential sources and processes contributing to each of the components identified by PCA are discussed.
2.1 Measurement location
Measurements of air pollutants were made at AMS 13 (Fig. 1), which is operated by WBEA. The site is located at −111.6423 longitude and 57.1492 latitude about 3 km from the southern edge of the community of Fort McKay, 300 m west from a public road, and 1 km west of the Athabasca River. The immediate vicinity of the site consisted of mixed-leaf boreal forest with a variety of tree species, including poplar, aspen, pine, and spruce (Smreciu et al., 2013). The site was accessible via a gravel road; traffic on this road was restricted during the study period (August–September 2013).
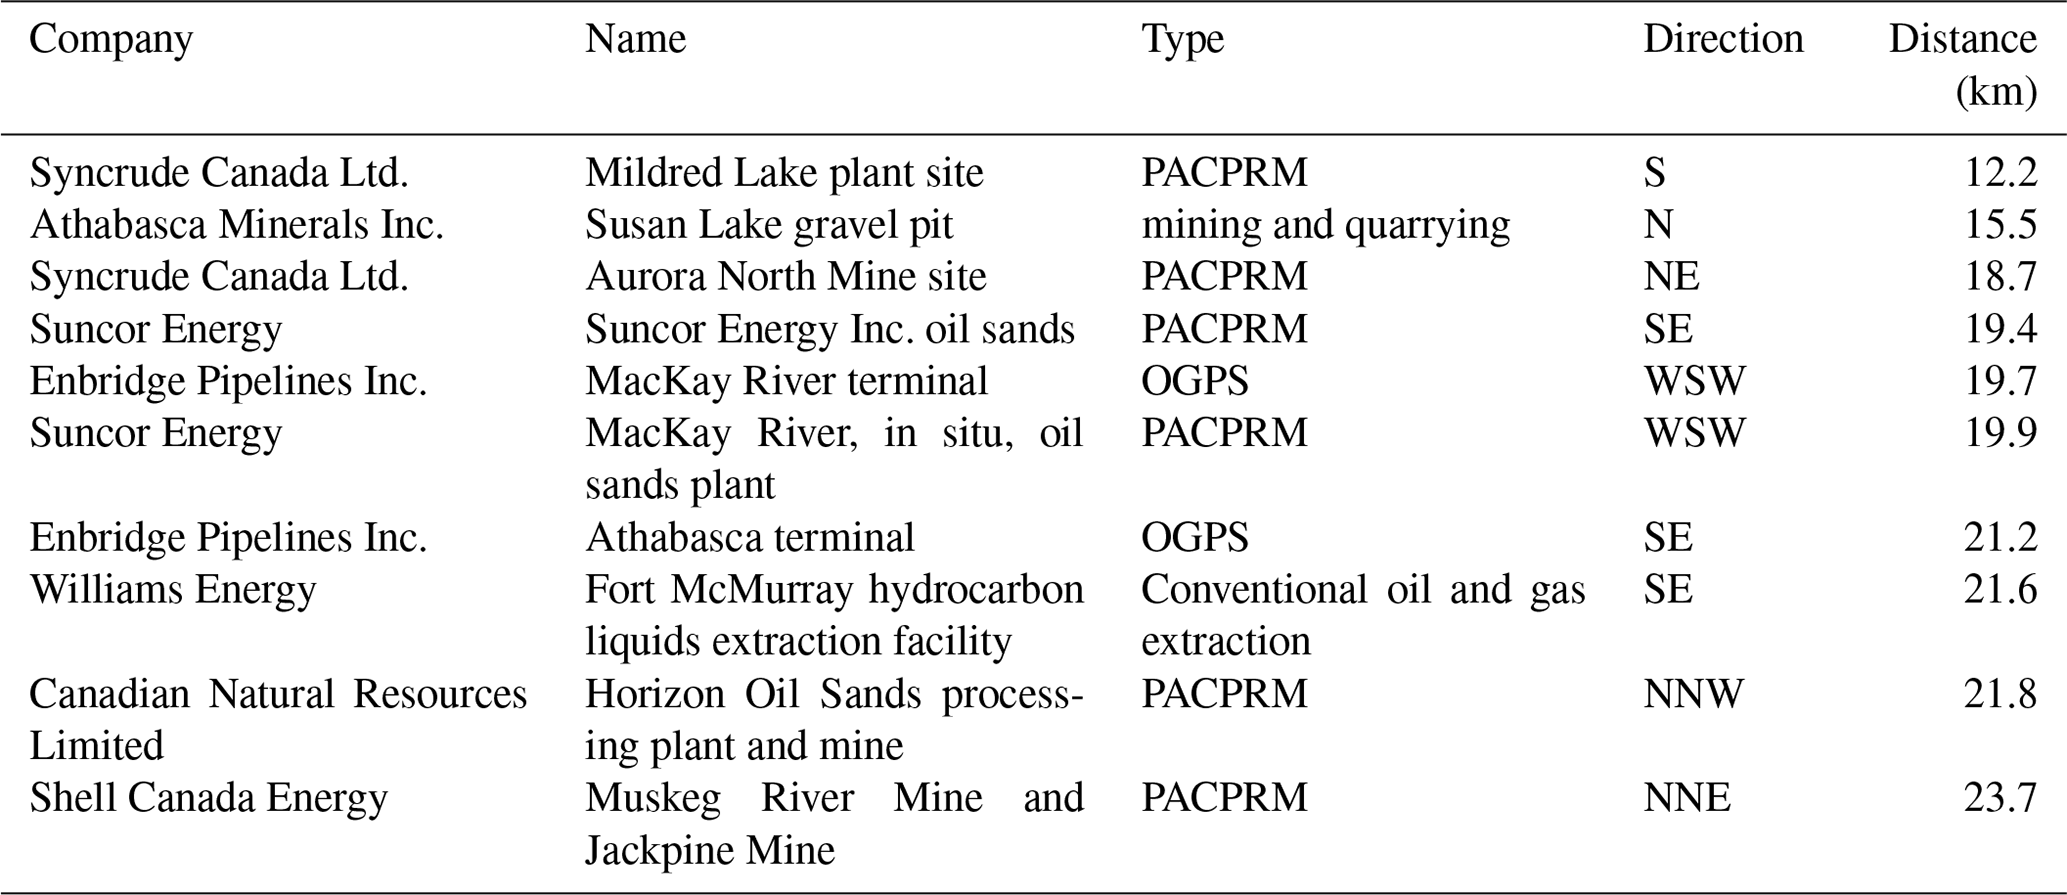
The site is impacted by emissions from nearby oil sands facilities (Table 1 and Fig. 1), including a large surface mining site operated by Syncrude Canada whose northeastern corner is located 3.5 km to the south of AMS 13 (and which is adjacent to the 5 km long Syncrude Mildred Lake (SML) tailing pond) and from a large upgrader stack facility operated by Suncor Energy Inc. located to the southeast. There are additional oil sands facilities operated (during the study period) by Canadian Natural Resources Limited, Imperial Oil, and Shell Canada to the north and northeast. A potentially important consideration is the photochemical aging of emissions between the points of emission and observation. During daytime, the average surface wind speed was 7.5 km h−1 (2.1 m s−1). The average transit times were 0.5 h to the edge of the closest mining operation, 1.6 h to the 12.2 km distant Mildred Lake Plant site, and 3.2 h to the Muskeg River Mine site located 23.7 km upwind.
Table 1Oil sands facilities located within 30 km of AMS 13. Distances were estimated using coordinates provided in the National Pollutant Release Inventory (NPRI, 2013) and do not account for the size of each facility, whose boundaries may be considerably closer to (or further away from) AMS 13. PACPRM: petroleum and coal product refining and manufacturing; OGPS: oil and gas pipelines and storage.
2.2 Instrumentation
A large number of instruments were deployed for this study; a partial list of instruments whose data were utilized in this paper is given in Table 2. Detailed descriptions of these instruments and operational aspects such as calibrations are given in the Supplement. Sample observations of analytically unresolved hydrocarbons by GC-ITMS and how these data were used in the analysis are described in Sect. “Analytically unresolved hydrocarbon signature” below.
Table 2Instruments used to measure ambient gas-phase and aerosol species during the 2013 JOSM intensive study at AMS 13.

n/a – not applicable.
Analytically unresolved hydrocarbon signature
As previously reported (Liggio et al., 2016), the total ion chromatogram of the GC-ITMS occasionally showed elevated and analytically unresolved hydrocarbons in the volatility range of C11–C17 with a saturation vapor concentration (C*) of 105 µg m µg m−3. An example is shown in Fig. 2.
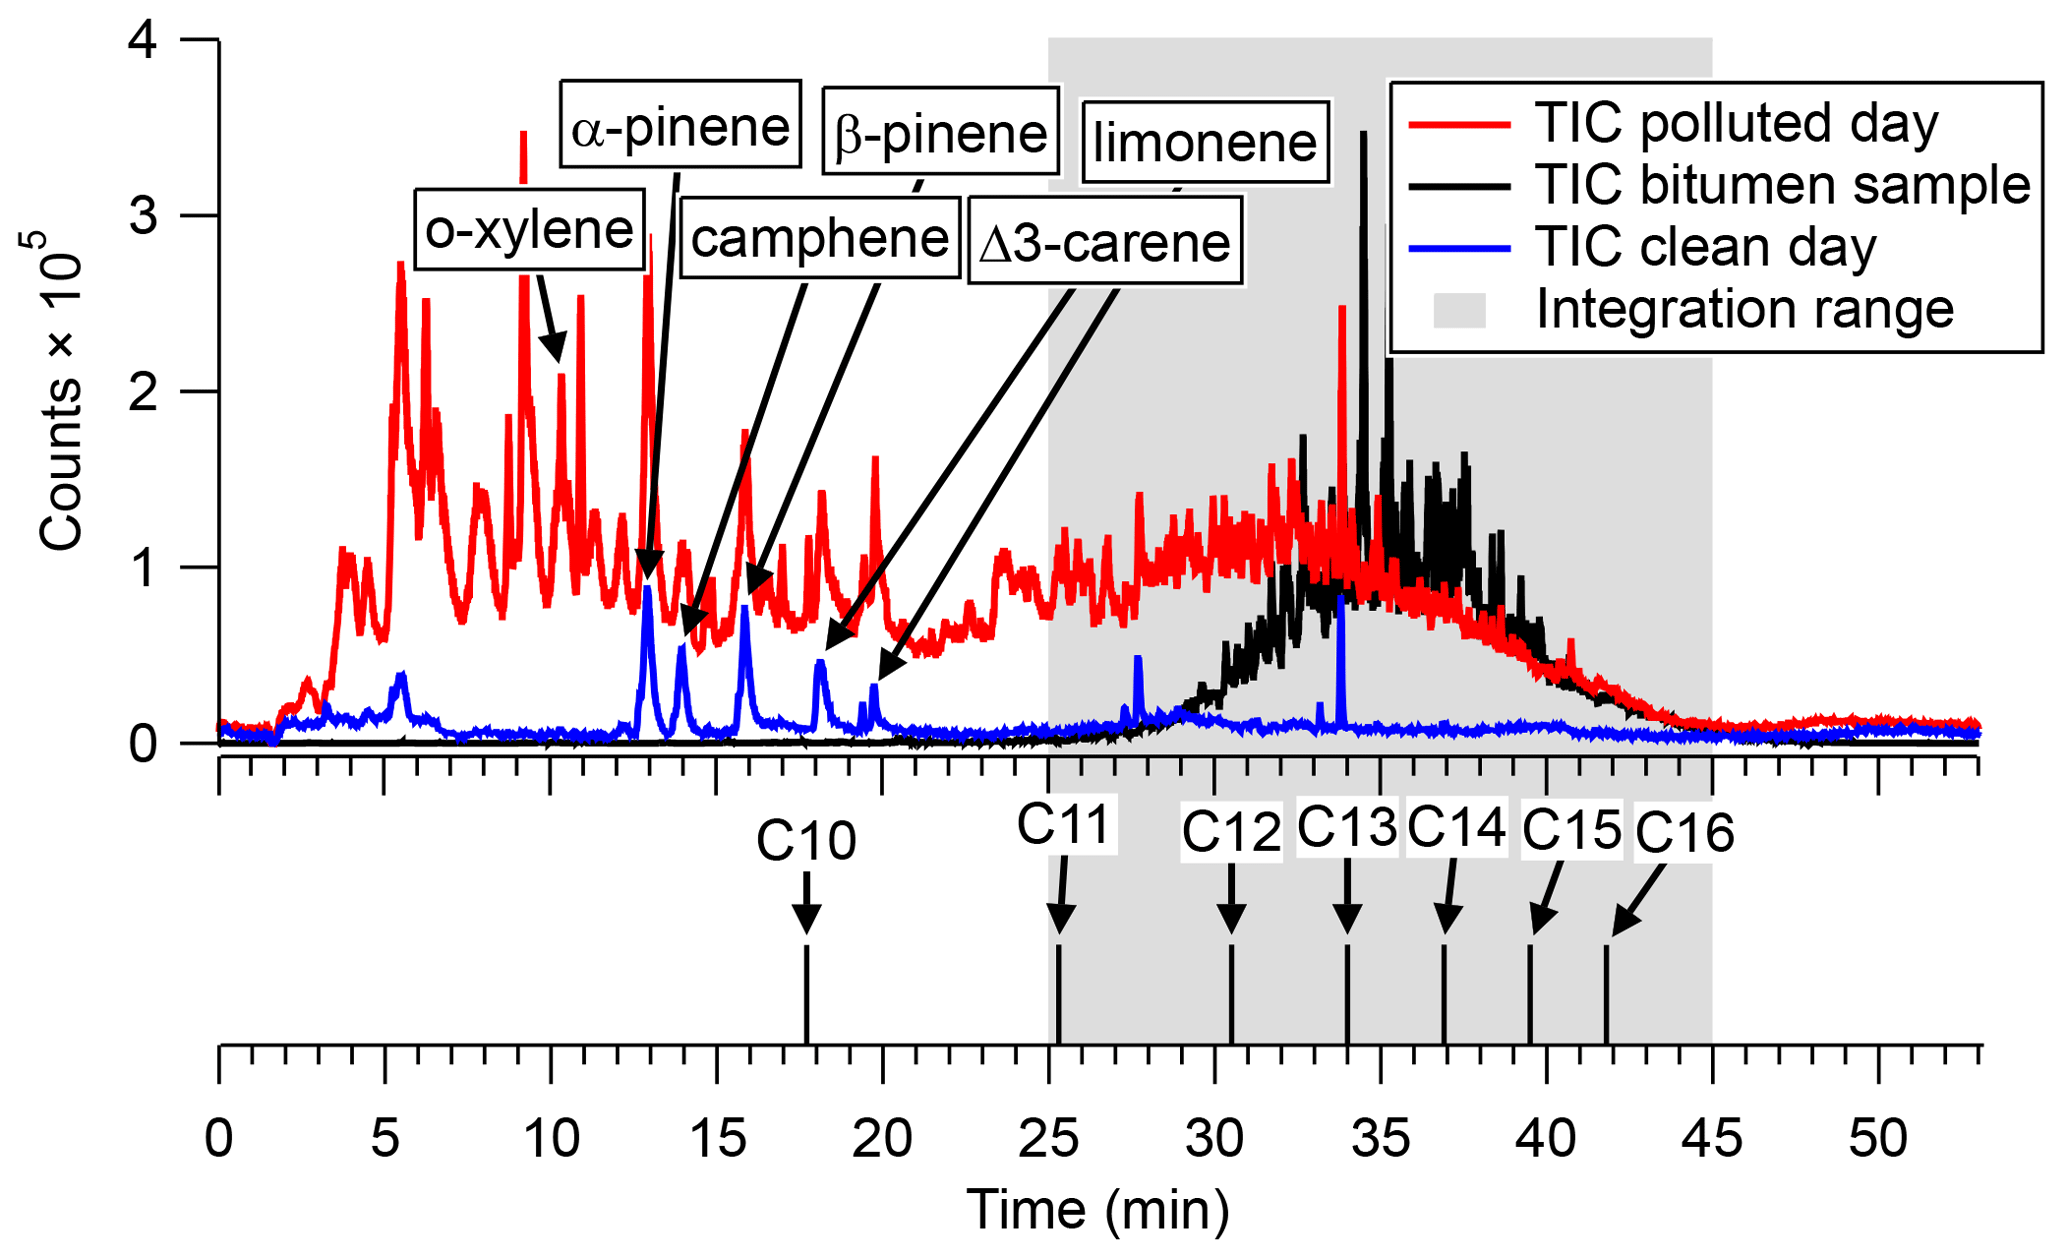
Figure 2The top shows total ion chromatograms of air samples collected on 27 August 2013 from 18:04 to 18:14 UTC (red) and on 28 August 2013 from 13:43 to 13:53 UTC (blue). The total ion counts (TICs) of a headspace sample of ground-up bitumen collected after the campaign is superimposed (black). The gray area indicates the range over which IVOC signal was integrated. The bottom shows retention times of n-alkanes, determined after the measurement campaign by sampling a VOC mixture containing a C10–C16 n-alkane ladder.
An offline analysis of the headspace above ground-up bitumen gave a similarly unresolved hydrocarbon signal (Fig. 2, black trace). In this particular case, the ambient air chromatogram also shows enhancements of lower-molecular-weight hydrocarbons (possibly from naphtha) that were not observed in the bitumen sample. The observed unresolved hydrocarbon feature is qualitatively similar to the “large chromatographic hump of unresolved complex mixtures” reported by Yang et al. (2011) during their analysis of bitumen extracts.
The major ions contributing to the unresolved signals in Fig. 2 are associated with alkanes (i.e., m∕z 55, 57, 67, 69; see Fig. S1 in the Supplement). In contrast, counts at masses associated with aromatics (i.e., m∕z 115, , and m∕z 91, ) as reported by Cross et al. (2013) were negligible in both the bitumen headspace and polluted day samples. The resemblance of the unresolved hydrocarbon feature in ambient air with the bitumen headspace sample in terms of both volatility (i.e., elution time) and electron impact mass fragmentation is consistent with bitumen as the source of IVOCs at this site.
In the interpretation of the integrated IVOC signal, it is assumed that it is of primary origin, i.e., emitted directly from point sources in the vicinity of the measurement site. For the PCA, the unresolved signal was integrated from a retention time of 25 to 45 min (gray area in Fig. 2) in all ambient air chromatograms.
The IVOCs observed in this work likely encompass a portion of the total that is emitted. For example, IVOCs generated by combustion processes, such as diesel engine exhaust, are comprised of aliphatic alkanes, including cyclic and branched alkanes, and aromatics (Gentner et al., 2012; Zhao et al., 2015). The use of a chromatographic column in this work biases the IVOC signal towards hydrocarbon IVOCs since oxygenated compounds (i.e., alcohols and acids) will not elute from the analytical column. Furthermore, the recovery of VOCs from the pre-concentration unit, while reproducible and likely complete for n-alkanes, which bracket the bulk of IVOC emitted and whose calibration curves were linear, is not known for late-eluting compounds but is assumed to be sufficiently reproducible to yield a semiquantitative signal.
2.3 Principal component analysis
The PCA was carried out using the Statistical Analysis System (SAS™) Studio 3.4 software (SAS, 2015) using a method similar to that described by Thurston et al. (2011) and Thurston and Spengler (1985). The source-related components and their associated profiles are derived from the correlation matrix of the input trace constituents. This approach assumes that the total concentration of each “observable” (i.e., input variable) is made up of the sum of contributions from each of a smaller number of pollution sources and that variables are conserved between the points of emission and observation.
2.3.1 Selection of variables
A total of 22 variables whose ambient concentrations are dominated by primary emissions or which are formed very shortly after emission (such as the less-oxidized oxygenated organic aerosol (LO-OOA) factor observed by the SP-AMS; see below) were included in the PCA (Table 3). These variables included CO2, CH4, NOy, CO, and SO2, which are known to be emitted in the oil sands region from stacks, the mine fleet and faces, tailing ponds, and fugitive emissions (Percy, 2013). The median ratio of NOx (= NO+NO2) to NOy was 0.85, consistent with the close proximity of the measurement site to emission sources and limited chemical processing. Because NOx constituted a large fraction of NOy, its temporal variation was captured by the latter, and it was not included as a separate variable in the PCA.
For this work, mixing ratios of all non-methane hydrocarbons (NMHCs) that were quantified (i.e., o-xylene, the n-alkanes decane and undecane, the aromatics 1,2,3- and 1,2,4-trimethylbenzene (TMB), and limonene and α- and β-pinene) were included as variables. In addition, the aforementioned unresolved signal associated with IVOCs was included as a variable by integrating total GC-ITMS ion counts (m∕z 50–425) over a retention time range of 25–45 min (retention index range of 1100 to 1700).
Gas-phase ammonia was included as a variable because elevated reduced nitrogen concentrations have been observed in the region and were linked to the use of ammonia on an industrial scale, for example as a floating agent and for hydrotreating (Bytnerowicz et al., 2010). Total sulfur and total reduced sulfur were added as tracers of upgrader stack SO2 emissions and of “odors”, believed to be emitted from oil sands tailing ponds, which continue to be of concern in surrounding communities (Small et al., 2015; Percy, 2013; Holowenko et al., 2000).
Refractory black carbon was added as a variable since it is present in diesel truck exhaust and in biomass burning plumes and is hence a combustion tracer (Wang et al., 2016; Briggs and Long, 2016). Particle-surface-bound polycyclic aromatic hydrocarbons (pPAHs) were included because of their association with facility stack emissions and combustion particles in the area (Allen, 2008; Grimmer et al., 1987). Hydrocarbon-like organic aerosol (HOA) was included as a surrogate for fossil fuel combustion by vehicles (Jimenez et al., 2009). The LO-OOA factor was included as it appears to form rapidly after emission of precursors (Lee et al., 2018). Supermicron aerosol volume (PM10−1, i.e., the volume of particles between PM10 and PM1) was also included as a tracer of coarse particles from primary sources, which are expected to be dominated by dust emissions.
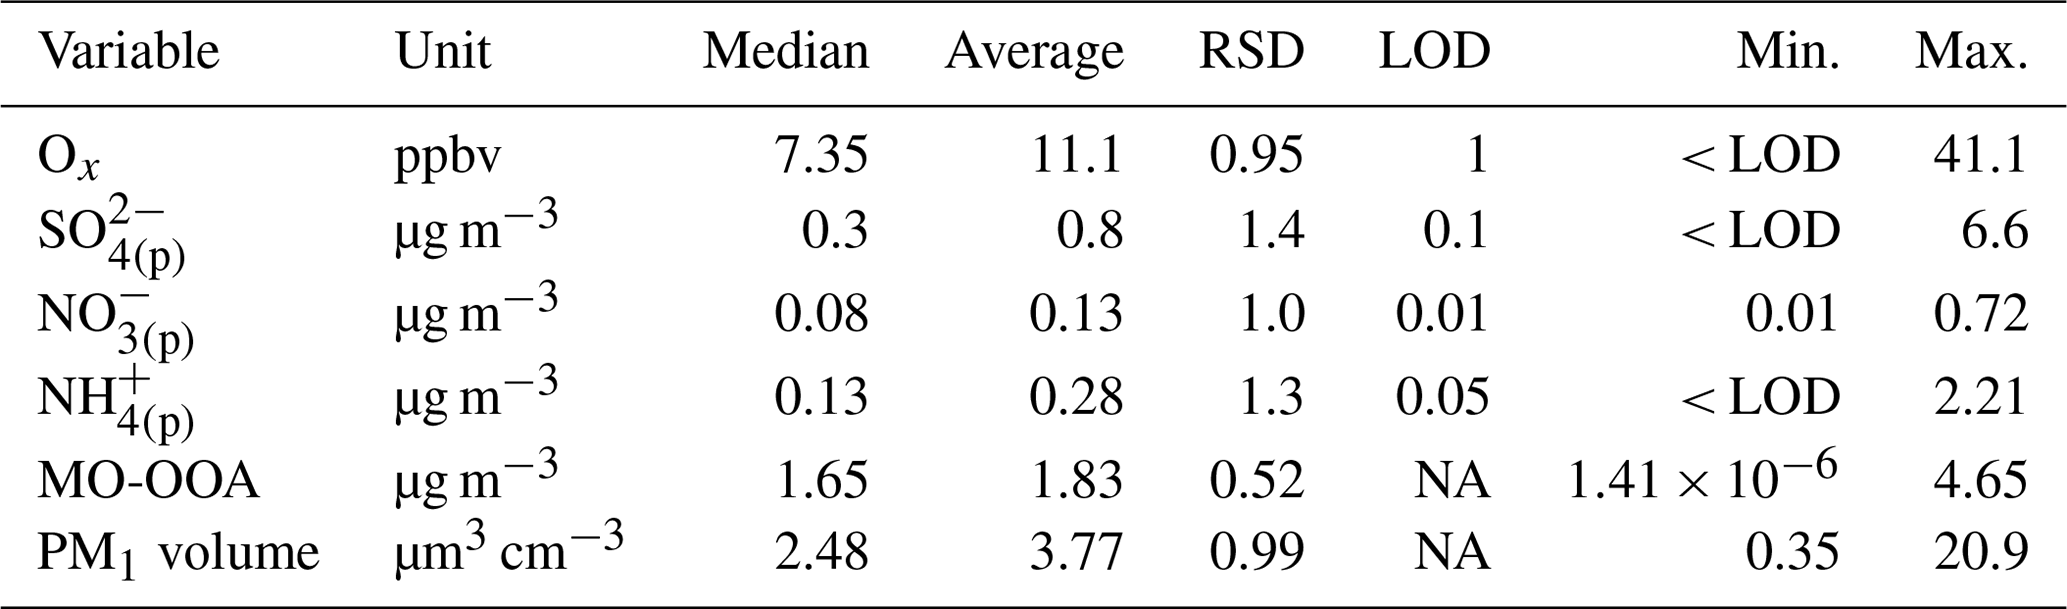
Table 3Variables observed at the AMS 13 ground site during the 2013 JOSM campaign used for PCA.
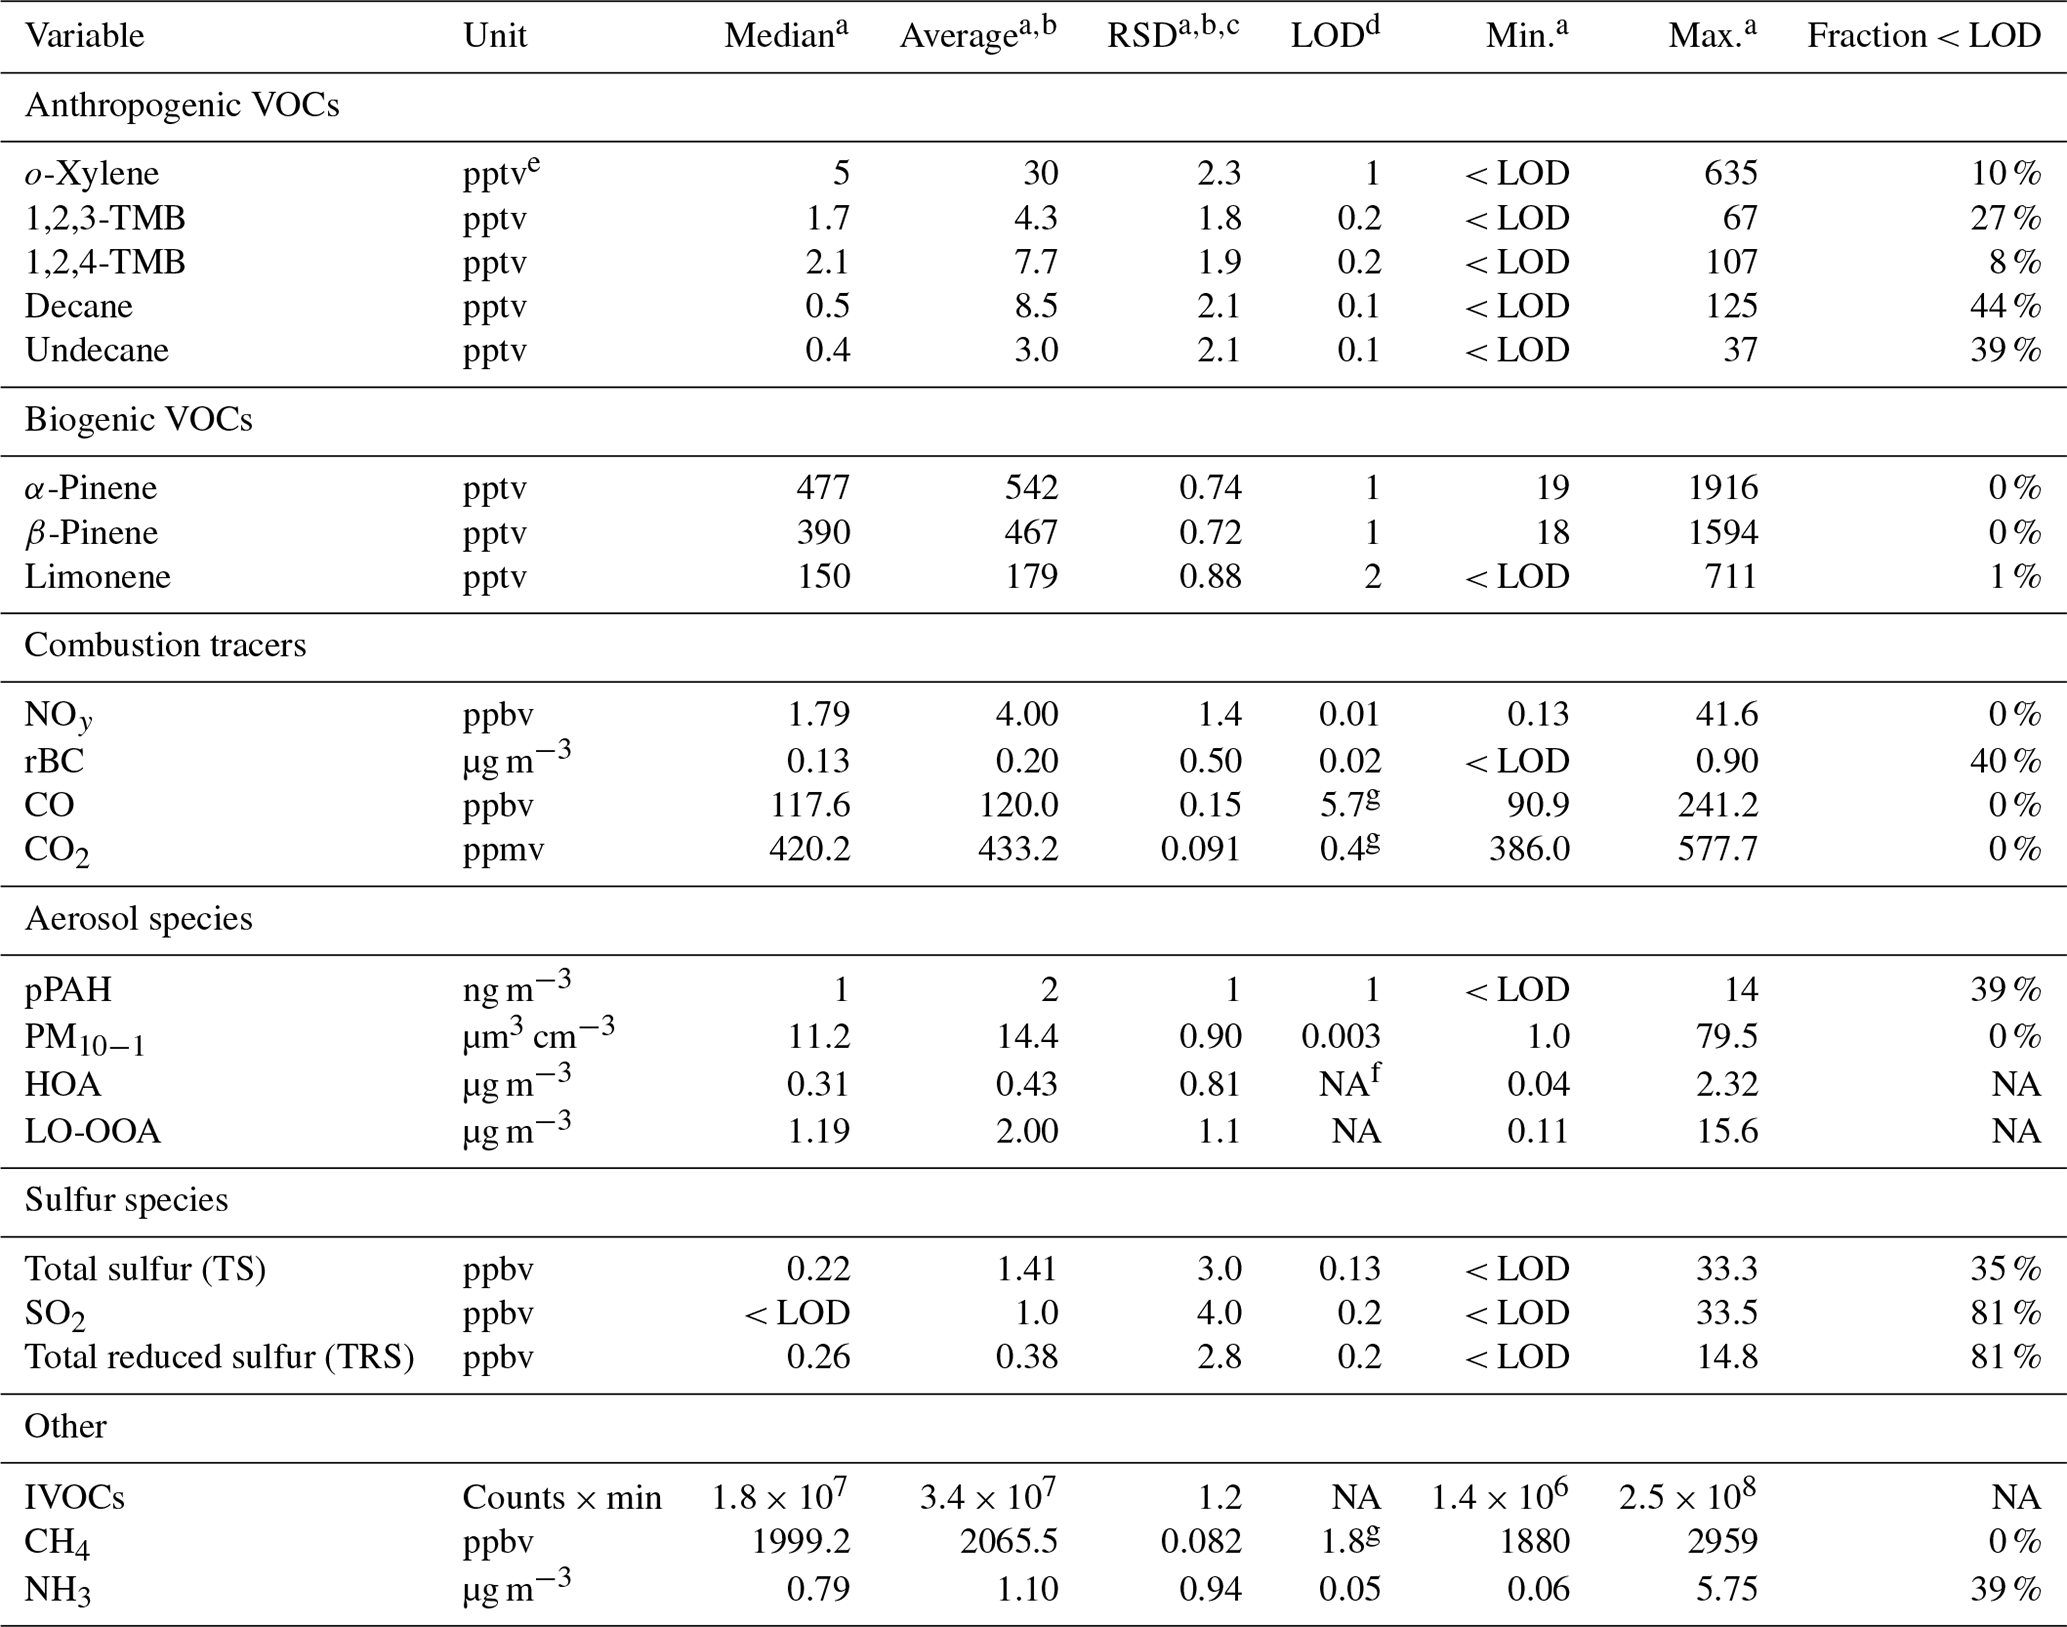
a Values were determined only from data points included in the PCA, not from the entire campaign. b Average and relative standard deviation were calculated before zeros were replaced with 0.5 × LOD. c RSD: relative standard deviation. d LOD: limit of detection. e ppt: parts per trillion by volume (10−12). f NA: data not available. g Calculated using 3 × standard deviation at ambient background levels.
To assess which components impact secondary product formation, a second PCA was performed that included variables mainly formed through atmospheric chemical processes and whose concentrations more strongly depend on air mass chemical age than those variables selected initially. In this PCA, odd oxygen (), submicron aerosol , , , a second, more-oxidized OOA factor (MO-OOA), and PM1 volume were included, increasing the total number of variables to 28 (Table 4). Furthermore, since oxidation of IVOCs leads to formation of SOA (Robinson et al., 2007; Lee et al., 2018), and the photochemical conversion of IVOC to SOA may adversely affect the PCA, a PCA without secondary and aerosol variables is presented in the Supplement (Table S10).
2.3.2 Treatment of input data
Data used in the PCA were averaged to match the time resolution of the GC-ITMS VOC and IVOC measurements, i.e., over 10 min long periods (spaced ∼1 h apart) set by the start and stop times of the GC-ITMS pre-concentration period. When concentrations were below their respective limit of detection (LOD; values are given in Table 3), half the reported LOD was used to minimize bias (Harrison et al., 1996; Polissar et al., 1998; Zhao et al., 2004; Guo et al., 2004). Prior to PCA, input variables were standardized to eliminate unit differences by subtracting the mean concentration of pollutant i from the concentration of sample k (Ci,k) and dividing by the standard deviation (si) of all samples included in the PCA.
Here, Zi,k is the standardized pollutant concentration. In total, 218 data points from all identified species over the period of the campaign were used for the main PCA.
Table 4Variables added in the second PCA. Particle-phase concentrations, i.e., , , , and MO-OOA, were measured by aerosol mass spectrometry and account for PM1 only.
2.3.3 PCA solutions
In this work, the varimax method (Kaiser, 1958) was used to rotate the loading matrix. This method is an orthogonal rotation (i.e., components are not expected to correlate), which minimizes the impact of high loadings, making the results easier to interpret (Kaiser, 1958). Several criteria (Table S10) were considered for component selection: the latent root criterion, i.e., on the basis that rotated eigenvalues must be greater than unity, the (cumulative) percentage of variance criterion, for which the extracted components account for >95 % of the variance, and the scree test (Fig. S2) (Thurston and Spengler, 1985; Guo et al., 2004; Hair et al., 1998; Cattell, 1966). For the optimal solution presented in the main paper, the 95 % variance criterion was chosen, providing a 10-component solution for the PCA with only primary variables and an 11-component solution for the PCA with both primary and secondary variables. Components 1 through 4 were consistent regardless of the number of components retained. Solutions with fewer and more components are presented in the Supplement.
Time series of each of the components were calculated by multiplying the original standardized matrix by the rotated loading matrix and were used to generate bivariate polar plots (Sect. 2.4).
2.4 Bivariate polar plots
The PCA was complemented by bivariate polar plots showing the wind speed and direction dependence of air pollutant concentrations. The use of these representations implies a linear relationship between local wind conditions and air mass origin, which may not always be the case (for example, during or after stagnation periods). In addition, local topography, such as the Athabasca River valley, complicates regional air flow patterns and limits the interpretability of polar plots in general and in particular to the E of AMS 13, where the river valley is located. The plots were generated with the OpenAir software package (Carslaw and Ropkins, 2012; Carslaw and Beevers, 2013) using the R programming language and the open-source software “RStudio: Integrated development environment for R” (RStudio Boston, 2017). The default setting (100) was used as the smoothing function.
3.1 Overview of the data set
Time series of the 22 pollution tracers chosen for PCA are presented in Fig. 3, grouped approximately by source type. Statistics of the data (i.e., median, average, maxima, minima) are summarized in Table 3.
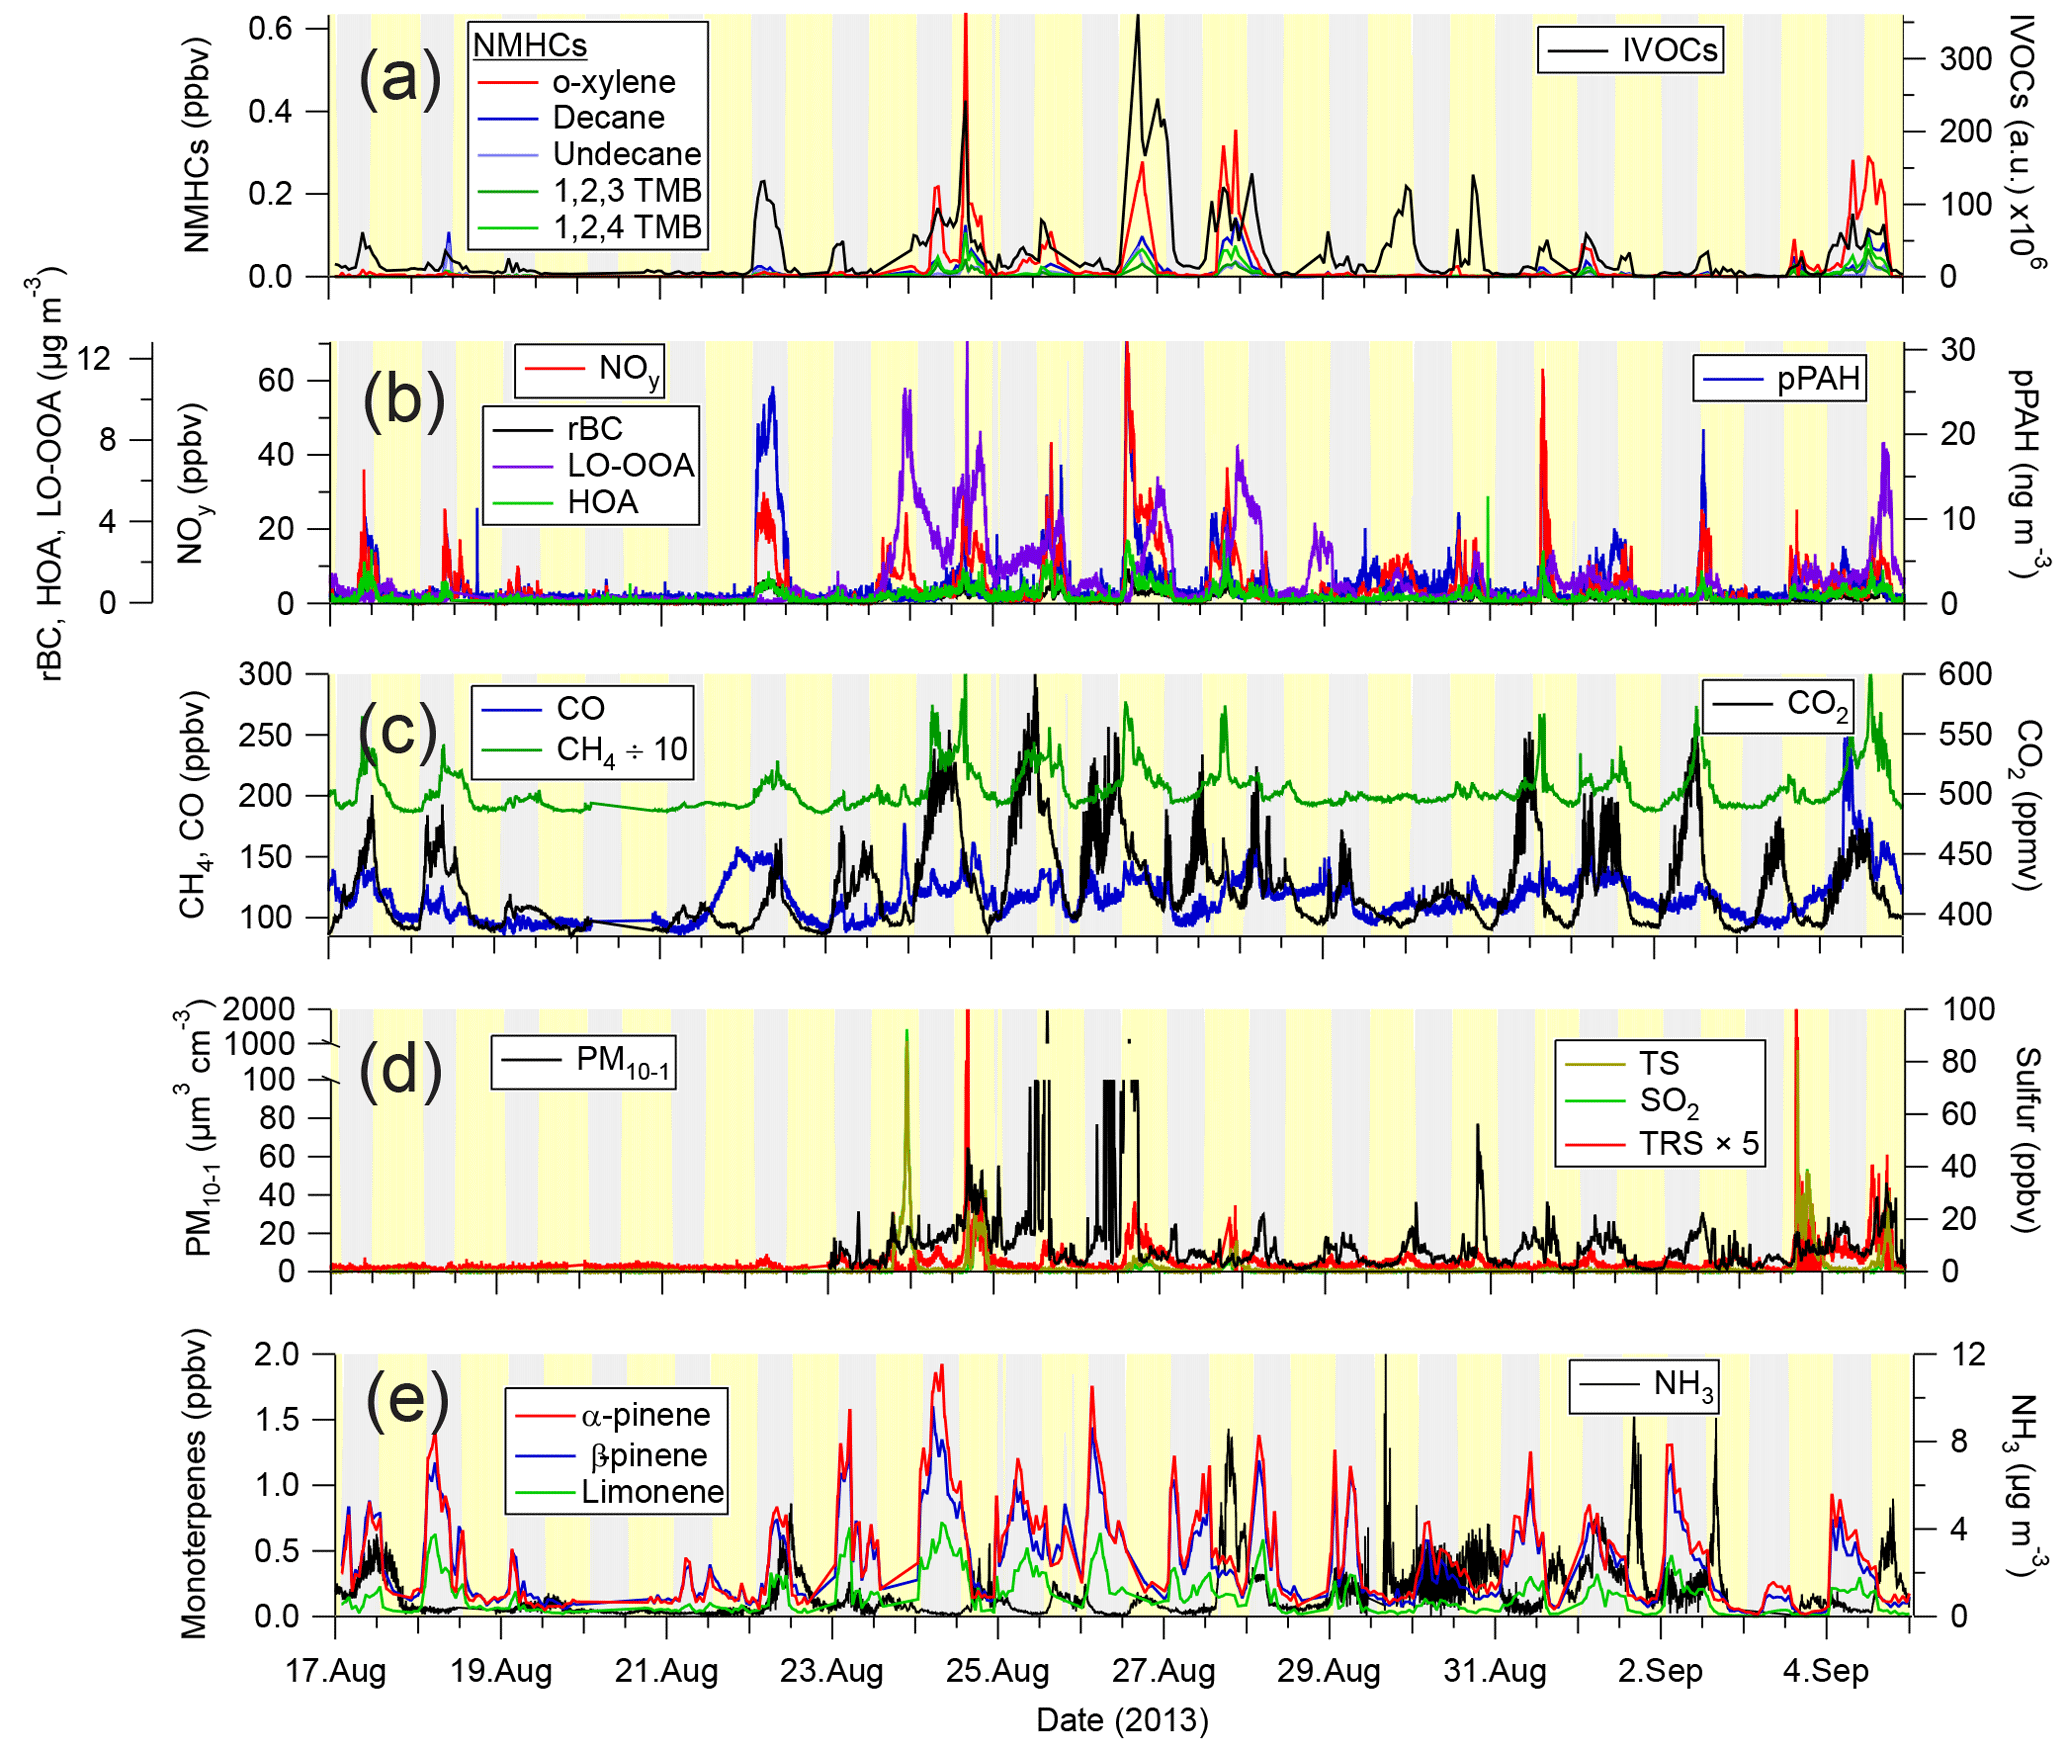
Figure 3Time series of selected pollution tracers observed at the AMS 13 ground site in the Athabasca oil sands during the 2013 JOSM measurement intensive. The gray and yellow backgrounds represent night and day, respectively. (a) Selected non-methane hydrocarbons (NMHCs) and IVOCs. (b) Combustion product tracers include refractory black carbon (rBC), total odd nitrogen (NOy), and particle-surface-bound polycyclic aromatic hydrocarbons (pPAHs), and organic aerosol components include hydrocarbon-like organic aerosol (HOA) and less-oxidized oxygenated organic aerosol (LO-OOA). (c) Methane (CH4), carbon dioxide (CO2), and monoxide (CO). (d) Total sulfur (TS), sulfur dioxide (SO2), and total reduced sulfur (TRS) and PM10 particle volume. (e) Biogenic VOCs (α-pinene, β-pinene, and limonene) and ammonia (NH3).
Time series of VOCs of primarily anthropogenic origin (i.e., o-xylene and 1,2,3- and 1,2,4-TMB) as well as the IVOC signature are shown in Fig. 3a. The abundances of these species, as well as the other compounds, were highly variable and varied as a function of time of day (i.e., boundary layer mixing height) and air mass origin, with higher VOC concentrations generally observed during daytime. The VOC concentrations varied between nearly pristine, remote conditions, with concentrations below detectable limits, and mixing ratios of aromatic species exceeding 100 pptv. The concentration range of o-xylene is within the extremes reported by WBEA in their 2013 annual report (WBEA, 2013), exemplifying that the data set is representative of typical pollutant levels in this region.
While there is some obvious covariance among variables (i.e., when the mixing ratios of one particular VOC increase, so do others), the ratios of hydrocarbons varied considerably. For example, on 18 August at 10:50 UTC, the n-decane-to-o-xylene ratio was , whereas on 24 August at 07:40 UTC it was . The IVOC magnitude also varied greatly and often increased and decreased in tandem with the other VOCs (e.g., on 24 August at 16:30 UTC) but also increased independently from the other VOC abundances (e.g., on 30 August at 01:20 UTC and on the night of 22 August). This behavior suggests the presence of multiple sources with distinct signatures that are being sampled to a varying extent at different times or, perhaps, a single source whose emission profile varies. This, coupled with the intermittency of the highly elevated signals, presents an analysis problem frequently encountered in environmental analysis that is usually investigated through a factor analysis or PCA (Thurston et al., 2011; Guo et al., 2004).
Presented in Fig. 3b are the time series of NOy, rBC, and pPAH abundances, all of which are combustion by-products. For example, rBC is emitted from combustion of fossil fuels, biofuels, open biomass burning, and burning of urban waste (Bond et al., 2004). Similar to the VOCs, the abundances of these species varied greatly, from very low continental background levels (i.e., <100 pptv of NOy, < LOD for rBC and pPAHs) to polluted concentrations (i.e., >60 ppbv of NOy, >1 µg m−3 rBC, >10 ng m−3 pPAHs) characteristic of polluted urban and industrial areas. When high concentrations of NOy were observed, its main component was NOx (data not shown), which is a combustion by-product usually associated with automobile exhaust. In the Alberta oil sands, emissions from off-road mining trucks as well as the upgrading processes are the main contributors to the NOy burden (Percy, 2013; Watson et al., 2013).
Shown in Fig. 3c are the mixing ratios of the greenhouse gases CH4 and CO2 along with CO. Abundances of CO2 were clearly attenuated by photosynthesis and respiration of the vegetation near the measurement site, as judged from the strong diurnal cycle in its concentration (not shown). Maxima typically occurred shortly after sunrise, coincident with the expected breakup of the nocturnal boundary layer. In addition to biogenic emissions from vegetation and soil, CO2 originates from a variety of point and mobile sources in this region, including off-road mining trucks (Watson et al., 2013) and the extraction, upgrading, and refining of bitumen, and on-road vehicle sources in the area (Nimana et al., 2015a, b). Concentrations of CO2 spiked whenever these emissions were transported to the measurement site.
Concentrations of CH4 also exhibit a diurnal cycle, with higher concentrations generally observed at night and peaking in the early morning hours. While CH4 and CO2 mixing ratios frequently correlated in plumes, their ratios were variable overall, suggesting they often originated from distinct sources. Potential methane point sources in the region include microbial production in tailing ponds (Siddique et al., 2012) and fugitive emissions associated with the mining and processing of bitumen (Johnson et al., 2016). Indeed, a recent analysis shows tailing ponds and open pit mining sources to be the largest sources of CH4 in the region (Baray et al., 2018).
Similar to the anthropogenic VOCs, the abundances of CH4 and CO2 were highly variable and ranged from minima of 1.88 and 384 ppmv to maxima of 2.96 and 578 ppmv, corresponding to maximum enhancements of 1.63 and 1.47 relative to tropospheric global monthly means of 1.806±0.001 and 394.3±0.1 ppmv for July 2013 (Dlugokencky, 2017a, b), respectively.
Mixing ratios of CO also varied with time but generally were not elevated greatly (median 118 ppbv) above background levels (minimum 91 ppbv), except for occasional spikes in concentration (Fig. 3c). Carbon monoxide is a tracer of biomass burning and fossil fuel combustion, in particular in automobiles with poorly performing or absent catalytic converters, but is also a by-product of the oxidation of VOCs, in particular of methane and isoprene, which are oxidized over a wide area upwind of AMS 13 (Miller et al., 2008).
Time series of sulfur species and PM10−1 volume are shown in Fig. 3d. The total sulfur (TS) and SO2 data are dominated by intermittent plumes containing SO2 mixing ratios exceeding 5 ppbv. The highest mixing ratio observed was 92.5 ppbv (in between the preconcentration periods of the GC-ITMS). Mixing ratios of SO2 exhibited the most variability in all pollutants, as judged from the relative standard deviation of each of the measurements (Table 3). TRS levels were generally small (<1 ppbv) and variable, except for plumes; TRS abundances in plumes, however, are more uncertain since they were calculated by subtraction of two large numbers. When TS and SO2 abundances were low (<1 ppbv), TRS abundances were variable and occasionally exhibited spikes that did not show any obvious correlation with other variables, suggesting the presence of one or more distinct TRS sources. PM10 volume concentrations varied a lot as well and, just like TRS, did not show an obvious correlation with other variables. Fugitive dust emissions likely contributed to much of the PM10 volume in the Athabasca oil sands region (Wang et al., 2015).
Time series of monoterpene mixing ratios are shown in Fig. 3e. α-Pinene was generally the most abundant monoterpene, followed by β-pinene. Their ratio, averaged over the entire campaign, was 1:0.85, though occasionally the α-pinene-to-β-pinene ratio was below 1:2 (e.g., on 28 August at 14:50 UTC and 5 September at 12:40 UTC). Terpene mixing ratios were generally higher at night than during the day, with maxima of 1.9 and 1.6 ppbv, respectively, a diurnal pattern consistent with what has been observed at other forest locations (Fuentes et al., 1996). Monoterpenes are emitted by plants via both photosynthetic and non-photosynthetic pathways (Fares et al., 2013; Guenther et al., 2012); at night, their emissions accumulate in a shallow nocturnal boundary layer, whereas during daytime, they are entrained aloft (above the canopy) and oxidized by the hydroxyl radical (OH) and O3, which are more abundant during the day than at night (Fuentes et al., 1996). α- and β-pinene mixing ratios were lowest midday (median values at noon of 140 and 133 pptv, respectively). The largest daytime concentrations were observed on 25 August, a cloudy day (as judged from spectral radiometer measurements of the NO2 photolysis frequency): on this particular day, mixing ratios at noon were 687 and 850 pptv, respectively.
Also shown in Fig. 3e is the time series of ammonia. These data were dominated by spikes, which were observed sporadically and did not correlate with other variables, suggesting the presence of nearby ammonia point sources. Ammonia was not as variable as some of the other pollutants (e.g., the anthropogenic VOCs, sulfur species) as judged from its relative standard deviation (Table 3), which suggests a geographically more disperse source or sources similar to CO or CH4, which have a “background”. This is consistent with a recent study by Whaley et al. (2018) that estimated over half (∼57 %) of the near-surface NH3 during the study period originated from NH3 bidirectional exchange (i.e., re-emission of NH3 from plants and soils), with the remainder being from a mix of anthropogenic sources (∼20 %) and forest fires (∼23 %).
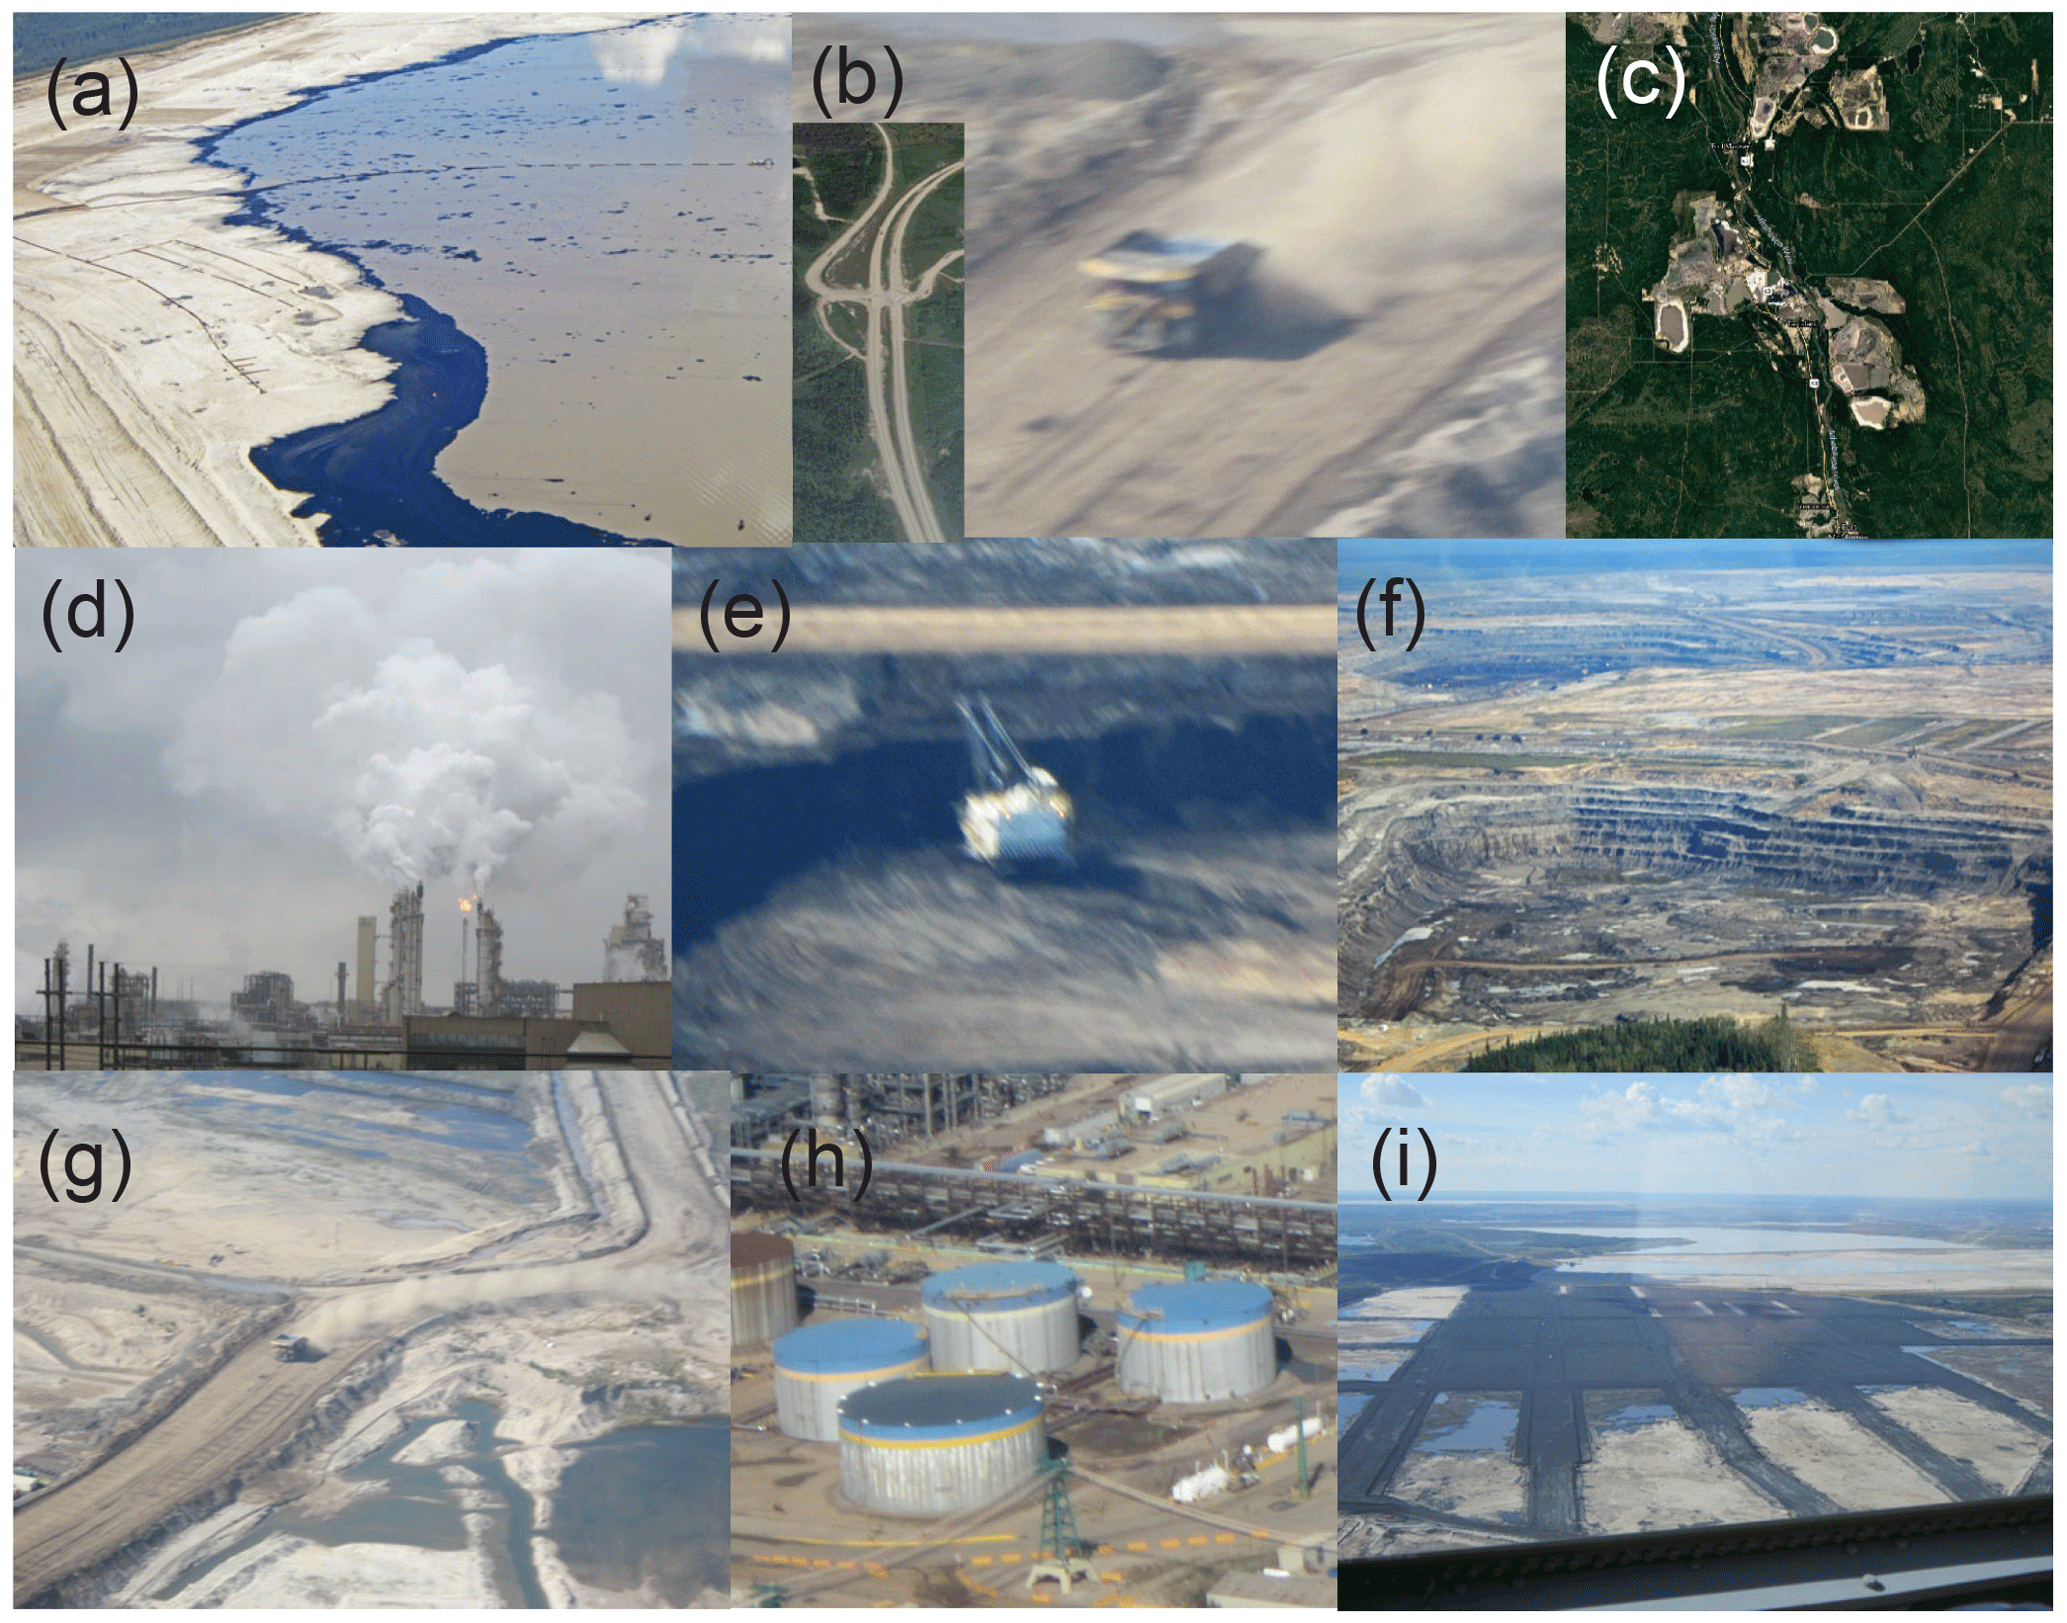
Figure 4Images of likely sources associated with each of the principal components. (a) Wet tailing ponds (component 1). (b) Mine truck fleet and highway traffic emissions (component 2). (c) Biogenic emissions from vegetation (component 3). (d) Upgrader facilities (component 4). (e) Exposed bitumen on mined surfaces (component 5). (f) Fugitive greenhouse gas emissions from mine faces (component 6). (g) Windblown dust from exposed sand (component 7). (h) Fugitive emissions of ammonia from storage tanks (component 8). (i) Composite (dry) tailings (component 10). No image is shown for production CO from oxidation of VOCs (component 9).
3.2 Principal component analysis
3.2.1 PCA with primary variables
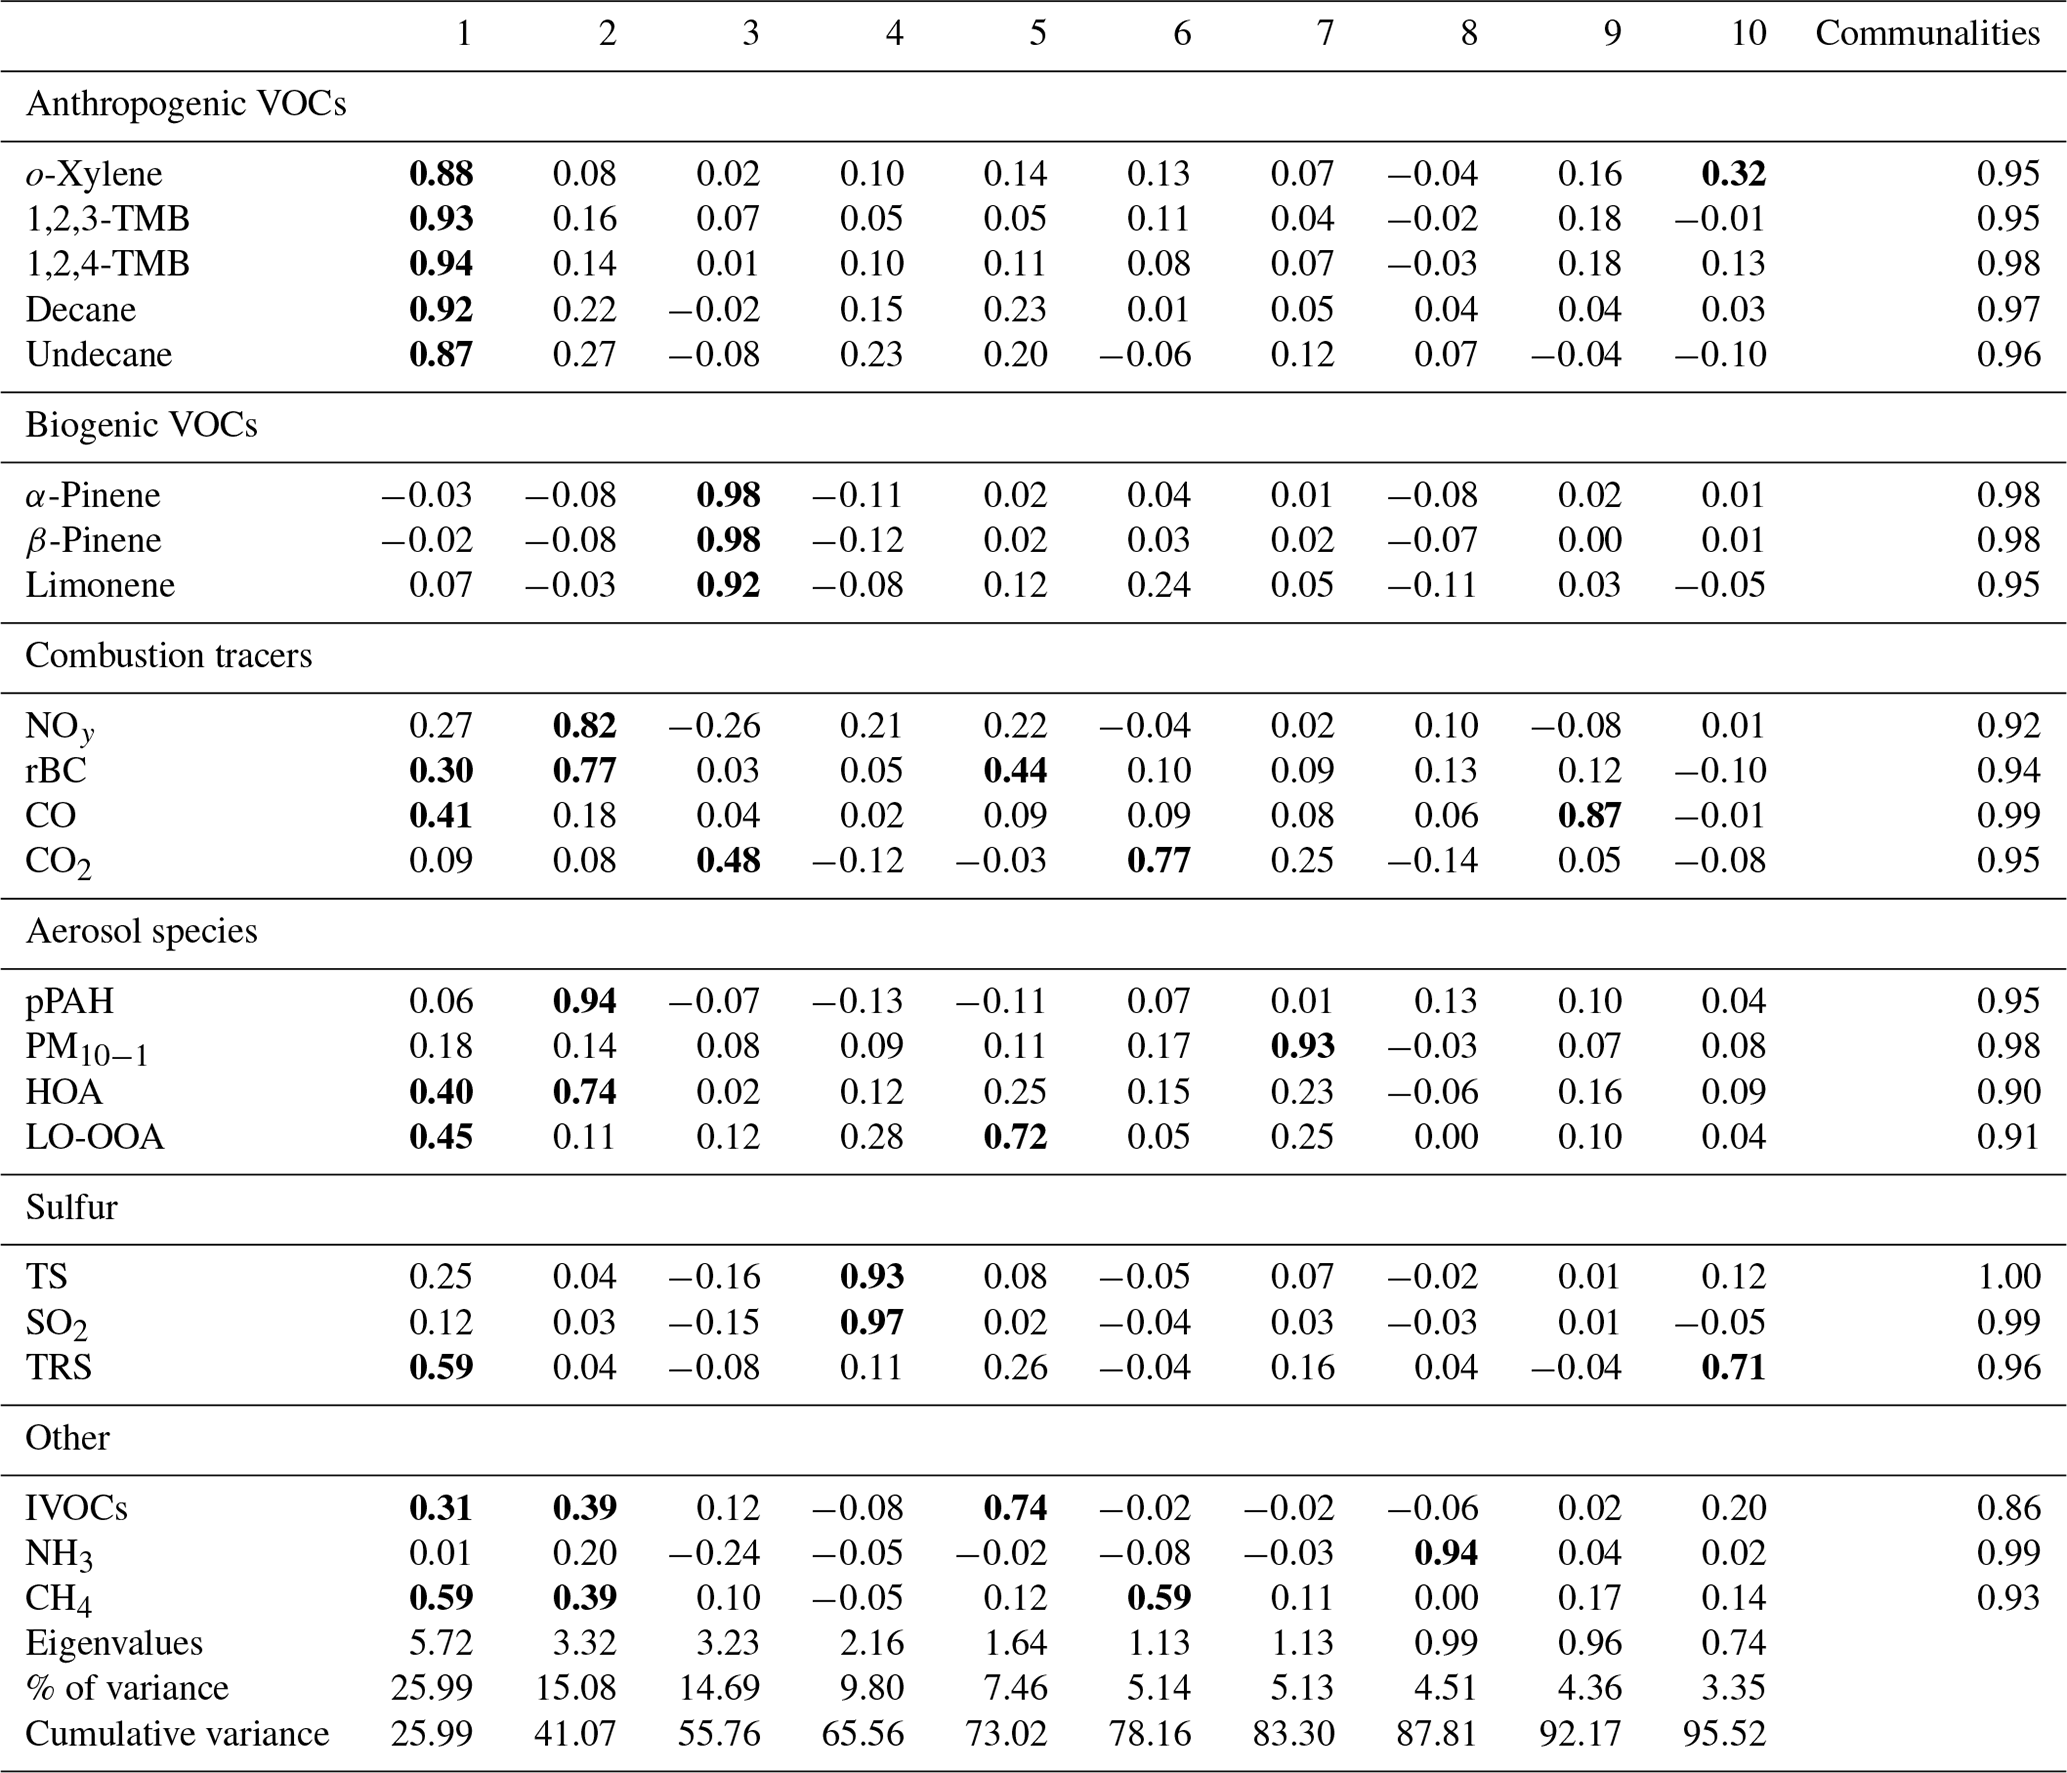
The loadings of the optimum solution are presented in Table 5. The 10-component solution accounts for a cumulative variance of 95.5 %. The communalities for the analysis, i.e., the fraction of total pollutant observations accounted for by the PCA, are all greater than 85 %, with the lowest communality obtained for the IVOCs (0.86).
In the following, an overview of the observed components is presented. Associations with r>0.7, r>0.3, and r>0.2 are referred to as “strong”, “weak”, and “poor”, respectively. Hypothesized identifications are given in Sect. 4 and are summarized in Table 6 and Fig. 4.
The component accounting for most of the variance of the data, component 1, is strongly associated with the anthropogenic VOCs (r>0.87), weakly associated with CH4 (r=0.59), TRS (r=0.59), HOA (r=0.40), LO-OOA (r=0.45), CO (r=0.41), and the IVOCs (r=0.31), and poorly associated with NOy (r=0.27) and rBC (r=0.30). Component 2 is strongly associated with the combustion tracers NOy (r=0.82), rBC (r=0.77), HOA (r=0.74), and pPAH (r=0.94), weakly associated with CH4 (r=0.39) and IVOCs (r=0.39), and poorly associated with ammonia (r=0.20), and undecane and decane (r=0.27 and 0.22, respectively). Component 3 is strongly associated (r>0.9) with the biogenic VOCs and weakly associated with CO2 (r=0.48) and shows poor negative correlations with NOy () and ammonia (). Component 4 is strongly associated with SO2 and TS (r=0.97 and 0.93, respectively) and poorly associated with NOy (r=0.21) and LO-OOA (r=0.28).
Components 1 through 4 emerged regardless of the number of components used to represent the data, whereas the structure of components 5 through 10 only fully emerged in the 10-component solution (see Supplement). Hence, components 6 through 10 are somewhat tentative as many (i.e., 7–9) are single-variable components and have eigenvalues close to or below unity, i.e., account for less variance than any single variable. As a result, the interpretations of these components are subject to more uncertainty and are more speculative but are presented in the Supplement for the sake of completeness and transparency. For the purpose of this paper, this is inconsequential as components 6–10 are not associated with IVOCs.
Table 5Loadings for the 10-factor optimal solution (primary variables only). Coefficients with Pearson correlation coefficients r>0.3 are shown in bold font.
3.2.2 Extended PCA with added secondary variables
The loadings of the optimum solution that includes primary and secondary variables are shown in Table 7. In this 11-component solution, the 10 components originally identified were preserved, though their relative order was changed, with the upgrader component moving from the fourth to second position. There was one new component (6), which encompassed only secondary species, including MO-OOA (r=0.92), Ox (r=0.33), (r=0.36), PM1 (r=0.31), and LO-OOA (r=0.31).
, , and are associated with the stack emissions component (2, with r=0.84, 0.84, and 0.44, respectively), which was also weakly correlated with PM1 (r=0.44) and Ox (r=0.36). The association of secondary variables with the primary components suggests rapid formation of these secondary products on a timescale that is similar to the transit time of the pollutants to the measurement site. PM1 correlated strongly with the major IVOC component (component 5, r=0.80), which was also weakly associated with LO-OOA (r=0.66) and (r=0.59), as well as and (r=0.32 and 0.33, respectively).
Table 7Loadings for the 11-component solution with the inclusion of variables associated with secondary processes.

3.3 Bivariate polar plots
Bivariate polar plots were generated for all components and their dominant associated variables and are shown in the Supplement (Figs. S2–S11). Winds were predominantly from the SW but were also observed often from the S and N. Figure 5a shows the plot for IVOCs. The highest concentrations were observed when the local wind direction was from the NE, where several facilities including the Aurora North, Musket River, and Jackpine mines and large swaths of disturbed and cleared land are located in close proximity to each other (Table 1 and Fig. 1). The second highest IVOC signal intensity was observed when local wind direction was from the SSE.
The bivariate polar plots of the three components associated with IVOCs are shown in Fig. 5b–d. These components are associated with winds from the NE, E, SE, and S at low to moderate speeds (1–3 m s−1). Component 5 (Fig. 5b) was the most strongly correlated with IVOCs and shows the most spatial overlap with the distribution of the IVOC source; however, the intensities differ owing to the association of component 5 with other variables such rBC and LO-OOA.
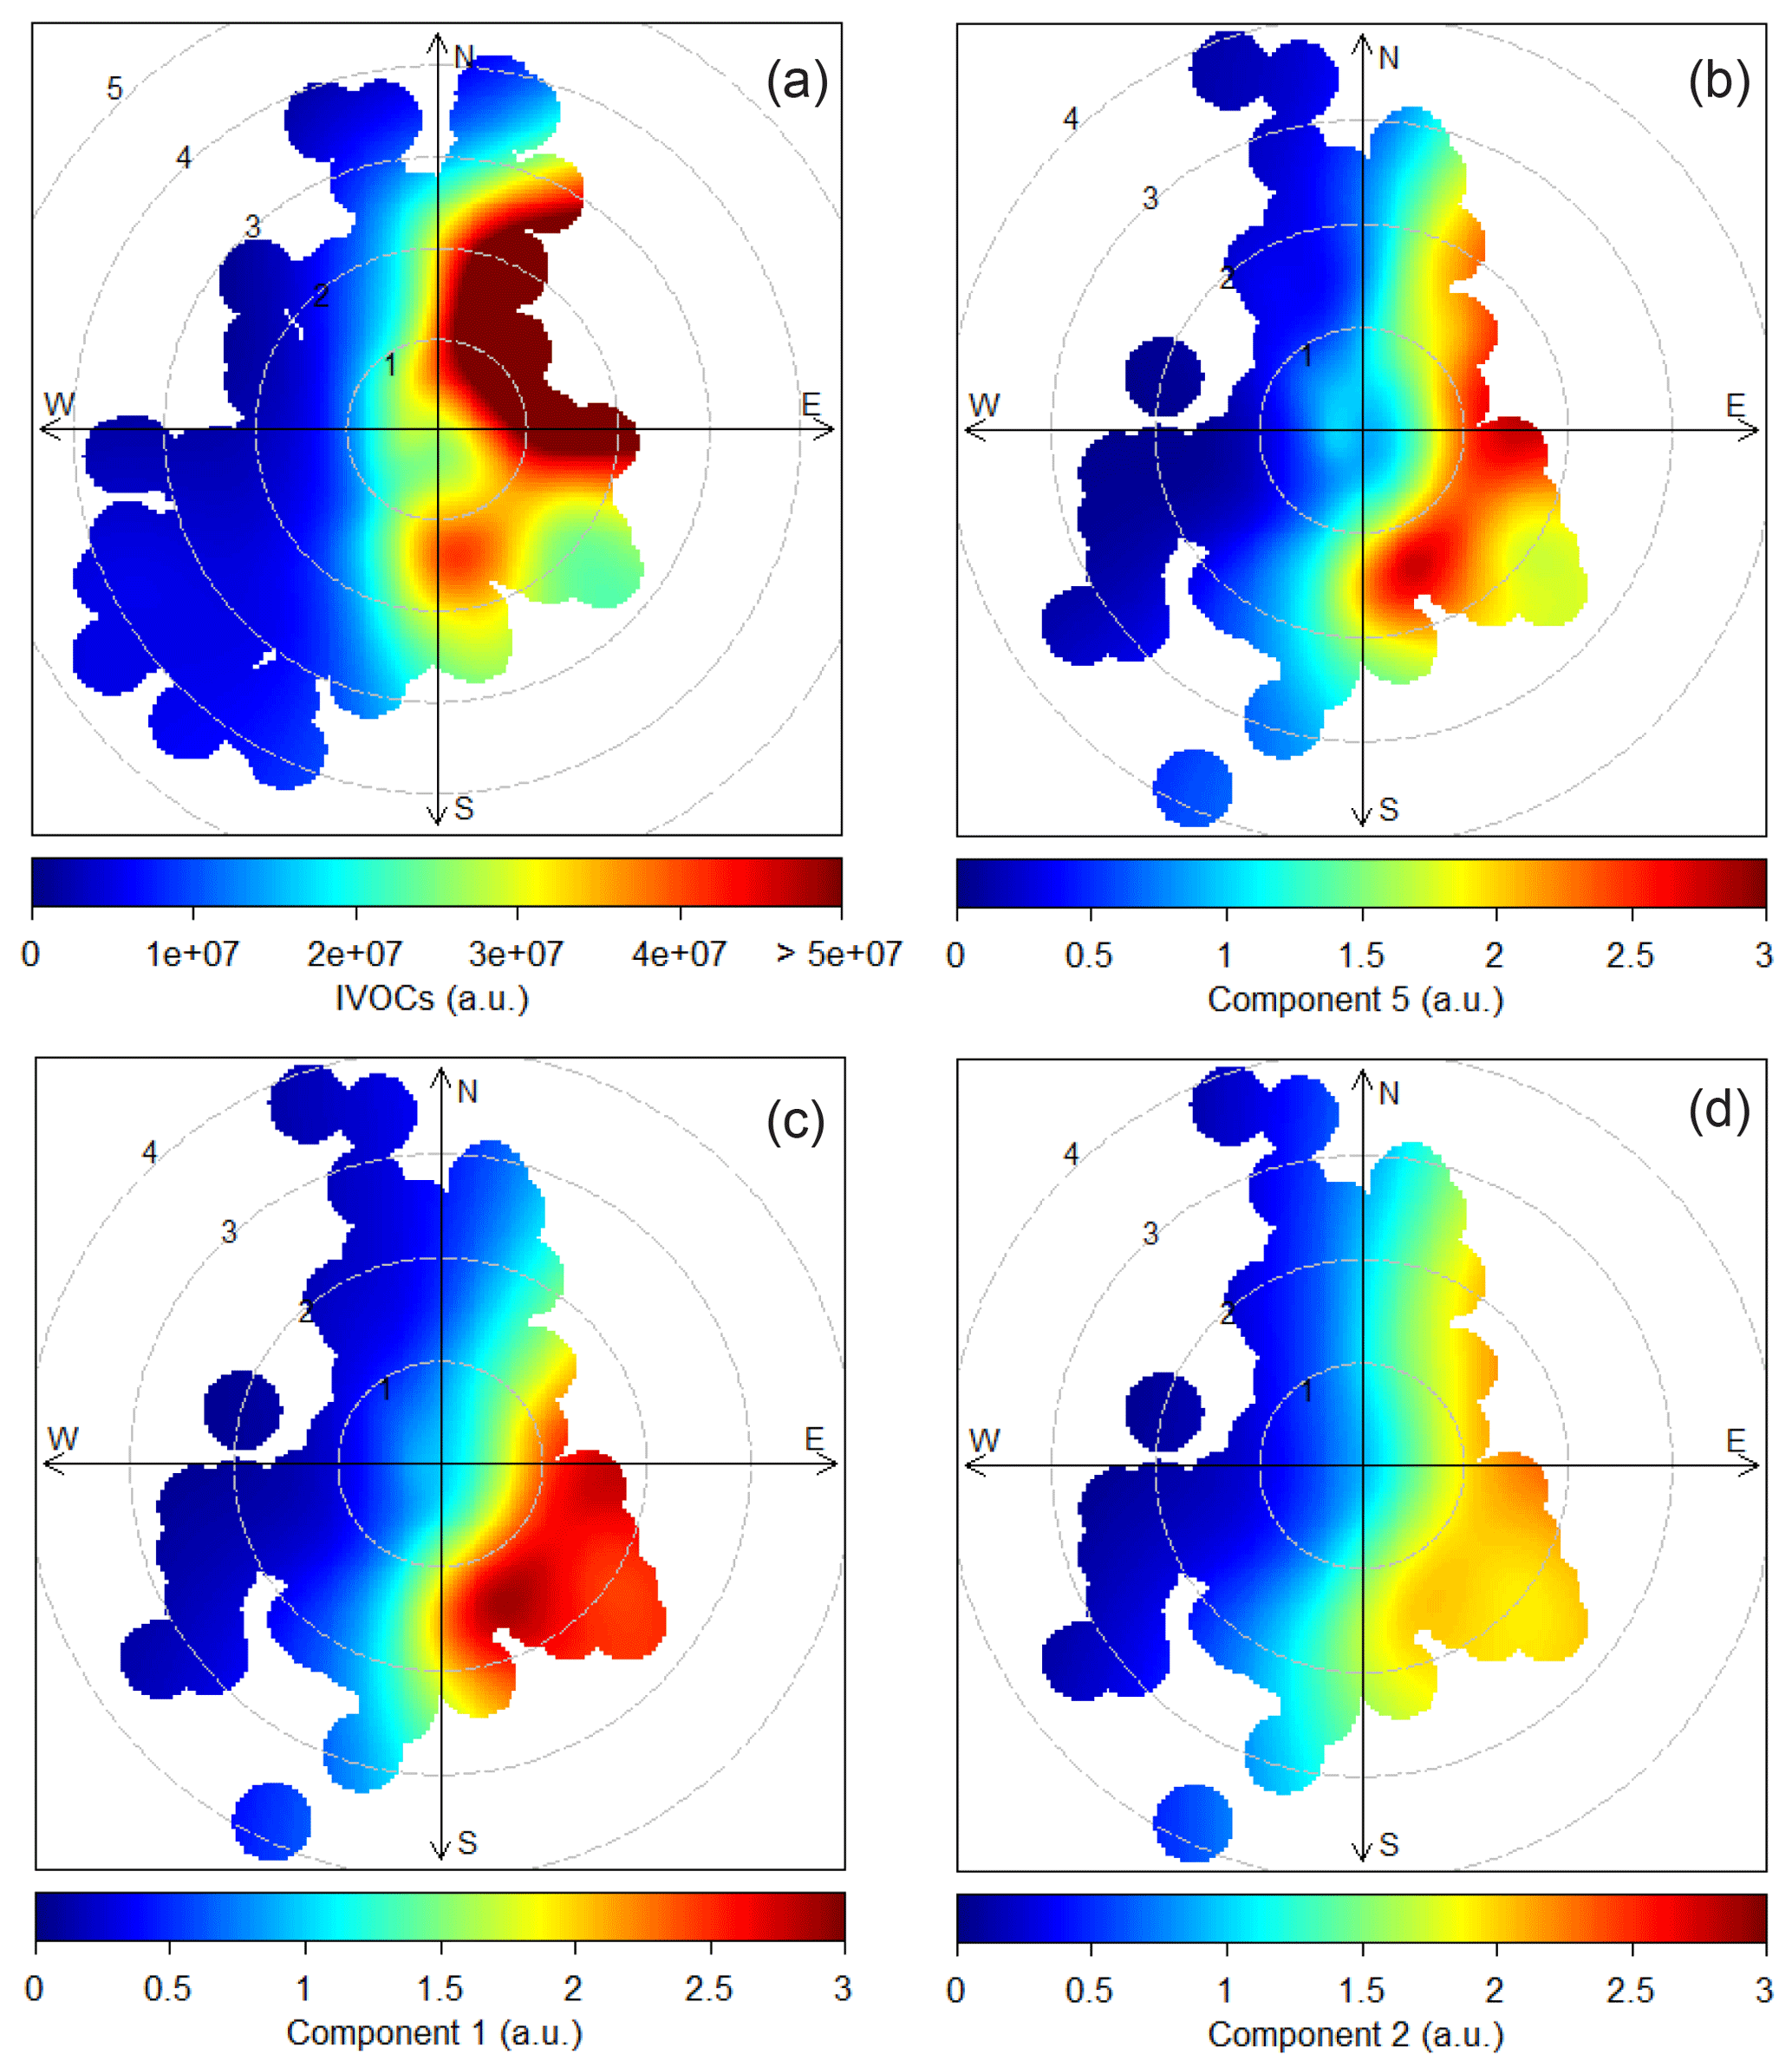
Figure 5Bivariate polar plots related to IVOCs. (a) IVOCs from the complete data set. (b) Component 5 extracted from the main PCA (Table 5). (c) Component 1 extracted from the main PCA. (d) Component 2 extracted from the main PCA. Wind direction is binned into 10∘ intervals and wind direction into 30∘ intervals. The polar axis indicates wind speed (m s−1). a.u. is arbitrary units.
This work has added to the relatively few data sets of pollutants in the Athabasca oil sands region, one of the largest emitters of airborne pollutants in Canada (NPRI, 2013), that are available in the open literature. Earlier source apportionment studies in the region investigated ground-level O3 and PM2.5 (Cho et al., 2012), examined VOCs (Bari and Kindzierski, 2018; Bari et al., 2016) and PM2.5 (Bari and Kindzierski, 2017; Landis et al., 2017) impacting the nearby communities of Fort McKay and Fort McMurray, or investigated pollutants such as PAHs as they affect sediments (Jautzy et al., 2013) or lichens (Landis et al., 2012). The measurement suite in this work encompassed a larger variety of collocated analytical instruments closer to oil sands mining operations than these earlier studies and included the first direct observation of airborne IVOCs, which is unique to this area and we have not observed it elsewhere where we have made GC-ITMS measurements, i.e., in Calgary and on Vancouver Island (Tokarek et al., 2017a).
The main objective of this work was to elucidate the origin of the IVOC signature observed at the AMS 13 ground site downwind from the Athabasca oil sands mining operations (Fig. 2) through a PCA. The optimum solution identified 10 components, of which three were associated with the IVOC signature: 1, 2, and 5 (Table 5). Tentative assignments of these components to source types in the oil sands are given in Table 6 and are discussed below.
Emission inventories show that the facilities that process the mined bitumen are by far the largest anthropogenic point sources in the oil sands region (NPRI, 2013), consistent with recent aircraft measurements (Baray et al., 2018; Howell et al., 2014; Li et al., 2017; Simpson et al., 2010), which have shown substantial emissions of NOy, SO2, CO, VOCs, CO2, and CH4, from these facilities and associated mining activities. No single component correlates with all of these variables, suggesting that the PCA is able to distinguish among source types within the facilities such as tailing ponds (component 1), stack emissions (component 4), and mining (component 2).
Close-up overflights (Howell et al., 2014; Li et al., 2017; Baray et al., 2018) were able to spatially resolve various oil sands facility emission sources (i.e., tailing ponds from upgrader facilities, fluid coking reactors, hydrocrackers and hydrotreaters); the PCA presented in this paper is not expected to do this in all cases because some emissions would have frequently merged into a single plume by the time of observation at AMS 13; unless their emissions vary considerably in time, these sources could be interpreted as originating from a single source in the PCA.
The discussion below focuses on components that are associated with IVOCs (Sect. 4.1), followed by those that are not (Sect. 4.2). The PCA that included six secondary products is discussed in Sect. 4.3. Components that are not associated with IVOCs and have only tentatively been identified (i.e., components 6–10) are discussed in the Supplement.
4.1 Components associated with IVOCs
4.1.1 Component 1: tailing ponds (wet tailings)
Component 1 is strongly associated with anthropogenic VOCs (r>0.87) and weakly with TRS (r=0.59) and CH4 (r=0.59). These pollutants originate from tailing ponds (Small et al., 2015), though it is unclear from this analysis how large a source tailing ponds are compared to fugitive emissions of these pollutants from the nearby processing (e.g., bitumen separation and mining) facilities.
Tailing ponds cover large areas of land and are used to slowly (on a timescale of years to decades) separate solid components, or tailings, from water used in bitumen extraction. Residual bitumen often floats to the top of the settling basins. Most tailing ponds are “wet” (as they contain residual naphtha that is used as a diluent during the transfer of tailings to the ponds) and emit VOCs, CH4, and CO2 (Small et al., 2015). The presence of o-xylene, TMB, and the n-alkanes in component 1 is consistent with the fugitive release of VOCs from residual naphtha, which contains these compounds (Siddique et al., 2008, 2011; Small et al., 2015). Furthermore, the observation of TRS and CH4 from this source is consistent with the presence of anaerobic sulfur-reducing bacteria and methanogens within the ponds, which degrade not only the residual bitumen (Holowenko et al., 2000; Percy, 2013; Quagraine et al., 2005) but also the various components of naphtha (Shahimin and Siddique, 2017; Small et al., 2015). Overall, tailing ponds emissions explain much of the TRS and CH4 concentration variability in this data set (Table 5) and in a recent aircraft study (Baray et al., 2018).
While component 1 correlates with CH4 (r=0.59), it does not correlate with CO2 (r=0.09). Emissions of CH4 from tailing ponds due to methanogenic bacterial activity are well documented (Small et al., 2015; Yeh et al., 2010) and hence the correlation with CH4 is not unexpected. Conversely, the lack of correlation with CO2 seems inconsistent with emission inventories that generally present tailing ponds as large CO2 sources (Small et al., 2015). One plausible explanation is that tailing ponds are a relatively small CO2 source overall in the region and that other, larger CO2 sources and sinks (such as photosynthesis and respiration by the vegetation surrounding the site) dominate the variance impacting the PCA results. It may also indicate that, at least on aggregate and for the particular ponds detected in this work, the emissions are in a regime in which the release of CH4 dominates over CO2, i.e., the ponds have, perhaps, become more anoxic than believed to be the case in previous studies and hence emit more CH4 (Holowenko et al., 2000). For example, Small et al. (2015) showed that older tailing ponds (those without the addition of fresh froth or thickening treatments) tended to emit more CH4, while newer ponds are associated with higher VOC emissions. It is likely that component 1 is dominated by the nearest pond (the Mildred Lake settling basin, 6–11 km SSE of AMS 13) and other tailings in the SE where the majority of air samples originated from. The Mildred Lake settling basin is one of the oldest in the region and is still actively being used; the correlation with CH4 and VOC emissions is hence expected.
Component 1 is also associated with NOy, rBC, CO, and HOA, though these correlations are relatively modest (r=0.27, 0.30, 0.41, and 0.40, respectively). These species typically originate from combustion sources, such as generators and motor vehicles, including diesel-powered engines powering generators or pumps; it is not obvious if and to what extent these are operated on or near tailing ponds, though. Satellite observations have shown elevated concentrations of NO2 above on-site upgrader facilities, likely a result of emissions from extraction and transport sources (McLinden et al., 2012). In addition, one of the major highways of the region is located adjacent to the Mildred Lake settling basin and other major ponds in the region; highway traffic emissions (of CO, NOy, rBC, and HOA) may hence also be partially included in component 1.
The bivariate polar plot shows that component 1 was observed when local wind speeds were from the SE and E of the measurement site (Fig. 5c), which is consistent with the notion that the Mildred Lake settling basin and emissions along Highway 63 and, potentially, more distant facilities are sources contributing to this component.
Component 1 is associated with the IVOC signature, though to a lesser degree than components 2 and 5. The association of the IVOC signal with component 1 is slightly poorer (r=0.31) than the association with component 2 (r=0.39), but significantly poorer than the association with component 5 (r=0.74). One possible explanation for the association of IVOCs with tailing ponds vapor is the presence of bitumen in the ponds that was not separated from the sand during the separation stage (Holowenko et al., 2000). This semi-processed bitumen would be expected to emit the same IVOC vapors as those that were observed in the lab (Fig. 2). Tailing ponds contain anywhere from 0.5 % to 5 % residual bitumen by weight (Chalaturnyk et al., 2002; Holowenko et al., 2000; Penner and Foght, 2010). As illustrated in Fig. 4a, some of this material floats on the ponds' surfaces, where IVOCs can partition to the air. Emission of IVOCs from bitumen floating on tailing ponds would be a function of many variables (e.g., diluent composition, extraction methodology, settling rate, temperature) and is thus not expected to be as persistent as CH4 partitioning from the ponds to the above air or from exposed bitumen on the mine surface, leading to a lower overall correlation.
Component 1 is also weakly associated with LO-OOA (r=0.45). Liggio et al. (2016) found that the observed SOA is dominated by an OOA factor whose mass spectrum was similar to that of aerosols formed from oxidized bitumen vapors. The organic aerosol budget in this study was also dominated by an OOA factor, the LO-OOA (Lee et al., 2018). The association of LO-OOA with component 1 is thus consistent with its association with IVOCs.
4.1.2 Component 2: mine fleet and vehicle emissions
Component 2 strongly correlates with NOy (r=0.82), rBC (r=0.77), pPAH (r=0.94), and HOA (r=0.74), which suggests a combustion source such as diesel engines. In the Athabasca oil sands, there is a sizeable off-road mining truck fleet consisting of heavy aggregate haulers. In addition, there are diesel engine sources associated with generators, pumps, and land-moving equipment, i.e., graders, dozers, hydraulic excavators, and electric rope shovels (Watson et al., 2013; Wang et al., 2016). Most of these non-road applications have been exempt from highway fuel taxes, on-road fuel formulation requirements, and after-engine exhaust treatment (Watson et al., 2013). Emissions from the hauler fleet and the stationary sources would fit the profile of component 2. Other diesel engines operated in the region include a commuter bus fleet, pickup and delivery trucks, tractor–trailers, and privately owned diesel-powered automobiles used to commute from the work sites to the major residential areas around Fort McMurray, whose emissions are likely captured by component 2 as well, though the magnitude of these relative to the mining truck fleet is not known. Consistent with component 2 being associated with an anthropogenic source is its poor correlation with undecane (r=0.27), likely arising from fugitive fuel emissions.
The bivariate polar plot (Fig. 5d) for component 2 and NOy in particular (Fig. S4a) matches the location of Highway 63, which crosses the river to the SE of AMS 13 and bends to the E and is indicative of a line source. At the same time, some of the largest mining operations in the region, the Susan Lake Gravel Pit, Aurora North, Muskeg River, and Millennium mines are located to the NE and SE of AMS 13 as well. NOy, rBC, and HOA (Fig. S4a, b and d) all appear to have dominating point sources to the S and E when wind speeds are 1–2 m s−1. These directions are the same as the Fort McKay industrial park to the E and the Syncrude Mildred Lake facility parking lot to the S, which would have a higher concentration of vehicles emitting these pollutants in a smaller area, whose emissions would be in addition to those from industrial activities.
Component 2 is associated with the IVOC signature and CH4 (both r=0.39). The mining activities bring bitumen to the surface; similar to what we had observed in lab experiments (Fig. 2, black trace), the surface exposure of bitumen during mining and on-site processing is expected to be associated with fugitive emissions of CH4 (Johnson et al., 2016) and IVOCs.
Fine-fraction pPAHs are associated strongly with component 2, but no other components. Measurements of individual PAHs in snow and moss downwind from the oil sands facilities have identified multiple sources of PAHs in the Athabasca oil sands, which include windblown petroleum coke dust (also referred to as petcoke for short), a carbonaceous residual product from the upgrading of crude petroleum that is stockpiled on mine sites, and emissions from fine tailings, oil sands ore, and naturally exposed bitumen (Zhang et al., 2016; Jautzy et al., 2015; Parajulee and Wania, 2014). Given this diversity of known sources, the associations of PAHs with only a single component is surprising, though it indicates that emissions from the mining fleet (which would include diesel and, perhaps, windblown emissions from petcoke that is being transported) gave rise to most of the variability in surface-bound PAH concentrations in this data set. The petcoke emissions identified in the studies mentioned above are likely mainly associated with larger supermicron-sized particles, whose PAH content would not be detected by the pPAH measurement in this data set.
Component 2 is not associated with LO-OOA (r=0.11), even though IVOCs are associated with this component. This feature may indicate that the IVOCs emitted in component 2 are qualitatively different from those emitted by components 1 and 5, in that they are less likely to yield organic aerosol on the timescale of transport from emission to observation. One reason for the difference could be that the bitumen that is transported by the mining fleet is relatively freshly exposed, whereas the IVOCs released from tailing ponds or from mine faces (component 5) may have been oxidized to a greater extent and hence more prone to rapid aerosol formation.
There is no association of component 2 with CO2 (r=0.08). This is somewhat unexpected as the trucks are expected to release CO2 (Wang et al., 2016) but could be due to significantly larger CO2 sources in the area dominating the observed CO2 variability at AMS 13 (e.g., components 3 and 6). Furthermore, one would expect an association of non-road mining truck emissions with aromatics and alkanes. Component 2 exhibited only poor correlations with decane (r=0.22) and undecane (r=0.27) and no correlation with o-xylene (r=0.08), suggesting that other components (i.e., component 1) explained most of the variability in their concentrations at this site.
4.1.3 Component 5: surface-exposed bitumen and hot-water bitumen extraction
Component 5 correlates more strongly with the IVOCs (r=0.74) than with any other component and correlates strongly with LO-OOA (r=0.72), weakly with rBC (r=0.44), and poorly with HOA (r=0.25), NOy (r=0.22), decane (r=0.23), undecane (r=0.20), and TRS (r=0.26). We interpret this profile as emissions from surface-exposed bitumen, which outgasses IVOCs.
One possibility is that these emissions occur on mine faces, where previously unexposed bitumen is brought to the surface as a result of mining. Only a relatively small portion of the mine faces are actively mined; those parts give rise to rBC and NOy emissions from combustion engines in heavy haulers or generators powering equipment. The poor association of component 5 with TRS could be due to sulfur-reducing bacteria found on the surface of bitumen. However, most of the variability in TRS at AMS 13 is attributed to composite or “dry” tailing ponds given their more conducive environment to microbial activity.
Component 5 does not correlate with CO2 () or with CH4 (r=0.12), which is somewhat at odds with the notion of mine faces as the main source of IVOCs. The mine faces give rise to substantial fugitive emissions of CO2 and CH4 (Johnson et al., 2016) – these emissions are likely captured by component 6 in this analysis (see Supplement). It is unclear to what extent these greenhouse gases are released relatively quickly from “hot spots” (i.e., from a small number of locations) through surface cracks and fissures or by slow release from new material that is exposed and then releases greenhouse gases during material handling, transport, and processing (Johnson et al., 2016). IVOCs from surface-exposed bitumen are likely released by the latter mechanism and are temperature dependent. If the mine faces are indeed the main IVOC source, the analysis results presented here suggest that the IVOC emissions from surface-exposed bitumen on mine faces are decoupled from CH4 emissions in time and appear as a distinct component and hence corroborate the hot spots or fast-release hypothesis, though clearly more work is needed to characterize greenhouse gas emissions from oil sands mine faces.
The association of IVOCs with component 5 may also be a result of fugitive emissions during the hot-water-based extraction of bitumen sand slurries during the separation phase of bitumen treatment. Generally, bitumen is extracted in a weak alkaline environment by aeration of the solution to optimize the separation of sand and bitumen (Masliyah et al., 2004). Unrecovered bitumen and naphtha then end up in tailings. The recovered bitumen and naphtha are moved to upgrader facilities where they undergo further treatment (such as coking or hydrotreatment). The magnitude of fugitive emissions during these downstream extraction processes could be large, considering the bitumen is heated and actively aerated. Future work should investigate IVOC fluxes near extraction plants and on mine faces.
Component 5 correlates strongly with LO-OOA (r=0.72), which is likely generated in part by photochemical aging of IVOCs. A back-of-the-envelope calculation using a kOH of cm3 molecule−1 s−1 based on the fact that used diesel exhaust IVOCs (Zhao et al., 2014) and an estimated midday OH concentration of 7×10⁶ molecules cm−3 (Liggio et al., 2016) gives a first-order lifetime of 130 min with respect to IVOC oxidation by OH during daytime. The photochemical age, estimated using relative concentrations of 124-TMB and n-decane and the method described by Borbon et al. (2013), during daytime was 1.0±0.4 h; assuming similar photochemical ages, we estimate that between 25 % and 50 % of the emitted IVOC is (potentially) oxidized during daytime (see Supplement). This oxidation will contribute SOA growth (Kroll et al., 2011). Hence, we expect some formation and growth of organic aerosol associated with component 5.
Finally, it is conceivable that a “natural” background of IVOCs exists in the region (since bitumen can be found at or near the surface in many parts of the region); such a natural background would also be included in component 5. However, this natural bitumen would have been exposed at the surface for geological timescales and, unlike unexposed, buried bitumen, likely would have lost most of its volatile content over that period. Furthermore, the mine faces occupy large swaths of land in the region (as evident from satellite imagery). Thus, the IVOC emissions are more likely due to anthropogenic activity than due to a natural phenomenon.
4.2 Components not associated with IVOCs
4.2.1 Component 3: biogenic emissions and respiration
Component 3 is strongly correlated with the monoterpenes α-pinene (r=0.98), β-pinene (r=0.98), and limonene (r=0.92) and is hence identified as a biogenic emissions source. This component is also weakly associated with CO2 (r=0.48).
At AMS 13, CO2 and the monoterpenes exhibit a very similar diurnal cycle: they are present in higher concentrations during the night than during the day (Fig. 3) due to a decrease in the boundary layer height (BLH) at night coupled with plant respiration of CO2 and non-photochemical emission of monoterpenes (Fares et al., 2013; Guenther et al., 2012). During the day, mixing ratios of CO2 are lower due to plant uptake and photosynthesis, and mixing ratios of terpenes are lower due to higher mixing heights and vertical entrainment and due to oxidation by O3 and OH (Fuentes et al., 1996). Hence, the PCA gives a positive correlation of monoterpenes with CO2 even though the physical processes, photosynthesis and respiration, work in the opposite direction.
The bivariate polar plots (Fig. S5a–c) show that the monoterpenes and CO2 were observed in the highest concentrations when the wind speeds were low (<1 m s−1), consistent with formation of a stable nocturnal boundary layer.
To corroborate this interpretation, the PCA was repeated with BLH estimated by a light detection and ranging (LIDAR) instrument (Strawbridge, 2013) added as a variable (Table S9 in the Supplement). Since BLH is not emitted by any source, it appears as a single variable component (r=0.90). The only other component that BLH (anti)correlates with is the biogenic component 3 ().
The dominant monoterpene species observed was α-pinene, followed by β-pinene and limonene, though occasionally there was twice as much β-pinene than α-pinene in the sampled air. Some variability in this ratio is expected since emission factors vary considerably among tree species (Geron et al., 2000), which are not homogeneously distributed throughout the region (e.g., Fig. S1 of Rooney et al., 2012).
Simpson et al. (2010) observed enhancements of α-pinene and, to a greater extent, β-pinene over the oil sands (up to 217 and 610 pptv) compared to background levels of 20±7 and 84±24 pptv, respectively, during midday overflights (which occurred between 11:00 and 13:00 local time). Similar enhancements were also reported by Li et al. (2017), who observed emissions of biogenic hydrocarbons in the four facilities sampled, three of which showed a higher β- than α-pinene concentration. The PCA (Table 5) showed no significant correlation of α- and β-pinene with any of the anthropogenic components, which implies that the biogenic source strength is simply too large for any anthropogenic emissions of terpenes to be picked up in the analysis, especially considering that terpenes are relatively short lived.
The biogenic source shows poor anticorrelations with NOy () and NH3 (). Many NOy species (i.e., NO2, HONO, peroxycarboxylic nitric anhydrides or PAN, and HNO3) deposit to the forest canopy (Hsu et al., 2016; Min et al., 2014; Fenn et al., 2015); at night, when mixing heights are lower, their concentrations are expected to decrease faster than during the day and are thus out of phase with the CO2 and terpene concentrations. The poor anticorrelation with NH3 likely arises because the NH3 emissions from plants are mainly stomatal and scale with temperature and are hence larger during the day than at night, anticorrelated with the terpene source (Whaley et al., 2018).
4.2.2 Component 4: Upgrader emissions
Component 4 is strongly correlated with SO2 (r=0.97) and total sulfur (r=0.93). By far the largest source of SO2 in the region are upgrader facilities, which emit as much as 6×10⁷ kg annually according to emission inventories (ECCC, 2013). Significant SO2 emissions from upgrader facilities have recently been confirmed by aircraft studies (Simpson et al., 2010; Howell et al., 2014; Liggio et al., 2016). Component 4 is also poorly correlated with NOy (r=0.21) but not with rBC (r=0.05), consistent with a non-sooty (i.e., lean) combustion source such as upgrader stacks. Strong enhancements in SO2 were only observed intermittently as “spikes”, which is expected when sampling emissions from relatively few and discrete point sources.
Component 4 is not associated with CO2 (), even though inventories indicate that the upgrading facilities are the largest CO2 source in the region (Furimsky, 2003; Englander et al., 2013; Yeh et al., 2010). In this data set, the lack of correlation of component 4 with CO2 (and to some extent with PM10−1 as well) likely arises mainly from a sampling bias as stack emissions were only observed during daytime, likely due to diurnal variability in the atmospheric boundary layer structure as explained below.
Most of the variability in CO2 concentration at AMS 13 is due to surface-based sources that originate from large areas, especially biogenic processes (photosynthesis during the day and respiration at night, component 3) and anthropogenic surface sources such as those captured by component 6 (Sect. 4.2.3). Other anthropogenic pollutants, such as SO2, NOy, and CH4, are not subject to large biogenically driven processes and are less affected than CO2.
In contrast to surface sources, emissions from the >100 m tall stacks are comparatively undersampled and observed mainly during daytime, when vertical mixing brings elevated plumes to the surface, yet CO2 concentrations are generally much lower than during the night due to uptake by vegetation. At night, pollutants emitted from stacks are injected above the likely very shallow nocturnal surface layer and were hence not observed at the surface. Vertical profile measurements of SO2 stack plumes by a Pandora spectral sun photometer at Fort McKay during daytime have shown considerable vertical gradients and only occasional transport of SO2 all the way to the surface (Fioletov et al., 2016).
The association of component 4 with CO2 is negative because the stack emission source is observed only during the day when the large biogenic sink dominates and effectively masks the relatively small increase due to anthropogenic CO2. In contrast, background concentrations of SO2 are comparatively low, and the increase in SO2 concentrations is readily picked up by the PCA.
It would be interesting to conduct a future study in winter when biogenic activities decrease; a wintertime PCA of surface measurements might be able to associate CO2 enhancements with upgrading facilities, though boundary layer mixing heights would decrease as well, which would make a PCA using surface data even more challenging.
Component 4 does not correlate with PM10−1 volume (r=0.09). It is clear that the emitted SO2 will contribute to secondary aerosol formation downwind, such that a correlation of stack emissions with PM10−1 volume might be expected. However, these secondary contributions will likely mostly be in the submicron aerosol fraction, which adds relatively little to PM10−1 volume. Further, PM10−1 volume is dominated by coarse particles from other primary sources, mostly windblown emission of sand from the mine surfaces, roadways, and perhaps bioaerosol (component 7, see the Supplement). These effects make PM10−1 volume from stacks appear comparatively small, such that the variability in the larger, surface-based sources likely masks the contribution of stack emissions to PM10−1 variability.
The bivariate polar plot of component 4 (Fig. S6d) shows that the largest magnitudes were observed when local winds were from the SE. The corresponding plot of SO2 (Fig. S6a) reveals two more distinct sources: a larger one from the E and a smaller one from the SSE. However, only two facilities (Sunrise and Firebag) are located to the E at relatively large distances of 37 and 47 km, respectively. The largest known upgrading facility and SO2 sources in the area (i.e., upgrading facilities located at the Mildred Lake and Suncor base plants) are located to the S and SE of AMS 13. Considering that the stack emissions are only observed intermittently, we speculate that there is a mesoscale transport pattern in the Athabasca River valley that channel emissions, such that the local wind direction and speed may be misleading as to the true location of these sources. For more extensive data sets, such phenomena may very well average out but perhaps did not in this case.
4.3 Extended PCA with added secondary variables
The extended analysis (Table 7) qualitatively preserves the structure (with the exception of an added “aged” component 6) of the original 10-component solution but allows an assessment of which components most result in formation of secondary products such as SOA, which has implications for health (Bernstein, 2004) and climate (Charlson et al., 1992). Secondary products vary considerably as a function of air mass chemical age (which depends, amongst other components, on time of day and synoptic conditions, including wind speed) and are hence expected to add considerable noise and scatter to the results leading to lower correlations. Conversely, the distance between the measurement site and sources is fixed, such that this variability should average out over time. This indeed appears to have happened in this data set in spite of the relatively low sample size.
The analysis indicates that the component with the strongest IVOC source (component 5) also has the highest association with PM1 (r=0.70; Table 7). Aircraft measurements combined with a modeling study have required a group of IVOC hydrocarbons to explain the significant SOA formation and growth downwind of the oil sands region (Liggio et al., 2016). The association of IVOCs with PM1 volume is consistent with the hypothesis that oxidation of IVOCs observed at AMS 13 leads to SOA generation and appears to have a significant impact on the variation in PM1 mass. The relatively short distance to sources and young photochemical age suggests that IVOCs would experience a relatively small number of oxidation steps. Consistent with this interpretation, a correlation with the MO-OOA is not observed in component 5 (r=0.10; Table 7). However, component 6, which is (poorly) anticorrelated with IVOCs (), is strongly correlated with MO-OOA (r=0.92), consistent with the notion that this component is more photochemically processed and that IVOCs contribute to this SOA AMS factor.
The second component influencing PM1 is that from stack emissions (component 4 in the primary PCA; component 2 in the secondary PCA) (Tables 5 and 7). It is well established that the oxidation of SO2 to sulfate will lead to formation of fine particulate matter. This apparently occurs, at least partially, on the timescale between the point of emission and the AMS 13 site (assuming a wind speed of 3 m s−1 and a distance of 11 km, the transit time is 1 h), though some fraction of is likely directly emitted.
A PCA was applied to continuous measurements of 22 primary pollutant tracers at the AMS 13 ground site in the Athabasca oil sands during the 2013 JOSM intensive study to elucidate the origins of airborne analytically unresolved hydrocarbons that were observed by GC-ITMS. The analysis identified 10 components. Three components correlated with the IVOC signature and were tentatively assigned to mine faces and, potentially, hot-water bitumen extraction facilities, the mine hauler fleet, and wet tailing pond emissions. All three are anthropogenic activities that involve the handling of raw bitumen, i.e., the unearthing, mining, and transport of crude bitumen, and the disposal of processed material that contains residual bitumen in wet tailing ponds. The PCA results are consistent with our previous interpretation that the unresolved hydrocarbons originate from bitumen based on the similarity of the chromatograms with those obtained in a headspace vapor analysis of ground-up bitumen in the laboratory.
Liggio et al. (2016) showed that these hydrocarbons constitute a group of IVOCs in the saturation vapor concentration (C*) range of 105 µg m µg m−3 that contribute significantly to SOA formation and growth downwind of the oil sands facilities. The correlation of LO-OOA with two of the three IVOC components in the main PCA and with PM1 in the extended analysis is consistent with the high SOA formation potential of IVOCs and suggests that further differentiation may be needed and stresses the need for IVOCs to be routinely monitored. In particular, direct measurements of emissions throughout the processing of raw bitumen are needed to pinpoint source contributions more accurately and aid in the development of potential mitigation strategies.
The PCA in this study suffered from several limitations. For instance, PCA does not provide insight into emission factors of individual facilities, though it does capture what conditions change ambient concentrations the most. Further, the receptor nature of PCA did not always discern among large source areas that may have many individual point sources coming together at the point of observation. For example, component 1 contains an obvious tailing pond signature because of its high correlation with anthropogenic VOCs, methane, and TRS, but also includes several combustion sources, making interpretation of this IVOC source location more challenging. A longer continuous data set with a greater number of variables would have perhaps been able to resolve these different sources, including the various tailing ponds, of which there are 19 in the region, all with slightly different emission profiles (Small et al., 2015) .
Another limitation is the bias of this (and most) ground site data set towards surface-based emissions and the undersampling of stack emissions. Facility stacks were only observed in the daytime because at night the mixing height is so low that the stacks emit directly into the residual layer. These emissions could be quantified using aircraft-based platforms (Howell et al., 2014; Li et al., 2017; Baray et al., 2018). The PCA struggled most with the allocation of greenhouse gases. Mixing ratios of CO2, in particular, were difficult to reconcile in this analysis due to a high background and large attenuation by biogenic activity and boundary layer meteorology. Forests greatly affected CO2 levels in the region because CO2 is taken up during the day when plants are photosynthetically active and emitted at night when plants undergo cellular respiration. This CO2 source and sink appears to dominate the PCA, effectively masking relatively small emissions from tailing ponds, facilities, and tail pipes in particular from the mine hauling fleet.
Finally, there is a need for improved monitoring methods for IVOCs. For instance, future studies should focus on characterizing the VOCs in the abovementioned volatility range using a greater mass and time resolution instrument, such as a time-of-flight mass spectrometer (TOF-MS) or higher-resolution separation methods (e.g., multidimensional gas chromatography), and also include measurement of speciated aerosol organic composition by, for example, thermal desorption aerosol GC (TAG) analysis (Williams et al., 2006). Future studies should also investigate how IVOC volatility distributions vary with source type and chemical age.
Data are available for download from the Environment and Climate Change Canada web site located at http://donnees.ec.gc.ca/data/air/monitor/ambient-air-quality-oil-sands-region/pollutant-transformation-summer-2013-ground-based-intensive-multi-parameters-Fort-McKay-oil-sands-region/?lang=en (last access: 10 December 2018).
The supplement related to this article is available online at: https://doi.org/10.5194/acp-18-17819-2018-supplement.
TWT and HDO carried out the experiments and analysis and wrote the paper (with input from all co-authors). CAOA, JAH, RM, AKYL, MDW, JPDA, CM, AD, RLM, KS, KLH, JSO, EGS, GRW, AGT, and DEJW operated and collected the raw data during the measurement campaign and/or worked up and compiled final data. DKB and FVA analyzed the bitumen sample after the campaign in the laboratory. AKYL and MGA carried out the aerosol PMF analysis. SML, JL, and JRB coordinated the campaign.
The authors declare that they have no conflict of interest.
This article is part of the special issue “Atmospheric emissions from oil sands development and their transport, transformation and deposition (ACP/AMT inter-journal SI)”. It is not associated with a conference.
Funding for this study was provided by Environment and Climate Change Canada
and the Canada-Alberta Oil Sands Monitoring program. The GC-ITMS used in this
work was purchased using funds provided by the Canada Foundation for
Innovation and matching funds by the Alberta government. Travis W. Tokarek,
Jennifer A. Huo, Duncan K. Brownsey, Faisal V. Assad, and Gregory R. Wentworth
acknowledge financial support from the Natural Sciences and Engineering
Research Council of Canada (NSERC) Collaborative Research and Training
Experience Program (CREATE) program Integrating Atmospheric Chemistry and
Physics from Earth to Space (IACPES).
Edited
by: Lynn M. Russell
Reviewed by: five anonymous referees
Alberta, G. O.: Government of Alberta, oil sands information portal, available at: http://osip.alberta.ca (last access: 23 February 2017), 2017.
Allen, E. W.: Process water treatment in Canada's oil sands industry: II. A review of emerging technologies, J. Environ. Eng. Sci., 7, 499–524, https://doi.org/10.1139/s08-020, 2008.
Baray, S., Darlington, A., Gordon, M., Hayden, K. L., Leithead, A., Li, S.-M., Liu, P. S. K., Mittermeier, R. L., Moussa, S. G., O'Brien, J., Staebler, R., Wolde, M., Worthy, D., and McLaren, R.: Quantification of methane sources in the Athabasca Oil Sands Region of Alberta by aircraft mass balance, Atmos. Chem. Phys., 18, 7361–7378, https://doi.org/10.5194/acp-18-7361-2018, 2018.
Bari, M. and Kindzierski, W. B.: Fifteen-year trends in criteria air pollutants in oil sands communities of Alberta, Canada, Environ. Int., 74, 200–208, https://doi.org/10.1016/j.envint.2014.10.009, 2015.
Bari, M. A. and Kindzierski, W. B.: Ambient fine particulate matter (PM2.5) in Canadian oil sands communities: Levels, sources and potential human health risk, Sci. Total Environ., 595, 828–838, https://doi.org/10.1016/j.scitotenv.2017.04.023, 2017.
Bari, M. A. and Kindzierski, W. B.: Ambient volatile organic compounds (VOCs) in communities of the Athabasca oil sands region: Sources and screening health risk assessment, Environ. Pollut., 235, 602–614, https://doi.org/10.1016/j.envpol.2017.12.065, 2018.
Bari, M. A., Kindzierski, W. B., and Spink, D.: Twelve-year trends in ambient concentrations of volatile organic compounds in a community of the Alberta Oil Sands Region, Canada, Environ. Int., 91, 40–50, https://doi.org/10.1016/j.envint.2016.02.015, 2016.
Bernstein, D. M.: Increased mortality in COPD among construction workers exposed to inorganic dust, Eur. Respir. J., 24, 512–512, https://doi.org/10.1183/09031936.04.00044504, 2004.
Bond, T. C., Streets, D. G., Yarber, K. F., Nelson, S. M., Woo, J. H., and Klimont, Z.: A technology-based global inventory of black and organic carbon emissions from combustion, J. Geophys. Res., 109, D14203, https://doi.org/10.1029/2003JD003697, 2004.
Borbon, A., Gilman, J. B., Kuster, W. C., Grand, N., Chevaillier, S., Colomb, A., Dolgorouky, C., Gros, V., Lopez, M., Sarda-Esteve, R., Holloway, J., Stutz, J., Petetin, H., McKeen, S., Beekmann, M., Warneke, C., Parrish, D. D., and de Gouw, J. A.: Emission ratios of anthropogenic volatile organic compounds in northern mid-latitude megacities: Observations versus emission inventories in Los Angeles and Paris, J. Geophys. Res.-Atmos., 118, 2041–2057, https://doi.org/10.1002/jgrd.50059, 2013.
Briggs, N. L. and Long, C. M.: Critical review of black carbon and elemental carbon source apportionment in Europe and the United States, Atmos. Environ., 144, 409–427, https://doi.org/10.1016/j.atmosenv.2016.09.002, 2016.
Burtscher, H., Scherrer, L., Siegmann, H. C., Schmidtott, A., and Federer, B.: Probing aerosols by photoelectric charging, J. Appl. Phys., 53, 3787–3791, https://doi.org/10.1063/1.331120, 1982.
Bytnerowicz, A., Fraczek, W., Schilling, S., and Alexander, D.: Spatial and temporal distribution of ambient nitric acid and ammonia in the Athabasca Oil Sands Region, Alberta, J. Limnol., 69, 11–21, https://doi.org/10.3274/jl10-69-s1-03, 2010.
CAPP (Canadian Association of Petroleum Producers): The facts on Canada's oil sands, available at: http://www.capp.ca/publications-and-statistics/publications/296225 (access: 20 April 2017), 2016.
Carslaw, D. C. and Beevers, S. D.: Characterising and understanding emission sources using bivariate polar plots and k-means clustering, Environ. Modell. Softw., 40, 325–329, https://doi.org/10.1016/j.envsoft.2012.09.005, 2013.
Carslaw, D. C. and Ropkins, K.: openair – An R package for air quality data analysis, Environ. Modell. Softw., 27–28, 52–61, https://doi.org/10.1016/j.envsoft.2011.09.008, 2012.
Cattell, R. B.: The Scree Test For The Number Of Factors, Multivar. Behav. Res., 1, 245–276, https://doi.org/10.1207/s15327906mbr0102_10, 1966.
Chalaturnyk, R. J., Don Scott, J., and Ozum, B.: Management of oil sands tailings, Petrol. Sci. Technol., 20, 1025–1046, https://doi.org/10.1081/lft-120003695, 2002.
Charlson, R. J., Schwartz, S. E., Hales, J. M., Cess, R. D., Coakley, J. A., Hansen, J. E., and Hofmann, D. J.: Climate forcing by anthropogenic aerosols, Science, 255, 423–430, https://doi.org/10.1126/science.255.5043.423, 1992.
Chen, H., Karion, A., Rella, C. W., Winderlich, J., Gerbig, C., Filges, A., Newberger, T., Sweeney, C., and Tans, P. P.: Accurate measurements of carbon monoxide in humid air using the cavity ring-down spectroscopy (CRDS) technique, Atmos. Meas. Tech., 6, 1031–1040, https://doi.org/10.5194/amt-6-1031-2013, 2013.
Cho, S., Morris, R., McEachern, P., Shah, T., Johnson, J., and Nopmongcol, U.: Emission sources sensitivity study for ground-level ozone and PM2.5 due to oil sands development using air quality modelling system: Part II – Source apportionment modelling, Atmos. Environ., 55, 542–556, https://doi.org/10.1016/j.atmosenv.2012.02.025, 2012.
Cross, E. S., Hunter, J. F., Carrasquillo, A. J., Franklin, J. P., Herndon, S. C., Jayne, J. T., Worsnop, D. R., Miake-Lye, R. C., and Kroll, J. H.: Online measurements of the emissions of intermediate-volatility and semi-volatile organic compounds from aircraft, Atmos. Chem. Phys., 13, 7845–7858, https://doi.org/10.5194/acp-13-7845-2013, 2013.
de Gouw, J. A., Middlebrook, A. M., Warneke, C., Ahmadov, R., Atlas, E. L., Bahreini, R., Blake, D. R., Brock, C. A., Brioude, J., Fahey, D. W., Fehsenfeld, F. C., Holloway, J. S., Le Henaff, M., Lueb, R. A., McKeen, S. A., Meagher, J. F., Murphy, D. M., Paris, C., Parrish, D. D., Perring, A. E., Pollack, I. B., Ravishankara, A. R., Robinson, A. L., Ryerson, T. B., Schwarz, J. P., Spackman, J. R., Srinivasan, A., and Watts, L. A.: Organic Aerosol Formation Downwind from the Deepwater Horizon Oil Spill, Science, 331, 1295–1299, https://doi.org/10.1126/science.1200320, 2011.
Dlugokencky, E.: Trends in atmospheric methane, available at: https://www.esrl.noaa.gov/gmd/ccgg/trends_ch4/ (last access: 11 April 2017), 2017a.
Dlugokencky, E.: Trends in atmospheric carbon dioxide, available at: https://www.esrl.noaa.gov/gmd/ccgg/trends/ (last access: 11 April 2017), 2017b.
ECCC: National pollutant release inventory (NPRI), available at: https://www.canada.ca/en/services/environment/pollution-waste-management/national-pollutant-release-inventory.html (last access: 10 December 2018), 2013.
ECCC: Joint oil sands monitoring program emissions inventory compilation report, Environment and Climate Change Canada, Downsview, 2016.
Englander, J. G., Bharadwaj, S., and Brandt, A. R.: Historical trends in greenhouse gas emissions of the Alberta oil sands (1970–2010), Environ. Res. Lett., 8, 044036, https://doi.org/10.1088/1748-9326/8/4/044036, 2013.
Fares, S., Schnitzhofer, R., Jiang, X., Guenther, A., Hansel, A., and Loreto, F.: Observations of Diurnal to Weekly Variations of Monoterpene-Dominated Fluxes of Volatile Organic Compounds from Mediterranean Forests: Implications for Regional Modeling, Environ. Sci. Technol., 47, 11073–11082, https://doi.org/10.1021/es4022156, 2013.
Fenn, M. E., Bytnerowicz, A., Schilling, S. L., and Ross, C. S.: Atmospheric deposition of nitrogen, sulfur and base cations in jack pine stands in the Athabasca Oil Sands Region, Alberta, Canada, Environ. Pollut., 196, 497–510, https://doi.org/10.1016/j.envpol.2014.08.023, 2015.
Fioletov, V. E., McLinden, C. A., Cede, A., Davies, J., Mihele, C., Netcheva, S., Li, S.-M., and O'Brien, J.: Sulfur dioxide (SO2) vertical column density measurements by Pandora spectrometer over the Canadian oil sands, Atmos. Meas. Tech., 9, 2961–2976, https://doi.org/10.5194/amt-9-2961-2016, 2016.
Fuentes, J. D., Wang, D., Neumann, H. H., Gillespie, T. J., DenHartog, G., and Dann, T. F.: Ambient biogenic hydrocarbons and isoprene emissions from a mixed deciduous forest, J. Atmos. Chem., 25, 67–95, https://doi.org/10.1007/BF00053286, 1996.
Furimsky, E.: Emissions of carbon dioxide from tar sands plants in Canada, Energy Fuels, 17, 1541–1548, https://doi.org/10.1021/ef0301102, 2003.
Gentner, D. R., Isaacman, G., Worton, D. R., Chan, A. W. H., Dallmann, T. R., Davis, L., Liu, S., Day, D. A., Russell, L. M., Wilson, K. R., Weber, R., Guha, A., Harley, R. A., and Goldstein, A. H.: Elucidating secondary organic aerosol from diesel and gasoline vehicles through detailed characterization of organic carbon emissions, P. Natl. Acad. Sci. USA, 109, 18318–18323, https://doi.org/10.1073/pnas.1212272109, 2012.
Geron, C., Rasmussen, R., Arnts, R. R., and Guenther, A.: A review and synthesis of monoterpene speciation from forests in the United States, Atmos. Environ., 34, 1761–1781, https://doi.org/10.1016/S1352-2310(99)00364-7, 2000.
Gordon, M., Li, S.-M., Staebler, R., Darlington, A., Hayden, K., O'Brien, J., and Wolde, M.: Determining air pollutant emission rates based on mass balance using airborne measurement data over the Alberta oil sands operations, Atmos. Meas. Tech., 8, 3745–3765, https://doi.org/10.5194/amt-8-3745-2015, 2015.
Grimmer, G., Brune, H., Deutschwenzel, R., Dettbarn, G., Jacob, J., Naujack, K. W., Mohr, U., and Ernst, H.: Contribution of polycyclic aromatic-hydrocarbons and nitro-derivatives to the carcinogenic impact of diesel-engine exhaust condensate evaluated by implantation into the lungs of rats, Cancer Lett., 37, 173–180, https://doi.org/10.1016/0304-3835(87)90160-1, 1987.
Guenther, A. B., Jiang, X., Heald, C. L., Sakulyanontvittaya, T., Duhl, T., Emmons, L. K., and Wang, X.: The Model of Emissions of Gases and Aerosols from Nature version 2.1 (MEGAN2.1): an extended and updated framework for modeling biogenic emissions, Geosci. Model Dev., 5, 1471–1492, https://doi.org/10.5194/gmd-5-1471-2012, 2012.
Guo, H., Wang, T., and Louie, P. K. K.: Source apportionment of ambient non-methane hydrocarbons in Hong Kong: Application of a principal component analysis/absolute principal component scores (PCA/APCS) receptor model, Environ. Pollut., 129, 489–498, https://doi.org/10.1016/j.envpol.2003.11.006, 2004.
Hair, J. F., Anderson, R. E., Tatham, R. L., and Black, W. C.: Multivariate data analysis, 7th Edn., Prentice-Hall, Upper Saddle River, NJ, 108–110, 1998.
Harrison, R. M., Smith, D. J. T., and Luhana, L.: Source Apportionment of Atmospheric Polycyclic Aromatic Hydrocarbons Collected from an Urban Location in Birmingham, U.K., Environ. Sci. Technol., 30, 825–832, https://doi.org/10.1021/es950252d, 1996.
Helmig, D., Klinger, L. F., Guenther, A., Vierling, L., Geron, C., and Zimmerman, P.: Biogenic volatile organic compound emissions (BVOCs) I. Identifications from three continental sites in the U.S, Chemosphere, 38, 2163–2187, https://doi.org/10.1016/S0045-6535(98)00425-1, 1999.
Holowenko, F. M., MacKinnon, M. D., and Fedorak, P. M.: Methanogens and sulfate-reducing bacteria in oil sands fine tailings waste, Can. J. Microbiol., 46, 927–937, https://doi.org/10.1139/cjm-46-10-927, 2000.
Howell, S. G., Clarke, A. D., Freitag, S., McNaughton, C. S., Kapustin, V., Brekovskikh, V., Jimenez, J.-L., and Cubison, M. J.: An airborne assessment of atmospheric particulate emissions from the processing of Athabasca oil sands, Atmos. Chem. Phys., 14, 5073–5087, https://doi.org/10.5194/acp-14-5073-2014, 2014.
Hsu, Y. M., Bytnerowicz, A., Fenn, M. E., and Percy, K. E.: Atmospheric dry deposition of sulfur and nitrogen in the Athabasca Oil Sands Region, Alberta, Canada, Sci. Total Environ., 568, 285–295, https://doi.org/10.1016/j.scitotenv.2016.05.205, 2016.
Jautzy, J., Ahad, J. M. E., Gobeil, C., and Savard, M. M.: Century-Long Source Apportionment of PAHs in Athabasca Oil Sands Region Lakes Using Diagnostic Ratios and Compound-Specific Carbon Isotope Signatures, Environ. Sci. Technol., 47, 6155–6163, https://doi.org/10.1021/es400642e, 2013.
Jautzy, J. J., Ahad, J. M. E., Gobeil, C., Smirnoff, A., Barst, B. D., and Savard, M. M.: Isotopic Evidence for Oil Sands Petroleum Coke in the Peace-Athabasca Delta, Environ. Sci. Technol., 49, 12062–12070, https://doi.org/10.1021/acs.est.5b03232, 2015.
Jimenez, J. L., Canagaratna, M. R., Donahue, N. M., Prevot, A. S. H., Zhang, Q., Kroll, J. H., DeCarlo, P. F., Allan, J. D., Coe, H., Ng, N. L., Aiken, A. C., Docherty, K. S., Ulbrich, I. M., Grieshop, A. P., Robinson, A. L., Duplissy, J., Smith, J. D., Wilson, K. R., Lanz, V. A., Hueglin, C., Sun, Y. L., Tian, J., Laaksonen, A., Raatikainen, T., Rautiainen, J., Vaattovaara, P., Ehn, M., Kulmala, M., Tomlinson, J. M., Collins, D. R., Cubison, M. J., E., Dunlea, J., Huffman, J. A., Onasch, T. B., Alfarra, M. R., Williams, P. I., Bower, K., Kondo, Y., Schneider, J., Drewnick, F., Borrmann, S., Weimer, S., Demerjian, K., Salcedo, D., Cottrell, L., Griffin, R., Takami, A., Miyoshi, T., Hatakeyama, S., Shimono, A., Sun, J. Y., Zhang, Y. M., Dzepina, K., Kimmel, J. R., Sueper, D., Jayne, J. T., Herndon, S. C., Trimborn, A. M., Williams, L. R., Wood, E. C., Middlebrook, A. M., Kolb, C. E., Baltensperger, U., and Worsnop, D. R.: Evolution of Organic Aerosols in the Atmosphere, Science, 326, 1525–1529, 10.1126/science.1180353, 2009.
Johnson, M. R., Crosland, B. M., McEwen, J. D., Hager, D. B., Armitage, J. R., Karimi-Golpayegani, M., and Picard, D. J.: Estimating fugitive methane emissions from oil sands mining using extractive core samples, Atmos. Environ., 144, 111–123, https://doi.org/10.1016/j.atmosenv.2016.08.073, 2016.
Jolliffe, I. T. and Cadima, J.: Principal component analysis: a review and recent developments, Philos. T. R. Soc. A, 374, 2065, https://doi.org/10.1098/rsta.2015.0202, 2016.
JOSM: Canada-Alberta Joint Oil Sands Environmental Monitoring, Government of Canada, available at: https://www.canada.ca/en/environment-climate-change/services/oil-sands-monitoring.html (last access: 10 December 2018), 2012.
Kaiser, H. F.: The varimax criterion for analytic rotation in factor-analysis, Psychometrika, 23, 187–200, https://doi.org/10.1007/bf02289233, 1958.
Kindzierski, W. B. and Ranganathan, H. K. S.: Indoor and outdoor SO2 in a community near oil sand extraction and production facilities in northern Alberta, J. Environ. Eng. Sci., 5, S121–S129, https://doi.org/10.1139/s06-022, 2006.
Kroll, J. H., Donahue, N. M., Jimenez, J. L., Kessler, S. H., Canagaratna, M. R., Wilson, K. R., Altieri, K. E., Mazzoleni, L. R., Wozniak, A. S., Bluhm, H., Mysak, E. R., Smith, J. D., Kolb, C. E., and Worsnop, D. R.: Carbon oxidation state as a metric for describing the chemistry of atmospheric organic aerosol, Nat. Chem., 3, 133, https://doi.org/10.1038/nchem.948, 2011.
Landis, M. S., Pancras, J. P., Graney, J. R., Stevens, R. K., Percy, K. E., and Krupa, S.: Chapter 18 – Receptor Modeling of Epiphytic Lichens to Elucidate the Sources and Spatial Distribution of Inorganic Air Pollution in the Athabasca Oil Sands Region, in: Developments in Environmental Science, edited by: Percy, K. E., Elsevier, 427–467, 2012.
Landis, M. S., Pancras, J. P., Graney, J. R., White, E. M., Edgerton, E. S., Legge, A., and Percy, K. E.: Source apportionment of ambient fine and coarse particulate matter at the Fort McKay community site, in the Athabasca Oil Sands Region, Alberta, Canada, Sci. Total Environ., 584, 105–117, https://doi.org/10.1016/j.scitotenv.2017.01.110, 2017.
Lee, A. K. Y., Adam, M. G., Liggio, J., Li, S.-M., Li, K., Willis, M. D., Abbatt, J. P. D., Tokarek, T. W., Odame-Ankrah, C. A., Huo, J. A., Osthoff, H. D., Strawbridge, K. B., and Brook, J. R.: A large contribution of anthropogenic organo-nitrates to secondary organic aerosol in Alberta oil sands, Atmos. Chem. Phys. Discuss., in preparation, 2018.
Li, S.-M., Leithead, A., Moussa, S. G., Liggio, J., Moran, M. D., Wang, D., Hayden, K., Darlington, A., Gordon, M., Staebler, R., Makar, P. A., Stroud, C. A., McLaren, R., Liu, P. S. K., O'Brien, J., Mittermeier, R. L., Zhang, J., Marson, G., Cober, S. G., Wolde, M., and Wentzell, J. J. B.: Differences between measured and reported volatile organic compound emissions from oil sands facilities in Alberta, Canada, P. Natl. Acad. Sci. USA, 114, E3756–E3765, https://doi.org/10.1073/pnas.1617862114, 2017.
Liggio, J., Li, S.-M., Hayden, K., Taha, Y. M., Stroud, C., Darlington, A., Drollette, B. D., Gordon, M., Lee, P., Liu, P., Leithead, A., Moussa, S. G., Wang, D., O'Brien, J., Mittermeier, R. L., Brook, J., Lu, G., Staebler, R., Han, Y., Tokarek, T. W., Osthoff, H. D., Makar, P. A., Zhang, J., Plata, D., and Gentner, D. R.: Oil Sands Operations as a Large Source of Secondary Organic Aerosols, Nature, 534, 91–94, https://doi.org/10.1038/nature17646, 2016.
Marey, H. S., Hashisho, Z., Fu, L., and Gille, J.: Spatial and temporal variation in CO over Alberta using measurements from satellites, aircraft, and ground stations, Atmos. Chem. Phys., 15, 3893–3908, https://doi.org/10.5194/acp-15-3893-2015, 2015.
Markovic, M. Z., VandenBoer, T. C., and Murphy, J. G.: Characterization and optimization of an online system for the simultaneous measurement of atmospheric water-soluble constituents in the gas and particle phases, J. Environ. Monitor., 14, 1872–1884, https://doi.org/10.1039/C2EM00004K, 2012.
Masliyah, J., Zhou, Z. J., Xu, Z. H., Czarnecki, J., and Hamza, H.: Understanding water-based bitumen extraction from athabasca oil sands, Can. J. Chem. Eng., 82, 628–654, https://doi.org/10.1002/cjce.5450820403, 2004.
McLinden, C. A., Fioletov, V., Boersma, K. F., Krotkov, N., Sioris, C. E., Veefkind, J. P., and Yang, K.: Air quality over the Canadian oil sands: A first assessment using satellite observations, Geophys. Res. Lett., 39, L04804, https://doi.org/10.1029/2011gl050273, 2012.
Miller, S. M., Matross, D. M., Andrews, A. E., Millet, D. B., Longo, M., Gottlieb, E. W., Hirsch, A. I., Gerbig, C., Lin, J. C., Daube, B. C., Hudman, R. C., Dias, P. L. S., Chow, V. Y., and Wofsy, S. C.: Sources of carbon monoxide and formaldehyde in North America determined from high-resolution atmospheric data, Atmos. Chem. Phys., 8, 7673–7696, https://doi.org/10.5194/acp-8-7673-2008, 2008.
Min, K.-E., Pusede, S. E., Browne, E. C., LaFranchi, B. W., and Cohen, R. C.: Eddy covariance fluxes and vertical concentration gradient measurements of NO and NO2 over a ponderosa pine ecosystem: observational evidence for within-canopy chemical removal of NOx, Atmos. Chem. Phys., 14, 5495–5512, https://doi.org/10.5194/acp-14-5495-2014, 2014.
Nara, H., Tanimoto, H., Tohjima, Y., Mukai, H., Nojiri, Y., Katsumata, K., and Rella, C. W.: Effect of air composition (N2, O2, Ar, and H2O) on CO2 and CH4 measurement by wavelength-scanned cavity ring-down spectroscopy: calibration and measurement strategy, Atmos. Meas. Tech., 5, 2689–2701, https://doi.org/10.5194/amt-5-2689-2012, 2012.
Nimana, B., Canter, C., and Kumar, A.: Energy consumption and greenhouse gas emissions in the recovery and extraction of crude bitumen from Canada's oil sands, Appl. Energ., 143, 189–199, https://doi.org/10.1016/j.apenergy.2015.01.024, 2015a.
Nimana, B., Canter, C., and Kumar, A.: Energy consumption and greenhouse gas emissions in upgrading and refining of Canada's oil sands products, Energy, 83, 65–79, https://doi.org/10.1016/j.energy.2015.01.085, 2015b.
NPRI: Detailed facility information, available at: http://www.ec.gc.ca/inrp-npri/donnees-data/index.cfm?do=facility_information&lang=En&opt_npri_id=0000002274&opt_report_year=2013 (last access: 13 April 2017), 2013.
Odame-Ankrah, C. A.: Improved detection instrument for nitrogen oxide species, PhD, Chemistry, University of Calgary, https://doi.org/10.5072/PRISM/26475, Calgary, 2015.
Onasch, T. B., Trimborn, A., Fortner, E. C., Jayne, J. T., Kok, G. L., Williams, L. R., Davidovits, P., and Worsnop, D. R.: Soot Particle Aerosol Mass Spectrometer: Development, Validation, and Initial Application, Aerosol Sci. Tech., 46, 804–817, https://doi.org/10.1080/02786826.2012.663948, 2012.
Paatero, P. and Tapper, U.: Positive matrix factorization: A non-negative factor model with optimal utilization of error estimates of data values, Environmetrics, 5, 111–126, https://doi.org/10.1002/env.3170050203, 1994.
Parajulee, A. and Wania, F.: Evaluating officially reported polycyclic aromatic hydrocarbon emissions in the Athabasca oil sands region with a multimedia fate model, P. Natl. Acad Sci. USA, 111, 3344–3349, https://doi.org/10.1073/pnas.1319780111, 2014.
Paul, D. and Osthoff, H. D.: Absolute Measurements of Total Peroxy Nitrate Mixing Ratios by Thermal Dissociation Blue Diode Laser Cavity Ring-Down Spectroscopy, Anal. Chem., 82, 6695–6703, https://doi.org/10.1021/ac101441z, 2010.
Penner, T. J. and Foght, J. M.: Mature fine tailings from oil sands processing harbour diverse methanogenic communities, Can. J. Microbiol., 56, 459–470, https://doi.org/10.1139/w10-029, 2010.
Percy, K. E.: Ambient Air Quality and Linkage to Ecosystems in the Athabasca Oil Sands, Alberta, Geosci. Can., 40, 182–201, https://doi.org/10.12789/geocanj.2013.40.014, 2013.
Peters, T. M. and Leith, D.: Concentration measurement and counting efficiency of the aerodynamic particle sizer 3321, J. Aerosol Sci., 34, 627–634, https://doi.org/10.1016/s0021-8502(03)00030-2, 2003.
Polissar, A. V., Hopke, P. K., Paatero, P., Malm, W. C., and Sisler, J. F.: Atmospheric aerosol over Alaska: 2. Elemental composition and sources, J. Geophys. Res.-Atmos., 103, 19045–19057, https://doi.org/10.1029/98JD01212, 1998.
Quagraine, E. K., Headley, J. V., and Peterson, H. G.: Is biodegradation of bitumen a source of recalcitrant naphthenic acid mixtures in oil sands tailing pond waters?, J. Environ. Sci. Heal. A, 40, 671–684, https://doi.org/10.1081/ese-200046637, 2005.
Robinson, A. L., Donahue, N. M., Shrivastava, M. K., Weitkamp, E. A., Sage, A. M., Grieshop, A. P., Lane, T. E., Pierce, J. R., and Pandis, S. N.: Rethinking organic aerosols: Semivolatile emissions and photochemical aging, Science, 315, 1259–1262, 2007.
Rooney, R. C., Bayley, S. E., and Schindler, D. W.: Oil sands mining and reclamation cause massive loss of peatland and stored carbon, P. Natl. Acad. Sci. USA, 109, 4933–4937, https://doi.org/10.1073/pnas.1117693108, 2012.
RStudio Boston: Integrated development environment for R, available at: http://www.rstudio.org (last access: 10 December 2018), 2017.
SAS: SAS™ Studio 3.4, SAS Studio Inc., Cary, North Carolina, USA, available at: https://www.sas.com/en_ca/software/studio.html (last access: 10 December 2018), 2015.
Shahimin, M. F. M. and Siddique, T.: Sequential biodegradation of complex naphtha hydrocarbons under methanogenic conditions in two different oil sands tailings, Environ. Pollut., 221, 398–406, https://doi.org/10.1016/j.envpol.2016.12.002, 2017.
Siddique, T., Fedorak, P. M., and Foght, J. M.: Biodegradation of short-chain n-alkanes in oil sands tailings under methanogenic conditions, Environ. Sci. Technol., 40, 5459–5464, https://doi.org/10.1021/es060993m, 2006.
Siddique, T., Gupta, R., Fedorak, P. M., MacKinnon, M. D., and Foght, J. M.: A first approximation kinetic model to predict methane generation from an oil sands tailings settling basin, Chemosphere, 72, 1573–1580, https://doi.org/10.1016/j.chemosphere.2008.04.036, 2008.
Siddique, T., Penner, T., Semple, K., and Foght, J. M.: Anaerobic Biodegradation of Longer-Chain n-Alkanes Coupled to Methane Production in Oil Sands Tailings, Environm. Sci. Technol., 45, 5892–5899, https://doi.org/10.1021/es200649t, 2011.
Siddique, T., Penner, T., Klassen, J., Nesbo, C., and Foght, J. M.: Microbial Communities Involved in Methane Production from Hydrocarbons in Oil Sands Tailings, Environ. Sci. Technol., 46, 9802–9810, https://doi.org/10.1021/es302202c, 2012.
Simpson, I. J., Blake, N. J., Barletta, B., Diskin, G. S., Fuelberg, H. E., Gorham, K., Huey, L. G., Meinardi, S., Rowland, F. S., Vay, S. A., Weinheimer, A. J., Yang, M., and Blake, D. R.: Characterization of trace gases measured over Alberta oil sands mining operations: 76 speciated C2–C10 volatile organic compounds (VOCs), CO2, CH4, CO, NO, NO2, NOy, O3 and SO2, Atmos. Chem. Phys., 10, 11931–11954, https://doi.org/10.5194/acp-10-11931-2010, 2010.
Small, C. C., Cho, S., Hashisho, Z., and Ulrich, A. C.: Emissions from oil sands tailings ponds: Review of tailings pond parameters and emission estimates, J. Petrol. Sci. Eng., 127, 490–501, https://doi.org/10.1016/j.petrol.2014.11.020, 2015.
Smreciu, A., Gould, K., and Wood, S.: Boreal Plant Species for Reclamation of Athabasca Oil Sands Disturbances – Updated December 2014, Edmonton, Alberta, Canada TR-44, https://doi.org/10.7939/R3MC8RK9B, 2013.
Strawbridge, K. B.: Developing a portable, autonomous aerosol backscatter lidar for network or remote operations, Atmos. Meas. Tech., 6, 801–816, https://doi.org/10.5194/amt-6-801-2013, 2013.
Thurston, G. D. and Spengler, J. D.: A quantitative assessment of source contributions to inhalable particulate matter pollution in metropolitan Boston, Atmos. Environ., 19, 9–25, https://doi.org/10.1016/0004-6981(85)90132-5, 1985.
Thurston, G. D., Ito, K., and Lall, R.: A source apportionment of U.S. fine particulate matter air pollution, Atmos. Environ., 45, 3924–3936, https://doi.org/10.1016/j.atmosenv.2011.04.070, 2011.
Tokarek, T. W., Huo, J. A., Odame-Ankrah, C. A., Hammoud, D., Taha, Y. M., and Osthoff, H. D.: A gas chromatograph for quantification of peroxycarboxylic nitric anhydrides calibrated by thermal dissociation cavity ring-down spectroscopy, Atmos. Meas. Tech., 7, 3263–3283, https://doi.org/10.5194/amt-7-3263-2014, 2014.
Tokarek, T. W., Brownsey, D. K., Jordan, N., Garner, N. M., Ye, C. Z., Assad, F. V., Peace, A., Schiller, C. L., Mason, R. H., Vingarzan, R., and Osthoff, H. D.: Biogenic emissions and nocturnal ozone depletion events at the Amphitrite Point Observatory on Vancouver Island, Atmos. Ocean, 55, 121–132, https://doi.org/10.1080/07055900.2017.1306687, 2017a.
Tokarek, T. W., Brownsey, D. K., Jordan, N., Garner, N. M., Ye, C. Z., Assad, F. V., Peace, A., Schiller, C. L., Mason, R. H., Vingarzan, R., and Osthoff, H. D.: Biogenic Emissions and Nocturnal Ozone Depletion Events at the Amphitrite Point Observatory on Vancouver Island, Atmos. Ocean, 55, 121–132, https://doi.org/10.1080/07055900.2017.1306687, 2017b.
Wang, S. C. and Flagan, R. C.: Scanning electrical mobility spectrometer, Aerosol Sci. Tech., 13, 230–240, https://doi.org/10.1080/02786829008959441, 1990.
Wang, X. L., Chow, J. C., Kohl, S. D., Percy, K. E., Legge, A. H., and Watson, J. G.: Characterization of PM2.5 and PM10 fugitive dust source profiles in the Athabasca Oil Sands Region, J. Air Waste Manage., 65, 1421–1433, https://doi.org/10.1080/10962247.2015.1100693, 2015.
Wang, X. L., Chow, J. C., Kohl, S. D., Percy, K. E., Legge, A. H., and Watson, J. G.: Real-world emission factors for Caterpillar 797B heavy haulers during mining operations, Particuology, 28, 22–30, https://doi.org/10.1016/j.partic.2015.07.001, 2016.
Warren, L. A., Kendra, K. E., Brady, A. L., and Slater, G. F.: Sulfur Biogeochemistry of an Oil Sands Composite Tailings Deposit, Front. Microbiol., 6, 14, https://doi.org/10.3389/fmicb.2015.01533, 2016.
Watson, J., Chow, J., Wang, X., Zielinska, B., Kohl, S., and Gronstal, S.: Characterization of real-world emissions from nonroad mining trucks in the Athabasca Oil Sands Region during September, 2009, available at: https://wbea.org/wp-content/uploads/2018/03/watson_j_g_et_al_2013_characterization_of_real_world_emissions_from_nonroad_mining_trucks_in_the_athabasca_oil_sands_region_during_september_2009.pdf (last access: 10 December 2018), 2013.
WBEA: WBEA annual report 2013, Wood Buffalo Environmental Association, 2013.
Whaley, C. H., Makar, P. A., Shephard, M. W., Zhang, L., Zhang, J., Zheng, Q., Akingunola, A., Wentworth, G. R., Murphy, J. G., Kharol, S. K., and Cady-Pereira, K. E.: Contributions of natural and anthropogenic sources to ambient ammonia in the Athabasca Oil Sands and north-western Canada, Atmos. Chem. Phys., 18, 2011–2034, https://doi.org/10.5194/acp-18-2011-2018, 2018.
Williams, B. J., Goldstein, A. H., Kreisberg, N. M., and Hering, S. V.: An in-situ instrument for speciated organic composition of atmospheric aerosols: Thermal Desorption Aerosol GC/MS-FID (TAG), Aerosol Sci. Tech., 40, 627–638, https://doi.org/10.1080/02786820600754631, 2006.
Wilson, N. K., Barbour, R. K., Chuang, J. C., and Mukund, R.: Evaluation of a real-time monitor for fine particle-bound PAH in air, Polycycl. Aromat. Comp., 5, 167–174, https://doi.org/10.1080/10406639408015168, 1994.
Yang, C., Wang, Z., Yang, Z., Hollebone, B., Brown, C. E., Landriault, M., and Fieldhouse, B.: Chemical Fingerprints of Alberta Oil Sands and Related Petroleum Products, Environ. Forensics, 12, 173–188, https://doi.org/10.1080/15275922.2011.574312, 2011.
Yeh, S., Jordaan, S. M., Brandt, A. R., Turetsky, M. R., Spatari, S., and Keith, D. W.: Land Use Greenhouse Gas Emissions from Conventional Oil Production and Oil Sands, Environ. Sci. Technol., 44, 8766–8772, https://doi.org/10.1021/es1013278, 2010.
Zhang, Y., Wang, Y., Chen, G., Smeltzer, C., Crawford, J., Olson, J., Szykman, J., Weinheimer, A. J., Knapp, D. J., Montzka, D. D., Wisthaler, A., Mikoviny, T., Fried, A., and Diskin, G.: Large vertical gradient of reactive nitrogen oxides in the boundary layer: Modeling analysis of DISCOVER-AQ 2011 observations, J. Geophys. Res.-Atmos., 121, 1922–1934, https://doi.org/10.1002/2015jd024203, 2016.
Zhao, W., Hopke, P. K., and Karl, T.: Source Identification of Volatile Organic Compounds in Houston, Texas, Environ. Sci. Technol., 38, 1338–1347, https://doi.org/10.1021/es034999c, 2004.
Zhao, Y. L., Hennigan, C. J., May, A. A., Tkacik, D. S., de Gouw, J. A., Gilman, J. B., Kuster, W. C., Borbon, A., and Robinson, A. L.: Intermediate-Volatility Organic Compounds: A Large Source of Secondary Organic Aerosol, Environ. Sci. Technol., 48, 13743–13750, https://doi.org/10.1021/es5035188, 2014.
Zhao, Y. L., Nguyen, N. T., Presto, A. A., Hennigan, C. J., May, A. A., and Robinson, A. L.: Intermediate Volatility Organic Compound Emissions from On-Road Diesel Vehicles: Chemical Composition, Emission Factors, and Estimated Secondary Organic Aerosol Production, Environ. Sci. Technol., 49, 11516–11526, https://doi.org/10.1021/acs.est.5b02841, 2015.