the Creative Commons Attribution 4.0 License.
the Creative Commons Attribution 4.0 License.
 | 14 Dec 2018
Measurements of I/SVOCs in biomass-burning smoke using solid-phase extraction disks and two-dimensional gas chromatography
Lindsay E. Hatch
Albert Rivas-Ubach
Coty N. Jen
Mary Lipton
Allen H. Goldstein
Kelley C. Barsanti
Biomass-burning organic-aerosol (OA) emissions are known to exhibit semi-volatile behavior that impacts OA loading during plume transport. Because such semi-volatile behavior depends in part on OA composition, improved speciation of intermediate and semi-volatile organic compounds (I/SVOCs) emitted during fires is needed to assess the competing effects of primary OA volatilization and secondary OA production. In this study, 18 laboratory fires were sampled in which a range of fuel types were burned. Emitted I/SVOCs were collected onto Teflon filters and solid-phase extraction (SPE) disks to qualitatively characterize particulate and gaseous I/SVOCs, respectively. Derivatized filter extracts were analyzed using comprehensive two-dimensional gas chromatography with time-of-flight mass spectrometry (GC × GC-TOFMS). Quality control tests were performed using biomass-burning relevant standards and demonstrate the utility of SPE disks for untargeted analysis of air samples. The observed chromatographic profiles of I/SVOCs in coniferous fuel-derived smoke samples were well correlated with each other, but poorly correlated with other fuel types (e.g., herbaceous and chaparral fuels). Emissions of benzenediol isomers were also shown to be fuel dependent. The combined Teflon and SPE filter data captured differences in gas-particle partitioning of the benzenediol isomers, with hydroquinone having a significantly higher particle-phase fraction than catechol due to its lower volatility. Additionally, the speciated volatility distribution of I/SVOCs in smoke from a rotten-log fire was estimated to evaluate the composition of potentially volatilized primary OA, which was entirely attributed to oxygenated (or other heteroatomic) compounds. The isomer-dependent partitioning and the speciated volatility distributions both suggest the need for better understanding of gas-phase and heterogenous reaction pathways of biomass-burning-derived I/SVOCs in order to represent the atmospheric chemistry of smoke in models.
- Article
(5586 KB) -
Supplement
(14035 KB) - BibTeX
- EndNote


Biomass burning emits high levels of carbonaceous material, including trace gases, black carbon, and primary organic aerosol (POA) (Akagi et al., 2011; Andreae and Merlet, 2001; Bond et al., 2004) that can significantly impact air quality (Kunzli et al., 2006; Liu et al., 2015; Naeher et al., 2007) and climate (Hobbs et al., 1997; Liu et al., 2014). The high concentrations of trace organic gases in smoke plumes suggest that their atmospheric processing could result in substantial production of secondary organic aerosol (SOA), as has been observed in a number of laboratory and field studies that investigated the photochemical aging of biomass-burning smoke (Cubison et al., 2011; DeCarlo et al., 2010; Grieshop et al., 2009a; Hennigan et al., 2011; Ortega et al., 2013; Tkacik et al., 2017; Yokelson et al., 2009). However, other studies have demonstrated negligible or even net loss of OA downwind of fires due to evaporative losses of POA (Akagi et al., 2012; Capes et al., 2008; Jolleys et al., 2012; May et al., 2015). Such observations are further supported by modeling studies, which have shown that significant SOA formation in biomass-burning plumes can be balanced by considerable losses of OA due to volatilization (Bian et al., 2017). In addition to affecting total OA mass, evaporation can impact oxidation rates and atmospheric lifetimes of traditional POA markers (e.g., levoglucosan in biomass-burning smoke) (May et al., 2012). Better understanding of the relative contributions of dilution-induced volatilization and SOA production requires speciation of the intermediate and semi-volatile organic compounds (I/SVOCs) in fresh biomass-burning smoke and estimation of their propensity to partition between gas and particle phases. Such measurements can further help to assess the available oxidation pathways of SOA precursors (i.e., gas-phase vs. heterogeneous oxidation).
Of the thousands of biomass-burning-related emissions studies available in the literature, relatively few have targeted speciation of I/SVOCs in both gas and particle phases. Those few studies generally characterized emissions from either a narrow range of compound classes or fuel types. McDonald et al. (2000) reported the emissions from residential wood combustion for selected I/SVOCs, including polycyclic aromatic hydrocarbons (PAHs) and eight methoxyphenols. Schauer et al. (2001) and Hays et al. (2002) have reported the most comprehensive speciation of gas- and particle-phase I/SVOCs to date, including hydrocarbons (alkanes, PAHs), alkanoic acids, substituted phenols, and anhydrosugars, among other more and less volatile compounds in the emissions of three types of residential wood combustion (Schauer et al., 2001) and burning of six foliar fuels (Hays et al., 2002). Mazzoleni et al. (2007) investigated I/SVOC emissions of methoxyphenols, levoglucosan, and organic acids across a range of fuel types and burning conditions, including laboratory, fireplace, and prescribed fires. Other studies have investigated I/SVOC emissions from selected fuel types, including wheat and Kentucky blue grass (Dhammapala et al., 2007). Gaston et al. (2016) conducted online measurements of ambient gas- and particle-phase emissions from residential wood combustion in real time, however without isomer speciation capability.
All of the offline I/SVOC characterization studies cited above collected samples using a filter and polyurethane foam (PUF) plug (or PUF/XAD-sorbent/PUF sandwich) to trap particle- and gas-phase I/SVOCs, respectively. Due to the drawbacks of PUF/XAD sampling and analysis, including high solvent needs and a relatively large physical size that exacerbates shipping costs and storage demands (Galarneau et al., 2006), alternative approaches, such as sorbent-impregnated filters (SIFs), have been investigated. Galarneau et al. (2006) custom-coated glass-fiber filters with XAD resin and found that the collection and recovery of compounds from ambient samples compared well to PUF measurements. Similarly Paolini et al. (2016) functionalized glass-fiber filters with phenyl moieties for targeted collection of gaseous PAHs and found recoveries of PAHs comparable to PUF plugs. As with lab-coated SIFs, commercial solid-phase extraction disks (hereafter called SPE filters) consist of a sorbent material incorporated into filters; in one such SPE filter, Empore by 3M, the sorbent is integrated into polytetrafluorethylene (PTFE) fibrils and accounts for > 90 % of the filter mass (Erger and Schmidt, 2014). Although SPE filters have been designed and primarily utilized for extraction of organic compounds from aqueous samples (e.g., Erger and Schmidt, 2014, and references therein), a few studies have demonstrated their efficacy for air sampling (Sanchez et al., 2003; Stuff et al., 1999; Tollback et al., 2006). In each of these studies, researchers simultaneously collected both gas and particle phases onto the SPE filter for targeted analysis of a specific class of compounds, including organophosphate esters (Tollback et al., 2006), nitroaromatic compounds (Sanchez et al., 2003), and chemical warfare agents (Stuff et al., 1999).
Table 1Summary of sampled fires.
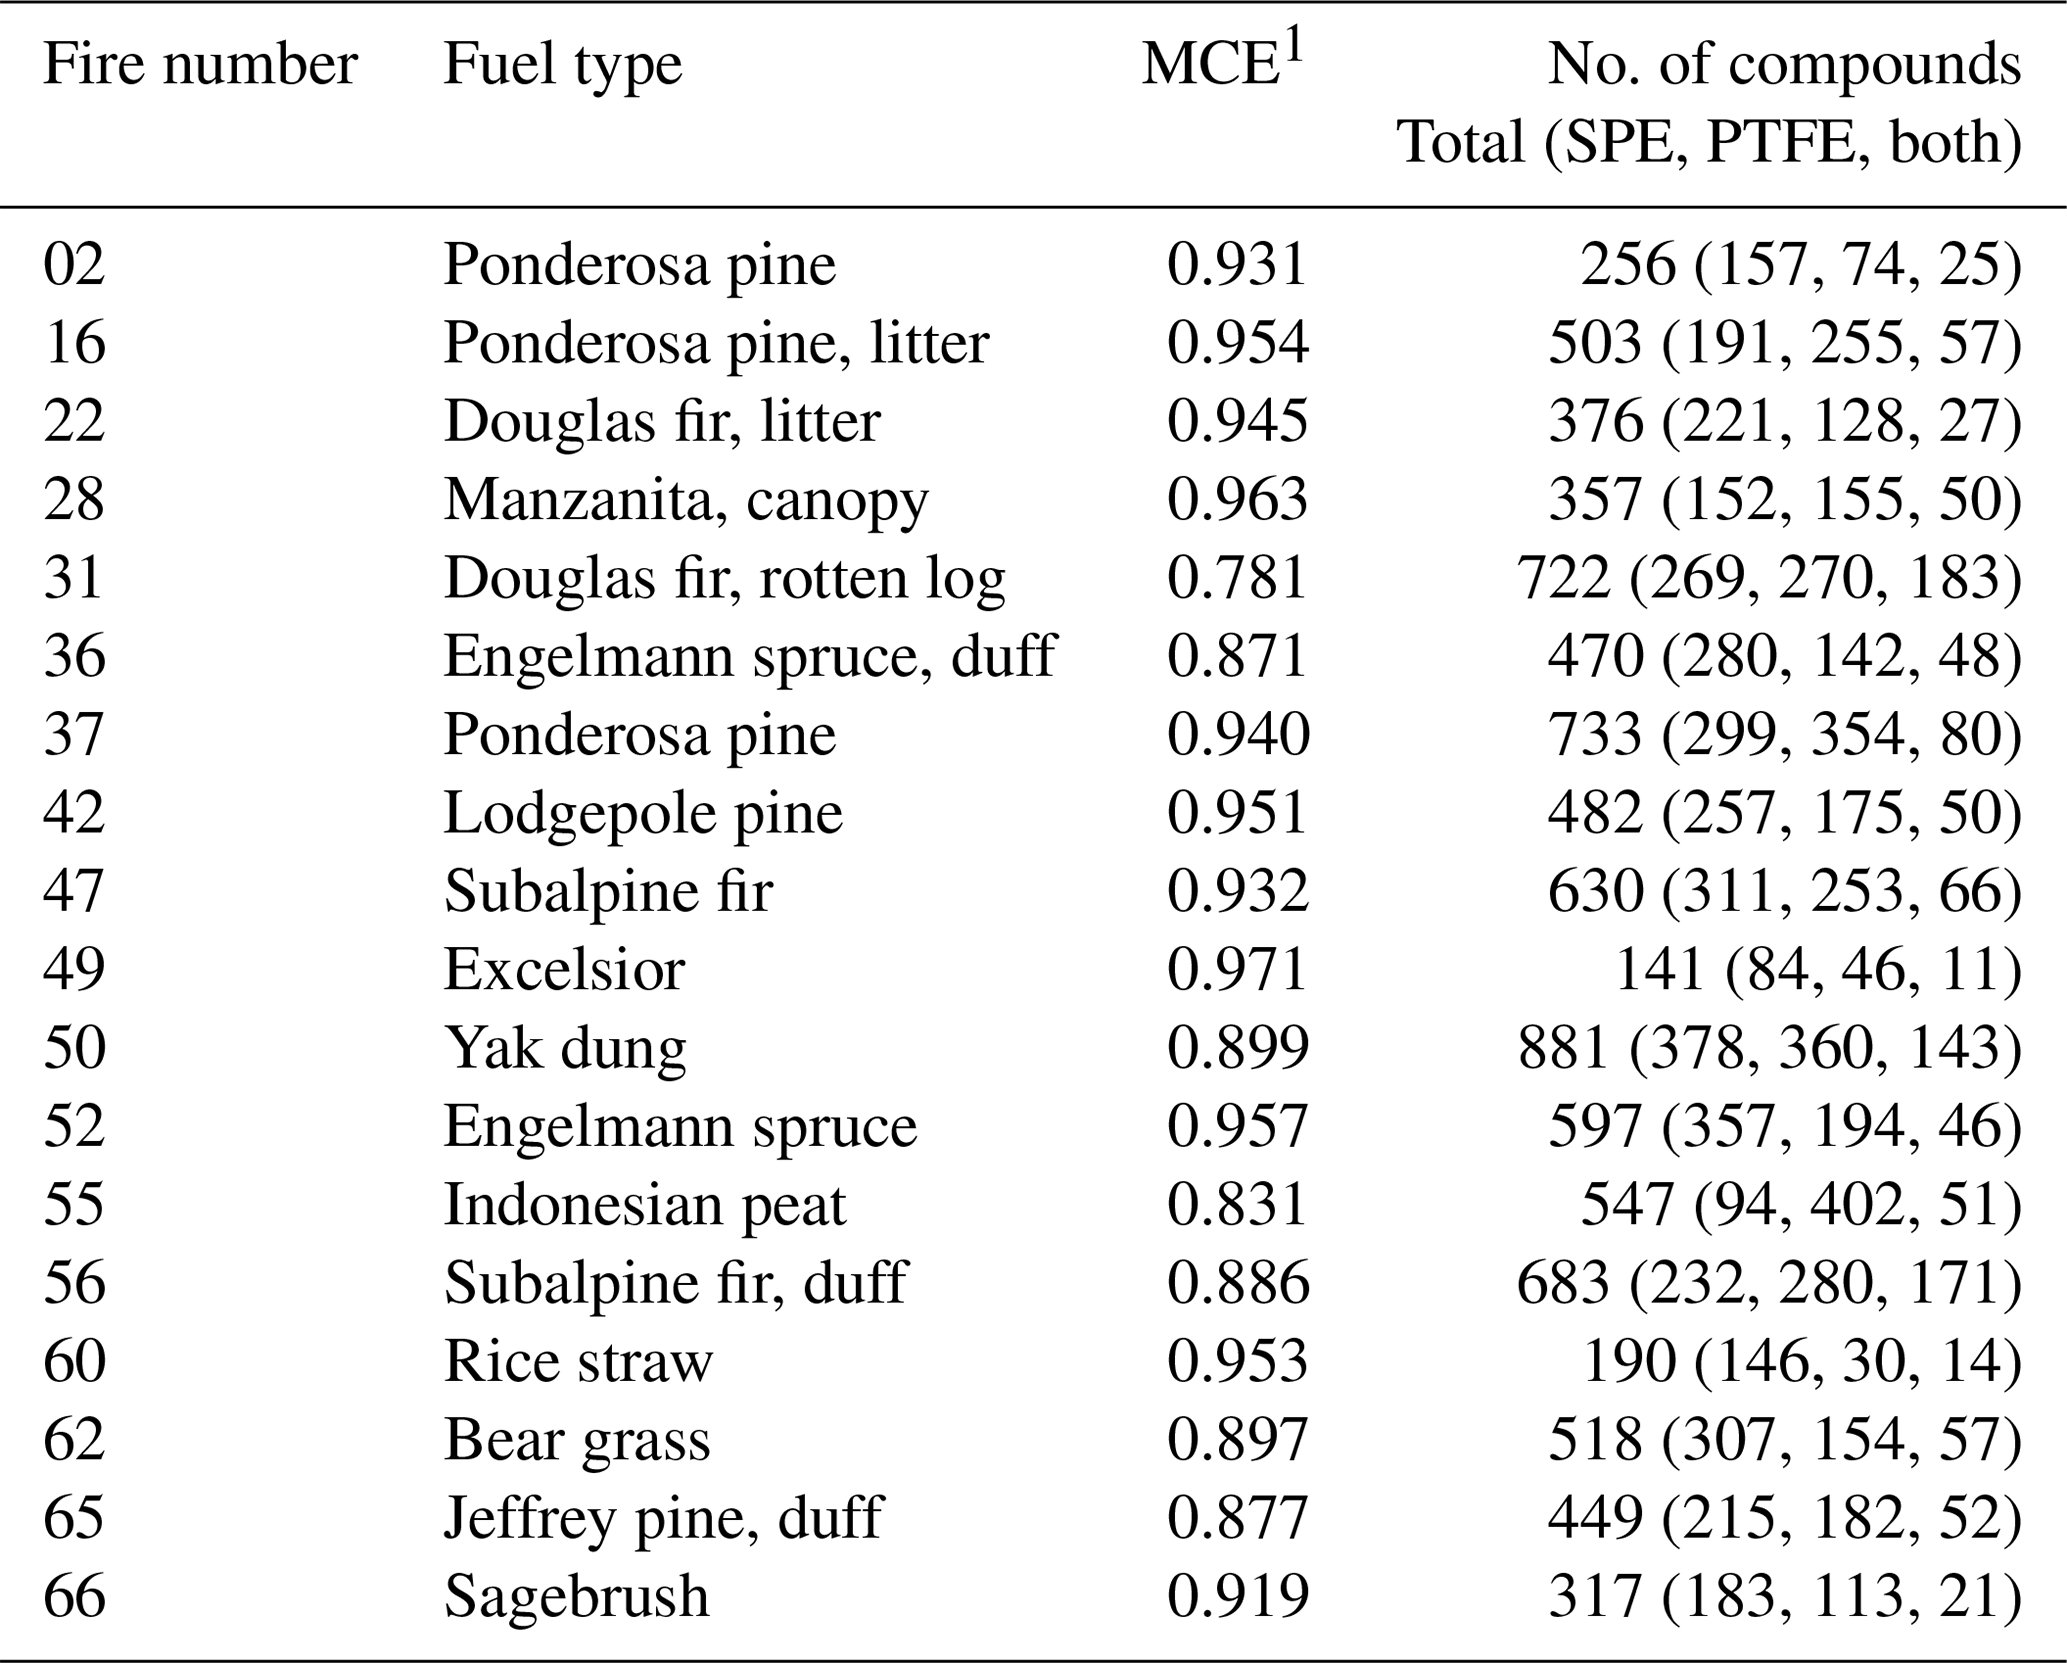
1 MCE values from Table S1 of Selimovic et al. (2018).
In this work, samples of biomass-burning smoke were collected onto tandem Teflon and SPE filters during the 2016 FIREX (Fire Influence on Regional and Global Environments Experiment) campaign at the US Forest Service Fire Sciences Laboratory (FSL). Two-dimensional gas chromatography with time-of-flight mass spectrometry (GC × GC-TOFMS) was used to analyze the I/SVOCs emitted during biomass burning and collected onto the filters. Leveraging the enhanced speciation capability of GC × GC-TOFMS, the goals of this work were 3-fold: (1) demonstrate the potential of SPE filters for the untargeted analysis of compounds with a wide range of volatilities; (2) qualitatively investigate the diversity of I/SVOCs emitted from biomass burning across a range of fuel types; and (3) assess the accuracy of phase-separated SPE measurements to predict gas-particle partitioning of specific compounds emitted from fires.
2.1 Laboratory fires and sample collection
Selimovic et al. (2018) provided details of the FIREX laboratory experiment, including the fuels burned. The fire samples analyzed in this work are listed in Table 1. Composite fires were constructed to recreate the relevant ecosystem, including fuel components such as duff, litter, wood debris (e.g., twigs), and canopy; these fires are listed as the ecosystem without further designation (e.g., Engelmann spruce). Individual fuel components were also burned separately, as noted in Table 1 (e.g., Engelmann spruce duff). Also included in Table 1 are the reported modified combustion efficiencies (MCEs) (Selimovic et al., 2018), defined as fire-integrated CO), where Δ indicates background-corrected mixing ratios (Yokelson et al., 1996). MCE provides a measure of the relative contributions of flaming and smoldering combustion, with values approaching 1 indicative of predominantly flaming combustion, values ∼0.8 predominantly smoldering, and 0.9 an even mix of both flaming and smoldering (Akagi et al., 2011).
The FSL has been described in detail by Christian et al. (2004). Briefly, fires were burned beneath a 1.6 m diameter stack with an inverted funnel located above the fuel bed. The combustion chamber is pressurized and vented through the top of the stack to completely entrain the smoke and carry it to the measurement platform 17 m above the floor. Previous measurements have shown the smoke to be well mixed at platform height (Christian et al., 2004). To collect filter samples, a passivated (Inertium®, AMCX, PA) stainless steel tube (1.27 cm o.d., 20.3 cm long) was passed through the stack wall and into the well-mixed smoke. At the outlet of the tube, one PTFE and one SPE filter were placed in series within a single 47 mm Teflon filter holder such that the PTFE filter was contacted first by the sample stream. The SPE filters (47 mm Empore C18 bonded silica, 3M) were pre-cleaned prior to the campaign in a Büchner funnel with 2×5 mL washes of acetone followed by methanol (Tollback et al., 2006). The PTFE filters (47 mm, 1.2 µm pore size, Cole-Parmer) were used without pretreatment. Smoke was pulled through the filters at 10 L min−1 for the duration of each fire (7–41 min). Samples were collected from 18 fires that burned a range of fuel types (Table 1). Three background samples were also collected from the stack over 30–40 min, in addition to two blanks for each filter type. Samples were stored in foil packets in a freezer until extraction approximately 3 months following collection.
2.2 Sample extraction and analysis
SPE and PTFE filters were identically extracted at the Environmental and Molecular Sciences Laboratory of Pacific Northwest National Laboratory. The filters were inserted into glass vials and extracted in 7 mL of methanol (HPLC grade) under sonication for 1 h. The extracts were transferred to new vials and then dried under ultra-pure nitrogen. The dried extracts were reconstituted in 1.2 mL of methanol, followed by centrifugation at 6500 rcf for 5 min to separate the SPE-filter residue; 0.7 mL of each extract was allocated for GC × GC-TOFMS analysis. These aliquots were stored at −80 ∘C for approximately 1 month followed by storage at −18 ∘C for up to 1.5 weeks until derivatization and analysis were completed at the University of California-Riverside. For derivatization, each aliquot was dried completely under nitrogen to avoid reaction between the solvent and derivatizing agent. Trimethylsilylation derivatization was achieved by adding 100 µL of BSTFA (N,O-Bis(trimethylsilyl) trifluoroacetamide) and 50 µL of anhydrous pyridine to each residue followed by heating at 70 ∘C under mixing at 1200 rpm for 1 h. During incubation, faulty vial caps caused volatilization losses (∼10 %–33 %) for a few samples; affected samples are listed in Table S1 in the Supplement. It is assumed that only derivatization agent evaporated, resulting in more concentrated samples. The data for impacted samples were scaled according to the estimated volume loss (Table S1). All samples were analyzed within ∼40 h of derivatization.
Derivatized extracts were analyzed on a Pegasus 4D GC × GC-TOFMS (Leco Corp., St. Joseph, MI) equipped with an autosampler (Agilent 7683); 1 µL of each extract was injected in splitless mode at 250 ∘C. GC × GC separations were performed with reversed polarity, i.e., using a mid-polarity primary column (Rxi-17SilMS, 30 m, 0.25 mm i.d., 0.25 mm film thickness, Restek, Bellefonte, PA) and a non-polar secondary column (Rxi-1MS, 1.1 m, 0.15 mm i.d., 0.15 mm film thickness, Restek, Bellefonte, PA). The primary oven was held at an initial temperature of 50 ∘C for 0.2 min, followed by a 3 ∘C min−1 ramp to 305 ∘C, with a final hold of 1 min. The secondary oven (modulator) was held at +5 ∘C (+25 ∘C) relative to the primary oven. The modulation period was 5 s. The transfer line was maintained at 250 ∘C. The ion source temperature was 225 ∘C; the mass spectrometer acquired at 200 Hz. A 450 s solvent delay was used.
2.3 Data analysis
GC × GC-TOFMS raw files were processed using Chromatof (Leco Corp., St. Joseph, MI). Background correction was performed separately on the PTFE and SPE filters. Within each filter group, the maximum peak area of each peak observed across the full set of corresponding blank and background samples was multiplied by 2 to ensure that all artifact peaks arising from the extraction and derivatization procedures would be entirely removed. Those adjusted values were subsequently used to background correct all associated peaks in the corresponding fire samples; only 16 (PTFE) and 32 (SPE) peaks in the fire samples required background correction. Data were retained for analyte peaks with S∕N > 200 and background-corrected peak area > 100 000 A.U. To further avoid potentially spurious or insignificant peaks, any remaining compounds present in only one sample (PTFE or SPE) were omitted from further analysis unless its peak area accounted for > 0.1 % of the total peak area for that sample (out of ∼1100 singly observed peaks, ∼120 were retained). Peaks corresponding to standard compounds (see Sect. 2.4) were considered positively identified. For other peaks, a compound name was assigned and considered tentatively identified if the match similarity with the NIST library hit was > 800 in any sample that contained that peak and the identified structure was consistent with the derivatization approach used here (i.e., contained trimethylsilyl groups where applicable). Worton et al. (2017) have recently demonstrated that the probability of an incorrect NIST library match is ∼30 % for matches between 800–900 and 14 % for matches > 900.
2.4 Extraction efficiency tests
Potential biases in the SPE extractions, which would affect comparisons of measured compounds between the PTFE and SPE filters, were tested using a range of standard compounds relevant to biomass-burning emissions, including phenol derivatives, levoglucosan, n-alkanes, n-alkanoic acids, and PAHs. Three tests were performed using equivalent volumes of the standard mixture: (1) a control where the standard was derivatized without going through the extraction procedure (hereafter called “standard”); (2) standard was spiked into 7 mL of methanol (HPLC grade) as a proxy for the PTFE extractions (hereafter called “PTFE test”); and (3) the standard was spiked onto SPE filters, briefly allowed to dry, and then extracted in 7 mL of methanol (hereafter called “SPE test”). Regarding the PTFE test, standards were not spiked directly onto a PTFE filter due to the potential for rapid evaporation of the relatively volatile standard constituents (Dhammapala et al., 2007); this approach assumes no recovery biases are introduced by the PTFE filter. The PTFE and SPE tests were performed in triplicate; the standard test was performed in duplicate. For the PTFE and SPE tests, the extraction and derivatization procedures were similar to that described above for the FSL samples with the main differences being that the extracts were filtered using PTFE-coated syringe filters (Titan3, Thermo-Scientific) rather than centrifugation, and MSTFA (N-methyl-N-(trimethylsilyl)trifluoroacetamide with 1 % trimethylchlorosilane) was used as the derivatizing agent rather than BSTFA. Standards derivatized with MSTFA showed no significant differences from those derivatized with BSTFA. GC × GC-TOFMS analysis was performed as described above. Additional standards (similar to those used in Hatch et al., 2015) were derivatized and analyzed for identification purposes only.
3.1 Extraction efficiency
Because SPE filters have not reportedly been used for untargeted analysis of air samples, the extraction efficiency was assessed for a range of standard compounds with regard to both absolute recovery and potential biases compared to extraction from PTFE filters. The recoveries of standard compounds from SPE and PTFE filters are shown in Fig. 1a for compounds relevant to the SPE fire samples described below, namely standards eluting at or before 3000 s (see Fig. 2 for comparison); data for all individual standard compounds tested are shown and discussed in the Supplement (Figs. S1–S5). Most compounds displayed high recovery (∼0.8–1.1) in the PTFE test (Figs. S1–S5). Exceptions were observed for the most volatile standard compounds within each compound class (Figs. S1–S5). The compounds with the poorest observed recovery (< 0.2) included naphthalene, undecane, dodecane, and tridecane and showed no obvious bias between the SPE and PTFE tests (Figs. 1a, S2, and S2), indicating that these compounds are too volatile to survive the extraction procedure regardless of filter type and likely volatilized during the drying periods. Matrix effects likely also contributed to the very poor recovery of these volatile non-polar hydrocarbons, due to the high concentration of highly polar, oxygenated compounds present in the standard matrix (further discussed in the Supplement). Thus, these four compounds were omitted from further analysis. However, there is no clear relationship between the poor recovery of these four compounds and oxygenated compounds that elute in the same primary retention time window. For example, heptanoic acid displayed significantly better recovery in the PTFE test (0.86±0.06, Fig. S4) than tridecane (0.14±0.07, Fig. S1) despite eluting significantly earlier (1045 s vs. 1190 s). As a result, the poor recovery of the volatile alkanes/naphthalene was not extrapolated to other relatively polar oxygenated compounds present at similar retention times in the fire samples.
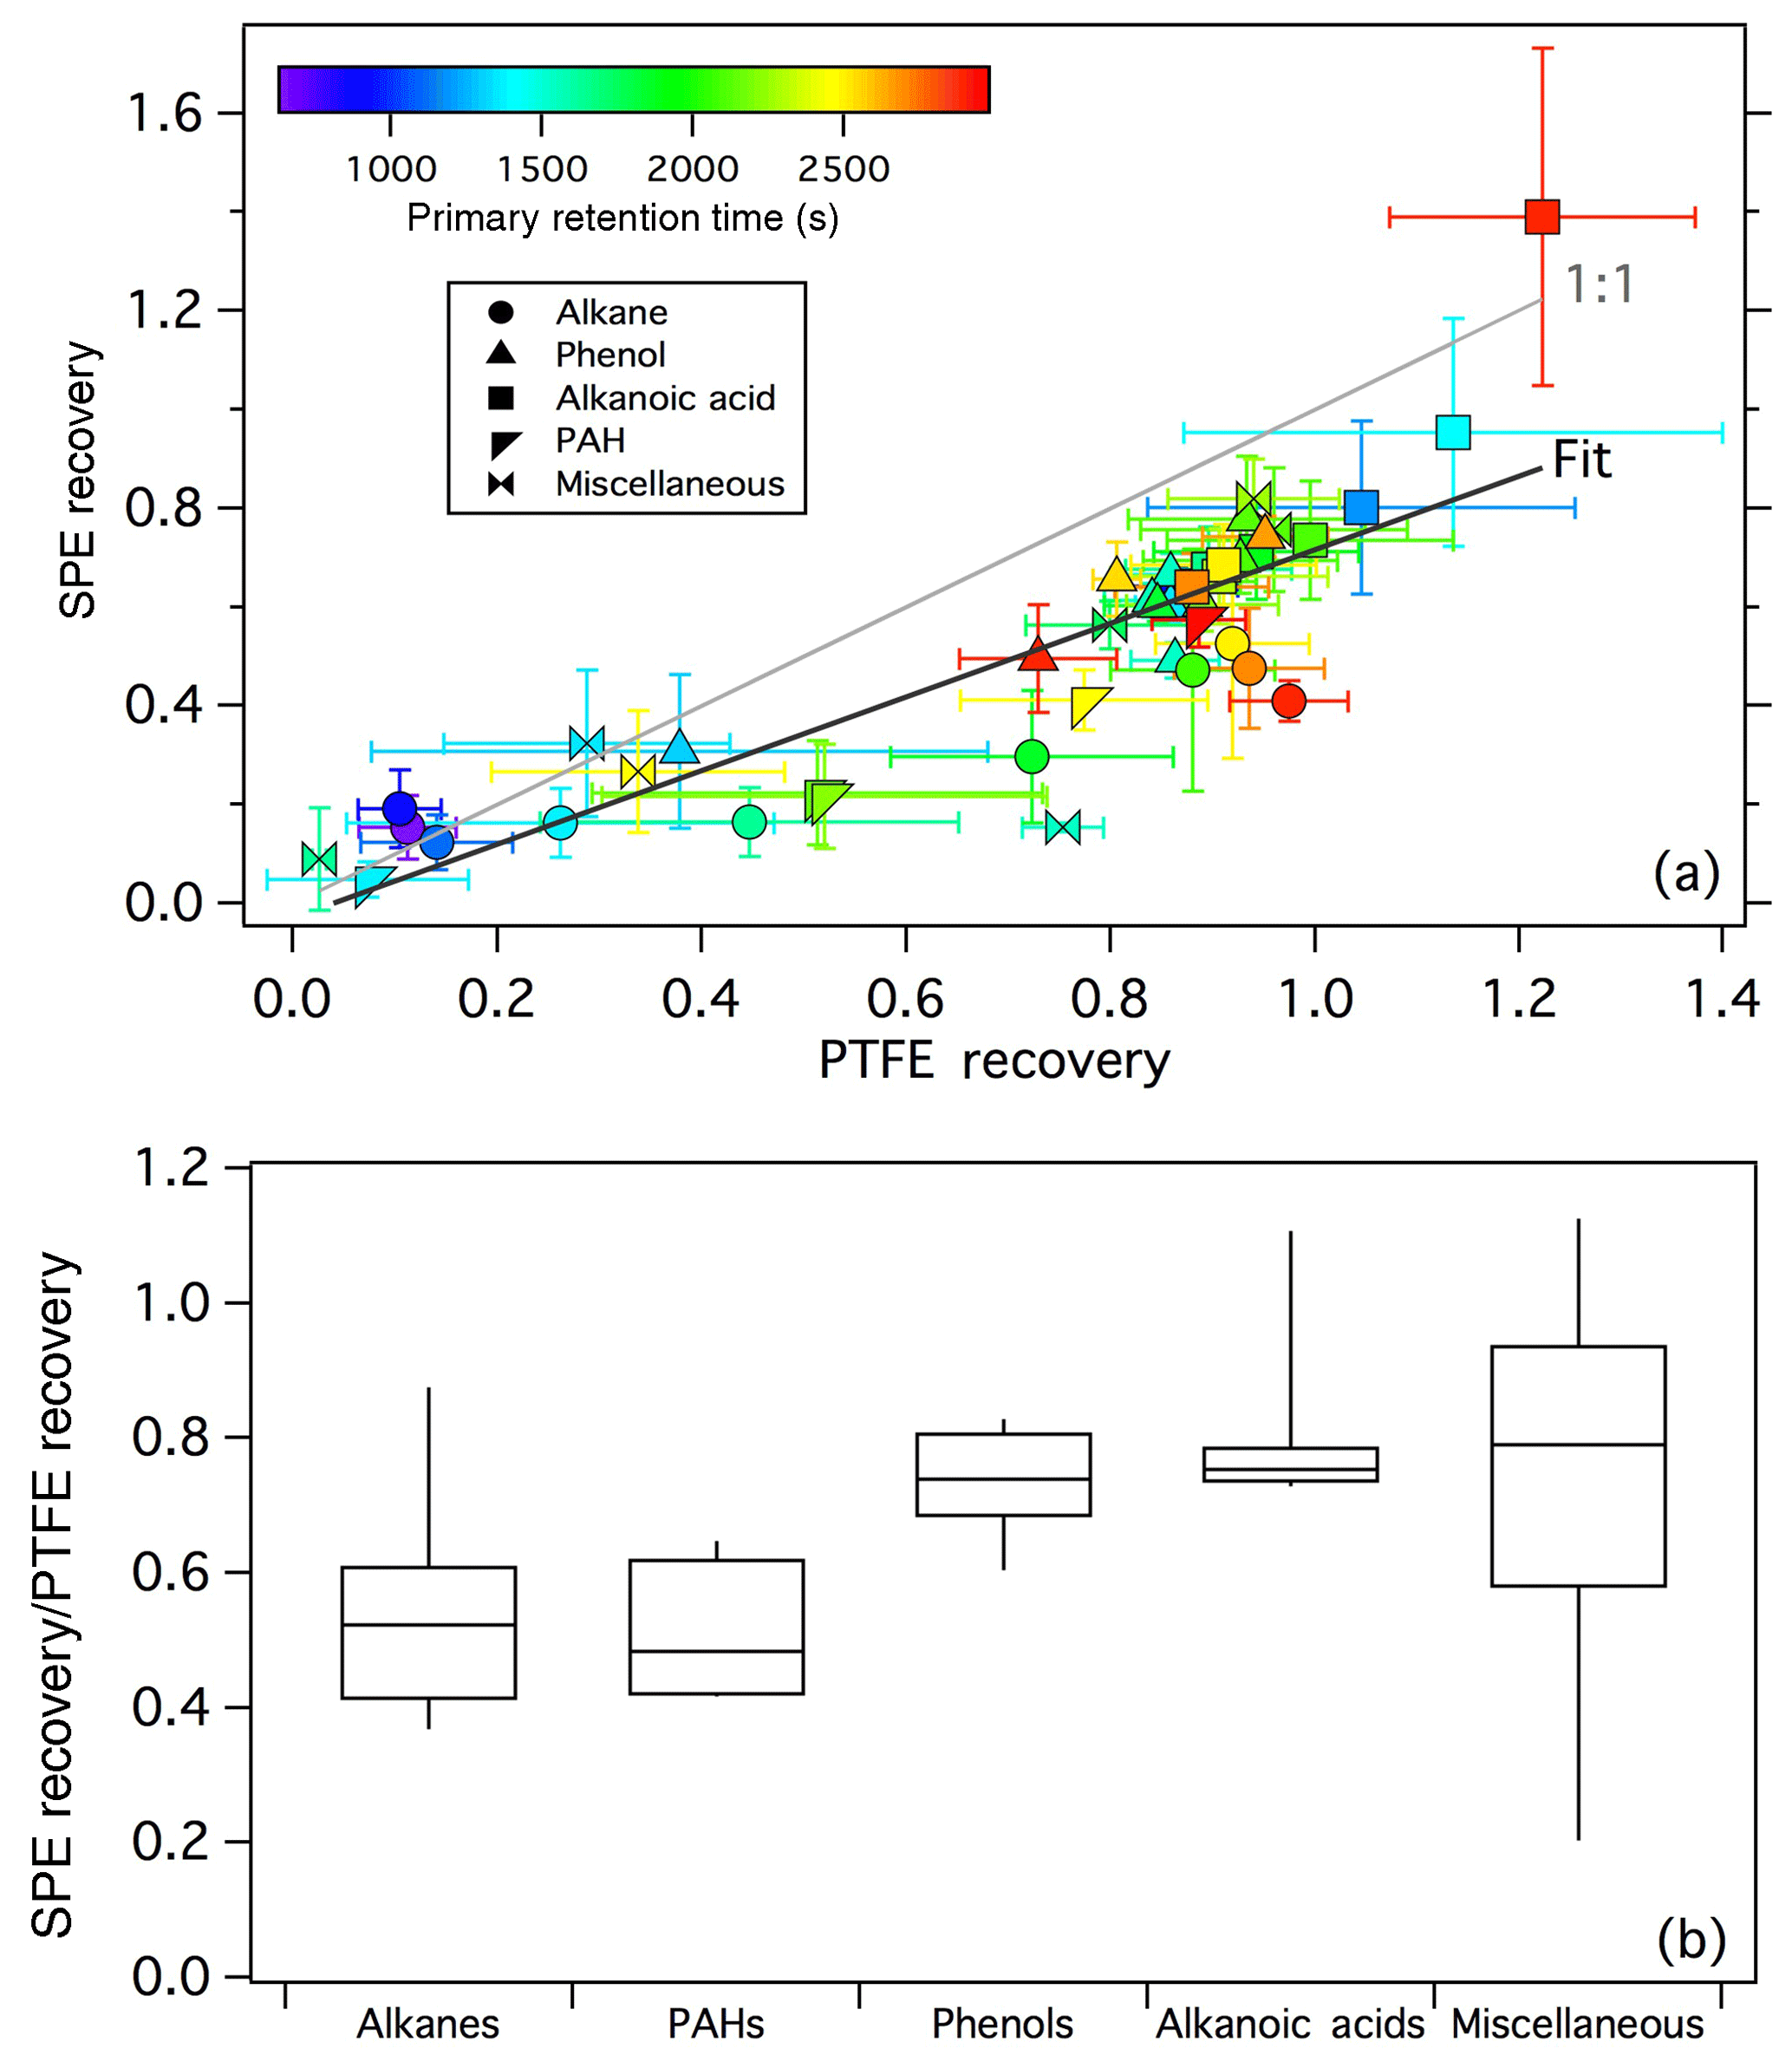
Figure 1(a) Comparison of the extraction recoveries of standard compounds in the SPE and PTFE tests. For the linear regression, R2=0.72 and slope =0.75. (b) SPE extraction bias as a function of compound class.
Linearity with a correlation coefficient (R2) of 0.72 was observed between the SPE tests and PTFE tests (Fig. 1a); however, there is clearly a negative bias in the extraction from SPE filters compared to the PTFE tests, with a slope of ∼0.75. This is partly due to retention of ∼0.5 mL (∼7 % of the total volume) of the extraction solvent by the SPE filters; thus 100 % recovery from SPE filters cannot be achieved. Such bias could be corrected in future work through application of recovery standards. The general under-recovery of analytes from the SPE filter is likely also due in part to incomplete solvation of analytes from the sorbent material.
The biases between the SPE and PTFE tests are further shown as a function of compound class in Fig. 1b. Included in the box plot are all data that were used to determine scaling factors to facilitate comparison of the SPE and PTFE extracts, namely compounds eluting before 3000 s and with PTFE-derived extraction efficiency > 0.15. For all compound classes, the recovery from SPE filters was lower than in the PTFE tests; however, differences were observed between hydrocarbons and oxygenated compounds. The median recovery for oxygenated compounds was ∼75 % that of the PTFE tests and was fairly consistent across different oxygenated classifications (0.74 for phenols, 0.75 for alkanoic acids, and 0.79 for miscellaneous oxygenates, Fig. 1b). Two outliers, palmitic acid and stearic acid, with recoveries > 1 were observed for the alkanoic acid class (Figs. 1a, S4). These two compounds were observed in all biomass-burning sample blanks/backgrounds and are likely an artifact of the extraction/derivatization procedure. The largest SPE bias among all compounds tested was observed for maltol, for which the recovery in the PTFE test was 0.75±0.04, but only 0.15±0.01 in the SPE test (Fig. S5). A repeat test was performed with a fresh maltol solution and resulted in similarly low recovery from SPE filters. The reason for this large SPE bias for maltol is currently unknown.
5-Hydroxy methyl furfural (HMF) displayed poor recovery in both tests (0.03±0.007 and 0.09±0.1 for the PTFE and SPE tests, respectively, Fig. S5) and can be attributed to reaction of HMF during extraction, as the same reaction product (based on comparison of the mass spectra) was observed in the composite standard and a repeat test using a fresh HMF standard solution. HMF was the only standard compound to form an obvious reaction product during extraction; reactions of other aldehydes (e.g., vanillin) during extraction were negligible (see Supplement). The methyl ester of HMF was also present in the composite standard solution due to reaction with methanol solvent during storage of the standard and showed significantly improved recovery compared to the aldehyde (0.80±0.08 and 0.56±0.05 in the PTFE and SPE tests, respectively, Fig. S5). Because other artifacts resulting from methanol extraction have been previously observed (Sauret-Szezepanki and Lane, 2004), further characterization of methanol-extraction-related artifacts and/or further optimization of the extraction solvent may be needed for studies seeking to accurately identify/quantify certain compounds. However, given the consistency of the observed HMF reactions, potential solvent–analyte interactions likely did not substantially impact the observed differences in the chromatographic profiles of the biomass-burning samples discussed below.
Alkanes and PAHs were under-recovered by ∼50 % in the SPE test compared to the PTFE test (Fig. 1b). It is possible that hydrocarbons were more strongly bound to the non-polar octadecane-based sorbent material than more polar compounds resulting in lower recovery. Other solvents (e.g., hexane) and/or solvent mixtures could be tested in future work to improve the recovery of hydrocarbons from SPE filters. Octadecane displayed a large positive bias in the SPE tests (SPE/PTFE , Fig. S1), likely due to degradation of the SPE sorbent material during extraction. Octadecane data have been omitted from Fig. 1, as well as all FIREX SPE-filter data discussed below.
These results demonstrate that the recovery of compounds from SPE filters is satisfactory for qualitative assessment of the compounds measured in the biomass-burning samples. Further method optimization (e.g., use of recovery, internal, and external standards) would be necessary for quantification. Characterization of the recoveries and matrix effects for more standards would also be necessary to adequately correct the recoveries for the wide range of compounds observed in untargeted analysis of biomass-burning smoke (including many unknown compounds), especially the most volatile observed compounds. As the interest at this stage is in assessing the full diversity of I/SVOCs in smoke and demonstrating the range of compounds collected by SPE filters, all observed compounds (except those explicitly noted above) were retained without correction for recovery. However, corrections have been made for the observed biases between the SPE and PTFE filters. Based on Fig. 1b, the peak areas for all known hydrocarbons detected in the FIREX SPE samples (alkanes, alkenes, and PAHs) were scaled 2× and the remaining compounds (largely oxygenates) were scaled 1.33×. Further, the relative standard deviation (RSD) for each compound was conservatively estimated to be approximately 100 % based on the maximum determined RSDs in the recovery tests (80 % and 64 % for the PTFE and SPE tests, respectively, not including the five omitted compounds mentioned above). This approach should account for much of the variability in analyte recovery during extraction and derivatization (see Supplement); however, it should be noted that on average the RSDs for most standard compounds were much lower than the maximum, with median RSDs of 8 % and 12 % for the PTFE and SPE tests, respectively.
3.2 Biomass-burning samples
Figure 2 shows a comparison of composite SPE and PTFE chromatograms wherein peaks from all SPE and all PTFE samples are represented (GasPedal, Decodon Gmbh, Greifswald, Germany) (Schmarr and Bernhardt, 2010); chromatograms from individual fires are also included in the Supplement (Figs. S7–S24). The compounds observed on the SPE filters (shown in orange) are generally earlier eluting than the compounds observed on the PTFE filters (shown in blue). The vast majority (∼97 %) of compounds observed in the SPE filters correspond to first-dimension Kovats retention indices (RIs) in the range of ∼1200–2100 (although even earlier eluting compounds were observed in the SPE samples, we restrict the analysis to only compounds eluting after 930 s, equivalent to an RI of 1200, Fig. 2). The mean primary retention time of analytes on the SPE filters is ∼1800 s (RI 1550) compared to ∼2600 s (RI 1915) for the compounds eluting in the PTFE filter extracts. Although retention time is not a perfect indicator of volatility differences here, due to derivatization as well as variable activity of diverse analytes in the column stationary phase, these observations suggest that the compounds detected on the SPE filters were on average more volatile than those collected on the PTFE filters, which is consistent with particles being first trapped on the PTFE filter followed by gases (or desorbed POA) being collected on the SPE filter. As indicated by the Venn diagram inset of Fig. 2, the majority of the compounds were found on only one filter type – across all samples, 543 and 581 compounds were detected solely on the SPE and PTFE filters, respectively. Because all standard compounds tested on the SPE filters could be observed to some degree (Figs. S1–S5), it is unlikely that SPE-related extraction bias was the cause of the different compounds observed solely on one filter type. Compounds present in both phases were detected (shown in black, Fig. 2); 364 compounds were found on at least one SPE and one PTFE filter sample. The numbers of compounds observed on each filter type for the individual fires are listed in Table 1.
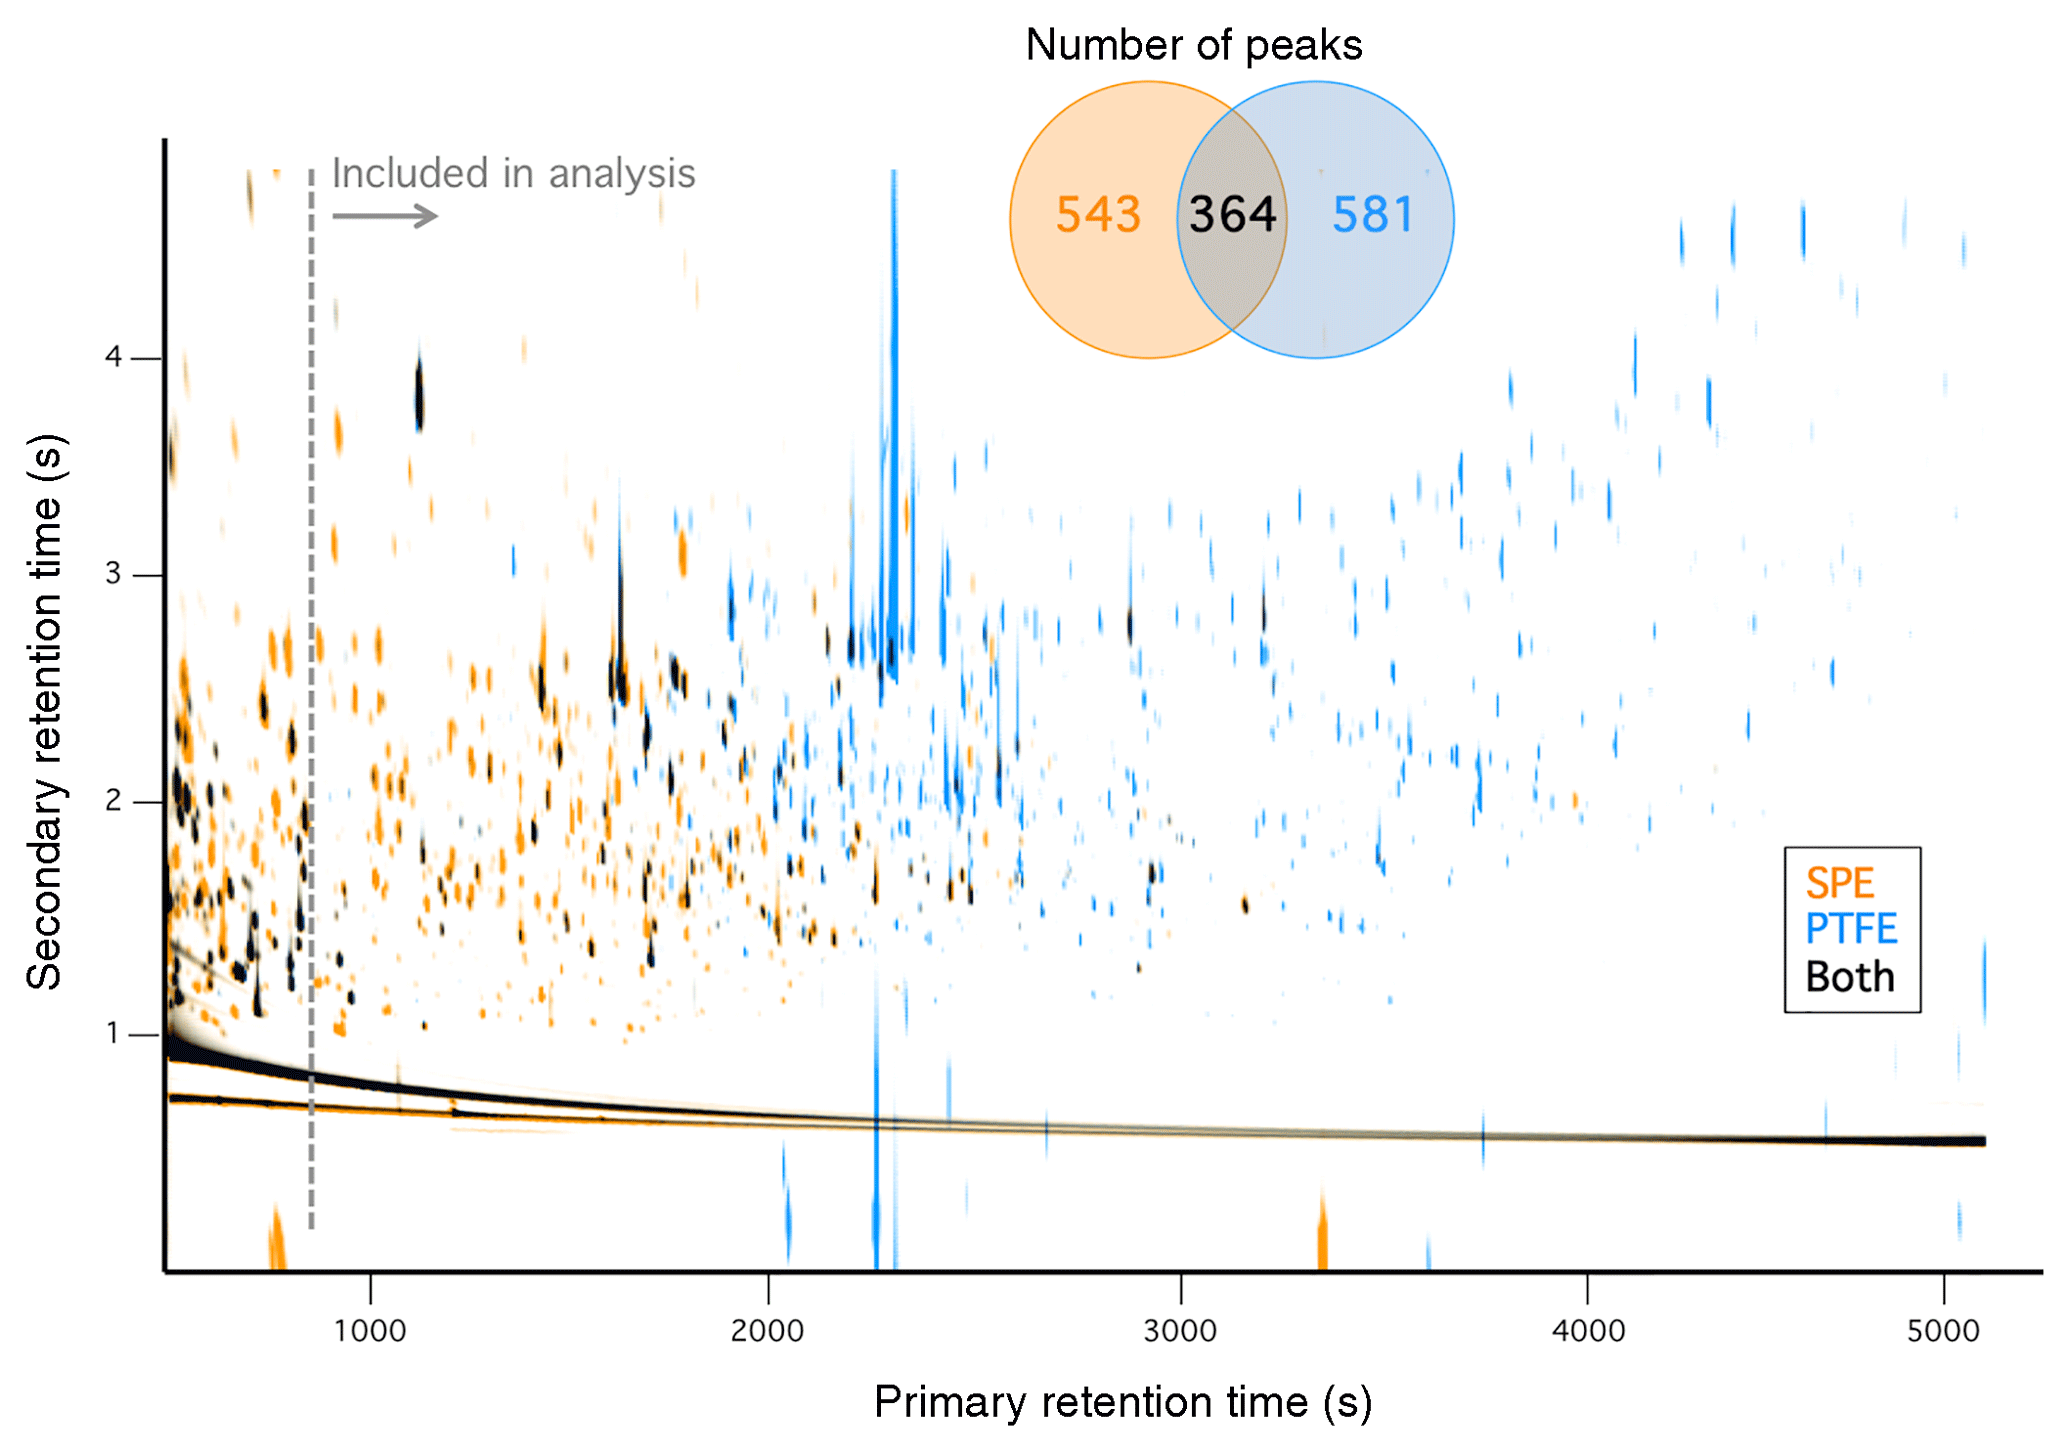
Figure 2Overlay of composite chromatograms for all SPE and all PTFE smoke samples. Inset shows the number of peaks observed on each filter type.
The earliest eluting, positively identified compounds in the SPE-filter data correspond to benzonitrile, and o-, m-, and p-cresol. Potential breakthrough of such volatile compounds through the SPE filter was probed by collecting smoke samples from a campfire-style burn in Riverside, CA onto a PTFE-SPE-SPE sampling train. Any compounds present on the backup SPE filter were below detection limit despite very high concentrations observed on the front SPE filter, consistent with the negligible breakthrough observed in previous studies using sorbent-impregnated filters (Galarneau et al., 2006) and SPE filters (Tollback et al., 2006). These observations demonstrate the ability of SPE filters to trap relatively volatile compounds, although more work is needed to optimize the recovery and quantification of such compounds. For example, other non-protic solvents could be tested to enable derivatization without the need to completely dry the samples, which would help to minimize volatilization losses. Other positively and tentatively identified compounds observed from the FIREX SPE samples are largely consistent with compounds reported from PUF/XAD measurements (Hays et al., 2002; Mazzoleni et al., 2007; Schauer et al., 2001), including phenol derivatives (e.g., dimethyl phenols, guaiacols, benzenediols, vanillin, isoeugenol, acetovanillone), mono-carboxylic acids, dicarboxylic acids (e.g., methyl maleic acid), n-alkanes, and PAHs (e.g., fluorene, phenanthrene). With high trapping efficiency and similar observable compound classes, SPE filters appear to be a suitable alternative to PUF/XAD measurements for untargeted analysis of I/SVOCs in air samples. Because many of the identifiable compounds in the FIREX samples have been reported and quantified in previous studies (Hays et al., 2002; Mazzoleni et al., 2007; Schauer et al., 2001), the focus here is on investigating the diversity of emissions rather than providing detailed speciation profiles.
Hereafter, the relative abundance (or % abundance) of a given compound is defined as the ratio of the peak area for compound i to the total observed peak area (using deconvoluted total ion current, DTIC) summed over all compounds present in either the corresponding SPE sample only or the combined SPE + PTFE samples (each case is explicitly noted where applicable). The peak area fractions are used as an indication rather than an absolute measure of the % abundance because the individual compounds have not been corrected for recovery or differences in instrument response. This approach is reasonable for the qualitative assessment sought here because many of the most volatile compounds were still observed with high relative abundance. For example, cresols likely exhibited poorer recovery (< 0.3) than guaiacol (Fig. S3) due to their higher volatilities, yet were still among the most abundant of the observed compounds. However, the relative abundance for volatile compounds should be considered a lower limit.
Figure 3 illustrates the number of SPE samples in which each compound was observed along with its median % abundance across the relevant set of samples (i.e., 0 % abundance values were ignored); for two or fewer samples, the maximum observed % abundance was used. Of the 907 total compounds observed across all 18 SPE samples, approximately half (452) were detected in 3 or fewer samples, demonstrating the abundance of unique compounds. In contrast, only 31 compounds were observed in all 18 samples; these ubiquitous compounds were also generally the most abundant. The red trace in Fig. 3 denotes the median of the median % abundance values within each bin and demonstrates a general trend of increasing average relative abundance with increasing detection frequency. On average, the most ubiquitous compounds (N=18) account for greater % abundance than compounds observed in 13 or fewer samples. These highly abundant (median relative abundance > 1 %), ubiquitous compounds include phenol derivatives (o-, m-, and p-cresols, guaiacol, methyl guaiacol, hydroquinone, 3- and 4-methyl catechol), methyl maleic acid, and several unknowns. Only catechol accounted for > 1 % of the total SPE peak area in all 18 samples, ranging from 4.9 % (dung) to 15 % (ponderosa pine, burn 37) and was therefore the most universally abundant I/SVOC detected in the gas phase. Several highly abundant compounds were also present in one to seven samples (Fig. 3). For example, camphor was only detected in sagebrush smoke, at 4.3 % of the total SPE peak area; a unique camphor signature was also observed during FIREX (Sekimoto et al., 2018). Two other highly abundant compounds were present in only one sample; these are unknown compounds (but likely alcohols or organic acids based on mass spectral fragmentation patterns discussed below) and accounted for 1.1 % and 2.3 % abundance in sagebrush and peat smoke, respectively.
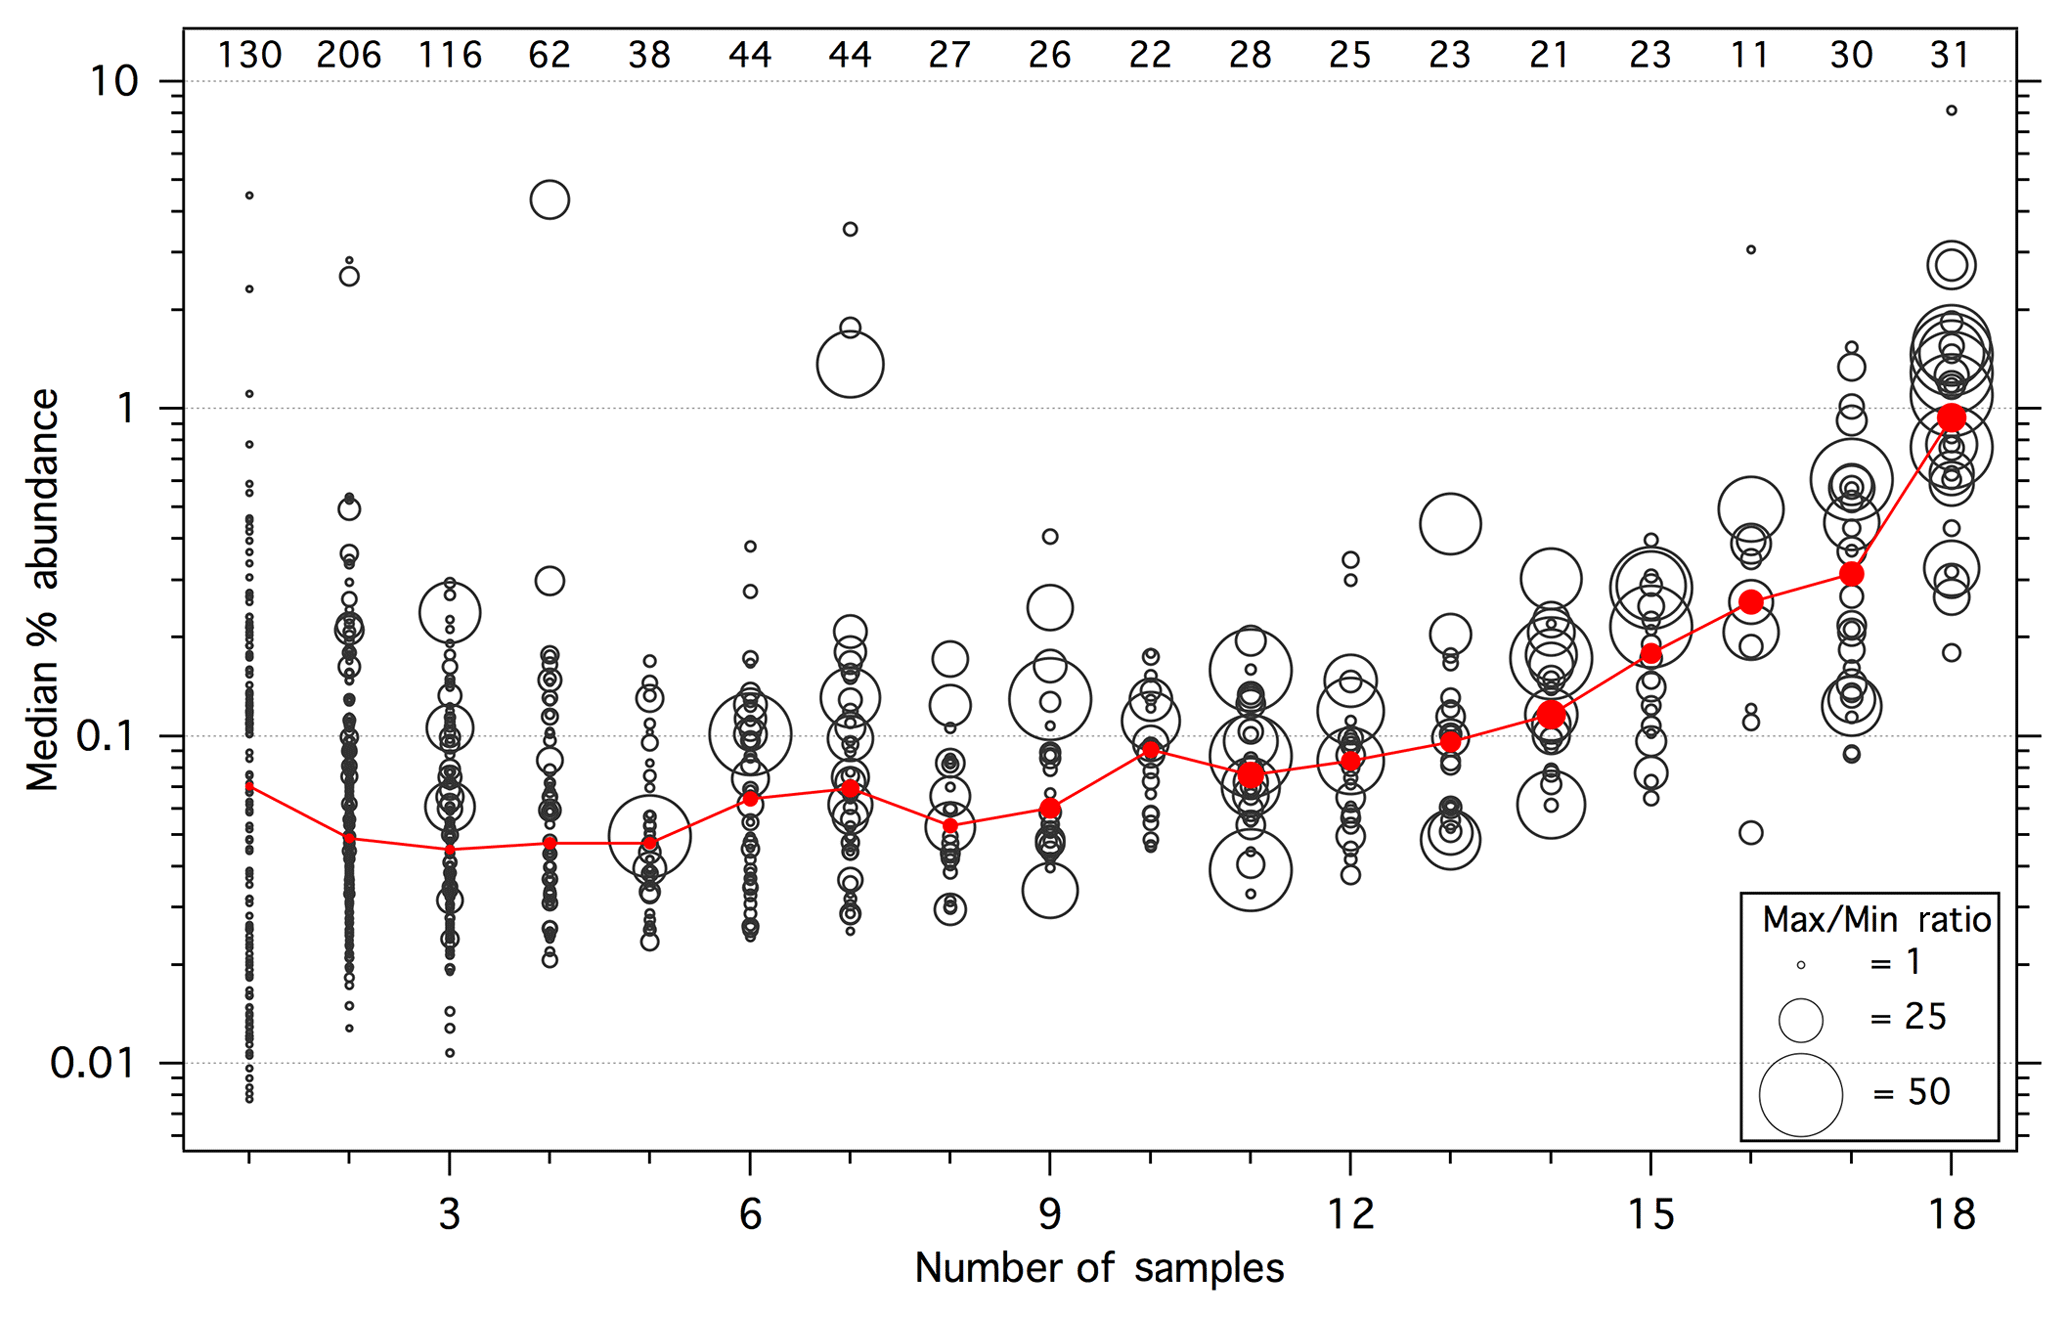
Figure 3The black circles represent the median percentage (ignoring zeros) of the total SPE peak area for each observed compound as a function of the number of SPE samples that contained that compound; for compounds observed in only one or two samples, the maximum percent abundance was used in place of the median. Marker size is proportional to the range of percent abundances observed for each compound (capped at 50), calculated as the ratio of the maximum value to the minimum non-zero value. The red trace represents the median of the values shown for each number of samples, with the marker sizes corresponding to the median max ∕ min ratio. The numbers along the top represent the number of compounds observed within each bin.
Large variability is evident in the % abundances of a given compound across the SPE samples, as indicated by the marker sizes in Fig. 3, which represent the ratio of the maximum observed value to the minimum observed non-zero value (ratios greater than ∼2 are unlikely to be due entirely to experimental artifacts). Ratios as high as 150 were observed (values in Fig. 3 have been capped at 50 for visual clarity), demonstrating the potential for high variability in the fraction of smoke accounted for by individual I/SVOCs. For example, there is wide variability in the relative abundances for many of the most ubiquitous compounds, with 35 % displaying max ∕ min ratios > 25 and a median ratio of 15. Although there is an apparent trend of increasing median variability (red marker sizes in Fig. 3) with increasing detection frequency, this is likely due in part to the higher relative abundance of more ubiquitous compounds. The variability of less frequently observed and generally less concentrated compounds was potentially truncated by the method detection limit and peak selection criteria (Sect. 2.3). This hypothesis is somewhat supported by the observation that the variability tends to be higher for the more abundant compounds within bins 2–7.
To explore the overall diversity of the speciated emissions among the smoke samples, correlation coefficients were calculated based on the combined (SPE + PTFE) % abundances of all individual observed compounds between pairs of fires (Fig. 4a, , lower half; correlation coefficients were calculated using Microsoft Excel and the image plot was generated using Igor Pro v.6.37). For illustration, example correlation plots for highly and poorly correlated fire pairs are included in Fig. 4b and c, respectively. Because levoglucosan was by far the most abundant compound in all burns except manzanita, accounting for between 7.6 % and 43 % of the total abundances (e.g., Fig. 4b, c), this single compound had a large effect on the regression parameters. Therefore, the correlation coefficients calculated with the levoglucosan data omitted () are shown in the upper half of Fig. 4a. This allows a better comparison of the less abundant compound signatures. For nearly all sample pairs, the R2 values dropped significantly after removing levoglucosan (Fig. 4a), with mean of 0.67 compared to mean of 0.33.
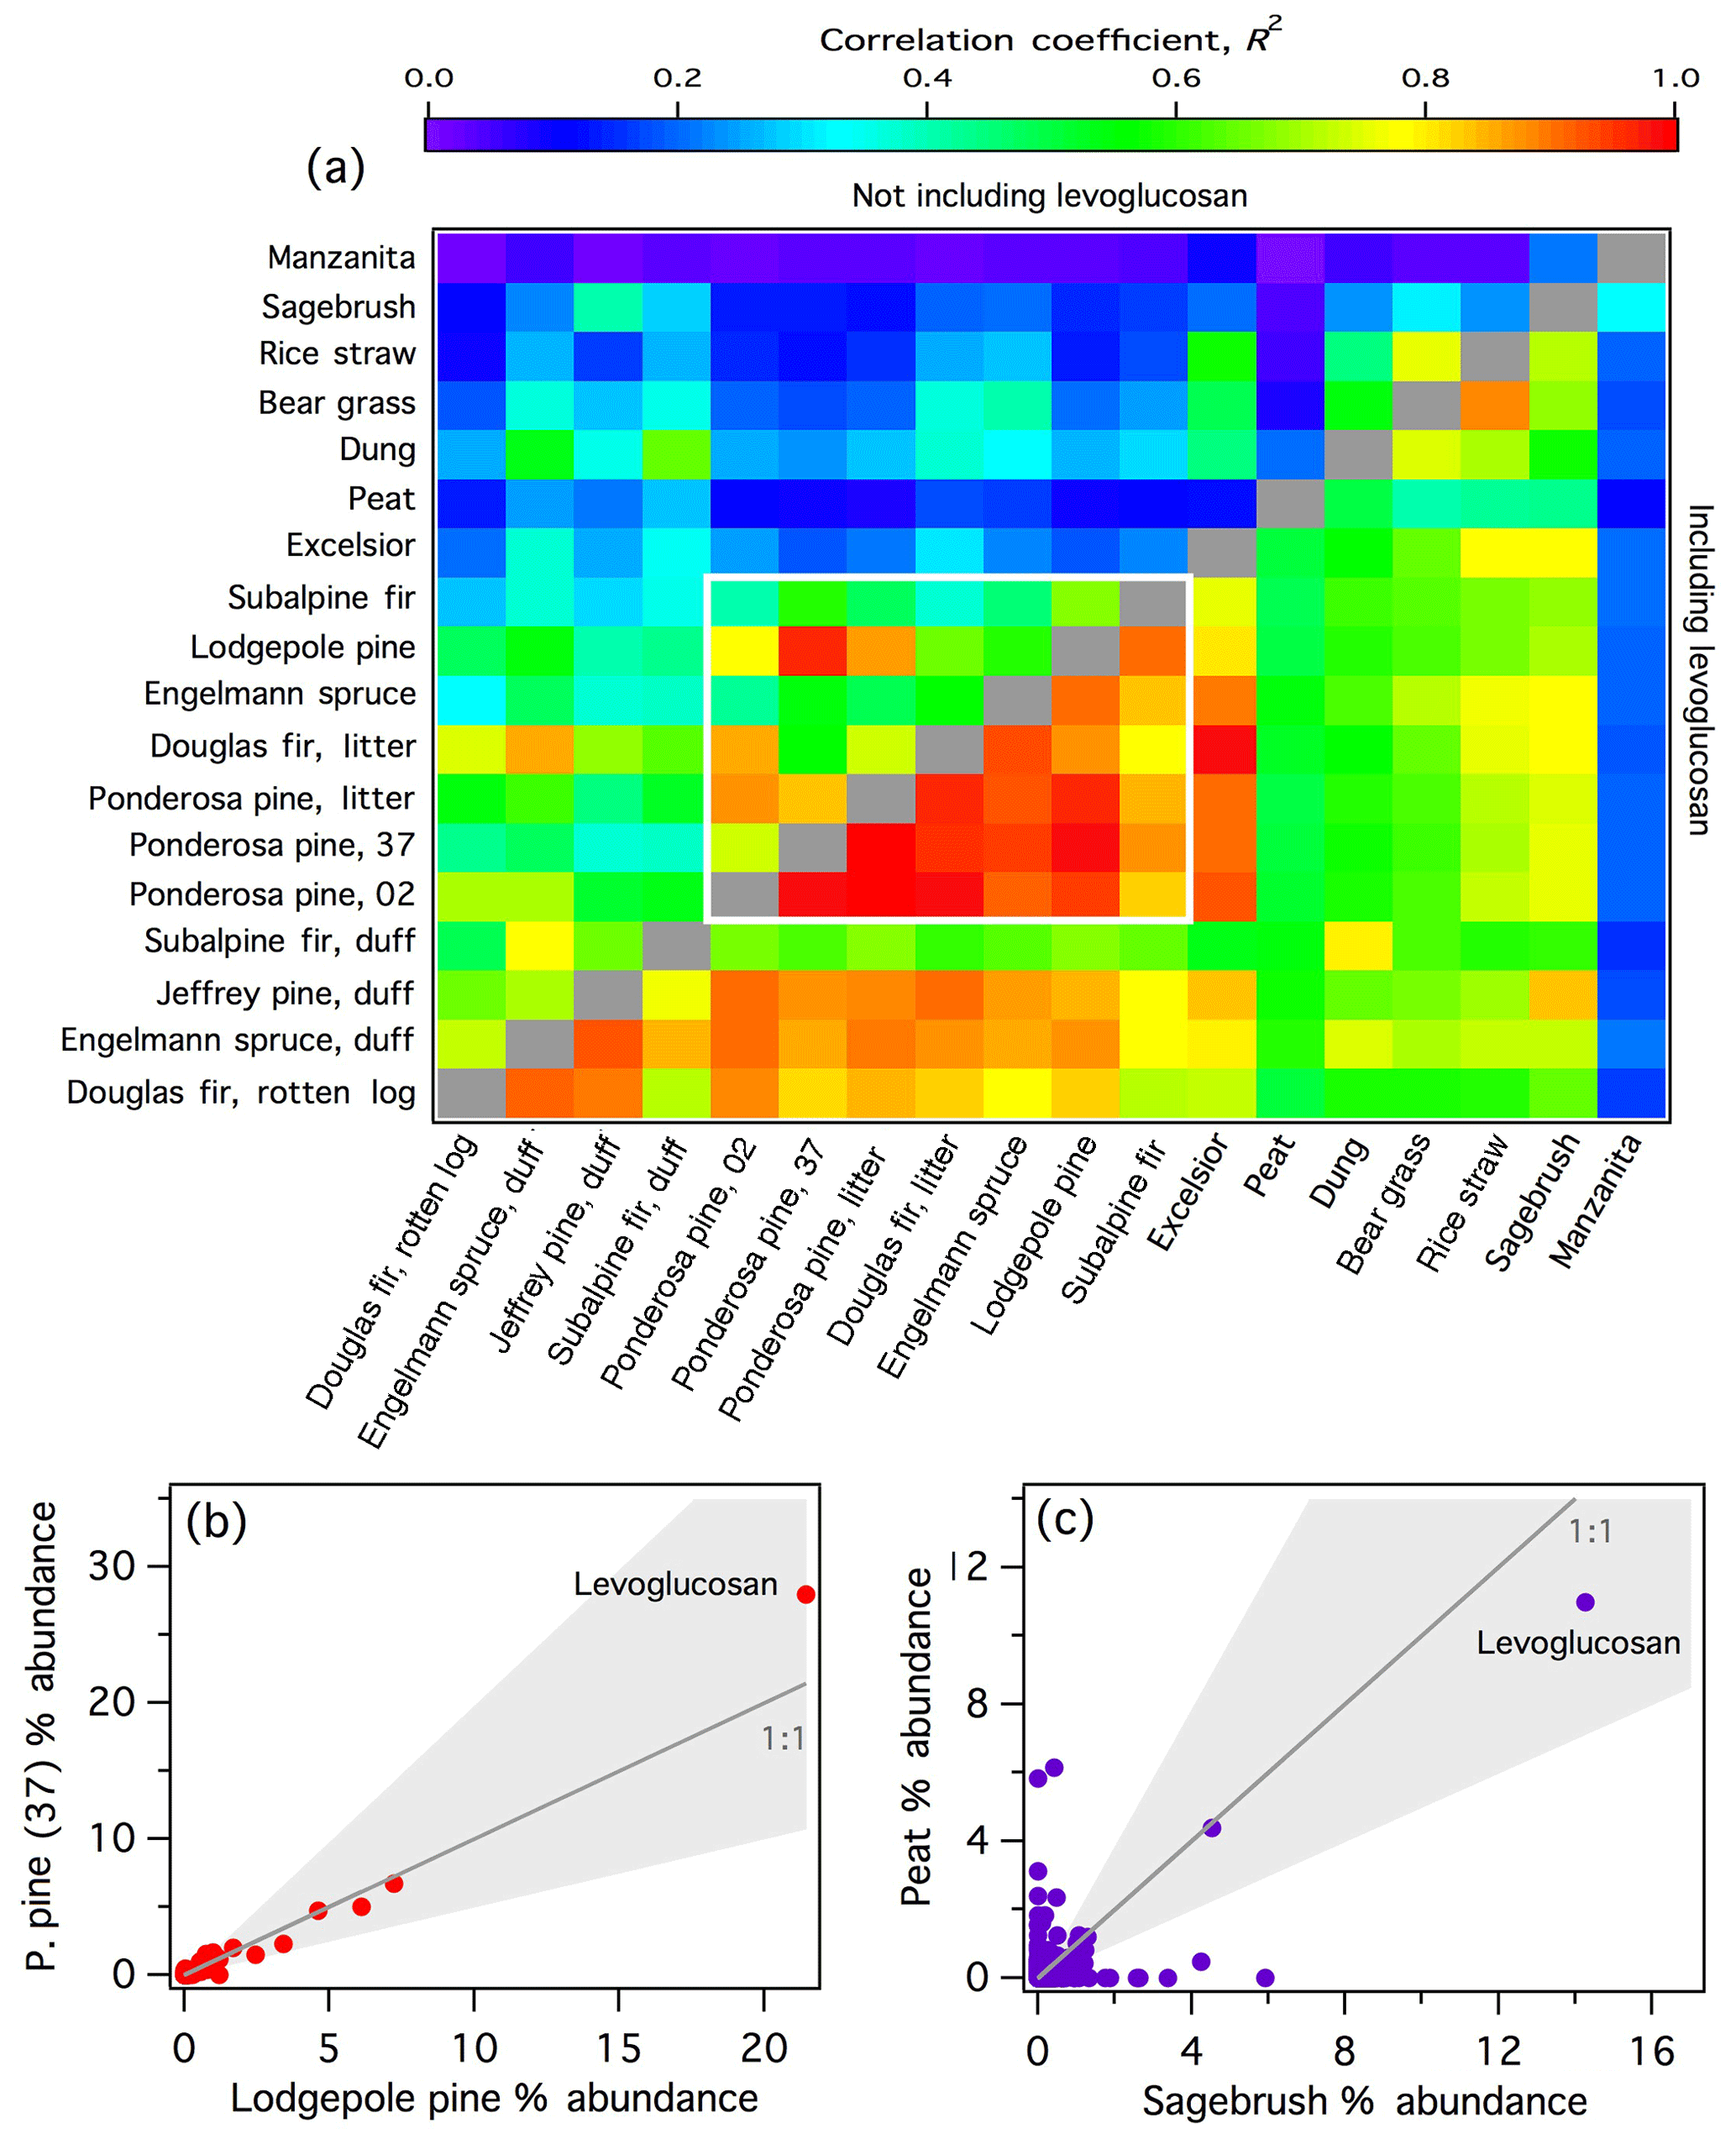
Figure 4(a) Correlation coefficients (R2) for each fire pair based on the total (SPE + PTFE) % abundance for each observed compound. For the ponderosa pine replicates, the fire number is indicated. Regression values below the diagonal were calculated including all observed compounds; above the diagonal, levoglucosan was omitted. The white box bounds the conifer fires. (b) Example scatter plot of a highly correlated fire pair. (c) Example scatter plot of a poorly correlated fire pair. In (b) and (c), each point represents a single compound and the shaded areas denote a factor of 2 from the 1:1 line.
The highest correlations were observed among the coniferous fuels (bounded by the white box in Fig. 4a). Among conifers, the mean is 0.91 and mean is 0.62, both of which are significantly higher than the overall mean values reported above. Selimovic et al. (2018) also observed similarities among the VOC emissions from coniferous fuels. The conifer emissions were well correlated with conifer-derived decayed plant matter (rotten log and duffs) with mean of 0.77 and mean of 0.47. When levoglucosan was included in the regressions, excelsior (aspen wood shavings) smoke is well correlated with the coniferous fuels (–0.97). This is likely because excelsior smoke was dominated by levoglucosan (43 % of the total abundance), and emissions from coniferous fuels also contained higher average levoglucosan (mean fLevo=27 %) than other fuels (mean fLevo=14 %, not including excelsior). Jen et al. (2018a) similarly observed higher average levoglucosan emission factors among coniferous fuels from filter samples collected during FIREX. However, with levoglucosan removed from the regression, excelsior smoke is poorly correlated with conifer-derived smoke (–0.25), likely due in part to the much simpler overall composition of excelsior smoke compared to other samples (Table 1).
In general, emissions from the miscellaneous fuel types that were sampled in this work (peat – manzanita in Fig. 4a) are poorly to moderately correlated with each other (mean , mean ) and the coniferous fuel types (mean , mean ). Of these, manzanita smoke was the least correlated with all other smoke samples ( < 0.32 and < 0.19); the unique signature of manzanita smoke is further discussed in Sect. 3.2.1. Peat smoke was also poorly correlated with most other biomass-burning emission samples, largely due to a high abundance of aliphatic compounds, including n-alkanes and 1-alkenes, as has been observed previously (George et al., 2016; Hatch et al., 2015; Jayarathne et al., 2018). The poor correlations are not driven solely by very low-abundance compounds. For example, in the peat–sagebrush comparison (Fig. 4c), 15 and 187 compounds with > 1 % and > 0.1 % abundance, respectively, were present in only one of the smoke samples (i.e., well outside the factor of 2 uncertainty).
Although sufficient data are not available to differentiate the separate effects of fuel type and combustion efficiency on smoke composition, Fig. 4a suggests that the diversity of I/SVOCs and their chromatographic profiles cannot be fully explained by combustion efficiency. For example, rice-straw smoke was much more strongly correlated with bear-grass smoke (), the only other herbaceous fuel sampled, despite significantly different MCEs (0.952 vs. 0.897, Table 1) than to the emissions of the two fires with the most similar MCEs (lodgepole pine, MCE =0.951, and ponderosa pine litter, MCE =0.954, , Fig. 4a).
3.2.1 Benzenediol isomers
Benzenediols (catechol, hydroquinone, and resorcinol) are ubiquitous in smoke, as described above, and thus are used as a case study to probe the variability of isomers from different fuel types. All three isomers were positively identified, demonstrated consistent recovery (Fig. S3), and are expected to exhibit similar instrument responses; therefore uncorrected experimental artifacts are not expected to significantly influence the comparison of these three compounds. Figure 5a shows the fraction of the total peak area (SPE + PTFE) from each burn attributed to the three benzenediol isomers. For nearly all samples, catechol was the dominant isomer and composed a relatively consistent fraction of the measured smoke, at 2.9 %–7.2 % of the total peak area measured for each fire. In contrast, resorcinol constituted a negligible fraction of the total emissions in all samples. Hydroquinone emissions were much more variable than catechol (0.29 %–33 % of the total measured emissions). Hydroquinone was overwhelmingly dominant in manzanita smoke, accounting for 33 % of the total measured peak area and with relative abundance that of catechol. Sagebrush smoke also showed relatively high emissions of hydroquinone, comparable to that of catechol. These similar hydroquinone signatures are likely one reason that manzanita smoke was best correlated with sagebrush smoke (Fig. 4a). The data in Fig. 5a are arranged by increasing MCE and demonstrate that the variable isomer speciation was not likely due to effects of combustion efficiency, but rather arises from the fuel composition. For example, the hydroquinone signature from manzanita fires can be attributed to its high concentration of arbutin, which contains a hydroquinone group that breaks off during pyrolysis (Jen et al., 2018b). These results demonstrate that important fuel-dependent emissions signatures could be missed when emissions measurements are performed solely with non-isomer-specific measurements.
The chromatographic data further indicate a significant difference in volatility among the benzenediol isomers. For compounds with similar functionality – i.e., similar activity coefficients in the column stationary phase – the retention factor is inversely correlated with vapor pressure (Dettmer-Wilde and Engewald, 2014). Hydroquinone and resorcinol both elute just after 4-methyl catechol in the first GC × GC dimension, which is significantly later than catechol, thereby suggesting significant differences in the volatilities of the benzenediol isomers. Because gas and particle phases were trapped separately on the SPE and PTFE filters, the gas-particle partitioning for each isomer can be investigated. The median gas-phase fractions of catechol and hydroquinone were 0.96 and 0.57, respectively (Fig. 5a), consistent with lower hydroquinone volatility. Schauer et al. (2001) similarly observed isomer-dependent benzenediol partitioning in smoke from residential wood combustion.
The measured partitioning was used to estimate the saturation concentration () of catechol and hydroquinone from each fire, based on Pankow (1994) and following Donahue et al. (2006) (Eq. 1):
The particle-phase fraction (fp) of compound i was based on the measured peak area from the PTFE filter relative to the total (PTFE + SPE) peak area; OA concentrations (COA) were estimated using PM2.5 data for each fire that was scaled by the corresponding OC fraction based on OC/EC measurements (Jen et al., 2018a). The gas-phase fractions for individual fires as a function of COA are shown in Fig. 5b. For both catechol and hydroquinone, the gas-phase fractions for fires 50 and 56 were anomalously low, likely due to an unidentified error or artifact in the filter measurements. It is possible that the recovered extraction volumes were lower from the corresponding SPE samples, however this was not tracked for each sample. Future use of recovery standards and further method optimization will help to correct for any sample-to-sample inconsistencies in the extraction efficiency and ultimately better constrain the partitioning estimates. Fires 50 and 56 were therefore omitted from the mean and standard deviation values of each compound to provide a best estimate of (although fire 66 also appears to be an outlier for catechol, it is not a clear outlier for hydroquinone and so the data have been retained). Using data from the remaining fires (except burn 2 for hydroquinone because it was not detected in both phases), the calculated mean is (, compared to of ( (including the outliers from burns 50 and 56 yields values of ( µg m−3 and ( for catechol and hydroquinone, respectively). The parameterized phase distributions as a function of COA for hydroquinone and catechol using the mean values ± one standard deviation are included in Fig. 5b.
To evaluate the accuracy of the filter-based estimates, the mean values were compared to those calculated using Antoine vapor-pressure coefficients (Burgess, 2018). The available Antoine coefficients are valid at elevated temperatures only (159–326 ∘C for hydroquinone and 118–245 ∘C for catechol); thus, vapor pressures were estimated at the minimum valid temperature and extrapolated down to the average ambient FSL temperature (20.8 ∘C) using the Clausius–Clapeyron equation and reported ΔHvap values. Literature values of ΔHvap varied widely for both isomers. To represent this variability, feasible bounds of were determined using two ΔHvap values for each compound, one reported by NIST (70.5 and 62.2 kJ mol−1 for hydroquinone and catechol, respectively; Burgess, 2018) and the other by Verevkin and Kozlova (2008) (84.4 and 70 kJ mol−1 for hydroquinone and catechol, respectively). The resulting values are summarized in Table 2 and the parameterized gas-particle partitioning for both literature assessments is shown in Fig. 5b.
Table 2Measured and literature-derived (µg m−3) values of benzenediol isomers.
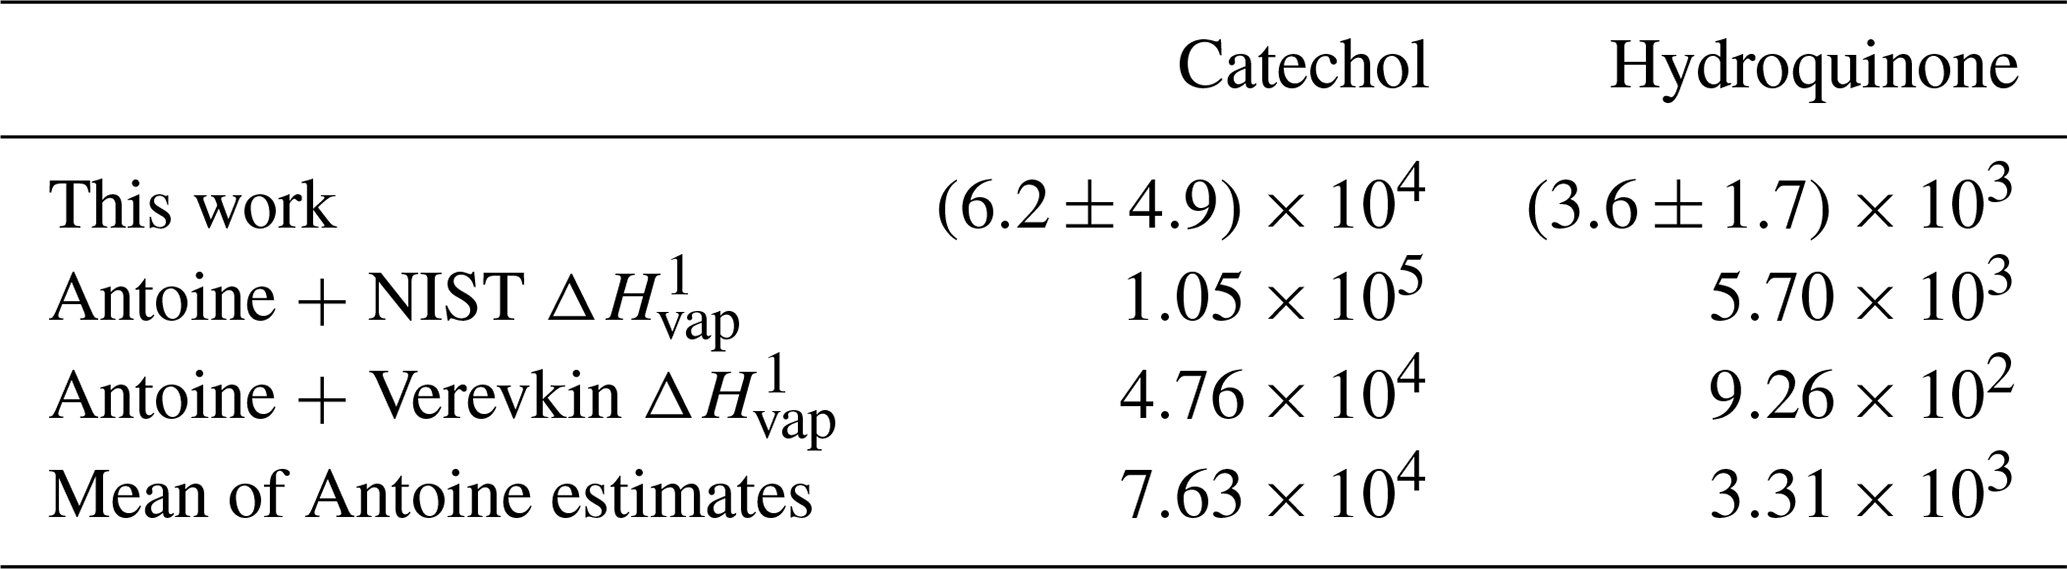
1 Calculated from vapor pressures estimated using Antoine coefficients (Burgess, 2018) scaled to ambient temperature using ΔHvap data from NIST (Burgess, 2018) or Verevkin and Kozlova (2008).
Although there is significant scatter in the filter-based estimates, the mean values for both compounds fall within the two literature-based estimates suggesting that on average the measured phase partitioning captured the differences in volatility between the two isomers and with reasonable accuracy. Further, considering that the estimated values are more likely to be underestimated rather than overestimated due to adsorption of I/SVOCs to the PTFE filter (Mader and Pankow, 2001), the filter-based estimates are more consistent with the Antoine + NIST ΔHvap thermodynamic data. The Antoine + NIST estimate displayed a consistent offset from the filter-based method for both compounds (i.e., Antoine /filter-based and 1.6 for catechol and hydroquinone, respectively) and a similar ratio between the isomers ( for both the measured and Antoine-based values); for comparison, using the Verevkin and Kozlova (2008) ΔHvap data, which is likely too large of a volatility difference between the two isomers based on a comparison with hexane- and cyclohexane- diols (Capouet and Muller, 2006).
Based on their values, benzenediols are classified as IVOCs (defined as ; Li et al., 2016) and are therefore expected to reside almost entirely in the gas phase at ambient OA loadings (), consistent with the parameterizations shown in Fig. 5b. However, at the high OA concentrations typical of biomass-burning smoke, considerable fractions of both catechol and hydroquinone – and by extension IVOCs in general – can partition to the particle phase in fresh emissions (Robinson et al., 2007). Therefore, single-phase measurements of such compounds in fresh/undiluted smoke may underestimate the total emissions by up to a factor of 2 and with significantly different potential errors across the I/SVOC volatility range as illustrated using the two isomers (Fig. 5b). It is also likely that wall losses within sample lines are significantly greater for hydroquinone than catechol. For example, using the parameterization of Pagonis et al. (2017) and our mean filter-derived values, delays in measurement response to benzenediols flowing through i.d. Teflon tubing are calculated to be 2.2 and 39 min m−1 of tubing at a flow rate of 1 L min−1 for catechol and hydroquinone, respectively (1.4 and 26 min m−1 for catechol and hydroquinone, respectively using the Antoine + NIST ΔHvap -derived values). Transport delays increase further with decreasing flow rate and increasing tube diameter (Pagonis et al., 2017). Such large differences in transport times between the two isomers could have a considerable impact on the measured total benzenediol emissions for some fuels (e.g., sagebrush and manzanita). To evaluate any potential effects on the filter measurements, the estimated delay in hydroquinone transport through the sample tube used here was ∼5 min (0.3 min for catechol; assuming the transport behavior of benzenediols through passivated stainless steel is similar to Teflon). Such time delays may have significantly impacted the hydroquinone measurements for rice straw and excelsior emissions, for which the fires lasted only 7–8 min. All other fires lasted 13–41 min and thus sample line wall effects are expected to have impacted the hydroquinone results from each fire by at most 12 %–38 %. The magnitude of the actual measurement impacts would depend in part on the timing of maximum hydroquinone emissions relative to the sampling period. Based on the emissions vs. time profiles of VOCs from online measurements of the FIREX fires (Sekimoto et al., 2018; Selimovic et al., 2018), maximum emissions generally occurred during the first half of the fire periods (or at least > 5 min prior to the end of the filter sample) and therefore any effects of transport delays on the hydroquinone (and other I/SVOC) measurements were likely minimal for most fires.
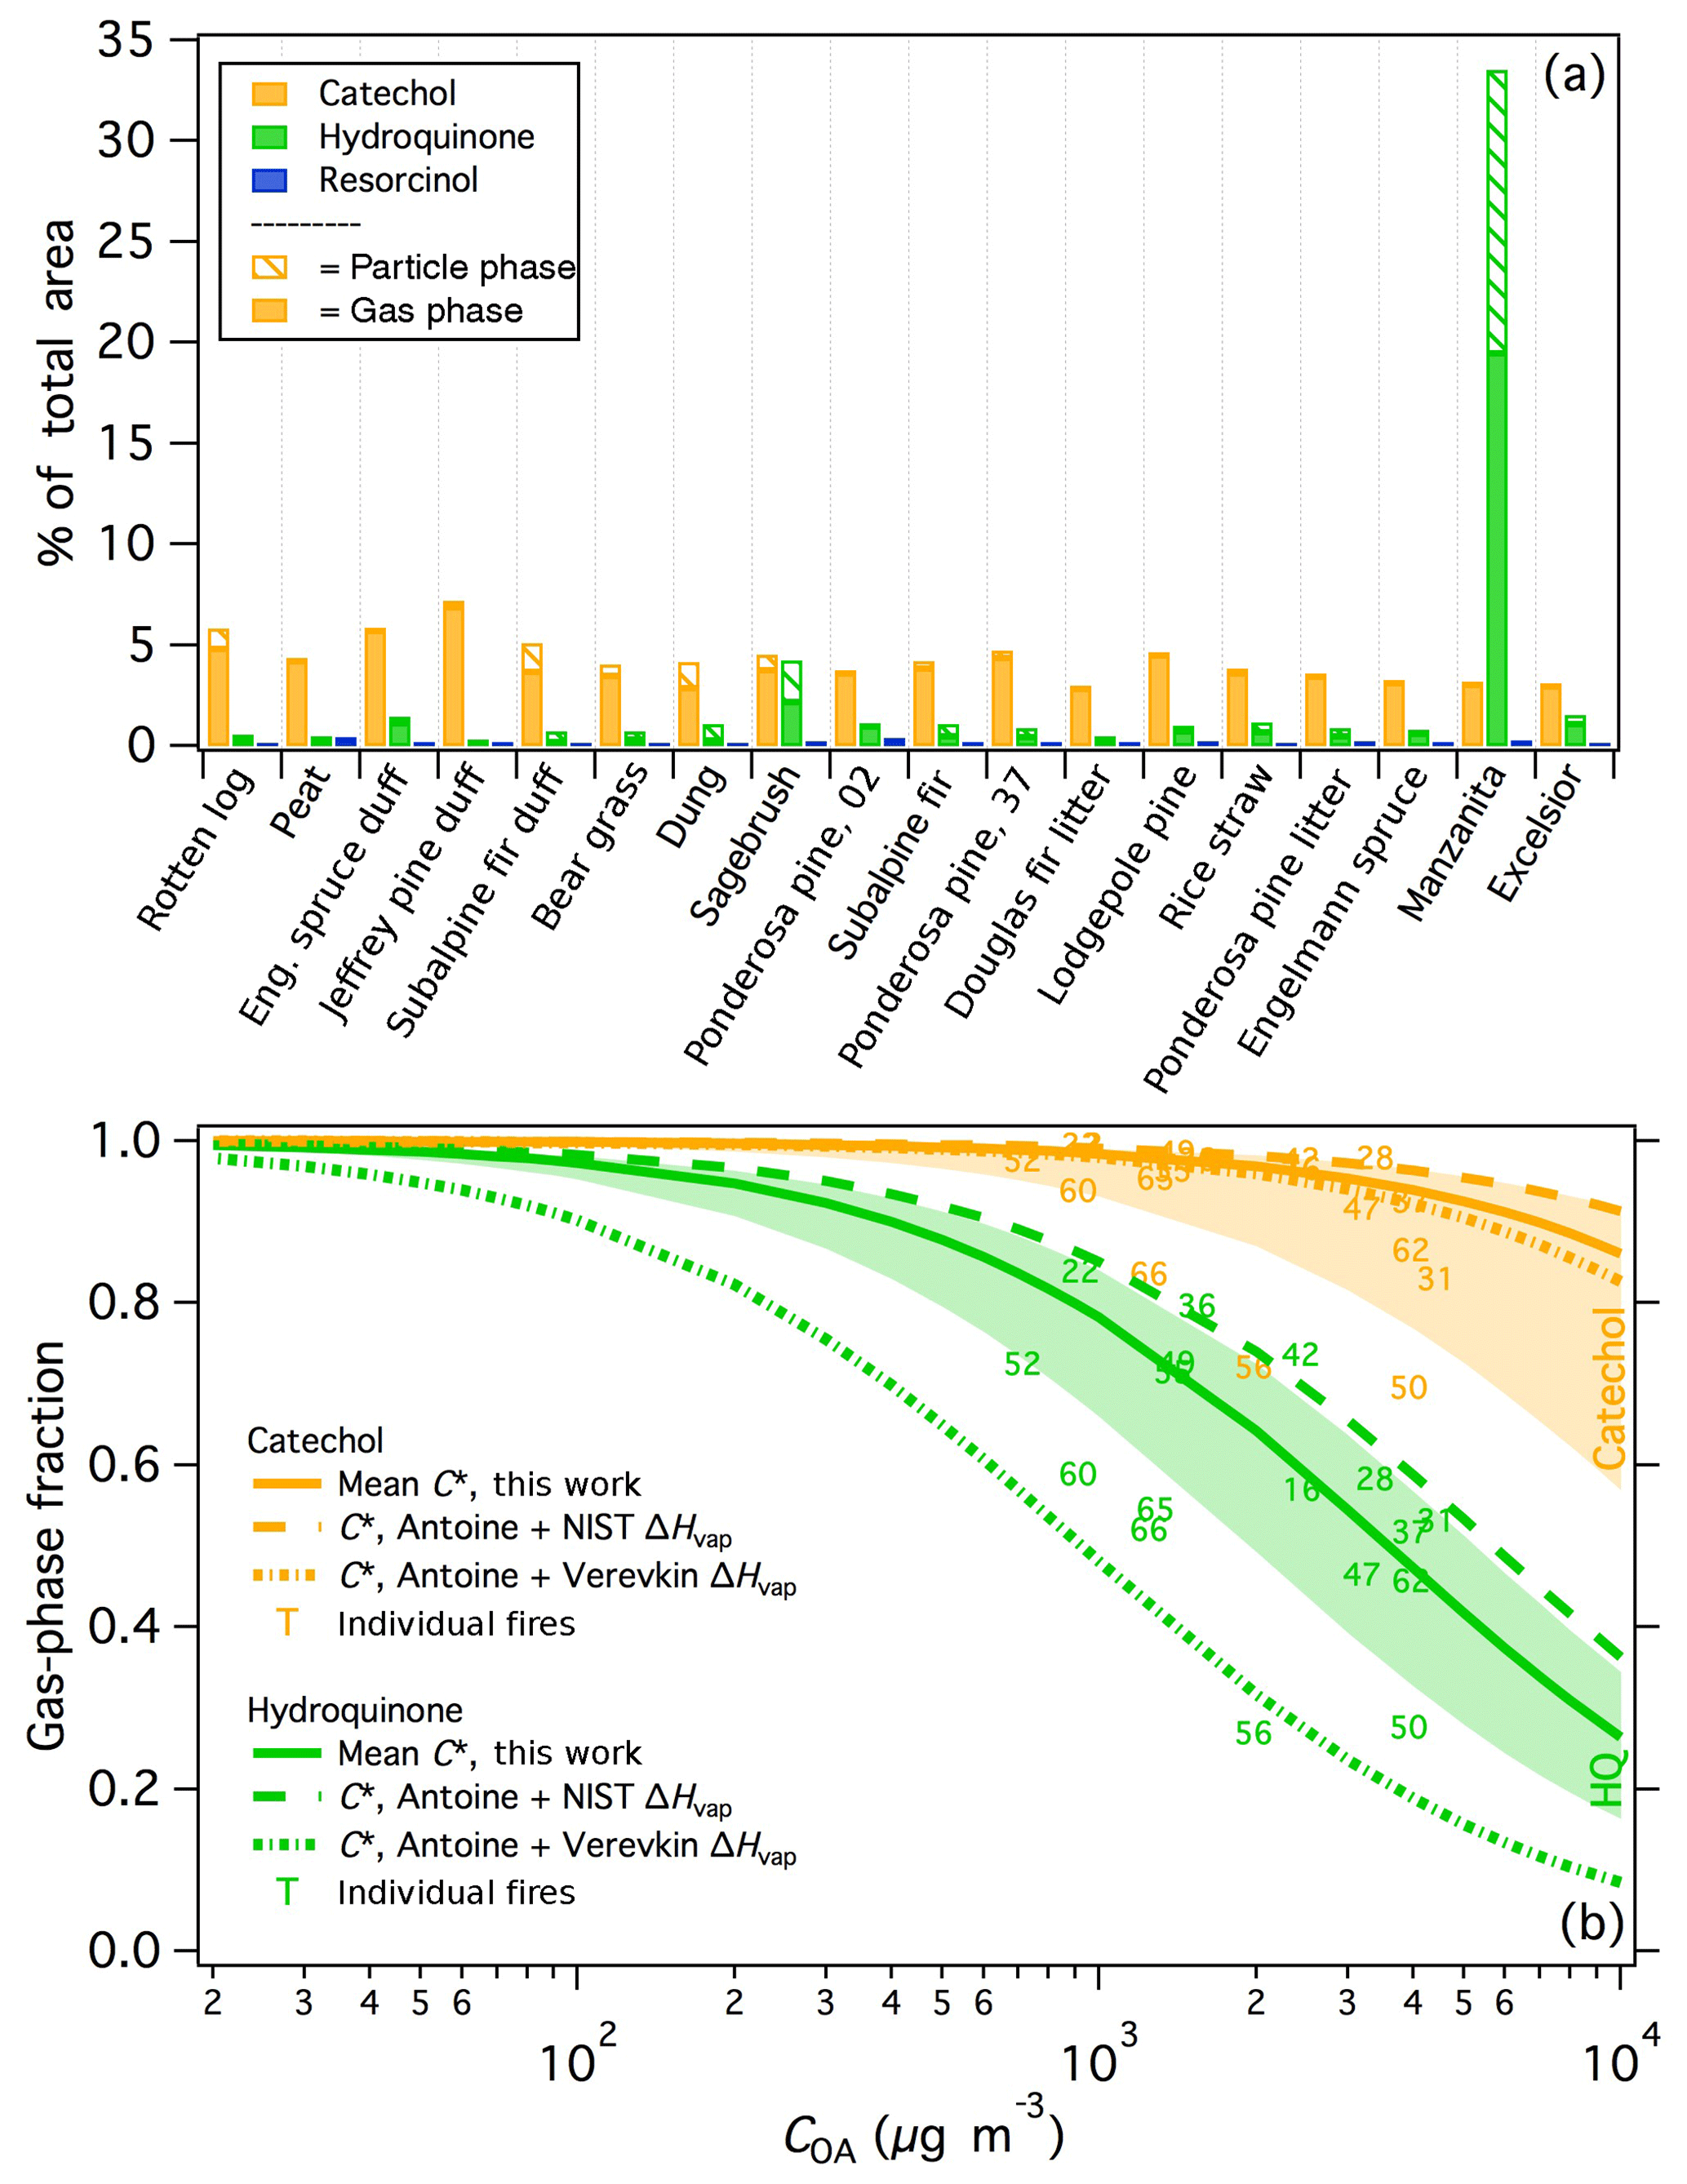
Figure 5(a) The percentage of the total (SPE + PTFE) peak area attributed to benzenediol isomers for each fire. Samples are arranged with increasing modified combustion efficiency (MCE) left to right. Fire numbers are indicated for the two ponderosa pine burns. (b) Calculated partitioning of catechol and hydroquinone (HQ) as a function of organic aerosol concentration (COA). Solid lines indicate the partitioning based on the mean C∗ values calculated in this work, with the shaded areas indicating plus/minus one standard deviation of the mean C∗. Dashed lines represent the partitioning calculated from vapor pressures estimated using Antoine coefficients and scaled to ambient temperature using ΔHvap data from NIST (Burgess, 2018) and Verevkin and Kozlova (2008).
The different phase distributions among the benzenediol isomers also suggest different oxidation and other reaction pathways could be available for catechol versus hydroquinone. Smith et al. (2015) determined that benzenediols can react rapidly in the aqueous phase with both triplet-state oxidants and OH radical yielding significant SOA mass (∼75 %–100 % yield); hydroquinone is further susceptible to aqueous-phase self-photodegradation with ∼90 % SOA yield. Overall, the partitioning estimates calculated in this work support the conclusions of Smith et al. (2015) that aqueous/condensed-phase SOA production mechanisms are more likely to occur for hydroquinone than catechol, for which gas-phase oxidation will dominate SOA production based on its low condensed-phase fraction (Fig. 5). Rate constants and SOA yield estimates, however, are not available for gas-phase reactions of hydroquinone (or resorcinol).
3.2.2 Volatility distribution
The benzenediol case study above demonstrates that the mean partitioning of individual compounds from SPE–PTFE comparisons can be estimated with reasonable accuracy to derive volatility distributions with decadal resolution. In this section, a single fire was used to investigate the overall volatility distribution of I/SVOCs in smoke following Eq. (1) and the approach outlined above. Rotten-log smoke (fire 31) was chosen because it was the only sample for which compounds present in both phases constituted a majority of the overall abundance (73 %). The estimated values for benzenediol isomers from fire 31 were within a factor of 3 of the mean values, suggesting sufficient accuracy for use within the volatility basis set (VBS) framework that is built upon order of magnitude volatility bins (Donahue et al., 2009). Therefore, among the available samples, the volatility distribution can be estimated most completely for the rotten log fire, although given the different I/SVOC chromatographic profiles observed for different fuels, as described above, the derived volatility distribution may not be broadly applicable.
The estimated volatility distribution for compounds observed in rotten log smoke is shown in Fig. 6a. Saturation concentrations could not be estimated for compounds that were detected in only one phase; therefore, particle- and gas-phase-only compounds were lumped into the logC∗ ≤0 and ≥7 bins, respectively. It is possible that such compounds could belong in one of the middle volatility bins if, for example, the compound was actually present in both phases but was below detection limit/peak selection criteria in either the PTFE or SPE sample. For compounds that were measured on both filters, volatilities were estimated in the log–6 range with the highest fractions of the emissions falling in the log and 4 bins. The relative fractions could change following improved quantification and correction of experimental artifacts, as outlined above. For example, from this fire falls within the log bin, whereas the mean value derived above would place catechol in the log bin; we leave catechol in the log bin here for consistency with the other unknown compounds in this sample. Additionally, the relative fractions of the higher volatility bins (i.e., logC∗ bins ≥5) would likely increase following correction of the relatively poor recovery exhibited by such compounds. Regardless, our estimated volatility distribution demonstrates that the SPE–PTFE method enables analysis of gas-phase compounds with lower volatility than has been observed using PTR-TOFMS and sorbent-tube GC × GC-TOFMS analyses, where little material has been reported in logC∗ bins < 5 (Hatch et al., 2017; Koss et al., 2018), and is therefore a complementary approach to common gas-phase measurements.
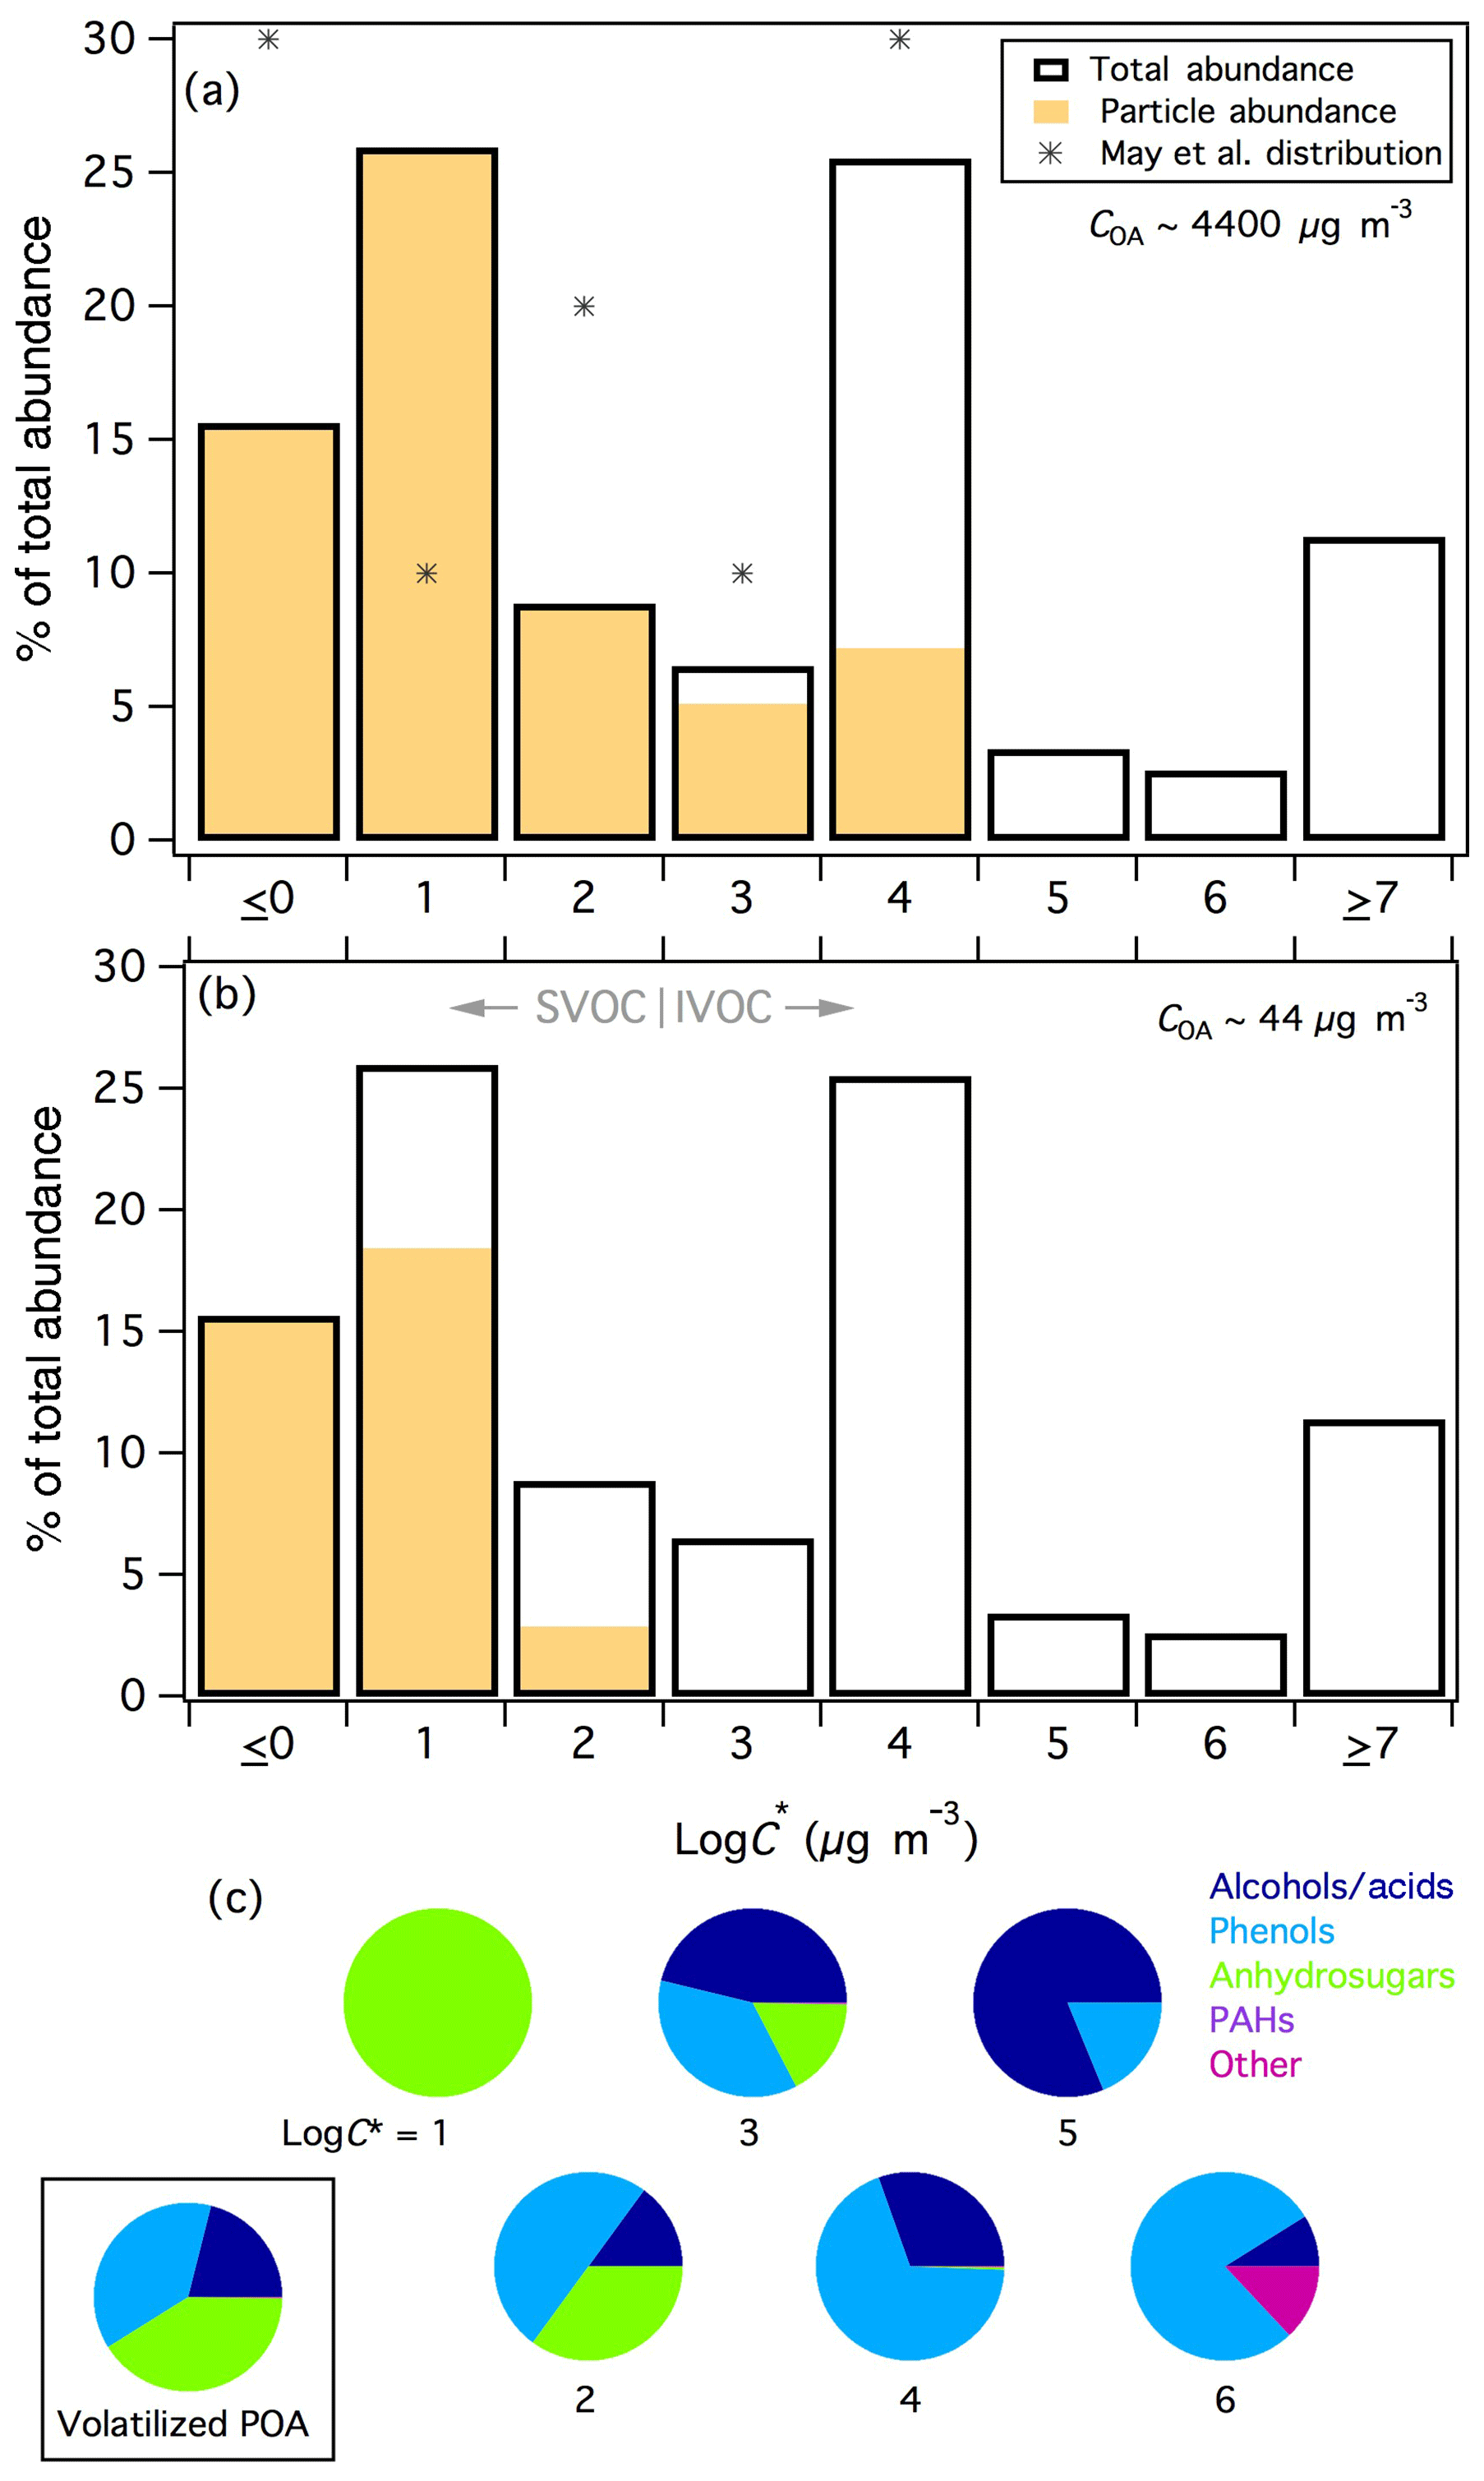
Figure 6(a) Volatility distribution of compounds observed in fresh rotten log smoke. Markers represent the derived volatility distribution for biomass-burning smoke organic aerosol from May et al. (2013). Particle- (gas-) phase only compounds are lumped into the log (≥7) bin. (b) As in panel (a), for a theoretical 100-fold evaporation of POA. (c) Speciation of the compound classes contributing to each volatility bin with measurable C∗ values. The pie chart bounded by the box shows the speciation of the I/SVOCs that were predicted to volatilize from the particle phase across all volatility classes following evaporation of POA represented in panel (b).
May et al. (2013) estimated the volatility distribution of biomass-burning OA from isothermal dilution and thermodenuder-aerosol mass spectrometry measurements of laboratory fires. Their distribution could be constrained within the log–4 range and is included for comparison in Fig. 6a. The trends observed in bins log–4 are nominally similar between the two studies, although the fractions are lower in this work due to allocation of some mass into bins > 4, which illustrates that the SPE filters enabled measurement of higher volatility compounds, although the relative abundances of such compounds are likely underestimated. The relative fractions in the log and 1 bins are opposite, however the sum of the two bins is very similar between the two studies (42 % in this work, 40 % in May et al.). Although the relative fractions in each bin do not line up exactly, the agreement is reasonable considering the two very different analytical approaches (speciation of individual compounds in gas and particle phases vs. volatility measurements of bulk OA) and the different fires included in each distribution.
The compound-class speciation for compounds observed in each volatility bin (for logC∗1–6) is given in Fig. 6c. For compounds that could not be positively or tentatively identified, compound classes were determined by mass-spectral fragmentation patterns (Lai and Fiehn, 2018). Alcohols and carboxylic acids were defined by significant m∕z 75 or 147 (and occasionally 103, 117, or 131) peaks; spectra for phenol derivatives contained large m∕z 73, negligible m∕z 75, and presence of higher m∕z peaks, indicative of resonance-stabilized aromatic structures; anhydrosugars and related compounds were characterized by m∕z 204 and 217; and “other” compounds were underivatized oxygenates or N/S-containing compounds (no mass spectral trimethylsilyl or hydrocarbon signatures) and eluted early in the secondary GC × GC dimension, consistent with higher polarity than derivatized compounds. Only one hydrocarbon (a PAH) was observed in rotten-log smoke within the characterized volatility range.
The log–6 bins are dominated by alcohols/acids and phenolic compounds, with increasing fractions of anhydrosugars with decreasing volatility (Fig. 6c). “Other” compounds were predominantly found in the highest volatility bin for which speciation was characterized (log); the absence of derivatization for such compounds implies that they lack –OH (or –NH, –SH) groups and therefore lack vapor-pressure lowering hydrogen-bonding functionality (Ziemann, 2011). Only two compounds were binned into the log bin: levoglucosan and its unidentified isomer. May et al. (2012) and Booth et al. (2011) both report measured sub-cooled liquid vapor pressures for levoglucosan equivalent to of ∼13 µg m−3 at 298 K. These reported values are within ∼25 % of our estimated levoglucosan of 16 µg m−3, demonstrating with the benzenediol isomer estimates above that our volatility estimates are reasonable over 4 orders of magnitude, encompassing both predominantly gas-phase and predominantly particle-phase compounds and providing greater confidence in the overall estimated volatility distribution. Whereas our estimated benzenediol values appeared to be underestimated, our estimated value for levoglucosan could be higher than literature estimates because the levoglucosan peak in the PTFE samples was overloaded on the GC × GC and may be out of the linear quantification range resulting in an underestimated particle-phase fraction. It is also possible that levoglucosan was only observable on the SPE filter due to its extremely high abundance, as only 0.3 % of the total levoglucosan signal was found on the SPE filter for the rotten log fire. Other compounds with similar gas-particle partitioning but much lower abundance would likely fall below the detection limit on the SPE filters and such compounds would therefore be lumped into the log0 bin in Fig. 6.
As smoke dilutes in the atmosphere, a considerable fraction of OA is expected to volatilize (Bian et al., 2017; Donahue et al., 2006; Grieshop et al., 2009b; Robinson et al., 2007). Figure 6b shows the predicted gas-particle partitioning following a theoretical 100-fold evaporation of rotten-log smoke POA (∼4400 to 44 µg m−3) and demonstrates that approximately 40 % of the particle-phase I/SVOCs would evaporate following such perturbation (ignoring potential OA activity effects). Comparison with Fig. 6a illustrates that compounds in the log and 4 bins volatilized completely (as expected for IVOCs), in addition to a significant fraction of the log and 2 bins. The framed pie chart of Fig. 6c shows the speciated compound classes of the POA that would theoretically volatilize following dilution (including all volatility bins). Of this material newly accessible to gas-phase oxidation, 41 % is attributable to anhydrosugars (levoglucosan and several isomers/related compounds), 38 % to phenol derivatives (catechol, vanillic acid, 4-methyl catechol, pyrogallol, 3-vanilpropanol) and 21 % to alcohols/acids (unknowns), where the identifiable compounds that account for > 5 % of the corresponding class of volatilized material are listed in descending order parenthetically. These speciated volatility measurements provide a first approximation of the types of I/SVOCs that can evaporate from POA and react as non-traditional SOA precursors. All such compounds were oxygenated and will therefore exhibit very different chemistry and SOA yields than I/SVOCs in vehicular emissions, which have generally been characterized as almost entirely hydrocarbons, particularly alkanes (Tkacik et al., 2012; Zhao et al., 2014, 2016). Of the identified compounds, only catechol has been studied with respect to gas-phase oxidation and SOA formation (Finewax et al., 2018; Nakao et al., 2011; Yee et al., 2013). Therefore more work is needed to better understand the relative importance of gas-phase vs. heterogeneous reaction pathways for biomass-burning-derived I/SVOCs.
This study demonstrates the use of SPE filters for untargeted analysis of gas-phase I/SVOCs in biomass-burning smoke samples. Based on extensive analysis of standard compounds, the extraction recovery was generally lower from SPE filters than PTFE filters. However, SPE-induced extraction biases were generally consistent for each compound class and could be corrected, although recovery was low for the most volatile compounds due volatilization during blow down. Future improvements in the extraction protocol, specifically testing additional solvents and drying time, in addition to the use of recovery, internal, and external standards, should enable quantification of compounds collected onto SPE filters. Further, negligible breakthrough was observed through SPE filters, demonstrating their high trapping efficiency. Therefore, SPE filters appear to be a suitable alternative to PUF/XAD measurements for untargeted analysis of I/SVOCs in air samples.
Analysis of biomass-burning smoke PTFE and SPE filter samples collected during laboratory fires demonstrated that particle- and gas-phase compounds were separately trapped on the respective filter types, with most of the observed compounds detected on only one filter type. The GC × GC-TOFMS-derived chromatographic profiles of I/SVOCs showed significant diversity among the different fuel types tested, with high correlations observed only among emissions from coniferous fuels. The chromatographic profiles did not appear to be strongly related to combustion efficiency.
Of the compounds observed on the SPE filters, catechol was the most common, highly abundant compound detected and was generally the dominant benzenediol isomer. However, fuel-dependent signatures were observed among the benzenediol isomers, with hydroquinone the most abundant isomer in manzanita smoke. Further, hydroquinone was shown to be significantly less volatile than catechol ( ∼18), which can lead to considerable differences in sampling-line losses, as well as in gas-particle partitioning and oxidation chemistry between these isomers. This demonstrates the need for isomer speciation to achieve a holistic understanding of biomass-burning emissions and plume chemistry.
Based on the phase-specific measurements enabled by PTFE and SPE filter samples, the speciated volatility distribution of Douglas fir rotten log smoke was estimated. Detection of compounds with logC∗ ∼1–4 demonstrates that the SPE–PTFE method enables analysis of gas-phase compounds with lower volatility than has been observed using PTR-TOFMS and sorbent-tube GC × GC-TOFMS analyses. Effectively 100 % of the compounds observed in both phases were oxygenates (or contained other heteroatoms). The POA likely to volatilize during plume dilution was attributed to anhydrosugars, phenol derivatives, and unidentified alcohols/acids, for which gas-phase chemistry has not been extensively studied.
All PTFE and SPE filter data are available for download from the NOAA FIREX archive at https://esrl.noaa.gov/csd/groups/csd7/measurements/2016firex/FireLab/DataDownload/ (NOAA, 2018).
The supplement related to this article is available online at: https://doi.org/10.5194/acp-18-17801-2018-supplement.
LEH and KCB designed the experiments. LEH collected the samples and analyzed the data. ARU extracted the FIREX filter samples. CNJ and AHG designed and prepared the biomass-burning standards. ML served as the EMSL User Proposal host. LEH and KCB interpreted the data and wrote the manuscript; all the other authors provided comments.
The authors declare that they have no conflict of interest.
This work was supported by NOAA AC4 grants NA16OAR4310103 (UCR) and
NA16OAR4310107 (UCB). CNJ acknowledges support from NSF PFS (AGS-1524211). A
portion of this research was performed using EMSL (proposal ID 49601), a DOE
Office of Science User Facility sponsored by the Office of Biological and
Environmental Research. We thank James Roberts (NOAA), Carsten Warneke
(NOAA), and Robert Yokelson (University of Montana), as well as FSL staff for
organizing the FIREX campaign. We thank Tianqu Cai and Jason Surratt
(University of North Carolina, Chapel Hill) for sharing PM2.5 data.
Edited by: Jacqui Hamilton
Reviewed by: two anonymous referees
Akagi, S. K., Yokelson, R. J., Wiedinmyer, C., Alvarado, M. J., Reid, J. S., Karl, T., Crounse, J. D., and Wennberg, P. O.: Emission factors for open and domestic biomass burning for use in atmospheric models, Atmos. Chem. Phys., 11, 4039–4072, https://doi.org/10.5194/acp-11-4039-2011, 2011.
Akagi, S. K., Craven, J. S., Taylor, J. W., McMeeking, G. R., Yokelson, R. J., Burling, I. R., Urbanski, S. P., Wold, C. E., Seinfeld, J. H., Coe, H., Alvarado, M. J., and Weise, D. R.: Evolution of trace gases and particles emitted by a chaparral fire in California, Atmos. Chem. Phys., 12, 1397–1421, https://doi.org/10.5194/acp-12-1397-2012, 2012.
Andreae, M. O. and Merlet, P.: Emission of trace gases and aerosols from biomass burning, Global Biogeochem. Cy., 15, 955–966, 2001.
Bian, Q., Jathar, S. H., Kodros, J. K., Barsanti, K. C., Hatch, L. E., May, A. A., Kreidenweis, S. M., and Pierce, J. R.: Secondary organic aerosol formation in biomass-burning plumes: theoretical analysis of lab studies and ambient plumes, Atmos. Chem. Phys., 17, 5459–5475, https://doi.org/10.5194/acp-17-5459-2017, 2017.
Bond, T. C., Streets, D. G., Yarber, K. F., Nelson, S. M., Woo, J. H., and Klimont, Z.: A technology-based global inventory of black and organic carbon emissions from combustion, J. Geophys. Res.-Atmos., 109, D14203, https://doi.org/10.1029/2003jd003697, 2004.
Booth, A. M., Montague, W. J., Barley, M. H., Topping, D. O., McFiggans, G., Garforth, A., and Percival, C. J.: Solid state and sub-cooled liquid vapour pressures of cyclic aliphatic dicarboxylic acids, Atmos. Chem. Phys., 11, 655–665, https://doi.org/10.5194/acp-11-655-2011, 2011.
Burgess, D. R.: Thermochemical Data, in: NIST Chemistry WebBook, NIST Standard Reference Database Number 69, edited by: Linstrom, P. J. and Mallard, W. G., National Institute of Standards and Technology, Gaithersburg, MD, 2018.
Capes, G., Johnson, B., McFiggans, G., Williams, P. I., Haywood, J., and Coe, H.: Aging of biomass burning aerosols over West Africa: Aircraft measurements of chemical composition, microphysical properties, and emission ratios, J. Geophys. Res.-Atmos., 113, D00c15, https://doi.org/10.1029/2008jd009845, 2008.
Capouet, M. and Müller, J.-F.: A group contribution method for estimating the vapour pressures of a-pinene oxidation products, Atmos. Chem. Phys., 6, 1455–1467, https://doi.org/10.5194/acp-6-1455-2006, 2006.
Christian, T. J., Kleiss, B., Yokelson, R. J., Holzinger, R., Crutzen, P. J., Hao, W. M., Shirai, T., and Blake, D. R.: Comprehensive laboratory measurements of biomass-burning emissions: 2. First intercomparison of open-path FTIR, PTR-MS, and GC- MS/FID/ECD, J. Geophys. Res.-Atmos., 109, D02311, https://doi.org/10.1029/2003jd003874, 2004.
Cubison, M. J., Ortega, A. M., Hayes, P. L., Farmer, D. K., Day, D., Lechner, M. J., Brune, W. H., Apel, E., Diskin, G. S., Fisher, J. A., Fuelberg, H. E., Hecobian, A., Knapp, D. J., Mikoviny, T., Riemer, D., Sachse, G. W., Sessions, W., Weber, R. J., Weinheimer, A. J., Wisthaler, A., and Jimenez, J. L.: Effects of aging on organic aerosol from open biomass burning smoke in aircraft and laboratory studies, Atmos. Chem. Phys., 11, 12049–12064, https://doi.org/10.5194/acp-11-12049-2011, 2011.
DeCarlo, P. F., Ulbrich, I. M., Crounse, J., de Foy, B., Dunlea, E. J., Aiken, A. C., Knapp, D., Weinheimer, A. J., Campos, T., Wennberg, P. O., and Jimenez, J. L.: Investigation of the sources and processing of organic aerosol over the Central Mexican Plateau from aircraft measurements during MILAGRO, Atmos. Chem. Phys., 10, 5257–5280, https://doi.org/10.5194/acp-10-5257-2010, 2010.
Dettmer-Wilde, K. and Engewald, W. (Eds.): Practical Gas Chromatography: A Comprehensive Reference, Springer-Verlag, Heidelberg, 2014.
Dhammapala, R., Claiborn, C., Jimenez, J., Corkill, J., Gullett, B., Simpson, C., and Paulsen, M.: Emission factors of PAHs, methoxyphenols, levoglucosan, elemental carbon and organic carbon from simulated wheat and Kentucky bluegrass stubble burns, Atmos. Environ., 41, 2660–2669, https://doi.org/10.1016/j.atmosenv.2006.11.023, 2007.
Donahue, N. M., Robinson, A. L., Stanier, C. O., and Pandis, S. N.: Coupled partitioning, dilution, and chemical aging of semivolatile organics, Environ. Sci. Technol., 40, 2635–2643, https://doi.org/10.1021/Es052297c, 2006.
Donahue, N. M., Robinson, A. L., and Pandis, S. N.: Atmospheric organic particulate matter: From smoke to secondary organic aerosol, Atmos. Environ., 43, 94–106, https://doi.org/10.1016/j.atmosenv.2008.09.055, 2009.
Erger, C. and Schmidt, T. C.: Disk-based solid-phase extraction analysis of organic substances in water, Trac-Trend. Anal. Chem., 61, 74–82, https://doi.org/10.1016/j.trac.2014.05.006, 2014.
Finewax, Z., de Gouw, J. A., and Ziemann, P. J.: Identification and Quantification of 4-Nitrocatechol Formed from OH and NO3 Radical-Initiated Reactions of Catechol in Air in the Presence of NOx: Implications for Secondary Organic Aerosol Formation from Biomass Burning, Environ. Sci. Technol., 52, 1981–1989, https://doi.org/10.1021/acs.est.7b05864, 2018.
Galarneau, E., Harner, T., Shoeib, M., Kozma, M., and Lane, D.: A preliminary investigation of sorbent-impregnated filters (SIFs) as an alternative to polyurethane foam (PUF) for sampling gas-phase semivolatile organic compounds in air, Atmos. Environ., 40, 5734–5740, https://doi.org/10.1016/j.atmosenv.2006.05.060, 2006.
Gaston, C. J., Lopez-Hilfiker, F. D., Whybrew, L. E., Hadley, O., McNair, F., Gao, H. L., Jaffe, D. A., and Thornton, J. A.: Online molecular characterization of fine particulate matter in Port Angeles, WA: Evidence for a major impact from residential wood smoke, Atmos. Environ., 138, 99–107, https://doi.org/10.1016/j.atmosenv.2016.05.013, 2016.
George, I. J., Black, R. R., Geron, C. D., Aurell, J., Hays, M. D., Preston, W. T., and Gullett, B. K.: Volatile and semivolatile organic compounds in laboratory peat fire emissions, Atmos. Environ., 132, 163–170, https://doi.org/10.1016/j.atmosenv.2016.02.025, 2016.
Grieshop, A. P., Logue, J. M., Donahue, N. M., and Robinson, A. L.: Laboratory investigation of photochemical oxidation of organic aerosol from wood fires 1: measurement and simulation of organic aerosol evolution, Atmos. Chem. Phys., 9, 1263–1277, https://doi.org/10.5194/acp-9-1263-2009, 2009a.
Grieshop, A. P., Miracolo, M. A., Donahue, N. M., and Robinson, A. L.: Constraining the Volatility Distribution and Gas-Particle Partitioning of Combustion Aerosols Using Isothermal Dilution and Thermodenuder Measurements, Environ. Sci. Technol., 43, 4750–4756, https://doi.org/10.1021/Es8032378, 2009b.
Hatch, L. E., Luo, W., Pankow, J. F., Yokelson, R. J., Stockwell, C. E., and Barsanti, K. C.: Identification and quantification of gaseous organic compounds emitted from biomass burning using two-dimensional gas chromatography-time-of-flight mass spectrometry, Atmos. Chem. Phys., 15, 1865–1899, https://doi.org/10.5194/acp-15-1865-2015, 2015.
Hatch, L. E., Yokelson, R. J., Stockwell, C. E., Veres, P. R., Simpson, I. J., Blake, D. R., Orlando, J. J., and Barsanti, K. C.: Multi-instrument comparison and compilation of non-methane organic gas emissions from biomass burning and implications for smoke-derived secondary organic aerosol precursors, Atmos. Chem. Phys., 17, 1471–1489, https://doi.org/10.5194/acp-17-1471-2017, 2017.
Hays, M. D., Geron, C. D., Linna, K. J., Smith, N. D., and Schauer, J. J.: Speciation of gas-phase and fine particle emissions from burning of foliar fuels, Environ. Sci. Technol., 36, 2281–2295, 2002.
Hennigan, C. J., Miracolo, M. A., Engelhart, G. J., May, A. A., Presto, A. A., Lee, T., Sullivan, A. P., McMeeking, G. R., Coe, H., Wold, C. E., Hao, W.-M., Gilman, J. B., Kuster, W. C., de Gouw, J., Schichtel, B. A., Collett Jr., J. L., Kreidenweis, S. M., and Robinson, A. L.: Chemical and physical transformations of organic aerosol from the photo-oxidation of open biomass burning emissions in an environmental chamber, Atmos. Chem. Phys., 11, 7669–7686, https://doi.org/10.5194/acp-11-7669-2011, 2011.
Hobbs, P. V., Reid, J. S., Kotchenruther, R. A., Ferek, R. J., and Weiss, R.: Direct radiative forcing by smoke from biomass burning, Science, 275, 1776–1778, 1997.
Jayarathne, T., Stockwell, C. E., Gilbert, A. A., Daugherty, K., Cochrane, M. A., Ryan, K. C., Putra, E. I., Saharjo, B. H., Nurhayati, A. D., Albar, I., Yokelson, R. J., and Stone, E. A.: Chemical characterization of fine particulate matter emitted by peat fires in Central Kalimantan, Indonesia, during the 2015 El Niño, Atmos. Chem. Phys., 18, 2585–2600, https://doi.org/10.5194/acp-18-2585-2018, 2018.
Jen, C. N., Hatch, L. E., Selimovic, V., Yokelson, R. J., Weber, R., Fernandez, A. E., Kreisberg, N. M., Barsanti, K. C., and Goldstein, A. H.: Speciated and total emission factors of particulate organics from burning western U.S. wildland fuels and their dependence on combustion efficiency, Atmos. Chem. Phys. Discuss., submitted, 2018a.
Jen, C. N., Liang, Y. T., Hatch, L. E., Kreisberg, N. M., Stamatis, C., Kristensen, K., Battles, J. J., Stephens, S. L., York, R. A., Barsanti, K. C., and Goldstein, A. H.: High Hydroquinone Emissions from Burning Manzanita, Environ. Sci. Tech. Let., 5, 309–314, https://doi.org/10.1021/acs.estlett.8b00222, 2018b.
Jolleys, M. D., Coe, H., McFiggans, G., Capes, G., Allan, J. D., Crosier, J., Williams, P. I., Allen, G., Bower, K. N., Jimenez, J. L., Russell, L. M., Grutter, M., and Baumgardner, D.: Characterizing the aging of biomass burning organic aerosol by use of mixing ratios: A meta-analysis of four regions, Environ. Sci. Technol., 46, 13093–13102, 2012.
Koss, A. R., Sekimoto, K., Gilman, J. B., Selimovic, V., Coggon, M. M., Zarzana, K. J., Yuan, B., Lerner, B. M., Brown, S. S., Jimenez, J. L., Krechmer, J., Roberts, J. M., Warneke, C., Yokelson, R. J., and de Gouw, J.: Non-methane organic gas emissions from biomass burning: identification, quantification, and emission factors from PTR-ToF during the FIREX 2016 laboratory experiment, Atmos. Chem. Phys., 18, 3299–3319, https://doi.org/10.5194/acp-18-3299-2018, 2018.
Kunzli, N., Avol, E., Wu, J., Gauderman, W. J., Rappaport, E., and Millstein, J.: Health effects of the 2003 Southern California wildfires on children, Am. J. Resp. Crit. Care, 174, 1221–1228, https://doi.org/10.1164/rccm.200604-519OC, 2006.
Lai, Z. and Fiehn, O.: Mass spectral fragmentation of trimethylsilylated small molecules, Mass Spectrom. Rev., 37, 245–257, https://doi.org/10.1002/mas.21518, 2018.
Li, Y., Pöschl, U., and Shiraiwa, M.: Molecular corridors and parameterizations of volatility in the chemical evolution of organic aerosols, Atmos. Chem. Phys., 16, 3327–3344, https://doi.org/10.5194/acp-16-3327-2016, 2016.
Liu, J. C., Pereira, G., Uhl, S. A., Bravo, M. A., and Bell, M. L.: A systematic review of the physical health impacts from non-occupational exposure to wildfire smoke, Environ. Res., 136, 120–132, https://doi.org/10.1016/j.envres.2014.10.015, 2015.
Liu, Y. Q., Goodrick, S., and Heilman, W.: Wildland fire emissions, carbon, and climate: Wildfire-climate interactions, Forest Ecol. Manag., 317, 80–96, 10.1016/j.foreco.2013.02.020, 2014.
Mader, B. T. and Pankow, J. F.: Gas/solid partitioning of semivolatile organic compounds (SOCs) to air filters. 3. An analysis of gas adsorption artifacts in measurements of atmospheric SOCs and organic carbon (OC) when using Teflon membrane filters and quartz fiber filters, Environ. Sci. Technol., 35, 3422–3432, https://doi.org/10.1021/es0015951, 2001.
May, A. A., Saleh, R., Hennigan, C. J., Donahue, N. M., and Robinson, A. L.: Volatility of Organic Molecular Markers Used for Source Apportionment Analysis: Measurements and Implications for Atmospheric Lifetime, Environ. Sci. Technol., 46, 12435–12444, https://doi.org/10.1021/es302276t, 2012.
May, A. A., Levin, E. J. T., Hennigan, C. J., Riipinen, I., Lee, T., Collett, J. L., Jimenez, J. L., Kreidenweis, S. M., and Robinson, A. L.: Gas-particle partitioning of primary organic aerosol emissions: 3. Biomass burning, J. Geophys. Res.-Atmos., 118, 11327–11338, https://doi.org/10.1002/jgrd.50828, 2013.
May, A. A., Lee, T., McMeeking, G. R., Akagi, S., Sullivan, A. P., Urbanski, S., Yokelson, R. J., and Kreidenweis, S. M.: Observations and analysis of organic aerosol evolution in some prescribed fire smoke plumes, Atmos. Chem. Phys., 15, 6323–6335, https://doi.org/10.5194/acp-15-6323-2015, 2015.
Mazzoleni, L. R., Zielinska, B., and Moosmuller, H.: Emissions of levoglucosan, methoxy phenols, and organic acids from prescribed burns, laboratory combustion of wildland fuels, and residential wood combustion, Environ. Sci. Technol., 41, 2115–2122, https://doi.org/10.1021/es061702c, 2007.
McDonald, J. D., Zielinska, B., Fujita, E. M., Sagebiel, J. C., Chow, J. C., and Watson, J. G.: Fine particle and gaseous emission rates from residential wood combustion, Environ. Sci. Technol., 34, 2080–2091, https://doi.org/10.1021/es9909632, 2000.
Naeher, L. P., Brauer, M., Lipsett, M., Zelikoff, J. T., Simpson, C. D., Koenig, J. Q., and Smith, K. R.: Woodsmoke Health Effects: A Review, Inhal. Toxicol., 19, 67–106, https://doi.org/10.1080/08958370600985875, 2007.
Nakao, S., Clark, C., Tang, P., Sato, K., and Cocker III, D.: Secondary organic aerosol formation from phenolic compounds in the absence of NOx, Atmos. Chem. Phys., 11, 10649–10660, https://doi.org/10.5194/acp-11-10649-2011, 2011.
NOAA: FIREX data archive, https://esrl.noaa.gov/csd/groups/csd7/measurements/2016firex/FireLab/DataDownload/, last access: 9 October 2018.
Ortega, A. M., Day, D. A., Cubison, M. J., Brune, W. H., Bon, D., de Gouw, J. A., and Jimenez, J. L.: Secondary organic aerosol formation and primary organic aerosol oxidation from biomass-burning smoke in a flow reactor during FLAME-3, Atmos. Chem. Phys., 13, 11551–11571, https://doi.org/10.5194/acp-13-11551-2013, 2013.
Pagonis, D., Krechmer, J. E., de Gouw, J., Jimenez, J. L., and Ziemann, P. J.: Effects of gas-wall partitioning in Teflon tubing and instrumentation on time-resolved measurements of gas-phase organic compounds, Atmos. Meas. Tech., 10, 4687–4696, https://doi.org/10.5194/amt-10-4687-2017, 2017.
Pankow, J. F.: An Absorption-Model of Gas-Particle Partitioning of Organic-Compounds in the Atmosphere, Atmos. Environ., 28, 185–188, https://doi.org/10.1016/1352-2310(94)90093-0, 1994.
Paolini, V., Guerriero, E., Bacaloni, A., Rotatori, M., Benedetti, P., and Mosca, S.: Simultaneous Sampling of Vapor and Particle-Phase Carcinogenic Polycyclic Aromatic Hydrocarbons on Functionalized Glass Fiber Filters, Aerosol Air Qual. Res., 16, 175–183, https://doi.org/10.4209/aaqr.2015.07.0476, 2016.
Robinson, A. L., Donahue, N. M., Shrivastava, M. K., Weitkamp, E. A., Sage, A. M., Grieshop, A. P., Lane, T. E., Pierce, J. R., and Pandis, S. N.: Rethinking organic aerosols: Semivolatile emissions and photochemical aging, Science, 315, 1259–1262, https://doi.org/10.1126/science.1133061, 2007.
Sanchez, C., Carlsson, H., Colmsjo, A., Crescenzi, C., and Batlle, R.: Determination of nitroaromatic compounds in air samples at femtogram level using C-18 membrane sampling and on-line extraction with LC-MS, Anal. Chem., 75, 4639–4645, https://doi.org/10.1021/ac034278w, 2003.
Sauret-Szezepanki, N. and Lane, D. A.: Smog chamber study of acenaphthene: Gas/particle partition measurements of the products formed by reaction with the OH radical, Polycycl. Aromat. Comp., 24, 161–172, 10.1080/10406630490460610, 2004.
Schauer, J. J., Kleeman, M. J., Cass, G. R., and Simoneit, B. R. T.: Measurement of emissions from air pollution sources. 3. C-1-C-29 organic compounds from fireplace combustion of wood, Environ. Sci. Technol., 35, 1716–1728, 2001.
Schmarr, H. G. and Bernhardt, J.: Profiling analysis of volatile compounds from fruits using comprehensive two-dimensional gas chromatography and image processing techniques, J. Chromatogr. A, 1217, 565–574, https://doi.org/10.1016/j.chroma.2009.11.063, 2010.
Sekimoto, K., Koss, A. R., Gilman, J. B., Selimovic, V., Coggon, M. M., Zarzana, K. J., Yuan, B., Lerner, B. M., Brown, S. S., Warneke, C., Yokelson, R. J., Roberts, J. M., and de Gouw, J.: High- and low-temperature pyrolysis profiles describe volatile organic compound emissions from western US wildfire fuels, Atmos. Chem. Phys., 18, 9263–9281, https://doi.org/10.5194/acp-18-9263-2018, 2018.
Selimovic, V., Yokelson, R. J., Warneke, C., Roberts, J. M., de Gouw, J., Reardon, J., and Griffith, D. W. T.: Aerosol optical properties and trace gas emissions by PAX and OP-FTIR for laboratory-simulated western US wildfires during FIREX, Atmos. Chem. Phys., 18, 2929–2948, https://doi.org/10.5194/acp-18-2929-2018, 2018.
Smith, J. D., Kinney, H., and Anastasio, C.: Aqueous benzene-diols react with an organic triplet excited state and hydroxyl radical to form secondary organic aerosol, Phys. Chem. Chem. Phys., 17, 10227–10237, https://doi.org/10.1039/c4cp06095d, 2015.
Stuff, J. R., Cheicante, R. L., Durst, H. D., and Ruth, J. L.: Detection of the chemical warfare agents bis-(2-chloroethyl)ethylamine (HN-1) and tris-(2-chloroethyl)amine (HN-3) in air, J. Chromatogr. A., 849, 529–540, https://doi.org/10.1016/S0021-9673(99)00585-3, 1999.
Tkacik, D. S., Presto, A. A., Donahue, N. M., and Robinson, A. L.: Secondary Organic Aerosol Formation from Intermediate-Volatility Organic Compounds: Cyclic, Linear, and Branched Alkanes, Environ. Sci. Technol., 46, 8773–8781, https://doi.org/10.1021/es301112c, 2012.
Tkacik, D. S., Robinson, E. S., Ahern, A., Saleh, R., Stockwell, C., Veres, P., Simpson, I. J., Meinardi, S., Blake, D. R., Yokelson, R. J., Presto, A. A., Sullivan, R. C., Donahue, N. M., and Robinson, A. L.: A dual-chamber method for quantifying the effects of atmospheric perturbations on secondary organic aerosol formation from biomass burning emissions, J. Geophys. Res.-Atmos., 122, 6043–6058, https://doi.org/10.1002/2016JD025784, 2017.
Tollback, J., Tamburro, D., Crescenzi, C., and Carlsson, H.: Air sampling with Empore solid phase extraction membranes and online single-channel desorption/liquid chromatography/mass spectrometry analysis: Determination of volatile and semi-volatile organophosphate esters, J. Chromatogr. A, 1129, 1–8, https://doi.org/10.1016/j.chroma.2006.05.086, 2006.
Verevkin, S. P. and Kozlova, S. A.: Di-hydroxybenzenes: Catechol, resorcinol, and hydroquinone – Enthalpies of phase transitions revisited, Thermochim. Acta, 471, 33–42, https://doi.org/10.1016/j.tca.2008.02.016, 2008.
Worton, D. R., Decker, M., Isaacman-VanWertz, G., Chan, A. W. H., Wilson, K. R., and Goldstein, A. H.: Improved molecular level identification of organic compounds using comprehensive two-dimensional chromatography, dual ionization energies and high resolution mass spectrometry, Analyst, 142, 2395–2403, https://doi.org/10.1039/C7AN00625J, 2017.
Yee, L. D., Kautzman, K. E., Loza, C. L., Schilling, K. A., Coggon, M. M., Chhabra, P. S., Chan, M. N., Chan, A. W. H., Hersey, S. P., Crounse, J. D., Wennberg, P. O., Flagan, R. C., and Seinfeld, J. H.: Secondary organic aerosol formation from biomass burning intermediates: phenol and methoxyphenols, Atmos. Chem. Phys., 13, 8019–8043, https://doi.org/10.5194/acp-13-8019-2013, 2013.
Yokelson, R. J., Griffith, D. W. T., and Ward, D. E.: Open-path Fourier transform infrared studies of large-scale laboratory biomass fires, J. Geophys. Res.-Atmos., 101, 21067–21080, 1996.
Yokelson, R. J., Crounse, J. D., DeCarlo, P. F., Karl, T., Urbanski, S., Atlas, E., Campos, T., Shinozuka, Y., Kapustin, V., Clarke, A. D., Weinheimer, A., Knapp, D. J., Montzka, D. D., Holloway, J., Weibring, P., Flocke, F., Zheng, W., Toohey, D., Wennberg, P. O., Wiedinmyer, C., Mauldin, L., Fried, A., Richter, D., Walega, J., Jimenez, J. L., Adachi, K., Buseck, P. R., Hall, S. R., and Shetter, R.: Emissions from biomass burning in the Yucatan, Atmos. Chem. Phys., 9, 5785–5812, https://doi.org/10.5194/acp-9-5785-2009, 2009.
Zhao, Y., Hennigan, C. J., May, A. A., Tkacik, D. S., de Gouw, J. A., Gilman, J. B., Kuster, W. C., Borbon, A., and Robinson, A. L.: Intermediate-Volatility Organic Compounds: A Large Source of Secondary Organic Aerosol, Environ. Sci. Technol., 48, 13743–13750, https://doi.org/10.1021/es5035188, 2014.
Zhao, Y., Nguyen, N. T., Presto, A. A., Hennigan, C. J., May, A. A., and Robinson, A. L.: Intermediate Volatility Organic Compound Emissions from On-Road Gasoline Vehicles and Small Off-Road Gasoline Engines, Environ. Sci. Technol., 4554–4563, https://doi.org/10.1021/acs.est.5b06247, 2016.
Ziemann, P. J.: Effects of molecular structure on the chemistry of aerosol formation from the OH-radical-initiated oxidation of alkanes and alkenes, Int. Rev. Phys. Chem., 30, 161–195, 2011.