the Creative Commons Attribution 4.0 License.
the Creative Commons Attribution 4.0 License.
 | 06 Dec 2018
The underappreciated role of nonvolatile cations in aerosol ammonium-sulfate molar ratios
Hongyu Guo
Athanasios Nenes
Overprediction of fine-particle ammonium-sulfate molar ratios (R) by thermodynamic models is suggested as evidence for interactions with organic constituents that inhibit the equilibration of gas-phase ammonia with aerosol sulfate and questions the equilibrium assumption long thought to apply for submicron aerosol. This hypothesis is tested through thermodynamic analysis of ambient observations. We find that the deviation between R from a molar ratio of 2 is strongly correlated with the concentration of sodium (Na+), a nonvolatile cation (NVC), but exhibits no correlation to organic aerosol (OA) mass concentration or mass fraction. Thermodynamic predictions of both R and ammonia gas–particle partitioning can accurately reproduce observations when small amounts of NVCs are included in the calculations, whereas exclusion of NVCs results in a predicted R consistently near 2. The sensitivity of R to small amounts of NVCs arises because, when the latter are present but not included in the thermodynamic calculations, the missing cations are replaced with ammonium in the model (NH3– equilibrium shifts to the particle), resulting in an R that is biased high. Results and conclusions based on bulk aerosol considerations that assume all species are internally mixed are not changed even if NVCs and sulfate are largely externally mixed; fine-particle pH is found to be much less sensitive to mixing state assumptions than molar ratios. We also show that the data used to support the “organic inhibition” of NH3 from equilibrium, when compared against other network and field campaign datasets, display a systematically and significantly lower (thought to be from an evaporation bias), that is of the order of the effect postulated to be caused by organics. Altogether, these results question the postulated ability of organic compounds to considerably perturb aerosol acidity and prevent ammonia from achieving gas–particle equilibrium, at least for the locations considered. Furthermore, the results demonstrate the limitations of using molar ratios to infer aerosol properties or processes that depend on particle pH.
- Article
(3713 KB) -
Supplement
(4837 KB) - BibTeX
- EndNote


The pH is a fundamental aerosol property that affects aerosol formation and composition through reactions that involve the hydronium ion (e.g., Jang et al., 2002; Eddingsaas et al., 2010; Surratt et al., 2010) and gas–particle partitioning of semivolatile acids and bases (e.g., Fridlind and Jacobson, 2000; Young et al., 2013; Guo et al., 2016, 2017). Acidity also modulates aerosol toxicity and atmospheric nutrient supply to the oceans by augmenting the solubility of transition metals and other nutrient species (Meskhidze et al., 2003; Nenes et al., 2011; Longo et al., 2016; Stockdale et al., 2016; Fang et al., 2017). Despite its importance, challenges in measuring fine-mode-particle pH have led to the adoption of measurable aerosol properties as acidity proxies, such as aerosol ammonium-sulfate ratio or ion balances with a priori assumed dissociation states (e.g., Paulot and Jacob, 2014; Wang et al., 2016; Silvern et al., 2017). Recent work has shown that such proxies are not uniquely related to pH because they do not capture variability in particle water content, ion activity coefficients, or dissociation state of polyprotic acids and bases (Guo et al., 2015, 2016; Hennigan et al., 2015; Song et al., 2018). An alternative approach that better constrains aerosol pH is a thermodynamic analysis of semivolatile acid (or base) measurements, whose partitioning is observably sensitive to shifts in aerosol acidity (pH is optimally constrained when gas–particle concentration ratios approach 1:1), and with the aerosol water content or phase state constrained as well (Guo et al., 2015; Hennigan et al., 2015). NH3–, HNO3–, and HCl–Cl− pairs often meet this condition for a wide range of atmospherically relevant pH. The method has been utilized for a range of meteorological conditions (RH, T) and gas–aerosol concentrations demonstrating that model predictions are often in agreement with observations (Bougiatioti et al., 2016; Guo et al., 2016, 2017; Liu et al., 2017; Murphy et al., 2017; Song et al., 2018).
Despite their skill and widespread use in regional and global models, aerosol thermodynamic models can predict ammonium-sulfate molar ratios (Kim et al., 2015; Weber et al., 2016; Silvern et al., 2017) that departs from observations in seemingly counterintuitive ways. In the southeastern US, where total ammonium (NHx = NH3 + ) is in large excess of particle sulfate, observed molar ratios are in the range of 1–2 (Hidy et al., 2014; Guo et al., 2015; Kim et al., 2015). Thermodynamic models predict very low pH (0.5 to 2) (Guo et al., 2015) and molar ratios always close to 2 (Kim et al., 2015; Weber et al., 2016; Silvern et al., 2017). This predicted–observed molar ratio discrepancy has led to the hypothesis that thermodynamic predictions are incorrect because they do not consider interactions with organic species, either in the form of films that inhibit gas-to-particle mass transfer of NH3 or other mechanisms that are not accounted for (Silvern et al., 2017). Such limitations, if prevalent, are suggested to oppose the validity of aerosol thermodynamic equilibrium with significant impacts on aerosol chemistry and acidity-mediated processes worldwide (Silvern et al., 2017), especially given the expected increasing organic mass fractions in the future due to reduced anthropogenic emissions, as seen with SO2 emission reductions in the eastern US (Hand et al., 2012; Attwood et al., 2014; Hidy et al., 2014).
The effect of organic species on gas–particle equilibrium of inorganic species has been the subject of many past studies. Organic films are often hypothesized to act as barriers for gas–particle mass transfer, which given their ubiquity means they require special attention in studies. For example, Anttila et al. (2007) reports the formation of ∼10 nm thick organic films in regions with monoterpene emissions, which are the largest source of summertime organic aerosol (OA) in the southeastern US (Zhang et al., 2018). Lab studies have shown that organic films may significantly slow down mass transfer of NH3 from gas to particle at low relative humidity (less effect at higher RH, such as the southeastern US) (Daumer et al., 1992; Liggio et al., 2011) but have little effect on water vapor uptake for a large RH range (Garland et al., 2005). Such films, as noted by Silvern et al. (2017), would have important implications for partitioning of NH3 and other larger semivolatile molecules, such as H2O, HNO3, and organic acids. However, in contrast, numerous studies show that NH3, water vapor, and HNO3 equilibrate with organic-rich atmospheric aerosols (Ansari and Pandis, 2000; Moya et al., 2001; Morino et al., 2006; Fountoukis et al., 2009; Guo et al., 2015, 2016, 2017; Liu et al., 2017; Murphy et al., 2017; Paulot et al., 2017), which suggest organic films, if present, do not impose considerable delays in mass transfer and gas–particle equilibration.
At low temperature and low relative humidity, particles may be in a semi-liquid or glassy state characterized by a very low molecular diffusivity throughout its volume (e.g., Zobrist et al., 2008; Bertram et al., 2011; Tong et al., 2011; Zobrist et al., 2011; Bones et al., 2012; Reid et al., 2018). When in this state, gas–particle mass transfer of all semivolatile components may be severely limited and require much longer timescales to equilibrate than the ∼20 min typically thought to apply for PM1 (Dassios and Pandis, 1999; Cruz et al., 2000; Fountoukis et al., 2009). However, such an effect has not been observed for the conditions in the eastern US, as there is good agreement between observed and predicted particle water, and partitioning of NH3– and HNO3–, especially in cases where RH is sufficiently high (greater than 40 %) to maintain the aerosol in a deliquesced (completely liquid) state (Guo et al., 2015, 2016).
Other reasons, unrelated to the presence of organic aerosol, may drive the observed molar ratio discrepancy. Analyses of aerosol acidity, molar ratios, and partitioning of semivolatile species often neglect the variations of composition with size, especially in the PM1 to PM2.5 range (Keene et al., 1998; Fridlind and Jacobson, 2000; Nenes et al., 2011; Young et al., 2013; Bougiatioti et al., 2016; Fang et al., 2017). If acidity across size changes sufficiently, average equilibrium composition (including molar ratios) may deviate considerably against observations owing to the nonlinear dependence of partitioning with acidity (e.g., Guo et al., 2016). Soluble nonvolatile cations (NVCs, such as Na+, K+, Ca2+, Mg2+), potentially present in large quantities in PM2.5 and to a lesser extent in PM1, can strongly modulate acidity and molar ratios. NVCs are often omitted from thermodynamic calculations because of their relatively minor contribution to aerosol mass and ion charge balance; for similar reasons, NVCs are not routinely included in aerosol composition measurements; when they are, proximity to level of detection (LOD) often increases their concentration uncertainty. Here we show, based on analysis of observational aerosol and gas datasets, that excluding even small amounts of NVC in thermodynamic analyses results in predicted molar ratios close to 2, whereas including them brings model-predicted molar ratios into agreement with observed levels. We also assess the implications of using specific datasets on molar ratios and the impact of adopting a size-averaged (bulk) thermodynamic analysis against one that considers an incomplete mixing (size-dependent composition) of ambient aerosols.
2.1 Molar ratios definition
Two ammonium-sulfate aerosol molar ratios (mol mol−1) are used in the following analysis:
Both are based on mole concentrations in units of mol m−3. is a more narrowly defined molar ratio that excludes associated with , because some fractions of ammonium sulfate and ammonium nitrate can be associated with different sized particles (Zhuang et al., 1999) and molar ratios are calculated based on bulk composition data (PM2.5 or PM1). This issue is discussed in more detail below. The upper limit for R and is 2 for a particle composition of pure (NH4)2SO4 and a lower limit of 0 for R when is associated with other cations instead of (e.g., Na2SO4) or if there is free H2SO4 in the aerosol. A negative can occur for conditions of high and low , concentrations (e.g., NaNO3) but is rare for ambient fine particles (at least not seen in the three datasets studied in this paper). R or is typically observed in the range of 1 and 2 in the southeastern US (Hidy et al., 2014; Guo et al., 2015; Weber et al., 2016). In cases where levels are low relative to , the two ratios, and R, are equivalent, as is observed in the summertime southeastern US, where is typically ∼0.2 µg m−3, ∼1 µg m−3, and ∼3 µg m−3 (Blanchard et al., 2013).
2.2 Data
Two datasets are mainly used for analysis: the Southern Oxidant and Aerosol Study (SOAS) and the Wintertime Investigation of Transport, Emissions, and Reactivity (WINTER). The SOAS study was conducted from 1 June to 15 July in the summer of 2013 at a rural ground site in Centreville (CTR), AL, representative of the southeastern US background atmosphere in summer. PM2.5 ions were determined with a particle-into-liquid sampler coupled with an ion chromatograph (PILS-IC). The PILS-IC detects aerosol water-soluble anions and cations collected and diluted by deionized water to the extent of complete deprotonation of H2SO4 in the aqueous sample (Orsini et al., 2003). NH3 was obtained from chemical ionization mass spectrometer measurements (You et al., 2014). In the following, we only use PM2.5 ion data from a 12-day period (11–23 June) of the SOAS campaign. (PILS PM1 data were collected in the second half of the study and are not used here). Periods of rainfall are not included in the analysis, as equilibrium does not apply. The same dataset was used to study pH sensitivity to sulfate and ammonia (Weber et al., 2016). PM2.5 anion and cation data along with NH3 and HNO3 were also collected with a Monitor for AeRosols and Gases in ambient Air (MARGA) during SOAS (Allen et al., 2015). The WINTER data were collected during 13 research aircraft flights from 1 February to 15 March 2015 mainly sampling over the northeastern US. We use PM1 aerosol data collected with a high-resolution time-of-flight aerosol mass spectrometer (hereafter referred to as AMS) (Schroder et al., 2018), which have been extensively compared to the PILS anion measurements also made in that study (Guo et al., 2016). Details of the these two campaigns and instruments, and calculations and verification of pH based on the observation datasets, have been described in Guo et al. (2015, 2016), respectively.
In the following analysis, we focus on R for summertime datasets since was generally low, and for wintertime datasets where higher concentrations were observed. Thermodynamic analyses of both datasets indicate highly acidic aerosols with an average pH ∼1 (Guo et al., 2015, 2016). At these pH levels, aerosol sulfate can be in the partially deprotonated form of instead of . For example, 10 % of the total sulfate is predicted to be for the SOAS condition (see Fig. S1 in the Supplement). Free-form H2SO4, which requires even lower pH, is rare. To avoid any confusion, we note that in this study refers to the sum of total aqueous aerosol sulfate (, , and H2SO4), i.e., S(VI). Similarly, refers to the sum of total aqueous ammonium (, NH3) and refers to the sum of total nitrate (, HNO3) in aqueous aerosols. , , and are reported by PILS-IC. However, PILS-IC cannot distinguish the in situ aerosol ion forms for collecting aerosols in diluted deionized water (i.e., the ionic strength is altered) (Orsini et al., 2003). The AMS vaporizes aerosols and ionizes non-refractory species with a 70 eV electron impact ionization and also cannot distinguish the dissociation states of inorganic ions (DeCarlo et al., 2006).
In addition to the SOAS and WINTER datasets, the Southeastern Aerosol Research and Characterization (SEARCH) CTR sampling site (the same as SOAS) historical data from year 1998 to 2013 are reanalyzed to show that the thermodynamic model can reproduce the observed decreasing trend of when NVCs are considered. Molar ratios determined from the Chemical Speciation Network (CSN), which were utilized and discussed by Silvern et al. (2017) and Pye et al. (2018), are not used in this work because of a significant low bias when compared to the SEARCH and SOAS data (see Table S1 and S2 in the Supplement). The discrepancy is likely due to the loss of semivolatile collected on the CSN nylon filters (Yu et al., 2006; Silvern et al., 2017) and can result in an underestimation or under-measurement in R, compared to online measurements, by as much as 1 unit (Table S1). Other than the tentative explanation that sulfate aerosols are coated by organic material, Silvern et al. (2017) found that NVCs would modify R on average by 0.11 for the ensemble of CSN sites and NVC concentrations were too low to significantly affect the charge balance, as previously shown by Kim et al. (2015). Therefore, NVCs could not explain the overprediction of R by the thermodynamic model due to the large low bias of CSN R shown above. In contrast, this study investigates the effects of NVCs by three datasets, including SOAS, WINTER, and SEARCH, and concludes the importance of NVCs in accurately predicting ammonium-sulfate molar ratios.
2.2.1 Thermodynamic analysis of observations
We have used the thermodynamic model ISORROPIA II (Fountoukis and Nenes, 2007) to determine the liquid water content and composition (including H+) of an –––Cl−–Na+–Ca2+–K+–Mg2+–water inorganic aerosol (or a subset therein) and its partitioning with corresponding gases. A molality-based definition of pH is used:
where is the hydronium ion activity coefficient (assumed = 1; note that the binary activity coefficients of ionic pairs, including H+, are calculated in the model), and (mol kg−1) and (µg m−3) are the hydronium ion concentration in particle liquid water and volume of air, respectively. Wi and Wo (µg m−3) are particle water concentrations associated with inorganic and organic species, respectively. The pH predicted solely with Wi is systematically lower by 0.15–0.23 units but highly correlated (r2=0.97) to pH predicted with measured total particle water (Wi+Wo) for the southeast US (which includes the SOAS study), where Wo accounted for 35 % of total particle water (Guo et al., 2015). For simplicity, we therefore use only Wi for the following pH calculations. ISORROPIA II was run in forward mode to calculate gas–particle equilibrium concentrations based on the input of total concentration of various inorganic species (e.g., NH3 + ). In all cases we also chose a metastable (not stable) solution, which assumes inorganic ions are associated with the aerosol components that are completely aqueous and contain no solid precipitate forms, other than CaSO4 ( is meaningless in a completely effloresced aerosol). Given this phase state requirement, we restrict the analysis to conditions where RH >40 %.
2.2.2 Mixing state
Because the aerosol composition data are bulk PM1 or PM2.5, and used as input to ISORROPIA II, the thermodynamic analysis implicitly assumes that all particle species were internally mixed, so that one value of pH represents the aerosols and governs the gas–particle partitioning. The existence of externally mixed particles may quantitatively and qualitatively affect the bulk thermodynamic analysis. To address this, we begin from the bulk analysis, then repeat the same calculation, augmenting each time the degree of external mixture of NVCs and sulfate. Direct measurements of aerosol mixing state during SOAS suggest that ambient particles indeed exhibit a range of mixing states (Bondy et al., 2018). In the external mixing analysis, the bulk aerosol is split into two subgroups: (1) species largely found in PM1 (e.g., and ) and (2) species found in PM1−2.5, which contains mostly the NVCs, , and some and . These two external mixtures are in equilibrium with gaseous NH3 and HNO3 and so interact through these species (i.e., and can move between the two). Nonvolatile species, such as and NVCs (Na+), remain in the original size class assumed at the start of the analysis. To determine the composition of the two subgroups, we iteratively solve for the equilibrium conditions, by sequentially calling ISORROPIA for each subgroup. The solution is found when the composition of each group no longer changes with iteration and both are in equilibrium with the gas-phase species (in this case, NH3, HNO3, and H2O (water vapor)). The mass of each species (gas plus particle) is conserved at all times and constrained by the observations. Given that pH is size dependent and generally higher at larger sizes (Fridlind and Jacobson, 2000; Young et al., 2013; Bougiatioti et al., 2016; Fang et al., 2017), bulk pH is compared against an aerosol liquid water-weighted pH:
3.1 NVCs cause discrepancy in molar ratio (R) predictions
3.1.1 SOAS dataset
We first investigate the issue of R discrepancy using PILS-IC PM2.5 data from a 12-day period of the SOAS campaign. To test the sensitivity of ISORROPIA predictions to the level of NVCs, we ran the model with three different Na+ concentration inputs, with all other inputs remaining the same, including total ammonium (NHx = + NH3), , , and Cl−. Ca2+, Mg2+, and K+ inputs were set to zero as they were mostly below detection limits. Three sets of Na+ input concentrations were tested: (1) measured PM2.5 Na+ from PILS-IC, including data below the LOD (data below LOD are clearly identified in the plots); (2) Na+ determined from an ion charge balance, Na+ = + + Cl− − (unit: nmol m−3), hereafter referred to as “inferred NVCs”; and (3) Na+ =0, which corresponds to ignoring NVCs all together.
The LOD of PILS-IC Na+ was 0.07 µg m−3, which is close to the average Na+ concentration for the whole observation time-series. In the following, Na+ data below the LOD are used in the analysis. Although in most studies data below LOD are excluded, here we include them to allow a continuum in the analysis down to zero NVCs. There is no obvious discontinuity in the results for data above and below the Na+ LOD (e.g., see Figs. 1 and 4) and Na+ below the PILS LOD still roughly agrees with MARGA measurements of Na+, which has a lower LOD (see Fig. S2a in the Supplement).
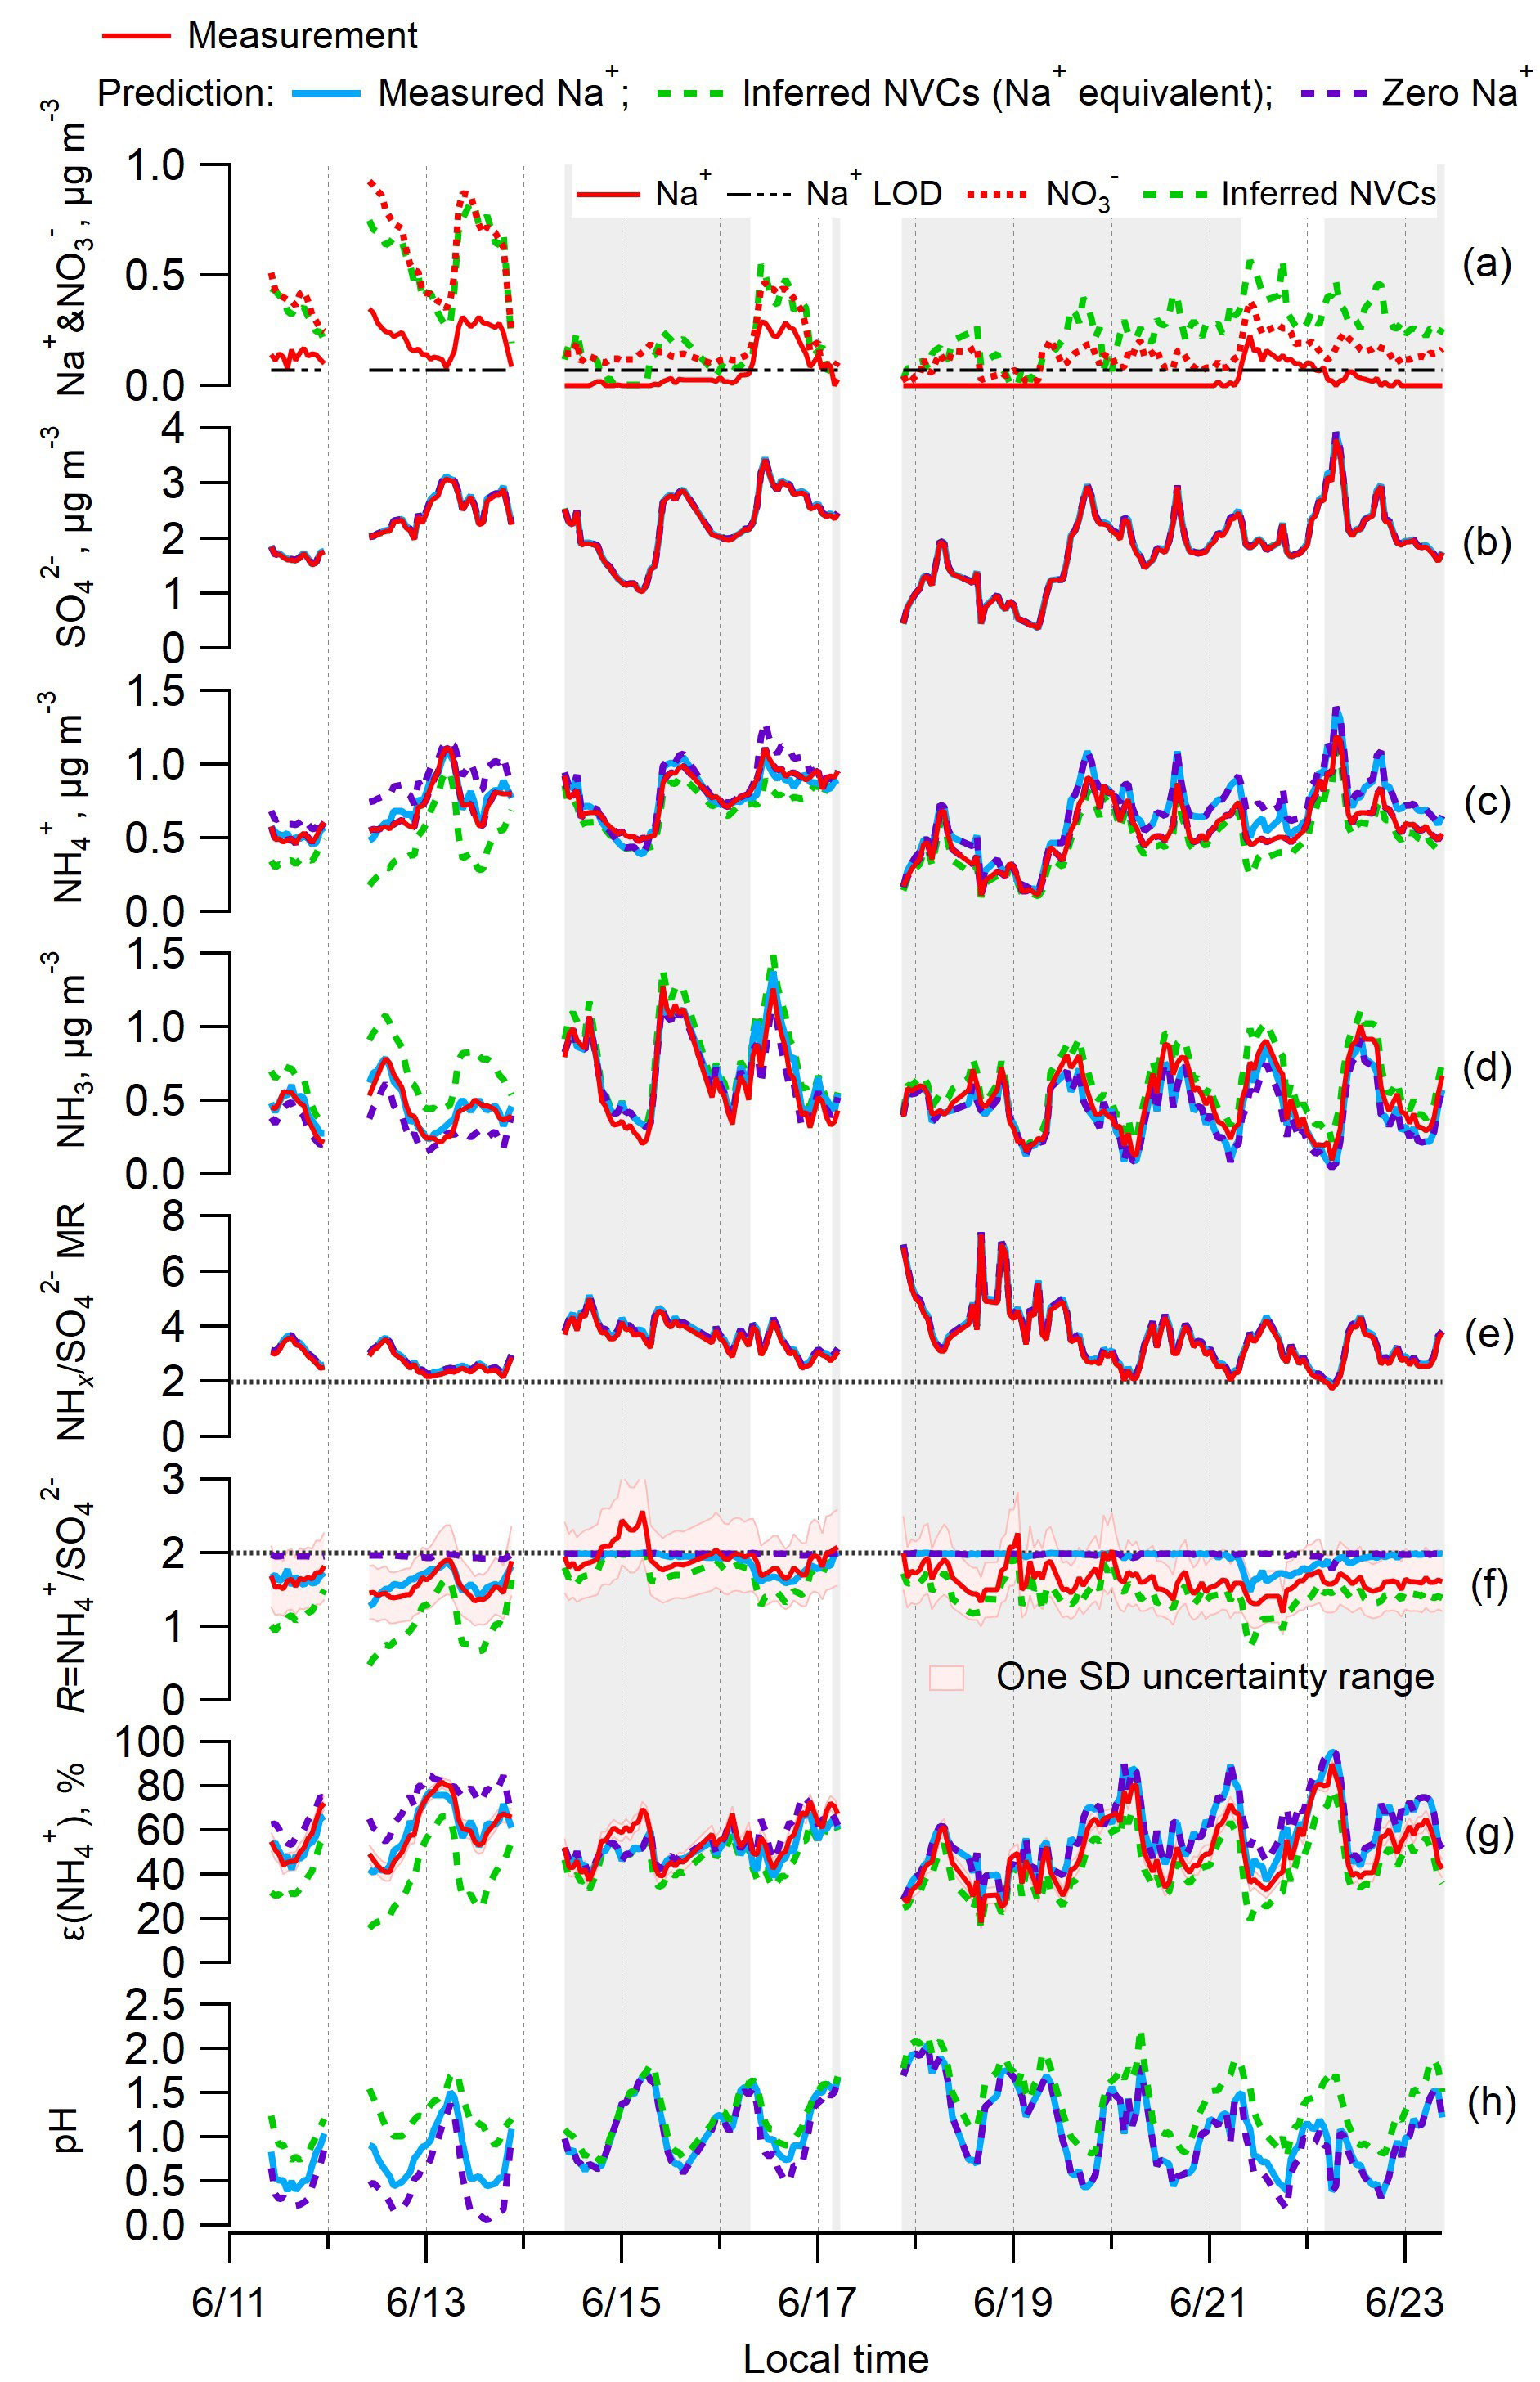
Figure 1Time series of various measured and ISORROPIA-predicted parameters and PM2.5 component concentrations for the SOAS study. Specific plots are as follows: (a) Na+ and ; (b) ; (c) ; (d) NH3; (e) total ammonium (NHx = + NH3) to sulfate molar ratio (); (f) ammonium-sulfate ratio (R= ); (g) particle-phase fractions of total ammonium, ε(); and (h) particle pH. ISORROPIA-predicted results for the base case and three different Na+ inputs are shown: measured Na+ in blue, inferred nonvolatile cations (NVCs) from an ion charge balance (where the overall NVCs are represented here by Na+; Na+ = + + Cl− − , µmol m−3) in green, and zero Na+ in purple. The periods with measured Na+ below LOD are marked with grey backgrounds.
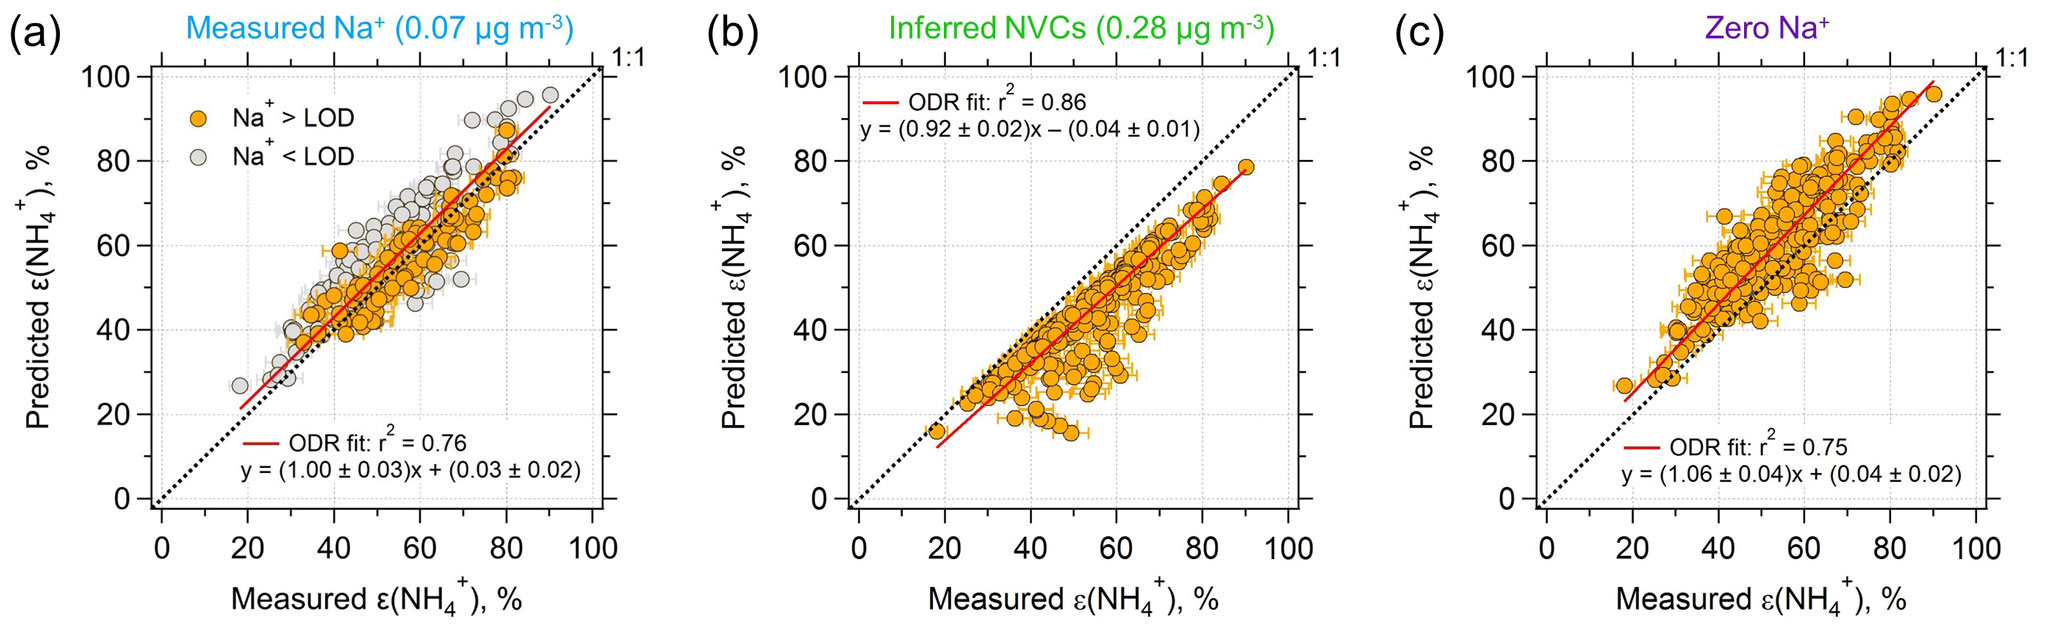
Figure 2Comparisons of predicted and measured particle-phase fractions of total ammonium, ε() = . (a) The model prediction is based on an ISORROPIA input of measured Na+, NHx, , , and Cl−. (b) Same model input, but NVCs (represented by Na+) are inferred from an ion charge balance and (c) Na+ is set to zero. Orthogonal distance regression (ODR) fits are shown and uncertainties in the fits are 1 standard deviation (SD) (the ODR fit in a is based on all the data points). The uncertainty of measured ε() is derived from error propagation of (20 %) and NH3 (6.8 %) measurements. The best agreement is achieved by using measured Na+ as input.
The inferred NVCs, determined from the charge balance, provide an upper limit of the NVC equivalents that can affect aerosol pH and satisfy solution electroneutrality. Overall, Na+ is chosen as a proxy NVC in our dataset because in this case it constitutes most of the NVC mass and does not precipitate out of solution. The choice of Na+ as a NVC proxy, although appropriate here, may not be generally applicable, such as in regions with considerable dust contributions, as treating NVC as “equivalent Na+” in the thermodynamic calculations can result in large prediction errors (e.g., Fountoukis et al., 2009). Inferred NVCs have an expected high uncertainty due to error propagation of , , , and Cl− measurements (see Fig. S2b), and uncertainties in the dissociation state of sulfate (see Fig. S1 for the pH dependence). The concentration of H+ is ignored in the ion charge balance calculation for inferred NVCs, since H+ is at least an order of magnitude lower than the NVC ion equivalents, even for these very low pH data points (between 0 and 2). To demonstrate this, the average ion molar concentrations in PM2.5 were =35.4, =21.1, =3.7, Na+ =2.9, and Cl− =0.82 nmol m−3 by PILS-IC, compared to ISORROPIA-predicted H+ =0.31 nmol m−3. For the three datasets used in this study, the difference in Na+ predicted from an ion balance without considering H+ compared to including H+ is less than 1 % for SOAS and SEARCH CTR and 6 % for the WINTER study (see Fig. S3 in the Supplement). In the following, we have not included H+ in the ion balance. In SOAS, inferred NVCs are generally above zero, indicating a cation deficiency, but 8 out of 229 points (3 % of the data) were slightly below zero. In these cases, a small positive value of 0.005 µg m−3 was assigned to inferred NVCs. Including these data has no effect on the results because the observed R was ∼2. Figure 1a shows that the inferred NVCs were always higher than the measured Na+. The inferred NVCs from PILS and MARGA generally agree with each other and also agree with the total NVCs from MARGA measurements before 18 June, suggesting that the magnitude of inferred NVCs is reasonable (see Fig. S2). The larger differences after 18 June are likely from difficulties in detecting NVCs in low concentrations.
The SOAS study period investigated here includes an episode of high Na+ associated with a sea-salt (NaCl) aerosol event (Fig. 1a). This provided an opportunity to assess the role of NVCs on pH when concentrations were substantially above LOD. The observed Na+ is mainly associated with (Fig. 1a) and to a lesser degree with Cl−. These ions are highly correlated (Na+– r2=0.82 and Na+–Cl− r2=0.64) and indicate some level of chloride depletion as the observed ratio was 0.24±0.16 (mol mol−1) (mean ± SD), whereas fresh sea salts would have a molar ratio close to 1 (Tang et al., 1997). Chloride depletion occurs when an acid, such as HNO3, is mixed with NaCl, producing HCl that evaporates owing to its higher volatility relative to HNO3 (e.g., Katoshevski et al., 1999; Fountoukis and Nenes, 2007), resulting in a loss of aerosol Cl−. The chloride depletion in sea-salt aerosols during the SOAS study was discussed in detail by Bondy et al. (2017). Cl− concentrations were sufficiently small (0.03±0.04 µg m−3, LOD = 0.01 µg m−3) compared to the dominant and nonvolatile anion , and HCl was not included in the model input, so Cl− had negligible effect on ISORROPIA predictions of pH and molar ratios. Periods where Na+ was closer to typical background levels and near or below the LOD lead to similar conclusions in the following analysis.
Figure 1 shows the effect of Na+ on ISORROPIA-predicted , , NH3, R, and pH. Figure 1b and e show that measured and predicted and NHx are always identical. completely resides in the aerosol phase in all calculations. The model predicts the gas–particle partitioning by conserving NHx, so the discrepancy between modeled and measured R must result from variation in the model prediction of NHx partitioning. It is noteworthy that is practically always above 2, indicating excess NHx compared to . Under such conditions, conventional thought suggests that NH3 must completely neutralize sulfate so that it can be in the form of (Kim et al., 2015; Silvern et al., 2017); this view, however, neglects the large difference in volatility between and NHx, which thermodynamic models consider. Because of this, PM2.5 can remain highly acidic, with a pH between 0 and 2 (Fig. 1h), even if there is a large amount of excess NHx (Weber et al., 2016).
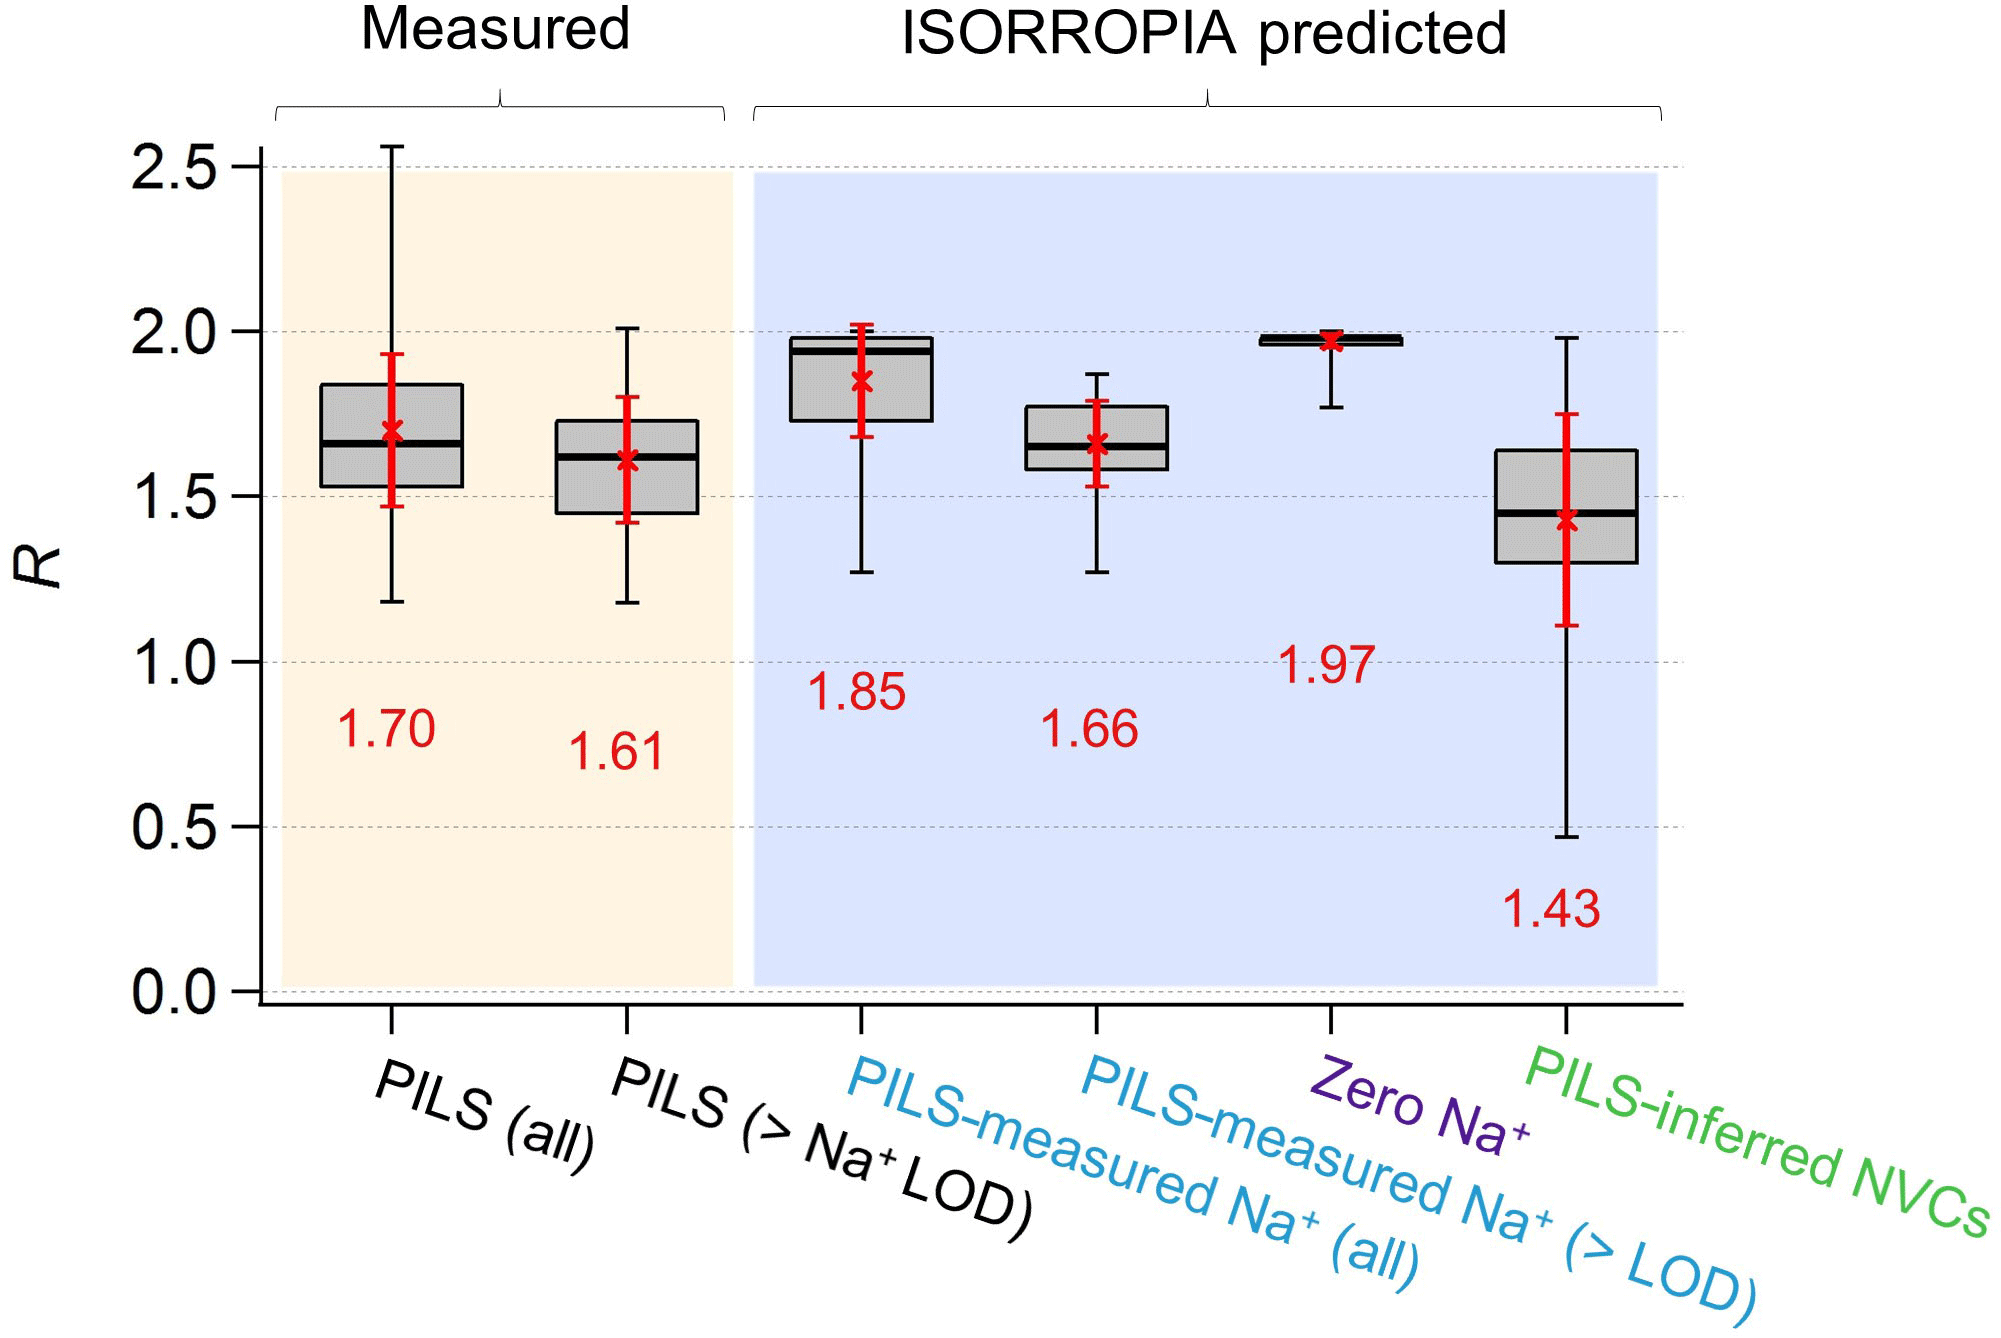
Figure 3Comparisons of PM2.5 ammonium-sulfate molar ratios (R) between measurements and ISORROPIA predictions for the base case but with differing Na+ inputs. Data are from the SOAS study. Red numbers are the means and red error bars are 1 SD. Standard box–whisker plots are shown, with 100 % and 0 % data indicated by black error bars. The top and bottom of the box are the interquartile ranges (75 % and 25 %) centered around the median value (50 %). Comparisons include all data and periods when measured Na+ > LOD of 0.07 µg m−3.
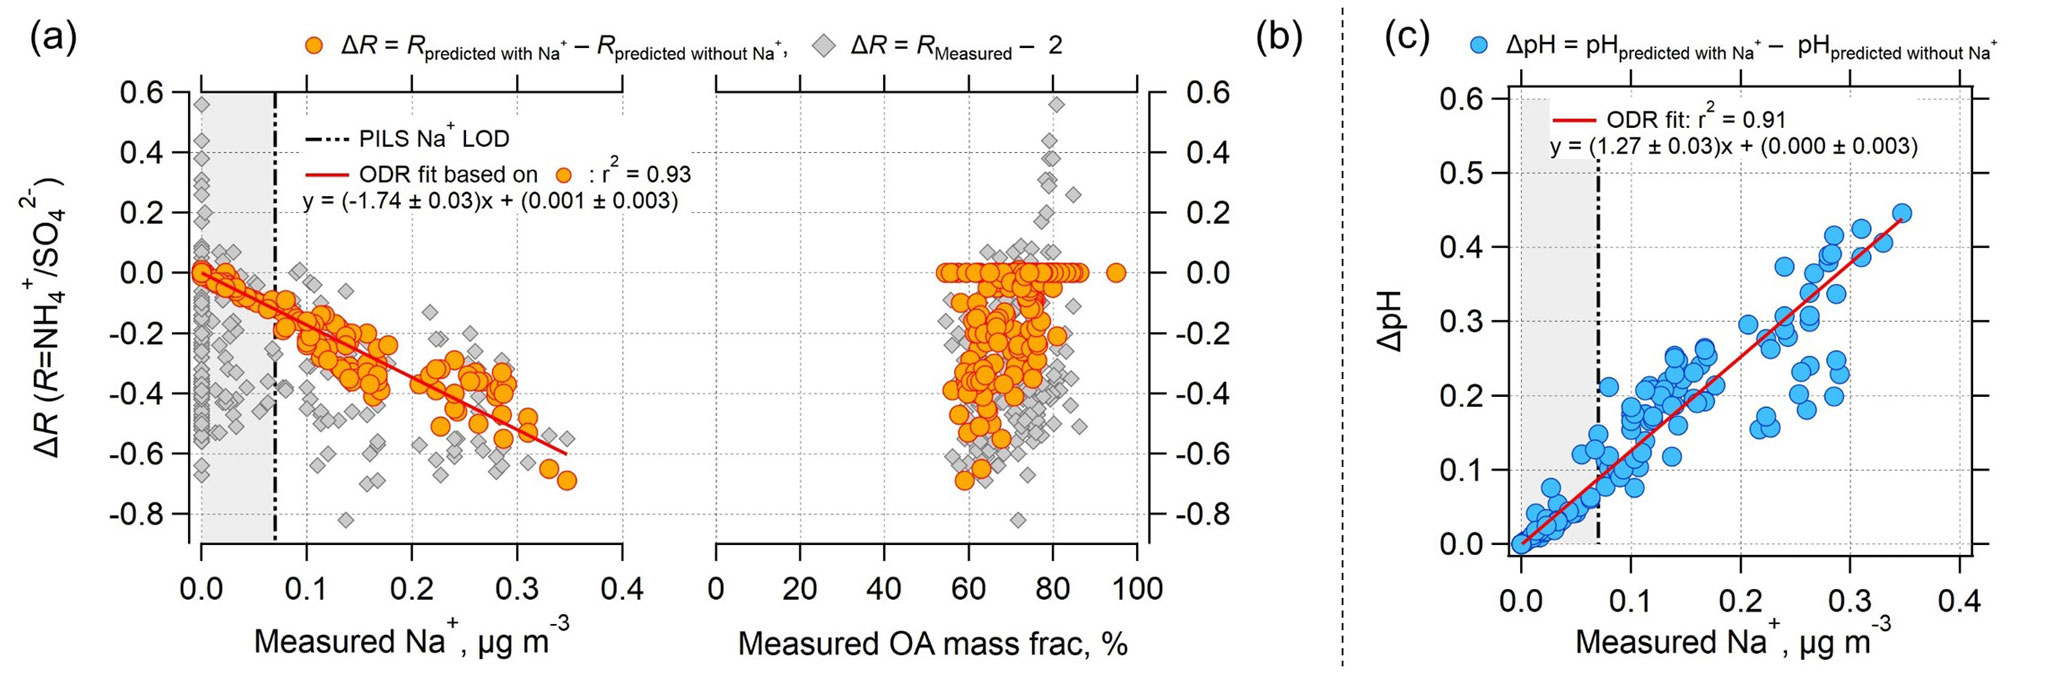
Figure 4Effect of nonvolatile cations (NVC) on the PM2.5 ammonium-sulfate molar ratios (R) and pH as a function of measured Na+ concentration and organic aerosol (OA) mass fractions for the SOAS dataset studied. Plot (a) is ΔR versus measured Na+, (b) is ΔR versus measured OA mass fraction (OA mass divided by total particle mass reported from AMS), and (c) is ΔpH versus measured Na+. Grey diamonds in plots (a) and (b) are for ΔR equal to the measured R minus 2. Orange circular points are for ΔR equal to ISORROPIA-predicted R with measured Na+ included in the model input minus ISORROPIA-predicted R without Na+ in the model input. ΔpH in plot (c) is determined in a similar way. ΔR is negative since including Na+ in the thermodynamic model results in an R lower than 2, whereas not including Na+ results in an R close to 2 (see Fig. 3). ODR fits are shown and uncertainties in the fits are 1 standard deviation. A plot similar to (b), but versus OA mass concentration can be found as Fig. S6. The vertical dotted line is the Na+ LOD of 0.07 µg m−3. Regions where Na+ is below LOD are marked with grey backgrounds.
Comparing measured to ISORROPIA-predicted NH3– partitioning (particle-phase fraction of total ammonium, ε() = ) can be used to test the sensitivity to NVC input concentrations. Figures 1g and 2a show very good agreement between measured and observed NH3– partitioning when measured Na+ is used in the model. Using inferred NVCs generally results in an underestimation of ε(). This is consistent with using overestimated NVC levels – as the resulting pH is overestimated (Fig. 1h), which in turn shifts a fraction of the to gas-phase NH3 and biases ε() low. Zero Na+ shows the opposite behavior (Figs. 1g and 2c); ε() is overpredicted because neglecting NVCs biases pH low, driving more NH3 to the particle phase and biasing ε() high.
From the above it is clear that R strongly depends on how NVCs are considered in the thermodynamic analysis. Figure 1f shows the time series comparison between R for various Na+ levels included in the ISORROPIA input. Figure 3 shows the summary statistics for various comparisons of R. For the SOAS analyzed time period, the predicted R using measured Na+ was on average 1.85±0.17. As expected, predicted R was significantly lower when inferred NVCs were used (mean ) and highest for zero NVC (average ) in the thermodynamic analysis (see Figs. 1f and 3). The average measured R was 1.70±0.23 for all PILS data and 1.61±0.19 excluding the points with Na+ below LOD. The MARGA-derived R is very similar, with measured for all data and 1.65±0.15 for periods when PILS Na+ was above LOD (see Figs. S4 and S5 in the Supplement). Note that CSN data used by other investigators (Silvern et al., 2017; Pye et al., 2018) have a much lower R (Table S1 and S2 in the Supplement) due to a known ammonium sampling artifact (Yu et al., 2006) that cannot be accounted for, and so the dataset cannot be used in this analysis. Together, the analysis shows that (1) when NVCs are well constrained by measurements, predicted R is in close agreement with measured R (t test at α=0.05 confirms no statistical difference); (2) using inferred NVCs overestimates NVC and biases R low; however, the trend in predicted R generally follows measured R (see Fig. 1f), which argues that inferred NVCs can be a useful upper limit in NVC concentrations, when not constrained by measurements; (3) when NVC levels are zero, ISORROPIA predicts R∼2, which is a consequence of having the maximum possible condensation of NH3 to the aerosol. Even if R∼2, however, the aerosol continues to remain strongly acidic.
3.1.2 Sensitivity of R and pH to NVCs and organic species
The results until now have clearly shown that the difference between predicted and observed R for this dataset is affected by the levels of NVC. However, it is important to assess whether organic species are associated with changes in the partitioning of semivolatile inorganics and aerosol acidity (Pye et al., 2018) or other unaccounted-for effects that drive the discrepancy between observed and predicted R. To avoid any cross correlations between organics and NVC variations, we examine how the discrepancy between observed R and its theoretical limit of 2 (corresponding to when NVC =0) correlates with organic aerosol. The results in Fig. 4 clearly suggest that increases with measured Na+ but does not depend on OA mass fraction (gray points) or OA concentration (see Fig. S6 in the Supplement). This suggests that ΔR is not driven by organic aerosol effects, but instead a poor representation of NVCs in the thermodynamic model. Figure 4 also shows that ISORROPIA-predicted R also depends on Na+. Predicted R with Na+ in the model input minus predicted R without Na+ decreases with increasing measured Na+ and is remarkably correlated with Na+ concentration (orthogonal linear regression, ) Na+ + (0.001±0.003), r2=0.93). The decreasing trend in R with increasing Na+ can be explained simply by the pH increasing with Na+, as shown in Fig. 4c. With increasing pH, some shifts to the gas-phase NH3, resulting in lower and lower R.
From the regression slope, for the SOAS measurement period analyzed, an average measured Na+ level of 0.07 µg m−3 (very small NVC concentrations) decreases R by 0.12 units. For a Na+ level of 0.3 µg m−3, R decreases by 0.5 units, from R=2 (i.e., no NVC) to R=1.5 (i.e., with NVC). Thus, ΔR is highly correlated and sensitive to Na+, both of which are not seen for the organic aerosol mass fraction. Mass fraction can be used as a proxy for organic film thickness too, given that the maximum possible thickness (and delay) associated with an organic film scales with (organic volume)1∕3 or (organic mass)1∕3.
In comparison to R, pH is less sensitive to inclusion of Na+, or other NVCs in general. ΔpH is only 0.09 for the average Na+ level of 0.07 µg m−3 and increases to 0.38 at 0.3 µg m−3 Na+ (Fig. 4b). The magnitude of ΔpH is relatively small and consistent with our previous studies where we investigated the effects of sea salt on pH (Guo et al., 2016; Weber et al., 2016). ΔpH would be higher in regions with more abundant NVC. For instance, a ΔpH unit of 0.8 was found in Pasadena, CA, where the average PM2.5 Na+ mass was 0.77 µg m−3 (Guo et al., 2017). Differences in sensitivity of R and pH to Na+ from the slope of the linear regressions (Fig. 4c) are 1.74 (ΔR − Na+ slope) and 1.2 (ΔpH − Na+), respectively. NVC effects on R and pH are studied next for a very different aerosol dataset.
3.1.3 WINTER dataset
The R discrepancy is investigated for a different season and a larger and different region by repeating the analysis using the WINTER study dataset collected from the NSF C-130 research aircraft during wintertime. The aerosol inorganic composition data used in the analysis are from an AMS and are PM1. In this study, NVCs were generally higher than those measured during SOAS, especially when the aircraft sampled near coastlines (e.g., PM1 Na+ =0.23 µg m−3). Also, PM1 nitrate was comparable to sulfate, largely owing to lower temperatures ( 13 nmol m−3 vs. 11 nmol m−3) (Guo et al., 2016). Therefore, was calculated instead of R.
The base case input to ISORROPIA II in this analysis included , , and total nitrate ( + HNO3). (NH3 should be included to determine NHx for input, but was not measured. It was found to have a small effect on predicted pH; e.g., ∼0.2 higher pH when including an NH3 concentration of 0.10 µg m−3, typical of the eastern US levels, and estimated from an order-of-magnitude iteration method, Guo et al., 2016). Figure 5a shows that ISORROPIA overpredicted for the base case (i.e., when cations are not included) and that this deviation increases as molar ratios approach 2 when inferred NVCs are smaller. Again, NVC concentrations were determined as NVCs = Na+ = + − (unit: nmol m−3), where all NVCs are assumed to be Na+. (Note that the predicted should be biased low since was underpredicted due to lack of NH3 data, resulting in some fraction of input particle-phase repartitioned in the model to the gas phase; thus the deviation is even worse than shown). Figure 5a shows that is highly sensitive to a lack of inclusion of NVCs when their concentrations are very low. However, when concentrations of NVC reach zero, predicted and measured converge to the expected value of 2 (dark blue symbols in Fig. 5a). Interestingly, as predicted NVCs increase, predicted and measured converge to zero, because NVCs progressively dominate the cations, and force to evaporate. On average, predicted was 1.68±0.51 versus the measured value of 1.47±0.43.
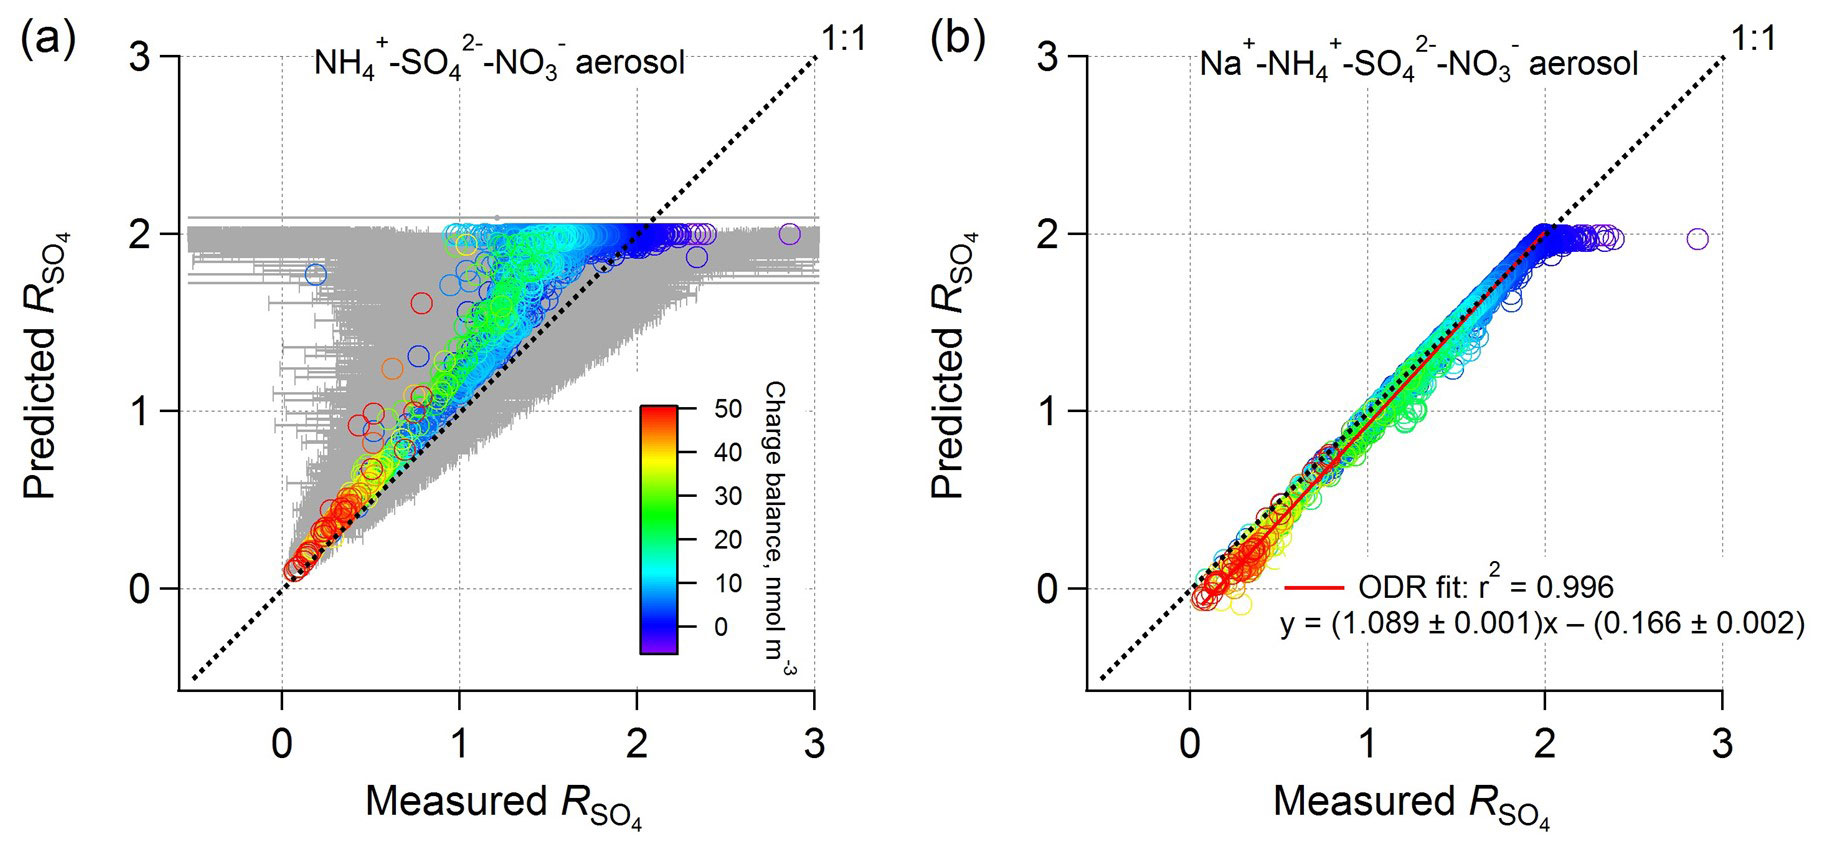
Figure 5Comparison between PM1 ISORROPIA-predicted and AMS-measured ( ( − ) (mol mol−1), where the ISORROPIA prediction is based on (a) , , and aerosol and (b) Na+, , , and aerosol, and both include HNO3 to calculate total nitrate for the model input. All measurement data are from the WINTER study. NVCs were determined by an ion charge balance with the predicted molar concentration shown by symbol color. Error bars were determined by propagated uncertainties for based on a 35 % AMS measurement uncertainty for , , and (Bahreini et al., 2009). Error bars are larger at higher ratios due to subtraction of higher concentrations of nitrate and so subject to greater measurement error. Data points with low levels (<0.2 µg m−3; 9 % of the total points) were excluded due to high uncertainties.
In contrast to ISORROPIA-predicted without NVCs, including NVCs (inferred NVCs) brings predicted and measured ammonium-sulfate molar ratios into agreement (Fig. 5b). Including or excluding H+ in the Na+ calculation produces similar results (Fig. S7). Findings based on other NVCs are shown in Fig. S8 in the Supplement. K+ and Mg2+ work similarly to Na+, while Ca2+ can precipitate sulfate in the form of CaSO4 and so cannot be used. For Na+, the linear regression result is , r2=0.996. As found for the SOAS dataset, again, the molar ratio bias from the thermodynamic model appears to result from not including small amounts of NVC (e.g., in this case on average 0.15 µg m−3 Na+ or 0.26 µg m−3 K+). The average amount of inferred PM1 Na+ from the ion charge balance was 0.15 µg m−3 – in this case smaller than what was measured offline, 0.23 µg m−3 (Guo et al., 2016) (in comparison, inferred NVCs are higher than the measured Na+ in the SOAS case). The analysis using measured PM1 Na+ results in highly scattered data due to the high sensitivities of to NVC and the significant Na+ measurement uncertainty at these low levels given the analytical sampling method used in this study (i.e., offline analysis).
3.2 Implications of not including NVC on predicting gas–particle partitioning and historical trends in molar ratios
3.2.1 Sensitivity of semivolatile species partitioning to NVCs
In our datasets, inferred NVCs group all NVCs, including K+ and Mg2+, into one species and are the upper limits of the NVCs based on the assumption of complete dissociation of all dissolved ionic species. For example, 10 % of the total sulfate is predicted to be and the rest as for the SOAS average pH ∼1 (see Fig. S1). Additional errors can occur if other ions are also missing, but this approach satisfies electroneutrality. Comparing ISORROPIA predictions that include the other major species, an inferred NVC input versus Na+ =0 input results in an average increase in pH by 0.32 for SOAS and 0.49 for WINTER. Even though the effect of NVC on pH may appear relatively small, the impact on predicted partitioning of a semivolatile species can be significant due to the highly nonlinear response of NH3– or HNO3– partitioning to pH (i.e., S curve). For example, as shown in Fig. S9 in the Supplement, a 0.3 unit pH bias in SOAS campaign could cause (i) ∼20 % bias in ε() or ε() prediction when ε() or ε() =50 % or (ii) no bias at all when the species are completely in one phase – ε() or ε() =0 % or 100 %. For the WINTER study, a 0.5 pH bias causes up to 30 % bias in ε() or ε(). These partitioning biases may constitute a significant source of bias for aerosol nitrate formation, especially if the total nitrate present in the gas–aerosol system is significant. In fact, the bias from the NVC may completely change the predicted response of nitrate to aerosol emissions and lead to errors in the predicted vs. observed trends in pH, such as was seen in the southeastern US (Vasilakos et al., 2018).
3.2.2 Effect of NVCs in trends in pH and in the southeastern US
The organic aerosol impact on NH3 equilibration (Silvern et al., 2017) was postulated to address the decreasing trend in R in the southeastern US despite the substantial drop in sulfate. Weber et al. (2016) also noted this and proposed that it could be explained by volatility. However, the thermodynamic model predictions of in that study did not find a comparable decreasing rate with time (see Fig. 6a), since the SOAS study mean PILS-IC Na+ concentration of 0.03 µg m−3 was applied to all historical data. With this constant input of 0.03 µg m−3, predicted was nearly constant at ∼2 for the input range (Fig. 6a) and would only rapidly decrease below 1 µg m−3 (See Fig. 2b in Weber et al., 2016). Repeating the calculations using Na+ inferred from the ion charge balance of Na+–––, determined for each daily data point in the historical dataset, results in good agreement between observed and ISORROPIA-predicted (Figs. 6 and S10). It also predicts a decreasing rate of −0.017 yr−1, which is fairly close to the measured rate at the SOAS site (Centreville, AL) of −0.021 yr−1 (see Fig. 6a) and in the range of the trend of −0.01 to −0.03 yr−1 reported by Hidy et al. (2014) for the SEARCH sites throughout the southeast. In contrast, using these different Na+ input concentrations did not change the trends in ISORROPIA-predicted pH; in both cases, it remained relatively constant (Fig. 6b), but as expected the pH was slightly higher with higher input Na+ concentrations. Thus, including daily estimates of NVC in ISORROPIA, the conclusion that PM2.5 pH has remained largely constant over the last 15 years remains, but the unexpected decreasing trend can be accounted for only with including NVC effects and volatility. These observations can all be explained by volatility of (Weber et al., 2016), without the need to invoke organic effects on the ammonia partitioning.
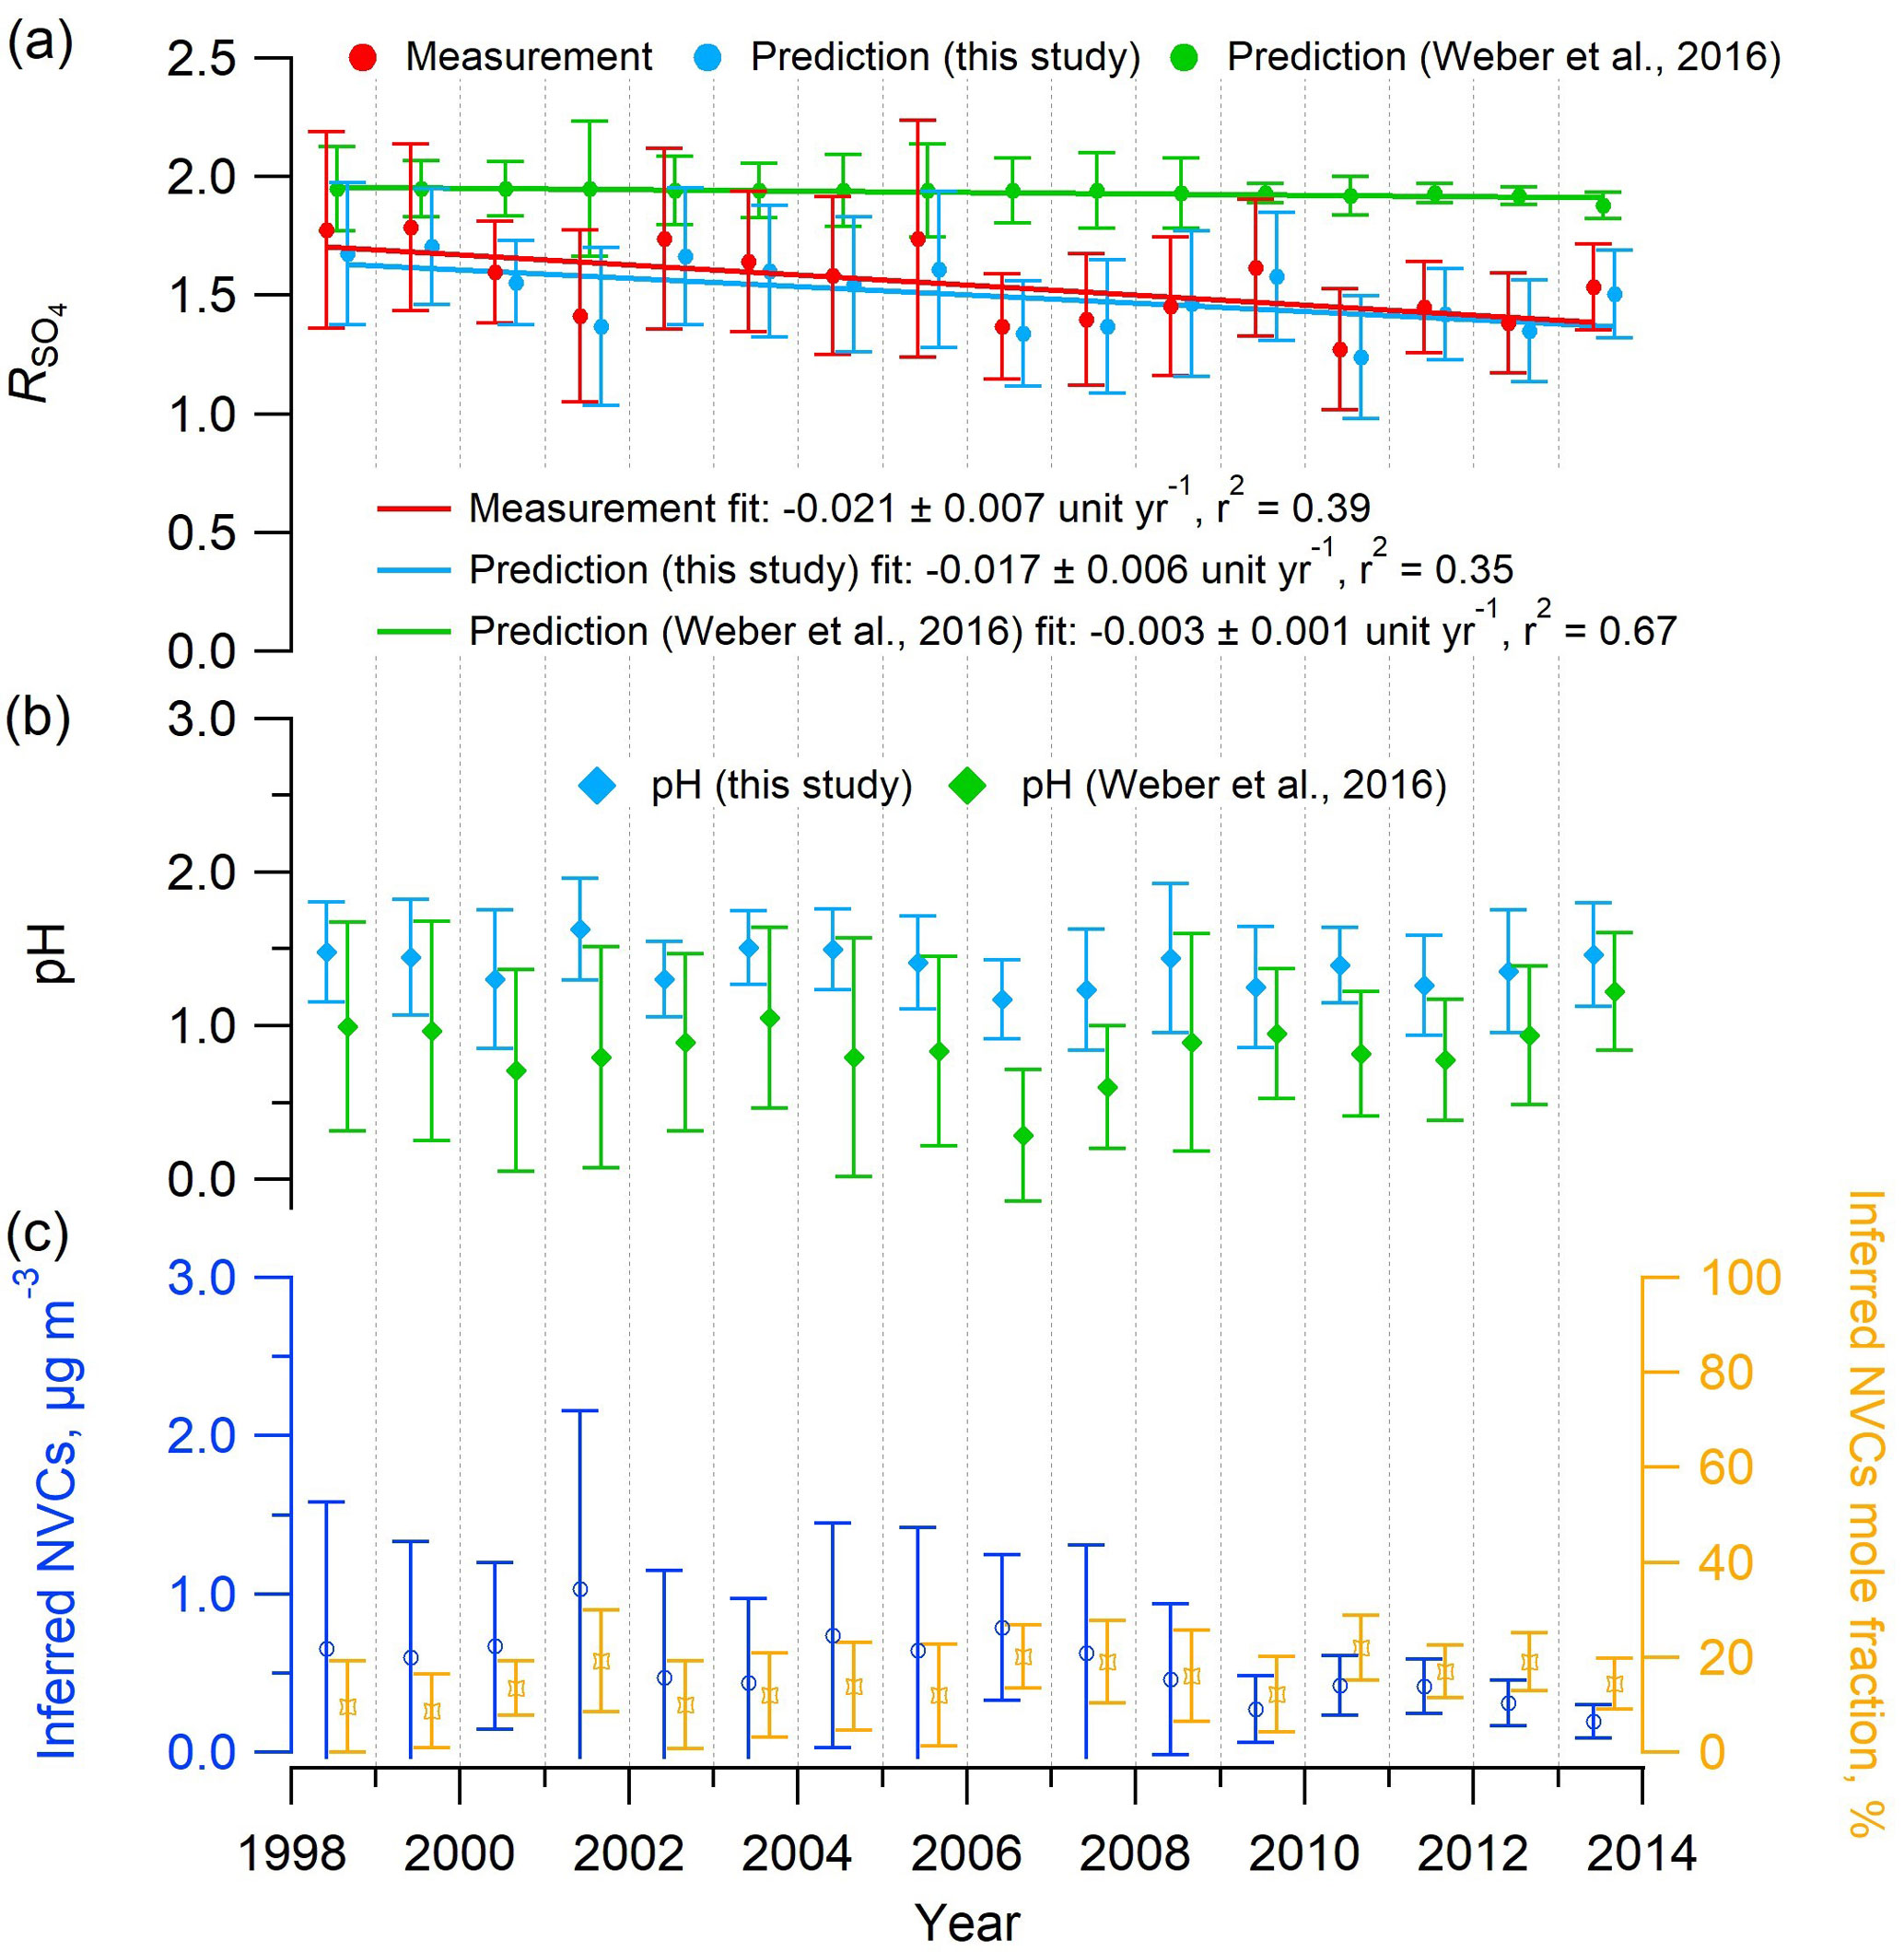
Figure 6Mean summer (June–August) trends in (a) measured and predicted , (b) predicted PM2.5 pH, and (c) inferred NVCs concentration and mole fraction at the SEARCH CTR site. Na+ was inferred from an ion charge balance of Na+–––. ISORROPIA inputs include the measured PM2.5 composition (, , ) and meteorological data (RH, T) at CTR. In all cases, and pH were estimated with ISORROPIA II run in forward mode with an assumed NH3 level of 0.36 µg m−3, which is the mean concentration from the SOAS study (CTR site, summer 2013), due to limited NH3 data before 2008. Historical NH3 mean summer concentrations at CTR were 0.2 µg m−3 (2004–2007) (Blanchard et al., 2013) and 0.23±0.14 µg m−3 (2008–2013) (Weber et al., 2016). Error bars represent daily data ranges (SD). Linear regression fits are shown and uncertainties in the fits are 1 SD. A total of 41 data points out of 609 (7 %) with observed daily mean above 3 were considered outliers and not shown (if included the fit slope is unit yr−1).
4.1 Internal vs. external mixtures
Our thermodynamic analysis up to this point has been based on the assumption that all ions were internally mixed (e.g., bulk PM2.5 or PM1). Although over time gas–particle and particle–particle interactions will lead to complete internally mixed systems (Seinfeld and Pandis, 2016), aerosol near their source regions tend to be externally mixed. Typical ambient conditions can be expected to exist somewhere between these two extreme cases (Bondy et al., 2018) owing to chemistry, coagulation, cloud processing, dilution, and gas-to-particle mass transfer (Zaveri et al., 2010). We address this here by studying how the conclusions described above are affected by the degree of mixing of NVCs with sulfate – as the other species, being semivolatile, quickly equilibrate.
PM2.5 Na+, K+, Ca2+, and Mg2+ from sea salt (or dust) are often not well mixed with ammonium and sulfate because of their different sources and sizes. NVC from sea salt and dust are largely produced by mechanical means and so are mainly in the coarse mode, with a tail extending into the fine mode (Whitby, 1978). Biomass burning and biogenic K+ is emitted into the fine mode (Bougiatioti et al., 2018); however, ammonium and sulfate are formed through gas-phase processes and mostly reside in the accumulation mode (e.g., Whitby, 1978; Seinfeld and Pandis, 2016). For the SOAS PILS-IC dataset, and were highly correlated (r2=0.88), but and Na+ (r2=0.07) or and Na+ (r2=0.17) were not. In contrast, PM2.5 Na+ and (r2=0.82) or Na+ and Cl− (r2=0.64) were highly correlated, which is consistent with internal mixing of most Na+, , and Cl− ions, leading to the depletion of some Cl− through evaporation of HCl (e.g., Katoshevski et al., 1997; Seinfeld and Pandis, 2016). Rapid scavenging of HNO3 by sea-salt aerosols is well established (Hanisch and Crowley, 2001; Meskhidze et al., 2005), with equilibrating timescales of 3–10 h for HNO3 uptake by 1–3 µm sea spray aerosols (Meng and Seinfeld, 1996; Fridlind and Jacobson, 2000) and subsequent evaporation of HCl.
NVCs can also be associated with small amounts of sulfate. For example, sea-salt aerosols are largely composed of NaCl but also include sulfate, approximately 8 % (g g−1) of all ions (∼25 % mass ratio) (DOE, 1994). In addition, sulfur enrichment and chloride depletion in aged sea-salt aerosols are possible by uptake of H2SO4 or oxidation of dissolved SO2 by O3 (McInnes et al., 1994; O'Dowd et al., 1997). These secondary sulfates are normally referred as non-sea-salt sulfates, to be distinguished from sea-salt sulfate that is naturally in sea waters (Tang et al., 1997). Many studies have reported sulfate-containing sea-salt aerosols with some degree of internal mixing (Andreae et al., 1986; McInnes et al., 1994; Murphy et al., 1998; Laskin et al., 2002; Bondy et al., 2018). In summary, a realistic external mixing state of the SOAS fine particles is that most of and are in PM1, whereas Na+ with associated anions ( and Cl−) and at least small amounts of and are associated in PM1−2.5 (particles with sizes 1–2.5 µm). This is consistent with the single particle mixing state observations by Bondy et al. (2018) from the SOAS study. The interactions between aerosols with gases are illustrated in Fig. 7a. Particle size distributions measured in the southeast US also support these types of particle mixing state (Fang et al., 2017).
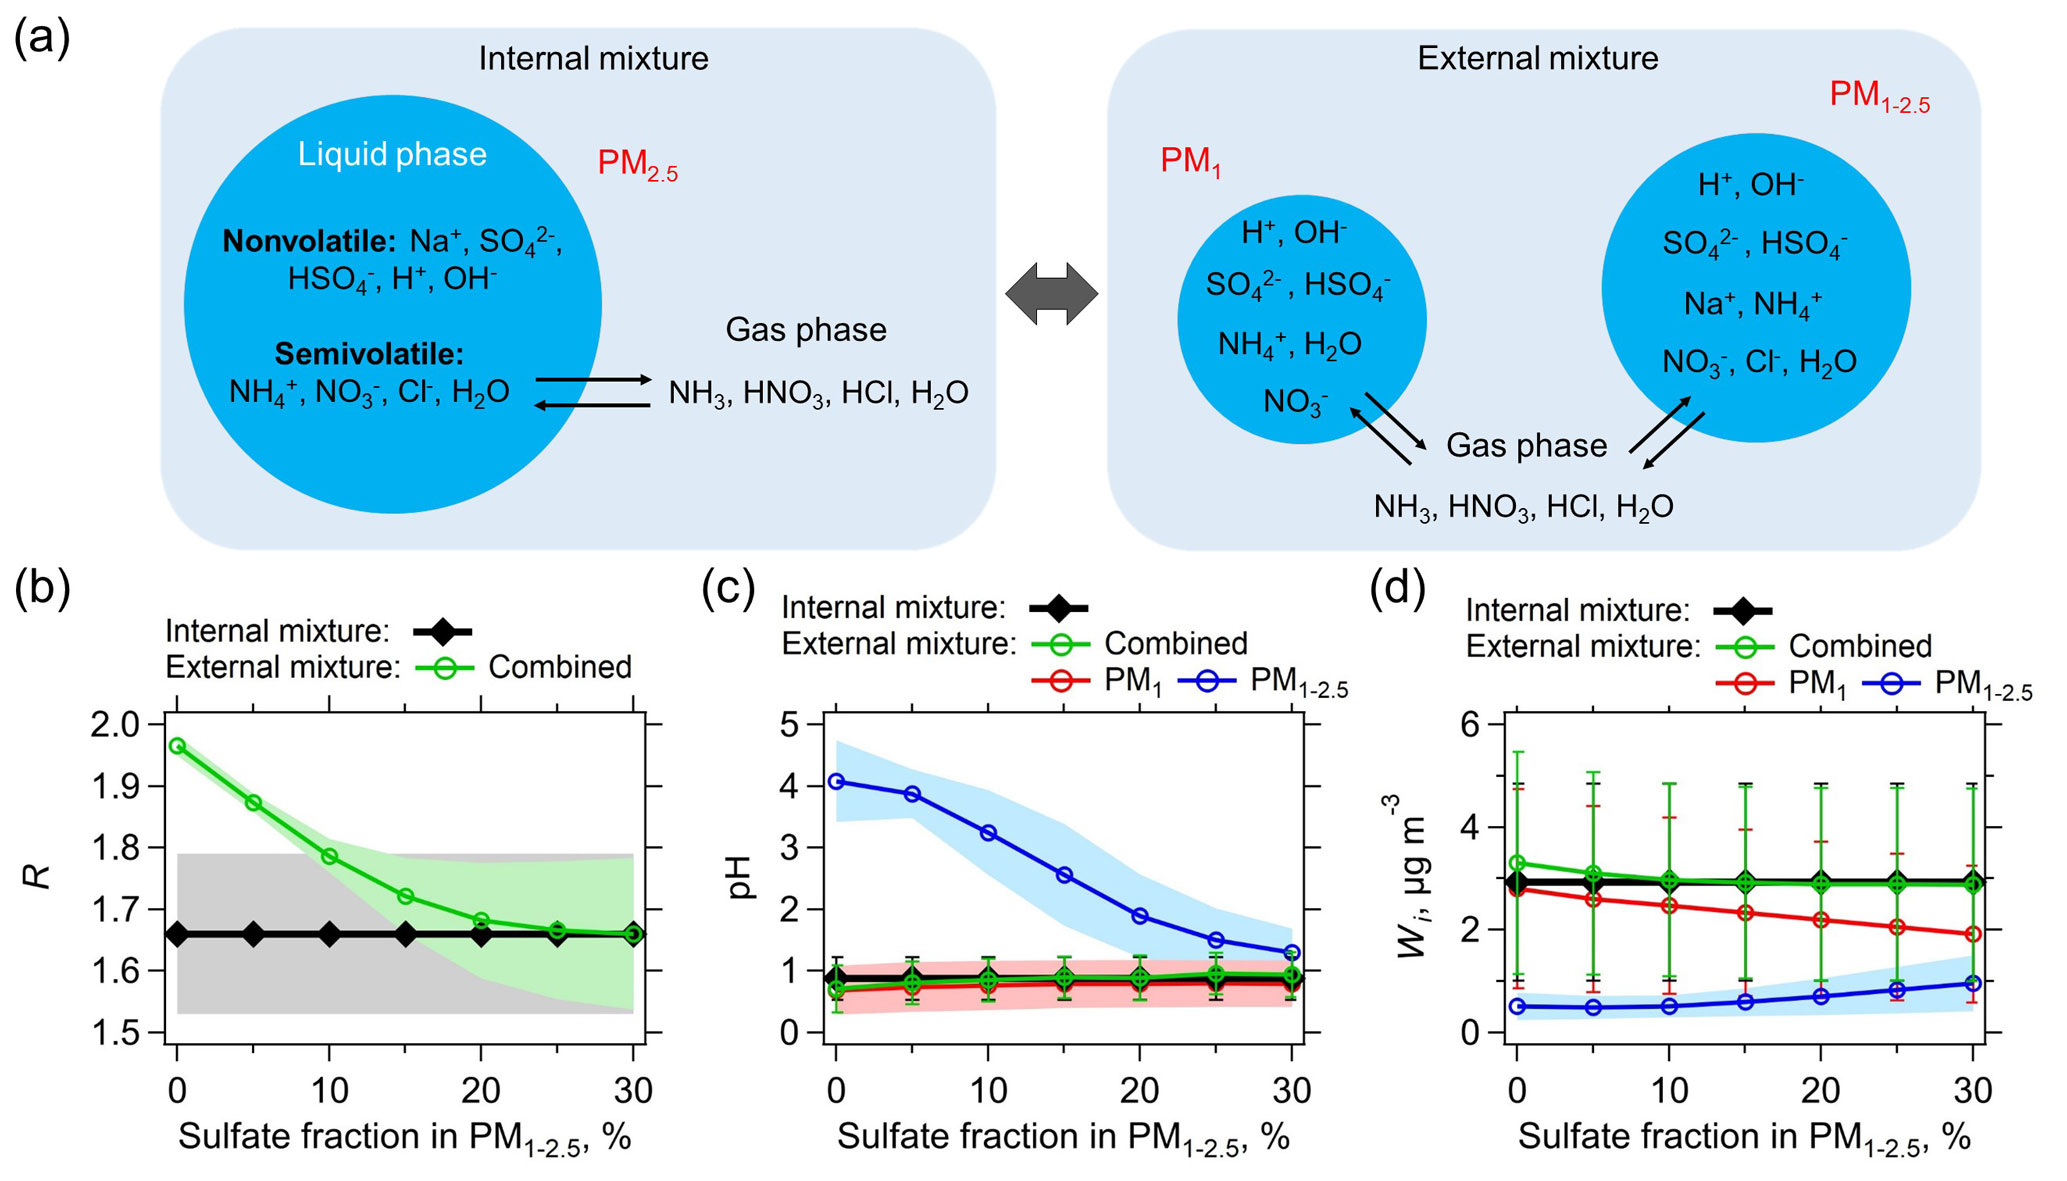
Figure 7(a) Schematic of assumed internally and externally mixed aerosols. NVCs (here represented by Na+) are all assumed in PM1−2.5 for the external mixing case. The two externally mixed aerosol groups (PM1 and PM1−2.5) are in equilibrium with the same gases. The internal mixed case has bulk PM2.5 compositions (PM1+ PM1−2.5) together with gases as model input. The predicted molar ratio (R), pH, and liquid water (Wi) of the internally and externally mixed aerosols are summarized in (b), (c), and (d), respectively. The x axis is the sulfate (mass) fraction assumed in PM1−2.5, with the remaining sulfate in PM1. For the analysis shown here only data for which measured Na+ was above the LOD are utilized. Lower Na+ concentrations require smaller fractions of in the PM1−2.5 range for agreement with the bulk analysis (e.g., 5 % for the PILS-IC Na+ LOD of 0.07 µg m−3). Standard deviations of the data are shown as error bars or shaded zones.
4.1.1 Explanation for role of NVCs in R based on bulk (internal mixture) analysis
Recapping the bulk analysis above where ions are all assumed to be internally mixed, we have shown that the observations relating R to NVCs, and deviations in R between models and observations, can be readily explained. First, when NVCs such as Na+ are present in the ambient aerosol and not included in the thermodynamic model, but some fraction of the associated anion pair is, the thermodynamic model will predict higher than observed because the model will partition greater levels of available semivolatile cations (i.e., NH3) to the particle phase () to conserve NHx and make up for the missing NVCs. This leads to a predicted R near 2. The trends in measured R with measured Na+ are also expected. As noted before, measured R becomes increasingly less than 2 as measured Na+ increases because at higher Na+ bulk aerosol pH increases (Fig. 3c), resulting in lower ε() (see S curve in Fig. S9 in the Supplement), shifting to gas-phase NH3. Other NVCs have similar effects as Na+, as long as soluble forms of the salts are observed (e.g., NaNO3, Na2SO4, KNO3, K2SO4, Ca(NO3)2, Mg(NO3)2). We have shown with this bulk analysis that accurately including NVCs in the thermodynamic analysis appears to largely resolve the disparity in predicted and measured R for the datasets we analyzed. But the bulk analysis is only an approximation of the actual aerosol mixing state. We next test if assuming an internal mixture will roughly represent the behavior of externally mixed aerosols in terms of the effect of NVCs on R, pH, and partitioning of semivolatile species. To assess this, we consider the behavior of external mixing cases.
4.1.2 Explanation for the role of NVCs in R based on external mixture analysis
An extreme (and unrealistic at the timescale of aerosol lifetime Zaveri et al., 2010) external mixture is where PM1 is composed of all the measured , and PM1−2.5 is composed of all the measured Na+ (all NVCs), , and Cl−. NH3, HNO3, HCl, and H2O (water vapor) can still equilibrate between these externally mixed particle types (see Fig. 7a), given the relatively short equilibrating timescales for these sizes of particles (Dassios and Pandis, 1999; Cruz et al., 2000; Fountoukis et al., 2009). As Fig. 7b shows, for the extreme external mixing case (i.e., 0 % sulfate in PM1−2.5), predicted R, combined from PM1 and PM1−2.5, is close to 2, deviating from the lower predicted R of 1.66 ±0.13 from the internal mixture. This is due to the vastly different pH of PM1 (0.6) and PM1−2.5 (4.1) (Fig. 7c), where all is predicted to be in PM1 and all is predicted to be in PM
For more realistic mixing cases, where some fraction of the sulfate is mixed with NVCs (Bondy et al., 2018), the combined R of the external mixture decreases rapidly as more is mixed with Na+ in PM1−2.5. At ∼20 % fraction in PM1−2.5, the average levels of predicted R start to converge between external and internal mixtures (Fig. 7b). The difference in pH between PM1 and PM1−2.5 is also reduced to within one pH unit (Fig. 7c). With these small differences in pH, can condense on both externally mixed aerosol groups. For example, PM1 and PM1−2.5 are predicted to be 0.67 and 0.04 µg m−3, respectively (equal to the sum of the measured PM2.5 of 0.71 µg m−3). From this analysis, based only on data when Na+ was above the LOD, predicted R for the bulk and external mixture are the same when on average 18±7 % (by mass) of the PM2.5 is in the PM1−2.5 size range (i.e., mixed with Na+). This is comparable to inferences of mixing based on size-resolved aerosol measurements in the southeast (e.g., Fang et al., 2017 shows ∼30 % PM2.5 mass in PM1−2.5). Less internal mixing of with Na+ is needed when Na+ concentrations are lower. For the SOAS 12-day Na+ average level of 0.07 µg m−3, only 5 % of the (by mass) when mixed with Na+ produces the same results as the bulk totally internal mixture case (see Fig. S11 in the Supplement). Note that higher Na+ concentrations generally require more to obtain agreement in R between external and internal mixtures (scatter plots are shown in Fig. S12 in the Supplement).
The difference between the internally and externally mixed system is not as great as may be expected, especially for particle pH and liquid water (Wi) (Fig. 7c and d). Since liquid water levels are determined as the sum of the water associated with the various salts, the bulk liquid water generally equals the sum of the two externally mixed liquid water concentrations, based on the Zdanovskii–Stokes–Robinson (ZSR) relationship (Zdanovskii, 1936; Stokes and Robinson, 1966). Because the most hygroscopic salts (i.e., and ; concentrations are low) are in PM1, PM1 liquid water dominates over PM1−2.5, making the combined pH of the external mixture nearly identical to the PM1 pH (see Eq. 4 for combined pH calculation). The combined pH of the external mixture is also similar to that of internal mixture, regardless of the fractions (see Fig. 7c).
We have shown that including NVCs in the thermodynamic model largely resolves the ammonium-sulfate molar ratio (R= ) discrepancy, based on our datasets. (We have not utilized the CSN dataset as other researchers have due to a large low bias in R.) Since only small amounts of NVC can significantly affect R, measurement limitations, such as high NVC LODs or NVCs not measured at all (e.g., AMS measurements), can lead to substantial differences in observed and thermodynamic-model-predicted R. We show that this bias in R (ISORROPIA-predicted R with Na+ minus ISORROPIA-predicted R without Na+) is correlated with and highly sensitive to measured Na+, but not correlated with organic aerosol mass or mass fraction. Similarly, the difference in measured R from a ratio of 2 (2 minus observed R) is correlated to measured Na+ (NVCs) and not correlated with organic aerosol mass or mass fraction. If organic films were limiting mass transfer, the discrepancy in R should worsen as the films become thicker. We find the opposite. Furthermore, ISORROPIA-predicted NH3– partitioning (with measured Na+ as input) agrees well with the observation, showing an equilibrium state of the partitioning and no significant NH3 mass transfer limit caused by organic films. These results provide evidence for the role of NVCs, but not bulk organic aerosol species or organic films in the molar ratio discrepancy observed in the southeastern US.
Excluding minor amounts of fine-mode NVC in thermodynamic calculations results in a predicted R near 2, which is generally higher than observed values. This results from the model criteria for aerosol electrical neutrality and because semivolatile has to be increased to compensate for the missing NVCs. Less absolute discrepancy is associated with predicted particle pH with or without NVC because pH is on a logarithmic scale of and the range of pH is larger than that of R (or ) in the eastern US. However, neglecting NVC can induce pH biases that could result in significant partitioning errors for semivolatile species like ammonium, nitrate, chloride, and even organic acids, under certain conditions. Because NVCs are often minor constituents of fine particles, especially for submicron particles, implying low ambient concentrations and high measurement uncertainties, assessing thermodynamic model predictions through molar ratios is problematic. If NVCs were not measured or significantly below the measurement LOD, an ion charge balance could be used to infer an upper limit on NVC concentrations, but addition of measurement uncertainties can lead to uncertain results. Note that the ion charge balance on its own generally cannot be used to infer H+ since the H+ concentrations are generally very low, even at the low pH of the southeastern US aerosols, and the dissociation states of acids must be known (e.g., proportions of and ), which requires a full thermodynamic analysis.
A motivation for the organic effects on ammonia partitioning (Silvern et al., 2017) was the observed decreasing trend over the past 15 years in the southeastern US. Fully considering NVCs does not change the finding of nearly constant fine-particle pH in the southeast (summertime) despite the large sulfate reductions in the past 15 years, but it does now lead to agreement with the observed decreasing trend. Although the analysis was performed assuming internal mixtures of aerosol constituents, since only bulk PM2.5 composition data were available, we show that external mixtures of NVCs and sulfate produce similar molar ratios, with the requirement that only small amounts of sulfate are needed to be mixed with the NVC-rich particle, which is qualitatively consistent with the particle mixing state measured for the SOAS study reported by Bondy et al. (2018). In contrast to molar ratio, the average pH for externally mixed aerosol is not sensitive to the mixing fraction of and Na+. Further assessments on possible effects of organic species on semivolatile partitioning of inorganic species should be carried out, especially for regions that are chemically different from the eastern US conditions evaluated in this study.
The model input data files can be accessed by request (rweber@eas.gatech.edu). Alternatively, the SOAS and WINTER datasets are open access: https://esrl.noaa.gov/csd/groups/csd7/measurements/2013senex/Ground/DataDownload/ (last access: 9 September 2014) and https://data.eol.ucar.edu/master_list/?project=WINTER (last access: 19 October 2015), respectively.
The supplement related to this article is available online at: https://doi.org/10.5194/acp-18-17307-2018-supplement.
HG and RJW collected the SOAS PILS-IC data. HG analyzed the data. HG, AN and RJW conceived the analysis, were involved in data interpretation and wrote the paper.
The authors declare that they have no conflict of interest.
This work was supported by the National Science
Foundation (NSF) under grant AGS-1360730. The WINTER data are provided by
NCAR/EOL under sponsorship of the National Science Foundation
(http://data.eol.ucar.edu/, last access: 19 October 2015).
We also acknowledge support from an EPA STAR grant and the European Research
Council Consolidator Grant 726165 – PyroTRACH.
Edited by: Hang Su
Reviewed by: three
anonymous referees
Allen, H. M., Draper, D. C., Ayres, B. R., Ault, A., Bondy, A., Takahama, S., Modini, R. L., Baumann, K., Edgerton, E., Knote, C., Laskin, A., Wang, B., and Fry, J. L.: Influence of crustal dust and sea spray supermicron particle concentrations and acidity on inorganic aerosol during the 2013 Southern Oxidant and Aerosol Study, Atmos. Chem. Phys., 15, 10669–10685, https://doi.org/10.5194/acp-15-10669-2015, 2015.
Andreae, M. O., Charlson, R. J., Bruynseels, F., Storms, H., Van Grieken, R. M. and Maenhaut, W.: Internal mixture of sea salt, silicates, and excess sulfate in marine aerosols, Science, 232, 1620–1623, https://doi.org/10.1126/science.232.4758.1620, 1986.
Ansari, A. S. and Pandis, S. N.: The effect of metastable equilibrium states on the partitioning of nitrate between the gas and aerosol phases, Atmos. Environ., 34, 157–168, https://doi.org/10.1016/s1352-2310(99)00242-3, 2000.
Anttila, T., Kiendler-Scharr, A., Mentel, T. F., and Tillmann, R.: Size dependent partitioning of organic material: evidence for the formation of organic coatings on aqueous aerosols, J. Atmos. Chem., 57, 215–237, https://doi.org/10.1007/s10874-007-9067-9, 2007.
Attwood, A. R., Washenfelder, R. A., Brock, C. A., Hu, W., Baumann, K., Campuzano-Jost, P., Day, D. A., Edgerton, E. S., Murphy, D. M., Palm, B. B., McComiskey, A., Wagner, N. L., de Sa, S. S., Ortega, A., Martin, S. T., Jimenez, J. L., and Brown, S. S.: Trends in sulfate and organic aerosol mass in the Southeast U.S.: Impact on aerosol optical depth and radiative forcing, Geophys. Res. Lett., 41, 7701–7709, https://doi.org/10.1002/2014gl061669, 2014.
Bahreini, R., Ervens, B., Middlebrook, A. M., Warneke, C., de Gouw, J. A., DeCarlo, P. F., Jimenez, J. L., Brock, C. A., Neuman, J. A., Ryerson, T. B., Stark, H., Atlas, E., Brioude, J., Fried, A., Holloway, J. S., Peischl, J., Richter, D., Walega, J., Weibring, P., Wollny, A. G., and Fehsenfeld, F. C.: Organic aerosol formation in urban and industrial plumes near Houston and Dallas, Texas, J. Geophys. Res., 114, D00F16, https://doi.org/10.1029/2008jd011493, 2009.
Bertram, A. K., Martin, S. T., Hanna, S. J., Smith, M. L., Bodsworth, A., Chen, Q., Kuwata, M., Liu, A., You, Y., and Zorn, S. R.: Predicting the relative humidities of liquid-liquid phase separation, efflorescence, and deliquescence of mixed particles of ammonium sulfate, organic material, and water using the organic-to-sulfate mass ratio of the particle and the oxygen-to-carbon elemental ratio of the organic component, Atmos. Chem. Phys., 11, 10995–11006, https://doi.org/10.5194/acp-11-10995-2011, 2011.
Blanchard, C. L., Hidy, G. M., Tanenbaum, S., Edgerton, E. S., and Hartsell, B. E.: The Southeastern Aerosol Research and Characterization (SEARCH) study: Spatial variations and chemical climatology, 1999–2010, JAPCA J. Air Waste Ma., 63, 260–275, https://doi.org/10.1080/10962247.2012.749816, 2013.
Bondy, A. L., Wang, B., Laskin, A., Craig, R. L., Nhliziyo, M. V., Bertman, S. B., Pratt, K. A., Shepson, P. B., and Ault, A. P.: Inland Sea Spray Aerosol Transport and Incomplete Chloride Depletion: Varying Degrees of Reactive Processing Observed during SOAS, Environ. Sci. Technol., 51, 9533–9542, https://doi.org/10.1021/acs.est.7b02085, 2017.
Bondy, A. L., Bonanno, D., Moffet, R. C., Wang, B., Laskin, A., and Ault, A. P.: The diverse chemical mixing state of aerosol particles in the southeastern United States, Atmos. Chem. Phys., 18, 12595–12612, https://doi.org/10.5194/acp-18-12595-2018, 2018.
Bones, D. L., Reid, J. P., Lienhard, D. M., and Krieger, U. K.: Comparing the mechanism of water condensation and evaporation in glassy aerosol, P. Natl. Acad. Sci. USA, 109, 11613–11618, https://doi.org/10.1073/pnas.1200691109, 2012.
Bougiatioti, A., Nikolaou, P., Stavroulas, I., Kouvarakis, G., Weber, R., Nenes, A., Kanakidou, M., and Mihalopoulos, N.: Particle water and pH in the eastern Mediterranean: source variability and implications for nutrient availability, Atmos. Chem. Phys., 16, 4579–4591, https://doi.org/10.5194/acp-16-4579-2016, 2016.
Bougiatioti, A., Nenes, A., Paraskevopoulou, D., Fourtziou, L., Stavroulas, I., Liakakou, E., Weber, R., Gerasopoulo, E., Nikolaou, P., and Mihalopoulos, N.: The unappreciated effects of biomass burning on fine mode aerosol acidity, water and nitrogen partitioning, in review, 2018.
Cruz, C. N., Dassios, K. G., and Pandis, S. N.: The effect of dioctyl phthalate films on the ammonium nitrate aerosol evaporation rate, Atmos. Environ., 34, 3897–3905, https://doi.org/10.1016/S1352-2310(00)00173-4, 2000.
Dassios, K. G. and Pandis, S. N.: The mass accommodation coefficient of ammonium nitrate aerosol, Atmos. Environ., 33, 2993–3003, https://doi.org/10.1016/S1352-2310(99)00079-5, 1999.
Daumer, B., Niessner, R., and Klockow, D.: Laboratory studies of the influence of thin organic films on the neutralization reaction of H2SO4 aerosol with ammonia, J. Aerosol Sci., 23, 315–325, https://doi.org/10.1016/0021-8502(92)90001-c, 1992.
DeCarlo, P. F., Kimmel, J. R., Trimborn, A., Northway, M. J., Jayne, J. T., Aiken, A. C., Gonin, M., Fuhrer, K., Horvath, T., Docherty, K. S., Worsnop, D. R., and Jimenez, J. L.: Field-deployable, high-resolution, time-of-flight aerosol mass spectrometer, Anal. Chem., 78, 8281–8289, https://doi.org/10.1021/ac061249n, 2006.
DOE: Handbook of Methods for the Analysis of the Various Parameters of the Carbon Dioxide System in Sea Water, Version 2, edited by: Dickson, A. G. and Goyet, C., ORNL/CDIAC-74, 1994.
Eddingsaas, N. C., VanderVelde, D. G., and Wennberg, P. O.: Kinetics and Products of the Acid-Catalyzed Ring-Opening of Atmospherically Relevant Butyl Epoxy Alcohols, J. Phys. Chem. A, 114, 8106–8113, https://doi.org/10.1021/Jp103907c, 2010.
Fang, T., Guo, H., Zeng, L., Verma, V., Nenes, A., and Weber, R. J.: Highly Acidic Ambient Particles, Soluble Metals, and Oxidative Potential: A Link between Sulfate and Aerosol Toxicity, Environ. Sci. Technol., 51, 2611–2620, https://doi.org/10.1021/acs.est.6b06151, 2017.
Fountoukis, C. and Nenes, A.: ISORROPIA II: a computationally efficient thermodynamic equilibrium model for K+–Ca2+–Mg2+––Na+–––Cl−–H2O aerosols, Atmos. Chem. Phys., 7, 4639–4659, https://doi.org/10.5194/acp-7-4639-2007, 2007.
Fountoukis, C., Nenes, A., Sullivan, A., Weber, R., Van Reken, T., Fischer, M., Matías, E., Moya, M., Farmer, D., and Cohen, R. C.: Thermodynamic characterization of Mexico City aerosol during MILAGRO 2006, Atmos. Chem. Phys., 9, 2141–2156, https://doi.org/10.5194/acp-9-2141-2009, 2009.
Fridlind, A. M. and Jacobson, M. Z.: A study of gas-aerosol equilibrium and aerosol pH in the remote marine boundary layer during the First Aerosol Characterization Experiment (ACE 1), J. Geophys. Res., 105, 17325–17340, https://doi.org/10.1029/2000jd900209, 2000.
Garland, R. M., Wise, M. E., Beaver, M. R., DeWitt, H. L., Aiken, A. C., Jimenez, J. L., and Tolbert, M. A.: Impact of palmitic acid coating on the water uptake and loss of ammonium sulfate particles, Atmos. Chem. Phys., 5, 1951–1961, https://doi.org/10.5194/acp-5-1951-2005, 2005.
Guo, H., Xu, L., Bougiatioti, A., Cerully, K. M., Capps, S. L., Hite Jr., J. R., Carlton, A. G., Lee, S.-H., Bergin, M. H., Ng, N. L., Nenes, A., and Weber, R. J.: Fine-particle water and pH in the southeastern United States, Atmos. Chem. Phys., 15, 5211–5228, https://doi.org/10.5194/acp-15-5211-2015, 2015.
Guo, H., Sullivan, A. P., Campuzano-Jost, P., Schroder, J. C., Lopez-Hilfiker, F. D., Dibb, J. E., Jimenez, J. L., Thornton, J. A., Brown, S. S., Nenes, A., and Weber, R. J.: Fine particle pH and the partitioning of nitric acid during winter in the northeastern United States, J. Geophys. Res., 121, 10355–10376, https://doi.org/10.1002/2016jd025311, 2016.
Guo, H., Liu, J., Froyd, K. D., Roberts, J. M., Veres, P. R., Hayes, P. L., Jimenez, J. L., Nenes, A., and Weber, R. J.: Fine particle pH and gas–particle phase partitioning of inorganic species in Pasadena, California, during the 2010 CalNex campaign, Atmos. Chem. Phys., 17, 5703–5719, https://doi.org/10.5194/acp-17-5703-2017, 2017.
Hand, J. L., Schichtel, B. A., Malm, W. C., and Pitchford, M. L.: Particulate sulfate ion concentration and SO2 emission trends in the United States from the early 1990s through 2010, Atmos. Chem. Phys., 12, 10353–10365, https://doi.org/10.5194/acp-12-10353-2012, 2012.
Hanisch, F. and Crowley, J. N.: The heterogeneous reactivity of gaseous nitric acid on authentic mineral dust samples, and on individual mineral and clay mineral components, Phys. Chem. Chem. Phys, 3, 2474–2482, https://doi.org/10.1039/b101700o, 2001.
Hennigan, C. J., Izumi, J., Sullivan, A. P., Weber, R. J., and Nenes, A.: A critical evaluation of proxy methods used to estimate the acidity of atmospheric particles, Atmos. Chem. Phys., 15, 2775–2790, https://doi.org/10.5194/acp-15-2775-2015, 2015.
Hidy, G. M., Blanchard, C. L., Baumann, K., Edgerton, E., Tanenbaum, S., Shaw, S., Knipping, E., Tombach, I., Jansen, J., and Walters, J.: Chemical climatology of the southeastern United States, 1999–2013, Atmos. Chem. Phys., 14, 11893–11914, https://doi.org/10.5194/acp-14-11893-2014, 2014.
Jang, M., Czoschke, N. M., Lee, S., and Kamens, R. M.: Heterogeneous atmospheric aerosol production by acid-catalyzed particle-phase reactions, Science, 298, 814–817, https://doi.org/10.1126/science.1075798, 2002.
Katoshevski, D., Nenes, A., and Seinfeld, J. H.: A study of processes that govern the maintenance of aerosols in the marine boundary layer, J. Aerosol Sci., 30, 503–532, https://doi.org/10.1016/S0021-8502(98)00740-X, 1999.
Keene, W. C., Sander, R., Pszenny, A. A. P., Vogt, R., Crutzen, P. J., and Galloway, J. N.: Aerosol pH in the marine boundary layer: A review and model evaluation, J. Aerosol Sci., 29, 339–356, https://doi.org/10.1016/s0021-8502(97)10011-8, 1998.
Kim, P. S., Jacob, D. J., Fisher, J. A., Travis, K., Yu, K., Zhu, L., Yantosca, R. M., Sulprizio, M. P., Jimenez, J. L., Campuzano-Jost, P., Froyd, K. D., Liao, J., Hair, J. W., Fenn, M. A., Butler, C. F., Wagner, N. L., Gordon, T. D., Welti, A., Wennberg, P. O., Crounse, J. D., St. Clair, J. M., Teng, A. P., Millet, D. B., Schwarz, J. P., Markovic, M. Z., and Perring, A. E.: Sources, seasonality, and trends of southeast US aerosol: an integrated analysis of surface, aircraft, and satellite observations with the GEOS-Chem chemical transport model, Atmos. Chem. Phys., 15, 10411–10433, https://doi.org/10.5194/acp-15-10411-2015, 2015.
Laskin, A., Iedema, M. J., and Cowin, J. P.: Quantitative Time-Resolved Monitoring of Nitrate Formation in Sea Salt Particles Using a CCSEM/EDX Single Particle Analysis, Environ. Sci. Technol., 36, 4948–4955, https://doi.org/10.1021/es020551k, 2002.
Liggio, J., Li, S. M., Vlasenko, A., Stroud, C., and Makar, P.: Depression of ammonia uptake to sulfuric acid aerosols by competing uptake of ambient organic gases, Environ. Sci. Technol., 45, 2790–2796, https://doi.org/10.1021/es103801g, 2011.
Liu, M., Song, Y., Zhou, T., Xu, Z., Yan, C., Zheng, M., Wu, Z., Hu, M., Wu, Y., and Zhu, T.: Fine particle pH during severe haze episodes in northern China, Geophys. Res. Lett., 44, 5213–5221, https://doi.org/10.1002/2017gl073210, 2017.
Longo, A. F., Feng, Y., Lai, B., Landing, W. M., Shelley, R. U., Nenes, A., Mihalopoulos, N., Violaki, K., and Ingall, E. D.: Influence of Atmospheric Processes on the Solubility and Composition of Iron in Saharan Dust, Environ. Sci. Technol., 50, 6912–6920, https://doi.org/10.1021/acs.est.6b02605, 2016.
McInnes, L. M., Covert, D. S., Quinn, P. K., and Germani, M. S.: Measurements of chloride depletion and sulfur enrichment in individual sea-salt particles collected from the remote marine boundary layer, J. Geophys. Res., 99, 8257–8268, https://doi.org/10.1029/93jd03453, 1994.
Meng, Z. and Seinfeld, J. H.: Time scales to achieve atmospheric gas-aerosol equilibrium for volatile species, Atmos. Environ., 30, 2889–2900, https://doi.org/10.1016/1352-2310(95)00493-9, 1996.
Meskhidze, N., Chameides, W. L., Nenes, A., and Chen, G.: Iron mobilization in mineral dust: Can anthropogenic SO2 emissions affect ocean productivity?, Geophys. Res. Lett., 30, 2085, https://doi.org/10.1029/2003gl018035, 2003.
Meskhidze, N., Chameides, W. L., and Nenes, A.: Dust and pollution: A recipe for enhanced ocean fertilization?, J. Geophys. Res., 110, D03301, https://doi.org/10.1029/2004jd005082, 2005.
Morino, Y., Kondo, Y., Takegawa, N., Miyazaki, Y., Kita, K., Komazaki, Y., Fukuda, M., Miyakawa, T., Moteki, N., and Worsnop, D. R.: Partitioning of HNO3 and particulate nitrate over Tokyo: Effect of vertical mixing, J. Geophys. Res., 111, D15215, https://doi.org/10.1029/2005jd006887, 2006.
Moya, M., Ansari, A. S., and Pandis, S. N.: Partitioning of nitrate and ammonium between the gas and particulate phases during the 1997 IMADA-AVER study in Mexico City, Atmos. Environ., 35, 1791–1804, https://doi.org/10.1016/s1352-2310(00)00292-2, 2001.
Murphy, D. M., Anderson, J. R., Quinn, P. K., McInnes, L. M., Brechtel, F. J., Kreidenweis, S. M., Middlebrook, A. M., Posfai, M., Thomson, D. S., and Buseck, P. R.: Influence of sea-salt on aerosol radiative properties in the Southern Ocean marine boundary layer, Nature, 392, 62–65, https://doi.org/10.1038/32138, 1998.
Murphy, J. G., Gregoire, P. K., Tevlin, A. G., Wentworth, G. R., Ellis, R. A., Markovic, M. Z., and VandenBoer, T. C.: Observational constraints on particle acidity using measurements and modelling of particles and gases, Faraday Discuss., 200, 379–395, https://doi.org/10.1039/c7fd00086c, 2017.
Nenes, A., Krom, M. D., Mihalopoulos, N., Van Cappellen, P., Shi, Z., Bougiatioti, A., Zarmpas, P., and Herut, B.: Atmospheric acidification of mineral aerosols: a source of bioavailable phosphorus for the oceans, Atmos. Chem. Phys., 11, 6265–6272, https://doi.org/10.5194/acp-11-6265-2011, 2011.
O'Dowd, C. D., Smith, M. H., Consterdine, I. E., and Lowe, J. A.: Marine aerosol, sea-salt, and the marine sulphur cycle: a short review, Atmos. Environ., 31, 73–80, https://doi.org/10.1016/s1352-2310(96)00106-9, 1997.
Orsini, D. A., Ma, Y., Sullivan, A., Sierau, B., Baumann, K., and Weber, R. J.: Refinements to the particle-into-liquid sampler (PILS) for ground and airborne measurements of water soluble aerosol composition, Atmos. Environ., 37, 1243–1259, https://doi.org/10.1016/s1352-2310(02)01015-4, 2003.
Paulot, F. and Jacob, D. J.: Hidden cost of U.S. agricultural exports: particulate matter from ammonia emissions, Environ. Sci. Technol., 48, 903–908, https://doi.org/10.1021/es4034793, 2014.
Paulot, F., Paynter, D., Ginoux, P., Naik, V., Whitburn, S., Van Damme, M., Clarisse, L., Coheur, P. F., and Horowitz, L. W.: Gas-aerosol partitioning of ammonia in biomass burning plumes: Implications for the interpretation of spaceborne observations of ammonia and the radiative forcing of ammonium nitrate, Geophys. Res. Lett., 44, 8084–8093, https://doi.org/10.1002/2017gl074215, 2017.
Pye, H. O. T., Zuend, A., Fry, J. L., Isaacman-VanWertz, G., Capps, S. L., Appel, K. W., Foroutan, H., Xu, L., Ng, N. L., and Goldstein, A. H.: Coupling of organic and inorganic aerosol systems and the effect on gas–particle partitioning in the southeastern US, Atmos. Chem. Phys., 18, 357–370, https://doi.org/10.5194/acp-18-357-2018, 2018.
Reid, J. P., Bertram, A. K., Topping, D. O., Laskin, A., Martin, S. T., Petters, M. D., Pope, F. D., and Rovelli, G.: The viscosity of atmospherically relevant organic particles, Nat. Commun., 9, 956, https://doi.org/10.1038/s41467-018-03027-z, 2018.
Schroder, J. C., Campuzano-Jost, P., Day, D. A., Shah, V., Larson, K., Sommers, J. M., Sullivan, A. P., Campos, T., Reeves, J. M., Hills, A., Hornbrook, R. S., Blake, N. J., Scheuer, E., Guo, H., Fibiger, D. L., McDuffie, E. E., Hayes, P. L., Weber, R. J., Dibb, J. E., Apel, E. C., Jaeglé, L., Brown, S. S., Thornton, J. A., and Jimenez, J. L.: Sources and Secondary Production of Organic Aerosols in the Northeastern United States during WINTER, J. Geophys. Res., 123, 7771–7796, https://doi.org/10.1029/2018jd028475, 2018.
Seinfeld, J. H. and Pandis, S. N.: Atmospheric Chemistry and Physics: From Air Pollution to Climate Change, 3rd Edn., John Wiley & Sons, Inc., Hoboken, New Jersey, 2016.
Silvern, R. F., Jacob, D. J., Kim, P. S., Marais, E. A., Turner, J. R., Campuzano-Jost, P., and Jimenez, J. L.: Inconsistency of ammonium–sulfate aerosol ratios with thermodynamic models in the eastern US: a possible role of organic aerosol, Atmos. Chem. Phys., 17, 5107–5118, https://doi.org/10.5194/acp-17-5107-2017, 2017.
Song, S., Gao, M., Xu, W., Shao, J., Shi, G., Wang, S., Wang, Y., Sun, Y., and McElroy, M. B.: Fine-particle pH for Beijing winter haze as inferred from different thermodynamic equilibrium models, Atmos. Chem. Phys., 18, 7423–7438, https://doi.org/10.5194/acp-18-7423-2018, 2018.
Stockdale, A., Krom, M. D., Mortimer, R. J., Benning, L. G., Carslaw, K. S., Herbert, R. J., Shi, Z., Myriokefalitakis, S., Kanakidou, M., and Nenes, A.: Understanding the nature of atmospheric acid processing of mineral dusts in supplying bioavailable phosphorus to the oceans, P. Natl. Acad. Sci. USA, 113, 14639–14644, https://doi.org/10.1073/pnas.1608136113, 2016.
Stokes, R. H. and Robinson, R. A.: Interactions in Aqueous Nonelectrolyte Solutions .I. Solute-Solvent Equilibria, J. Phys. Chem., 70, 2126–2130, https://doi.org/10.1021/J100879a010, 1966.
Surratt, J. D., Chan, A. W., Eddingsaas, N. C., Chan, M., Loza, C. L., Kwan, A. J., Hersey, S. P., Flagan, R. C., Wennberg, P. O., and Seinfeld, J. H.: Reactive intermediates revealed in secondary organic aerosol formation from isoprene, P. Natl. Acad. Sci. USA, 107, 6640–6645, https://doi.org/10.1073/pnas.0911114107, 2010.
Tang, I. N., Tridico, A. C., and Fung, K. H.: Thermodynamic and optical properties of sea salt aerosols, J. Geophys. Res., 102, 23269–23275, https://doi.org/10.1029/97jd01806, 1997.
Tong, H.-J., Reid, J. P., Bones, D. L., Luo, B. P., and Krieger, U. K.: Measurements of the timescales for the mass transfer of water in glassy aerosol at low relative humidity and ambient temperature, Atmos. Chem. Phys., 11, 4739–4754, https://doi.org/10.5194/acp-11-4739-2011, 2011.
Vasilakos, P., Russell, A., Weber, R., and Nenes, A.: Understanding nitrate formation in a world with less sulfate, Atmos. Chem. Phys., 18, 12765–12775, https://doi.org/10.5194/acp-18-12765-2018, 2018.
Wang, G., Zhang, R., Gomez, M. E., Yang, L., Levy Zamora, M., Hu, M., Lin, Y., Peng, J., Guo, S., Meng, J., Li, J., Cheng, C., Hu, T., Ren, Y., Wang, Y., Gao, J., Cao, J., An, Z., Zhou, W., Li, G., Wang, J., Tian, P., Marrero-Ortiz, W., Secrest, J., Du, Z., Zheng, J., Shang, D., Zeng, L., Shao, M., Wang, W., Huang, Y., Wang, Y., Zhu, Y., Li, Y., Hu, J., Pan, B., Cai, L., Cheng, Y., Ji, Y., Zhang, F., Rosenfeld, D., Liss, P. S., Duce, R. A., Kolb, C. E., and Molina, M. J.: Persistent sulfate formation from London Fog to Chinese haze, P. Natl. Acad. Sci. USA, 113, 13630–13635, https://doi.org/10.1073/pnas.1616540113, 2016.
Weber, R. J., Guo, H., Russell, A. G., and Nenes, A.: High aerosol acidity despite declining atmospheric sulfate concentrations over the past 15 years, Nat. Geosci., 9, 282–285, https://doi.org/10.1038/ngeo2665, 2016.
Whitby, K. T.: The physical characteristics of sulfur aerosols, Atmos. Environ., 12, 135–159, https://doi.org/10.1016/0004-6981(78)90196-8, 1978.
You, Y., Kanawade, V. P., de Gouw, J. A., Guenther, A. B., Madronich, S., Sierra-Hernández, M. R., Lawler, M., Smith, J. N., Takahama, S., Ruggeri, G., Koss, A., Olson, K., Baumann, K., Weber, R. J., Nenes, A., Guo, H., Edgerton, E. S., Porcelli, L., Brune, W. H., Goldstein, A. H., and Lee, S.-H.: Atmospheric amines and ammonia measured with a chemical ionization mass spectrometer (CIMS), Atmos. Chem. Phys., 14, 12181–12194, https://doi.org/10.5194/acp-14-12181-2014, 2014.
Young, A. H., Keene, W. C., Pszenny, A. A. P., Sander, R., Thornton, J. A., Riedel, T. P., and Maben, J. R.: Phase partitioning of soluble trace gases with size-resolved aerosols in near-surface continental air over northern Colorado, USA, during winter, J. Geophys. Res., 118, 9414–9427, https://doi.org/10.1002/jgrd.50655, 2013.
Yu, X., Lee, T., Ayres, B., Kreidenweis, S., Malm, W., and Collett Jr., J.: Loss of fine particle ammonium from denuded nylon filters, Atmos. Environ., 40, 4797–4807, https://doi.org/10.1016/j.atmosenv.2006.03.061, 2006.
Zaveri, R. A., Barnard, J. C., Easter, R. C., Riemer, N., and West, M.: Particle-resolved simulation of aerosol size, composition, mixing state, and the associated optical and cloud condensation nuclei activation properties in an evolving urban plume, J. Geophys. Res., 115, D17210, https://doi.org/10.1029/2009jd013616, 2010.
Zdanovskii, A. B.: Regularities in the property variations of mixed solutions, Trudy Solyanoi Laboratorii Akad. Nauk SSSR, 6, 5–70, 1936.
Zhang, H., Yee, L. D., Lee, B. H., Curtis, M. P., Worton, D. R., Isaacman-VanWertz, G., Offenberg, J. H., Lewandowski, M., Kleindienst, T. E., Beaver, M. R., Holder, A. L., Lonneman, W. A., Docherty, K. S., Jaoui, M., Pye, H. O. T., Hu, W., Day, D. A., Campuzano-Jost, P., Jimenez, J. L., Guo, H., Weber, R. J., de Gouw, J., Koss, A. R., Edgerton, E. S., Brune, W., Mohr, C., Lopez-Hilfiker, F. D., Lutz, A., Kreisberg, N. M., Spielman, S. R., Hering, S. V., Wilson, K. R., Thornton, J. A., and Goldstein, A. H.: Monoterpenes are the largest source of summertime organic aerosol in the southeastern United States, P Natl. Acad. Sci. USA, 115, 2038–2043, https://doi.org/10.1073/pnas.1717513115, 2018.
Zhuang, H., Chan, C. K., Fang, M., and Wexler, A. S.: Size distributions of particulate sulfate, nitrate, and ammonium at a coastal site in Hong Kong, Atmos. Environ., 33, 843–853, https://doi.org/10.1016/S1352-2310(98)00305-7, 1999.
Zobrist, B., Marcolli, C., Pedernera, D. A., and Koop, T.: Do atmospheric aerosols form glasses?, Atmos. Chem. Phys., 8, 5221–5244, https://doi.org/10.5194/acp-8-5221-2008, 2008.
Zobrist, B., Soonsin, V., Luo, B. P., Krieger, U. K., Marcolli, C., Peter, T., and Koop, T.: Ultra-slow water diffusion in aqueous sucrose glasses, Phys. Chem. Chem. Phys, 13, 3514–3526, https://doi.org/10.1039/c0cp01273d, 2011.