the Creative Commons Attribution 4.0 License.
the Creative Commons Attribution 4.0 License.
 | 04 Dec 2018
Molecular dynamics simulation of the surface tension of aqueous sodium chloride: from dilute to highly supersaturated solutions and molten salt
Xiaoxiang Wang
Chuchu Chen
Kurt Binder
Uwe Kuhn
Ulrich Pöschl
Sodium chloride (NaCl) is one of the key components of atmospheric aerosols. The surface tension of aqueous NaCl solution (σNaCl,sol) and its concentration dependence are essential to determine the equilibrium water vapor pressure of aqueous NaCl droplets. Supersaturated NaCl solution droplets are observed in laboratory experiments and under atmospheric conditions, but the experimental data for σNaCl,sol are mostly limited up to subsaturated solutions. In this study, the surface tension of aqueous NaCl is investigated by molecular dynamics (MD) simulations and the pressure tensor method from dilute to highly supersaturated solutions. We show that the linear approximation of concentration dependence of σNaCl,sol at molality scale can be extended to the supersaturated NaCl solution until a molality of ∼10.7 mol kg−1 (i.e., solute mass fraction (xNaCl) of ∼0.39). Energetic analyses show that this monotonic increase in surface tension is driven by the increase in excess surface enthalpy (ΔH) as the solution becomes concentrated. After that, the simulated σNaCl,sol remains almost unchanged until xNaCl of ∼0.47 (near the concentration upon efflorescence). The existence of the “inflection point” at xNaCl of ∼0.39 and the stable surface tension of xNaCl between ∼0.39 and ∼0.47 can be attributed to the nearly unchanged excess surface entropy term (T⋅ΔS) and the excess surface enthalpy term (ΔH). After a “second inflection point” at xNaCl of ∼0.47, the simulated σNaCl,sol gradually regains the growing momentum with a tendency to approach the surface tension of molten NaCl (∼175.58 mN m−1 at 298.15 K, MD simulation-based extrapolation). This fast increase in σNaCl,sol at xNaCl>0.47 is a process driven by excess surface enthalpy and excess surface entropy. Our results reveal different regimes of concentration dependence of the surface tension of aqueous NaCl at 298.15 K: a water-dominated regime (xNaCl from 0 to ∼0.39), a transition regime (xNaCl from ∼0.39 to ∼0.47) and a molten NaCl-dominated regime (xNaCl from ∼0.47 to 1).
- Article
(7326 KB) -
Supplement
(272 KB) - BibTeX
- EndNote


Sodium chloride (NaCl) is one of the most important components of atmospheric aerosol particles (Finlayson-Pitts, 2003; Lewis and Schwartz, 2004). The aqueous NaCl solution droplet could participate in many atmospheric processes, such as phase transition, cloud activation, ice crystallization, long-range transport and chemical aging (Martin, 2000; Finlayson-Pitts, 2003; Ghorai et al., 2014; Wagner et al., 2015; Chen et al., 2016). To better understand these processes, the concentration-dependent surface tension of aqueous NaCl solution (σNaCl,sol) is essential to determine the equilibrium between NaCl solution droplet and water vapor (Jarvis and Scheiman, 1968; Dutcher et al., 2010).
Below the saturation point (∼6.15 mol kg−1), σNaCl,sol shows a near-linear dependence on molality (Jarvis and Scheiman, 1968; Johansson and Eriksson, 1974; Aveyard and Saleem, 1976; Weissenborn and Pugh, 1995; Matubayasi et al., 2001) with a slope of 1.73±0.17 (Pegram and Record, 2006, 2007). Because of the energy barrier of crystallization during dehydration and size effects at the nanoscale (Martin, 2000; Biskos et al., 2006; Cheng et al., 2015), supersaturated aqueous NaCl solution droplets can exist under atmospheric conditions. However, direct measurements of surface tension of supersaturated droplets are challenging due to technical difficulties (Harkins and Brown, 1919; Vargaftik et al., 1983; Richardson and Snyder, 1994; Kumar, 2001). Only recently, Bzdek et al. (2016) overcame these limitations with an optical tweezer method and extended the concentration range to ∼8 mol kg−1, where the near-linear relationship still holds (Bzdek et al., 2016).
It is a matter of debate to what extent the approximation of a near-linear dependence of surface tension on molality can still be used for NaCl droplets. Cheng et al. (2015) used the differential Köhler analyses (DKA) method to retrieve the surface tension of NaCl aqueous droplets, and revealed a large deviation from the near-linear increase at a molality of ∼10 mol kg−1. In literature, such a deviation in concentrated solution has also been found for other compounds, such as HNO3 (Weissenborn and Pugh, 1996), and it is believed to be typically true for most highly soluble electrolytes (Dutcher et al., 2010). The reason for such deviation remains unclear.
Several models about surface tension have been developed for highly concentrated solutions, e.g., Li and Lu (2001), Li et al. (1999) and Levin and Flores-Mena (2001). Li and Lu (2001) developed a model based on the Gibbs dividing surface concept, where the adsorption and desorption rate constants, saturated surface excess, stoichiometric coefficient of ions and mean ionic activity coefficient are needed. For NaCl aqueous solutions, this model is suitable for solutions with concentrations up to ∼5.5 mol kg−1. Li et al. (1999) uses a Debye–Hückel parameter, osmotic coefficient and a proportionality constant from the fitting of measured values to calculate the surface tension, which covers the concentration until the saturation point of bulk NaCl aqueous solutions. The remaining models are mostly only suitable for the dilute electrolyte solutions, such as the one proposed by Levin and Flores-Mena (2001). In their valid concentration range, these surface tension models produce linear or near-linear concentration dependence of σNaCl,sol that agrees well with currently available observations.
One surface tension model that is able to predict σNaCl,sol in the whole concentration range from infinitely dilute (xNaCl=0) to highly supersaturated solution to molten salts (xNaCl=1) was proposed by Dutcher et al. (2010), which has been adopted into the widely used Extended Aerosol Inorganics Model (E-AIM; Wexler and Clegg, 2002). This model is based on the following concept: ions are solvated by the water at low salt concentrations, which means that water molecules form hydration shells around the ions; while at very high salt concentration the water is considered as “solute” that is solvated by the ions, which means that ions form shells around the water molecules (Dutcher et al., 2010). Accordingly, for a diluted solution, the surface tension of water dominates and the surface tension of the solution equals the surface tension of water adjusted by a term that is proportional to the solute concentration. For a highly supersaturated solution, a similar relationship can be applied with the surface tension of molten salt as governing element. Legitimately, the model is then constrained by the surface tensions of water and molten salt. The parameterization of this model is obtained by fitting the data of subsaturated solutions. When the aqueous NaCl solution gets concentrated, this model shows a nonlinear monotonically increasing trend of σNaCl,sol generally in good agreement with observations, but no inflection point was introduced. It should be noted that the surface tension as a function of mole fraction of NaCl according to the Dutcher et al. (2010) model is essentially a linear interpolation between the surface tensions of water and molten NaCl.
In this study, we applied molecular dynamics (MD) simulations and the pressure tensor method to calculate the concentration dependence of σNaCl,sol from infinitely dilute (xNaCl=0) to highly supersaturated solution to molten salt (xNaCl=1). The concentration dependence of σNaCl,sol is divided into 3 regimes: a water-dominated regime, a transition regime and a molten NaCl-dominated regime. We compare our results with the Dutcher et al. (2010) model, and present the principal underlying physical chemistry (driving forces) behind the change of surface tension along concentration changes.
Table 1Concentrations of solution studied in our simulation and the calculated values of surface tension.

a The solution slab in this system is
and the simulation box is .
b There is a little difference between the concentration in the bulk region
and the one of the whole system due to surface effects. The values used in
the main text are the ones in the bulk region.
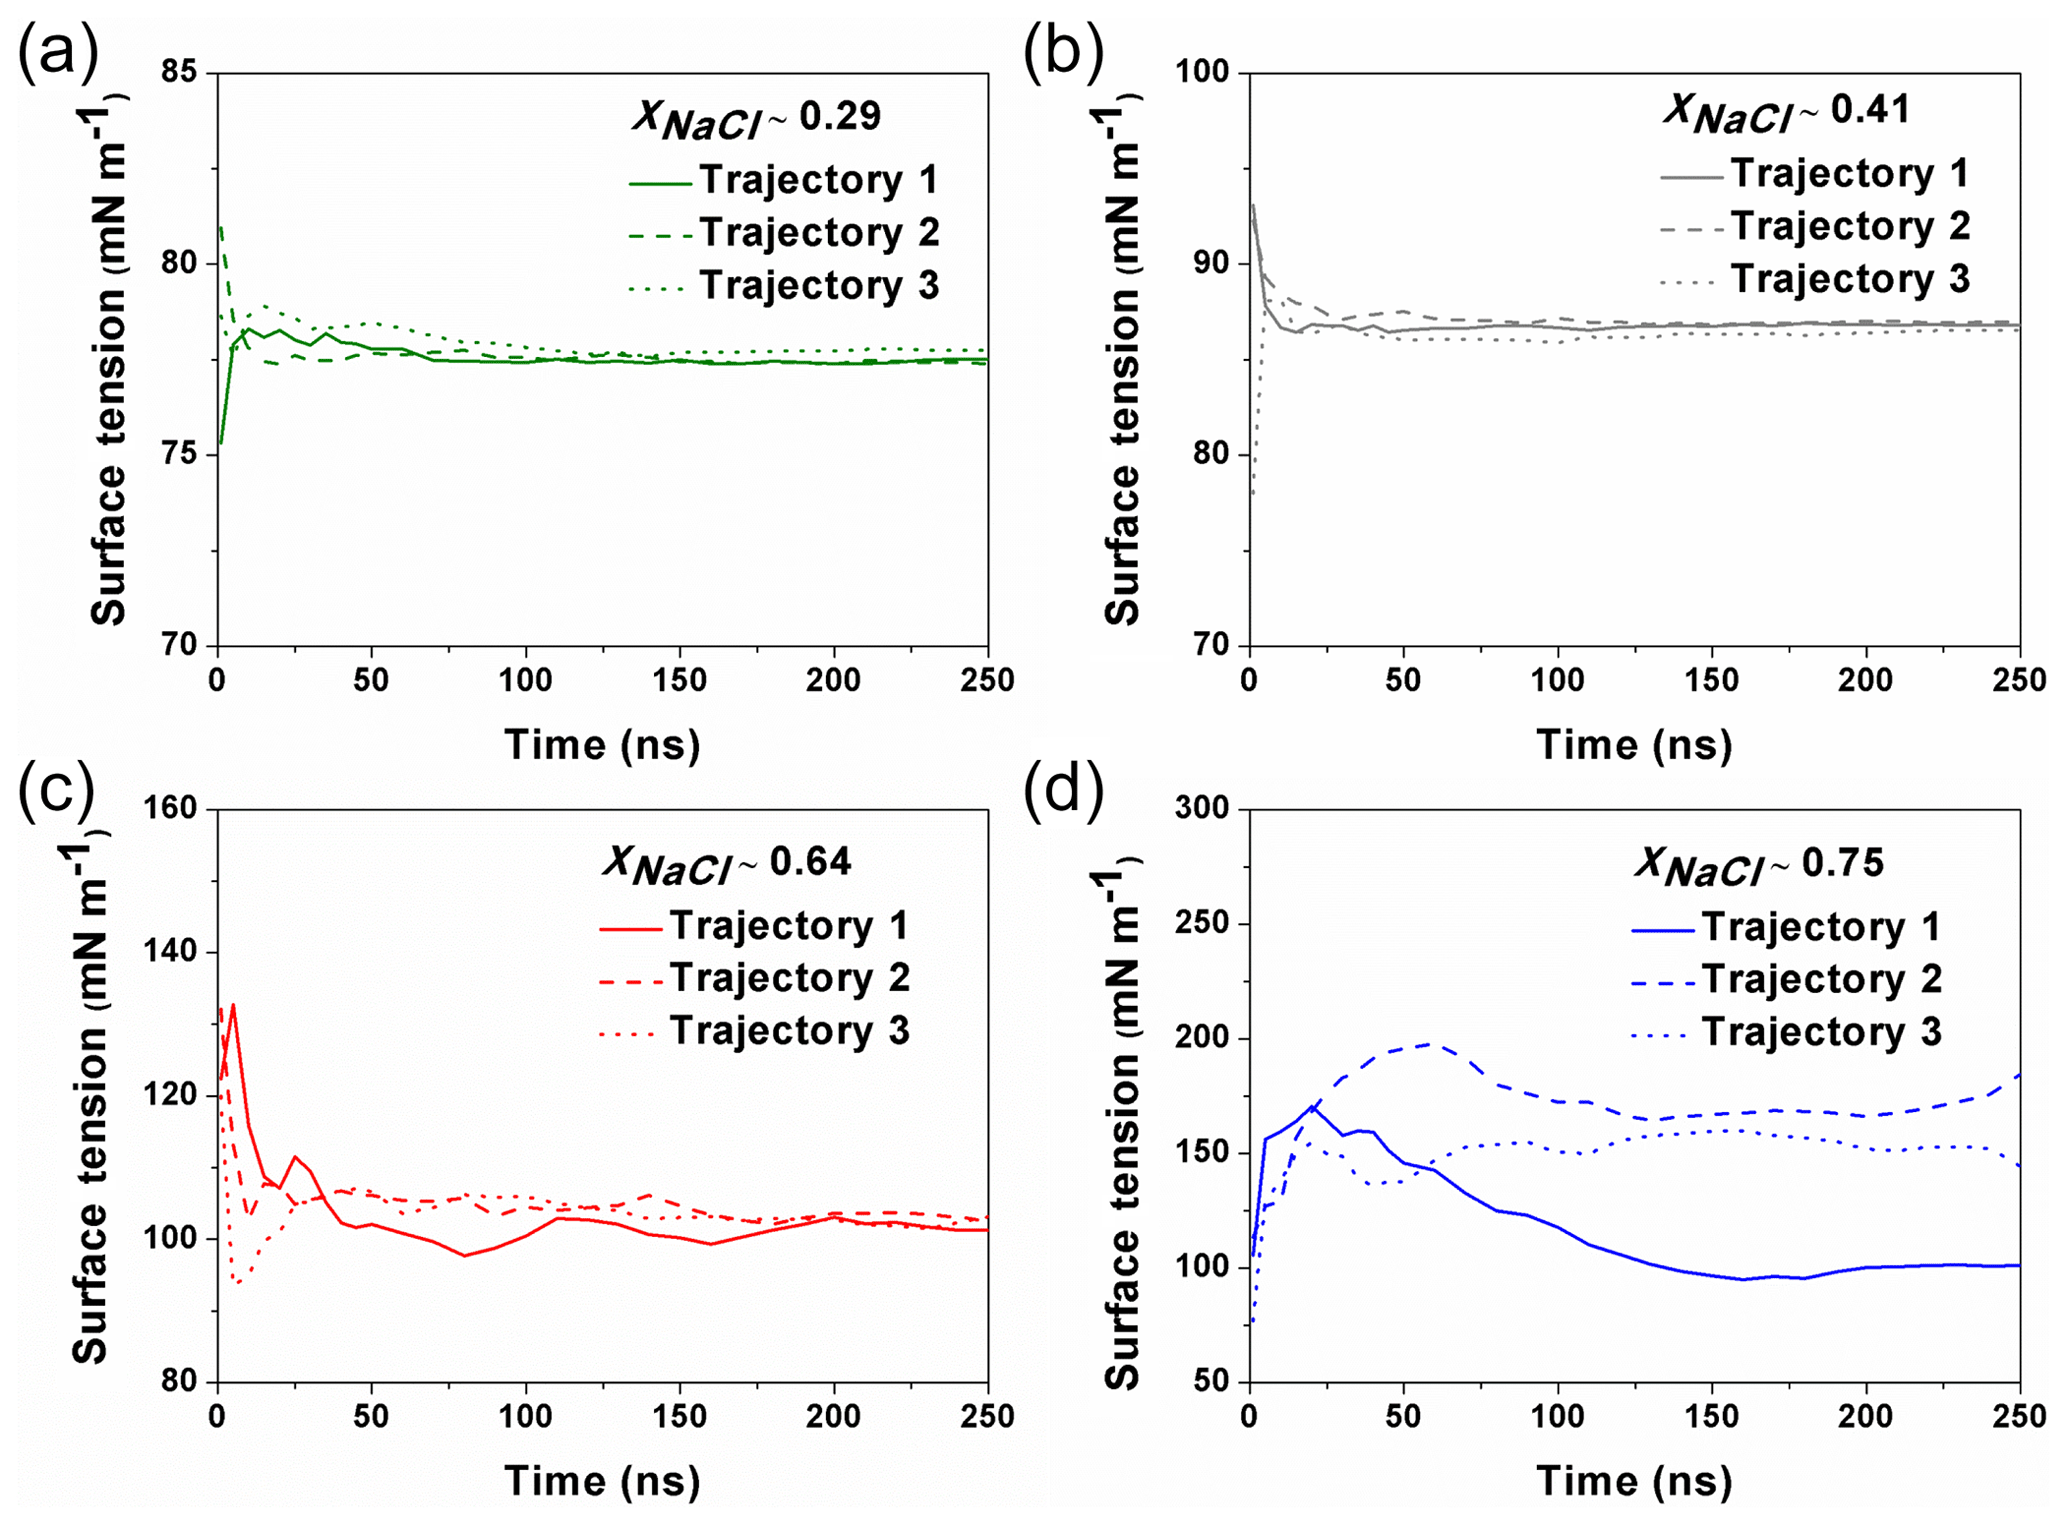
Figure 1The calculated surface tension at different simulation time from different trajectories. For the solution with xNaCl≤0.64 (a–c), the surface tension become steadily stabilized after ∼100–150 ns, and different individual simulation runs converge to a similar result. When xNaCl>0.64 (d; here xNaCl=0.75), the surface tension keeps fluctuating and the final values from different individual simulations cannot be converged even after 250 ns.
2.1 MD simulation
MD simulations were carried out with the GROMACS 5.1 package (Abraham et al., 2015). The Na+ ions, Cl− ions and water molecules were added into a cubic box (L=5 nm) to imitate the NaCl solution. The concentrations of simulated solutions are summarized in Table 1. To simulate the surface tension of supersaturated NaCl aqueous solution, we make use of the time window in the MD simulations before the crystallization starts in the system. The highest xNaCl we can reach is ∼0.64 (the corresponding concentration is ∼30.39 mol kg−1), below which the simulated surface tensions in three independent runs stably converge after 50 to 100 ns (Fig. 1). For more concentrated solutions, stable convergence cannot be reached, e.g., large fluctuations are shown in Fig. 1d at xNaCl of 0.75.
According to Dutcher et al. (2010), surface tension of liquid or molten NaCl at 298.15 K (corresponding xNaCl is 1, infinite concentrated solution) can be regarded as the upper boundary of σNaCl,sol. However, a direct simulation of surface tension of molten NaCl at 298.15 K would not be possible, due to excessively large relaxation times of this system at this temperature. It has been found that surface tensions of a very wide range of molten salts can be well described by linear functions of temperature (Sada et al., 1984; Horvath, 1985; Janz, 1988; Dutcher et al., 2010). We thus follow the approach of Dutcher et al. (2010) assuming a linear relationship between surface tension of molten NaCl and temperature. With this approach, we retrieve the surface tension of molten NaCl at 298.15 K by extrapolating the simulated surface tension of molten NaCl in the temperature range of 1000 to 1700 K. Note that, in principle, non-linearity could still be possible at very high degrees of supercooling (e.g., close to or at room temperature) for the molten salts, which may introduce uncertainties to the offset obtained by the extrapolation.

The simulation procedure we followed is the following (Fig. 2): (1) systems were firstly energetically minimized by the steepest descent method (Stillinger and Weber, 1985). (2) Solutions were equilibrated in the NVT ensemble (constant-temperature, constant-volume) and NPT ensemble (constant-temperature, constant-pressure) (pressure=1 bar) with periodic boundary conditions in three directions. The temperature was controlled by using the Nosé–Hoover thermostat (Nosé, 1984; Hoover, 1985). The box volume change due to the variation in density at different temperatures, and in our case the length of the cubic box varied from 4.9 to 5.1 nm. (3) The box was elongated along the z direction with Lz=20 nm to create two interfacial regions. (4) The solution was equilibrated and simulated with the NVT ensemble in the rectangular parallelepiped box at the corresponding temperature. (5) Systems without surfaces were also simulated for further energy analysis, and the trajectories obtained from step 2 were simulated with NPT ensemble. (6) All simulations were carried out for at least 200 ns, which is much longer than that in previous studies (a few nanoseconds; Jungwirth and Tobias, 2000; Neyt et al., 2013), because the system that we were dealing with is much more concentrated. A 1 fs time step was adopted and conformations for analysis were saved every 2 ps. Both electrostatic interactions and van der Waals interactions were calculated using the particle mesh Ewald (PME) algorithm, which has been proven to be a good choice for accurate calculation of long-range interactions (Essmann et al., 1995; Fischer et al., 2015). To test the reproducibility, all the systems were simulated 3 times, and the respective statistical error bars were provided.
In our simulation, the Joung–Cheatham (JC) force field for NaCl (Joung and Cheatham III, 2009) with SPC/E water model (Berendsen et al., 1987) was applied to simulate the NaCl solution and molten NaCl. The solubility at 298.15 K based on the JC force field with SPC/E model has been determined as 3.7±0.2 mol kg−1 (Moučka et al., 2013; Mester and Panagiotopoulos, 2015; Espinosa et al., 2016), which to the best of our knowledge is the value closest to the experimental value of solubility (∼6.15 mol kg−1). Therefore, this force field is appropriate to use to study the concentration dependence of properties. More details about the history of the attempts to correctly calculate the quantity by molecular simulation can be found in the review by Nezbeda et al. (2016).
2.2 Calculation of surface tension
Based on results from MD simulations, the surface tension was calculated by using the mechanical definition of the atomic pressure (Alejandre et al., 1995):
where σMD can represent the surface tension of molten NaCl (σNaCl), NaCl solution (σNaCl,sol) or pure water (σwater); Lz is the length of the simulation cell in the longest direction (along z axis) and Paa (a=x, y, z) denotes the diagonal component of the pressure tensor. The 〈…〉 refers to the time average. The factor 0.5 outside the squared brackets takes into account the two interfaces in the system. Only the stable values were taken as our calculated surface tension.
2.3 Energy analysis
The excess surface enthalpy denotes the additional enthalpy in the system due to the creation of surfaces. It can be calculated as the difference of enthalpy between solutions with and without surfaces (Bahadur et al., 2007),
where Hb_s is the total enthalpy of simulated systems with surfaces and Hb is the total enthalpy of simulated systems without surfaces. As the kinetic energy is the same for systems with or without surfaces and the difference of pV can be ignored, ΔH can be presented as
where Eb_s and Eb are the potential energy of the system with and without surfaces.
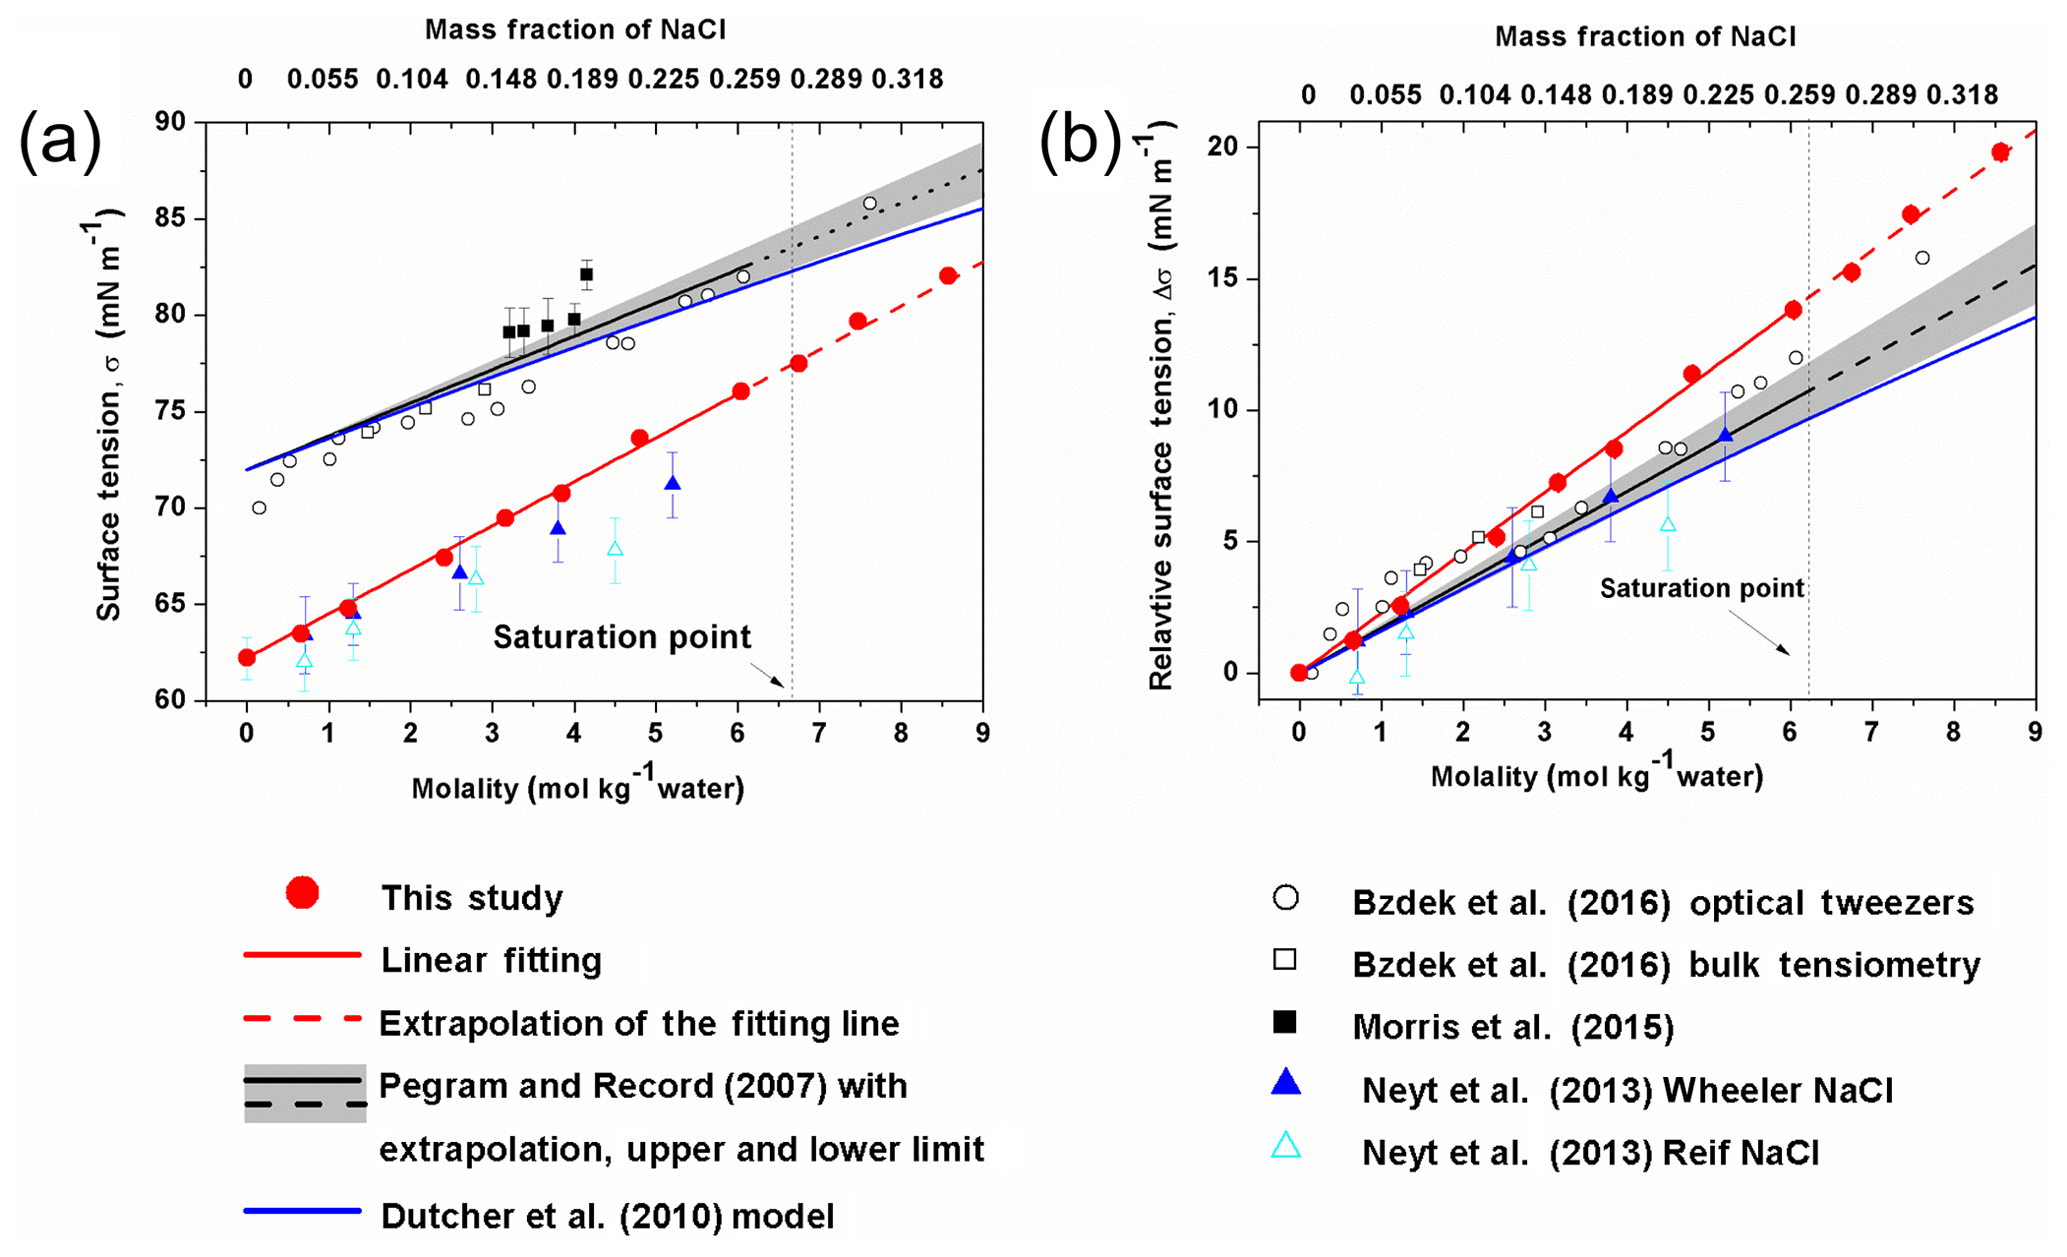
Figure 3Surface tension (a) and relative surface tension (b) defined as as a function of the concentration of NaCl. The σwater in the Morris et al. (2015) study was not determined, thus the corresponding Δσ is not shown in (b).
Then the surface tension can be determined by the excess surface free energy per unit area as in Eq. (4) (Davidchack and Laird, 2003):
where ΔG is the increased part of free energy due to the creation of surfaces, A is the total area of the surface we created, so and a is the area of each created surface. ΔS is the excess surface entropy. We then can retrieve ΔS by using the data of enthalpy and surface tension:
where ΔH and T⋅ΔS per unit area ( and ) are obtained as the enthalpic and entropic part of the contributions to the net surface tension, which will be used to explain the change of surface tension along with the mass fraction of NaCl (xNaCl).
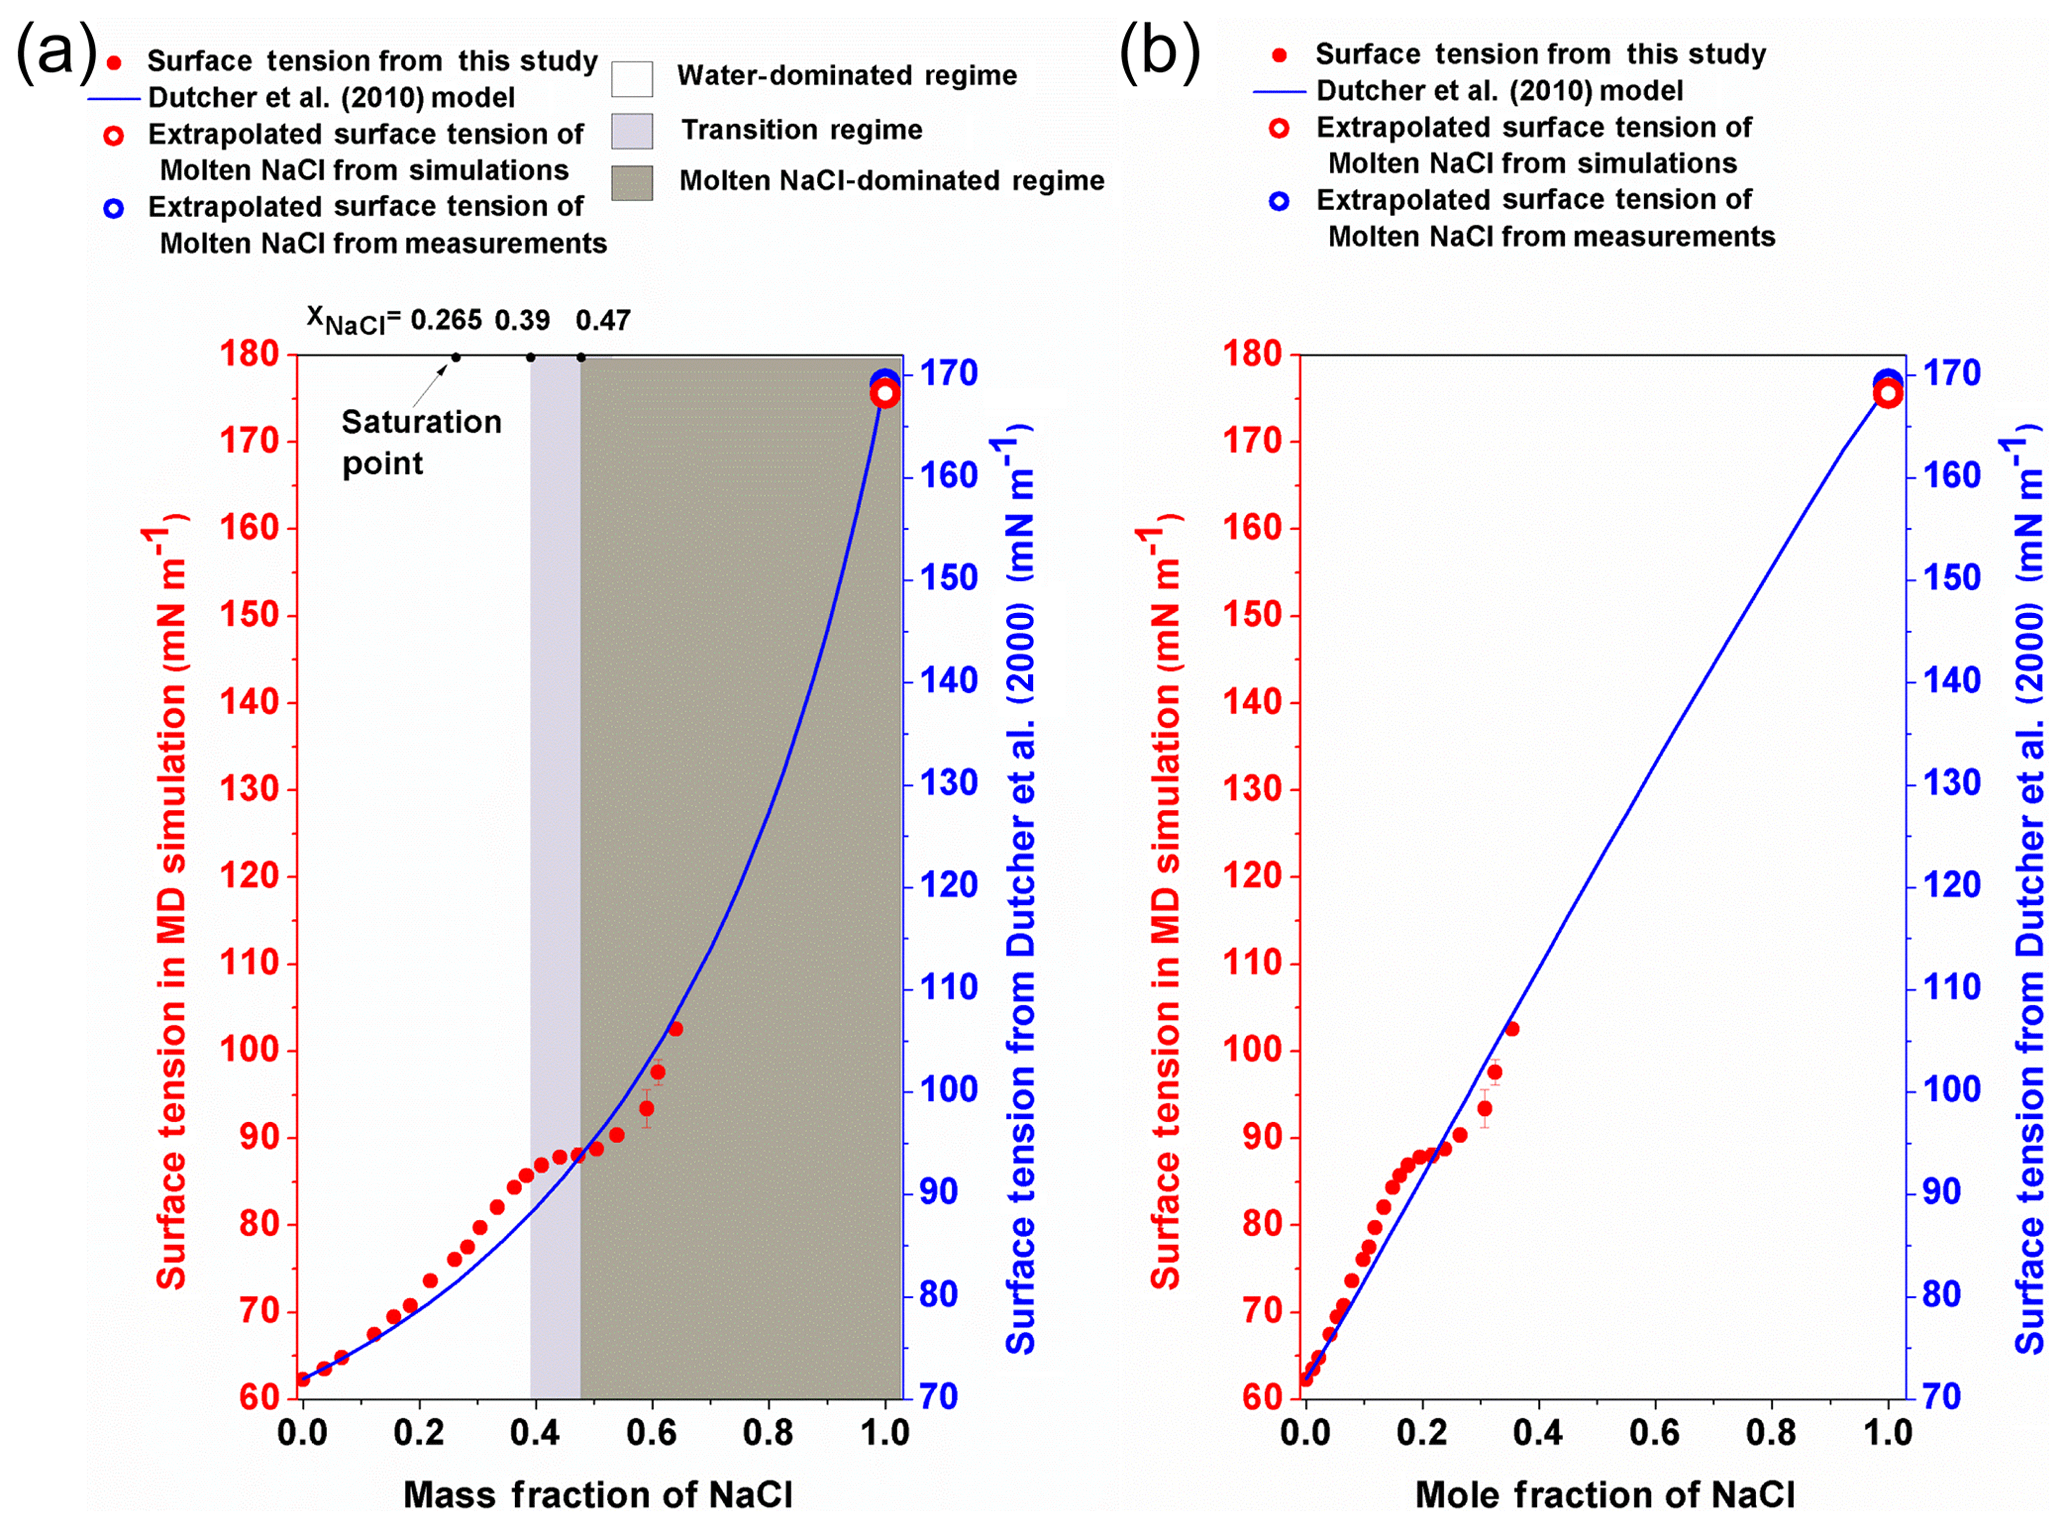
Figure 4The surface tension of different-concentration NaCl solution. (a) The surface tension of NaCl solution against the mass fraction of NaCl. The left red y axis is for the data from MD simulation (red circle), and the right blue y axis is for the Dutcher et al. (2010) model (blue solid line). The white, light grey and dark grey areas shade the water-dominated, transition and molten NaCl-dominated regimes, respectively. (b) The surface tension of NaCl solution is plotted against the mole fraction of NaCl.
3.1 Water-dominated regime ()
In Fig. 3a, the calculated surface tension of NaCl aqueous solution (σNaCl,sol) is compared with experimentally determined values (Jarvis and Scheiman, 1968; Johansson and Eriksson, 1974; Aveyard and Saleem, 1976; Weissenborn and Pugh, 1995; Matubayasi et al., 2001; Pegram and Record, 2006, 2007; Morris et al., 2015; Bzdek et al., 2016) in the subsaturated concentration range (molality of NaCl solution from 0 to 6.15 mol kg−1 and xNaCl from 0 to ∼0.265). At 298.15 K, both model simulation (red solid points and fit line in Fig. 3a) and experimental observation (black line in Fig. 3a) reveal a linear dependence of surface tension on solution concentration at molality scale, with a very similar slope (2.1 versus 1.73±0.17, respectively). Systematic underestimation, however, exists in the simulated σNaCl,sol. The previous MD simulations by Neyt et al. (2013) have also reported a similar result for the solution whose concentration ranges from 0 to 5.2 mol kg−1 by using the same water model (SPC/E) but two different NaCl force fields, i.e., Wheeler NaCl (solid dark-blue triangle in Fig. 3a) and Relf NaCl (open light-blue triangle in Fig. 3a). Bhatt et al. (2004) also used the Wheeler NaCl model and SPC/E water model revealing a linear dependence and underestimation. We also subtracted the experimentally determined and the MD-simulated surface tension of pure water (σwater) from the observed and modeled σNaCl,sol, respectively. The relative increase in surface tension () from models and experiments converge nicely (Fig. 3b), and the former is only a little higher than the latter. The MD simulation is able to reproduce the increment in the growth of surface tension from pure water due to the addition of solute NaCl, although the predicted absolute value of σNaCl,sol is systematically underestimated, which may mainly be attributed to the discrepancy between observed σwater and the modeled ones from the SPC/E water model.
By performing MD simulations in the supersaturated concentration range, we found that this linear relationship still holds beyond the saturation point until xNaCl of ∼0.39 (Fig. 4). As mentioned above, the laboratory experiments with elevated NaCl aqueous droplet and the optical tweezer method show that the linear relationship between σNaCl,sol and NaCl concentration (molality scale) can be extended to ∼8 mol kg−1 (Fig. 3; Bzdek et al., 2016), corresponding to xNaCl of ∼0.33 (Fig. 4), which is consistent with our simulations.
3.2 Transition regime (xNaCl from ∼0.39 to ∼0.47)
It was often found that surface tensions of single inorganic electrolyte aqueous solutions were linear functions of concentration (at the molality scale) over the moderate concentration range (Horvath, 1985; Dutcher et al., 2010). However, these simple relationships may not hold when the solutions become more concentrated. As shown in Fig. 4, starting from xNaCl∼0.39, the simulated σNaCl,sol remains almost unchanged until xNaCl of ∼0.47 (concentration upon efflorescence). This inflection point of σNaCl,sol at xNaCl of ∼0.39 is supported by those determined by the DKA approach (Cheng et al., 2015), where there is a large deviation of surface tension from the monotonic linear increase. Note that beyond xNaCl of ∼0.47, the simulated surface tension increases again (Fig. 4). This second inflection point, right at the concentration upon efflorescence, may imply a potential correlation with crystallization processes.
3.3 Molten NaCl-dominated regime ()
Beyond the second inflection point (xNaCl>0.47), the simulated σNaCl,sol gradually increases more and more strongly (Fig. 4). Unfortunately, due to the large fluctuation in the surface tension simulation (Fig. 1), we are not able to extend our surface tension calculation in this way beyond xNaCl of ∼0.64. However, according to Dutcher et al. (2010), it is expected that the surface tension of the solution would ultimately approach the surface tension of the hypothetical molten solute (i.e., xNaCl=1) at the same temperature. This hypothesis has been found to be consistent with the DKA retrieval for a highly concentrated ammonium sulfate aqueous solution with molality of ∼380 mol kg−1 (Cheng et al., 2015). We thus also try to constrain the growth of σNaCl,sol by MD-simulated surface tension of molten NaCl (σNaCl) at 298.15 K.

Figure 5The surface tension of molten NaCl at different temperatures. The equation in Janz's study (1988) is (blue solid line). The fitting line based on our data is (red solid line). The red and blue open circles represent the extrapolated value of surface tension in simulation and reality, respectively.
Similar to the experimental results of Janz (1988), the simulated σNaCl is also linearly correlated with temperature from 1000 K (the simulated melting point of NaCl) to 1700 K, as shown in Fig. 5. Following Dutcher et al. (2010), a surface tension of ∼175.58 mN m−1 is obtained for the hypothetical molten NaCl at 298.15 K by linear extrapolation of the MD simulated σNaCl at higher temperature, which is very close to the ∼169.7 mN m−1 extrapolated from the experimental results (Dutcher et al., 2010). Combined with mN m−1, the simulated σNaCl,sol in the concentration range of xNaCl>0.47 shows the tendency to ultimately approach the surface tension of melting NaCl at 298.15 K, similar to the blue curve in Fig. 4 from the Dutcher et al. (2000) study.
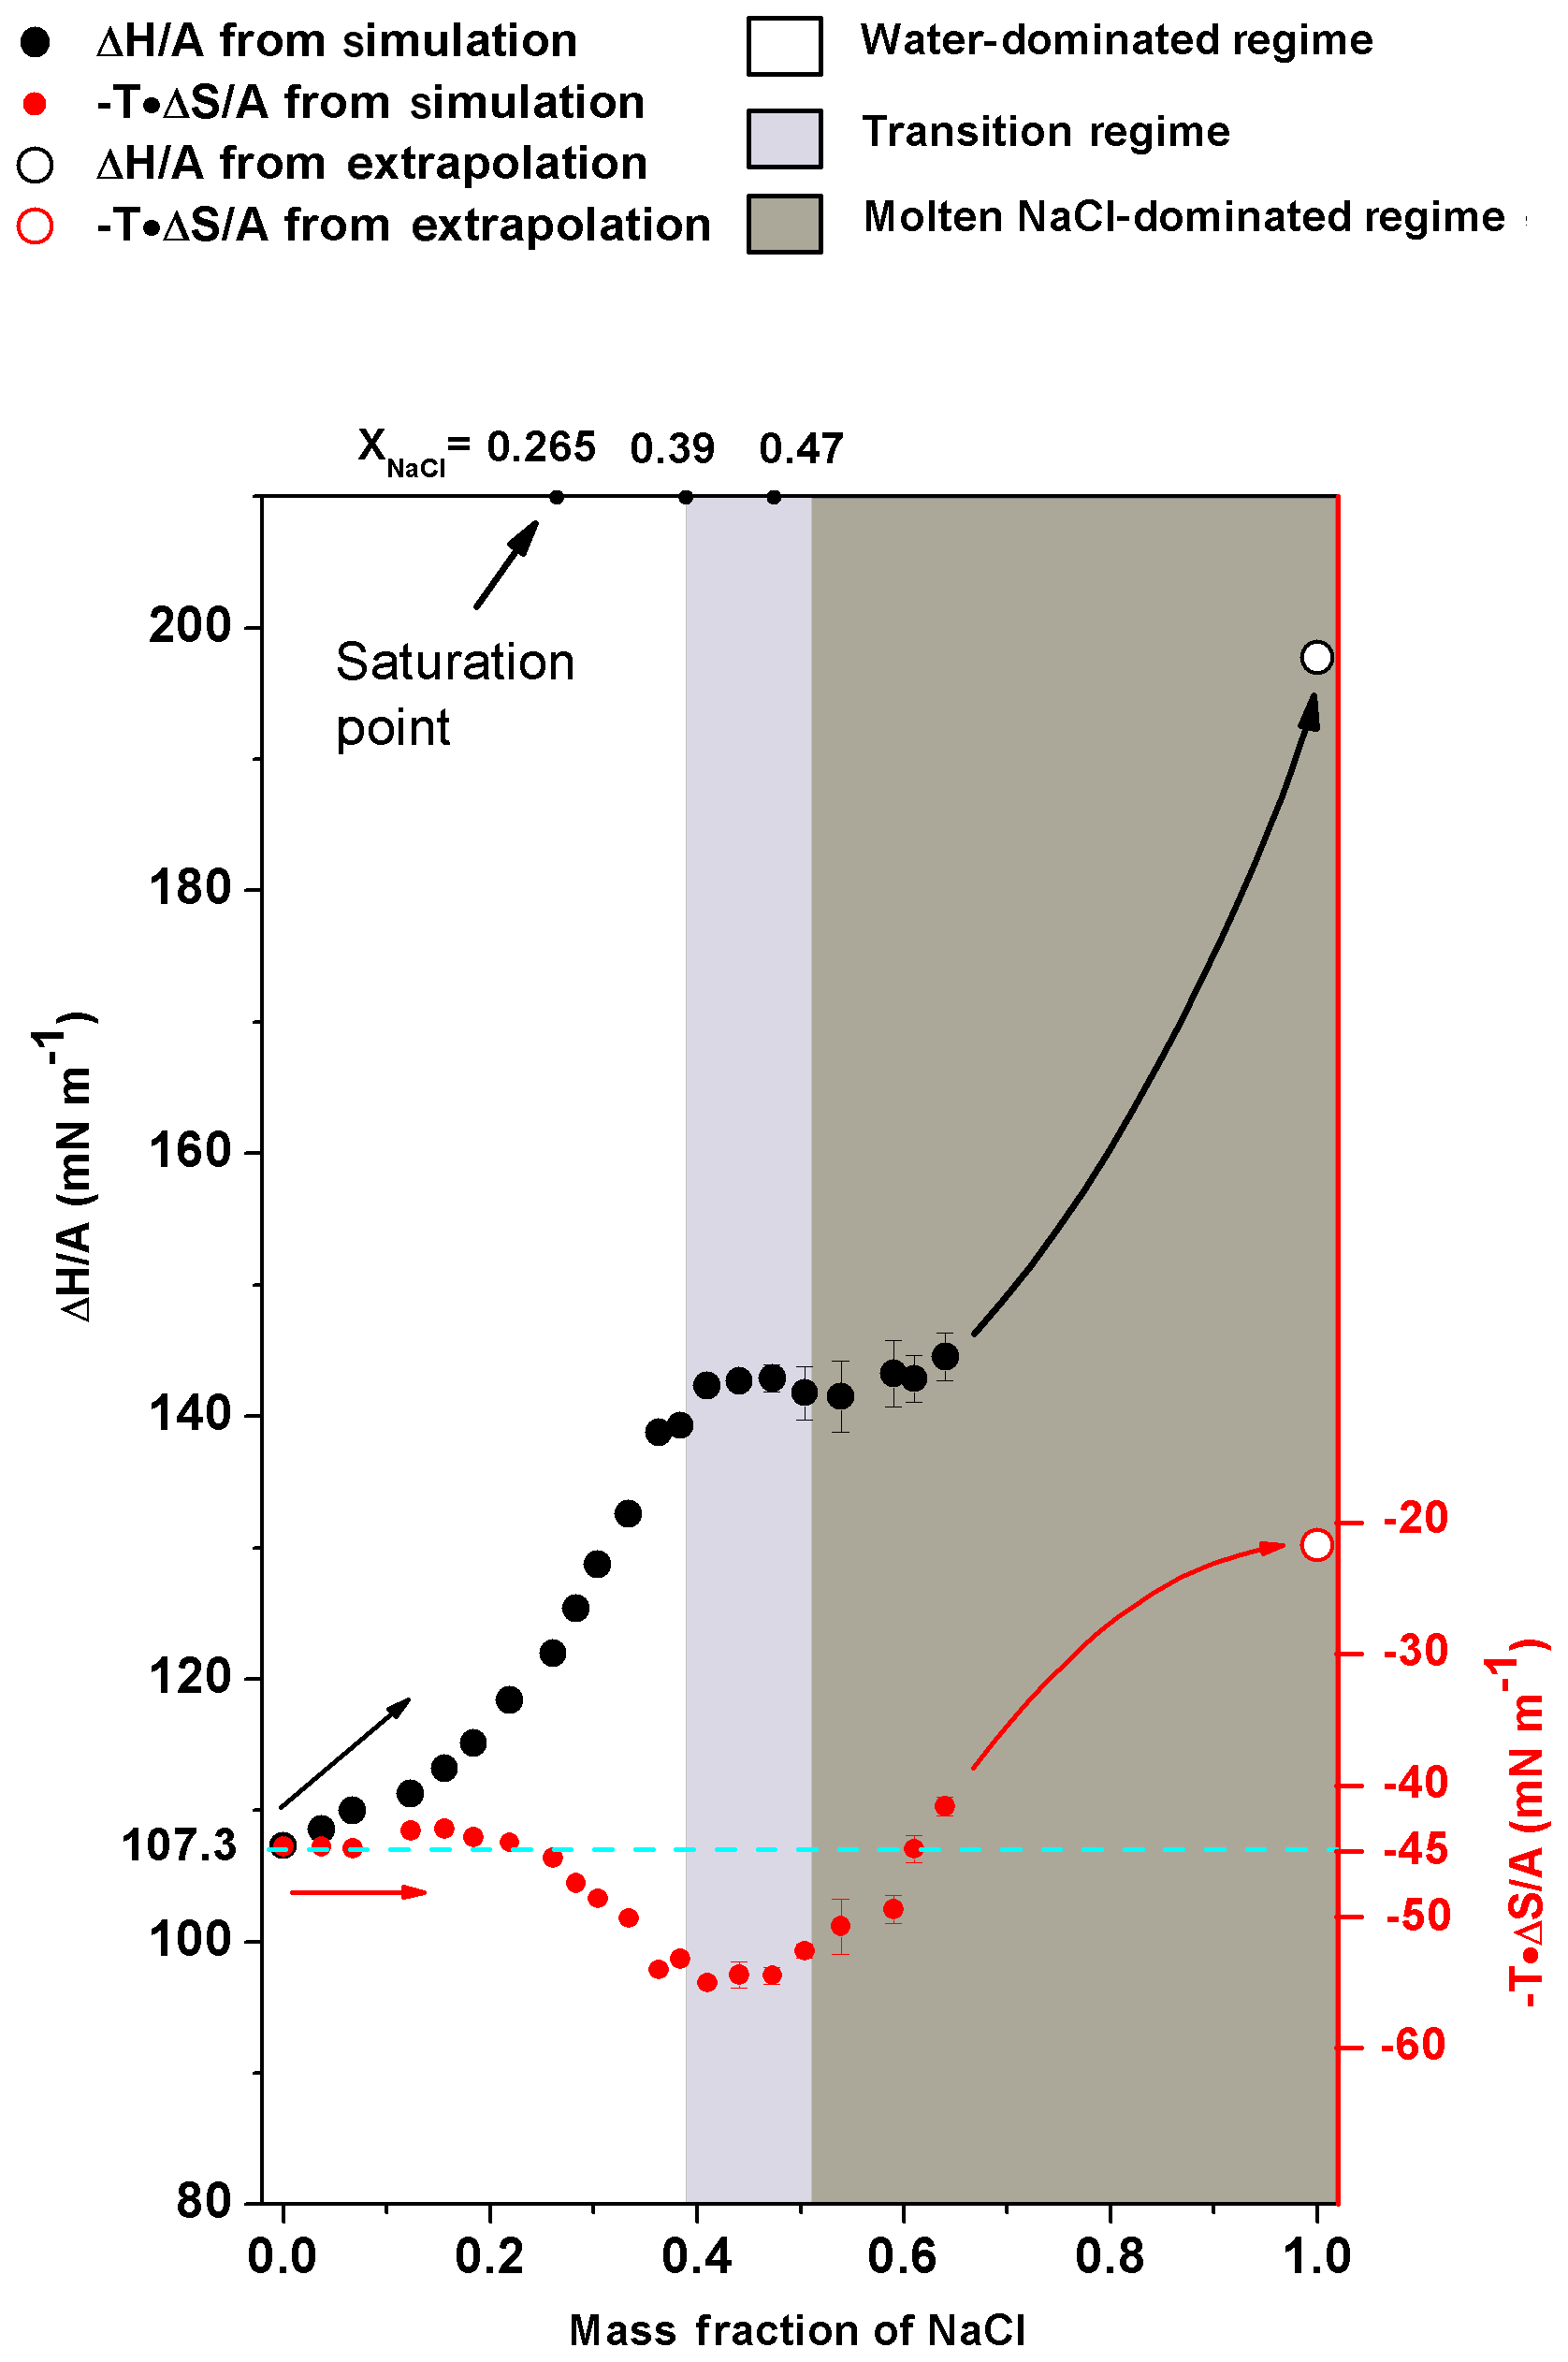
Figure 6The excess surface enthalpy and entropy per unit area ( and ) of different NaCl solution concentrations. (black circles) and (red circles) are shown as a function of mass fraction of NaCl. The solid circles are obtained from simulation directly, and the open circles are obtained from the extrapolation of corresponding properties of molten NaCl. The cyan dashed line is only an auxiliary line for clearer view. Shaded areas are the same as in Fig. 4.
3.4 Physical chemistry behind the regimes
In energetic analyses, surface tension was decomposed into excess surface enthalpy ( and excess surface entropy (). Note that the increase in excess surface entropy () or decrease in will negatively contribute to the growth of σNaCl,sol. The analyses show that the monotonic increase in surface tension in water-dominated concentration ranges (xNaCl from 0 to ∼0.39) is driven by the increase in when the solution becomes concentrated (Fig. 6). When the solution gets concentrated, first increases slightly with enhanced increasing rate at and in the supersaturated regime up to xNaCl of ∼0.39. behaves differently, it remains almost constant at about −45 mN m−1 first and only starts to decrease at xNaCl∼0.2. This way, in this concentration range (xNaCl from 0 to ∼0.39), the increase in excess surface enthalpy outnumbers the increase in excess surface entropy and thus this physicochemical regime can be understood as an excess surface enthalpy-driving process.
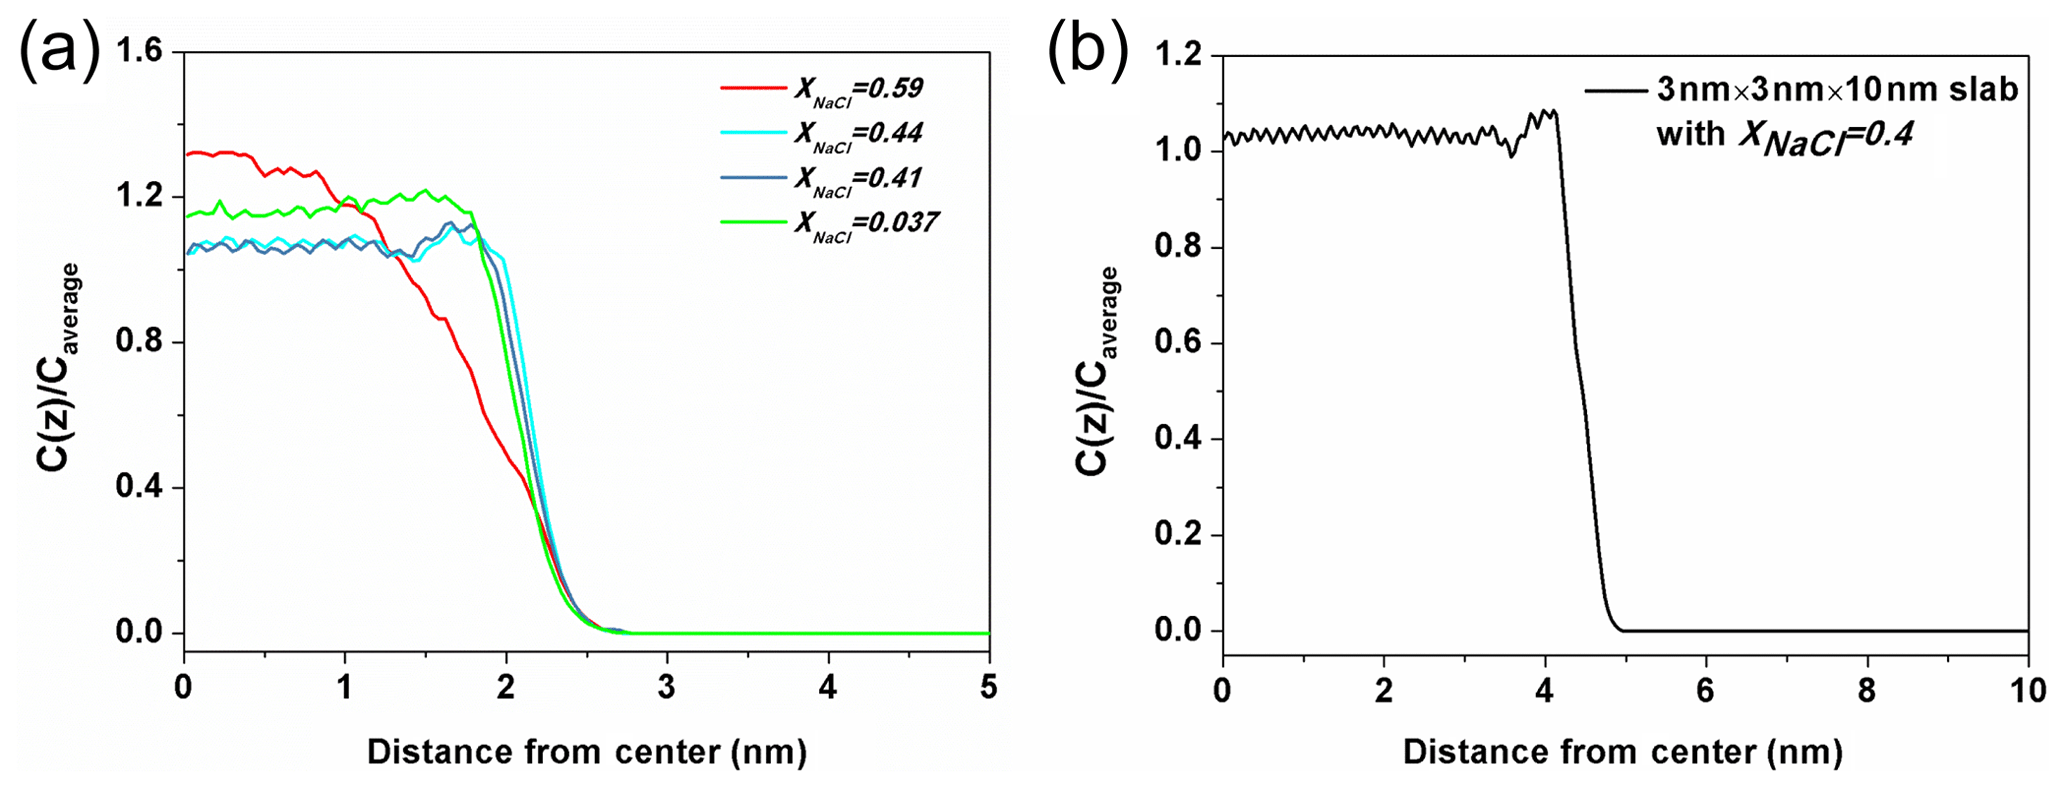
Figure 7The ratio of Na+ concentration at different positions (Cz) to the average concentration of the whole system (Caverage). (a) The solution with xNaCl=0.59 (red line) is on behalf of the solution in the molten NaCl-dominated regime (red line), the solution xNaCl=0.44 and 0.41 (blue lines) represent the solution in transition regime and the solution xNaCl=0.037 (green line) represents the solution in the water-dominated regime. (b) The density profile obtained from a solution slab in which NaCl mass fraction is about 0.4.
The stable surface tension in the transition-regime concentration range (xNaCl from ∼0.39 to ∼0.47) is attributed to the fact that and are both almost unchanged. Figure 6 shows that in the concentration above xNaCl of ∼0.39, the increase in significantly slows down and stabilizes at ∼145 mN m−1 when the mass fraction approaches the efflorescence point. During this period, keeps nearly unchanged, which results in a corresponding σNaCl,sol almost independent of the solution concentration change.
Here, we present a potential explanation for the stability of surface tension in this region from the structural analysis. The ratio of Na+ concentration at different positions to the average concentration of the whole system (Cz∕Caverage) in different solutions is shown in Fig. 7a. The three blue-toned lines represent the ratio of solution in the transition regime with xNaCl from ∼0.39 to ∼0.47. All of them have apophyses (significant rise) near the surface and these apophyses almost overlap with each other. This phenomenon suggests that the solute in these solutions enriches close to the surface and the degree of enrichment is almost the same for the different-concentration solution. Here, we denote the significant difference of the solute concentration in bulk region and on surface as a type of liquid–liquid partitioning. To check if this partitioning is dependent on the size of the solution slab, we calculate the corresponding value of a solution slab with xNaCl of 0.4 (Fig. 7b). There is still an apophysis near the surface, thus we can claim that the partitioning is independent of the size of the solution slab in the simulation. Note that this surface enrichment of NaCl does not mean that NaCl is enriched right on top of the solution surface. Actually the density profile of water extends about 0.2 nm beyond that of NaCl towards the vapor region. By contrast, the solution with xNaCl>0.47 or <0.39 do not have this type of partitioning as shown by the red and green lines. This comparison implies that the stability of surface tension of solution with xNaCl from ∼0.39 to ∼0.47 is related to the “bulk-surface” partitioning. This interpretation is only a conjecture, and more studies are needed to further examine this phenomenon and interpretation. The shallow minimum in the density profile for xNaCl between 0.39 and 0.47 to the left of the maximum is somewhat unexpected, and one might expect equilibration problems. However, we have checked that this structural feature develops already during the first 10 ns of the MD simulation, and does not change at all during the residual 200 ns. Surface enrichment of NaCl can be expected, however, when the solubility limit of the water-rich solution in the bulk is reached. Very roughly, such phenomena are analogous to interfacial wetting phenomena such as surface melting of crystals (Frenken and Van der Veen, 1985), which is sometimes observed when the temperature is raised towards the triple point. In our case, the enrichment zone of NaCl (which is about 0.4 nm thick in Fig. 7) would be a precursor effect to the (metastable) NaCl-rich bulk solution. Tentatively, one may correlate the formation of the enrichment zone with the stability of the surface entropy in this region via the entropy of mixing. At the same time, the surface enhancement of ions may be related to the phenomenon of efflorescence.
As shown in Fig. 6, when a solution gets more concentrated from xNaCl of ∼0.47 to ∼0.64, the slightly increases from the plateau of ∼145 mN m−1 but the change is only ∼5 mN m−1. The keeps increasing. So during this period, both the surface excess enthalpy and entropy terms contribute to the growth of σNaCl,sol. To constrain the energetic analyses, the and were also calculated for the molten NaCl at 298.15 K. According to Fig. 5, we have ; then we can get because of (Landau and Lifshitz, 1969). Therefore, for molten NaCl (xNaCl=1.0), at 298.16 K is 22.15 mN m−1, and at 298.15 K is 198.09 mN m−1 (Fig. 6). Here, we used the derivative of the temperature–surface tension relation to calculate the excess surface entropy, and more discussions about the comparison of these methods can be found in the Supplement (Fig. S1). As can be seen in Fig. 6, it is expected that the excess surface enthalpy term will still have a large amount (about more than 50 mN m−1) to grow until approaching of molten NaCl at 298.15 K. It is similar for the surface excess entropy term while the increment is smaller. Thus, the fast increase in σNaCl,sol in the concentration of xNaCl from ∼0.47 to 1 can be assumed to be a process driven by excess surface enthalpy and excess surface entropy.
The analysis based on the calculated surface tension confirms the basic concept of the Dutcher et al. (2010) semiempirical model, while unfolding a more detailed global landscape of concentration dependence of surface tension of aqueous NaCl solution and its driving forces: (1) a water-dominated regime (xNaCl from 0 to ∼0.39; at low concentrations ions are solvated by the water molecules, which means that water-structures/hydration shells are formed around ions); (2) a transition regime (xNaCl from ∼0.39 to ∼0.47); and (3) a molten NaCl-dominated regime (xNaCl from ∼0.47 to 1, at very high salt concentration water molecules are solvated by the ions, which means that a salt-structure is formed around the water molecules). Note that our result may not exactly reflect the real mode of surface tension of NaCl solution along the concentration, but it does imply the concept of a non-monotonic change of surface tension. One must be aware that for nucleation processes in the atmosphere other chemical compounds also matter, and will require future study. Also, mixed salt solutions would be very interesting, and can in principle be studied with similar simulation methods as applied here; however, this task must be left to future work.
Readers who are interested in the data should contact the authors: Yafang Cheng (yafang.cheng@mpic.de), Hang Su (h.su@mpic.de) or Xiaoxiang Wang (xiaoxiang.wang@mpic.de).
The supplement related to this article is available online at: https://doi.org/10.5194/acp-18-17077-2018-supplement.
YC and HS conceived and led the study. XW performed the MD simulation and analyzed the data. XW, YC, KB and HS interpreted the results. UP and CC discussed the results and commented on the manuscript. XW, KB, YC, CC and HS wrote the manuscript with input from all coauthors.
The authors declare that they have no conflict of interest.
This study is supported by the Max Planck Society (MPG). Xiaoxiang Wang
acknowledges the support from China Scholarship Council (CSC, 201406190170).
Yafang Cheng acknowledges the Minerva Program from MPG.
The article processing charges for this open-access
publication were covered by the Max Planck Society.
Edited by: Maria Cristina Facchini
Reviewed by: two anonymous referees
Abraham, M. J., Murtola, T., Schulz, R., Páll, S., Smith, J. C., Hess, B., and Lindahl, E.: GROMACS: High performance molecular simulations through multi-level parallelism from laptops to supercomputers, SoftwareX., 1, 19–25, 2015.
Alejandre, J., Tildesley, D. J., and Chapela, G. A.: Molecular dynamics simulation of the orthobaric densities and surface tension of water, J. Chem. Phys., 102, 4574–4583, 1995.
Aveyard, R. and Saleem, S. M.: Interfacial tensions at alkane-aqueous electrolyte interfaces, J. Am. Chem. Soc., 72, 1609–1617, 1976.
Bahadur, R., Russell, L. M., and Alavi, S.: Surface tensions in NaCl-water-air systems from MD simulations, J. Phys. Chem. B, 111, 11989–11996, 2007.
Berendsen, H., Grigera, J., and Straatsma, T.: The missing term in effective pair potentials, J. Phys. Chem., 91, 6269–6271, 1987.
Bhatt, D., Newman, J., and Radke, C.: Molecular dynamics simulations of surface tensions of aqueous electrolytic solutions, J. Phys. Chem. B, 108, 9077–9084, 2004.
Biskos, G., Malinowski, A., Russell, L., Buseck, P., and Martin, S.: Nanosize effect on the deliquescence and the efflorescence of sodium chloride particles., Aerosol Sci. Tech., 40, 97–106, 2006.
Bzdek, B. R., Power, R. M., Simpson, S. H., Reid, J. P., and Royall, C. P.: Precise, contactless measurements of the surface tension of picolitre aerosol droplets, Chem. Sci., 7, 274–285, 2016.
Chen, Y., Cheng, Y., Ma, N., Wolke, R., Nordmann, S., Schüttauf, S., Ran, L., Wehner, B., Birmili, W., van der Gon, H. A. C. D., Mu, Q., Barthel, S., Spindler, G., Stieger, B., Müller, K., Zheng, G.-J., Pöschl, U., Su, H., and Wiedensohler, A.: Sea salt emission, transport and influence on size-segregated nitrate simulation: a case study in northwestern Europe by WRF-Chem, Atmos. Chem. Phys., 16, 12081–12097, https://doi.org/10.5194/acp-16-12081-2016, 2016.
Cheng, Y., Su, H., Koop, T., Mikhailov, E., and Pöschl, U.: Size dependence of phase transitions in aerosol nanoparticles, Nat. Commun., 6, 5923, 2015.
Davidchack, R. L. and Laird, B. B.: Direct calculation of the crystal–melt interfacial free energies for continuous potentials: Application to the Lennard-Jones system, J. Chem. Phys., 118, 7651–7657, 2003.
Dutcher, C. S., Wexler, A. S., and Clegg, S. L.: Surface tensions of inorganic multicomponent aqueous electrolyte solutions and melts, J. Phys. Chem. A, 114, 12216–12230, 2010.
Espinosa, J., Young, J., Jiang, H., Gupta, D., Vega, C., Sanz, E., Debenedetti, P., and Panagiotopoulos, A.: On the calculation of solubilities via direct coexistence simulations: Investigation of NaCl aqueous solutions and Lennard-Jones binary mixtures, J. Chem. Phys., 145, 154111, https://doi.org/10.1063/1.4964725, 2016.
Essmann, U., Perera, L., Berkowitz, M. L., Darden, T., Lee, H., and Pedersen, L. G.: A smooth particle mesh Ewald method, J. Chem. Phys., 103, 8577–8593, 1995.
Finlayson-Pitts, B.: The tropospheric chemistry of sea salt: A molecular-level view of the chemistry of NaCl and NaBr, Chem. Rev., 103, 4801–4822, 2003.
Fischer, N. M., van Maaren, P. J., Ditz, J. C., Yildirim, A., and van der Spoel, D.: Properties of organic liquids when simulated with long-range Lennard-Jones interactions, J. Chem. Theory Comput., 11, 2938–2944, 2015.
Frenken, J. W. M. and Van der Veen, J. F.: Observation of surface melting, Phys. Rev. Lett., 54, 134–137, 1985.
Ghorai, S., Wang, B., Tivanski, A., and Laskin, A.: Hygroscopic properties of internally mixed particles composed of NaCl and water-soluble organic acids, Environ. Sci. Technol., 48, 2234–2241, 2014.
Harkins, W. D. and Brown, F.: The determination of surface tension (free surface energy), and the weight of falling drops: The surface tension of water and benzene by the capillary height method, J. Am. Chem. Soc., 41, 499–524, 1919.
Hoover, W. G.: Canonical dynamics: equilibrium phase-space distributions, Phys. Rev. A, 31, 1695, https://doi.org/10.1103/PhysRevA.31.1695, 1985.
Horvath, A. L.: Handbook of aqueous electrolyte solution physical properties, estimation and correlation methods, Ellis Horwood Series in Physical Chemistry, Ellis Horwood Limited, New York, 1985.
Janz, G. J.: Thermodynamic and transport properties for molten salts: correlation equations for critically evaluated density, surface tension, electrical conductance, and viscosity data, Amer. Inst. of Phys., New York, 1988.
Jarvis, N. L. and Scheiman, M. A.: Surface potentials of aqueous electrolyte solutions, J. Phys. Chem., 72, 74–78, 1968.
Johansson, K. and Eriksson, J. C.: γ and dγ∕dT measurements on aqueous solutions of 1, 1-electrolytes, J. Colloid Interf. Sci., 49, 469–480, 1974.
Joung, I. S. and Cheatham III, T. E.: Molecular dynamics simulations of the dynamic and energetic properties of alkali and halide ions using water-model-specific ion parameters, J. Phys. Chem. B, 113, 13279–13290, 2009.
Jungwirth, P. and Tobias, D. J.: Surface effects on aqueous ionic solvation: A molecular dynamics simulation study of NaCl at the air/water interface from infinite dilution to saturation, J. Phys. Chem. B, 104, 7702–7706, 2000.
Kumar, A.: Aqueous guanidinium salts: Part II. Isopiestic osmotic coefficients of guanidinium sulphate and viscosity and surface tension of guanidinium chloride, bromide, acetate, perchlorate and sulphate solutions at 298.15 K, Fluid Phase Equilibr., 180, 195–204, 2001.
Landau, L. D. and Lifshitz, E. M.: Statistical physics, Pergamon press, Oxford, 1969.
Levin, Y. and Flores-Mena, J.: Surface tension of strong electrolytes, EPL, 56, 187–192, 2001.
Lewis, E. R. and Schwartz, S. E.: Sea salt aerosol production: mechanisms, methods, measurements, and models-A critical review, American Geophysical Union, Washington, D.C., 2004.
Li, Z. and Lu, B. C.-Y.: Surface tension of aqueous electrolyte solutions at high concentrations – representation and prediction, Chem. Eng. Sci., 56, 2879–2888, 2001.
Li, Z.-B., Li, Y.-G., and Lu, J.-F.: Surface tension model for concentrated electrolyte aqueous solutions by the Pitzer equation, Ind. Eng. Chem. Res., 38, 1133–1139, 1999.
Martin, S. T.: Phase transitions of aqueous atmospheric particles, Chem. Rev., 100, 3403–3454, 2000.
Matubayasi, N., Tsunetomo, K., Sato, I., Akizuki, R., Morishita, T., Matuzawa, A., and Natsukari, Y.: Thermodynamic quantities of surface formation of aqueous electrolyte solutions: IV. Sodium halides, anion mixtures, and sea water, J. Colloid Interf. Sci., 243, 444–456, 2001.
Mester, Z. and Panagiotopoulos, A Z.: Mean ionic activity coefficients in aqueous NaCl solutions from molecular dynamics simulations, J. Chem. Phys., 142, 044507, https://doi.org/10.1063/1.4906320, 2015.
Morris, H. S., Grassian, V. H., and Tivanski, A. V.: Humidity-dependent surface tension measurements of individual inorganic and organic submicrometre liquid particles, Chem. Sci., 6, 3242–3247, 2015.
Moučka, F., Nezbeda, I., and Smith, W. R.: Molecular force field development for aqueous electrolytes: 1. Incorporating appropriate experimental data and the inadequacy of simple electrolyte force fields based on Lennard-Jones and point charge interactions with Lorentz–Berthelot rules, J. Chem. Theory Comput., 9, 5076–5085, 2013.
Neyt, J.-C., Wender, A., Lachet, V., Ghoufi, A., and Malfreyt, P.: Prediction of the concentration dependence of the surface tension and density of salt solutions: atomistic simulations using Drude oscillator polarizable and nonpolarizable models, Phys. Chem. Chem. Phys., 15, 11679–11690, 2013.
Nezbeda, I., Moučka, F., and Smith, W. R.: Recent progress in molecular simulation of aqueous electrolytes: Force fields, chemical potentials and solubility, Mol. Phys., 114, 1665–1690, 2016.
Nosé, S.: A molecular dynamics method for simulations in the canonical ensemble, Mol. Phys., 52, 255–268, 1984.
Pegram, L. M. and Record, M. T.: Partitioning of atmospherically relevant ions between bulk water and the water/vapor interface, P. Natl. Acad. Sci. USA, 103, 14278–14281, 2006.
Pegram, L. M. and Record, M. T.: Hofmeister salt effects on surface tension arise from partitioning of anions and cations between bulk water and the air-water interface, J. Phys. Chem. B, 111, 5411–5417, 2007.
Richardson, C. and Snyder, T. D.: A study of heterogeneous nucleation in aqueous solutions, Langmuir, 10, 2462–2465, 1994.
Sada, E., Katoh, S., Yoshii, H., Yamanlshl, T., and Nakanlshl, A.: Performance of the gas bubble column in molten salt systems, Ind. Eng. Chem. Proc. Des. Dev., 23, 151–154, 1984.
Stillinger, F. H. and Weber, T. A.: Computer simulation of local order in condensed phases of silicon, Phys. Rev. B, 31, 5262–5271, 1985.
Vargaftik, N., Volkov, B., and Voljak, L.: International tables of the surface tension of water, J. Phys. Chem. Ref. Dat., 12, 817–820, 1983.
Wagner, R., Höhler, K., Möhler, O., Saathoff, H., and Schnaiter, M.: Crystallization and immersion freezing ability of oxalic and succinic acid in multicomponent aqueous organic aerosol particles, Geophys. Res. Lett., 42, 2464–2472, 2015.
Weissenborn, P. K. and Pugh, R. J.: Surface tension and bubble coalescence phenomena of aqueous solutions of electrolytes, Langmuir, 11, 1422–1426, 1995.
Weissenborn, P. K. and Pugh, R. J.: Surface tension of aqueous solutions of electrolytes: relationship with ion hydration, oxygen solubility, and bubble coalescence, J. Colloid Interf. Sci., 184, 550–563, 1996.
Wexler, A. S. and Clegg, S. L.: Atmospheric aerosol models for systems including the ions H+, , Na+, , , Cl−, Br−, and H2O, J. Geophys. Res.-Atmos, 107, ACH 14-1–ACH 14-14, https://doi.org/10.1029/2001JD000451, 2002.