the Creative Commons Attribution 4.0 License.
the Creative Commons Attribution 4.0 License.
 | 30 Nov 2018
Nitrogen oxides in the global upper troposphere: interpreting cloud-sliced NO2 observations from the OMI satellite instrument
Daniel J. Jacob
Sungyeon Choi
Joanna Joiner
Maria Belmonte-Rivas
Ronald C. Cohen
Steffen Beirle
Lee T. Murray
Luke D. Schiferl
Viral Shah
Lyatt Jaeglé
Nitrogen oxides () in the upper troposphere (UT) have a large impact on global tropospheric ozone and OH (the main atmospheric oxidant). New cloud-sliced observations of UT NO2 at 450–280 hPa (∼6–9 km) from the Ozone Monitoring Instrument (OMI) produced by NASA and the Royal Netherlands Meteorological Institute (KNMI) provide global coverage to test our understanding of the factors controlling UT NOx. We find that these products offer useful information when averaged over coarse scales (, seasonal), and that the NASA product is more consistent with aircraft observations of UT NO2. Correlation with Lightning Imaging Sensor (LIS) and Optical Transient Detector (OTD) satellite observations of lightning flash frequencies suggests that lightning is the dominant source of NOx to the upper troposphere except for extratropical latitudes in winter. The NO2 background in the absence of lightning is 10–20 pptv. We infer a global mean NOx yield of 280±80 moles per lightning flash, with no significant difference between the tropics and midlatitudes, and a global lightning NOx source of 5.9±1.7 Tg N a−1. There is indication that the NOx yield per flash increases with lightning flash footprint and with flash energy.
- Article
(3482 KB) -
Supplement
(2093 KB) - BibTeX
- EndNote


Nitrogen oxides () in the upper troposphere (UT) have profound effects on the oxidizing capacity of the atmosphere and on climate, but the factors controlling their concentrations are poorly understood. NOx in the UT impacts climate by efficiently producing ozone where it is a potent greenhouse gas (Dahlmann et al., 2011; Worden et al., 2011; Rap et al., 2015) and by increasing the concentration of OH (the main tropospheric oxidant) (Murray et al., 2012, 2014). Primary NOx sources in the UT include lightning, aircraft, convective injection, and downwelling from the stratosphere (Ehhalt et al., 1992; Jaeglé et al., 1998; Bertram et al., 2007). NOx cycles chemically with reservoir species including nitric acid (HNO3), pernitric acid (HNO4), dinitrogen pentoxide (N2O5), peroxyacetyl nitrate (PAN), and other organic nitrates, thus defining the NOy chemical family (NOy≡NOx + reservoirs). Effective loss of NOx from the UT is through subsidence of NOy to lower altitudes where deposition of HNO3 provides the ultimate sink. The residence time of NOy in the UT is 10–20 days (Prather and Jacob, 1997). The lifetime of NOx against conversion to short-lived reservoirs varies from ∼3 h in the convective outflow of thunderstorms to 0.5–1.5 days in background air (Nault et al., 2016). Chemical recycling from these reservoirs maintains relatively high UT NOx background concentrations (Bradshaw et al., 2000; Baehr et al., 2003; Nault et al., 2016).
Representation of lightning NOx in chemical transport models (CTMs) is particularly uncertain. Physically based parameterizations relating lightning frequency to deep convective cloud tops, convective mass flux, convective precipitation, or high-cloud ice content have poor predictive capability (Tost et al., 2007; Allen et al., 2010; Murray et al., 2012; Finney et al., 2014), limiting our ability to estimate the response of lightning NOx to future climate (Finney et al., 2016, 2018). An alternative is to prescribe flash densities from space-based observations and static NOx production rates per flash (Sauvage et al., 2007; Allen et al., 2010; Murray et al., 2012). NOx production efficiencies per flash in the literature vary from <10 to 5000 moles nitrogen per flash (mol N fl−1) (Schumann and Huntrieser, 2007; Murray, 2016). Global CTMs typically use 100–500 mol N fl−1, sometimes assuming higher production rates at midlatitudes than in the tropics (Hudman et al., 2007; Ott et al., 2010), and a global lightning NOx source of 3–7 Tg N a−1 to match observations of tropospheric ozone and NOy species (Sauvage et al., 2007).
Our understanding of UT NOx has so far been evaluated with observations from aircraft campaigns (Drummond et al., 1988; Jacob et al., 1996; Crawford et al., 1997; Jaeglé et al., 1998; Bradshaw et al., 2000; Hudman et al., 2007; Stratmann et al., 2016). There are also long-term NOx measurements from instruments on board commercial aircraft dating back to the 1990s, but these are mostly over the north Atlantic and the NO2 measurements have low precision and interference from thermally unstable NOx reservoir compounds (Brunner et al., 2001). A number of studies have used satellite observations of tropospheric NO2 columns from solar backscatter to infer lightning NOx emissions (Beirle et al., 2010; Pickering et al., 2016; Bucsela et al., 2010), including in combination with global models (Boersma et al., 2005; Martin et al., 2007; Miyazaki et al., 2014). These studies estimate global lightning NOx emission of 1 to 8 Tg N a−1.
New cloud-sliced satellite products of tropospheric NO2 mixing ratios at 280–450 hPa (∼6–9 km) offer additional vertical resolution by retrieving partial NO2 columns above clouds and exploiting differences in heights of neighboring clouds to calculate NO2 mixing ratios (Choi et al., 2014; Belmonte-Rivas et al., 2015). There are two new products of seasonal mean UT NO2 mixing ratios retrieved from Ozone Monitoring Instrument (OMI) partial NO2 columns by research groups at the Royal Netherlands Meteorological Institute (KNMI) and NASA. The KNMI product has been evaluated against UT NO2 from the Tracer Model version 4 (TM4) CTM. Large regional differences between OMI and TM4 are attributed to model deficiencies in lightning NOx and uplift of anthropogenic pollution (Belmonte-Rivas et al., 2015). The NASA UT product is new to this work and follows a similar retrieval approach to the midtropospheric (900–650 hPa) product of Choi et al. (2014). That product was evaluated with aircraft observations of NO2 and interpreted with the Global Modeling Initiative (GMI) CTM (Choi et al., 2014). Choi et al. (2014) identified large discrepancies between modeled and observed NO2 seasonality over regions influenced by pollution and lightning.
Here, we compare the two UT NO2 products, obtained with distinct retrieval methods, and use aircraft observations of NO2 from multiple NASA DC8 aircraft campaigns to arbitrate and evaluate the information that can be derived from the satellite datasets. We go on to test current understanding of UT NOx and the implications for lightning emissions using the GEOS-Chem CTM.
OMI is on board the NASA Aura satellite launched into Sun-synchronous orbit in July 2004. It has an overpass time of about 13:30 LT, a swath width of 2600 km, and a horizontal resolution of 13 km × 24 km at nadir (Levelt et al., 2006). Columns of NO2 along the instrument viewing path (slant columns) are obtained by spectral fitting of solar backscattered radiation in the 405–465 nm window (Boersma et al., 2011). Standard products of total and tropospheric column NO2 are screened for cloudy scenes using a cloud radiance fraction threshold of 0.5. Partial columns of NO2 above cloudy scenes can be used to estimate vertically resolved NO2 mixing ratios, as was first demonstrated with satellite observations of ozone (Ziemke et al., 2001). This approach, so-called cloud slicing, assumes a uniform trace gas concentration between two horizontally nearby clouds at different altitudes, so that the UT NO2 mixing ratio is proportional to the slope of the partial columns versus the corresponding cloud pressures at the optical center of the cloud. Two products of seasonal mean UT NO2 have been retrieved from OMI following distinct retrieval steps detailed below: a product from KNMI at 330–450 hPa for 2006 (Belmonte-Rivas et al., 2015) and from NASA at 280–450 hPa for 2005–2007 following an approach similar to that used to retrieve midtropospheric NO2 (Choi et al., 2014). In what follows, we distinguish between the two OMI NO2 products as KNMI and NASA.
The KNMI product uses DOMINO v2.0 slant columns (Boersma et al., 2011) and cloud fractions and altitudes from the O2–O2 absorption cloud product, OMCLDO2 (Acarreta et al., 2004) over partially to very cloudy scenes (cloud radiance fraction >0.5). Contamination due to NO2 from below (up to 66 % over polluted land masses) is estimated using the TM4 model and removed. Stratospheric NO2 from an assimilated product (Belmonte-Rivas et al., 2014) is also removed. An air mass factor (AMF) (detailed in Boersma et al., 2004) that accounts for viewing geometry, surface albedo, light attenuation by gases along the viewing path, and sensitivity to NO2 vertical distribution is applied to the resultant partial slant columns to convert to vertical columns. Additional data filtering removes scenes with solar zenith angle (SZA) ≥ 70∘ and surface albedo ≥30 %. Resultant daily vertical partial columns are aggregated on consistent pressure and horizontal () grids and used to determine seasonal mean UT NO2 mixing ratios for grid squares with at least 30 measurements. UT NO2 centered at 380 hPa (range 330–450 hPa) is estimated as the difference between partial tropospheric columns retrieved above two neighboring clouds with cloud pressures in the ranges 330–450 and 380–500 hPa, respectively. Biases from sampling cloudy scenes, such as the effect of clouds on photochemistry, are corrected using TM4. These are small (typically <20 %) in the UT (Belmonte-Rivas et al., 2015).
The NASA UT NO2 product for 2005–2007, centered at 350 hPa (∼280–450 hPa), uses updated version 3 slant columns (OMNO2 v3.0) (Krotkov et al., 2017) that correct for a positive bias in the DOMINO v2.0 product with improved spectral fitting (Marchenko et al., 2015; van Geffen et al., 2015). Partial columns from the cloud height to the top of the atmosphere are retrieved for individual OMI pixels above very cloudy scenes (cloud radiance fraction >0.7) to minimize contamination from below. Cloud fraction and height are from the OMCLDO2 product (Acarreta et al., 2004). The AMF accounts for viewing path geometry and light scattering by clouds with uniform scatter that is optically thick and geometrically thin (near-Lambertian clouds). Data filtering is applied to remove scenes with SZA > 80∘, snow/ice cover, and severe aerosol pollution that could be misclassified as clouds. Daily UT NO2 is estimated for neighboring partial columns with sufficient cloud variability (cloud pressure distance >160 hPa) and well-mixed NO2 (NO2 vertical gradient <0.33 pptv hPa−1 diagnosed with the GMI CTM). The stratospheric column is assumed uniform above neighboring clouds and thus is removed when differencing two nearby partial columns. Daily values of UT NO2 are gridded to obtain seasonal means at (latitude × longitude) for scenes with at least 50 measurements. Gaussian weighting is applied to assign higher weighting to UT NO2 closest to 350 hPa. Choi et al. (2014) used a similar approach to retrieve midtropospheric NO2 except that cloud fraction and height were from the rotational Raman scattering product (OMCLDRR), and successful retrieval required a stricter cloud radiance fraction of 0.9, a minimum of 30 measurements, and a wider minimum cloud pressure distance of 200 hPa. A shift in cloud radiance fraction threshold from 0.9 (Choi et al., 2014) to 0.7 (this work) only introduces a small (<5 %) difference in the retrieved partial columns due to contamination from below, as estimated by Pickering et al. (2016) for OMI scenes over the Gulf of Mexico.
Figure 1 compares seasonal mean UT NO2 from the two satellite products in December–February and June–August. KNMI NO2 is gridded to the NASA coarse grid. Data for March–May and September–November are in the Supplement (Fig. S1). KNMI NO2 has greater coverage than the NASA product due to a lower cloud fraction threshold in the retrieval. The two products exhibit very different spatial features. Spatial correlation between the two products (Pearson's correlation coefficient between coincident grid squares) is R=0.41 in December–February and R=0.38 in June–August. There is marginal improvement in the correlation with further spatial averaging. At , we find R=0.50 in December–February and R=0.45 in June–August. The correlation only increases substantially in September–November from R=0.49 at (Fig. S1) to R=0.66 at . KNMI is systematically lower than NASA in all seasons for coincident grid squares, varying from 16 % lower in June–August to 48 % lower in December–February at .

Figure 1Upper troposphere (UT) NO2 from the OMI satellite instrument. Seasonal mean UT NO2 from KNMI in 2006 at 330–450 hPa (a, b) is compared to NASA in 2005–2007 at 280–450 hPa (c, d). Data are at horizontal resolution for December–February (a, c) and June–August (b, d). Grey areas indicate no data and, for NASA, scenes with fewer than 50 measurements.
Contamination of UT NO2 from below the cloud may still be present in the datasets despite attempts to correct for this using the TM4 model in the case of KNMI and by only considering very cloudy scenes in the case of NASA. These include a large enhancement in KNMI NO2 (>90 pptv) over southern Africa in June–August when there is intense biomass burning, and the NO2 hotspot over northeast China in all seasons in both products (Figs. 1, S1). Belmonte-Rivas et al. (2015) caution that the contamination correction in the KNMI product relies on accurate simulation of NO2 vertical distribution.
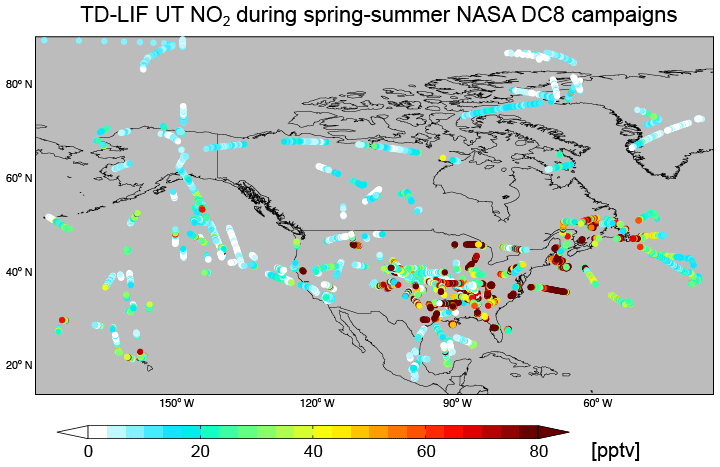
Figure 2NASA DC8 upper troposphere NO2 over North America in spring–summer (March–August). Observations are from the thermal-dissociation laser-induced fluorescence (TD-LIF) instrument at 450–280 hPa, 11:00–16:00 LT, and without stratospheric influence. Campaigns include the Intercontinental Chemical Transport Experiment – North America Phase A (INTEX-A) in June–August 2004 (Singh et al., 2006), Phase B (INTEX-B) in March–May 2006 (Singh et al., 2009), Arctic Research of the Composition of the Troposphere from Aircraft and Satellites (ARCTAS) in March–April and June–July 2008 (Jacob et al., 2010), Deep Convective Clouds and Chemistry (DC3) in May–June 2012 (Barth et al., 2015), and Studies of Emissions, Atmospheric Composition, Clouds and Climate Coupling by Regional Surveys (SEAC4RS) in August 2013 (Toon et al., 2016).
We evaluate the OMI UT NO2 products with observations from NASA DC8 aircraft campaigns over North America and Greenland in spring–summer, for which dense coverage is available (Fig. 2). These include the Intercontinental Chemical Transport Experiment – North America Phase A (INTEX-A), Phase B (INTEX-B), Arctic Research of the Composition of the Troposphere from Aircraft and Satellites (ARCTAS), Deep Convective Clouds and Chemistry (DC3), and Studies of Emissions, Atmospheric Composition, Clouds and Climate Coupling by Regional Surveys (SEAC4RS) campaigns. Only INTEX-B is in the same year as the OMI products but we consider interannual variability to be a small source of error. All NO2 measurements are from thermal-dissociation laser-induced fluorescence (TD-LIF) instruments (Day et al., 2002). These are susceptible to interference from decomposition of thermally unstable reservoir compounds including methyl peroxy nitrate (CH3O2NO2) and HNO4 (Browne et al., 2011). Publicly available DC3 and SEAC4RS TD-LIF NO2 are already corrected for this interference. We apply a correction for the other campaigns using the relationship between temperature and percentage interference from Browne et al. (2011). Observed mean ambient air temperature in the UT during INTEX-A was 246 K, corresponding to 20 % interference. That for INTEX-B was 241 K (30 % interference) and 236 K for ARCTAS (38 % interference).
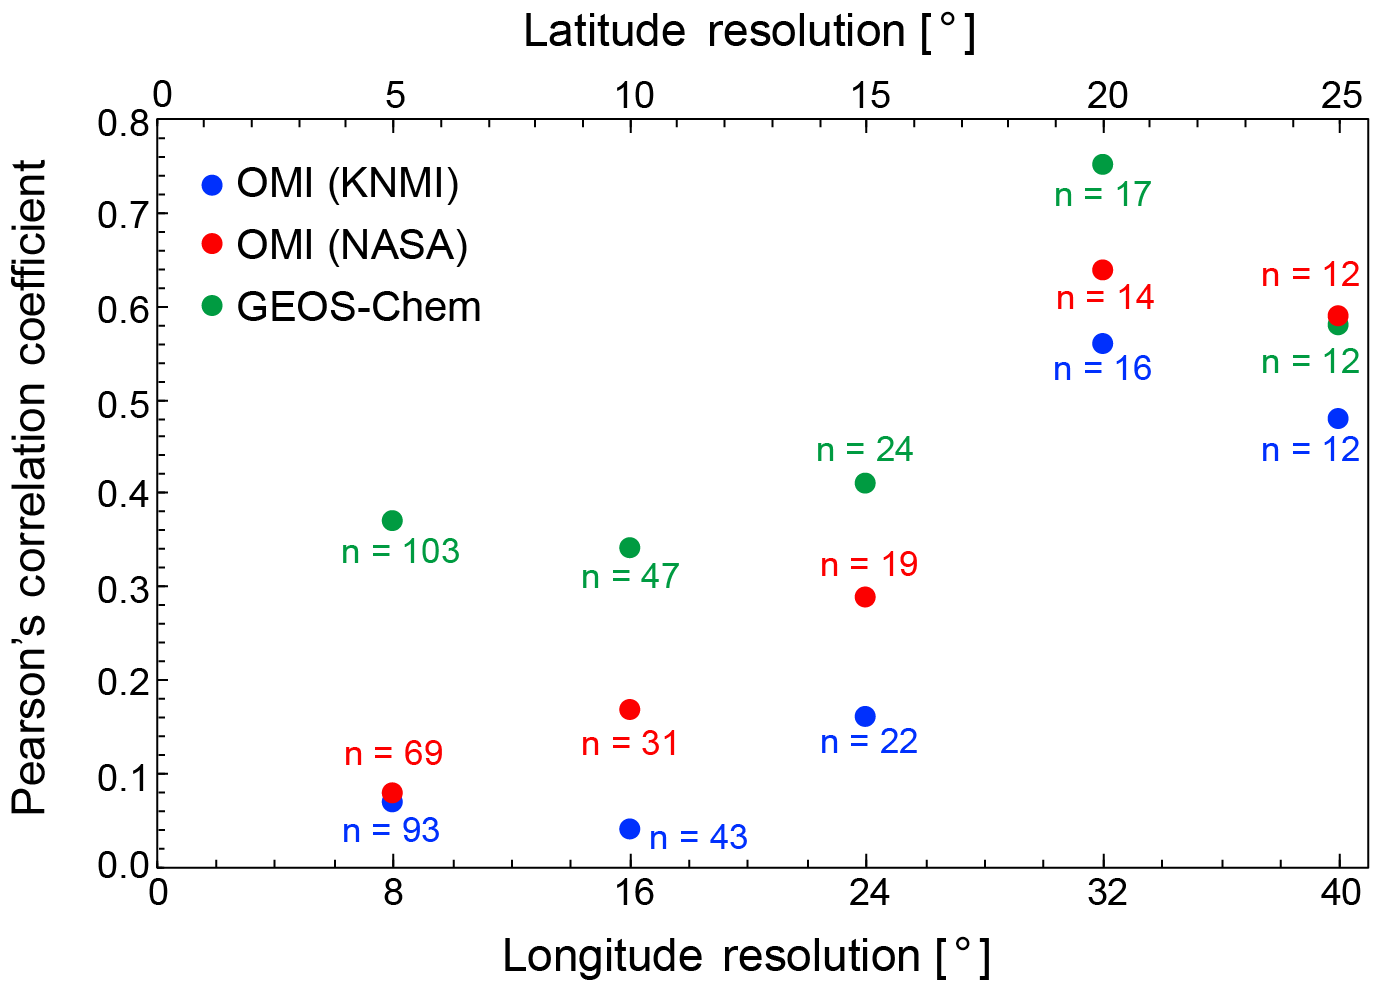
Figure 3Evaluation of OMI and GEOS-Chem upper troposphere NO2 with aircraft observations. Individual points are Pearson's correlation coefficients between gridded March–August mean UT NO2 measured from the aircraft and OMI KNMI in 2006 (blue), OMI NASA in 2005–2007 (red), and GEOS-Chem in 2006 (green) for grid averaging domains of (latitude × longitude), , , , and . Inset values are the number of points at each resolution. The domain sampled is shown in Fig. 2.
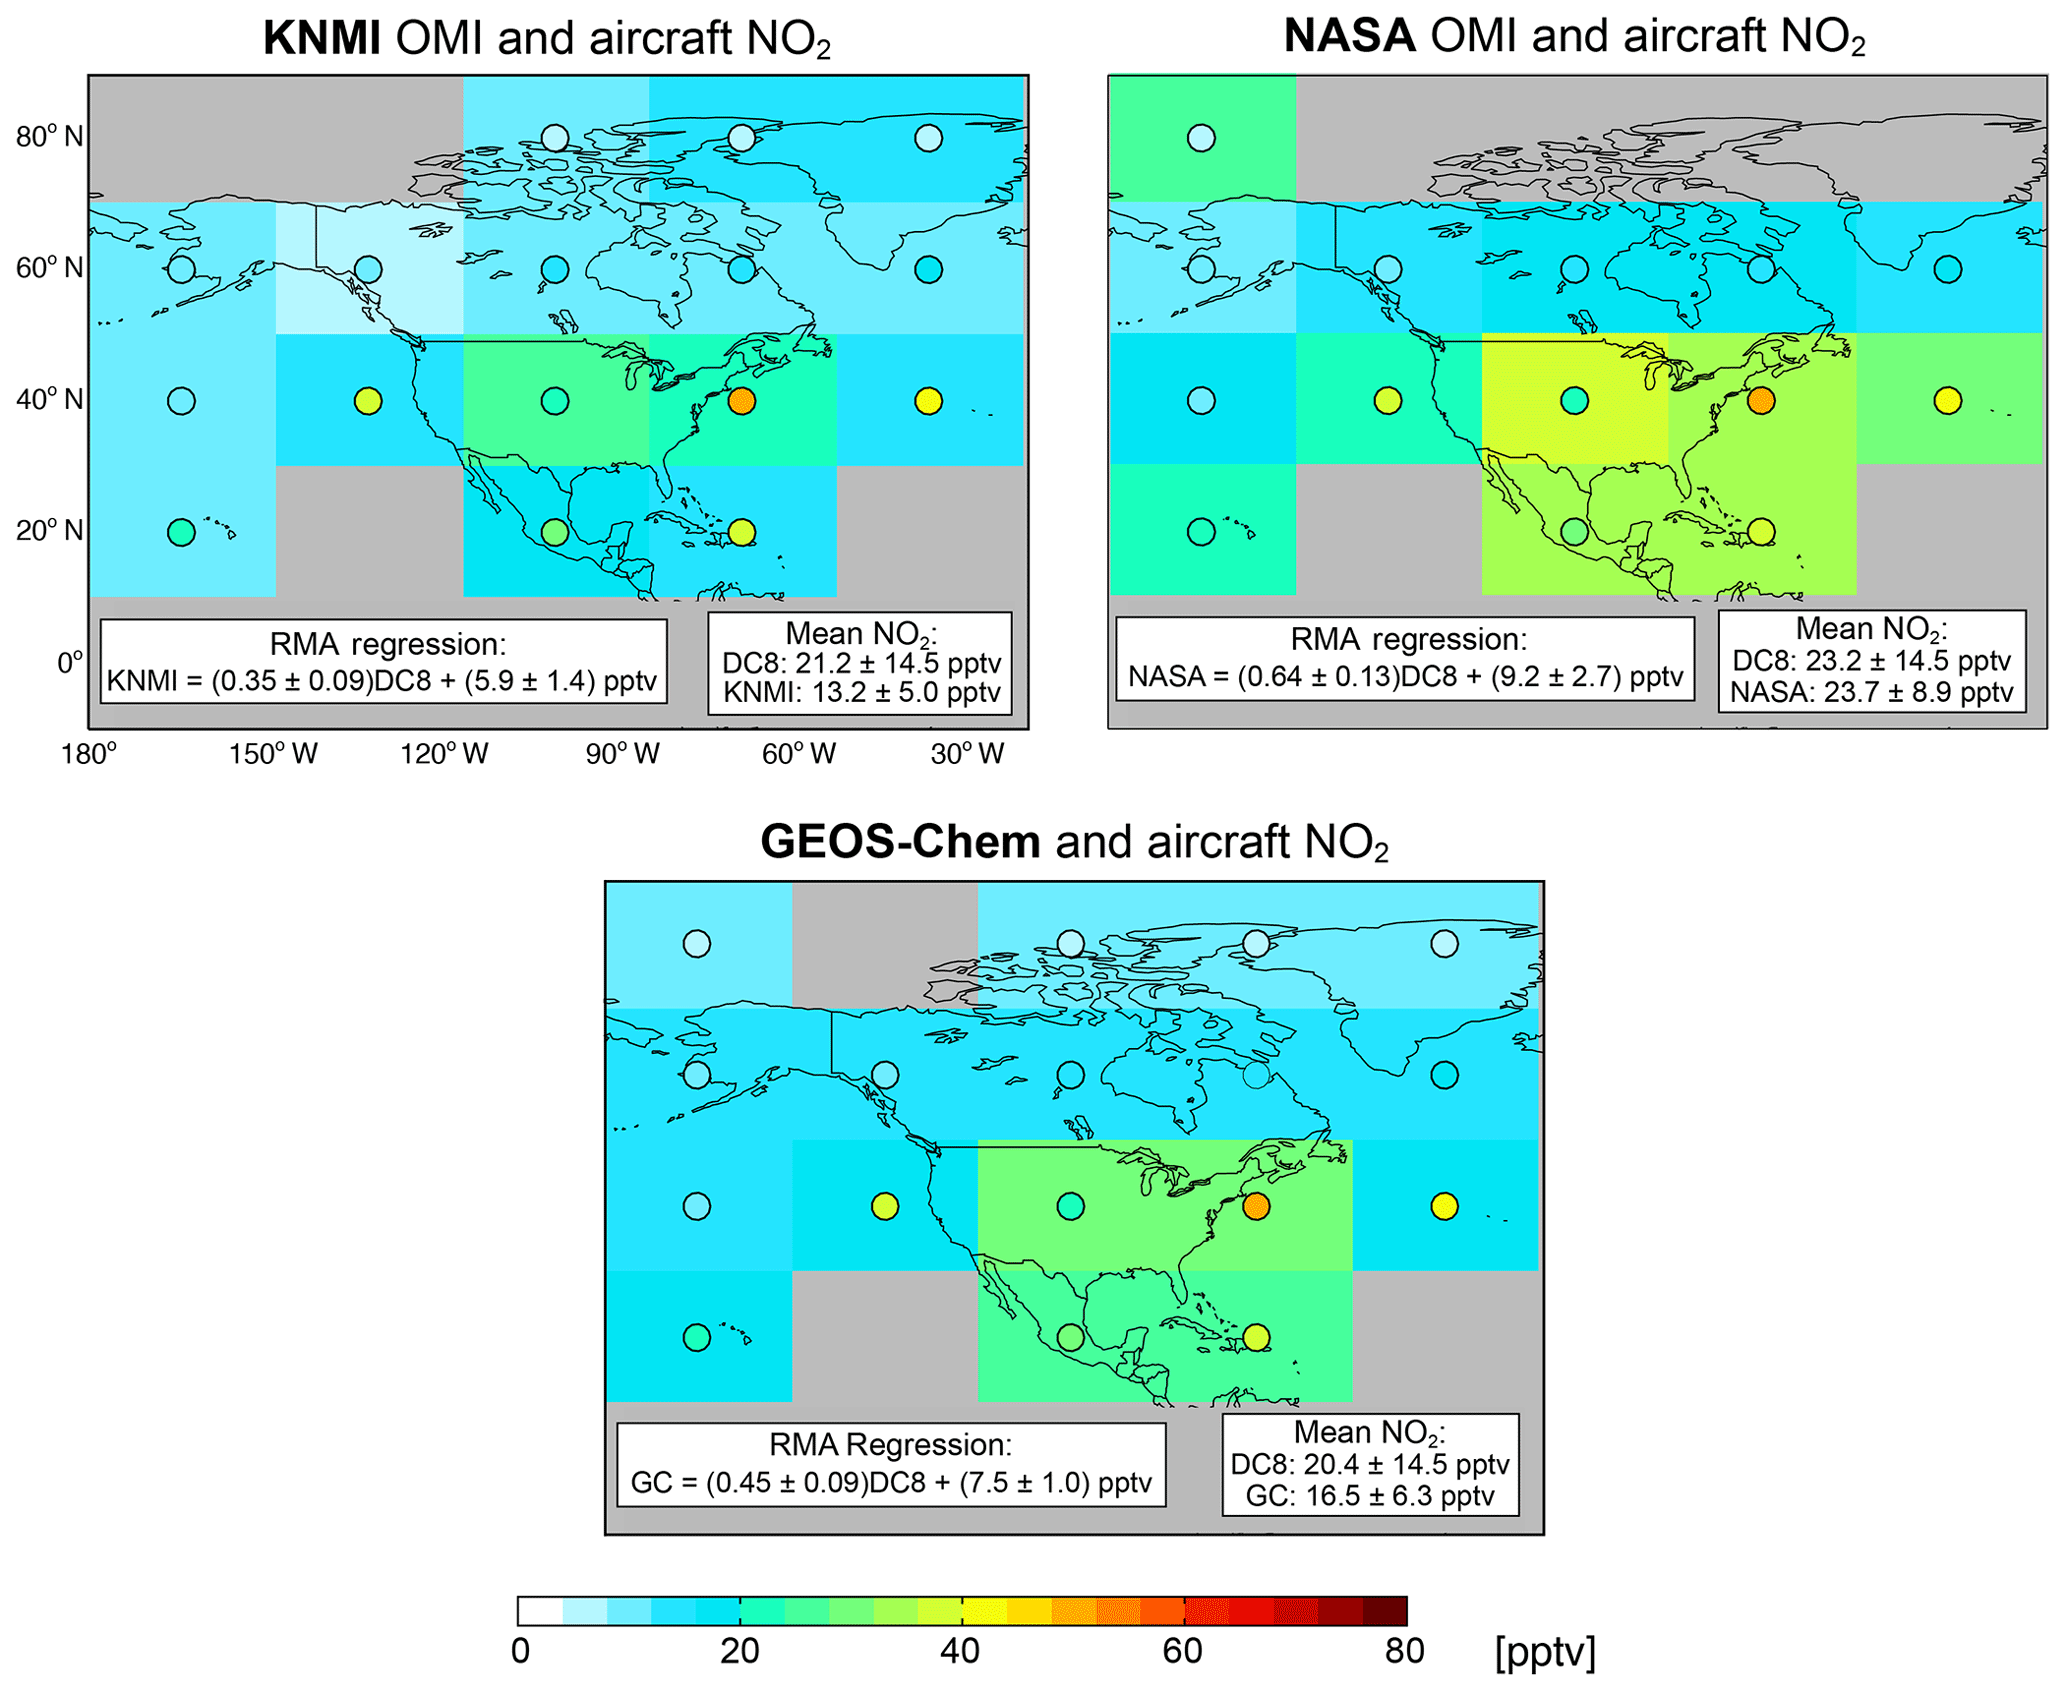
Figure 4March–August upper troposphere NO2 over North America. All data are at . Background colors in the different panels show concentrations from KNMI, NASA, and GEOS-Chem (GC). Circles show the aircraft observations (same in all panels). Aircraft observations are for 11:00–16:00 LT. The model is sampled in the satellite overpass time window (12:00–15:00 LT). Model and aircraft data are at 280–450 hPa and screened for stratospheric influence using ozone ∕ CO >1.25 mol mol−1. Inset boxes show reduced major axis (RMA) regression statistics and mean NO2 for coincident grid squares. Grey grid squares indicate no coincident observations.
There are also NO2 observations from the recent NASA ATom campaign and from the In-service Aircraft for a Global Observing System (IAGOS) commercial aircraft campaign (Berkes et al., 2018). These use chemiluminescence instruments that are also susceptible to interference. Chemiluminescence and TD-LIF NO2 are consistent during the SEAC4RS campaign for the altitude range considered in this work (6–9 km) (Travis et al., 2016), but the interference from chemiluminescence is challenging to quantify due to dependence on the operator and instrument design that varies across campaigns (Reed et al., 2016).
Figure 2 shows the sampling extent of TD-LIF UT NO2 over North America and Greenland in spring–summer at 450–280 hPa around the satellite overpass (11:00–16:00 LT) for scenes not influenced by the stratosphere (diagnosed with collocated ozone ∕ CO >1.25 mol mol−1; Hudman et al., 2007). Concentrations of UT NO2 exceed 80 pptv over the eastern US due to lightning NOx emissions and convective transport of boundary layer pollution, and are <30 pptv over the rest of the domain.
Figure 3 shows the spatial correlation between the March–August mean gridded aircraft data and the OMI UT NO2 from the KNMI and NASA products as a function of horizontal resolution. There is no significant spatial correlation between the OMI products and aircraft NO2 at (R<0.1) and (R<0.2). The correlation improves with further spatial averaging, peaking at (R=0.56 for KNMI, R=0.64 for NASA). The satellite products are also spatially consistent at this resolution (R=0.89), but KNMI is 43 % lower than NASA.
Figure 4 compares the spatial distribution of OMI and aircraft UT NO2 at over North America. Domain mean KNMI UT NO2 is 38 % lower than the aircraft observations, compared to 2.2 % higher for NASA UT NO2. Both products exhibit less variability (reduced major axis, RMA, regression slopes <1) and high bias in background NO2 compared to the aircraft observations (positive RMA intercepts of 5.9±1.4 pptv for KNMI and 9.2±2.7 pptv for NASA). We proceed with the NASA UT NO2 product at , as correlation peaks at this resolution and the NASA product is more consistent with domain mean aircraft UT NO2 than the KNMI product.
The NASA product provides near-global coverage of UT NO2 to assess current understanding of regional UT NOx sources and dynamics by comparing to UT NO2 from the GEOS-Chem CTM (version 10-01; http://wiki.seas.harvard.edu/geos-chem/index.php/GEOS-Chem_v10-01, last access: 28 November 2017) driven by NASA Modern-Era Retrospective analysis for Research and Applications, version 2 (MERRA-2) reanalysis meteorology. The model horizontal resolution is and the output is regridded to for comparison with OMI. GEOS-Chem is sampled under all-sky conditions in the satellite overpass window (12:00–15:00 LT). We find that the effect on NO2 of sampling the model under cloudy conditions is small. Isolating NO2 under very cloudy conditions using MERRA-2 cloud fractions decreases modeled UT NO2 by no more than 5 pptv in the tropics/subtropics and less at higher latitudes. We use output from the model for 2006 following a 1-year spin-up for chemical initialization. Interannual variability in UT NO2, determined as the difference between modeled 2006 and multi-year mean (2005–2007) UT NO2, is small (<4 pptv) everywhere except central Africa year round (4–12 pptv), the Arctic north of 60∘ N (up to 25 pptv), and the Middle East in June–August and northern India in March–May (both 10–20 pptv). Recent evaluation of model NO2 with observed vertical profiles from the SEAC4RS aircraft campaign shows no significant bias in the 6–9 km range of the OMI product (Travis et al., 2016; Silvern et al., 2018).
Local GEOS-Chem emissions of NOx in the UT include aircraft and lightning. Aircraft emissions from the Aviation Emissions Inventory Code (AEIC) inventory (Stettler et al., 2011) total 0.82 Tg N in 2006, which is much less than lightning in the same year (6.5 Tg N). Transport from the stratosphere is simulated using a climatology of NOy species concentrations from the GMI model above the tropopause (Murray et al., 2012) and is very small (0.4 Tg N a−1 as total NOy). Lightning in the model is estimated using the parameterization implemented by Murray et al. (2012). This includes an initial estimate of lightning flashes using the Price and Rind (1992, 1993, 1994) relationship between cloud-top height and lightning flashes. These are then scaled to the same annual global flash frequency (46 fl s−1) and regional distribution as the climatology from the combined Lightning Imaging Sensor (LIS) and Optical Transient Detector (OTD) high-resolution monthly climatology (LIS/OTD HRMC) (Cecil et al., 2014). The standard GEOS-Chem model has higher NOx yields per flash at northern midlatitudes (north of 35∘ N) than in the tropics (500 mol N fl−1 versus 260 mol N fl−1), but we find that this overestimates observed OMI UT NO2 by 10–20 pptv (20 %–40 %) at northern midlatitudes in summer when the lightning source is dominant. Here, we address this overestimate by assuming a NOx yield of 260 mol N fl−1 everywhere. This decreases global lightning NOx emissions by 15 % from 6.5 to 5.5 Tg N a−1. The lightning parameterization in GEOS-Chem does not distinguish lightning NOx production from flashes within or between clouds (intra- or inter-cloud) or from the cloud to the Earth's surface (cloud to ground).
Figure 3 shows the spatial correlation between the model and aircraft observations. The model is more consistent with the aircraft observations than OMI at fine spatial resolution. Like OMI, GEOS-Chem correlation with the aircraft observations improves with spatial averaging, peaking at (R=0.75). Figure 4 also shows comparison of March–August GEOS-Chem UT NO2 with the aircraft observations at . The model is sampled over the same pressure range as NASA (280–450 hPa) around the OMI overpass (12:00–15:00 LT) and is filtered for stratospheric influence using model ozone ∕ CO >1.25 mol mol−1. Domain average UT NO2 from the model is 19% lower than the aircraft measurements, and the model also overestimates background UT NO2 (intercept of 7.5±1.0 pptv) and underestimates the variability (slope of 0.45±0.09).
Figure 5 compares seasonal mean OMI and GEOS-Chem UT NO2 in December–February and June–August. The other seasons are shown in the Supplement (Fig. S2). Formation of PAN, HNO4, and CH3O2NO2 accounts for over 75 % of NOx loss in the model in all seasons. Lower concentrations of UT NO2 in the Northern Hemisphere winter compared to summer in the model is mostly because lightning activity is at a minimum. The model underestimates UT NO2 in the northern midlatitudes in winter by 20–40 pptv, suggesting misrepresentation of another process in the model, such as excessive NOx loss by N2O5 hydrolysis in aerosols (Kenagy et al., 2018). The particularly large bias over polluted regions in winter could also be due to contamination of the UT NO2 retrievals by enhanced boundary layer NO2.
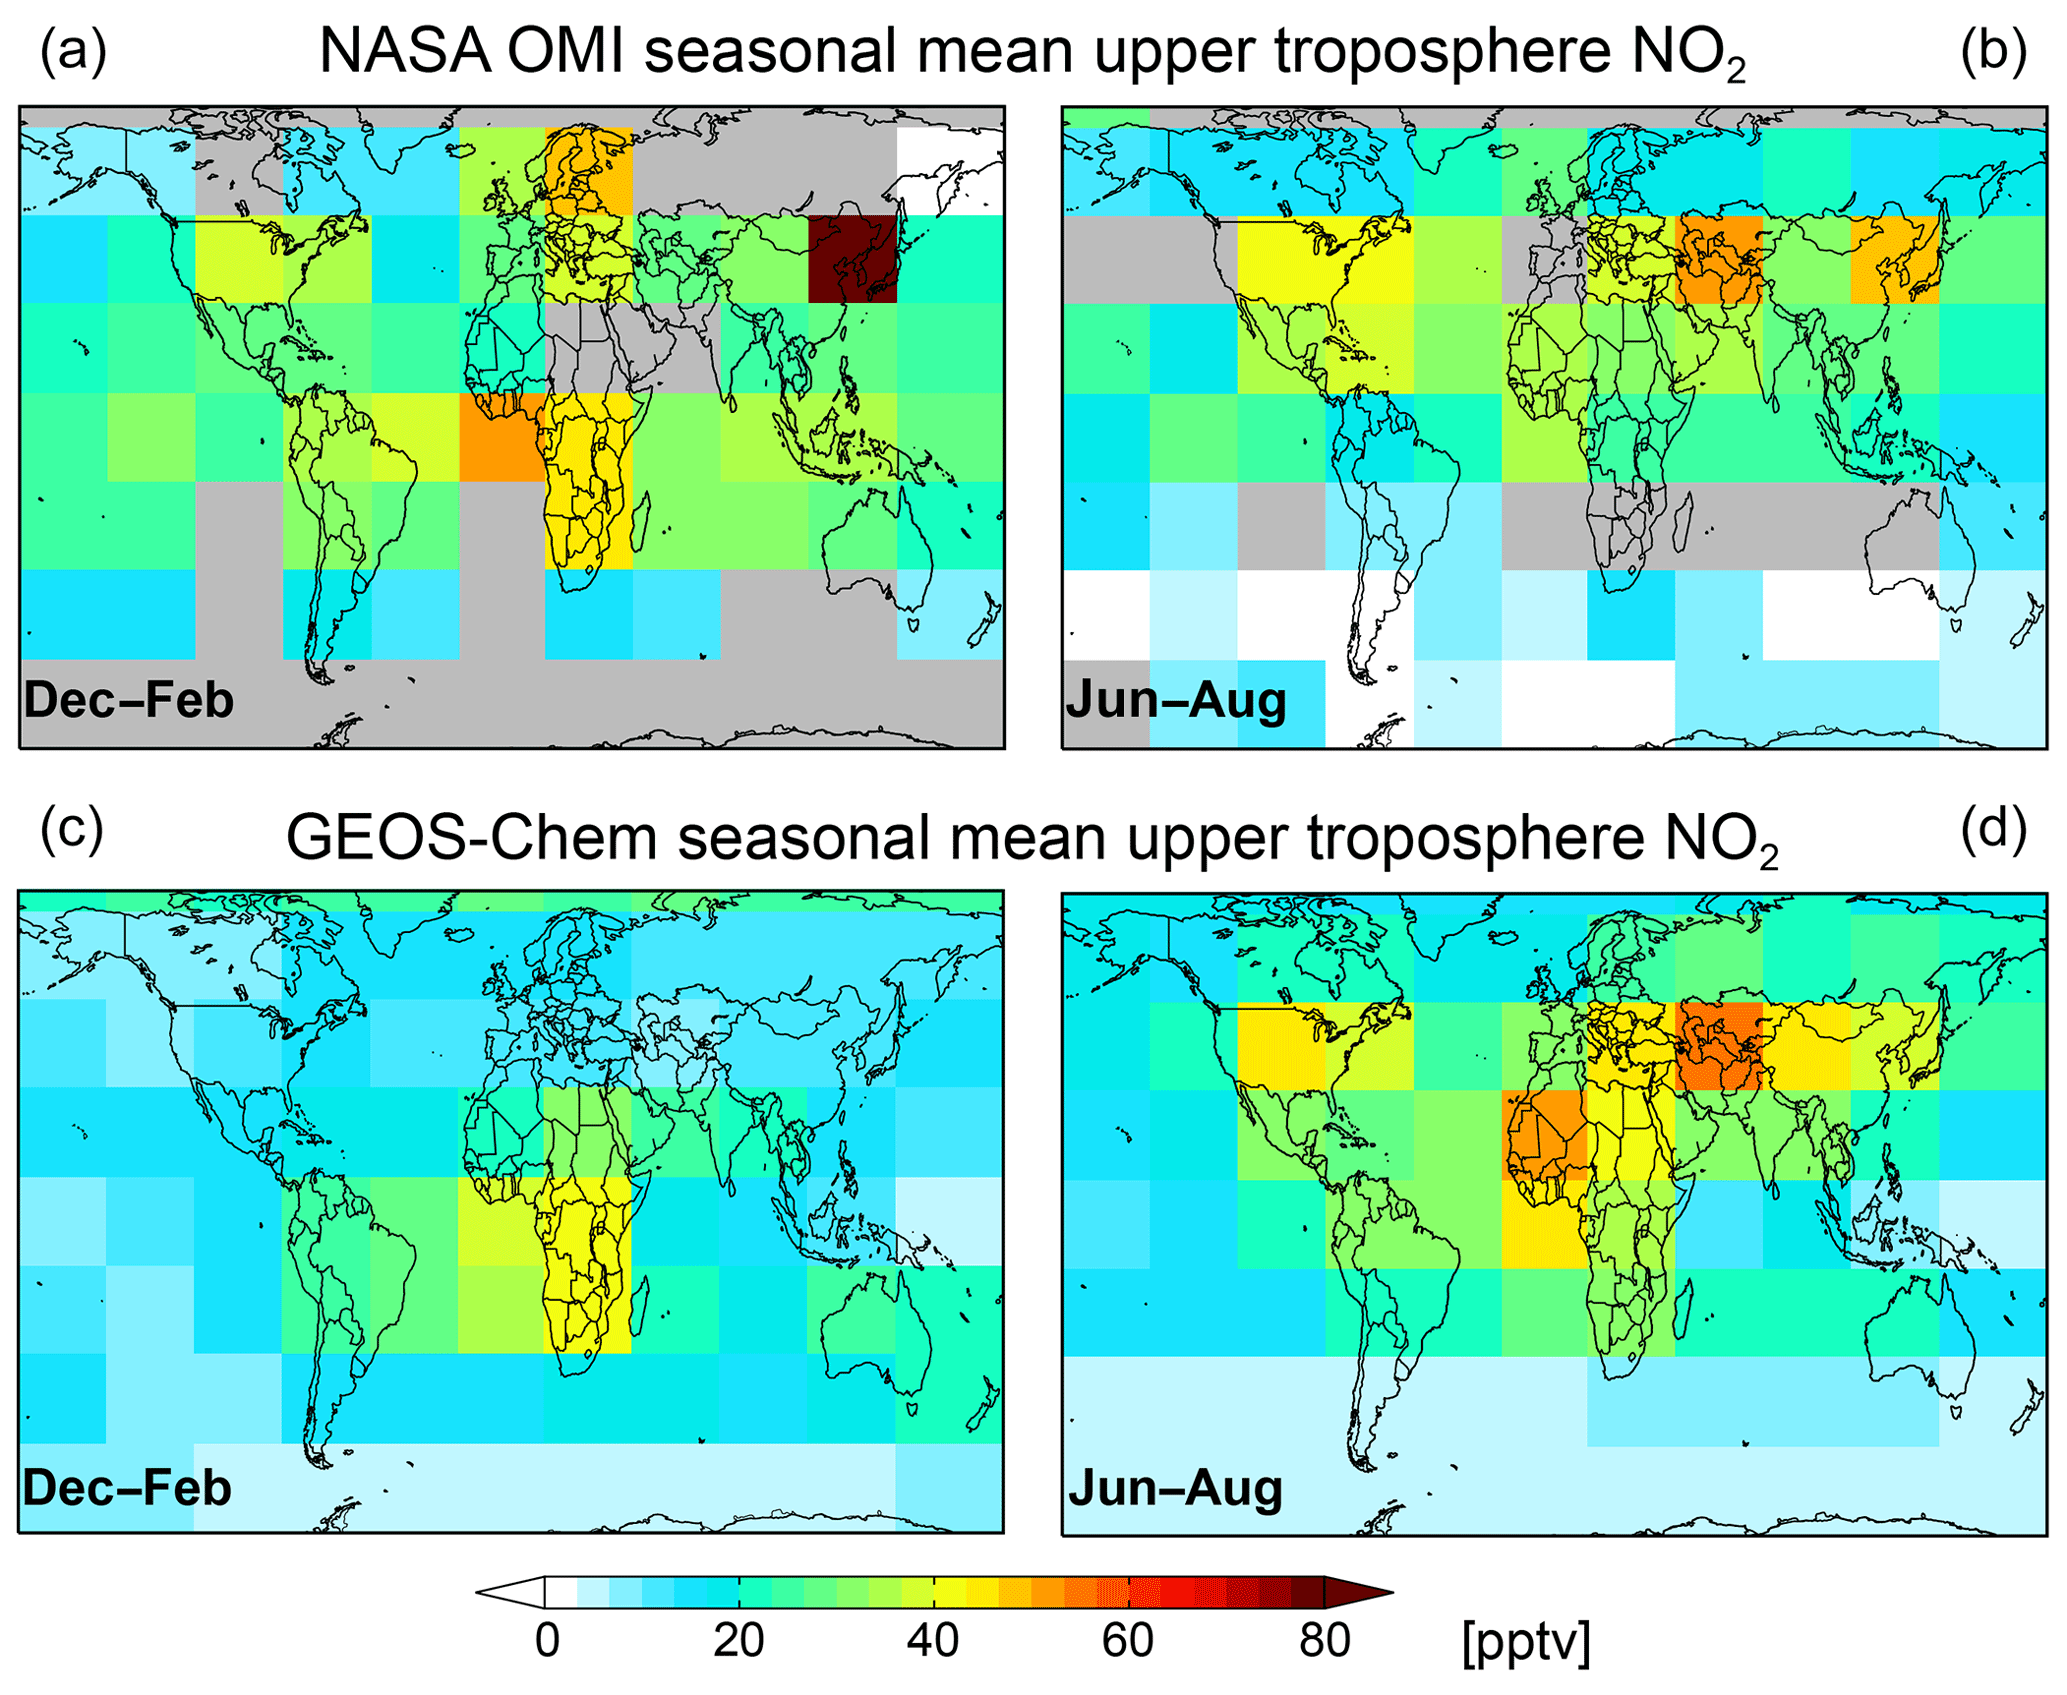
Figure 5Observed and modeled upper troposphere NO2. The figure shows NASA OMI seasonal mean UT NO2 for 2005–2007 (a, b) and corresponding GEOS-Chem model values (c, d). The model is sampled at 280–450 hPa during the satellite overpass (12:00–15:00 LT) and filtered for stratospheric influence. Data are at horizontal resolution for December–February (a, c) and June–August (b, d). Grey grid squares in the top panels indicate no OMI data.

Figure 6Log–log relationship between upper troposphere NO2 and lightning flash frequencies, and linear regression fits between the two. Individual points are coincident seasonal mean UT NO2 from OMI (a) and GEOS-Chem (b) versus seasonal mean LIS/OTD lightning flash climatologies for coincident grid squares in the northern midlatitudes (>30∘ N; blue) and tropics (<30∘ N; orange). Northern midlatitude points exclude December–February, which show poor correlation with lightning flashes (see text for details). Lines and legends show reduced major axis linear regression fits to the data with corresponding Pearson's correlation coefficients. The regression lines plot as curves on the log–log scale, highlighting the NO2 background at low lightning flash rates and the correlation of NO2 with lightning at high flash rates.
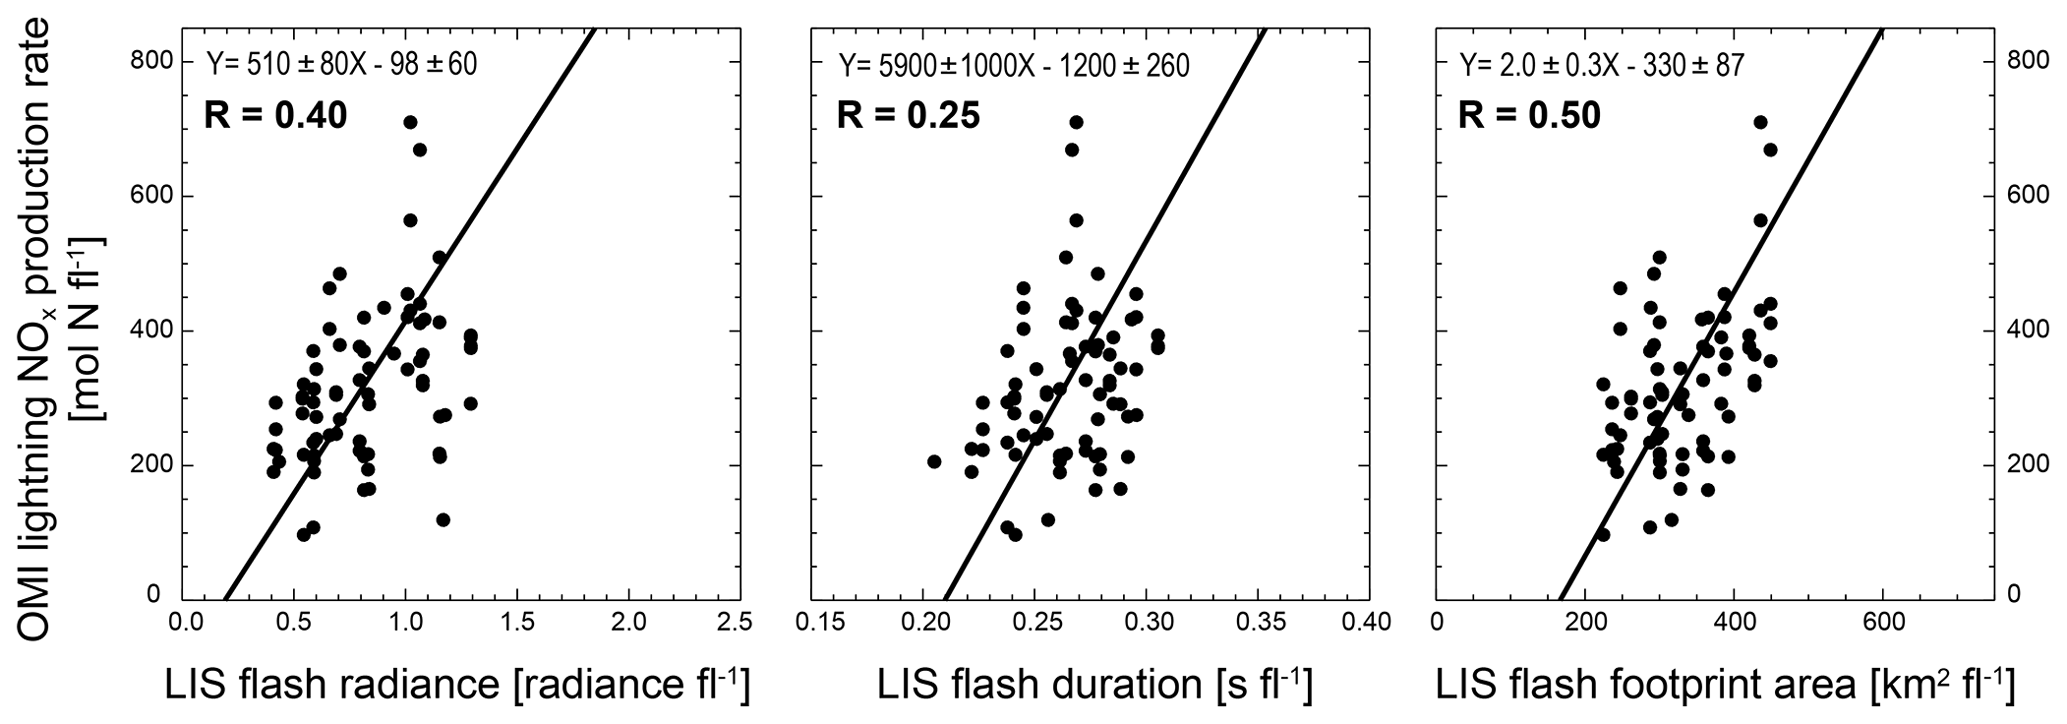
Figure 7Relationship between OMI and GEOS-Chem derived lightning NOx production rates and LIS lightning properties: energy (radiance), duration, and footprint area. Individual points are seasonal mean grid squares at 40∘ N–40∘ S.
Figure 6 shows the log–log relationship between seasonal mean LIS/OTD lightning flash climatology and seasonal mean UT NO2 from OMI and GEOS-Chem, and the corresponding reduced major axis linear regression fits. Data are divided into northern midlatitudes and tropics. We exclude the contaminated observations over northeast China and the wintertime northern midlatitude grid squares that show no correlation with lightning flashes (R<0.1). Results from multi-model sensitivity studies indicate that UT NOx in winter is predominantly from surface sources, with a smaller contribution from extratropical lightning (Grewe et al., 2001). Background concentration of UT NO2 (intercepts in Fig. 6) from non-lightning sources is 10–20 pptv and is 3–5 pptv higher in the northern midlatitudes than in the tropics. The slopes for the linear fits to lightning flash frequency are consistent between the OMI observations and GEOS-Chem, and show similar slopes for northern midlatitudes and the tropics. Fitting the ratio between OMI observations and GEOS-Chem on the grid implies a NOx yield per flash of 280±80 mol N fl−1 with no significant difference between midlatitudes and the tropics, and no significant difference with the GEOS-Chem prior estimate of 260 mol N fl−1. Our prior estimate of global lightning source was 5.5 Tg N a−1, and the improved estimate is 5.9±1.7 Tg N a−1.
Properties of lightning flashes, including energy, duration, and footprint area, have been retrieved from the OTD and LIS sensors (Beirle et al., 2014). The flash footprint area is the spatial extent of lightning detection events contributing to the flash (collection of local events) diagnosed by the satellite data. Figure 7 shows the relationship between OMI and GEOS-Chem derived lightning NOx production rates and LIS lightning properties from Beirle et al. (2014). The strongest correlation is with lightning extent (R=0.50), followed by energy (R=0.40). The correlation with flash duration is weak (R=0.25). The relationships in Fig. 7 suggest a dependence of lightning NOx production rates on lightning flash energy of 510±80 mol N (J m−2 sr−1 µm and on flash footprint area of 2.0±0.3 mol N km−2, possibly offering guidance for relating NOx yields to physical properties in global models rather than the current approach of assigning static values.
Measurements of NOx in the UT have mainly been from aircraft campaigns that are limited in space and time. Two new cloud-slicing UT NO2 products from OMI produced by KNMI and NASA offer the potential to address uncertainties in our understanding of UT NOx sources. Here, we intercompared these products, evaluated them with aircraft observations, and used them together with GEOS-Chem model simulations to demonstrate a dominance of lightning as a source of UT NOx.
The KNMI and NASA UT NO2 products use very different retrieval methods. Seasonal mean concentrations from the two products show weak global correlation at the (latitude × longitude) resolution of the NASA retrieval, with some improvement when the data are further averaged to (R=0.5–0.7). At that resolution, they show correlation with in situ aircraft observations of UT NO2 over North America for different years (R=0.56–0.64). The KNMI product is biased low by 38 % relative to the aircraft observations, while the NASA product has no significant bias.
We find from the relationship of OMI UT NO2 with LIS/OTD flash rates that most NOx in the upper troposphere is from lightning, except in the midlatitudes in winter. The background NO2 concentration in the absence of lightning is 10–20 pptv. The relationship suggests no difference in NOx yields per flash between the midlatitudes and the tropics, in contrast to the higher yields at midlatitudes often assumed in models. We derive a global mean lightning NOx production rate per flash of 280±80 mol N fl−1, from which we infer a best estimate for the global lightning NOx emission of 5.9±1.7 Tg N a−1.
Data from this work can be made available upon request: Eloise A. Marais for GEOS-Chem output, Maria Belmonte-Rivas for KNMI OMI UT NO2, Sungyeon Choi and Joanna Joiner for NASA OMI UT NO2, and Steffen Beirle for LIS lightning properties.
Aircraft observations are available at https://doi.org/10.5067/AIRCRAFT/SEAC4RS/AEROSOL-TRACEGAS-CLOUD for SEAC4RS (NASA, 2017a, last access: 1 April 2017), https://doi.org/10.5067/Aircraft/DC3/DC8/Aerosol-TraceGas for DC3 (NASA, 2017b, last access: 1 April 2017), https://doi.org/10.5067/Aircraft/INTEXA/Aerosol-TraceGas for INTEX-A (NASA, 2017c, last access: 1 April 2017), https://doi.org/10.5067/Aircraft/INTEXB/Aerosol-TraceGas for INTEX-B (NASA, 2017d, last access: 1 April 2017), and https://www-air.larc.nasa.gov/cgi-bin/ArcView/arctas?DC8-MERGE=1#1_MINUTE/ for ARCTAS (NASA, 2017e, last access: 1 April 2017).
The supplement related to this article is available online at: https://doi.org/10.5194/acp-18-17017-2018-supplement.
EAM conducted model simulations, analyzed and interpreted satellite, model, and aircraft data, and prepared the manuscript; DJJ provided supervisory guidance and assisted in the writing. SC, JJ, and MB-R retrieved the OMI UT NO2 products; RCC aided in interpreting aircraft observations. LTM contributed LIS/OTD lightning flash observations; SB contributed lightning flash properties; LS, VS, and LJ contributed updated GEOS-Chem code.
The authors declare that they have no conflict of interest.
This work was funded by the NASA Tropospheric Chemistry Program and a
University of Birmingham Research Fellowship and NERC/EPSRC grant
(EP/R513465/1) awarded to Eloise A. Marais. Model simulations were performed
on the University of Birmingham's BlueBEAR High-Performance Cluster (HPC). The
authors would like to thank the BlueBEAR support team for IT and HPC
support.
Edited by: Yafang
Cheng
Reviewed by: two anonymous referees
Acarreta, J. R., De Haan, J. F., and Stammes, P.: Cloud pressure retrieval using the O2-O2 absorption band at 477 nm, J. Geophys. Res., 109, D05204, https://doi.org/10.1029/2003jd003915, 2004.
Allen, D., Pickering, K., Duncan, B., and Damon, M.: Impact of lightning NO emissions on North American photochemistry as determined using the Global Modeling Initiative (GMI) model, J. Geophys. Res., 115, D22301, https://doi.org/10.1029/2010jd014062, 2010.
Baehr, J., Schlager, H., Ziereis, H., Stock, P., van Velthoven, P., Busen, R., Strom, J., and Schumann, U.: Aircraft observations of NO, NOy, CO, and O3 in the upper troposphere from 60∘ N to 60∘ S – Interhemispheric differences at mitlatitudes, Geophys. Res. Lett., 30, 1598, https://doi.org/10.1029/2003gl016935, 2003.
Barth, M. C., Cantrell, C. A., Brune, W. H., Rutledge, S. A., Crawford, J. H., Huntrieser, H., Carey, L. D., MacGorman, D., Weisman, M., Pickering, K. E., Bruning, E., Anderson, B., Apel, E., Biggerstaff, M., Campos, T., Campuzano-Jost, P., Cohen, R., Crounse, J., Day, D. A., Diskin, G., Flocke, F., Fried, A., Garland, C., Heikes, B., Honomichl, S., Hornbrook, R., Huey, L. G., Jimenez, J. L., Lang, T., Lichtenstern, M., Mikoviny, T., Nault, B., O'Sullivan, D., Pan, L. L., Peischl, J., Pollack, I., Richter, D., Riemer, D., Ryerson, T., Schlager, H., St Clair, J., Walega, J., Weibring, P., Weinheimer, A., Wennberg, P., Wisthaler, A., Wooldridge, P. J., and Ziegler, C.: The Deep Convective Clouds and Chemistry (DC3) Field Campaign, B. Am. Meteorol. Soc., 96, 1281–1309, https://doi.org/10.1175/Bams-D-13-00290.1, 2015.
Beirle, S., Huntrieser, H., and Wagner, T.: Direct satellite observation of lightning-produced NOx, Atmos. Chem. Phys., 10, 10965–10986, https://doi.org/10.5194/acp-10-10965-2010, 2010.
Beirle, S., Koshak, W., Blakeslee, R., and Wagner, T.: Global patterns of lightning properties derived by OTD and LIS, Nat. Hazards Earth Syst. Sci., 14, 2715–2726, https://doi.org/10.5194/nhess-14-2715-2014, 2014.
Belmonte Rivas, M., Veefkind, P., Boersma, F., Levelt, P., Eskes, H., and Gille, J.: Intercomparison of daytime stratospheric NO2 satellite retrievals and model simulations, Atmos. Meas. Tech., 7, 2203–2225, https://doi.org/10.5194/amt-7-2203-2014, 2014.
Belmonte Rivas, M., Veefkind, P., Eskes, H., and Levelt, P.: OMI tropospheric NO2 profiles from cloud slicing: constraints on surface emissions, convective transport and lightning NOx, Atmos. Chem. Phys., 15, 13519–13553, https://doi.org/10.5194/acp-15-13519-2015, 2015.
Berkes, F., Houben, N., Bundke, U., Franke, H., Pätz, H.-W., Rohrer, F., Wahner, A., and Petzold, A.: The IAGOS NOx instrument – design, operation and first results from deployment aboard passenger aircraft, Atmos. Meas. Tech., 11, 3737–3757, https://doi.org/10.5194/amt-11-3737-2018, 2018.
Bertram, T. H., Perring, A. E., Wooldridge, P. J., Crounse, J. D., Kwan, A. J., Wennberg, P. O., Scheuer, E., Dibb, J., Avery, M., Sachse, G., Vay, S. A., Crawford, J. H., McNaughton, C. S., Clarke, A., Pickering, K. E., Fuelberg, H., Huey, G., Blake, D. R., Singh, H. B., Hall, S. R., Shetter, R. E., Fried, A., Heikes, B. G., and Cohen, R. C.: Direct measurements of the convective recycling of the upper troposphere, Science, 315, 816–820, https://doi.org/10.1126/science.1134548, 2007.
Boersma, K. F., Eskes, H. J., and Brinksma, E. J.: Error analysis for tropospheric NO2 retrieval from space, J. Geophys. Res., 109, D04311, https://doi.org/10.1029/2003jd003962, 2004.
Boersma, K. F., Eskes, H. J., Meijer, E. W., and Kelder, H. M.: Estimates of lightning NOx production from GOME satellite observations, Atmos. Chem. Phys., 5, 2311–2331, https://doi.org/10.5194/acp-5-2311-2005, 2005.
Boersma, K. F., Eskes, H. J., Dirksen, R. J., van der A, R. J., Veefkind, J. P., Stammes, P., Huijnen, V., Kleipool, Q. L., Sneep, M., Claas, J., Leitão, J., Richter, A., Zhou, Y., and Brunner, D.: An improved tropospheric NO2 column retrieval algorithm for the Ozone Monitoring Instrument, Atmos. Meas. Tech., 4, 1905–1928, https://doi.org/10.5194/amt-4-1905-2011, 2011.
Bradshaw, J., Davis, D., Grodzinsky, G., Smyth, S., Newell, R., Sandholm, S., and Liu, S.: Observed distributions of nitrogen oxides in the remote free troposphere from the NASA global tropospheric experiment programs, Rev. Geophys., 38, 61–116, https://doi.org/10.1029/1999rg900015, 2000.
Browne, E. C., Perring, A. E., Wooldridge, P. J., Apel, E., Hall, S. R., Huey, L. G., Mao, J., Spencer, K. M., Clair, J. M. St., Weinheimer, A. J., Wisthaler, A., and Cohen, R. C.: Global and regional effects of the photochemistry of CH3O2NO2: evidence from ARCTAS, Atmos. Chem. Phys., 11, 4209–4219, https://doi.org/10.5194/acp-11-4209-2011, 2011.
Brunner, D., Staehelin, J., Jeker, D., Wernli, H., and Schumann, U.: Nitrogen oxides and ozone in the tropopause region of the Northern Hemisphere: Measurements from commercial aircraft in 1995/1996 and 1997, J. Geophys. Res., 106, 27673–27699, https://doi.org/10.1029/2001jd900239, 2001.
Bucsela, E. J., Pickering, K. E., Huntemann, T. L., Cohen, R. C., Perring, A., Gleason, J. F., Blakeslee, R. J., Albrecht, R. I., Holzworth, R., Cipriani, J. P., Vargas-Navarro, D., Mora-Segura, I., Pacheco-Hernandez, A., and Laporte-Molina, S.: Lightning-generated NOx seen by the Ozone Monitoring Instrument during NASA's Tropical Composition, Cloud and Climate Coupling Experiment (TC4), J. Geophys. Res., 115, D00J10, https://doi.org/10.1029/2009jd013118, 2010.
Cecil, D. J., Buechler, D. E., and Blakeslee, R. J.: Gridded lightning climatology from TRMM-LIS and OTD: Dataset description, Atmos. Res., 135, 404–414, https://doi.org/10.1016/j.atmosres.2012.06.028, 2014.
Choi, S., Joiner, J., Choi, Y., Duncan, B. N., Vasilkov, A., Krotkov, N., and Bucsela, E.: First estimates of global free-tropospheric NO2 abundances derived using a cloud-slicing technique applied to satellite observations from the Aura Ozone Monitoring Instrument (OMI), Atmos. Chem. Phys., 14, 10565–10588, https://doi.org/10.5194/acp-14-10565-2014, 2014.
Crawford, J. H., Davis, D. D., Chen, G., Bradshaw, J., Sandholm, S., Kondo, Y., Merrill, J., Liu, S., Browell, E., Gregory, G., Anderson, B., Sachse, G., Barrick, J., Blake, D., Talbot, R., and Pueschel, R.: Implications of large scale shifts in tropospheric NOx levels in the remote tropical Pacific, J. Geophys. Res., 102, 28447–28468, https://doi.org/10.1029/97jd00011, 1997.
Dahlmann, K., Grewe, V., Ponater, M., and Matthes, S.: Quantifying the contributions of individual NOx sources to the trend in ozone radiative forcing, Atmos. Environ., 45, 2860–2868, https://doi.org/10.1016/j.atmosenv.2011.02.071, 2011.
Day, D. A., Wooldridge, P. J., Dillon, M. B., Thornton, J. A., and Cohen, R. C.: A thermal dissociation laser-induced fluorescence instrument for in situ detection of NO2, peroxy nitrates, alkyl nitrates, and HNO3, J. Geophys. Res., 107, 4046, https://doi.org/10.1029/2001jd000779, 2002.
Drummond, J. W., Ehhalt, D. H., and Volz, A.: Measurements of nitric oxide between 0-12 km altitude and 67∘ N to 60∘ S latitude obtained during STRATOZ III, J. Geophys. Res., 93, 15831–15849, https://doi.org/10.1029/JD093iD12p15831, 1988.
Ehhalt, D. H., Rohrer, F., and Wahner, A.: Sources and distribution of NOx in the upper troposphere at northern midlatitudes, J. Geophys. Res., 97, 3725–3738, https://doi.org/10.1029/91JD03081, 1992.
Finney, D. L., Doherty, R. M., Wild, O., Huntrieser, H., Pumphrey, H. C., and Blyth, A. M.: Using cloud ice flux to parametrise large-scale lightning, Atmos. Chem. Phys., 14, 12665–12682, https://doi.org/10.5194/acp-14-12665-2014, 2014.
Finney, D. L., Doherty, R. M., Wild, O., Young, P. J., and Butler, A.: Response of lightning NOx emissions and ozone production to climate change: Insights from the Atmospheric Chemistry and Climate Model Intercomparison Project, Geophys. Res. Lett., 43, 5492–5500, https://doi.org/10.1002/2016gl068825, 2016.
Finney, D. L., Doherty, R. M., Wild, O., Stevenson, D. S., MacKenzie, I. A., and Blyth, A. M.: A projected decrease in lightning under climate change, Nat. Clim. Change, 8, 210–213, https://doi.org/10.1038/s41558-018-0072-6, 2018.
Grewe, V., Brunner, D., Dameris, M., Grenfell, J. L., Hein, R., Shindell, D., and Staehelin, J.: Origin and variability of upper tropospheric nitrogen oxides and ozone at northern mid-latitudes, Atmos. Environ., 35, 3421–3433, https://doi.org/10.1016/S1352-2310(01)00134-0, 2001.
Hudman, R. C., Jacob, D. J., Turquety, S., Leibensperger, E. M., Murray, L. T., Wu, S., Gilliland, A. B., Avery, M., Bertram, T. H., Brune, W., Cohen, R. C., Dibb, J. E., Flocke, F. M., Fried, A., Holloway, J., Neuman, J. A., Orville, R., Perring, A., Ren, X., Sachse, G. W., Singh, H. B., Swanson, A., and Wooldridge, P. J.: Surface and lightning sources of nitrogen oxides over the United States: Magnitudes, chemical evolution, and outflow, J. Geophys. Res., 112, D12S05, https://doi.org/10.1029/2006jd007912, 2007.
Jacob, D. J., Heikes, B. G., Fan, S. M., Logan, J. A., Mauzerall, D. L., Bradshaw, J. D., Singh, H. B., Gregory, G. L., Talbot, R. W., Blake, D. R., and Sachse, G. W.: Origin of ozone and NOx in the tropical troposphere: A photochemical analysis of aircraft observations over the South Atlantic basin, J. Geophys. Res., 101, 24235–24250, https://doi.org/10.1029/96jd00336, 1996.
Jacob, D. J., Crawford, J. H., Maring, H., Clarke, A. D., Dibb, J. E., Emmons, L. K., Ferrare, R. A., Hostetler, C. A., Russell, P. B., Singh, H. B., Thompson, A. M., Shaw, G. E., McCauley, E., Pederson, J. R., and Fisher, J. A.: The Arctic Research of the Composition of the Troposphere from Aircraft and Satellites (ARCTAS) mission: design, execution, and first results, Atmos. Chem. Phys., 10, 5191–5212, https://doi.org/10.5194/acp-10-5191-2010, 2010.
Jaeglé, L., Jacob, D. J., Wang, Y., Weinheimer, A. J., Ridley, B. A., Campos, T. L., Sachse, G. W., and Hagen, D. E.: Sources and chemistry of NOx in the upper troposphere over the United States, Geophys. Res. Lett., 25, 1705–1708, https://doi.org/10.1029/97gl03591, 1998.
Kenagy, H. S., Sparks, T. L., Ebben, C. J., Wooldridge, P. J., Lopez-Hilfiker, F., Lee, B. H., Thornton, J. A., McDuffe, E. E., Fibiger, D. L., Brown, S. S., Montzka, D. D., Weinheimer, A. J., Schroder, J. C., Campuzano-Jost, P., Day, D. A., Jimenez, J. L., Dibb, J. E., Campos, T., Shah, V., Jaegle, L., and Cohen, R. C.: NOx Lifetime and NOy Partitioning During WINTER, J. Geophys. Res., 123, 9813–9827, https://doi.org/10.1029/2018JD028736, 2018.
Krotkov, N. A., Lamsal, L. N., Celarier, E. A., Swartz, W. H., Marchenko, S. V., Bucsela, E. J., Chan, K. L., Wenig, M., and Zara, M.: The version 3 OMI NO2 standard product, Atmos. Meas. Tech., 10, 3133–3149, https://doi.org/10.5194/amt-10-3133-2017, 2017.
Levelt, P. F., Van den Oord, G. H. J., Dobber, M. R., Malkki, A., Visser, H., de Vries, J., Stammes, P., Lundell, J. O. V., and Saari, H.: The Ozone Monitoring Instrument, IEEE T. Geosci. Remote, 44, 1093–1101, https://doi.org/10.1109/Tgrs.2006.872333, 2006.
Marchenko, S., Krotkov, N. A., Lamsal, L. N., Celarier, E. A., Swartz, W. H., and Bucsela, E. J.: Revising the slant column density retrieval of nitrogen dioxide observed by the Ozone Monitoring Instrument, J. Geophys. Res., 120, 5670–5692, https://doi.org/10.1002/2014jd022913, 2015.
Martin, R. V., Sauvage, B., Folkins, I., Sioris, C. E., Boone, C., Bernath, P., and Ziemke, J.: Space-based constraints on the production of nitric oxide by lightning, J. Geophys. Res., 112, D09309, https://doi.org/10.1029/2006jd007831, 2007.
Miyazaki, K., Eskes, H. J., Sudo, K., and Zhang, C.: Global lightning NOx production estimated by an assimilation of multiple satellite data sets, Atmos. Chem. Phys., 14, 3277–3305, https://doi.org/10.5194/acp-14-3277-2014, 2014.
Murray, L. T.: Lightning NOx and Impacts on Air Quality, Current Pollut. Rep., 2, 115–133, https://doi.org/10.1007/s40726-016-0031-7, 2016.
Murray, L. T., Jacob, D. J., Logan, J. A., Hudman, R. C., and Koshak, W. J.: Optimized regional and interannual variability of lightning in a global chemical transport model constrained by LIS/OTD satellite data, J. Geophys. Res., 117, D20307, https://doi.org/10.1029/2012jd017934, 2012.
Murray, L. T., Mickley, L. J., Kaplan, J. O., Sofen, E. D., Pfeiffer, M., and Alexander, B.: Factors controlling variability in the oxidative capacity of the troposphere since the Last Glacial Maximum, Atmos. Chem. Phys., 14, 3589–3622, https://doi.org/10.5194/acp-14-3589-2014, 2014.
NASA: Aircraft observations for SEAC4RS, https://doi.org/10.5067/AIRCRAFT/SEAC4RS/AEROSOL-TRACEGAS-CLOUD, last access: 1 April 2017a.
NASA: Aircraft observations for DC3, https://doi.org/10.5067/Aircraft/DC3/DC8/Aerosol-TraceGas, last access: 1 April 2017b.
NASA: Aircraft observations for INTEX-A, https://doi.org/10.5067/Aircraft/INTEXA/Aerosol-TraceGas, last access: 1 April 2017c.
NASA: Aircraft observations for INTEX-B, https://doi.org/10.5067/Aircraft/INTEXB/Aerosol-TraceGas, last access: 1 April 2017d.
NASA: Aircraft observations for ARCTAS, available at: https://www-air.larc.nasa.gov/cgi-bin/ArcView/arctas?DC8-MERGE=1#1_MINUTE/, last access: 1 April 2017e.
Nault, B. A., Garland, C., Wooldridge, P. J., Brune, W. H., Campuzano-Jost, P., Crounse, J. D., Day, D. A., Dibb, J., Hall, S. R., Huey, L. G., Jimenez, J. L., Liu, X. X., Mao, J. Q., Mikoviny, T., Peischl, J., Pollack, I. B., Ren, X. R., Ryerson, T. B., Scheuer, E., Ullmann, K., Wennberg, P. O., Wisthaler, A., Zhang, L., and Cohen, R. C.: Observational Constraints on the Oxidation of NOx in the Upper Troposphere, J. Phys. Chem. A, 120, 1468–1478, https://doi.org/10.1021/acs.jpca.5b07824, 2016.
Ott, L. E., Pickering, K. E., Stenchikov, G. L., Allen, D. J., DeCaria, A. J., Ridley, B., Lin, R. F., Lang, S., and Tao, W. K.: Production of lightning NOx and its vertical distribution calculated from three-dimensional cloud-scale chemical transport model simulations, J. Geophys. Res., 115, D04301, https://doi.org/10.1029/2009jd011880, 2010.
Pickering, K. E., Bucsela, E., Allen, D., Ring, A., Holzworth, R., and Krotkov, N.: Estimates of lightning NOx production based on OMI NO2 observations over the Gulf of Mexico, J. Geophys. Res., 121, 8668–8691, https://doi.org/10.1002/2015jd024179, 2016.
Prather, M. J. and Jacob, D. J.: A persistent imbalance in HOx and NOx photochemistry of the upper troposphere driven by deep tropical convection, Geophys. Res. Lett., 24, 3189–3192, https://doi.org/10.1029/97gl03027, 1997.
Price, C. and Rind, D.: A simple lightning parameterization for calculating global lightning distributions, J. Geophys. Res., 97, 9919–9933, https://doi.org/10.1029/92JD00719, 1992.
Price, C. and Rind, D.: What determines the cloud-to-ground lightning fraction in thunderstorms, Geophys. Res. Lett., 20, 463–466, https://doi.org/10.1029/93gl00226, 1993.
Price, C. and Rind, D.: Modeling global lightning distributions in a General-Circulation Model, Mon. Weather Rev., 122, 1930–1939, https://doi.org/10.1175/1520-0493(1994)122<1930:Mgldia>2.0.Co;2, 1994.
Rap, A., Richards, N. A. D., Forster, P. M., Monks, S. A., Arnold, S. R., and Chipperfield, M. P.: Satellite constraint on the tropospheric ozone radiative effect, Geophys. Res. Lett., 42, 5074–5081, https://doi.org/10.1002/2015gl064037, 2015.
Reed, C., Evans, M. J., Di Carlo, P., Lee, J. D., and Carpenter, L. J.: Interferences in photolytic NO2 measurements: explanation for an apparent missing oxidant?, Atmos. Chem. Phys., 16, 4707–4724, https://doi.org/10.5194/acp-16-4707-2016, 2016.
Sauvage, B., Martin, R. V., van Donkelaar, A., Liu, X., Chance, K., Jaeglé, L., Palmer, P. I., Wu, S., and Fu, T.-M.: Remote sensed and in situ constraints on processes affecting tropical tropospheric ozone, Atmos. Chem. Phys., 7, 815–838, https://doi.org/10.5194/acp-7-815-2007, 2007.
Schumann, U. and Huntrieser, H.: The global lightning-induced nitrogen oxides source, Atmos. Chem. Phys., 7, 3823–3907, https://doi.org/10.5194/acp-7-3823-2007, 2007.
Silvern, R. F., Jacob, D. J., Travis, K. R., Sherwen, T., Evans, M. J., Cohen, R. C., Laughner, J. L., Hall, S. R., Ullmann, K., Crounse, J. D., Wennberg, P. O., Peischl, J., and Pollack, I. B.: Observed NO∕NO2 ratios in the upper troposphere imply errors in cycling kinetics or an unaccounted NOx reservoir, Geophys. Res. Lett., 45, 4466–4474, 2018.
Singh, H. B., Brune, W. H., Crawford, J. H., Jacob, D. J., and Russell, P. B.: Overview of the summer 2004 intercontinental chemical transport experiment – North America (INTEX-A), J. Geophys. Res., 111, D24S01, https://doi.org/10.1029/2006jd007905, 2006.
Singh, H. B., Brune, W. H., Crawford, J. H., Flocke, F., and Jacob, D. J.: Chemistry and transport of pollution over the Gulf of Mexico and the Pacific: spring 2006 INTEX-B campaign overview and first results, Atmos. Chem. Phys., 9, 2301–2318, https://doi.org/10.5194/acp-9-2301-2009, 2009.
Stettler, M. E. J., Eastham, S., and Barrett, S. R. H.: Air quality and public health impacts of UK airports. Part I: Emissions, Atmos. Environ., 45, 5415–5424, https://doi.org/10.1016/j.atmosenv.2011.07.012, 2011.
Stratmann, G., Ziereis, H., Stock, P., Brenninkmeijer, C. A. M., Zahn, A., Rauthe-Schoch, A., Velthoven, P. V., Schlager, H., and Volz-Thomas, A.: NO and NOy in the upper troposphere: Nine years of CARIBIC measurements onboard a passenger aircraft, Atmos. Environ., 133, 93–111, https://doi.org/10.1016/j.atmosenv.2016.02.035, 2016.
Toon, O. B., Maring, H., Dibb, J., Ferrare, R., Jacob, D. J., Jensen, E. J., Luo, Z. J., Mace, G. G., Pan, L. L., Pfister, L., Rosenlof, K. H., Redemann, J., Reid, J. S., Singh, H. B., Thompson, A. M., Yokelson, R., Minnis, P., Chen, G., Jucks, K. W., and Pszenny, A.: Planning, implementation, and scientific goals of the Studies of Emissions and Atmospheric Composition, Clouds and Climate Coupling by Regional Surveys (SEAC4RS) field mission, J. Geophys. Res., 121, 4967–5009, https://doi.org/10.1002/2015jd024297, 2016.
Tost, H., Jckel, P., and Lelieveld, J.: Lightning and convection parameterisations – uncertainties in global modelling, Atmos. Chem. Phys., 7, 4553–4568, https://doi.org/10.5194/acp-7-4553-2007, 2007.
Travis, K. R., Jacob, D. J., Fisher, J. A., Kim, P. S., Marais, E. A., Zhu, L., Yu, K., Miller, C. C., Yantosca, R. M., Sulprizio, M. P., Thompson, A. M., Wennberg, P. O., Crounse, J. D., St. Clair, J. M., Cohen, R. C., Laughner, J. L., Dibb, J. E., Hall, S. R., Ullmann, K., Wolfe, G. M., Pollack, I. B., Peischl, J., Neuman, J. A., and Zhou, X.: Why do models overestimate surface ozone in the Southeast United States?, Atmos. Chem. Phys., 16, 13561–13577, https://doi.org/10.5194/acp-16-13561-2016, 2016.
van Geffen, J. H. G. M., Boersma, K. F., Van Roozendael, M., Hendrick, F., Mahieu, E., De Smedt, I., Sneep, M., and Veefkind, J. P.: Improved spectral fitting of nitrogen dioxide from OMI in the 405–465 nm window, Atmos. Meas. Tech., 8, 1685–1699, https://doi.org/10.5194/amt-8-1685-2015, 2015.
Worden, H. M., Bowman, K. W., Kulawik, S. S., and Aghedo, A. M.: Sensitivity of outgoing longwave radiative flux to the global vertical distribution of ozone characterized by instantaneous radiative kernels from Aura-TES, J. Geophys. Res., 116, D14115, https://doi.org/10.1029/2010jd015101, 2011.
Ziemke, J. R., Chandra, S., and Bhartia, P. K.: “Cloud slicing”: A new technique to derive upper tropospheric ozone from satellite measurements, J. Geophys. Res., 106, 9853–9867, https://doi.org/10.1029/2000jd900768, 2001.