the Creative Commons Attribution 4.0 License.
the Creative Commons Attribution 4.0 License.
 | 29 Nov 2018
Microphysical characteristics of frozen droplet aggregates from deep convective clouds
Junshik Um
Greg M. McFarquhar
Jeffrey L. Stith
Chang Hoon Jung
Seoung Soo Lee
Ji Yi Lee
Younghwan Shin
Yun Gon Lee
Yiseok Isaac Yang
Seong Soo Yum
Byung-Gon Kim
Joo Wan Cha
A-Reum Ko
During the 2012 Deep Convective Clouds and Chemistry (DC3) experiment the National Science Foundation/National Center for Atmospheric Research Gulfstream V (GV) aircraft sampled the upper anvils of two storms that developed in eastern Colorado on 6 June 2012. A cloud particle imager (CPI) mounted on the GV aircraft recorded images of ice crystals at altitudes of 12.0 to 12.4 km and temperatures (T) from −61 to −55 ∘C. A total of 22 393 CPI crystal images were analyzed, all with maximum dimension ( µm and with an average Dmax of 80.7±45.4 µm. The occurrence of well-defined pristine crystals (e.g., columns and plates) was less than 0.04 % by number. Single frozen droplets and frozen droplet aggregates (FDAs) were the dominant habits with fractions of 73.0 % (by number) and 46.3 % (by projected area), respectively. The relative frequency of occurrence of single frozen droplets and FDAs depended on temperature and position within the anvil cloud.
A new algorithm that uses the circle Hough transform technique was developed to automatically identify the number, size, and relative position of element frozen droplets within FDAs. Of the FDAs, 42.0 % had two element frozen droplets with an average of 4.7±5.0 element frozen droplets. The frequency of occurrence gradually decreased with the number of element frozen droplets. Based on the number, size, and relative position of the element frozen droplets within the FDAs, possible three-dimensional (3-D) realizations of FDAs were generated and characterized by two different shape parameters, the aggregation index (AI) and the fractal dimension (Df), that describe 3-D shapes and link to scattering properties with an assumption of spherical shape of element frozen droplets. The AI of FDAs decreased with an increase in the number of element frozen droplets, with larger FDAs with more element frozen droplets having more compact shapes. The Df of FDAs was about 1.20–1.43 smaller than that of black carbon (BC) aggregates (1.53–1.85) determined in previous studies. Such a smaller Df of FDAs indicates that FDAs have more linear chain-like branched shapes than the compact shapes of BC aggregates. Determined morphological characteristics of FDAs along with the proposed reconstructed 3-D representations of FDAs in this study have important implications for improving the calculations of the microphysical (e.g., fall velocity) and radiative (e.g., asymmetry parameter) properties of ice crystals in upper anvil clouds.


Deep convective systems, such as thunderstorms and mesoscale convective systems (MCSs), play an important role in Earth's climate system, for example, by conveying ice crystals to the upper troposphere and lower stratosphere, redistributing latent heat, controlling precipitation, and regulating the Earth's radiation budget (Jensen et al., 1996; Stephens, 2005; de Reus et al., 2009; Frey et al., 2011; Feng et al., 2011, 2012; Gayet et al., 2012; Taylor et al., 2016). Clouds formed by deep convection show several distinct features. Vigorous turrets associated with deep convection generate intense precipitation that influences the hydrological cycle and large anvil shields that modulate radiation due to their extensive spatial and temporal coverage (Feng et al., 2011, 2012; Wang et al., 2015). Overshooting tops associated with strong updrafts are responsible for stratosphere–troposphere exchange (Homeyer et al., 2014; Frey et al., 2015) and can be an indicator of the severity of a thunderstorm (Proud, 2015).
Clouds formed by deep convection have three thermodynamic phases: liquid, mixed, and ice. The cloud particles also have different shapes, sizes, and concentrations that vary in the horizontal and vertical causing horizontal and vertical variability in radiative properties. For example, precipitating cores of tropical convective clouds reveal a negative impact on radiation balance, whereas non-precipitating anvils have a positive impact (Hartmann and Berry, 2017). A numerical simulation (Fu et al., 1995) showed that the spatial extent of an anvil cloud is influenced by moisture advection from the convective turret, radiative effects, and small-scale convection occurring within the anvil (Lilly, 1988). The relationships between the spatial and temporal coverage of convectively generated clouds and their radiative impact are still not well understood and affect the representation of cloud feedbacks in numerical models (Bony et al., 2015, 2016; Hartmann, 2016; Hartmann and Berry, 2017).
Despite the high height of the tropopause and the remote regions where some of these cloud systems occur, there have been in situ measurements of the microphysical and scattering properties of ice crystals in anvil tops (e.g., Heymsfield, 1986; McFarquhar and Heymsfield, 1996; Stith et al., 2002, 2004, 2014, 2016; Connolly et al., 2005; Gallagher et al., 2005; Heymsfield et al., 2005; May et al., 2008; Jensen et al., 2009; Lawson et al., 2010; Frey et al., 2011; Gayet et al., 2012; Barth et al., 2015; Jensen et al., 2016). Although in situ aircraft measurements have some limitations as crystals are not observed where they form (Um et al., 2015), they along with laboratory experiments (e.g., Bailey and Hallett, 2004, 2009) provide information on how crystal habit varies with temperature and humidity.
One distinct characteristic of anvil clouds is the frequent occurrence of plate type crystals and their aggregates, which is different from ice crystals found in non-convective cirrus, where bullet rosettes and their aggregates are most common (McFarquhar and Heymsfield, 1996; Stith et al., 2002; Lawson et al., 2003; Connolly et al., 2005; Um and McFarquhar, 2009; Järvinen et al., 2016). As plate type crystals form at warmer temperatures (Bailey and Hallett, 2004, 2009) than the typical temperatures at anvil tops, these plate crystals must form at lower altitudes and be transported to upper altitudes by convection. It has been hypothesized that the “chain-like” shaped aggregates frequently observed in convective clouds may be produced by high electric fields within clouds (Saunders and Wahab, 1975; Stith et al., 2002, 2004; Lawson et al., 2003; Connolly et al., 2005; Um and McFarquhar, 2009). These shapes differ from aggregates observed in non-convective cirrus where aggregates of bullet rosettes are more common (Um and McFarquhar, 2007) and chain-like structures are not commonly seen.
Another unique feature of ice crystals in deep convective clouds is the high concentration of small frozen droplets (Gayet et al., 2012; Baran et al., 2012; Stith et al., 2014). These are no doubt generated from the freezing of supercooled droplets that have been observed at temperatures as low as −37.5 ∘C in deep continental convective clouds (Rosenfeld and Woodley, 2000). Below this temperature homogeneous freezing occurs in the strong updrafts which produces high concentrations of quasi-spherical frozen droplets with maximum dimensions µm (Heymsfield and Sabin, 1989; Phillips et al., 2007; Heymsfield et al., 2009). However, instrumental uncertainties associated with the generation of artificially high concentrations of small ice crystals from the shattering of large ice crystals on the tips of in situ probes (Field et al., 2003, 2006; McFarquhar et al., 2007; Korolev et al., 2011; Lawson, 2011; Jackson and McFarquhar, 2014; Jackson et al., 2014; Korolev and Field, 2015) cast some doubt on the exact concentration of these small crystals. Knowledge about the concentrations, shapes, and scattering properties of these small crystals at cloud top is crucial for satellite retrievals that rely on visible and near-infrared wavelengths due to their strong influence on cloud reflectance (e.g., Stephens et al., 1990; McFarquhar et al., 1999; Yang et al., 2001).
Although not plentiful, there are some observations of the shapes of these small ice crystals at the tops of anvils and convective towers. Gayet et al. (2012) reported up to 70 cm−3 of frozen droplets and their aggregates with chain-like shapes in the overshooting tops of a continental deep convective cloud at ∘C. A mean effective diameter of 43 µm, maximum particle size of ∼300 µm, and an asymmetry parameter of ∼0.776 were observed in the very dense cloud tops. Single frozen droplets and frozen droplet aggregates (FDAs) were also observed in midlatitude continental convective clouds during the 2012 Deep Convective Clouds and Chemistry (DC3) experiment (Barth et al., 2015; Stith et al., 2014). Based on these observations, the occurrence of single frozen droplets and FDAs as a function of position within the anvil cloud and of updraft velocity was determined (Stith et al., 2014). A positive correlation between the frequency of occurrence of FDAs and the level of nitrogen oxide (NOx) produced by lightning suggested that a strong electric force in the updrafts was playing a role in the formation of the FDAs (Stith et al., 2016). Conversely, these FDAs have not been observed in tropical or maritime convective clouds where updrafts are not as strong. Aggregates of faceted crystals (e.g., plate) are more common in these systems (Stith et al., 2002, 2004; Lawson et al., 2003; Connolly et al., 2005; Um and McFarquhar, 2009; Gallagher et al., 2012) because droplets originating at cloud base are less likely to reach the homogeneous freezing level of −38 ∘C (Heymsfield et al., 2009).
The radiative properties (e.g., albedo) of convective cloud systems depend strongly on both the concentrations and shapes of crystals in the anvil-cloud layer. In order to better understand the role of continental convective clouds in Earth's radiation budget, the fractional contributions of different habits must be quantified, and the scattering properties of the habits determined. This is complicated by a couple of issues. First, several idealized crystal models representing shapes of small crystals have been proposed (McFarquhar et al., 2002; Yang et al., 2003; Nousiainen and McFarquhar, 2004; Nousiainen et al., 2011; Um and McFarquhar, 2011, 2013; Järvinen et al., 2016), but it is not known which best characterizes the shapes. Second, few in situ aircraft observations of continental convective clouds have been made due to their high altitudes and the difficulty of flying through or near strong updrafts. In this study, 22 393 crystals imaged by a cloud particle imager (CPI) on 6 June 2012 in anvil clouds over eastern Colorado during DC3 are analyzed to determine the morphological properties of single frozen droplets and FDAs (e.g., size and number of element) and their radiative impacts. Although previous studies (Gayet et al., 2012; Baran et al., 2012; Stith et al., 2014, 2016) have analyzed FDAs observed in continental deep convective clouds, the dimensions and three-dimensional (3-D) shapes of FDAs that are important for radiative implication were not determined as is done in this study.
The remainder of this paper is organized as follows. Section 2 summarizes the in situ aircraft measurements made during DC3. In Sect. 3, a habit classification scheme that distinguishes FDAs from other crystals is introduced along with the methodology used to identify the number and size of element frozen droplets within FDAs. The morphology of FDAs and their reconstructed 3-D shapes are shown in Sect. 4. Two different parameters that describe the 3-D shapes of aggregate particles, fractal dimension and aggregation index, are also introduced. Furthermore, the characteristics of the shapes of FDAs are compared against those of black carbon aggregates in Sect. 4. The significance of this study and concluding remarks are made in Sect. 5.
2.1 Cloud probes
The 2012 DC3 experiment investigated the impacts of deep midlatitude continental convective clouds on upper tropospheric chemistry and composition in the US Midwest (Barth et al., 2015). The National Science Foundation (NSF)/National Center for Atmospheric Research (NCAR) Gulfstream V (GV), the National Aeronautics and Space Administration (NASA) DC-8, and the Deutsches Zentrum für Luft- und Raumfahrt (DLR) Falcon aircraft were deployed during DC3.
In this study, in situ measurements were acquired from the GV equipped with a Stratton Park Engineering Company Inc. (SPEC) 3V-CPI instrument, a cloud droplet probe (CDP, manufactured by Droplet Measurement Technologies, DMT), and a specially modified Particle Measuring Systems (PMS) optical array probe (2DC), which uses high-speed electronics and a 64-element 25 µm-resolution diode array in order to shadow particles at the sampling speeds of the GV. The 3V-CPI instrument provided high-resolution (i.e., 2.3 µm) images of ice crystals with sizes up to ∼2300 µm at 400 frames per second. The CDP determined the number distribution function N(Dmax) and total concentration (NCDP) of ice crystals with a Dmax between 2 and 50 µm from the amount of light forward scattered. The 2DC optical array probe measured N(Dmax) for µm. Other details on the GV instrumentation are provided in Stith et al. (2014).
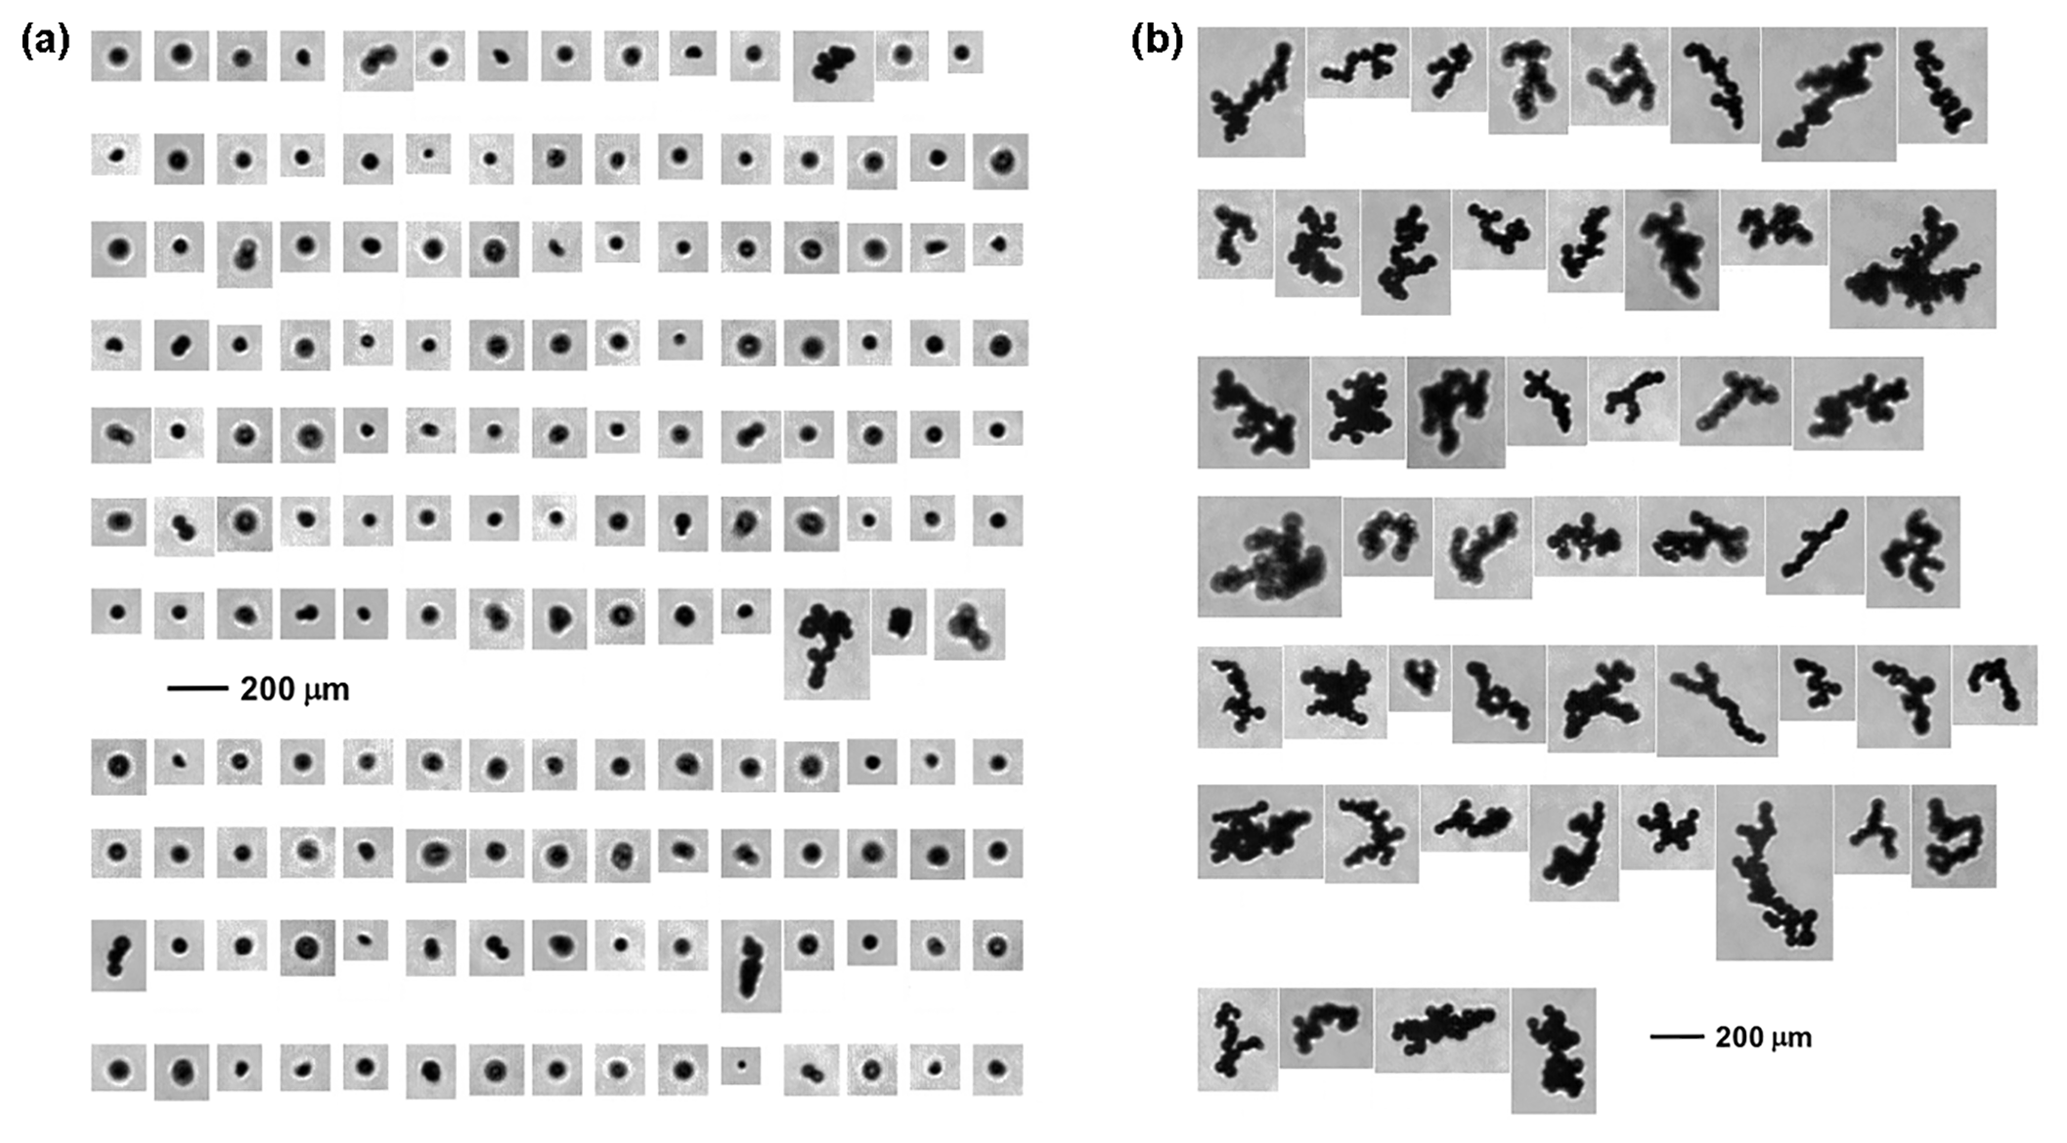
Figure 1(a) Example CPI images of ice crystals observed at ∘C (altitude of 12.11 km) between 22:12:13 and 22:12:19 UTC, and (b) example CPI images of ice crystals observed at ∘C (altitude of 12.03 km) between 22:21:02 and 22:22:14 UTC. The 200 µm scale bar is embedded in each figure.
The shattering of large cloud particles on the shrouds, tips, or inlets of cloud probes can cause artificial increases in in situ measured concentrations of small particles. Thus, the impacts of shattering must be prevented or removed (Field et al., 2003, 2006; McFarquhar et al., 2007; Korolev et al., 2011; Lawson, 2011; Jackson and McFarquhar, 2014; Jackson et al., 2014; Korolev and Field, 2015). The CDP used during DC3 did not have a shroud; thus, shattering is not expected to be substantial (Stith et al., 2014). Anti-shattering tips (Korolev et al., 2011) were installed on the 2DC, and post-processing methods of removing particles with small interarrival times (Field et al., 2003, 2006) were applied. 2DC measurements of only particles with µm were used in this study due to a poorly defined depth of field for smaller particles (e.g., McFarquhar et al., 2017). Thus, the CDP (NCDP) and 2DC (N2DC>100) concentrations are used to identify the presence of small ( µm) and large ( µm) particles, respectively. Information about particle shape was obtained from the CPI component of the 3V-CPI. But, only CPI images with focus >20 were used (McFarquhar et al., 2013), and analysis of multiple particles on the same frame was not performed as Um and McFarquhar (2011) suggested that they might be shattered artifacts.
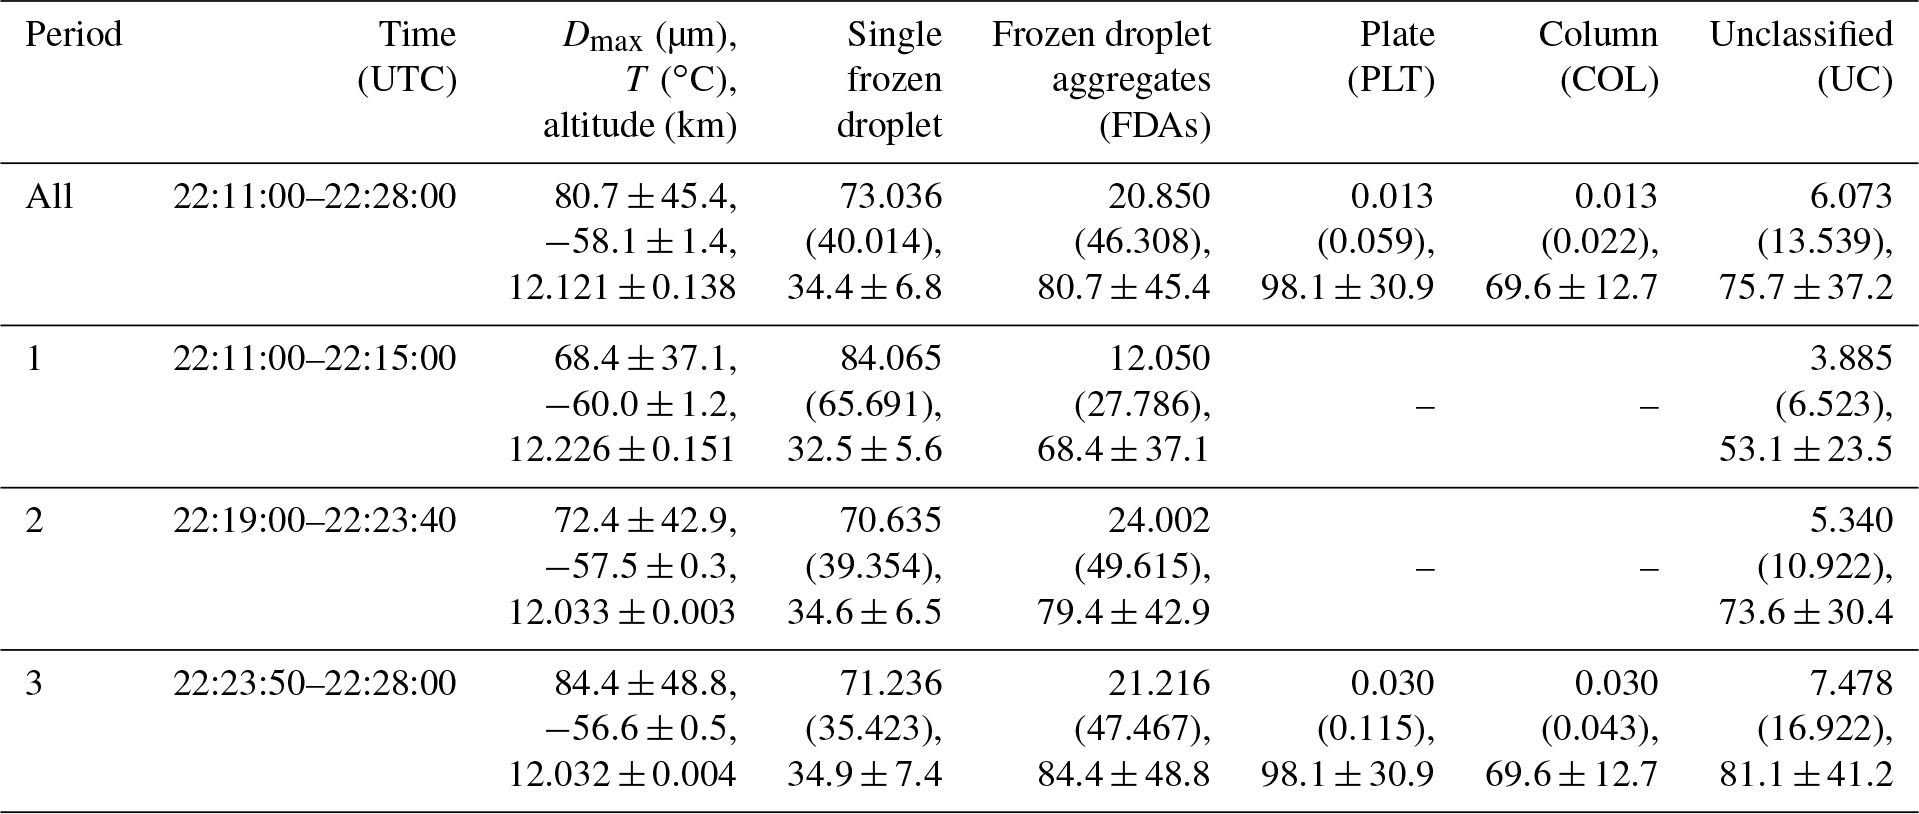
Table 1Segregated time periods of the 6 June flight and contributions (%) of crystal habit to the total number (total projected area) of ice crystals for the given time period. The average and standard deviation of temperature (T), altitude, and maximum dimension (Dmax) of ice crystals determined from CPI images are also listed for the given time period.
2.2 Anvil observations
During the 6 June 2012 flight, the GV sampled the upper anvils of two storms that developed in eastern Colorado between 22:10:00 and 22:30:00 UTC near the CSU-CHILL radar (40.45∘ N and 104.64∘ W). The two storms were aligned north–south, separated by ∼70 km, and had similar size and intensity based on the next generation weather radar (NEXRAD) images (see Figs. 1–3 of Stith et al., 2014). Examples of CPI crystal images sampled during this flight are shown in Fig. 1. They were mainly (>93 % by number) single frozen droplets with quasi-circular shapes and their aggregates (i.e., FDAs). This is consistent with the analysis of Stith et al. (2014), who showed that these upper anvil regions were primarily composed of frozen droplets with differing degrees of aggregation, with FDAs being most frequent in the center and lower regions of the upper anvil. More details about these two storms are discussed in Stith et al. (2014, 2016). The GV flew two constant altitude runs during this period, at altitudes and temperatures of 12.0 to 12.4 km and −61 to −55 ∘C, respectively (see Fig. 2). This period is further segregated into three periods: (1) 22:11:30–22:14:55 UTC, (2) 22:19:00–22:23:40 UTC, and (3) 22:23:55–22:27:50 UTC (Table 1 and Fig. 2). These periods are selected in order to separate measurements in the north and south anvils and at different temperatures. During time periods 1 and 2, the same anvil of the south storm was sampled with a ∼4 min interval between the samples at two different temperatures ( and −57.5 ∘C, respectively), whereas period 3 sampled the north anvil at the higher temperature of −56.6 ∘C. In the next section, the frequency at which single frozen droplets and FDAs were observed is determined using a technique derived to identify the frozen droplet elements within FDAs.
3.1 Ice crystal habit classification
Based on CPI crystal images obtained in tropical ice clouds, Um and McFarquhar (2009) developed a classification scheme to sort crystals into eleven habits: small, medium, and large quasi-spheres, columns, plates, bullet rosettes, aggregates of columns, aggregates of plates, aggregates of bullet rosettes, capped columns, and unclassified. To represent other crystal habits commonly found in midlatitude and Arctic clouds, the capability of sorting into more habits (i.e., dendrite, needle, aggregates of needles, and FDAs) has been added to the scheme (McFarquhar et al., 2017). Thus, this habit classification scheme now sorts crystals into 15 different categories in a quasi-automatic manner that requires some manual intervention.

Figure 2(a) Temperature and altitude of the NSF/NCAR GV aircraft as a function of time on the 6 June 2012 flight and (b) the 1 s average concentration of measured CDP and 2DC>100. Determined habit fraction (c) by number and (d) by projected area as a function of time. Habit categories for panels (c) and (d) are shown using the colored legend under the figure . Habits are sorted into 15 categories: frozen droplet aggregates (FDAs), small quasi-sphere (SQS), medium quasi-sphere (MQS), large-quasi sphere (LQS), plate, aggregates of plates, bullet rosette, aggregates of bullet rosettes, column, aggregates of column, needle, aggregates of needles, dendrite, capped column, and unclassified as shown in Fig. 2. For simplicity single frozen drops (FD) denoted in this figure includes SQS, MQS, and LQS, while other habits except FDAs and UC are indicated as “Else” in this figure. Time periods 1, 2, and 3 are shaded gray in each panel.
In this study, ice crystals classified as small (SQS), medium (MQS), and large quasi-spheres (LQS) are regarded as single frozen droplets. The FDAs that occur near anvil tops are often classified as bullet rosettes, aggregates of bullet rosettes, or unclassified from the automated part of the algorithm; therefore, an additional manual check was necessary to confirm whether or not these crystals were FDAs. To be classified as FDAs, there must be at least two quasi-circular frozen droplets as elements. Habits that frequently occurred during the 6 June 2012 flight were single frozen droplets (i.e., SQS, MSQ, and LQS) and their aggregates (i.e., FDAs), whereas very few pristine shape crystals, such as plates, columns, and bullet rosettes, were observed (see Table 1 and Fig. 3).

Figure 3Contributions of ice crystal habits by number (red) and by projected area (blue) during (a) all periods, (b) period 1, (c) period 2, and (d) period 3. The total number of samples is indicated in each panel. Acronyms for crystal habits are indicated in the caption of Fig. 2.
3.2 Technique to identify element frozen droplets
The circle Hough transform (CHT, Duda and Hart, 1972) detects circular objects in digital images and is one of many feature-extracting techniques that use the Hough transform (Hough, 1962). Several variants of the Hough transform have been developed, such as, the fast Hough transform (Li et al., 1986), two-stage CHT (Yuen et al., 1990), space saving approach CHT (Albanesi and Ferretti, 1990), and the phase-coding method (Atherton and Kerbyson, 1999). These techniques have been used to detect natural particles with circular shapes in digital images, such as circular nanoparticles in transmission electron microscopy (TEM) images (Bescond et al., 2014; Mirzaei and Rafsanjani, 2017).
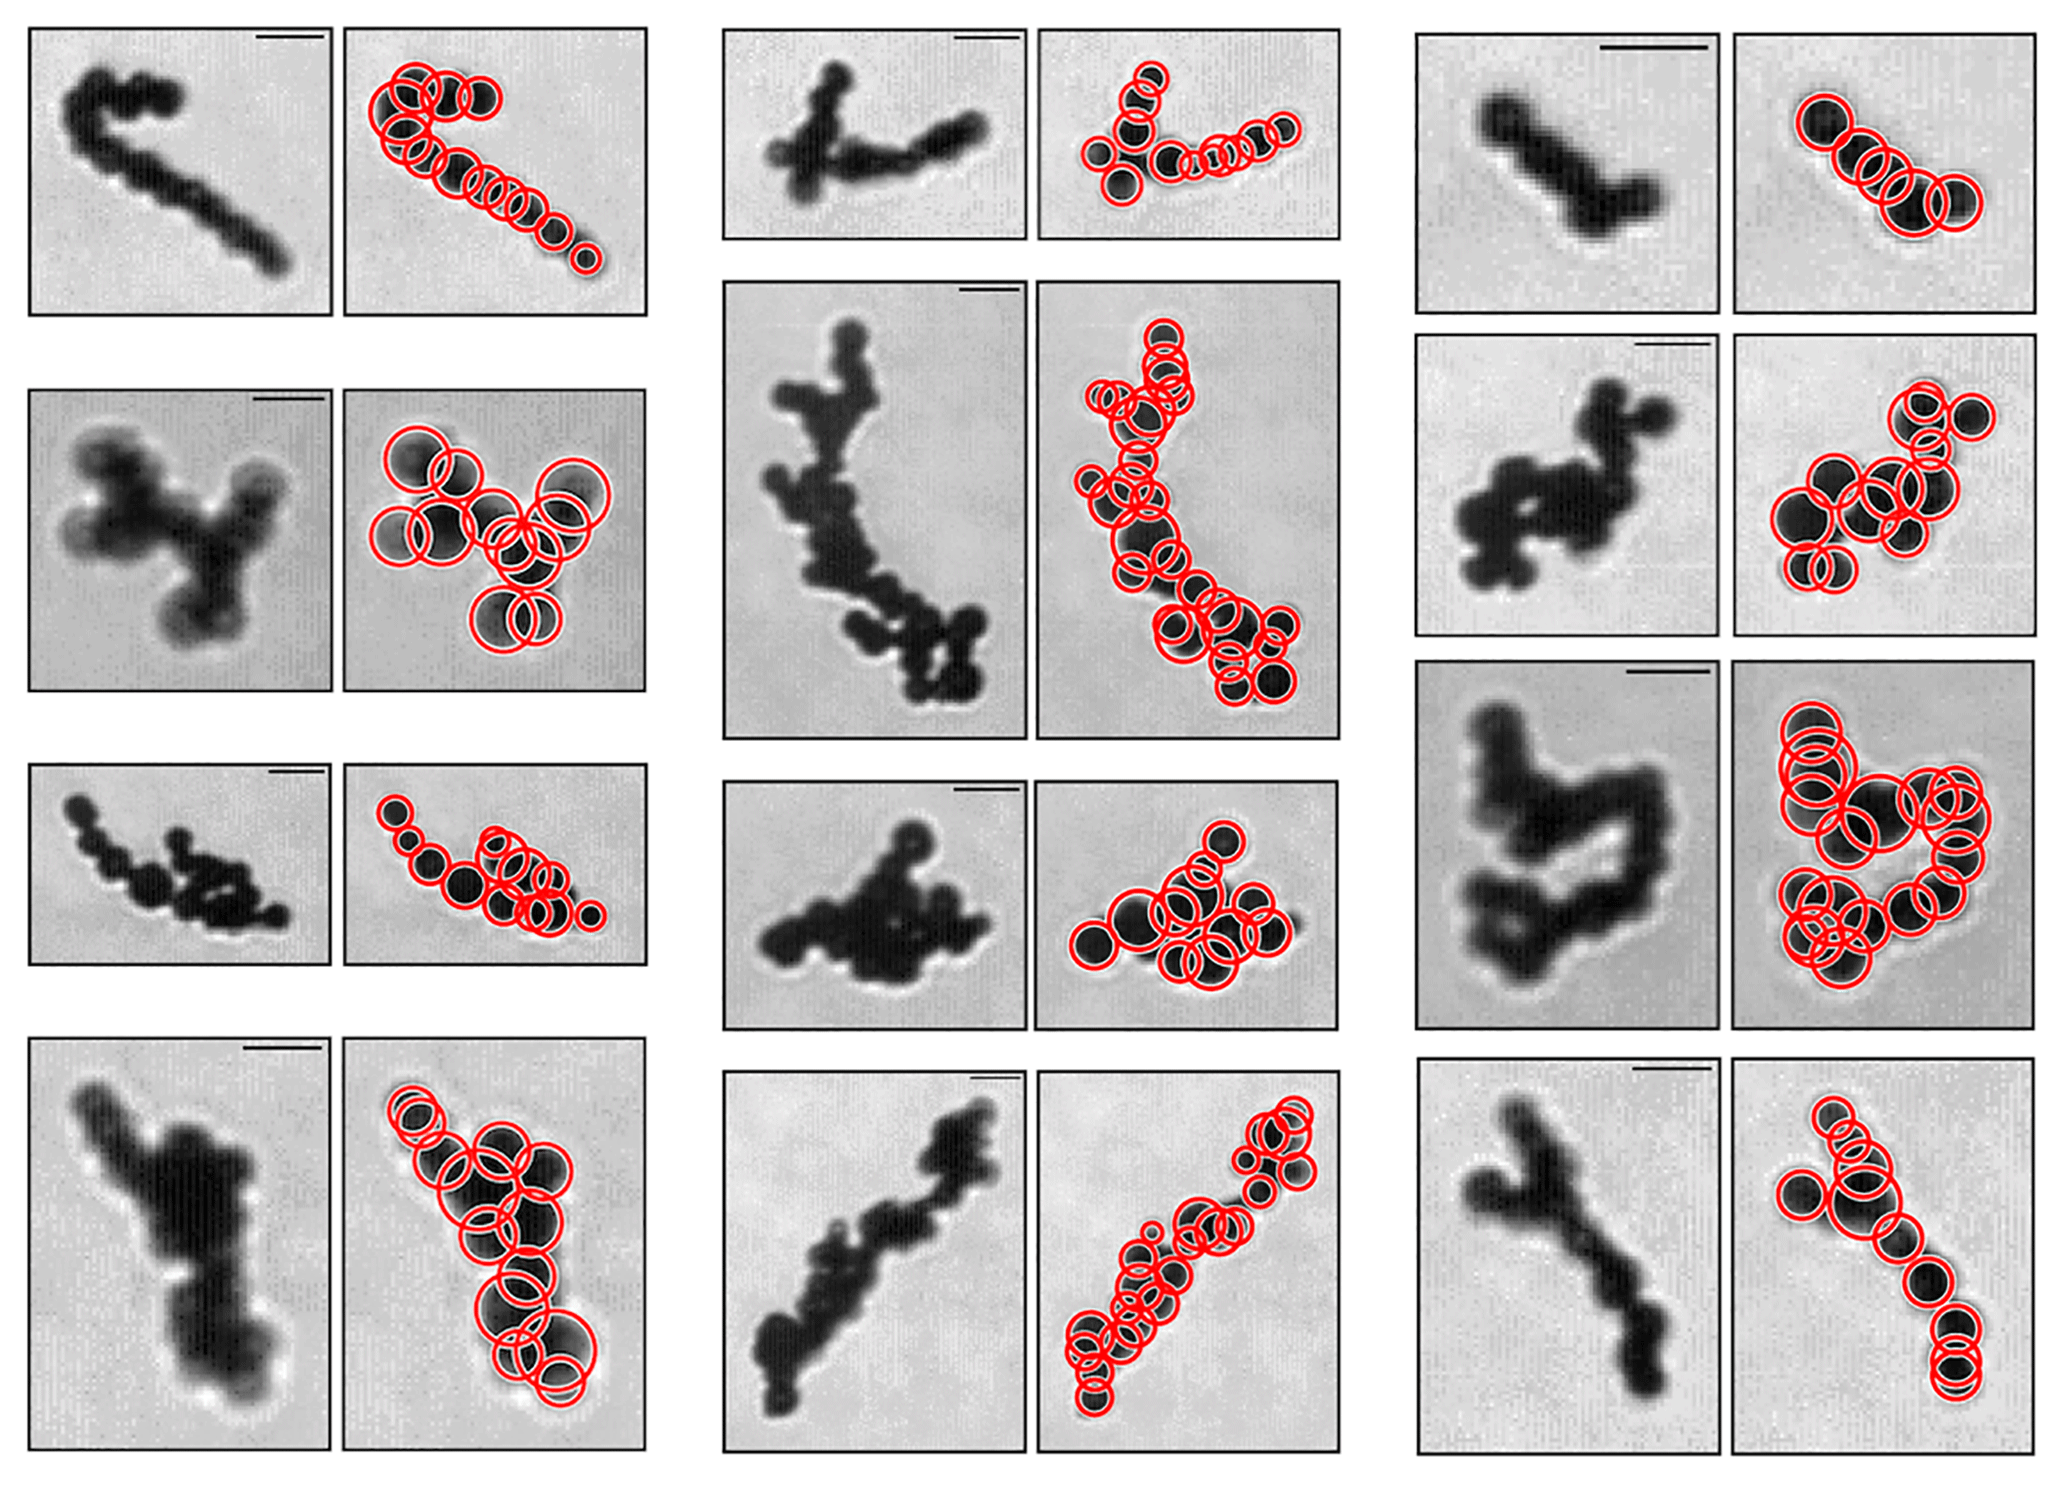
Figure 4CPI images of frozen droplet aggregates (FDAs, left image of each column) and those with determined element frozen droplets (red circle, right image of each column). The 46 µm scale bar is shown in each FDA image.
Prior studies have used such techniques to identify the elemental or primary particles within black carbon aggregates (e.g., Bescond et al., 2014; China et al., 2013), most of which are circular. Similar techniques can be applied to the FDAs observed near the tops of anvil clouds assuming the element frozen droplets have spherical shapes. The biggest difference between TEM and CPI images is that the quality of TEM images is, in general, better than that of CPI images. A CPI image has an inhomogeneous background and debris or noise, such as impulse noise (i.e., salt-and-pepper noise), which causes lower quality images. Thus, additional image-quality control was required before applying the CHT technique to the images. This was accomplished in a number of steps. First, a median filter that is a nonlinear digital filtering technique to remove noise is applied to the CPI images classified as FDAs. The 256-level gray-scale CPI images are then converted to binary images based on the average intensity of pixels to further remove background noise and debris. Figure 4 shows example images of CPI FDAs. Two different CHT techniques, the two-stage CHT and phase-coding method, are then applied to the images to detect element circles (i.e., frozen droplets) as shown by the red circles in Figs. 4 and 5. Two different techniques are used because the performance of each technique varies depending on the CPI image being classified. The technique used for the subsequent analysis is chosen as that for which the projected area of the FDAs determined for the element frozen droplets identified by CHT technique (i.e., area determined by red lines in Fig. 5) best matches that for the original CPI image (i.e., area enclosed by green line in Fig. 5). However, the performance of both techniques is quite similar. For example, the phase-coding technique shows closer agreement with the imaged area for the FDAs shown in the top row of Fig. 5, while the two-stage CHT shows closer agreement for the FDAs shown in the bottom row. Although the phase-coding method provided marginally better results for ∼54 % cases, the differences in projected area determined by the two techniques were within 9.7 % for all FDAs. Thus, since the performance of both methods in replicating the determined area of the CPI images is similar, there should be minimal bias in the determined results. The number and size of the element frozen droplets within the FDAs were then determined automatically. The relative positions (i.e., x and y coordinates) of the element frozen droplets were also identified.

Figure 5Element frozen droplets (red circles) determined using the phase-coding (left column) and two-stage CHT (middle column) techniques. Examples of two different FDAs are shown in the top and bottom rows, respectively. Original CPI images of FDAs are shown in the right column along with the 46 µm scale bar. The detected boundary (green lines) of the FDAs are shown on panels in the left and middle columns.
4.1 Frequency of occurrence of ice crystal habits
Figure 3 shows the normalized contribution of each habit to the total number (red) and to the total projected area (blue) of measured ice crystals during the three different time periods and integrated over the entire time period. For all time periods, single frozen droplets represented the dominant habit by number, whereas FDAs were dominant by projected area (see also Table 1). The fraction (by number) of single frozen droplets was 73.0 % (84.1 %; 70.6 %; 71.2 %) for all periods (period 1; period 2; period 3), whereas the area fraction of FDAs was 46.3 % (27.8 %; 49.6 %; 47.5 %). The fraction of well-defined pristine ice crystals, such as plates and columns, was less than 0.04 % by number and 0.12 % by area for all time periods, whereas unclassified crystals represented 6.1 % (3.9 %; 5.3 %; 7.5 %) by number for all periods (period 1; period 2; period 3) and 13.5 % (6.5 %; 10.9 %; 16.9 %) by area. These fractions of unclassified crystals were lower than those obtained from anvil cloud in the tropics (Um and McFarquhar, 2009) that showed more than 22 % and 37 % contributions by number and area, respectively. The presence of small crystals with relatively simple habit distributions shown in this study indicates that the anvil clouds were sampled in an early stage of development, which was verified using radar observations (Stith et al., 2014, 2016).
The average Dmax for all crystal habits was 80.7±45.4 µm for all periods, with the average Dmax of 68.4±37.1 µm during period 1 at ∘C smaller than those of 72.4±42.9 and 84.4±48.8 µm during periods 2 and 3 at ∘C and ∘C, respectively (Table 1). Table 1 also shows that the contributions of single frozen droplets and FDAs sampled in the south and north anvil in periods 2 and 3 are similar, whereas a much higher fraction of small frozen droplets was revealed in the south anvil during period 1 at a slightly lower temperature. For example, the fraction (by number) of single frozen droplets was 84.1 % in period 1, and 70.6 % and 71.2 % in periods 2 and 3, respectively. The fraction of FDAs in period 1 was 12.1 % and 27.8 % by number and projected area, respectively, which was substantially lower than those sampled in periods 2 and 3 (Table 1). Figure 2 shows that the fraction of single frozen droplets, in general, decreased as the GV penetrated into the center of anvil cloud (i.e., center of each gray shaded area shown on panels in Fig. 2), and then increased as it approached the cloud edge (i.e., both sides of each gray shaded area shown on panels in Fig. 2) for all periods. This variation in the relative occurrence of small and large crystals is more distinctly seen by comparing the NCDP and N2CD>100 shown in Fig. 2.
In summary, single frozen droplets and their aggregates dominated the upper anvil clouds sampled in situ, with the relative frequency of occurrence of single frozen droplets and FDAs dependent on temperature and position within the anvil, consistent with the conceptual model proposed by Stith et al. (2014, Fig. 12) and further detailed in Stith et al. (2016, Fig. 9).
4.2 Morphology of single frozen droplets and FDAs
Among the 4667 CPI images of FDAs, the CHT technique succeeded in identifying element frozen droplets for 4356 FDAs, whereas it failed for 311 FDAs (6.66 %). The number, size, and 2-D position of the element frozen droplets within the FDAs were thus determined automatically. Figure 6a shows the frequency distribution of the number of element frozen droplets within FDAs. The average number of frozen droplets within FDAs is 4.7±5.0 and the FDAs with two element frozen droplets are dominant with a frequency of occurrence of 42.0 %. This occurrence frequency gradually decreases with the number of element frozen droplets. The average and standard deviation of the diameter of the determined element frozen droplets (blue) are shown as a function of the number of element frozen droplets (Fig. 6b). The average and standard deviation of Dmax of the single frozen droplets (red) are also shown for comparison. Considering plausible errors ( µm) in the identifying algorithm and the 2.3 µm CPI resolution, the average and standard deviation of the diameter of the element frozen droplets (31.79±7.12 µm) are comparable with those of the Dmax of single frozen droplets (34.03±6.22 µm). The CPI errors in sizing particles vary with focus (Connolly et al., 2007) and can be larger than those considered in this study. The quasi-spherical shapes, non-pristine shapes, and similarity of single and element droplet sizes indicate that diffusional growth was likely not effective for the anvils sampled, and the large ice crystals (i.e., FDAs) grew mainly through aggregation. They also indicate that the sampled anvil clouds are in an early stage of development as verified by radar observations. The more complex structure of FDAs with an increase in the number of elements may cause errors in the estimated size of the element frozen droplets. For example, the increase in the determined diameter of element frozen droplets as the number of element frozen droplets increases from two to five in Fig. 6b may not be a physical effect, but rather caused by uncertainty in the methodology. The sizes of the element frozen droplets here (31.79±7.12 µm) are larger than those (15–20 µm) noted by Gayet et al. (2012) and those (∼10 µm) measured during laboratory experiments (Pedernera and Ávila, 2018). It is hard to determine the extent to which differences in methodology as opposed to physical differences in droplet sizes caused these differences because Gayet et al. (2012) did not specify how they determined frozen droplet size. However, despite the unavoidable errors in identifying the element frozen droplets due to the quality of the CPI images, the differences are large enough to suggest physical differences.
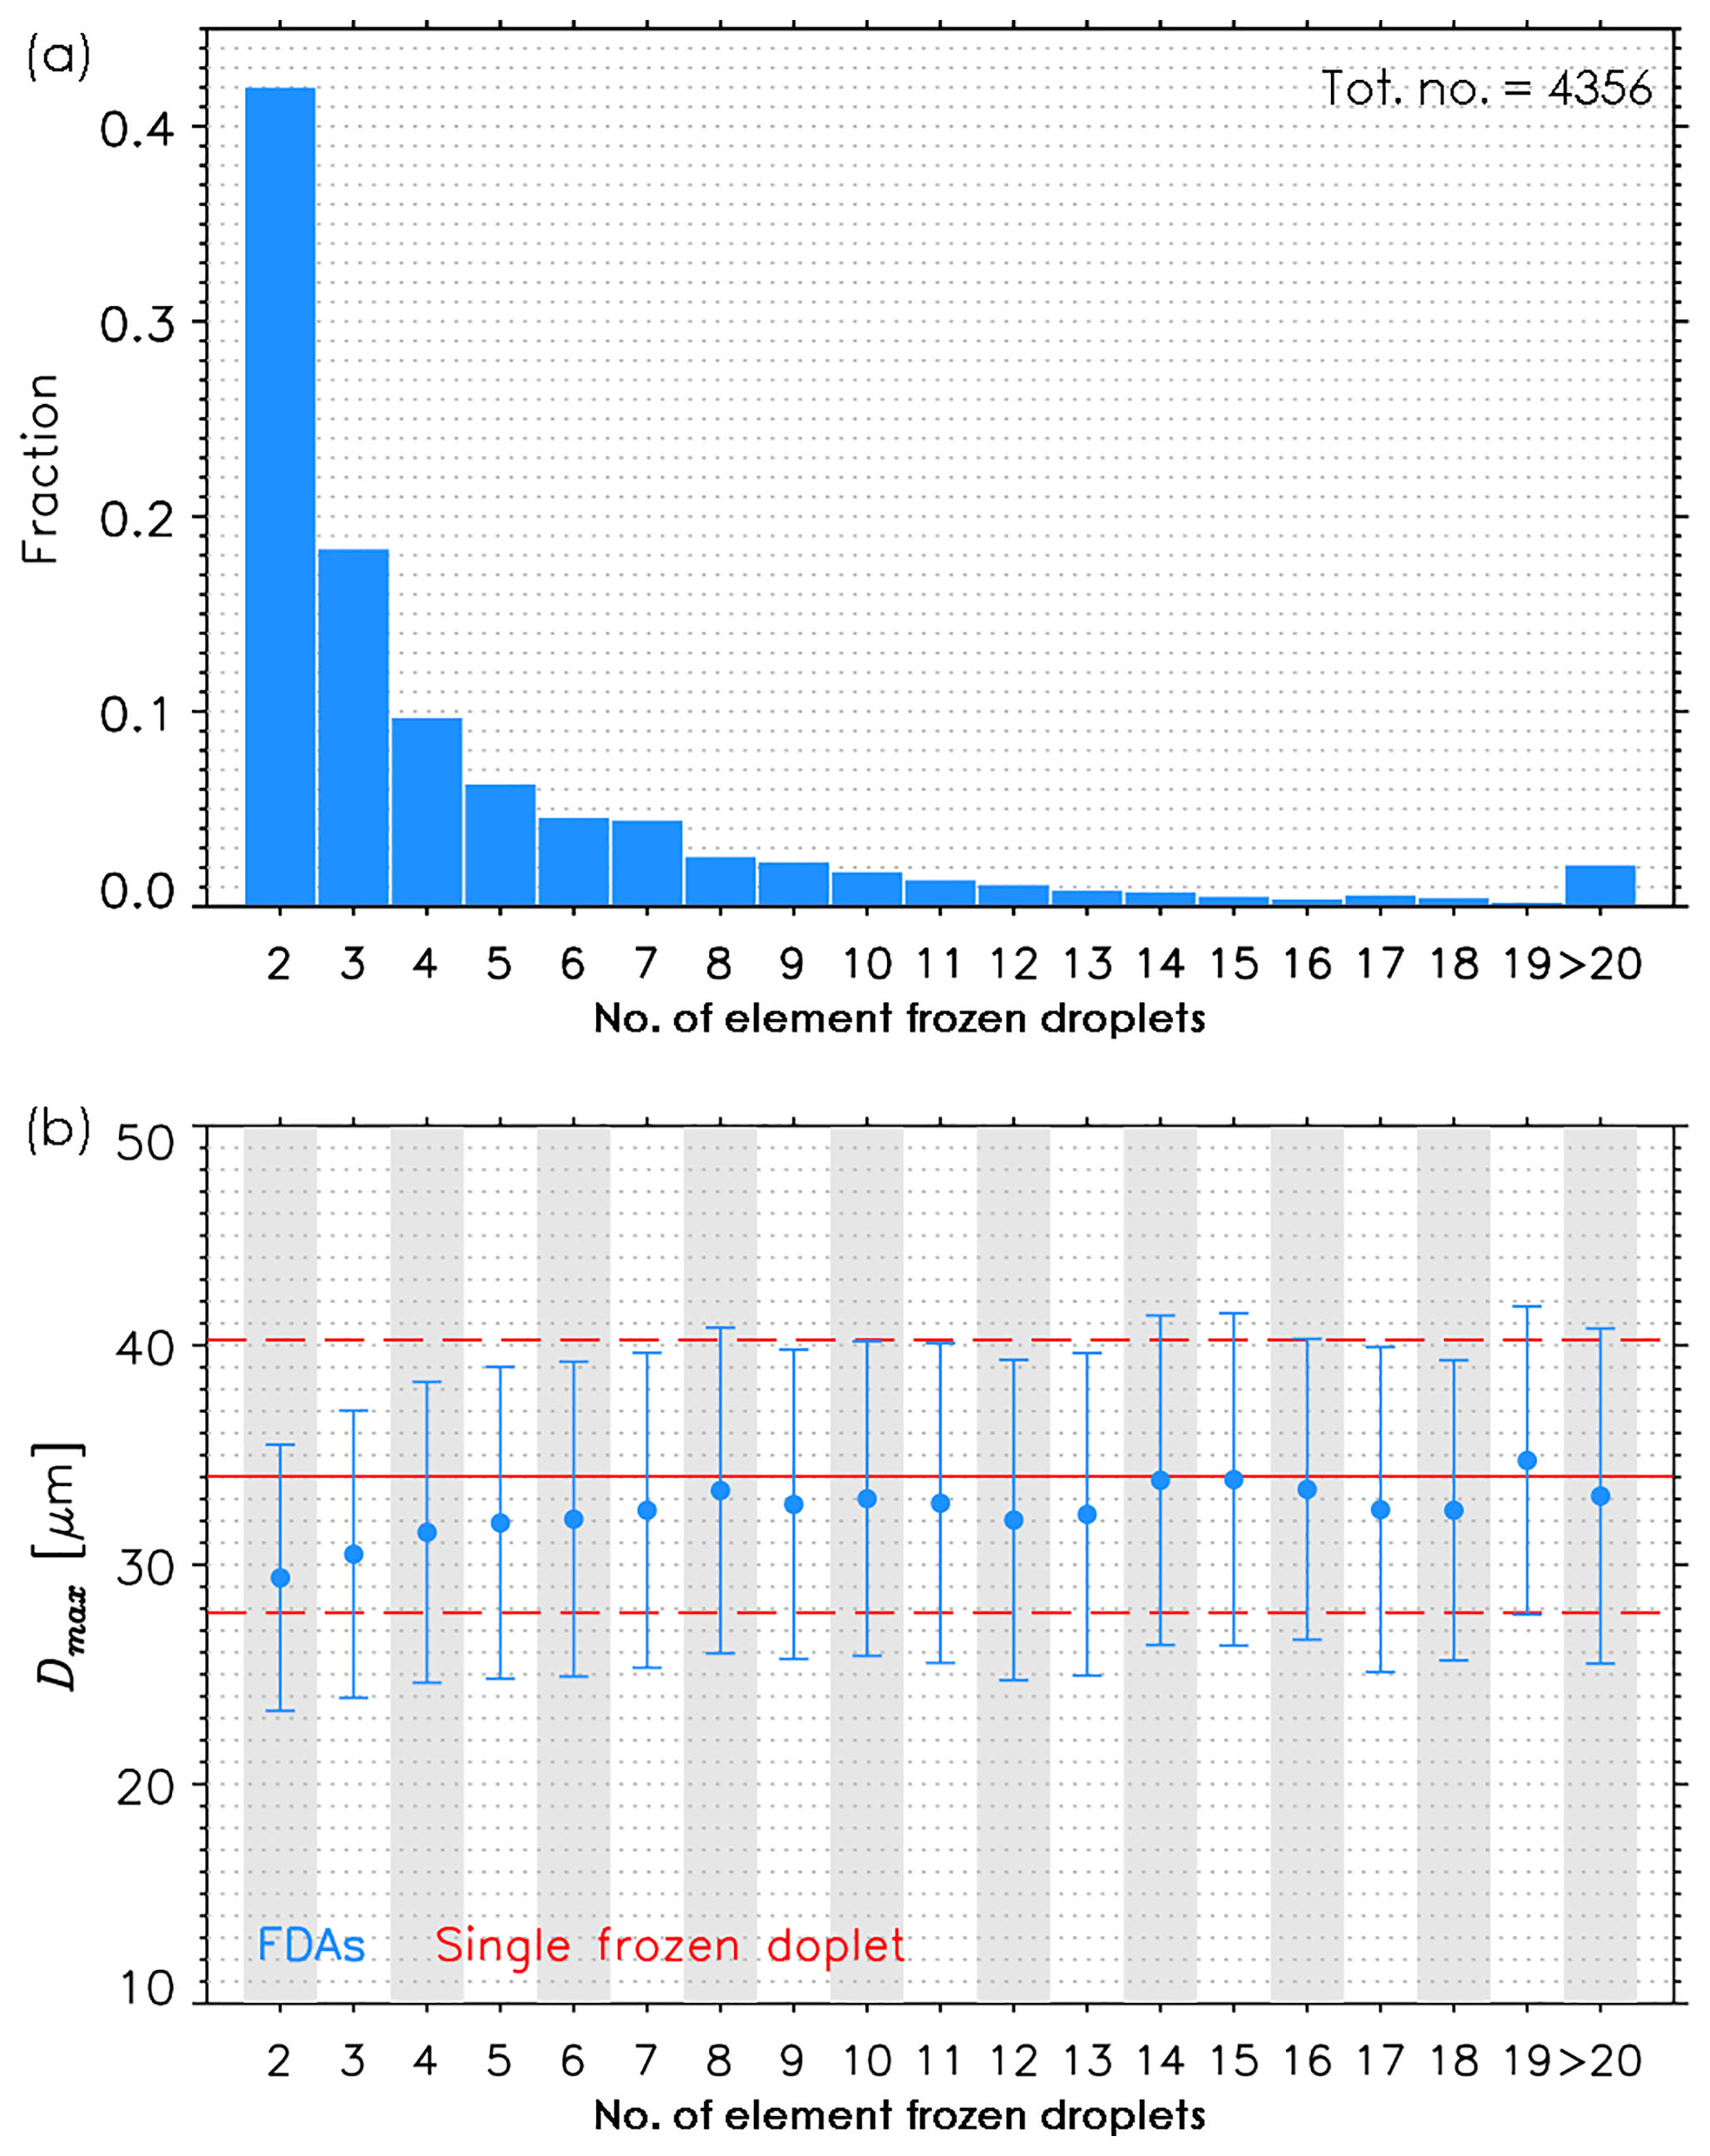
Figure 6(a) Normalized frequency of occurrence of the number of component frozen droplets within 4356 FDAs analyzed. (b) The average and standard deviation of the diameter of frozen droplets as a function of number of component frozen droplets within FDAs (blue). The average (red solid line) and standard deviation (red dash line) of the Dmax of single frozen droplets are also shown.
4.3 Three-dimensional representations of FDAs and comparison with black carbon aggregates
To determine microphysical (e.g., fall velocity) and scattering (e.g., asymmetry parameter) properties of cloud particles required for models, idealized 3-D models of the crystals are needed. However, cloud particle images recorded by cloud probes are silhouettes (i.e., 2-D images) of 3-D cloud particles (Nousiainen and McFarquhar, 2004). Retrieving the 3-D shapes of cloud particles based on the recorded silhouettes is difficult, especially for non-spherical ice crystals that have non-pristine shapes. It is easier to reconstruct 3-D shapes of well-defined pristine crystals, such as columns and plates. For example, an iterative approach to retrieve the 3-D shapes of bullet rosette crystals was developed (Um and McFarquhar, 2007). Assuming that the element crystals all had the same shape (e.g., plates), the 3-D shapes of more complex crystal aggregates (e.g., aggregates of plates) have also been reconstructed from crystal silhouettes (Um and McFarquhar, 2009).
FDAs consist of at least two element frozen droplets whose shapes are assumed to be spheres even though the elements are in fact quasi-spherical, meaning they have some departures from a spherical shape. The number, size, and 2-D position of the element frozen droplets within the FDAs were determined from the CPI images as explained in Sect. 3.2. Using this information, the 3-D shapes of FDAs are reconstructed for the given 2-D silhouette (i.e., CPI image) with the following assumptions:
-
element frozen droplets of FDAs are spheres;
-
there is no overlap between the elements of the frozen droplets; and
-
the maximum number of contacting points of an element frozen droplet with other frozen droplets is two.
Since the relative positions (i.e., x and y coordinates) and sizes of the element frozen droplets are known, the reconstruction problem becomes one of stacking spheres with varying combinations of a vertical (z) coordinate. The abovementioned assumptions reduce the number of possible 3-D realizations of FDAs for a given 2-D projection so that a maximum number of 3-D realizations is possible, where np is the number of element frozen droplets. For example, for FDAs with five element frozen droplets (i.e., np=5), a maximum number of eight different 3-D realizations is possible, while a maximum number of 256 3-D realizations is possible for FDAs with 10 elements. Figure 7 shows six different example 3-D realizations of the FDA shown in the top-left panel of Fig. 4. Since this FDA has 12 element frozen droplets, theoretically a total of 1024 3-D realizations are possible. However, FDAs such as this with a large number of element frozen droplets usually have notably fewer 3-D realizations due to the abovementioned assumptions, in particular due to the no overlap assumption.
As the number of element frozen droplets increases, the number of possible 3-D realizations also increases. For FDAs with 20 element frozen droplets, a maximum number of 262 144 different 3-D realizations is possible. Considering all 262 144 3-D realizations of FDAs is impractical for calculations of single-scattering properties. Thus, parameters that characterize the 3-D shapes of particles and link the 3-D shapes to scattering properties are required. Um and McFarquhar (2009) used several parameters, such as the aggregation index (AI), the area ratio, and the normalized projected area, to characterize the 3-D shape and to link to the scattering properties of aggregates of plate crystals. The motivation for the use of the AI is that the asymmetry parameter (g) of aggregates of plates was previously seen to increase with AI (Um and McFarquhar, 2009). In this study, a similar approach is adapted and the AI is defined as
where Dij is the distance between the center of frozen droplet i and that of frozen droplet j and np≥3. Physically, AI represents the ratio of the sum of the distances between the centers of all frozen droplets compared to that when they all lie on a straight line. Thus, when all frozen droplets lie on a straight line AI=1, whereas a smaller AI implies a more compact shape. The AI is calculated for every 3-D realization. Thus, there are 262 144 AIs for FDAs with 20 element frozen droplets. Since the 3-D shape complexity of a particle (i.e., AI) and its g was previously shown to have a positive relationship for aggregates of plate (Um and McFarquhar, 2009), the maximum, minimum, and average AI are calculated for a given FDA. The calculated maximum, minimum, and average AI of FDAs as a function of the number of element frozen droplets (for np>2) are shown in Fig. 8. The AI of FDAs decreases with np, which indicates that larger FDAs with more element frozen droplets have more compact shapes. Figure 9 shows that the AI of FDAs decreases slightly with increasing temperature. Stith et al. (2014) showed that FDAs were frequent in the lower regions (i.e., higher temperatures) of the upper anvil.

Figure 7Six different examples of 3-D representations of FDA. Each image has the same projected area (gray) as the CPI image shown in Fig. 4 (top-left image).
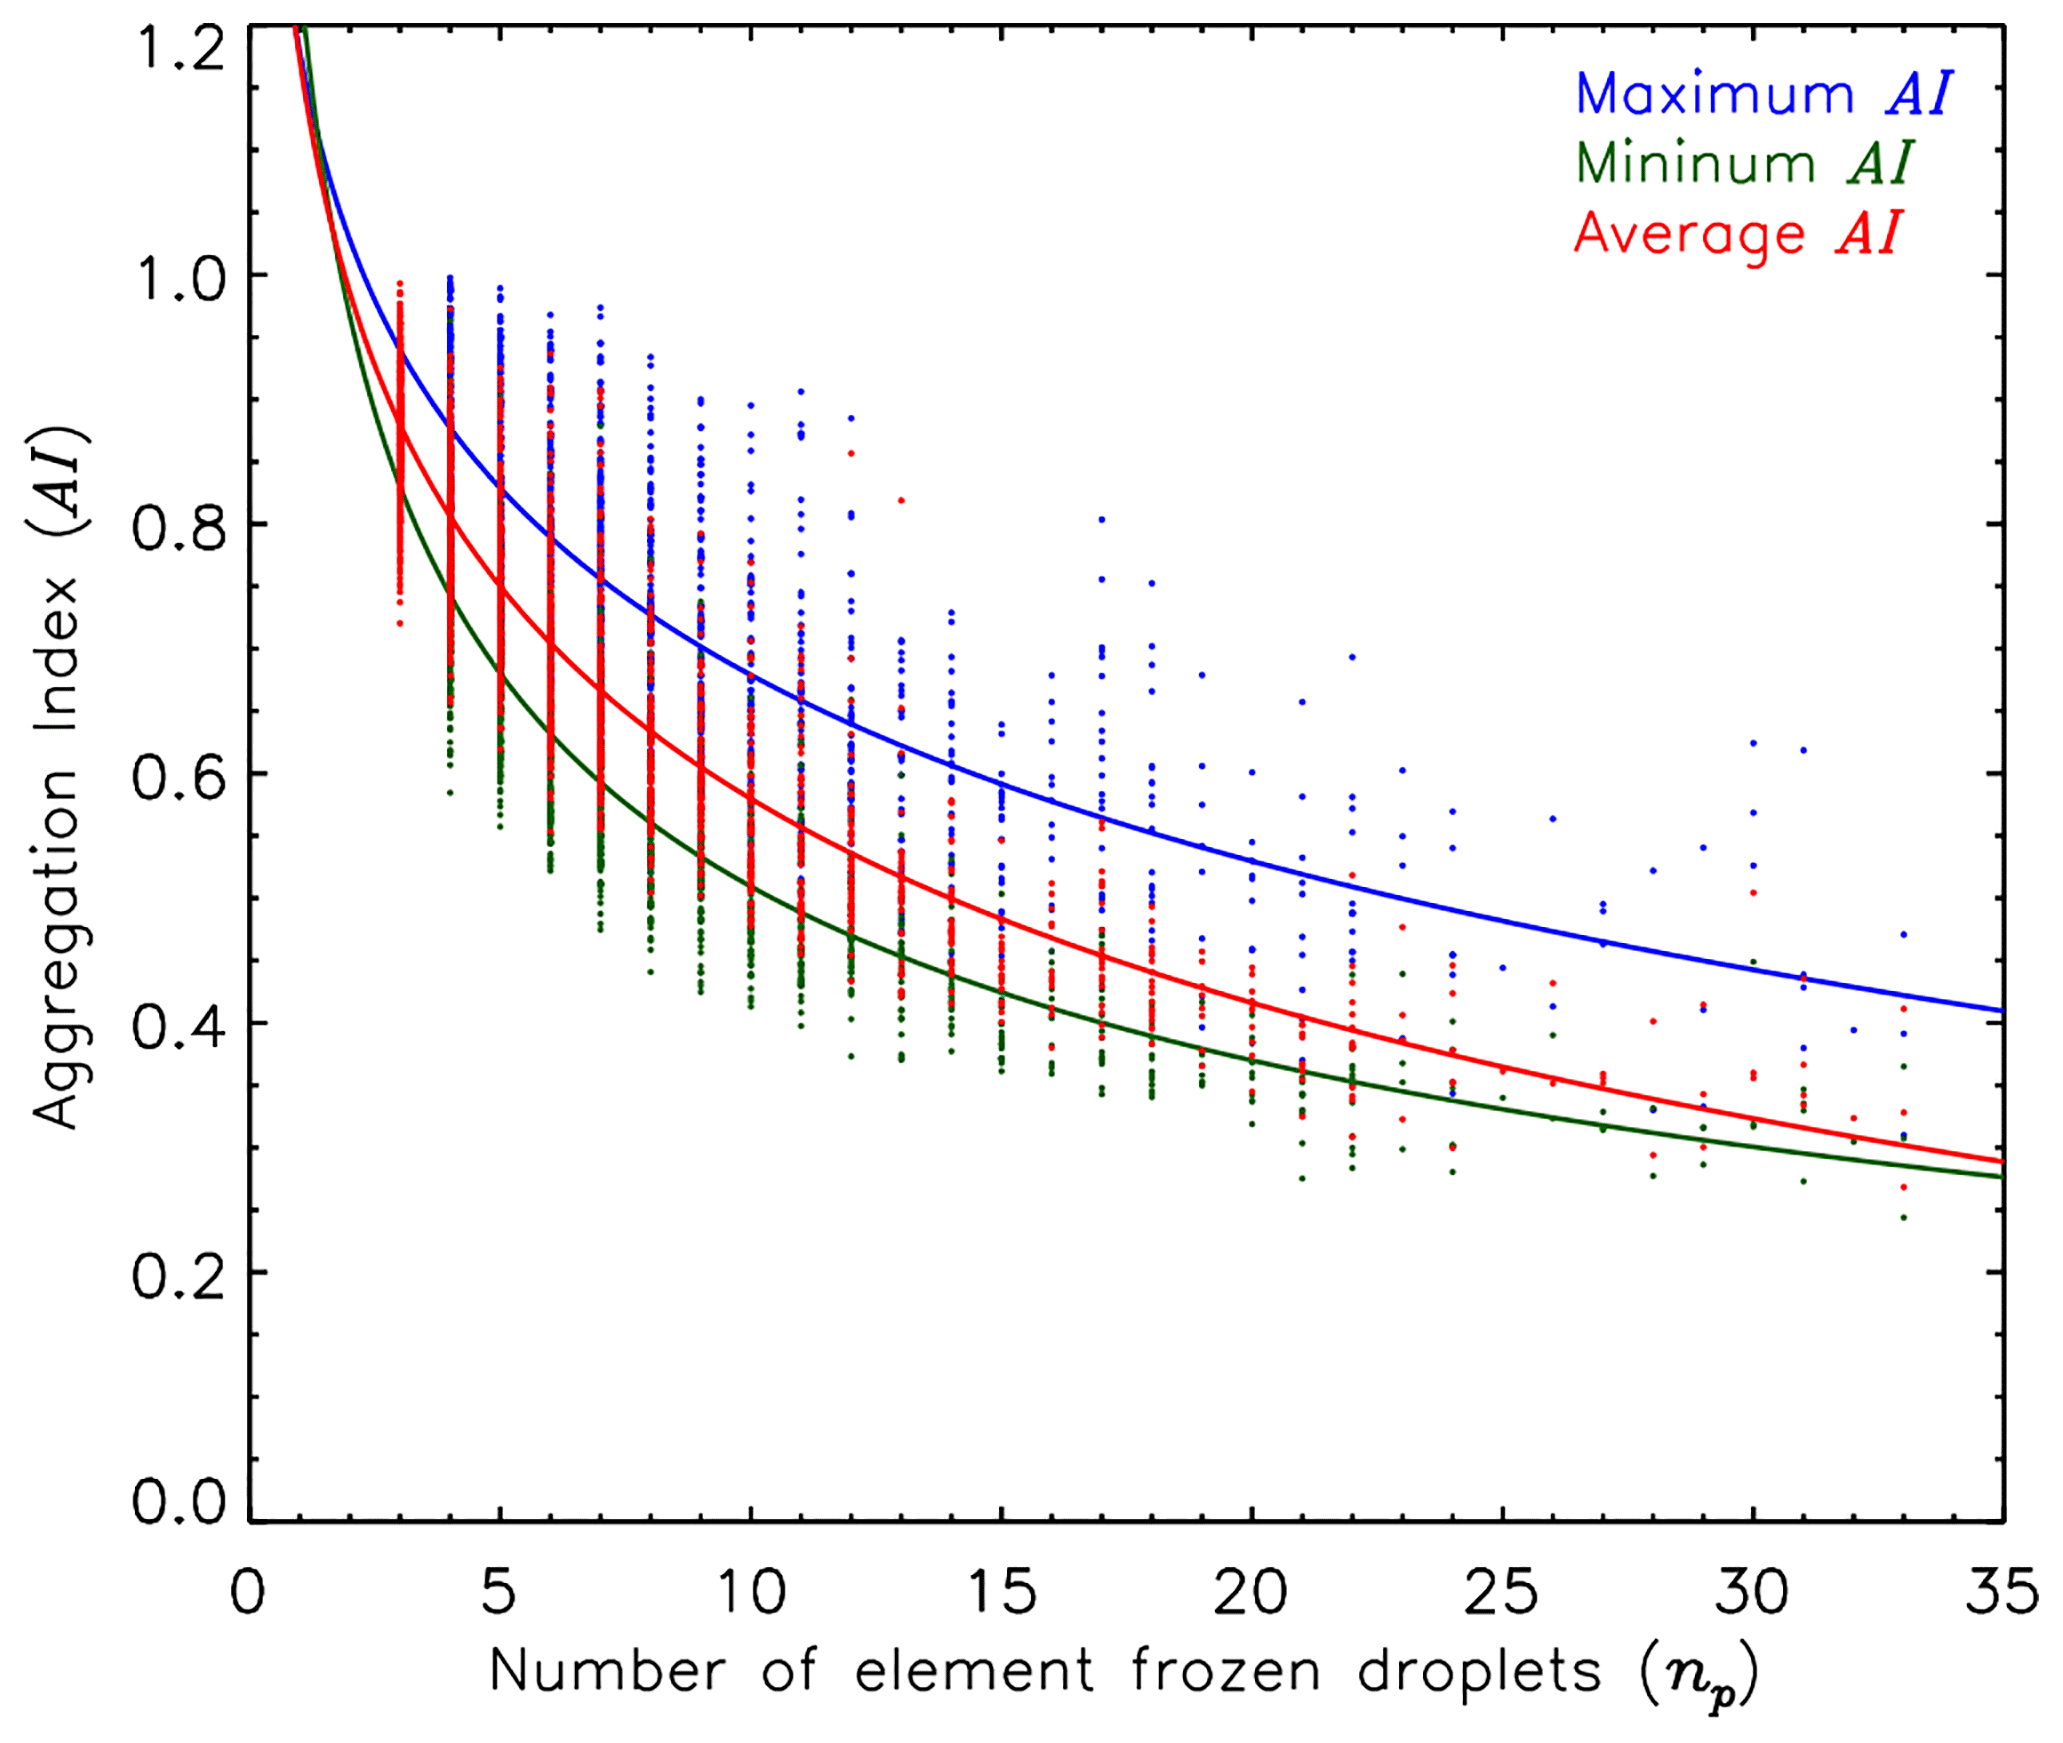
Figure 8The calculated maximum (blue), minimum (green), and average (red) aggregation index (AI) of FDAs (circles) as a function of the number of element frozen droplets. Best-fit lines are shown using solid lines.
A fractal dimension (Df) has been widely used to describe the 3-D shape or compactness of black carbon (soot) aggregates (e.g., Bescond et al., 2014; China et al., 2013) and can be represented using the following scaling law:
where Rg, rp, and kf are the radius of gyration, average radius of elements frozen droplets, and fractal prefactor (or structural coefficient) (Mandelbrot, 1982), respectively. The radius of gyration is represented as
where mi is the mass of ith element and xi is the distance between element i and the center of mass of the FDA. The radius of gyration is an overall cluster radius. The chain-like shapes of FDAs observed near the tops of anvil clouds (e.g., Fig. 1) show similarity with those of black carbon (BC) aggregates (see Figs. 6–8 in Lewis et al., 2009). Thus, identifying fractal dimensions of FDAs and comparing them against those of BC aggregates is of great interest to calculate the scattering properties as a function of shape. In this study, possible 3-D realizations of FDAs are represented using both AI and Df with subsequent comparison to the shape of BC aggregates.
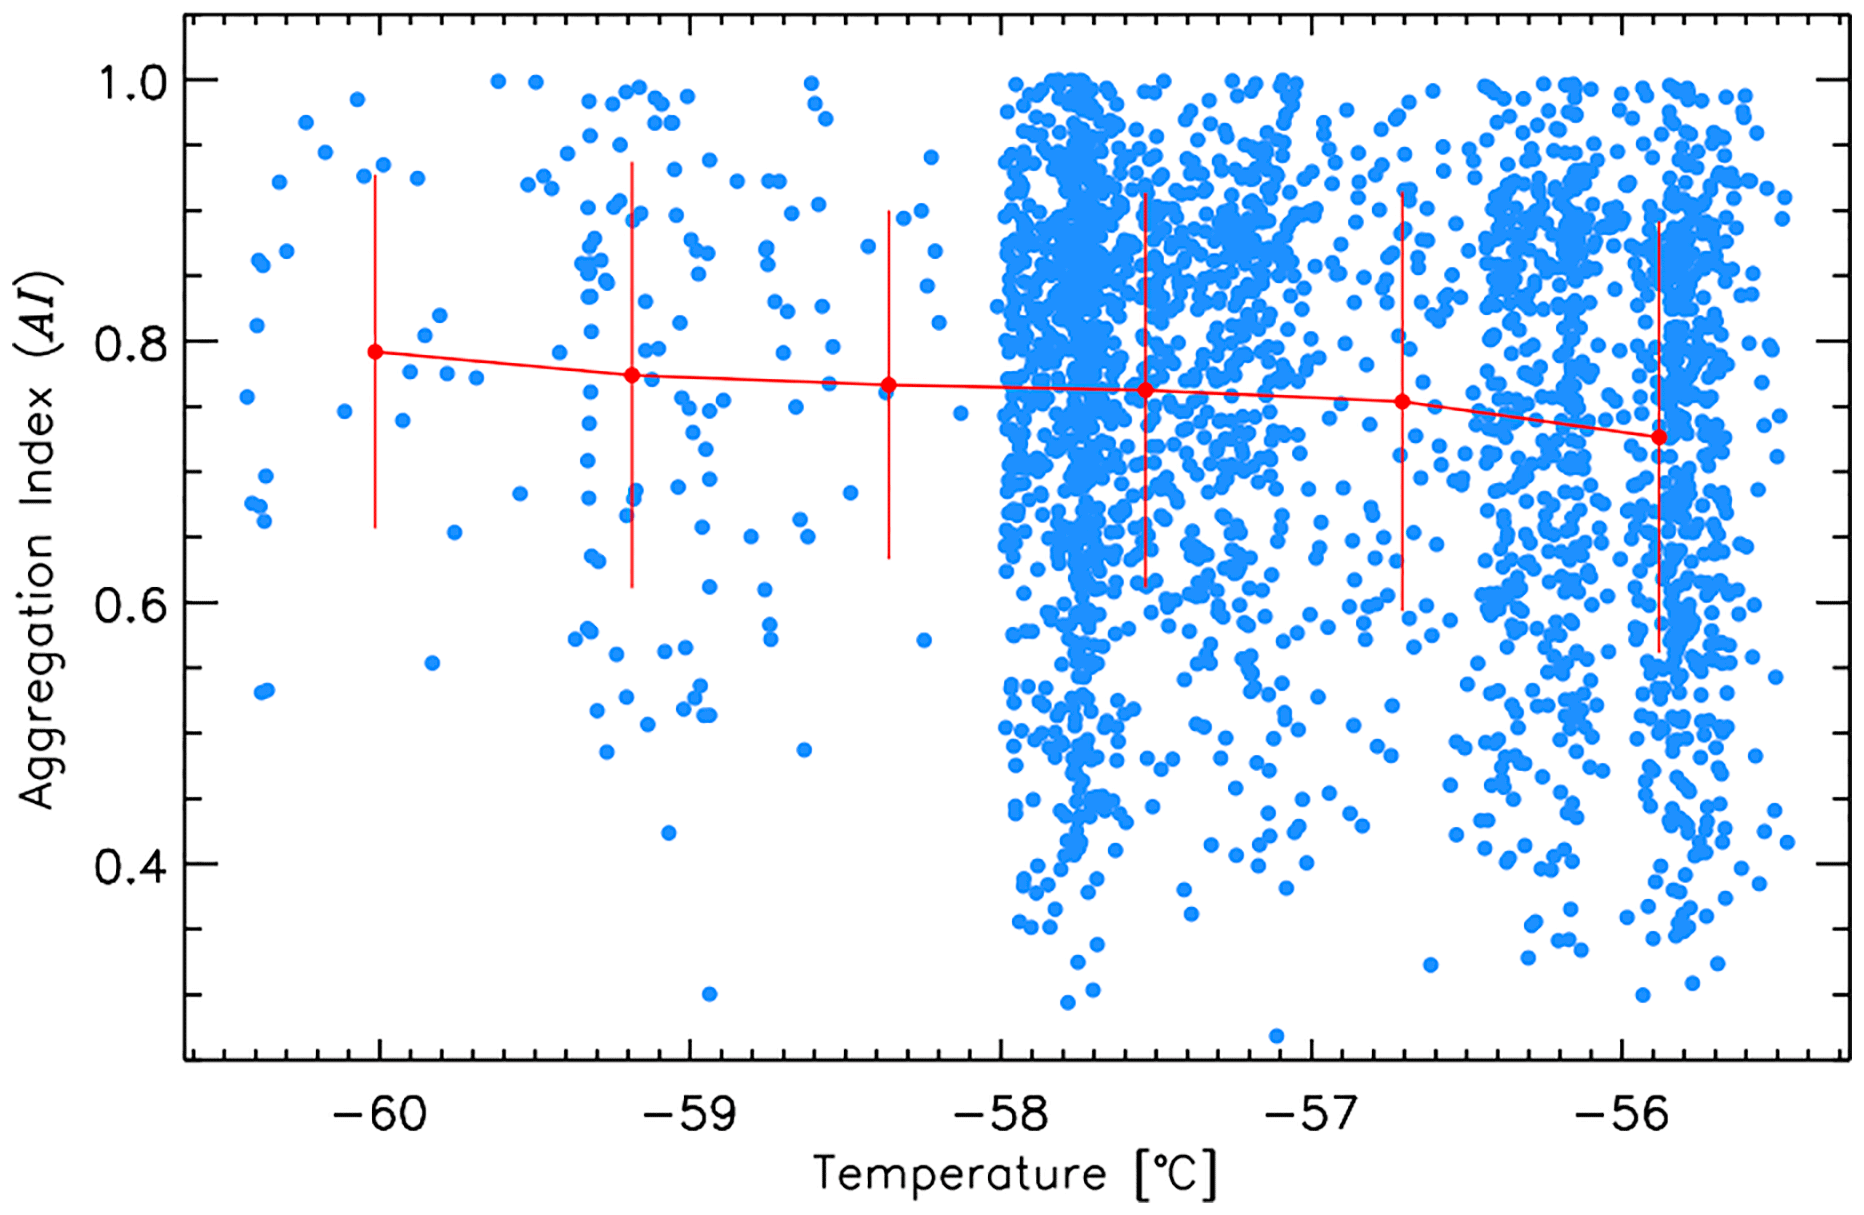
Figure 9The average aggregation index (AI, red circles in Fig. 8) as a function of temperature (blue circles). The mean and standard deviation of AI for six temperature ranges are indicated by the red circles and vertical bars, respectively.
To provide an overview of the shapes of the FDAs, the Df, kf, Rg, and rp are calculated for three 3-D realizations of a FDA that represent the maximum, minimum, and average AI. For each 3-D realization Rg∕rp is plotted against np in Fig. 10. Then, the Df and kf are determined by fitting to Eq. (2). For a given Df, kf represents the degree of compactness, with a smaller kf indicating less packing density (Lewis et al., 2009). The FDAs with the maximum, minimum, and average Rg∕rp have a Df (kf) of 1.2083 (2.0998), 1.4329 (2.3864), and 1.4124 (2.0412), respectively. A smaller Df indicates a more linear shape with 1.0 indicating a perfectly linear shape; the compactness also increases with Df. Thus, FDAs with the maximum Rg∕rp have more linear (chain-like) shapes, while FDAs with the minimum Rg∕rp have more compact shapes.

Figure 10Relationships between the ratio of the radius of gyration (Rg) to the average diameter of element frozen droplets (rp) and the number of element frozen droplets (np). Maximum (blue), minimum (green), and average (red) Rg∕rp are shown using circles, and corresponding best-fit lines are plotted using solid lines. The calculated fractal dimension (Df) and the fractal prefactor (kf) of FDAs with maximum, minimum, and average Rg∕rp are embedded. The Df and kf of ambient (black) and denuded (yellow) black carbon aggregates determined in China et al. (2013) are indicated along with those commonly determined (purple) in several studies.
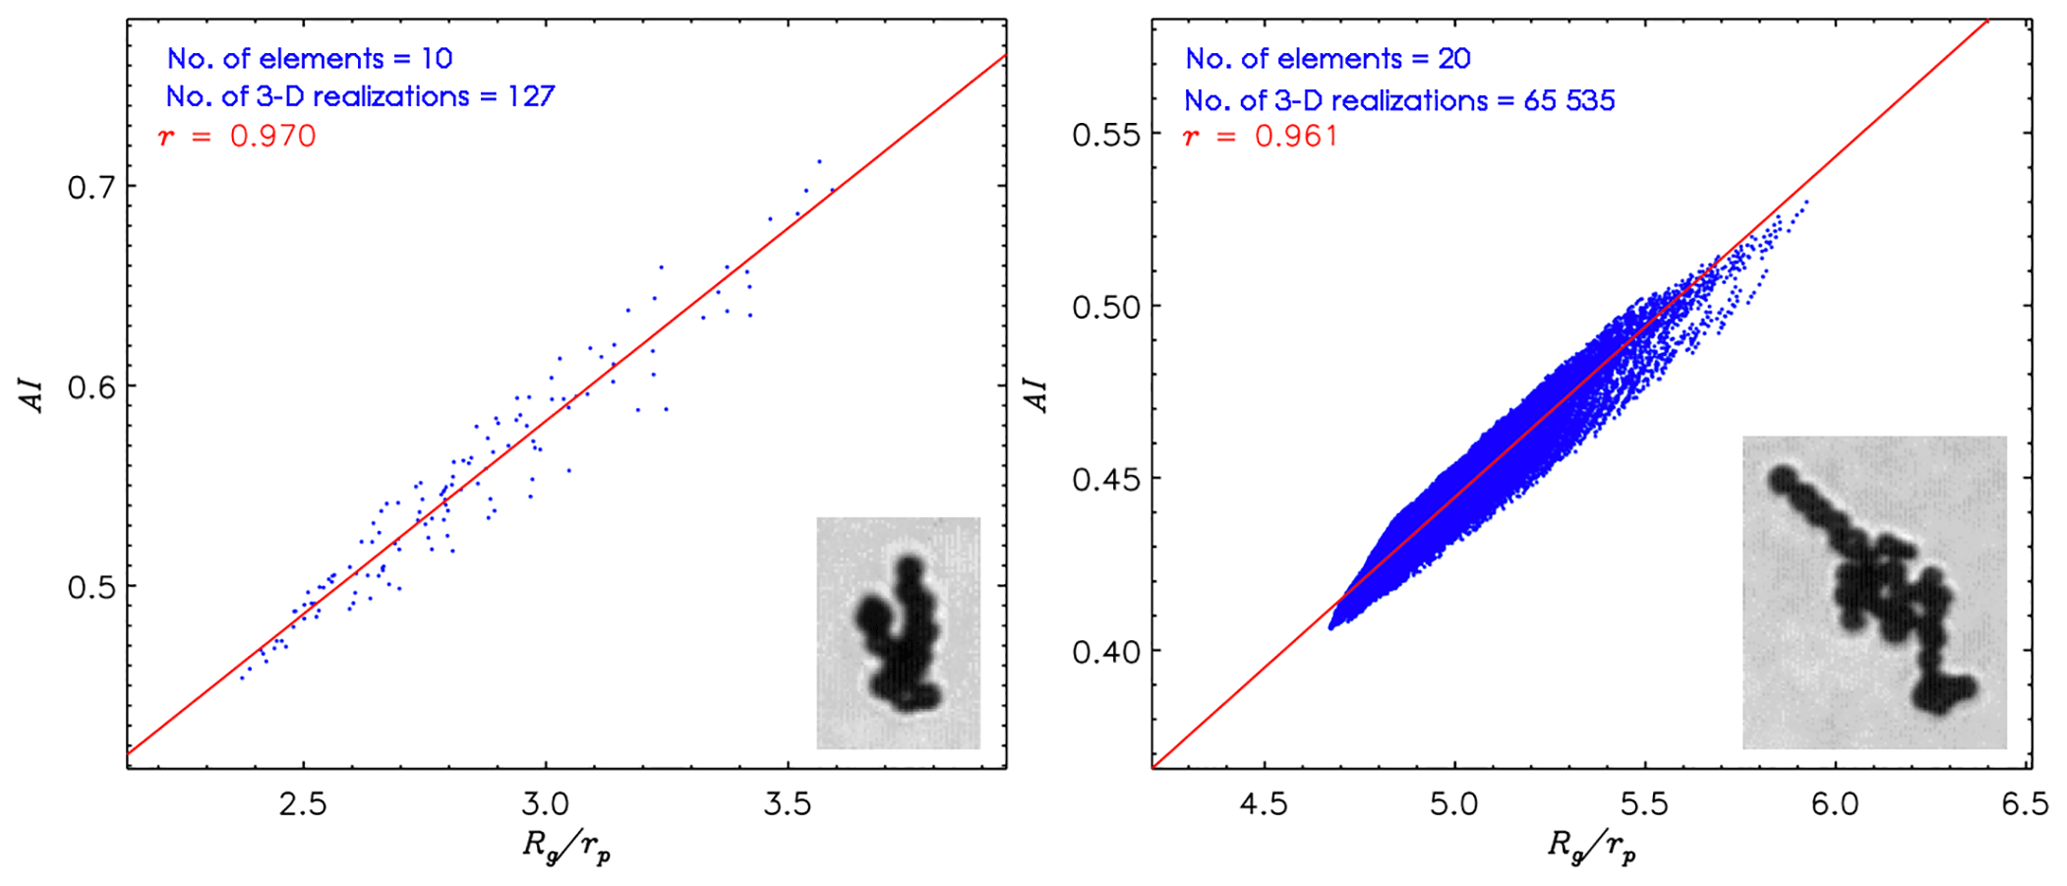
Figure 11Relationship between aggregation index (AI) and the ratio of radius of gyration to the average radius of elements (Rg∕rp) of FDAs. The number of element frozen droplets (no. elements) and number of all possible 3-D realizations (no. 3-D realizations) are indicated. The best fit and correlation coefficient (r) for the relationship between the AI and Rg∕rp are shown in red. Corresponding CPI images of FDAs are also embedded in each panel.
The Df=1.8 and kf=1.35 for BC aggregates determined in previous studies (Meakin, 1983; Kolb et al., 1983; Sorensen and Robert, 1997; Lattuada et al., 2003; Pierce et al., 2006; Heinson et al., 2012; Heinson and Chakrabarty, 2016) are shown in the purple dashed line in Fig. 10 for comparison. The Df=1.85 and kf=1.46 determined for ambient BC aggregates (black dashed line) and Df=1.53 and kf=2.40 for denuded BC aggregates (yellow dashed line) sampled from the Las Conchas fire (New Mexico, 2011) (China et al., 2013) are also shown in Fig. 10. The calculated fractal dimensions (1.20–1.43) of FDAs are smaller than those of BC aggregates (1.53–1.85), which indicates that FDAs have more linear branched shapes compared with the compact shapes of BC aggregates. Previous studies have shown that the Df of fresh BC aggregates is between 1.6 and 1.8 (e.g., Chakrabarty et al., 2006; Köylü et al., 1995; Sorensen, 2001; Pierce et al., 2006; Heinson et al., 2012) and becomes larger than 1.8 in aged BC aggregates (Lewis et al., 2009). It was also shown that the scattering properties of BC aggregates depended heavily on their Df (e.g., Sorensen, 2001; Liu et al., 2008). Thus, it is required to characterize the 3-D shapes of FDAs for the accurate calculation of radiative properties.
There is a fundamental difference in the nature of the variables AI and Df that describe the 3-D shapes of aggregates. The former is a 3-D shape indicator of individual aggregates, whereas the latter is an indicator for a group of aggregates. Each parameter has advantages and disadvantages. For example, AI is useful to describe the 3-D shape of individual aggregates and their scattering properties. As the Df is intended to describe a group of aggregates, a statistically significant number of samples is required to determine meaningful values and they should not be used to describe individual aggregates. Though AI and Df cannot be compared, a comparison between AI and Rg∕rp is possible. Comparisons between AI and Rg∕rp of FDAs with 10 (left) and 20 (right) element frozen droplets are shown in Fig. 11. The CPI images of FDAs are embedded in each panel. For the FDA with 10 elements a total 127 3-D realizations are possible, whereas a total 65 535 3-D realizations are possible for the FDA with 20 elements (Fig. 11). The best fits illustrated in Fig. 11 show that AI and Rg∕rp of FDAs are positively correlated with high correlation coefficients. For all FDAs with np >2, an average r of 0.942±0.094 is revealed. It indicates that the AI and Rg∕rp of aggregates are highly correlated and both parameters can be used to describe individual and/or a group of aggregates for the calculations of microphysical and radiative properties.
During the 2012 Deep Convective Clouds and Chemistry (DC3) experiment the National Science Foundation/National Center for Atmospheric Research Gulfstream V (GV) aircraft sampled the upper anvils of two storms that developed in eastern Colorado on 6 June 2012. A cloud particle imager (CPI) mounted on the GV aircraft recorded images of ice crystals at altitudes of 12.0 to 12.4 km and temperatures (T) of −61 to −55 ∘C. The GV flew two constant altitude runs during this period that were segregated into three periods according to the anvil and the temperature level sampled. A total of 22 393 CPI crystal images were analyzed, all with a maximum dimension µm and with an average Dmax of 80.7±45.4 µm. Dominant crystal habits observed during the 6 June 2012 flight were single frozen droplets and frozen droplet aggregates (FDAs, see Fig. 1). A new algorithm that uses the circle Hough transform technique was developed to automatically identify the number, size, and relative position of element frozen droplets within FDAs and was applied to 4667 FDAs. Using this information, the 3-D shapes of FDAs were reconstructed for given 2-D silhouettes (i.e., CPI images) and two different parameters describing the 3-D shapes of aggregate particles, the aggregation index (AI) and fractal dimension (Df), were determined. The characteristics of the shapes of FDAs were compared against those of black carbon (BC) aggregates. The anvil cloud selected for this study was an early-stage anvil associated with a strong continental storm and appeared to provide conditions most favorable for the formation of frozen drops and FDAs, as other ice particle types were mostly absent in the location selected for study. Other anvils from DC3 exhibited FDA's as common ice particle types, but to a lesser extent than the cloud regions sampled here (Stith et al., 2014).
The most important findings from this study are summarized as follows:
-
For all time periods, single frozen droplets represented the dominant habit by number, whereas FDAs were dominant by projected area. The fraction (by number) of single frozen droplets was 73.0 % (84.1 %; 70.6 %; 71.2 %) for all time periods (period 1; period 2; period 3), whereas the area fraction of FDAs was 46.3 % (27.8 %; 49.6 %; 47.5 %).
-
The fraction of well-defined pristine ice crystals (i.e., plates and columns) was less than 0.04 % by number and 0.12 % by area for all time periods, whereas unclassified crystals represented 6.1 % (3.9 %; 5.3 %; 7.5 %) by number for all periods (period 1; period 2; period 3) and 13.5 % (6.5 %; 10.9 %; 16.9 %) by area.
-
The high concentrations of small crystals (i.e., single frozen droplets) with relatively simple habit distributions shown in this study indicates that the anvil clouds were sampled in an early stage of development as also verified using radar data.
-
The relative frequency of occurrence of single frozen droplets and FDAs was dependent on temperature and position within the anvil, consistent with the conceptual model proposed by Stith et al. (2014, 2016). The fraction of single frozen droplets, in general, decreased as the GV penetrated into the center of the anvil cloud, and then increased as it approached the cloud edge for all three periods.
-
The average number of element frozen droplets within FDAs is 4.70±5.0. The FDAs with two elements were dominant with a frequency of occurrence of 42.0 %. This occurrence frequency gradually decreased with the number of element frozen droplets.
-
The average diameter of the element frozen droplets (31.79±7.12 µm) was comparable with that of single frozen droplets (34.03±6.22 µm). The quasi-spherical shapes, non-pristine shapes, and similarity of single and element droplet sizes indicate that diffusional growth was likely not effective and that the large ice crystals (i.e., FDAs) mainly grew through aggregation.
-
The AI of FDAs decreases with an increase in the number of element frozen droplets, which indicates that larger FDAs with more element frozen droplets have more compact shapes. The AI of FDAs decreases with increasing temperature, which agrees with the frequent occurrence of FDAs in the lower regions (i.e., higher temperatures) of the upper anvil (Stith et al., 2014).
-
The calculated fractal dimensions of FDAs (1.20–1.43) in this study are smaller than those of BC aggregates (1.53–1.85), which indicates that FDAs have more linear branched shapes compared against the compact shapes of BC aggregates.
-
A strong positive relationship () between AI and the ratio of radius of gyration (Rg) to the average radius of element frozen droplets (rp) of FDAs is shown. Both parameters can be used to describe 3-D shapes of aggregates and to link the scattering properties, especially AI and Df for an individual and a group of aggregates, respectively.
The results of this study have important implications for the improvement of the calculations of the microphysical (e.g., fall velocity) and radiative (e.g., asymmetry parameter) properties of ice crystals in upper anvil clouds, especially continental convective clouds. To implement the results of this study for numerical models and satellite-retrieval algorithms, a role of electric fields within convective clouds should be identified and quantified systemically. A recent laboratory experiment (Pedernera and Ávila, 2018) showed that the collision and adhesion process was highly related to electrical forces that stimulated the aggregation process of frozen droplet aggregates. A subsequent study will calculate the single-scattering properties and fall velocities of FDAs using the morphological features and models of FDAs proposed here, which will have high impacts on clouds formed over the US Great Plains and east Andes where strongest convection and electric field exist.
The CPI imagery is available from UCAR/NCAR (2013) and low-rate GV data are available from UCAR/NCAR (2017).
JU, GMM, and JLS conceived the study, and JU wrote the paper with help from GMM and JLS. JLS collected the CPI, CDP, and 2DC data from aircraft. JU, YS, YGL, and YIY carried out the CPI image analysis. JU, CHJ, and JYL performed the fractal dimension analysis. JU, SSL, SSY, BGK, JWC, and ARK performed the cloud data analysis. All authors were involved in the scientific interpretation and discussion and commented on the paper.
The authors declare that they have no conflict of interest.
This work was supported by funding from the National Science Foundation under
grant no. AGS 12-13311 and from the Advanced Study Program (ASP) at the
National Center for Atmospheric Research. The National Center for Atmospheric
Research is sponsored by the National Science Foundation. Part of this work
was completed while Greg M. McFarquhar was on sabbatical at NCAR. This
research was supported by the National Strategic Project – Fine particle of
the National Research Foundation of Korea (NRF) funded by the Ministry of
Science and ICT (MSIT), the Ministry of Environment (ME), and the Ministry of
Health and Welfare (MOHW) (project no. NRF-2017M3D8A1092022).
This study was also funded by the Korea Meteorological Administration
Research and Development Program “Research and Development for KMA Weather,
Climate, and Earth system Services Development of Application Technology on
Atmospheric Research Aircraft” under (grant no. KMA2018-00222). We would
like to acknowledge operational, technical, and scientific support provided
by NCAR's Earth Observing Laboratory, sponsored by the National Science
Foundation.
Edited by: Ottmar
Möhler
Reviewed by: two anonymous referees
Albanesi, M. G. and Ferretti, M.: A space saving approach to the Hough transform, 10th Int. Conf. on Pattern Recognition, Atlantic City, NJ, USA, https://doi.org/10.1109/ICPR.1990.119403, 1990.
Atherton, T. J. and Kerbyson, D. J.: Size invariant circle detection, Image Vision Comput, 17, 795–803, 1999.
Bailey, M. P. and Hallett, J.: Growth rates and habits of ice crystals between −20 ∘C and −70 ∘C, J. Atmos. Sci., 61, 514–544, 2004.
Bailey, M. P. and Hallett, J.: A comprehensive habit diagram for atmospheric ice crystals: Confirmation from the laboratory, AIRS II, and other field studies, J. Atmos. Sci., 66, 2888–2899, 2009.
Baran, A. J., Gayet, J.-F., and Shcherbakov, V.: On the interpretation of an unusual in-situ measured ice crystal scattering phase function, Atmos. Chem. Phys., 12, 9355–9364, https://doi.org/10.5194/acp-12-9355-2012, 2012.
Barth, M. C., Cantrell, C. A., Brune, W. H., Rutledge, S. A., Crawford, J. H., Huntrieser, H., Carey, L. D., MacGorman, D., Weisman, M., Pickering, K. E., Bruning, E., Anderson, B., Apel, E., Biggerstaff, M., Campos, T., Campuzano-Jost, P., Cohen, R., Crounse, J., Day, D. A., Diskin, G., Flocke, F., Fried, A., Garland, C., Heikes, B., Honomichi, S., Hornbrook, R., Huey, L. G., Jimenez, J., Lang, T., Lichtenstern, M., Mikoviny, T., Nault, B., O'Sullivan, D., Pan, L., Peischl, J., Pollack, I., Richter, D., Riemer, D., Ryerson, T., Schlager, H., St. Clair, J., Walega, J., Weibring, P., Weinheimer, A., Wennberg, P., Wisthaler, A., Wooldridge, P., and Zeigler, C.: The Deep Convective clouds and Chemistry (DC3) Field Campaign, B. Am. Meteorol. Soc., 96, 1281–1309, https://doi.org/10.1175/BAMS-D-13-00290.1, 2015.
Bescond, A., Yon, J., Ouf, F. X., Ferry, D., Delhaye, D., Gaffié, D., Coppalle, A., and Rozé, C.: Automated determination of aggregate primary particle size distribution by TEM image analysis: Application to soot, Aerosol Sci. Tech., 48, 831–841, 2014.
Bony, S., Stevens, B., Frierson, D. M. W., Jakob, C., Kageyama, M., Pincus, R., Shepherd, T. G., Sherwood, S. C., Siebesma, A. P., Sobel, A. H., Watanabe, M., and Webb, M. J.: Clouds, circulation and climate sensitivity, Nat. Geosci., 8, 261–268, https://doi.org/10.1038/ngeo2398, 2015.
Bony, S., Stevens, B., Coppin, D., Becker, T., Reed, K. A., Voigt, A., and Medeiros, B.: Thermodynamic control of anvil cloud amount, P. Natl. Acad. Sci. USA, 113, 8927–8932, 2016.
Chakrabarty, R. K., Moosmüller, H., Garro, M. A., Arnott, W. P., Walker, J., Susott, R. A., Babbitt, R. E., Wold, C. E., Lincoln, E. N., and Hao, W. M.: Emissions from the laboratory combustion of wildland fuels: Particle morphology and size, J. Geophys. Res., 111, D07204, https://doi.org/10.1029/2005JD006659, 2006.
China, S., Mazzoleni, C., Gorkowski, K., Aiken, A. C., and Dubey, M. K.: Morphology and mixing state of individual freshly emitted wildfire carbonaceous particles, Nat. Commun, 4, 2122, https://doi.org/10.1038/ncomms3122, 2013.
Connolly, P. J., Saunders, C. P. R., Gallagher, M. W., Bower, K. N., Flynn, M. J., Choularton, T. W., Whiteway, J., and Lawson, R. P.: Aircraft observations of the influence of electric fields on the aggregation of ice crystals, Q. J. Roy. Meteor. Soc., 131, 1695–1712, https://doi.org/10.1256/qj.03.217, 2005.
Conolly, P. J., Flynn, M. J., Ulanowski, Z., Choularton, T. W., Gallagher, M. W., and Bower, K. N.: Calibration of cloud particle imager probes using calibration beads and ice crystal analogs: The depth of field, J. Atmos. Ocean. Tech., 24, 1860–1879, 2007.
de Reus, M., Borrmann, S., Bansemer, A., Heymsfield, A. J., Weigel, R., Schiller, C., Mitev, V., Frey, W., Kunkel, D., Kürten, A., Curtius, J., Sitnikov, N. M., Ulanovsky, A., and Ravegnani, F.: Evidence for ice particles in the tropical stratosphere from in-situ measurements, Atmos. Chem. Phys., 9, 6775–6792, https://doi.org/10.5194/acp-9-6775-2009, 2009.
Duda, R. O. and Hart, P. E.: Use of the Hough transformation to detect lines and curves in pictures, Communication of the ACM, 15, 11–15, 1972.
Feng, Z., Dong, X., Xi, B., Schumacher, C., Minnis, P., and Khaiyer, M.: Top-of-atmosphere radiation budget of convective core/stratiform rain and anvil clouds from deep convective systems, J. Geophys. Res., 116, D23202, https://doi.org/10.1029/2011JD016451, 2011.
Feng, Z., Dong, X., Xi, B., McFarlane, S. A., Kennedy, A., Lin, B., and Minnis, P.: Life cycle of midlatitude deep convective systems in a Lagrangian framework, J. Geophys. Res., 117, D23201, https://doi.org/10.1029/2012JD018362, 2012.
Field, P. R., Wood, R., Brown, P. R. A., Kay, P. H., Hirst, E., Greenaway, R., and Smith, J. A.: Ice Particle Interarrival Times Measured with a Fast FSSP, J. Atmos. Ocean. Tech., 20, 249–261, 2003.
Field, P. R., Heymsfield, A. J., and Bansemer, A.: Shattering and particle interarrival times measured by optical array probes in ice clouds, J. Atmos. Ocean. Tech., 23, 1357–1371, 2006.
Frey, W., Borrmann, S., Kunkel, D., Weigel, R., de Reus, M., Schlager, H., Roiger, A., Voigt, C., Hoor, P., Curtius, J., Krämer, M., Schiller, C., Volk, C. M., Homan, C. D., Fierli, F., Di Donfrancesco, G., Ulanovsky, A., Ravegnani, F., Sitnikov, N. M., Viciani, S., D'Amato, F., Shur, G. N., Belyaev, G. V., Law, K. S., and Cairo, F.: In situ measurements of tropical cloud properties in the West African Monsoon: upper tropospheric ice clouds, Mesoscale Convective System outflow, and subvisual cirrus, Atmos. Chem. Phys., 11, 5569–5590, https://doi.org/10.5194/acp-11-5569-2011, 2011.
Frey, W., Schofield, R., Hoor, P., Kunkel, D., Ravegnani, F., Ulanovsky, A., Viciani, S., D'Amato, F., and Lane, T. P.: The impact of overshooting deep convection on local transport and mixing in the tropical upper troposphere/lower stratosphere (UTLS), Atmos. Chem. Phys., 15, 6467–6486, https://doi.org/10.5194/acp-15-6467-2015, 2015.
Fu, Q., Krueger, S., and Liou, K.: Interactions of radiation and convection in simulated tropical cloud clusters, J. Atmos. Sci., 52, 1310–1328, 1995.
Gallagher, M. W., Connolly, P. J., Whiteway, J., Figueras-Nieto, D., Flynn, M., Choularton, T. W., Bower, K. N., Cook, C., Busen, R., and Hacker, J.: An overview of the microphysical structure of cirrus clouds observed during EMERALD-1, Q. J. Roy. Meteor. Soc., 131, 1143–1169, 2005.
Gallagher, M. W., Connolly, P. J., Crawford, I., Heymsfield, A., Bower, K. N., Choularton, T. W., Allen, G., Flynn, M. J., Vaughan, G., and Hacker, J.: Observations and modelling of microphysical variability, aggregation and sedimentation in tropical anvil cirrus outflow regions, Atmos. Chem. Phys., 12, 6609–6628, https://doi.org/10.5194/acp-12-6609-2012, 2012.
Gayet, J.-F., Mioche, G., Bugliaro, L., Protat, A., Minikin, A., Wirth, M., Dörnbrack, A., Shcherbakov, V., Mayer, B., Garnier, A., and Gourbeyre, C.: On the observation of unusual high concentration of small chain-like aggregate ice crystals and large ice water contents near the top of a deep convective cloud during the CIRCLE-2 experiment, Atmos. Chem. Phys., 12, 727–744, https://doi.org/10.5194/acp-12-727-2012, 2012.
Hartmann, D. L.: Tropical anvil clouds and climate sensitivity, P. Natl. Acad. Sci. USA, 113, 8897–8899, 2016.
Hartmann, D. L. and Berry, S. E.: The balanced radiative effect of tropical anvil clouds, J. Geophys. Res.-Atmos., 122, 5003–5020, https://doi.org/10.1002/2017JD026460, 2017.
Heinson, W. R. and Chakrabarty, R. K.: Fractal morphology of black carbon aerosol enhances absorption in the thermal infrared wavelengths, Opt. Lett., 41, 808–811, 2016.
Heinson, W. R., Sorensen, C. M., and Chakrabarti, A.: A three parameter description of the structure of diffusion limited cluster fractal aggregates, J. Colloid Interf. Sci., 375, 65–69, https://doi.org/10.1016/j.jcis.2012.01.062, 2012.
Heymsfield, A. J.: Ice particle evolution in the anvil of a severe thunderstorm during CCOPE, J. Atmos. Sci., 43, 2463–2478, 1986.
Heymsfield, A. J. and Sabin, R. M.: Cirrus crystal nucleation by homogeneous freezing of solution droplets, J. Atmos. Sci., 46, 2252–2264, 1989.
Heymsfield, A. J., Miloshevich, L., Schmitt, C., Bansemer, A., Twohy, C., Poellot, M., Fridlind, A., and Gerber, H.: Homogeneous ice nucleation in subtropical and tropical convection and its influence on cirrus anvil microphysics, J. Atmos. Sci., 62, 41–64, https://doi.org/10.1175/JAS-3360.1, 2005.
Heymsfield, A. J., Bansemer, A., Heymsfield, G., and Fierro, A. O.: Microphysics of maritime tropical convective updrafts at temperatures from −20 to −60 ∘C, J. Atmos. Sci., 66, 3530–3562, 2009.
Homeyer, C. R., Pan, L. L., and Barth, M. C.: Transport from convective overshooting of the extratropical tropopause and the role of large-scale lower stratosphere stability, J. Geophys. Res.-Atmos., 119, 2220–2240, https://doi.org/10.1002/2013JD020931, 2014.
Hough, P. V. C.: Method and means for recognizing complex patterns, 18 December, U.S. Patent 3.069.654, 1962.
Jackson, R. C. and McFarquhar, G. M.: An Assessment of the Impact of Antishattering Tips and Artifact Removal Techniques on Bulk Cloud Ice Microphysical and Optical Properties Measured by the 2D Cloud Probe, J. Atmos. Ocean. Tech., 30, 2131–2144, 2014.
Jackson, R. C., McFarquhar, G. M., Stith, J., Beals, M., Shaw, R. A., Jensen, J., Fugal, J., and Korolev, A.: An Assessment of the Impact of Antishattering Tips and Artifact Removal Techniques on Cloud Ice Size Distributions Measured by the 2D Cloud Probe, J. Atmos. Ocean. Tech., 31, 2576–2590, 2014.
Järvinen, E., Schnaiter, M., Mioche, G., Jourdan, O., Shcherbakov, V. N., Costa, A., Afchine, A., Krämer, M., Heidelberg, F., Jurkat, T., Voigt, C., Schlager, H., Nichman, L., Gallagher, M., Hirst, E., Schmitt, C., Bansemer, A., Heymsfield, A., Lawson, P., Tricoli, U., Pfeilsticker, K., Vochezer, P., Möhler, O., and Leisner, T.: Quasi-Spherical Ice in Convective Clouds, J. Atmos. Sci., 73, 3885–3910, https://doi.org/10.1175/JAS-D-15-0365.1, 2016.
Jensen, E. J., Toon, O. B., Selkirk, H. B., Spinhirne, J. D., and Schoeberl, M. R.: On the formation and persistence of subvisible cirrus clouds near the tropical tropopause, J. Geophys. Res., 101, 21361–21375, https://doi.org/10.1029/95JD03575, 1996.
Jensen, E. J., Lawson, P., Baker, B., Pilson, B., Mo, Q., Heymsfield, A. J., Bansemer, A., Bui, T. P., McGill, M., Hlavka, D., Heymsfield, G., Platnick, S., Arnold, G. T., and Tanelli, S.: On the importance of small ice crystals in tropical anvil cirrus, Atmos. Chem. Phys., 9, 5519–5537, https://doi.org/10.5194/acp-9-5519-2009, 2009.
Jensen, M. P., Petersen, W. A., Bansemer, A., Bharadwaj, N., Carey, L. D., Cecil, D. J., Collis, S. M., Del Genio, A. D., Dolan, B., Gerlach, J., Giangrande, S. E., Heymsfield, A., Heymsfield, G., Kollias, P., Lang, T. J., Nesbitt, S. W., Neumann, A., Poellot, M., Rutledge, S. A., Schwaller, M., Tokay, A., Williams, C. R., Wolff, D. B., Xie, S., and Zipser, E. J.: The Midlatitude Continental Convective Clouds Experiment (MC3E), B. Am. Meteorol. Soc., 97, 1667–1686, https://doi.org/10.1175/BAMS-D-14-00228.1, 2016.
Kolb, M., Botet, R., and Jullien, R.: Scaling of kinetically growing clusters, Phys. Rev. Lett., 51, 1123–1126, 1983.
Korolev, A. and Field, P. R.: Assessment of the performance of the inter-arrival time algorithm to identify ice shattering artifacts in cloud particle probe measurements, Atmos. Meas. Tech., 8, 761–777, https://doi.org/10.5194/amt-8-761-2015, 2015.
Korolev, A. V., Emery, E. F., Strapp, J. W., Cober, S. G., Isaac, G. A., Wasey, M., and Marcotte, D.: Small Ice Particles in Tropospheric Clouds: Fact or Artifact?, B. Am. Meteorol. Soc., 92, 967–973, 2011.
Köylü, Ü. Ö., Faeth, G. M., Farias, T. L., and Carvalho, M. G.: Fractal and projected structure properties of soot aggregates, Combust. Flame, 100, 621–623, 1995.
Lattuada, M., Wu, H., and Morbidelli, M.: Hydrodynamic radius of fractal clusters, J. Colloid. Interf. Sci., 268, 96–105, 2003.
Lawson, R. P.: Effects of ice particles shattering on the 2D-S probe, Atmos. Meas. Tech., 4, 1361–1381, https://doi.org/10.5194/amt-4-1361-2011, 2011.
Lawson, R. P., Baker, B. A., and Pilson, B. L.: In-Situ measurements of microphysical properties of mid-latitude and anvil cirrus, Proceedings, 30th International Symposium on Remote Sensing of Environment, November, Honolulu, Hawaii, 707–710, 2003.
Lawson, R. P., Jensen, E., Mitchell, D. L., Baker, B., Mo, Q., and Pilson, B.: Microphysical and radiative properties of tropical clouds investigated in TC4 and NAMMA, J. Geophys. Res., 115, D00J08, https://doi.org/10.1029/2009JD013017, 2010.
Lewis, K. A., Arnott, W. P., Moosmüller, H., Chakrabarty, R. K., Carrico, C. M., Kreidenweis, S. M., Day, D. E., Malm, W. C., Laskin, A., Jimenez, J. L., Ulbrich, I. M., Huffman, J. A., Onasch, T. B., Trimborn, A., Liu, L., and Mishchenko, M. I.: Reduction in biomass burning aerosol light absorption upon humidification: roles of inorganically-induced hygroscopicity, particle collapse, and photoacoustic heat and mass transfer, Atmos. Chem. Phys., 9, 8949–8966, https://doi.org/10.5194/acp-9-8949-2009, 2009.
Li, H., Lavin, M. A., and Le Master, R. J.: Fast Hough transform: A hierarchical approach, Lect. Notes Comput. Sc., 36, 139–161, 1986.
Lilly, D. K.: Cirrus outflow dynamics, J. Atmos. Sci., 45, 1594–1605, 1988.
Liu, L., Mishchenko, M. I., and Arnott, W. P.: A study of radiative properties of fractal soot aggregates using the superposition T-matrix method, J. Quant. Spectrosc. Ra., 109, 2656–2663, 2008.
Mandelbrot, B.: The Fractal Geometry of Nature, W. H. Freeman and Company, New York, 468 pp., 1982.
May, P. T., Mather, J. H., Vaughan, G., Jakob, C., McFarquhar, G. M., Bower, K. N., and Mace, G. G.: The tropical warm pool international cloud experiment, B. Am. Meteorol. Soc., 89, 629–645, 2008.
McFarquhar, G. M. and Heymsfield, A. J.: Microphysical characteristics of three anvils sampled during the Central Equatorial Pacific Experiment, J. Atmos. Sci., 53, 2401–2423, 1996.
McFarquhar, G. M., Heymsfield, A. J., Macke, A., Iaquinta, J., and Aulenbach, S. M.: Use of observed ice crystal sizes and shapes to calculate mean-scattering properties and multispectral radiances: CEPEX April 4, 1993, case study, J. Geophys. Res., 104, 31763–31779, 1999.
McFarquhar, G. M., Yang, P., Macke, A., and Baran, A. J.: A new parameterization of single scattering solar radiative properties for tropical anvils using observed ice crystal size and shape distributions, J. Atmos. Sci., 59, 2458–2478, 2002.
McFarquhar, G. M., Um, J., Freer, M., Baumgardner, D., Kok, G. L., and Mace, G.: Importance of small ice crystals to cirrus properties: Observations from the Tropical Warm Pool International Cloud Experiment (TWP-ICE), Geophys. Res. Lett., 34, L13803, https://doi.org/10.1029/2007GL029865, 2007.
McFarquhar, G. M., Um, J., and Jackson, R.: Small cloud particle shapes in mixed-phase clouds, J. Appl. Meteorol. Clim., 52, 1277–1293, 2013.
McFarquhar, G. M., Baumgardner, D., Bansemer, A., Abel, S. J., Crosier, J., French, J., Rosenberg, P., Korolev, A., Schwarzoenboeck, A., Leroy, D., Um, J., Wu, W., Heymsfield, A. J., Twohy, C., Detwiler, A., Field, P., Neumann, A., Cotton, R., Axisa, D., and Dong, J.: Processing of ice cloud in-situ data collected by bulk water, scattering, and imaging probes: Fundamentals, uncertainties, and efforts towards consistency, Meteor. Mon., 58, 11.1–11.33, https://doi.org/10.1175/AMSMONOGRAPHS-D-16-0007.1, 2017.
Meakin, P.: Formation of fractal clusters and networks by irreversible diffusion-limited aggregation, Phys. Rev. Lett., 51, 1119–1122, 1983.
Mirzaei, M. and Rafsanjani, H. K.: An automatic algorithm for determination of the nanoparticles from TEM images using circular Hough transform, Micron, 96, 86–95, 2017.
Nousiainen, T. and McFarquhar, G. M.: Light scattering by quasi–spherical ice crystals, J. Atmos. Sci., 61, 2229–2248, 2004.
Nousiainen, T., Lindqvist, H., McFarquhar, G. M., and Um, J.: Small irregular ice crystals in tropical cirrus, J. Atmos. Sci., 68, 2614–2627, https://doi.org/10.1175/2011JAS3733.1, 2011.
Pedernera, D. A. and Ávila, E. E.: Frozen-droplets aggregation at temperature below −40 ∘C, J. Geophys. Res., 123, 1244–1252, 2018.
Phillips, V. T. J., Donner, L. J., and Garner, S. T.: Nucleation processes in deep convection simulated by a cloud-system-resolving model with double-moment bulk microphysics, J. Atmos. Sci., 64, 738–761, 2007.
Pierce, F., Sorensen, C. M., and Chakrabarti, A.: Computer simulation of diffusion-limited cluster aggregation with an Epstein drag force, Phys. Rev. E, 74, 021411, https://doi.org/10.1103/PhysRevE.74.021411, 2006.
Proud, S. R.: Analysis of overshooting top detections by Meteosat Second Generation: A 5-year dataset, Q. J. Roy. Meteor. Soc., 141, 909–915, https://doi.org/10.1002/qj.2410, 2015.
Rosenfeld, D. and Woodley, W.: Deep convective clouds with sustained superooled liquid water down to −37.5 ∘C, Nature, 405, 440–442, https://doi.org/10.1038/35013030, 2000.
Saunders, C. P. R. and Wahab, N. M. A.: The influence of electric fields on the aggregation of ice crystals, J. Meteorol. Soc. Jpn., 53, 121–126, 1975.
Sorensen, C. M.: Light scattering by fractal aggregates: A review, Aerosol Sci. Tech., 35, 648–687, 2001.
Sorensen, C. M. and Roberts, G. C.: The prefactor of fractal aggregates, J. Colloid Interf. Sci., 186, 447–452, 1997.
Stephens, G. L.: Cloud feedbacks in the climate system: A critical review, J. Climate, 18, 237–273, 2005.
Stephens, G. L., Tsay, S. C., Stackhouse, P. W., and Flatau, P. J.: The relevance of the microphysical and radiative properties of cirrus clouds to climate and climatic feedback, J. Atmos. Sci., 47, 1742–1753, https://doi.org/10.1175/1520-0469(1990)047<1742:trotma>2.0.co;2, 1990.
Stith, J. L., Dye, J. E., Bansemer, A., Heymsfield, A. J., Grainger, C. A., Petersen, W. A., and Cifelli, R.: Microphysical Observations of Tropical Clouds, J. Appl. Meteorol., 41, 97–117, https://doi.org/10.1175/1520-0450(2002)041<0097:MOOTC>2.0.CO;2, 2002.
Stith, J. L., Haggerty, J. A., Heymsfield, A., and Grainger, C. A.: Microphysical Characteristics of Tropical Updrafts in Clean Conditions, J. Appl. Meteorol., 43, 779–794, https://doi.org/10.1175/2104.1, 2004.
Stith, J. L., Avallone, L. M., Bansemer, A., Basarab, B., Dorsi, S. W., Fuchs, B., Lawson, R. P., Rogers, D. C., Rutledge, S., and Toohey, D. W.: Ice particles in the upper anvil regions of midlatitude continental thunderstorms: the case for frozen-drop aggregates, Atmos. Chem. Phys., 14, 1973–1985, https://doi.org/10.5194/acp-14-1973-2014, 2014.
Stith, J. L., Basarab, B., Rutledge, S. A., and Weinheimer, A.: Anvil microphysical signatures associated with lightning-produced NOx, Atmos. Chem. Phys., 16, 2243–2254, https://doi.org/10.5194/acp-16-2243-2016, 2016.
Taylor, J. W., Choularton, T. W., Blyth, A. M., Liu, Z., Bower, K. N., Crosier, J., Gallagher, M. W., Williams, P. I., Dorsey, J. R., Flynn, M. J., Bennett, L. J., Huang, Y., French, J., Korolev, A., and Brown, P. R. A.: Observations of cloud microphysics and ice formation during COPE, Atmos. Chem. Phys., 16, 799–826, https://doi.org/10.5194/acp-16-799-2016, 2016.
UCAR/NCAR (Earth Observing Laboratory): NSF/NCAR GV (HIAPER) 3V-CPI Raw CPI ROI Imagery, Version 1.0, UCAR/NCAR – Earth Observing Laboratory, https://doi.org/10.5065/D6S180T6, 2013.
UCAR/NCAR (Earth Observing Laboratory): Low Rate (LRT – 1 sps) Navigation, State Parameter, and Microphysics Flight-Level Data (NetCDF), Version 2.0, UCAR/NCAR – Earth Observing Laboratory, https://doi.org/10.5065/D6BC3WKB, 2017.
Um, J. and McFarquhar, G. M.: Single-scattering properties of aggregates of bullet rosettes in cirrus, J. Appl. Meteorol. Clim., 46, 757–775, https://doi.org/10.1175/JAM2501.1, 2007.
Um, J. and McFarquhar, G. M.: Single-scattering properties of aggregates plates, Q. J. Roy. Meteor. Soc., 135, 291–304, https://doi.org/10.1002/qj.378, 2009.
Um, J. and McFarquhar, G. M.: Dependence of the single-scattering properties of small ice crystals on idealized shape models, Atmos. Chem. Phys., 11, 3159–3171, https://doi.org/10.5194/acp-11-3159-2011, 2011.
Um, J. and McFarquhar, G. M.: Optimal numerical methods for determining the orientation averages of single-scattering properties of atmospheric ice crystals, J. Quant. Spectrosc. Ra., 127, 207–223, https://doi.org/10.1016/j.jqsrt.2013.05.020, 2013.
Um, J., McFarquhar, G. M., Hong, Y. P., Lee, S.-S., Jung, C. H., Lawson, R. P., and Mo, Q.: Dimensions and aspect ratios of natural ice crystals, Atmos. Chem. Phys., 15, 3933–3956, https://doi.org/10.5194/acp-15-3933-2015, 2015.
Wang, J., Dong, X., and Xi, B.: Investigation of ice cloud microphysical properties of DCSs using aircraft in situ measurements during MC3E over the ARM SGP site, J. Geophys. Res., 120, 3533–3552, https://doi.org/10.1002/2014JD022795, 2015.
Yang, P., Gao, B. C., Baum, B. A., Wiscombe, W. J., Hu, Y. X., Nasiri, S. L., Soulen, P. F., Heymsfield, A. J., McFarquhar, G. M., and Miloshevich, L. M.: Sensitivity of cirrus bidirectional reflectance to vertical inhomogeneity of ice crystal habits and size distributions for two Moderate-Resolution Imaging Spectroradiometer (MODIS) bands, J. Geophys. Res., 106, 17267–17291, 2001.
Yang, P., Baum, B. A., Heymsfield, A. J., Hu, Y. X., Huang, H.-L., Tsay, S.-C., and Ackerman, S.: Single-scattering properties of droxtals, J. Quant. Spectrosc. Ra., 79–80, 1159–1169, 2003.
Yuen, H. K., Princen, J., Illingworth, J., and Kittler, J.: Comparative study of Hough transform methods for circle finding, Image Vision Comput., 8, 71–77, 1990.