the Creative Commons Attribution 4.0 License.
the Creative Commons Attribution 4.0 License.
 | 20 Nov 2018
The size-resolved cloud condensation nuclei (CCN) activity and its prediction based on aerosol hygroscopicity and composition in the Pearl Delta River (PRD) region during wintertime 2014
Mingfu Cai
Haobo Tan
Chak K. Chan
Yiming Qin
Hanbing Xu
Misha I. Schurman
Li Liu
A hygroscopic tandem differential mobility analyzer (HTDMA), a scanning mobility cloud condensation nuclei (CCN) analyzer (SMCA), and an Aerodyne high-resolution time-of-flight aerosol mass spectrometer (HR-ToF-AMS) were used to, respectively, measure the hygroscopicity, condensation nuclei activation, and chemical composition of aerosol particles at the Panyu site in the Pearl River Delta region during wintertime 2014. The distribution of the size-resolved CCN at four supersaturations (SSs of 0.1 %, 0.2 %, 0.4 %, and 0.7 %) and the aerosol particle size distribution were obtained by the SMCA. The hygroscopicity parameter κ (κCCN, κHTDMA, and κAMS) was, respectively, calculated based upon the SMCA, HTDMA, and AMS measurements. The results showed that the κHTDMA value was slightly smaller than the κCCN one at all diameters and for particles larger than 100 nm, and the κAMS value was significantly smaller than the others (κCCN and κHTDMA), which could be attributed to the underestimated hygroscopicity of the organics (κorg). The activation ratio (AR) calculated from the growth factor – probability density function (Gf-PDF) without surface tension correction was found to be lower than that from the CCN measurements, due most likely to the uncorrected surface tension (σs∕a) that did not consider the surfactant effects of the organic compounds. We demonstrated that better agreement between the calculated and measured ARs could be obtained by adjusting σs∕a. Various schemes were proposed to predict the CCN number concentration (NCCN) based on the HTDMA and AMS measurements. In general, the predicted NCCN agreed reasonably well with the corresponding measured ones using different schemes. For the HTDMA measurements, the NCCN value predicted from the real-time AR measurements was slightly smaller (∼6.8 %) than that from the activation diameter (D50) method due to the assumed internal mixing in the D50 prediction. The NCCN values predicted from bulk chemical composition of PM1 were higher (∼11.5 %) than those from size-resolved composition measured by the AMS because a significant fraction of PM1 was composed of inorganic matter. The NCCN values calculated from AMS measurement were underpredicted at 0.1 % and 0.2 % supersaturations, which could be due to underestimation of κorg and overestimation of σs∕a. For SS values of 0.4 % and 0.7 %, slight overpredicted NCCN values were found because of the internal mixing assumption. Our results highlight the need for accurately evaluating the effects of organics on both the hygroscopic parameter κ and the surface tension σ in order to accurately predict CCN activity.
- Article
(4178 KB) -
Supplement
(240 KB) - BibTeX
- EndNote


Aerosol particles can directly impact global climate by scattering and absorbing solar radiation (Stocker, 2013), while they can influence cloud formation, lifetime, and optical properties by acting as cloud condensation nuclei (CCN), indirectly exerting climatic forcing on the Earth's atmosphere. In general, aerosol particles increase the CCN concentration and hence cause cooling effects on the global radiation balance. However, to what extent aerosol particles contribute to the radiation forcing is still highly uncertain (Stocker, 2013). It is hence important to measure chemical composition and properties of aerosol particles in order to assess their abilities of acting as CCN and contribution to cloud formation, further facilitating our understanding of the impacts of atmospheric aerosols on regional and global climate.
The extent to which aerosol particles can affect cloud formation is dependent on their fraction that can be activated to become CCN. This fraction of activation is termed as CCN activity that is determined by the chemical composition, sizes, and the water saturation ratio of the particles (Farmer et al., 2015). The size-dependent saturation ratio (S) can be calculated from the Köhler equation (Köhler, 1936):
where aw is the water activity in solution, σs∕a is surface tension of the solution/air interface, Mw is the mole weight of water, R is the universal gas constant, T is temperature in Kelvin, and D is the diameter of the droplet. The aw represents the Raoult effect, which means that the activation potential increases with the concentration of the solution. The term represents Kelvin effect, which relates the surface curvature to the saturation vapor pressure of the droplet. The activation potential increases with increase of the droplet diameter or decrease of surface tension σs∕a, and the σs∕a value is sensitive to the organic surfactant effect. The two important parameters, the water activity (αw) and surface tension (σs∕a), are dependent on the composition of the aerosol particles, assuming those particles have the same properties as their corresponding bulk solutions. The effects of organics on the CCN activity have been extensively investigated; however, many outstanding questions still remain. Sorjamaa et al. (2004) suggested that the partitioning of surfactants had to be considered when evaluating the Kelvin effect and the Raoult effect. According to their experimental results, the surfactant partitioning could alter the Raoult effect and the change is large enough to depress CCN activity. However, another experiment conducted by Engelhart et al. (2008) revealed that the organics in aged monoterpene aerosols could depress surface tension by about 0.01 N m−1 and hence increase CCN activity. Ovadnevaite et al. (2017) also presented observational and theoretical evidence that the decrease of surface tension could prevail over the Raoult effect, which led to the increase of CCN activity. Salma et al. (2006) isolated humic-like substances (HULIS) from PM2.5 fraction aerosol samples and investigated the surface tension properties of the HULIS pure solutions. The results show that thermodynamic equilibrium on surface could only be reached after several hours. Because the depression of surface tension was controlled by diffusion of surfactants from the bulk of the droplet to its surface, the extent of the actual decrease of surface tension was hence kinetically limited. A hybrid model proposed by Petters and Kreidenweis (2013) was used to predict the effects of surfactants on the CCN activity. The model predicted strong effects of the surfactants on ternary systems where common ions were present. However, due to the limited measurement techniques, the available laboratory data were still not sufficient to support this prediction and more solid data were needed to validate the surfactant effects on the CCN activity.
The CCN activity can be characterized by the hygroscopicity parameter κ that was initially proposed by Petters and Kreidenweis (2007). Aerosol hygroscopicity represents the ability of the particles to grow by absorbing water vapor from the atmosphere and the extent to which the particles are hygroscopic can be evaluated by the κ values, which can be determined from the HTDMA or cloud condensation nuclei counter (CCNc) measurements. The κ values were measured worldwide extensively either in field measurements or in laboratory experiments and depending on the organic content of the particles, a wide range of κ values was reported in the literature. Cerully et al. (2011) showed that the κ values measured in 2007 by a continuous-flow streamwise thermal gradient CCN (CFSTGC) chamber ranged mostly between 0.1 and 0.4 in a forest environment in Finland. Hong et al. (2014) obtained the average κ values of 0.15 (110 nm) and 0.28 (102 nm) measured by the HTDMA at the same site in 2010. Chang et al. (2010) used an AMS to measure aerosol chemical composition and a mole ratio of atomic oxygen to atomic carbon (O∕C) at a rural site in Canada. They reported a relationship between the κ values of organics and the O∕C ratio as . Tritscher et al. (2011) conducted smog chamber experiments for measurements of the κ values of aging secondary organic aerosols and they found that the κ was a sensitive indicator of the secondary organic aerosol (SOA) properties.
Although the κ values were reported under different environments in many locations, only a few studies were conducted to measure κ in the Pearl River Delta (PRD) region (Cheung et al., 2015; Schurman et al., 2017). Jiang et al. (2016) compared the κ values between wintertime (0.18–0.22) and summertime (0.17–0.21) in Guangzhou. Cai et al. (2017) reported the κ values of about 0.4–0.6 and 0.2–0.3 measured by the HTDMA, respectively, in Cape Hedo (Japan) and Guangzhou (China). Alternatively, the average κ values can be predicted by the Zdanovskii–Stokes–Robinson (ZSR) mixing rule (Zdanovskii, 1948; Stokes and Robinson, 1966) which is based on the chemical composition of the aerosol particles from the AMS measurements. Liu et al. (2014) reported the κ values of 0.22 to 0.32 using the ZSR mixing rule, consistent with the values (0.25 to 0.34) based on the HTDMA measurements.
Once the κ values were determined, they could then be employed to predict the CCN activity that was characterized by two important parameters: activation diameter (D50) and activation ratio (AR). Until now, the CCN activity (thus the above three parameters) can be determined using the following three methods:
-
The combination of CCNc and scanning mobility particle sizer (SMPS). The CCN number was measured by the CCNc at different supersaturation (SS, typically 0.05 %–1 %) ratios. Meanwhile, the D50 and size-resolved activation ratios could be measured by combining the CCNc with a differential mobility analyzer (DMA) and a condensation particle counter (CPC) (Moore et al., 2011; Deng et al., 2011), referred to as scanning mobility CCN analysis (SMCA) based on measurements from a SMPS (DMA plus CPC) and a CCNc. This method can measure the size-resolved CCN distributions at a high time resolution (Moore et al., 2010) and has been applied in lab experiments (Asa-Awuku et al., 2009) and field campaigns (Moore et al., 2008) to measure CCN activity.
-
The ZSR method based on chemical composition measurements. The CCN concentrations were inverted from the chemical composition and the size distribution of the aerosol particles measured, respectively, from the aerosol mass spectrometer (AMS) and SMPS (Moore et al., 2012; Meng et al., 2014). The κ was then calculated from the ZSR mixing rule. In general, the particles were assumed to be internally mixed, which might lead to a large uncertainty (up to 80 %) in predicting NCCN in some cases (Wang et al., 2010).
-
The HTDMA method. The size-resolved CCN distribution and activation ratios could be determined from hygroscopicity and size distribution measured using the HTDMA (Good et al., 2010; Wu et al., 2013). The HTDMA measured the distribution of hygroscopic growth factor (Gf) at a fixed relative humidity for a selected diameter of aerosol particles. Väisänen et al. (2016) reported that the measured NCCN with the HTDMA agreed well with that from in-cloud prediction, where the sample was collected from a tower approximately 224 m above the surrounding lake level. On the other hand, Chan et al. (2008) attributed differences in κ from HTDMA and CCN measurements to sparingly soluble organics that did not easily deliquesce in the previous measurements.
The PRD region is one of the most economically invigorating regions in China. This region is subjected to severe air pollution due to intensive human activities and insufficient pollution control measures. High particle loading leads to both visibility degradation and large cooling effects due to decrease of solar radiation. During wintertime, high concentrations of fine particles also cause severe haze events that pose health risks for people at the regional scale. It is hence an ideal location to investigate the influence of local anthropogenic emissions on the particles properties. However, there is still lack of understanding on the relationship between the CCN activity and its controlling factors (e.g., chemical composition and hygroscopicity of aerosol particles), hindering policy makers to propose effective measures for climate-related policy making.
In this study, we used the SMCA, HTDMA, and HR-ToF-AMS to, respectively, measure CCN activity, hygroscopicity, and chemical composition. We reported the relationship between CCN activity and hygroscopicity/chemical composition of aerosol particles in the PRD region, where only a few studies on such a relationship were available in the literature. The measurements were performed during wintertime 2014 (November and December). The CCN properties were predicted based on the combined SMCA, HTDMA, and HR-ToF-AMS measurements. The methods employed to predict the CCN concentrations were evaluated and the impact of organics on CCN concentrations was discussed.
2.1 Measurement site
The field measurements were conducted at the Chinese Meteorological Administration (CMA) Atmospheric Watch Network (CAWNET) station in Panyu, Guangzhou, China, during wintertime 2014 (November and December). The Panyu station is located at the center of the PRD region and at the top of the Dazhengang mountain ( N, E) with an altitude of about 150 m. No significant local emission sources were around the site. Detailed description of the measurement site and instruments (i.e., the HTDMA and the AMS) can be found elsewhere (Cai et al., 2017; Qin et al., 2017).
2.2 Instrumentation
2.2.1 Aerosol hygroscopicity measurements
Size-resolved aerosol hygroscopicity and particle number size distribution (PNSD) were measured by a HTDMA which was developed by Tan et al. (2013a). The hygroscopicity data were only available in November due to the failure of the HTDMA during December. An aerosol sampling port equipped with a PM1 impactor inlet was used during the measurement period. Ambient sampling flow first passed through a Nafion dryer (model PD-70T-24ss, Perma Pure Inc., USA) to achieve a relative humidity (RH) of <10 %. We considered the particles to be dry when the RH values were less than 10 %. The particles were subsequently charged by a neutralizer (Kr85, TSI Inc.) and size selected by a differential mobility analyzer (DMA1, model 3081L, TSI Inc.). The monodisperse particles with a specific diameter (D0) were then introduced into a Nafion humidifier (model PD-70T-24ss, Perma Pure Inc., USA) under a fixed RH of (90±0.44) %. Another differential mobility analyzer (DMA2, model 3081L, TSI Inc.) and a condensation particle counter (CPC, model 3772, TSI Inc.) were used to measure the number size distribution of the humidified particles (Dp). Thus, Gf of the particles can be calculated:
During the campaign, we selected five dry mobility diameters (40, 80, 110, 150, and 200 nm) for the HTDMA measurements. The measurements were performed continuously except for regular calibration of the instrument. We used standard polystyrene latex spheres and ammonium sulfate to perform the DMA calibration to ensure the instrument functioned normally.
2.2.2 Size-resolved CCN activity measurements
Size-resolved CCN spectra and activation ratios were measured with the SMCA initially proposed by Moore et al. (2010). In this work, the SMCA consisted of a CCNc-100 (DMT Inc.), a differential mobility analyzer (DMA, model 3081L, TSI Inc.), and a condensation particle counter (CPC, model 3787, TSI Inc.). In the SMCA system, the combined DMA and CPC were used as a SMPS during the measurements. The dry particles after the Nafion dryer were neutralized by the Kr85 neutralizer and were subsequently classified by the DMA. The monodisperse particles were split into two streams: one to the CPC for measurement of total particle number concentration (NCN) and another to the CCNc-100 for measurements of the CCN number concentration. The aerosol and CPC flow rates were both 1.0 L min−1 for the DMA and the CPC (0.5 L min−1 makeup flow and 0.5 L min−1 sample flow), respectively. The CCNc-100 drew another aerosol flow rate of 0.5 L min−1. The SMCA was protocolled to measure particles at a mobility diameter range of 10–400 nm. The supersaturation in the CCNc-100 was set to be 0.1 %, 0.2 %, 0.4 %, and 0.7 %, respectively, for each measurement cycle. The CCNc-100 was regularly calibrated with ammonium sulfate particles at the four SSs (0.1 %, 0.2 %, 0.4 %, and 0.7 %). Previous studies showed that different parameterizations in the Köhler theory can retrieve different critical supersaturations (Rose et al., 2008; Wang et al., 2017). When performing the CCNc calibration, we assumed the density and molecular weight of ammonium sulfate to be 1770 kg m−3 and 0.132141 kg mol−1, respectively. In the CCNc calibration, the water activity (aw) was approximated according to Rose et al. (2008):
where is, μs, and Mw are the van 't Hoff factor, molality of solute, and the molar mass of water (0.01802 kg mol−1), respectively. The van 't Hoff factor is is calculated from a polynomial fit to Pitzer model output data (Moore et al., 2010). In this study, we adopted the simplest parameterization of the surface tension of the solution (Rose et al., 2008); that is, it was simply approximated by the surface tension of pure water (0.072 N m−1) according to Seinfeld and Pandis (2006).
We also set the temperature and the pressure to 298.15 K and 1026 hPa, respectively. A temperature gradient ΔT of about 3–8 K in the CCNc column was also used in the calibrations. Similarly, the DMA was calibrated with standard polystyrene latex spheres before and after the campaign for quality assurance and control.
2.2.3 Aerosol chemical composition measurements
An Aerodyne high-resolution time-of-flight aerosol mass spectrometer (HR-ToF-AMS) was employed in the campaign to measure non-refractory PM1 chemical composition (bulk and size-resolved) including sulfate, nitrate, ammonium, chloride, and organics. The refractory components such as black carbon, sea salts, and crustal species cannot be measured by this instrument. Detailed description of the HR-ToF-AMS can be found elsewhere (DeCarlo et al., 2006; Jimenez et al., 2003). Here, only a brief description relevant to the measurements is given. The instrument was operated in three modes (pToF, V, and W modes). Particle size distribution could be obtained based on the time of flight of the particles in pToF mode. In V and W modes, the resolving power of the mass spectrometer was approximately 2000 and 4000, respectively. The instrument collected alternatively 5 min average mass spectra for the V plus pToF modes and the W mode. The monodisperse pure ammonium nitrate (NH4NO3) particles selected by a DMA (400 nm) were used weekly in the ionization efficiency (IE) calibration. Background signals were obtained daily for about 30 min by introducing filtered ambient air with a high-efficiency particulate air (HEPA) filter in the sample flow. Before and after the measurement, the sampling flow rate was calibration with a Gilian gilibrator. We also generated polystyrene latex (PSL) (Duke Scientific) and ammonium nitrate particles in a size range of 178–800 nm to calibrate the pToF size. Note that the mass concentrations were too low for particle diameters smaller than 65 nm and data for those particles were hence discarded in this study. A more detailed description of the AMS performance during the measurements can be found in Qin et al. (2017) and Cai et al. (2017).
The AMS measured size-resolved chemical composition of particles in a vacuum aerodynamic diameter (Dva). It is hence necessary to convert aerodynamic diameter to mobility diameter in order to compare the AMS data and the SMCA data. We adopted the equation derived by DeCarlo et al. (2004) to do the conversion. Here, we assume a density of 1700 kg m−3 for particles measured by the AMS (DeCarlo et al., 2004).
2.3 Data processing and methodology
2.3.1 Hygroscopicity
Due to the effects of diffusing transfer function, the measured distribution function (MDF) given by the HTDMA is only a skewed and smoothed integral transform of the actual growth factor – probability density function (Gf-PDF) of the particles (Gysel et al., 2009). Here, the TDMAfit algorithm (Stolzenburg and McMurry, 2008) was applied to narrow the uncertainties caused by the diffusion broadening. The TMDAfit algorithm describes the Gf-PDF as a combination of several (usually smaller than three) lognormal distribution functions, in which the parameters of each mode are considered as mean Gf, standard deviation, and number fraction. The detailed data inversion process of the HTDMA instrument can be found in Tan et al. (2013b). Note that we include multiply charged correction for the SMCA, SMPS, and HTDMA data when the data were inverted so that the contributions of the multiply charged particles were accounted for all the measured particle data.
As mentioned in the introduction, the CCN activity can be represented by a widely used hygroscopicity parameter κ (Petters and Kreidenweis, 2007). According to the κ-Köhler theory, for a known temperature, κ and Gf can be related via Eq. (4) (Petters and Kreidenweis, 2007):
where ρw is the density of water (about 997.04 kg m−3 at 298.15 K), Mw is the molecular weight of water (0.018 kg mol−1), σs∕a is the surface tension of the solution/air interface and here pure water is tentatively assumed for the solution ( N m−1 at 298.15 K), R is the universal gas constant (about 8.31 J mol−1 K−1), T is thermodynamic temperature in Kelvin (298.15 K), and D is the particle diameter (in meter).
2.3.2 CCN activation
The NCN and NCCN data were, respectively, measured by the SMPS and the CCNc-100 and they were used to calculate the size-resolved CCN ARs which was defined as the ratio of NCCN to NCN at each particle size. The activation ratio can be obtained by fitting the ratio with the sigmoidal function with respect to Dp:
where Dp is the particle dry diameter, B, C and D50 are fitting coefficients that represent the asymptote, the slope, and the inflection point of the sigmoid, respectively (Moore et al., 2010). Note that the parameter C (in Eq. 5) is a fitting coefficient with no specific physical meaning. However, a small C value indicates a steep activation curve. D50 is also called the critical diameter or the activation diameter, that is, the diameter at which 50 % of the particles are activated at a specific SS.
Alternatively, the hygroscopicity parameter κ can be calculated from the critical saturation ratio (Sc) and D50 from the following equation (Petters and Kreidenweis, 2007):
2.3.3 CCN prediction based on HTDMA and AMS measurements
The NCCN can be predicted based on either the aerosol hygroscopicity data (measured by the HTDMA) or the AMS data. Figure 1 is the schematic diagram of the four approaches we followed to predict NCCN based on the above two measured datasets. In the first approach (I in Fig. 1), the mixing state and size dependence were taken into account. We assumed the critical hygroscopicity parameter κcritical to be a function of the particle diameter and the supersaturation ratio (denoted as κcritical(Dp, SS)). The κcritical was hence defined as the point at which all the particles were activated at a specific diameter and a specific SS. Here, we measured hygroscopicity using the HTDMA at five dry diameters and the CCN concentrations at four SSs. We calculated the κcritical(Dp, SS) using Eq. (6) for a known diameter and SS. A particle with a κ value higher than κcritical(Dp, SS) was considered to be activated as CCN (Fig. 1a) and the shadow area represented the particles which can be activated as CCN for a known diameter and SS. The activation ratio for a specific diameter at a specific SS was obtained by integrating the κ-PDF for κ>κcritical(Dp, SS).
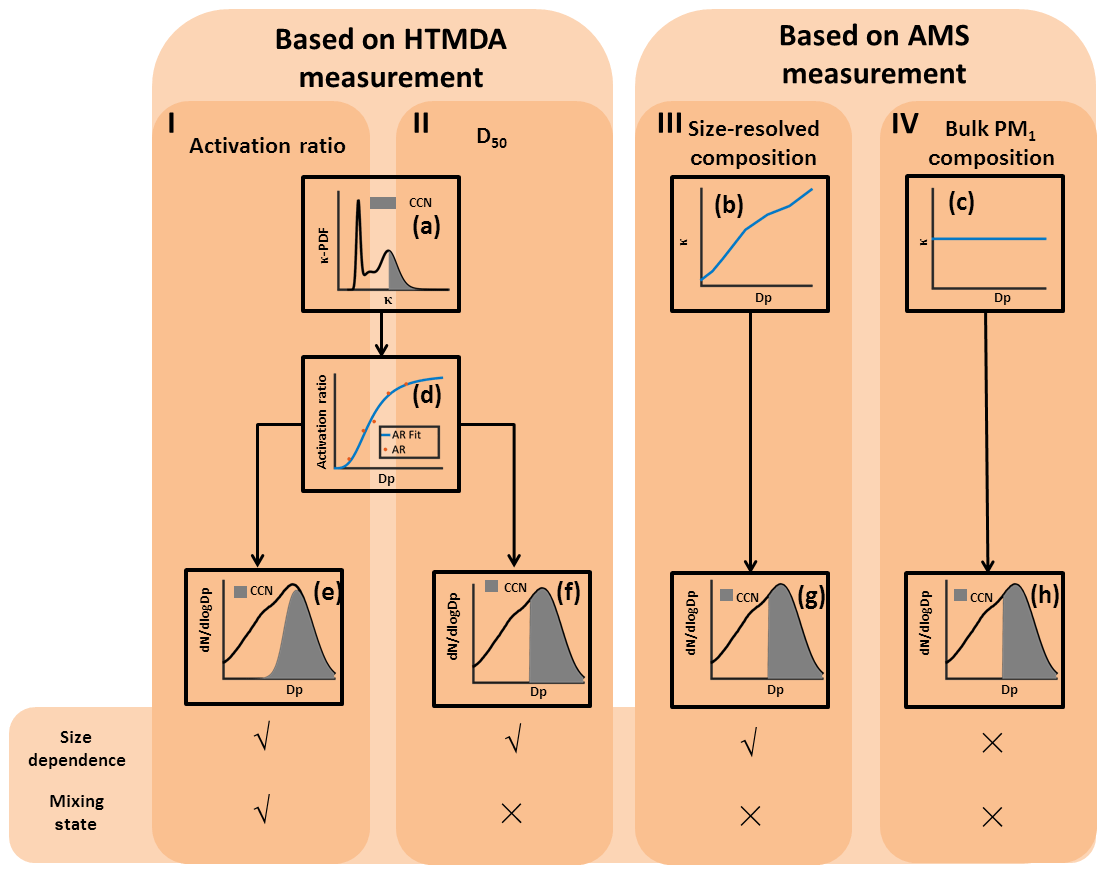
Figure 1A schematic representation of NCCN prediction based on the HTDMA and the AMS measurements. The NCCN can be predicted based on the fitted activation ratio (approach I) and the D50 (approach II), both obtained from the HTDMA measurement, the size-resolved composition (approach III), and the bulk PM1 composition (approach IV), both obtained from the AMS measurements. Panel (a) shows the representation of calculating the activation ratio for a specific diameter and SS, and the shadow area represents the particles which can be activated as CCN; panels (b) and (c) show the representations of the κ values obtained, respectively, from size-resolved chemical composition and bulk chemical composition; panel (d) shows the representation of fitting the activation ratio to the particle diameter Dp (red dot); panels (e), (f), (g), and (h) show the representations of predicting the NCCN using the four approaches, respectively, and the shadow area represents the particles which can be activated as CCN.
This approach is similar to the one employed in Kammermann et al. (2010); however, we used the size-resolved activation ratio (ARSR) to calculate the NCCN. The ARSR was determined by fitting the AR(Dp,SS) to the diameter Dp using Eq. (5) for the five measured diameters (Fig. 1d). Thus, the calculated NCCN using the activation ratio can be expressed as (Fig. 1e)
In the second approach (II in Fig. 1), the particles were assumed to be internally mixed. The D50 was determined by fitting the AR(Dp,SS) to the diameter Dp (Fig. 1d). The NCCN was obtained by integrating the cloud nuclei concentration for particles larger than D50 based on the particle size distribution (Fig. 1f), according to the following equation (Eq. 8):
In the third and fourth approaches (III and IV in Fig. 1), the particles were also assumed to be internally mixed. We then calculated the κ value according to the ZSR rule (Eq. 9) based on the AMS measurements.
where εi is the volume fraction of each component in the particles; κi is the κ value of each component.
The AMS only provided the ion concentrations during the measurements, while the ZSR rule required the volume fraction and hygroscopicity of each component. A simplified ion pairing scheme developed by Gysel et al. (2007) was used to reconstruct the , , and measured by the AMS:
where n denotes the number of moles of each component (i.e., , , and ). Here, we used the uncoupled diameter-dependent thermodynamic equilibrium model (ADDEM) proposed by Topping et al. (2005) to calculate the κ values of the inorganic species and those of the organics were tentatively assumed to be 0.1 (Meng et al., 2014). Table 1 lists the κ values of the relevant species used in the study based on the calculations and the above assumption.
Table 1The κ values of the related species in the study.
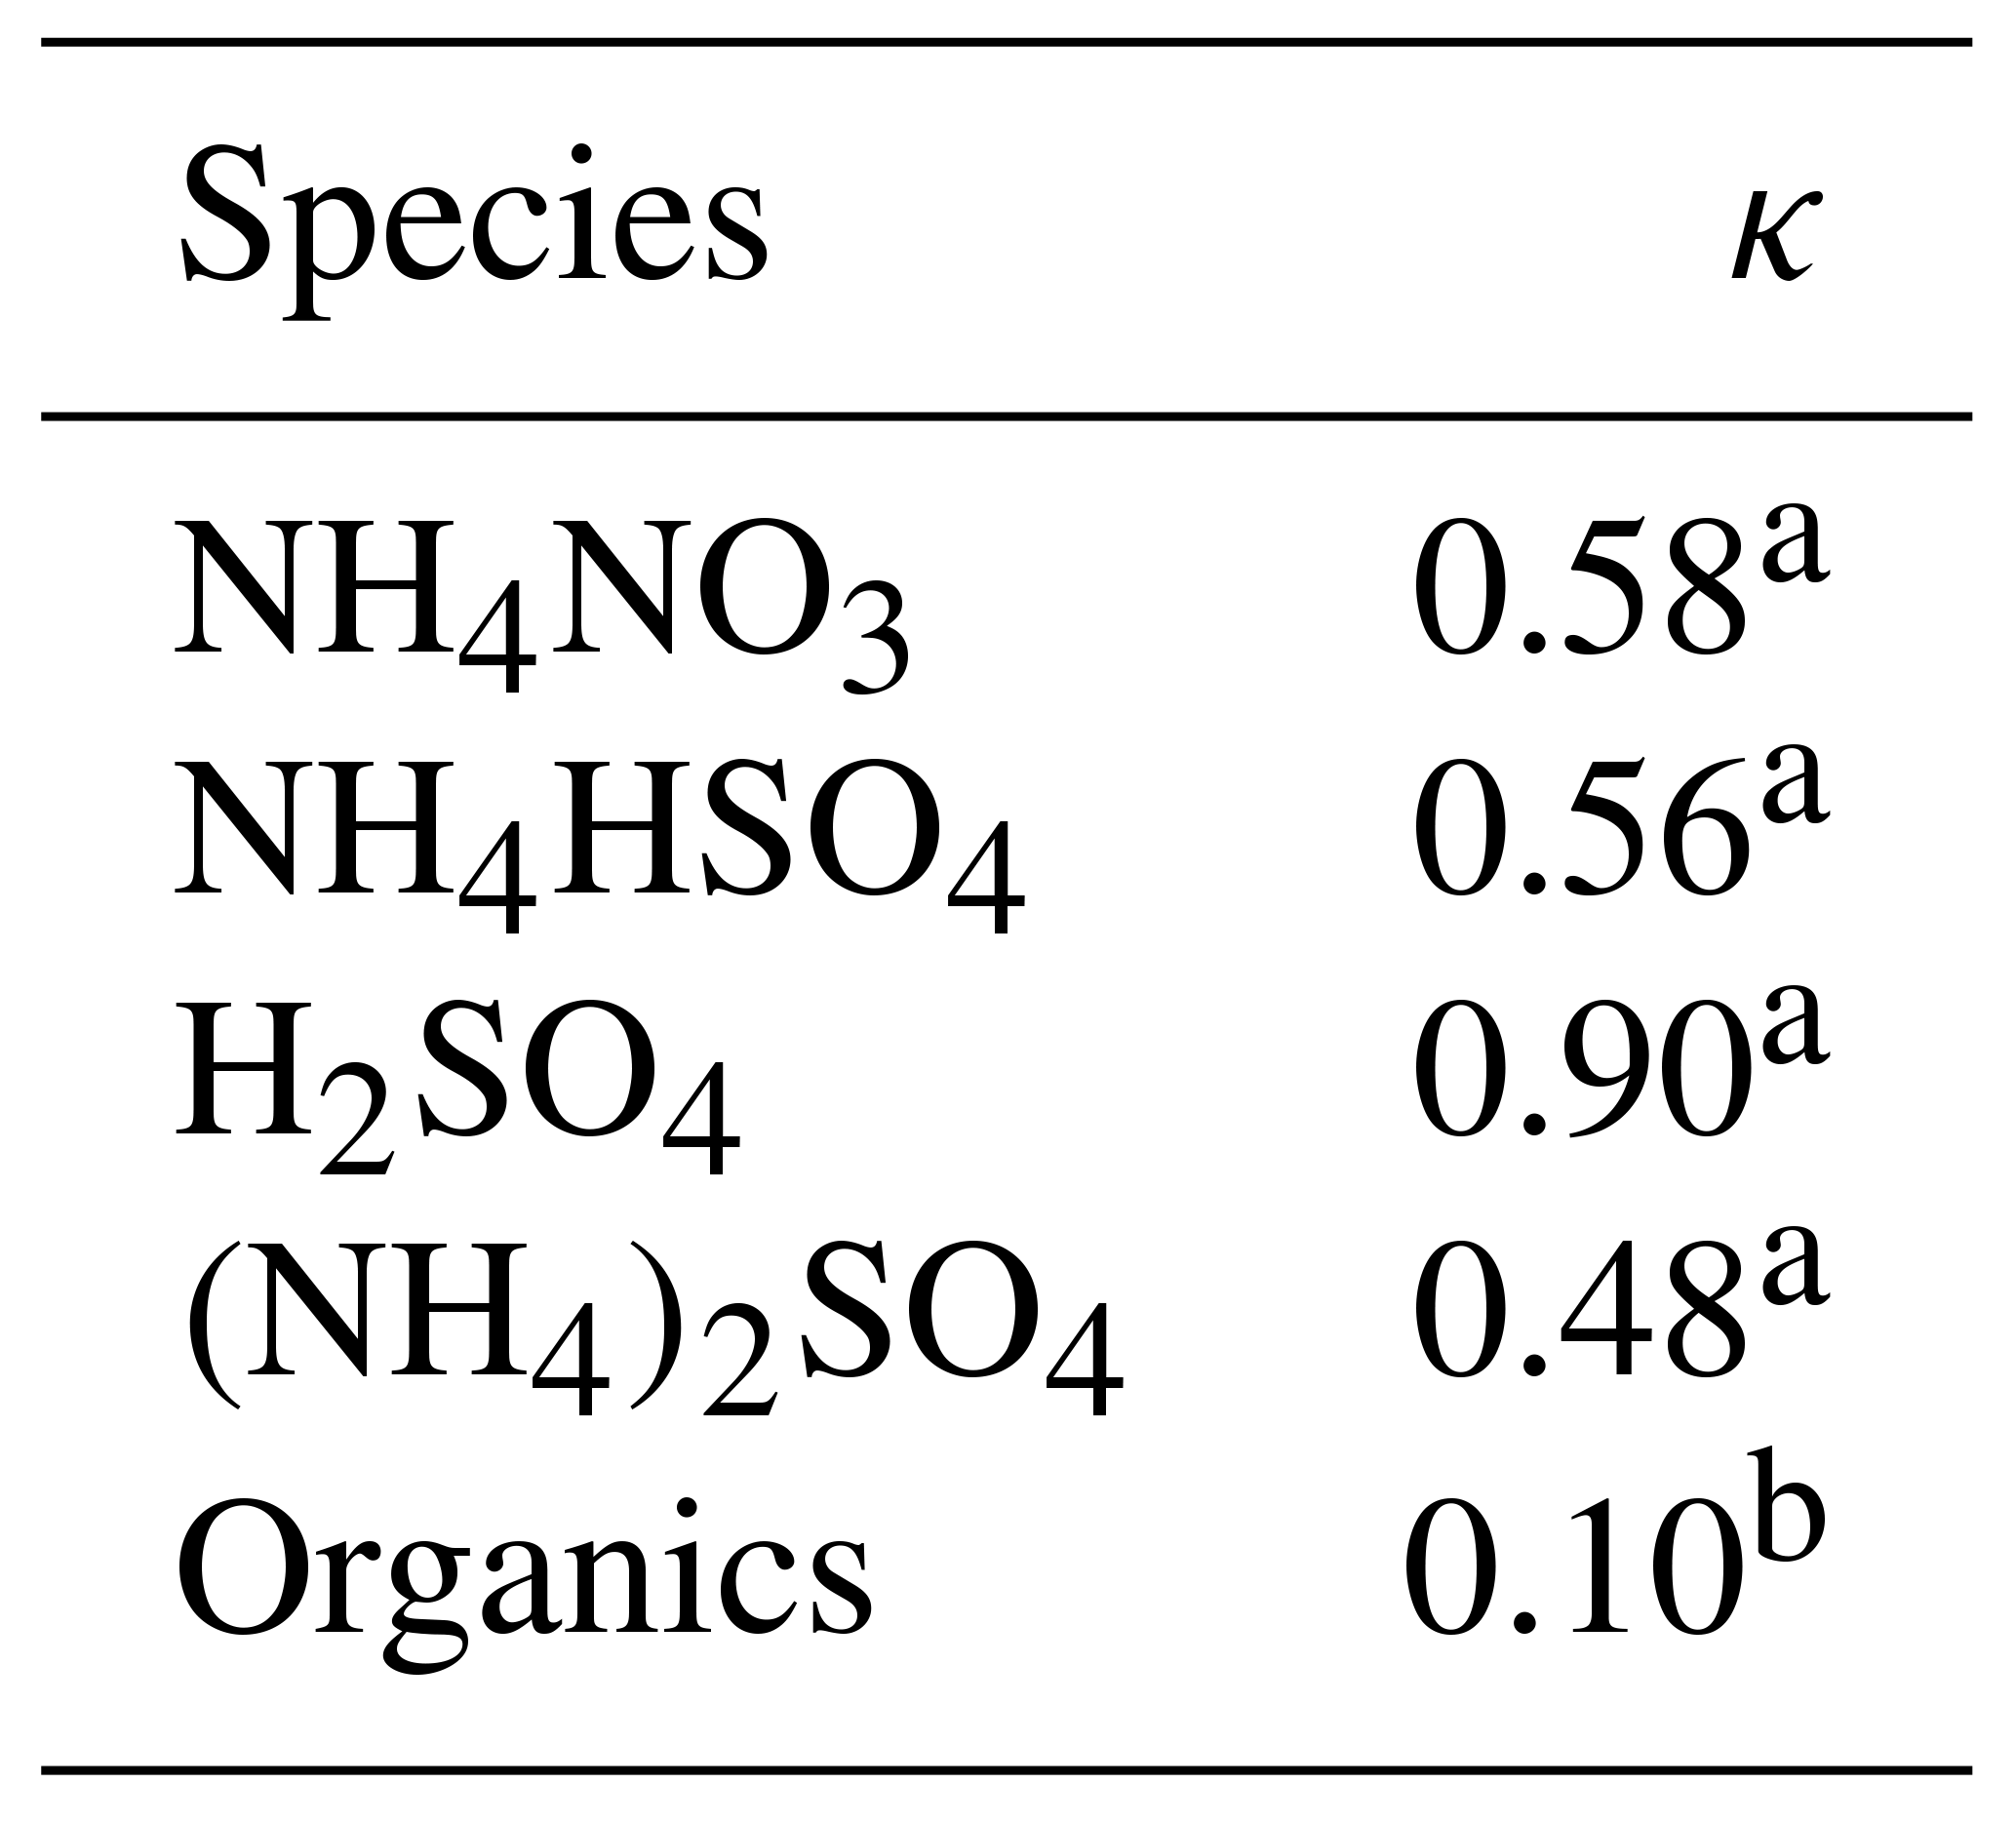
a κ of inorganic compounds is derived from ADDEM (Topping et al., 2005). b κ of organics is from Meng et al. (2014).
Here, instead of being determined from fitting of ARSR to Dp used in the second approach, the D50 was calculated from the above κ values using Eq. (6). In the third approach, the κ values were size resolved because the chemical composition of the particles was size dependent (Fig. 1b). In the fourth approach, the particles were assumed to have the same chemical composition and hygroscopicity as those in PM1 (Fig. 1c). The NCCN was then predicted using Eq. (8) (Fig. 1g and h).
3.1 Overview
Table 2 summarizes the observed CCN activity during the campaign. Overall, the average NCCN at 0.1 %, 0.2 %, 0.4 %, and 0.7 % SS were about 3100, 5100, 6500, and 7900 cm−3, respectively. The average ARs at the above four SSs were 0.26, 0.41, 0.53, and 0.64, respectively. The average D50 values at the above four SSs were 156, 107, 78, and 58 nm, respectively. The NCCN at 0.7 % SS was, respectively, lower than those of the previous measurements (10 731 cm−3 at 0.67 % SS) in July 2006 in Guangzhou (Rose et al., 2010) but much higher than those measured (2085 cm−3 at 0.7 % SS) in May 2011 in Hong Kong (Meng et al., 2014), while the was lower than that from the previous measurements (at 0.67 % SS) in Guangzhou (0.59; Rose et al., 2010) and similar to that from the measurements (at 0.7 % SS) in Hong Kong (0.64; Meng et al., 2014). The D50 was larger than that in the previous measurements in Guangzhou (49 nm) and in Hong Kong (47 nm), due to the lower particle hygroscopicity in Guangzhou. The differences of the κCCN values between the two measurements (0.21 in this winter campaign vs. 0.28 during the summer season in Guangzhou both at 0.7 % SS) suggested that the particles in the summer were in general more hygroscopic and hence were more readily activated than those in the winter, implying different chemical composition of the particles between the two distinct seasons. Mochida et al. (2010) measured the size-resolved CCN activity in Cape Hedo, a remote marine site rarely affected by anthropogenic emissions. The results showed that the D50 at 0.1 % SS in Cape Hedo was about 130 nm, much smaller than that in Guangzhou, leading to higher hygroscopicity of atmospheric particles in Cape Hedo than that in Guangzhou.

Figure 2The mass fraction of the bulk NR-PM1 composition (a) and the mass fraction of the size-resolved composition (b).
Table 2Summary of the measured CCN concentration, activation ratio, and D50 at the four supersaturations during the campaign.
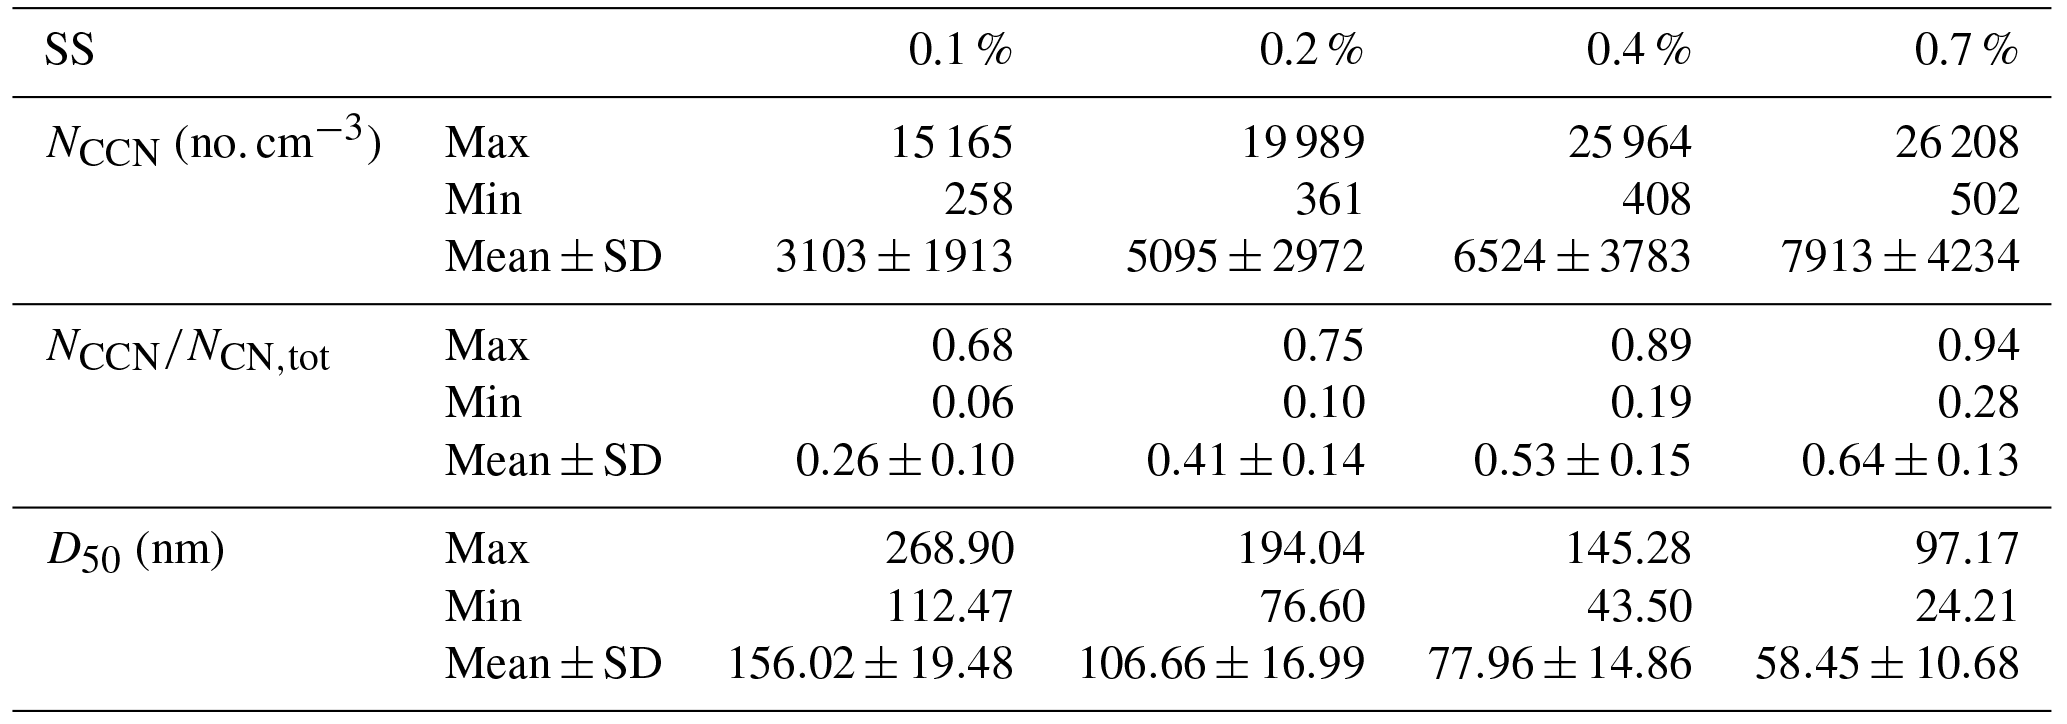
Figure 2 shows the average mass fraction of NR-PM1 bulk composition and size-resolved (64–731 nm) composition. The organics were dominant in the bulk NR-PM1 (50 %), followed by sulfate (26 %) and nitrate (12 %) (Fig. 2a). The mass fraction of the organics decreased with the size (Fig. 2b) from 73 % at 64 nm to 42 % at 397 nm. The mass fraction of organics at 397 nm was close to that of NR-PM1 bulk, due to the fact that the PM1 mass is dominated by particles in a diameter range of 200–500 nm (Tan et al., 2016). In comparison, the dominant NR-PM1 species observed in Hong Kong were sulfate (51.0 %) and organics (28.2 %) (Lee et al., 2013), which is significantly different from our measurements, due probably to different origins of the dominant air masses between the two seasons. The measurement site in Guangzhou was impacted predominantly by the air mass from the north, where straw burning contributes to a high mass fraction of organic matter (Cao et al., 2008).
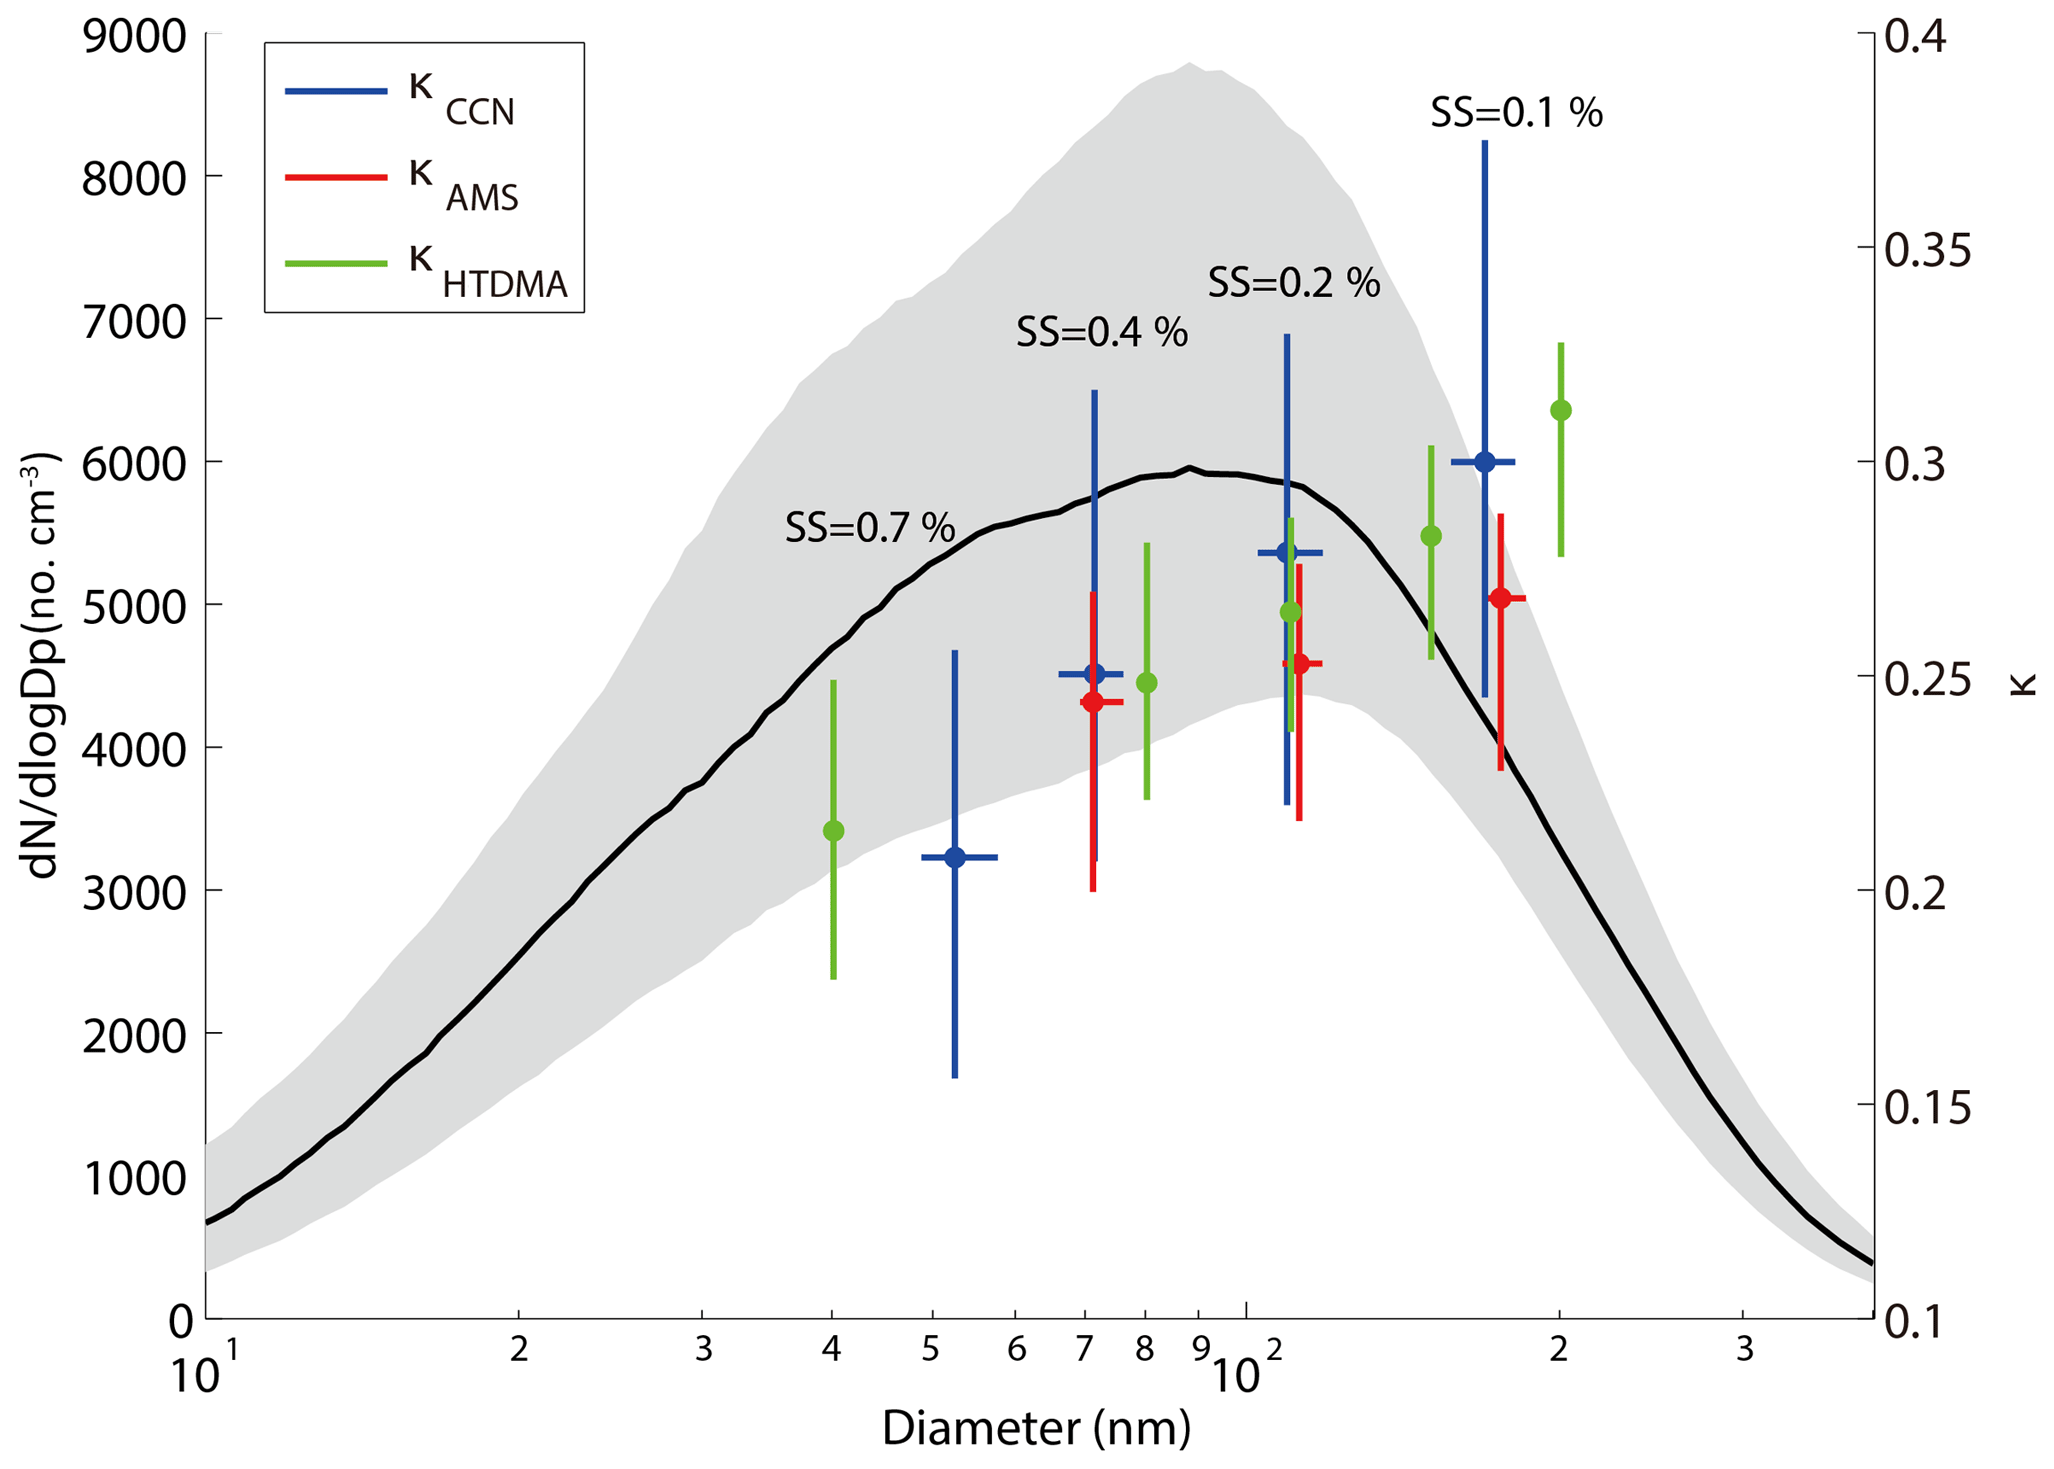
Figure 3The median and interquartile PNSD, κ obtained from HTDMA, AMS, and CCN measurements during the campaign. The κ was pointed against their corresponding median D50 (SMCA and AMS) or measured diameter (HTDMA). Dots represent the median value and the bars represent the interquartile range. The blue, red, and green colors represent κCCN, κAMS, and κHTDMA, respectively.
Figure 3 shows the κ values based, respectively, on the CCN (κCCN), AMS (κAMS), and HTDMA (κHTDMA) measurements, along with the measured PNSD (10–400 nm) during the campaign. The shadow area represents the interquartile range of the PNSD. A distinct peak at around 90 nm was observed from the PNSD (Fig. 3). The κAMS was calculated based on the size-resolved chemical composition, assuming the particles are internally mixed. At 0.7 % SS, the D50 was about 58 nm. Hence, no κAMS was reported at this SS since we only measured particle composition above 63 nm using the AMS in this study. The κ values were shown in the interquartile range, with the largest variation from the CCN measurements (Fig. 3). As shown in Fig. 3, the difference between κCCN and κHTDMA is statistically insignificant at all employed diameters, while the one between κAMS and κCCN became statistically significant at larger sizes of the particles. The p value between the κAMS and the κccn was close to 0, indicating that the correlation between them is significant. The κHTDMA values were lower than those of the corresponding κCCN at most of the particle sizes, consistent with the previous observation (Pajunoja et al., 2015). This was probably due to the fact that particles contain a certain fraction of low-solubility composition, such as SOA, contributing differently to hygroscopic growth and CCN activation. The available AMS data (Fig. 3) show that the κAMS values were lower than the corresponding κCCN and κHTDMA values at all size ranges, and the differences become larger with increasing particle sizes. This was probably due to underestimated hygroscopicity in the organic composition when using the AMS data, since we assumed a κ value of 0.1 for all organics at all particle sizes. The hygroscopicity increased with particle diameters due to aerosol aging which increased the hygroscopic organic contents. Previous studies showed that the κorg values of larger particles are lower than those for smaller particles (Lance et al., 2013; Zhao et al., 2015), and hygroscopicity of organics is often found to be related to its chemical composition (f44 or O∕C) in both field and laboratory studies (Chang et al., 2010; Massoli et al., 2010; Lambe et al., 2011; Mei et al., 2013, and other references therein). We showed that the f44 increased with the particle size from the AMS data (Fig. S1 in the Supplement). Note that the f44 for particle diameters smaller than 100 nm was discarded due to the data quality. The results indicate that the degree of oxidation of the organics was higher for larger size particles and the hygroscopicity for larger particles is higher (Chang et al., 2010). The measured κmean values fall in a range of 0.22–0.30 for the particle sizes of 40–200 nm measured by the HTDMA in this study. The other aerosol hygroscopicity measurement in PRD (Jiang et al., 2016) reported the κmean values ranging from 0.18 to 0.22 in the 2012 winter season and 0.17 to 0.21 in the 2013 summer season, suggesting an increase of the aerosol hygroscopicity, which might result from an increasing mass fraction of nitrate in recent years (Zhang et al., 2015; Itahashi et al., 2018), although the fraction decrease of less hygroscopic compounds is not as significant as the fraction increase of the nitrate. However, the fraction of the non-hydroscopic compounds (i.e., EC) decreases more rapidly than the organic compounds.

Figure 4The size-resolved activation ratios measured by the SMCA at four different supersaturations. Note that the curves were fitted according to the SMCA measurements.
Figure 4 shows the ARs measured by SMCA at four supersaturation ratios (0.1 %, 0.2 %, 0.4 %, 0.7 %) for particles below 300 nm. The activation curves obtained in this study were segmented into three sections: a steady rise at low ARs, a middle sharp increase, and a plateau at almost 100 % AR. We defined the steepness as the rate at which the AR increased with the particle sizes. Figure 4 shows the steepness increased with the SS, indicating that the curves became steeper with the SS and a larger variation of the D50 was expected. In addition, the CCN activity was more sensitive to particle diameters at higher SS, which can be seen from partial derivative of κcritical by ∂D50 (Eq. 15):
For a certain SS, the κcritical value became more sensitive to D50 with decrease of the D50. Meanwhile, a high SS usually led to a low D50. Therefore, the AR would vary with Dp more readily at higher SS and the curve would become steeper. A higher SS allowed a smaller particle to be activated and the activation curve became steeper, and vice versa for a lower SS.
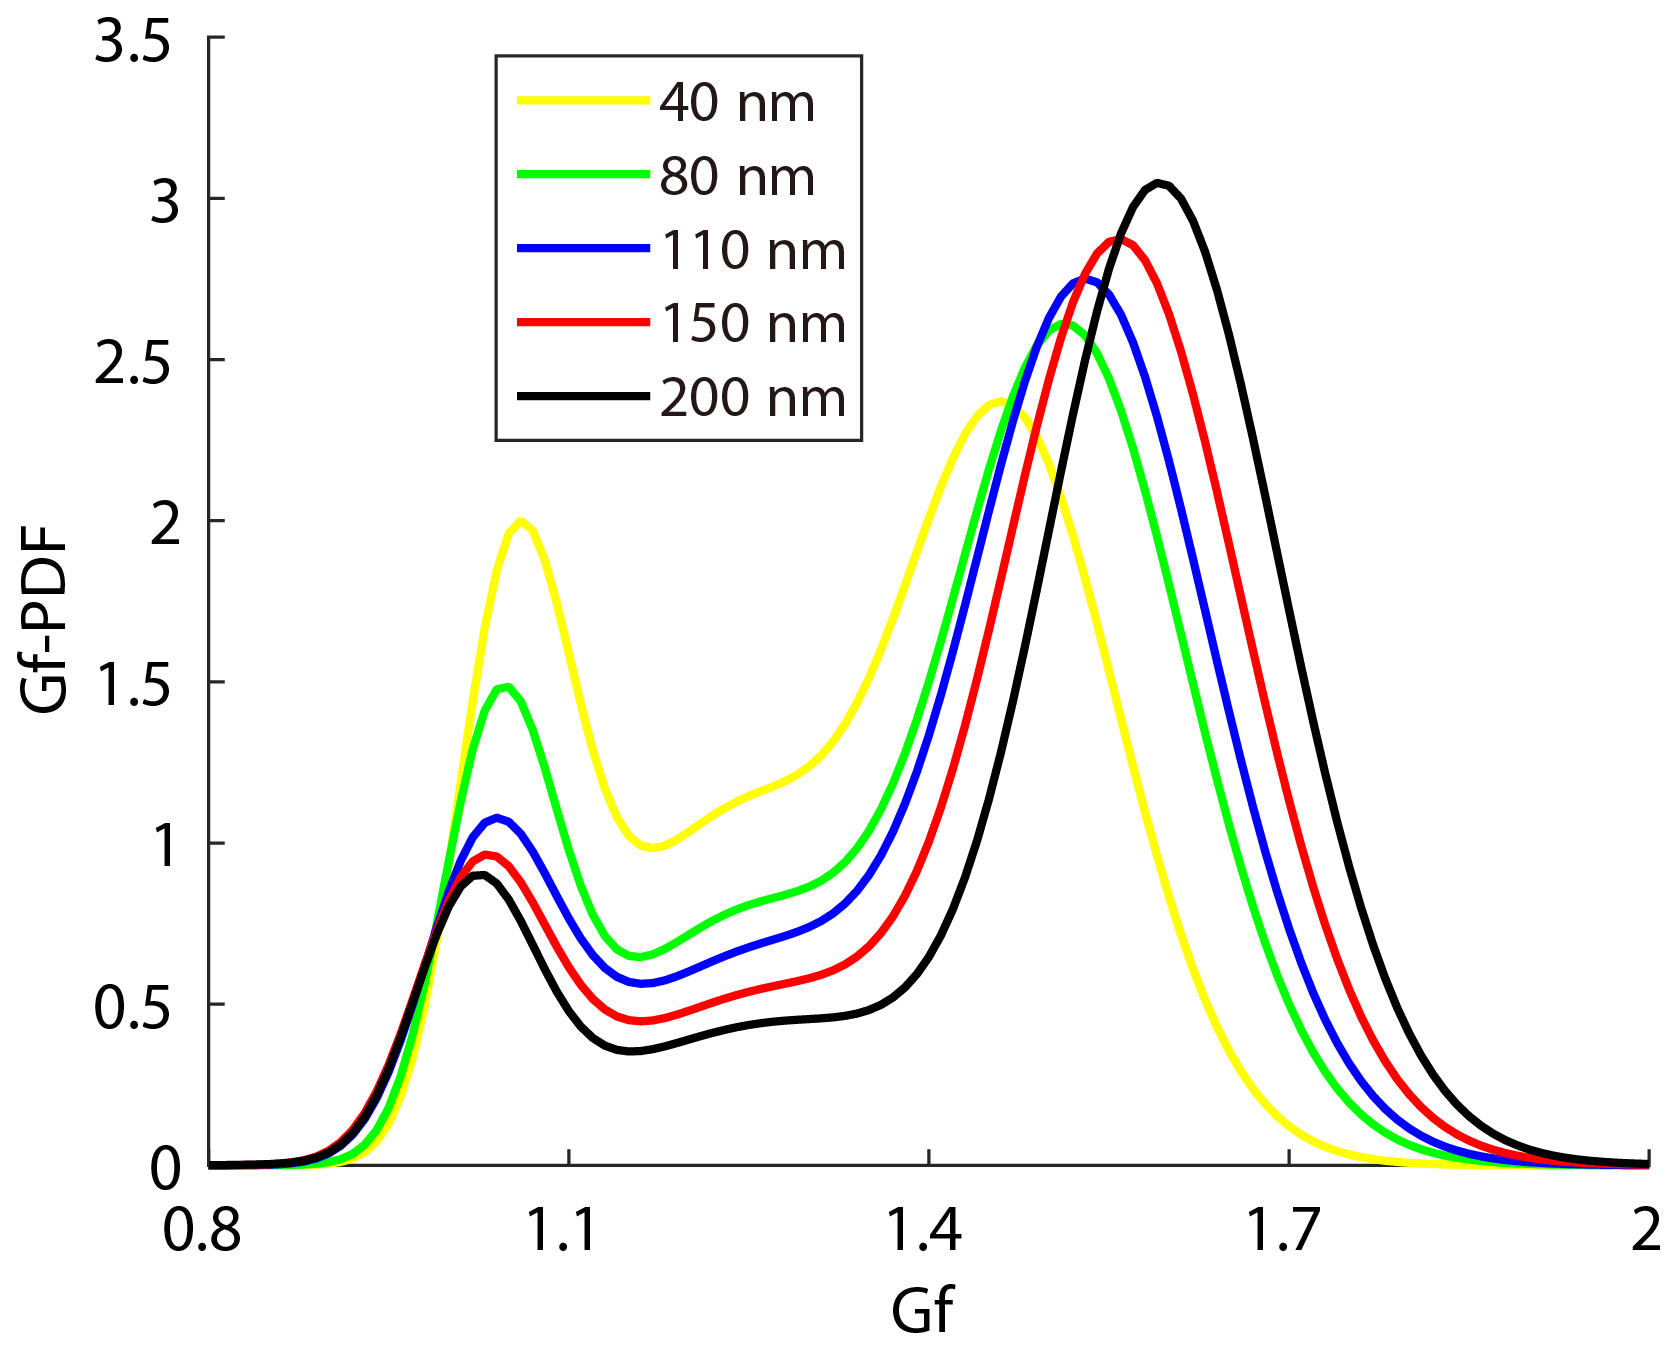
The steepness of activation curve was also associated with the heterogeneity of aerosol chemical composition; that is, a steeper activation curve meant that aerosol particles had higher similarity in hygroscopicity. A bimodal distribution (peaks at about 1–1.1 and 1.5–1.7 Gf) of the Gf-PDFs was observed along the Gf coordinate at all five sizes of the particles measured by the HTDMA in this study (Fig. 5), corresponding, respectively, to the less- and more-hygroscopic modes. Larger size particles contain higher fractions of more-hygroscopic inorganic matter which leads to the increase of Gf of the more-hygroscopic mode. The less-hygroscopic mode usually represents externally mixed black carbon or fresh organics. Thus, the less-hygroscopic mode for larger size particles more likely represents the external mixing non-hygroscopic black carbon with a Gf value of 0.8–1.1, indicating that the Gf of the less-hygroscopic mode decreased and that of the more-hygroscopic mode increased with the particle diameter (Fig. 5). Since less-hygroscopic particles were usually associated with externally mixed black carbon (BC) or fresh organics and more-hygroscopic particles usually represent the inorganic matter or BC coated with inorganic matter (internally mixed). The decrease of peak area of less-hygroscopic mode and the increase of more-hygroscopic mode indicate that the number fraction of less-hygroscopic particles decreased while the more-hygroscopic particles fraction increased. Thus, the particles became more internally mixed. Here, a parameter σ is introduced to illustrate the deviation of Gf-PDF (Gysel et al., 2009):
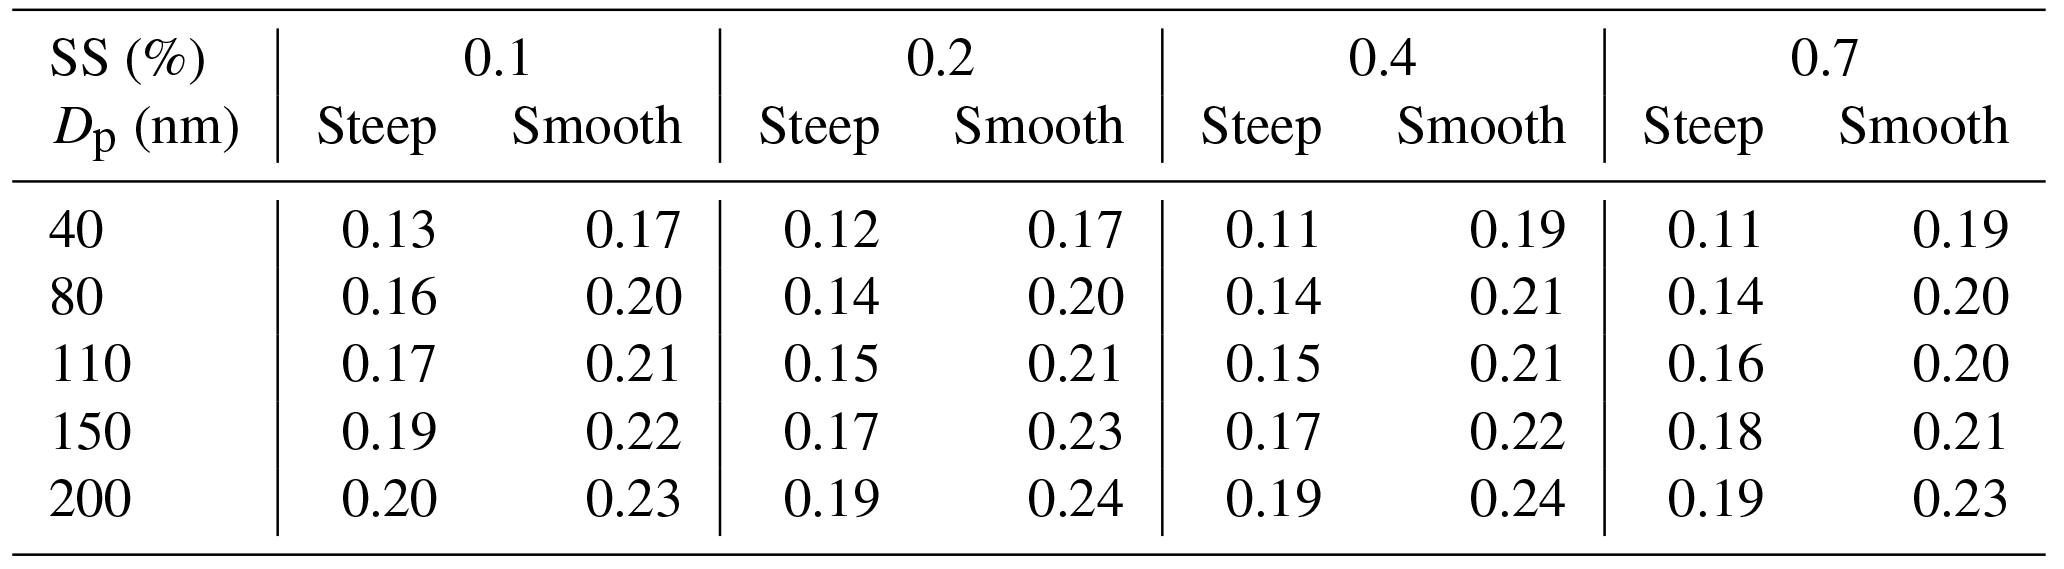
where the c(Gf) denotes Gf-PDF and Gfmean denotes number weighted mean Gf. The σ was employed as a measure of the spread of Gf-PDF which represents the heterogeneity of aerosol chemical composition (Sjogren et al., 2008; Liu et al., 2011). A small σ indicated that the heterogeneity of aerosol chemical composition was low and aerosol particles had higher similarity in hygroscopicity. The parameter C (in Eq. 5) determined the shape of the activation curve which was segmented into steep and smooth parts. A small C value means a steep activation curve, and vice versa. Here, an activation curve was assumed to be steep when the C values were lower than the lower quartile of all the C values, while the activation curve was considered to be smooth when the C values were higher than the upper quartile of all the C values. Table 3 summarizes the σ values of Gf-PDF for the corresponding steep and smooth activation curve at the four supersaturations. In general, the σ increased with the diameter, indicating that larger particles had higher heterogeneity of aerosol chemical composition. Meanwhile, the σ values for smooth curve were generally higher than the σ values for steep curve. The results implied that the shapes of activation curves were related to the heterogeneity of aerosol chemical composition. Cai et al. (2017) compared the Gf-PDF between Guangzhou and Cape Hedo and the results showed that only more-hygroscopic particles were observed in Cape Hedo, indicating that atmospheric particles tend to be more internally mixed in Cape Hedo than in Guangzhou. Meanwhile, atmospheric particles in Guangzhou have a higher degree of external mixing affected by more anthropogenic emissions, which in turn affect the CCN activity.
Table 3The average of σ values of Gf-PDF measured by the HTDMA for five diameters for the steep and smooth activation ratio at four supersaturations.
3.2 Impact of organics on CCN activity
Figure 6 shows the relationship between the D50 obtained from the SMCA measurements and the size-resolved mass fractions of organics (forg) at three supersaturation ratios (0.1 %, 0.2 %, and 0.4 % SS). In general, the D50 increased with forg at the three SSs, with slopes of 127, 66, and 21, and fitting coefficients (R2) of 0.47, 0.31, and 0.1 at 0.1 %, 0.2 %, and 0.4 % SS, respectively. The particles usually became less hygroscopic with increase of the organic fractions (forg), which then required larger particles to be activated. At lower SS, better correlations were found between the forg and the D50 because the D50 was more sensitive to hygroscopicity (the activation ratios increase slower with particle sizes at lower SS as shown in Fig. 4). It was hence more obvious at lower SS that the modification of the particle hygroscopicity caused by the change of the mass fraction of organic matter could greatly modify the D50 which might further affect the CCN activity. At higher SS, according to Eq. (6), particles were more easily activated as CCN and the change of particle hygroscopicity would not significantly alter the CCN activity.

Figure 6The relationship between size-resolved mass fraction of organics and D50 at three supersaturations. The red, blue, and green dots and line represent 0.1 %, 0.2 %, and 0.4 % SSs, respectively.
Organics can affect the CCN activity via two opposite ways: they can decrease the CCN activity by increasing the less hygroscopic organic fraction of the particles and thus increase the D50 as shown in Fig. 6; they can also increase the CCN activity by decreasing the surface tension of the particles. The latter effect has been demonstrated experimentally. For example, an increase of CCN activity was observed when organics were added to sulfate ammonium (Engelhart et al., 2008). In this study, we investigated the impacts of organics on CCN activity through adjusting the value of surface tension until the calculated AR values based on HTDMA measurements agreed with those obtained from SMCA measurements (measured AR). The calculated AR values were systematically lower than the corresponding measured ones because here the surface tension of bulk pure water (0.072 N m−1) was assumed when calculating the AR from the HTDMA measurements (Fig. 7). Note that the surface tension is not the only factor that determines the AR and other factors such as the sparingly soluble compounds in the particles may contribute to the AR, although they are currently not understood. Previous studies found that the hygroscopicity of the particles measured by the HTDMA could be lower than that measured by the CCNc (Chan et al., 2008; Pajunoja et al., 2015; Petters et al., 2009; Hansen et al., 2015; Hong et al., 2014) which might be attributed to low soluble compounds in the particles. The deviation of the calculated AR from the measured AR is probably dependent on the degree of dissolution of particles and the oxidative state of the organics in the particles.
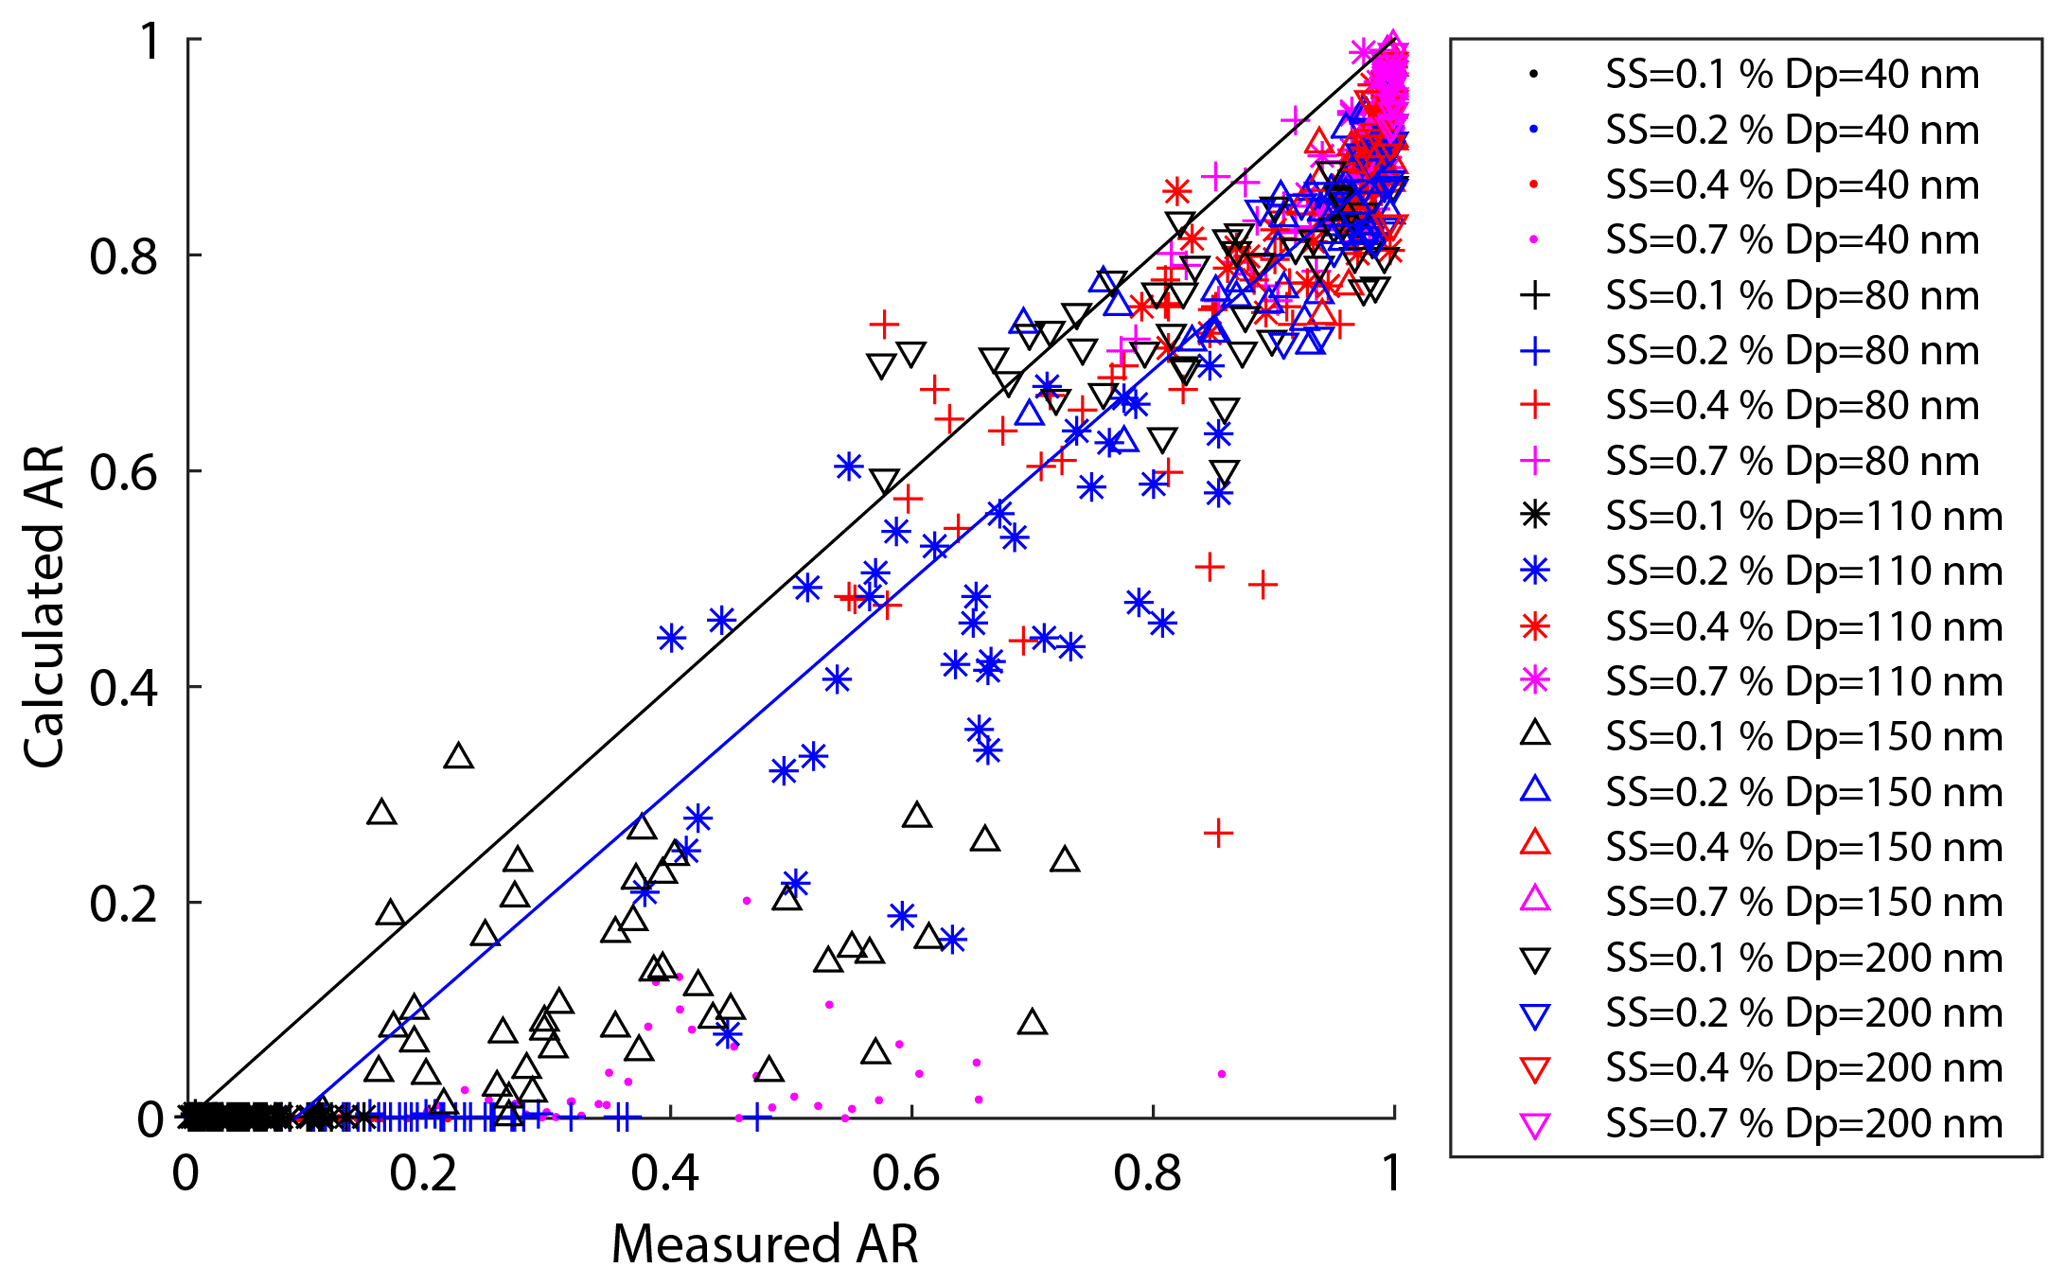
Figure 7The predicted activation ratio based on HTDMA measurement vs. the measured activation ratio at 0.1 %, 0.2 %, 0.4 %, and 0.7 % SS for 40, 80, 110, 150, and 200 nm particles.
The surface tension of a nanoparticle was substantially different from that of its bulk solution due to the curvature effect (Ahn et al., 1975; Bogdan, 1997). The effects of size and composition on the surface tension were currently not well understood. Here, we proposed an approach to evaluate the impact of organics on the surface tension (σs∕a) based on the fraction change of the calculated AR to the measured AR. We defined this fraction change (δAR) as a function of surface tension, diameter, and supersaturation:
where ARm(Dp,SS) is the measured AR for a certain diameter and SS, and is the calculated AR for a certain diameter, SS, and σs∕a. We excluded particles at the size of 200 nm because they were easily activated even at 0.1 % SS and the δAR was expected to be independent of σs∕a. Here, the σs∕a value varied between 0.03 and 0.072 N m−1 (surface tension of pure water). Figure 8 shows the δAR as a function of σs∕a for the four particle diameters (40, 80, 110, 150 nm). The δAR decreased with increase of the σs∕a for all given particle sizes, changing more rapidly for smaller particles (i.e., from 200 % to −100 % for 40 nm) than bigger particles (i.e., from 20 % to −10 % for 150 nm). The R2 values between measured AR and predicted AR for a certain diameter and four supersaturations at N m−1 were 0.35, 0.93, 0.95, and 0.91, respectively. The δAR values reached zero when the σs∕a was set to be about 0.054 N m−1 for 40, 80, and 110 nm particles, and 0.062 N m−1 for 150 nm particles, with a R2 of 0.88, 0.94, 0.94, and 0.88, respectively. As a compromise, here we adopt a σs∕a value of 0.058 N m−1 (denoted as ) to predict AR. This value significantly increased the R2 compared to that based on the pure water assumption (0.072 N m−1) for 40 nm particles, while it was reasonably well for other sizes of particles (80, 110, 150 nm). The AR was then recalculated using the value and the prediction was significantly improved (Fig. 9). We calculated the p value between the measured and predicted AR and the results showed that the p value is close to 0, indicating a significant correlation between the two variables. The results demonstrated that partitioning of organics into aerosol particles would decrease their surface tension. Therefore, the pure water assumption for surface tension would lead to high uncertainties when it was applied to predict the activation ratios of the aerosol particles at a certain size. Note that we did not consider the effects of individual organics due to the limited data from the chemical composition measurements. How chemical composition affects the surface tension of the particles is yet to be investigated.
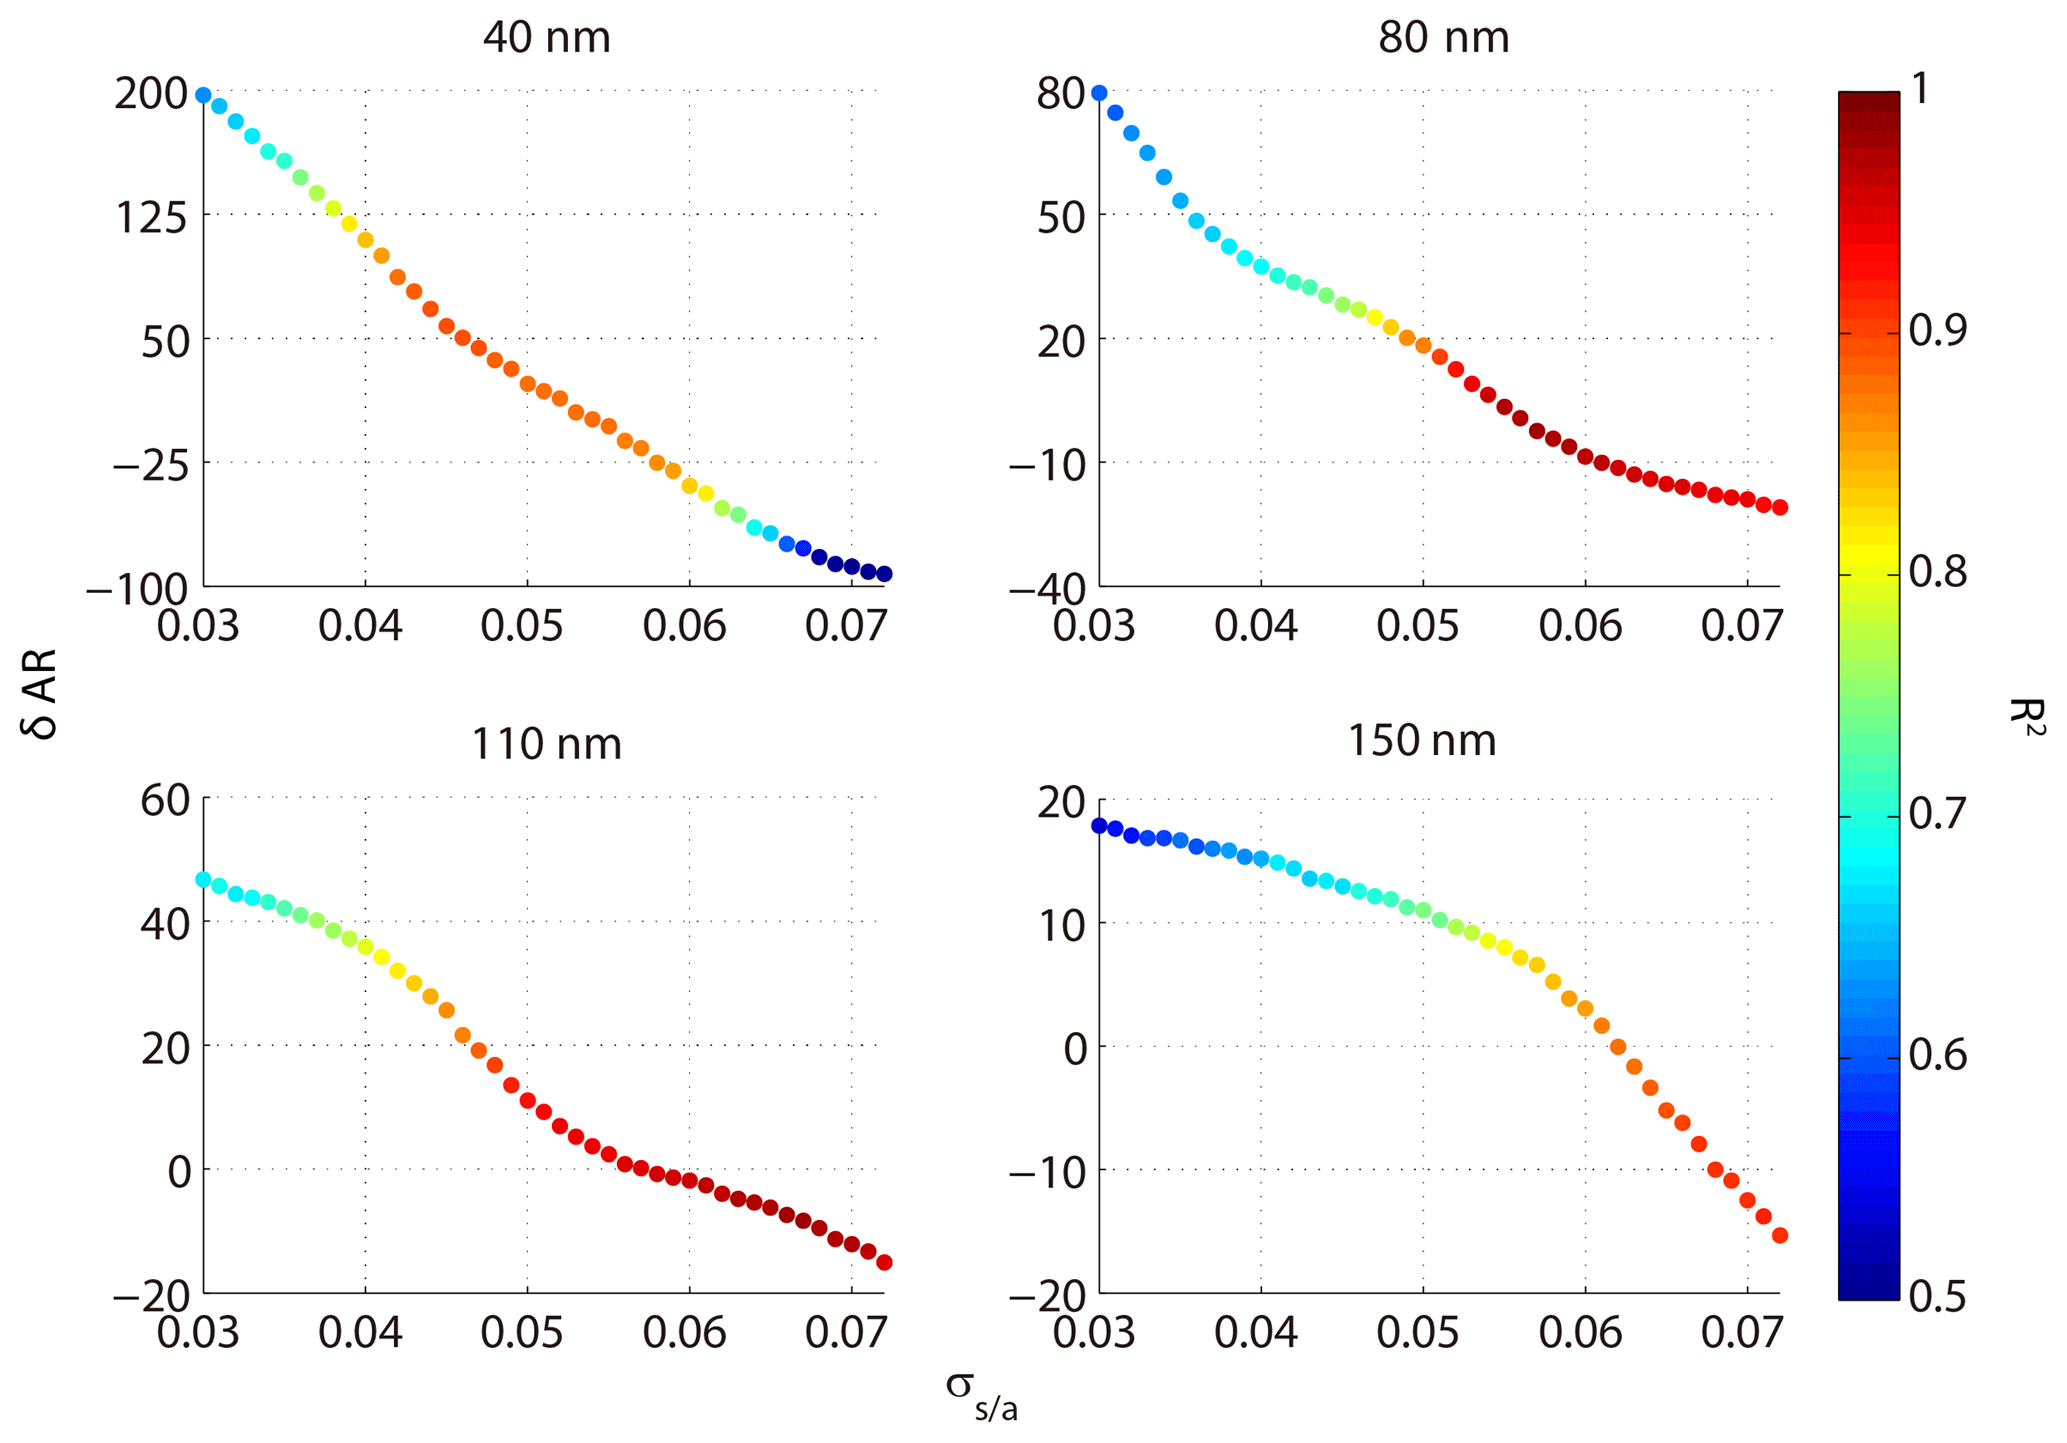
Figure 8The relative deviation between predicted AR and measured AR at different assumed σs∕a; the color code represents R2 between calculated AR and measured AR.
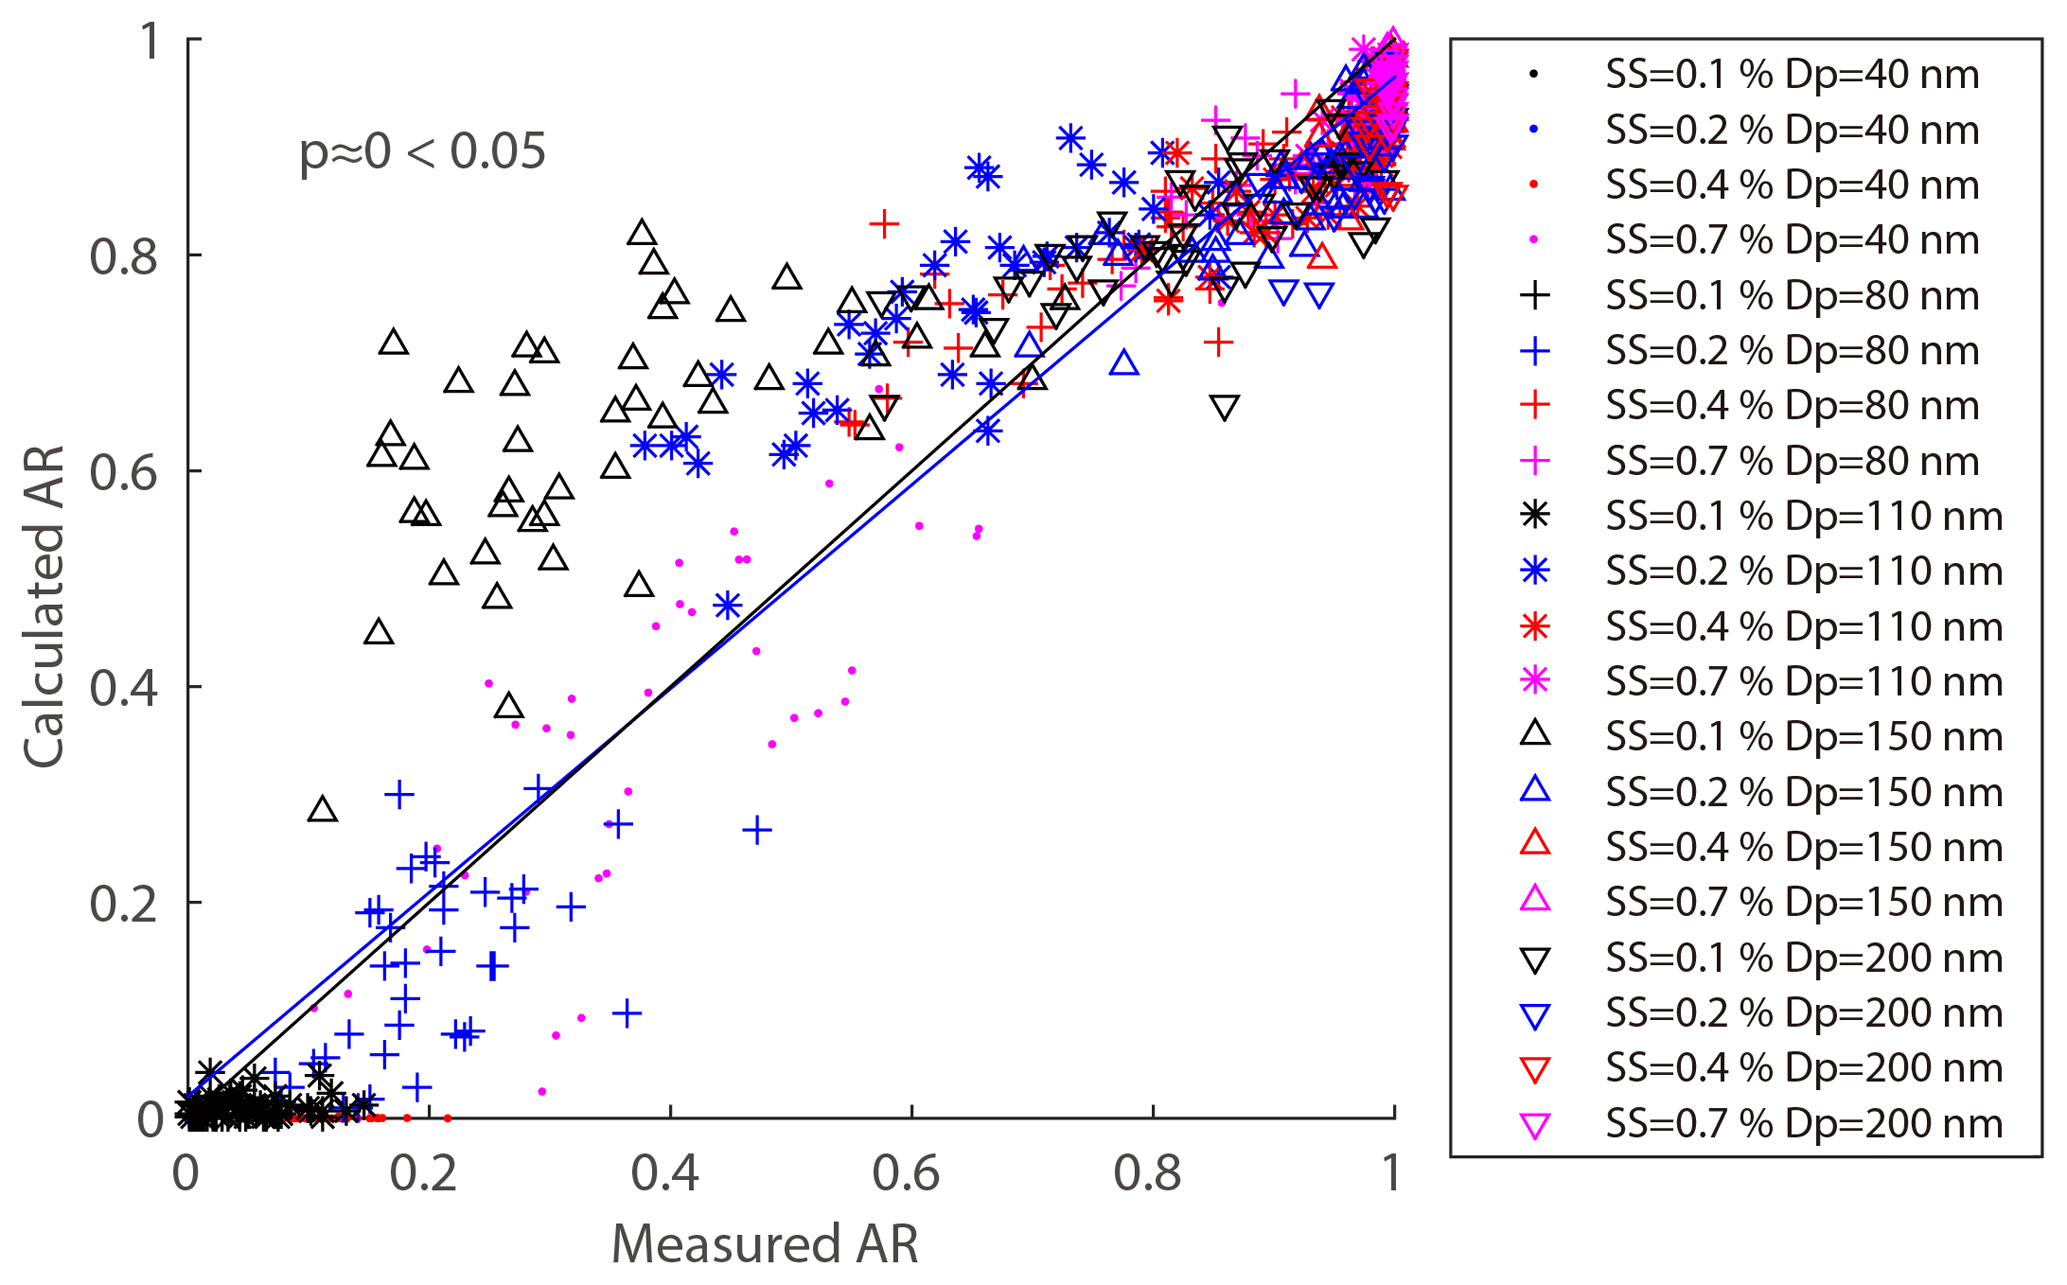
Figure 9The predicted activation ratio using the new surface tension assumption () based on HTDMA measurement vs. the measured activation ratio at 0.1 %, 0.2 %, 0.4 %, and 0.7 % SS for 40, 80, 110, 150, and 200 nm particles.
3.3 The NCCN prediction
3.3.1 The NCCN prediction based on the HTDMA measurements
In this study, we used several approaches to predict the NCCN based on the HTDMA measurements, from either the activation curve or the D50. Table 4 summarizes the methods that were used to predict the NCCN, along with the slope and R2 between the predicted and the measured values. The mixing state of the aerosol particles is an important parameter in determining the NCCN. The prediction of NCCN using the activation curve means the NCCN was calculated based on Eq. (7). Meanwhile, the prediction of NCCN using the D50 means that the NCCN was calculated based on Eq. (8) and the D50 was determined from fitting the size-resolved activation ratio by Eq. (5). The activation curve represented actual mixing state, while the D50 approach assumed that all particles were internally mixed. Scheme 5 in Table 4 was the method based on the activation curve with the new (0.058 N m−1). Equations (7) and (8) were, respectively, used to calculate the NCCN following schemes 1, 2, 5, and the rest of the schemes. Scheme 5 (real-time activation curve using ) provided the best NCCN predicted value (closest to the measured one), followed by scheme 3 (real-time D50) > scheme 4 (average D50) > scheme 1 (real-time activation curve) > scheme 2 (average activation curve). The R2 values for all the approaches were in general high (around 0.93). The CCN prediction based on scheme 2 led to the largest underestimation over the measured values. In general, the real-time data (schemes 1 and 3) gave better predicted NCCN than the corresponding average data (schemes 2 and 4).
Table 4The overview of different schemes used in the NCCN prediction based on HTDMA measurements.
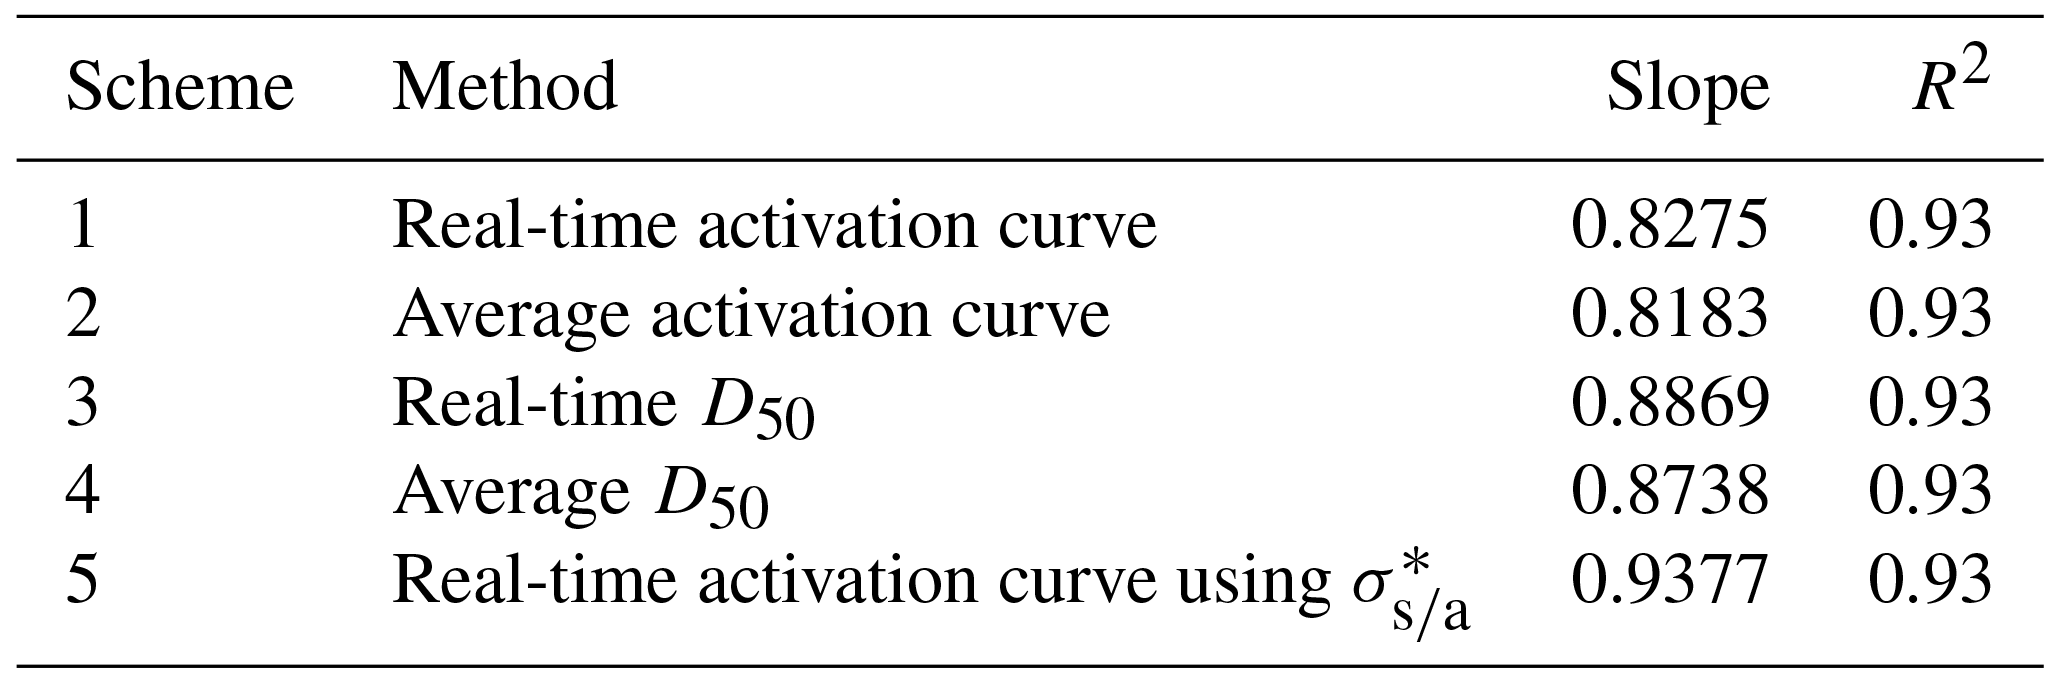
Figure 10 shows the correlation between the measured NCCN and the predicted NCCN from schemes 1–5 at the four SSs. For schemes 1–4, the predicted NCCN values were found to be the largest deviation from the corresponding measured ones at 0.1 % SS among all the approaches, probably due to the pure water assumption for surface tension ( N m−1). Meanwhile, because the CCN activity was sensitive to hygroscopicity of the particles at low SS, the uncertainties of hygroscopicity data would lead to large errors in the prediction of CCN. As discussed in the previous section, the D50 was more sensitive to the σs∕a at lower supersaturations, leading to a large deviation of the NCCN from the measured value. The best agreement between the calculated AR and the measured AR was seen using scheme 5, as the slopes at the four SSs were close to 1 (Fig. 10q–t).

Figure 10The relationship between measured NCCN and predicted NCCN based on schemes 1, 2, 3, 4, and 5. The black lines represent 1:1 lines.
3.3.2 The NCCN prediction based on AMS measurements
We proposed five approaches based on HTDMA measurements to predict the NCCN in the previous section. Alternatively, we can calculate the NCCN based on AMS measurements. Here, we proposed four methods based on either size-resolved chemical composition or bulk PM1 chemical composition from the AMS measurements (Table 5). Here, we assumed that the particles were internally mixed and the median κAMS obtained from bulk composition was 0.28, higher than those from size-resolved composition (0.24–0.26 in Fig. 3), probably due to a higher mass fraction of inorganic matter in bulk NR-PM1 (Fig. 2). We excluded the size-resolved data at 0.7 % SS due to their poor quality. Note that the impact on the calculated κAMS values and the predicted NCCN was minor using the κ value (0.53) of ammonium sulfate from Petters and Kreidenweis (2007). For example, the κAMS values slightly increased from 0.27 to 0.28 at 0.1 % SS; the slopes for schemes 6, 8, and 9 in Table 5 slightly increased from 0.9859 to 0.9898, 0.9721 to 0.9834, and 0.9742 to 0.9973, respectively, while the one for scheme 7 did not change. Figure 11 shows the correlation between the measured and predicted NCCN from schemes 6–9. The NCCN was underpredicted at 0.1 % SS and was overpredicted at 0.7 % SS. We proposed three potential factors that might impact NCCN prediction based on AMS measurements. (1) The assumed κorg values were probably underestimated for particles larger than 100 nm, leading to the underestimated NCCN at low SS. As shown in Fig. 3, the predicted κ shows a larger deviation from the measured value for a larger particle. The D50 values were more sensitive to particle hygroscopicity at lower SS, as discussed in the previous section. (2) Pure water was assumed for surface tension. As we have shown in the previous section, the σs∕a values for the aerosol particles were found to be much smaller than the σs∕a for pure water (0.072 N m−1). As a result, the pure water assumption for surface tension led to the NCCN underestimation. In addition, again the D50 was more sensitive to σs∕a at the low SS. (3) Black carbon (BC) particles were not included and the particles were assumed to be internally mixed. The BC particles were known to be non-hygroscopic and had a low CCN activity. During the campaign period, the average BC concentration was about 5.91 µg m−3, which accounts for 7 % in PM2.5. The assumption of no BC particles would lead to the overestimation of NCCN. Here, the particles were assumed to be internally mixed in the AMS measurements. This would lead to an overestimation of the NCCN when the ambient particles tend to be externally mixed (Wang et al., 2010; Sánchez Gácita et al., 2017). However, the internal mixing assumption seems to play a minor role in predicting the NCCN at 0.1 % SS since the particles at about 140–180 nm tend to be internally mixed, as shown in Fig. 5. In this case, the κorg assumption and the pure water assumption played more important roles than the mixing state assumption at low SS (i.e., 0.1 % SS). Figure 11 shows significant underestimation of NCCN at 0.1 % SS (Fig. 11a, e, i, m), while more or less comparable to the measured NCCN at higher SS (i.e., 0.2 %, 0.4 %, 0.7 %). The difference between the κAMS and κCCN became smaller and the corresponding D50 value decreased with the increase of the SS so that the impacts of the κorg assumption and the pure water assumption became minor with the increase of the SS. Instead, the internal mixing state assumption would play a more important role in the prediction (Meng et al., 2014). As shown in Fig. 5, the peak height and area of the less-hygroscopic mode became larger for the smaller size particles (i.e., 40 nm particles), implying that small particles were likely to be externally mixed; that is, the non-hygroscopic or less hygroscopic species including BC and insoluble organics were less likely coated with inorganic salts. Hence, the internal mixing assumption could lead to an overestimated NCCN.
Table 5The overview of methods used in the NCCN prediction based on AMS measurements.
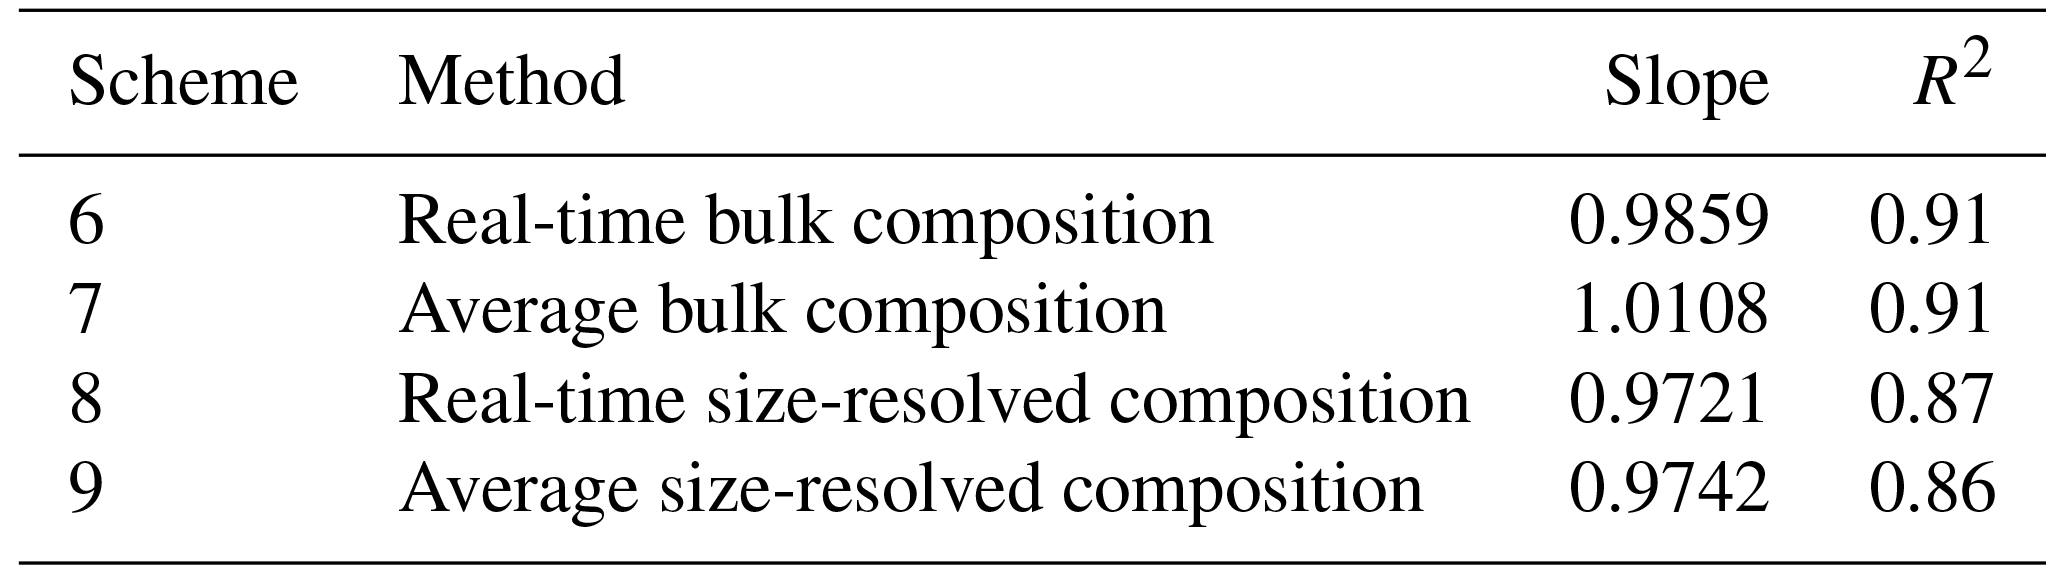
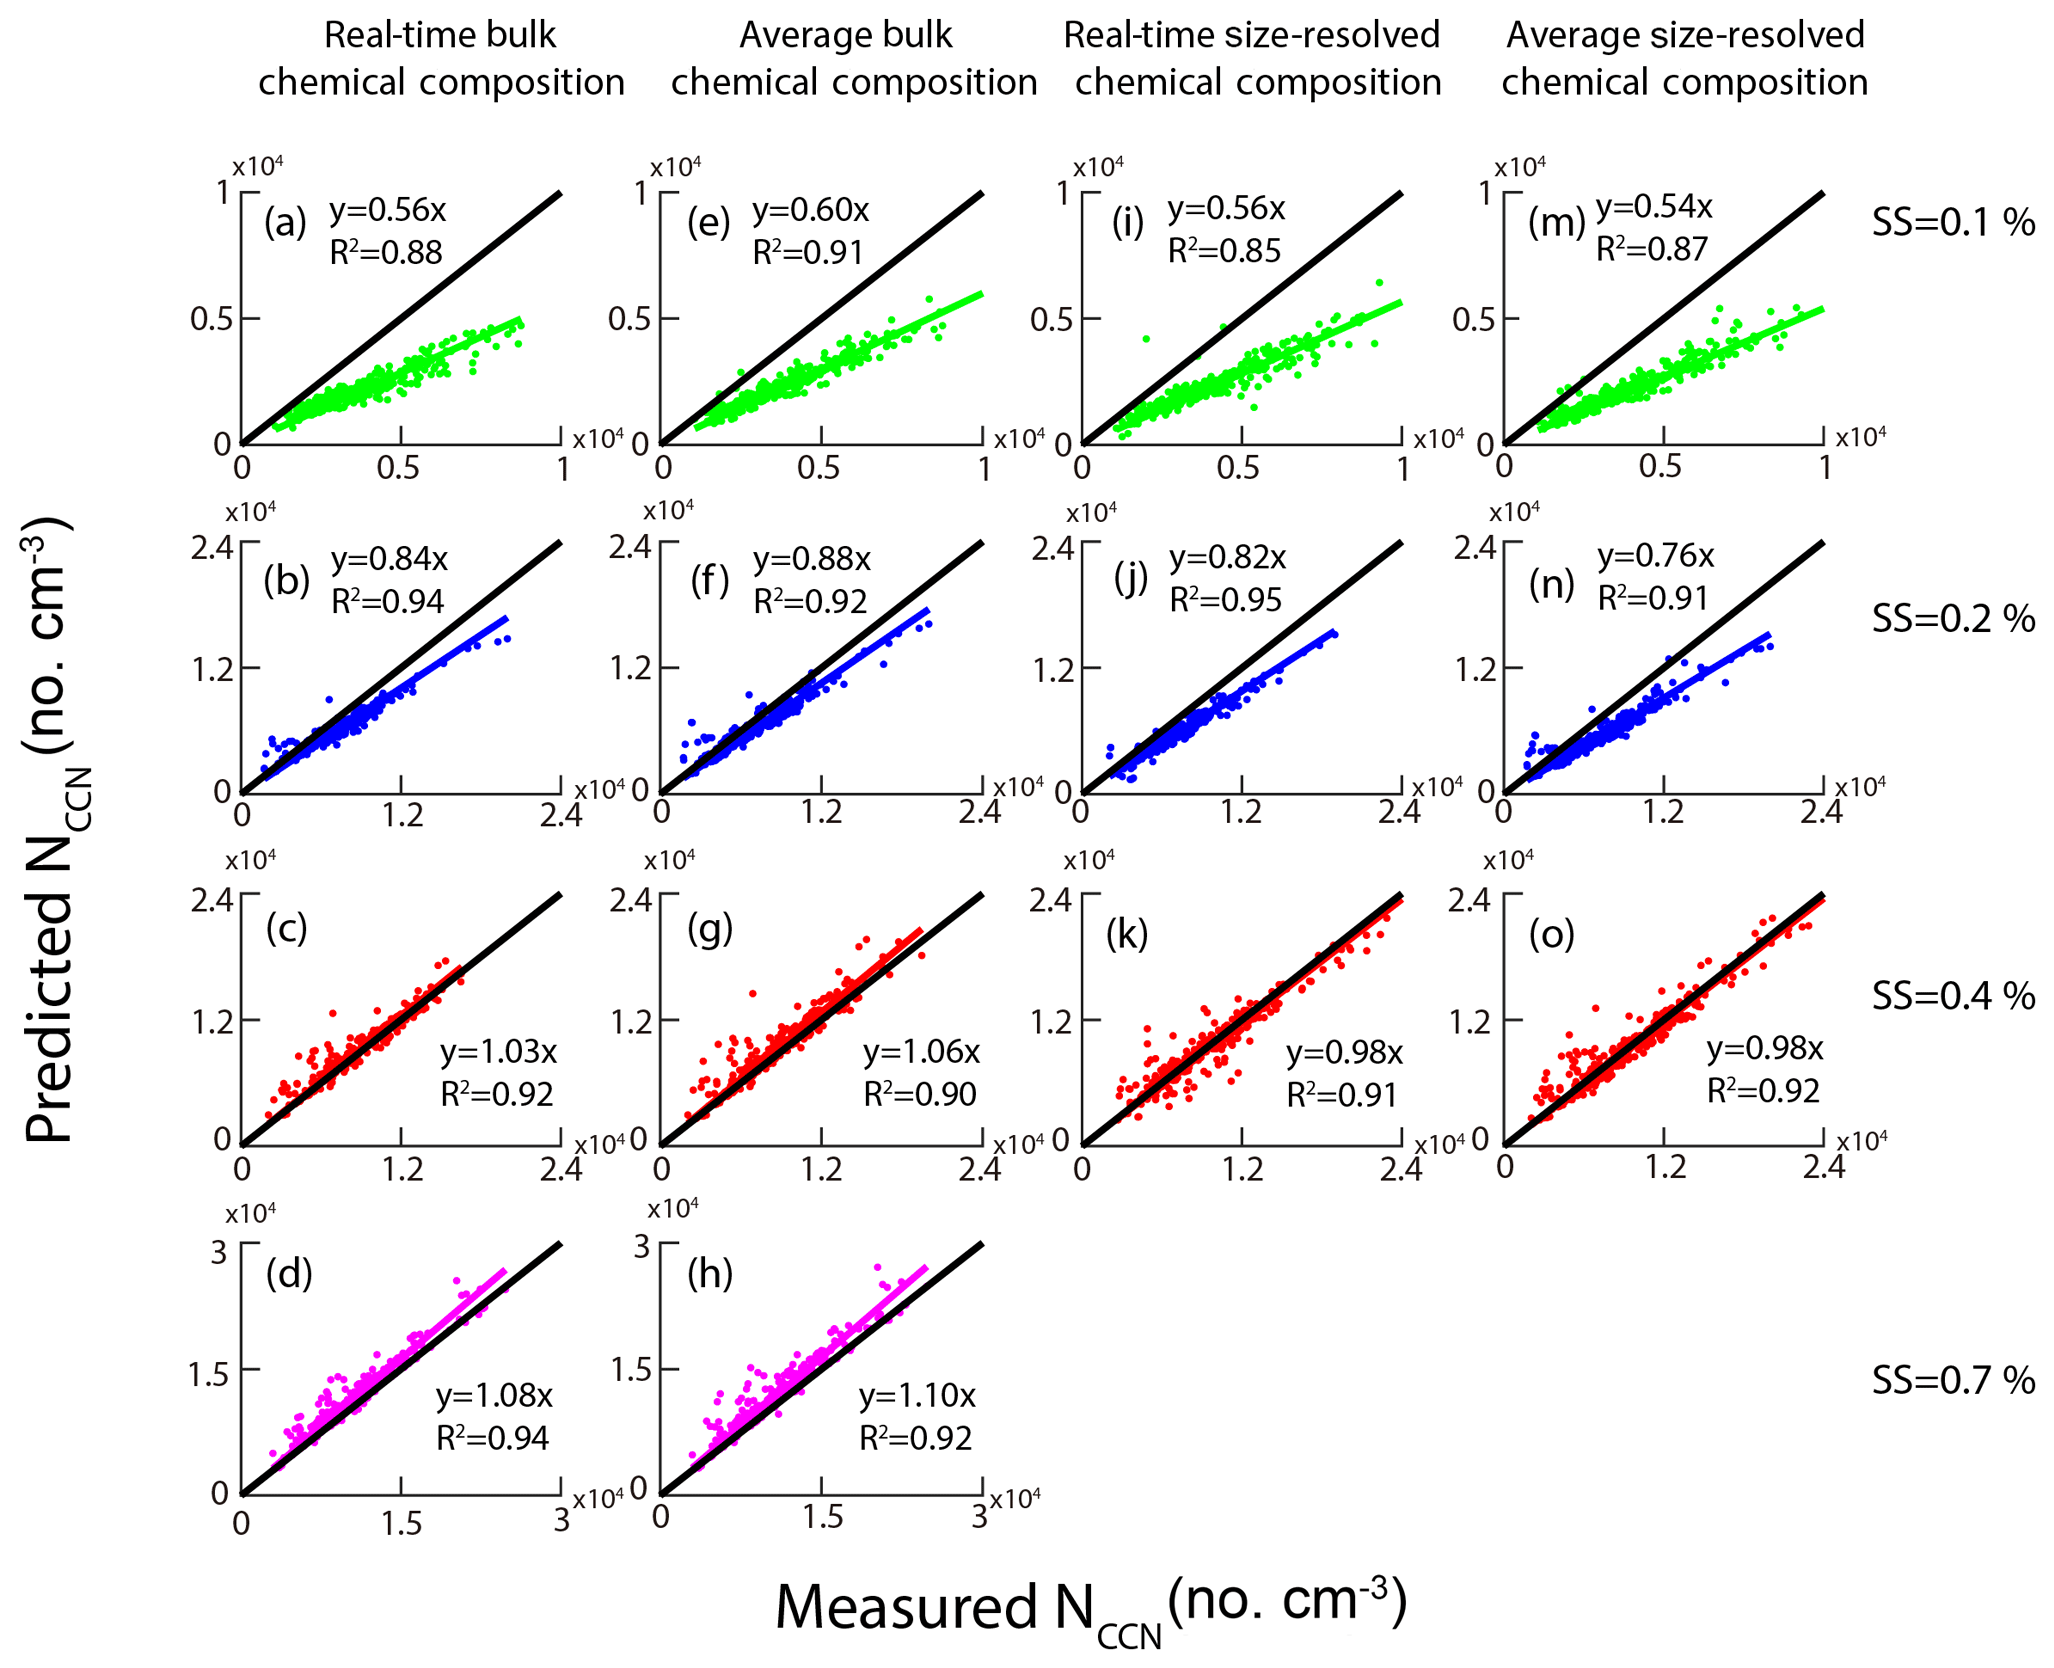
Figure 11The relationship between measured NCCN and predicted NCCN based on schemes 6, 7, 8, and 9. The black lines represent 1:1 lines.
As discussed above, the two important parameters (κorg and σs∕a) had significant impacts on the NCCN prediction. We denoted and as important representations, respectively, for hygroscopicity and surface tension contributed from organics. We also pointed out that the κorg was dependent on the particle size, and hence here we further assumed the values to be 0.15 and 0.1, respectively, for particles larger and smaller than 100 nm. Note that we previously assumed the κorg to be 0.1 for all particle sizes. Here, we gave an example of the improvements at 0.1 % SS when the κorg and σs∕a values were, respectively, replaced with the and ones (Fig. 12). The κAMS value calculated at 0.1 % SS based on was 0.288, very close to the corresponding κCCN value (0.30), indicating that an improvement was made for the NCCN prediction when including the value. The NCCN prediction could be greatly improved when including both and in the calculation. For example, the underestimate of NCCN decreased from 44 % (Fig. 11a) to 4 % (Fig. 12b). In addition, we also investigated the effects of the σs∕a values in a range of 0.054 to 0.062 N m−1 as discussed in Sect. 3.2. The shadow area in Fig. 12b represents the variation of linear fit between the measured and predicted NCCN. An under- and overestimated value of 16 % ( slope of 0.84) and 8 % (slope of 1.08) was obtained for the predicted NCCN to the measured NCCN using a σs∕a value of 0.054 and 0.062 N m−1, respectively, indicating that the predicted NCCN agreed reasonably with the measured ones when the σs∕a values between 0.054 and 0.062 N m−1 were used in this study. We conclude that the predicted NCCN can agree better with the measured one when including both and in the calculation at low SS.
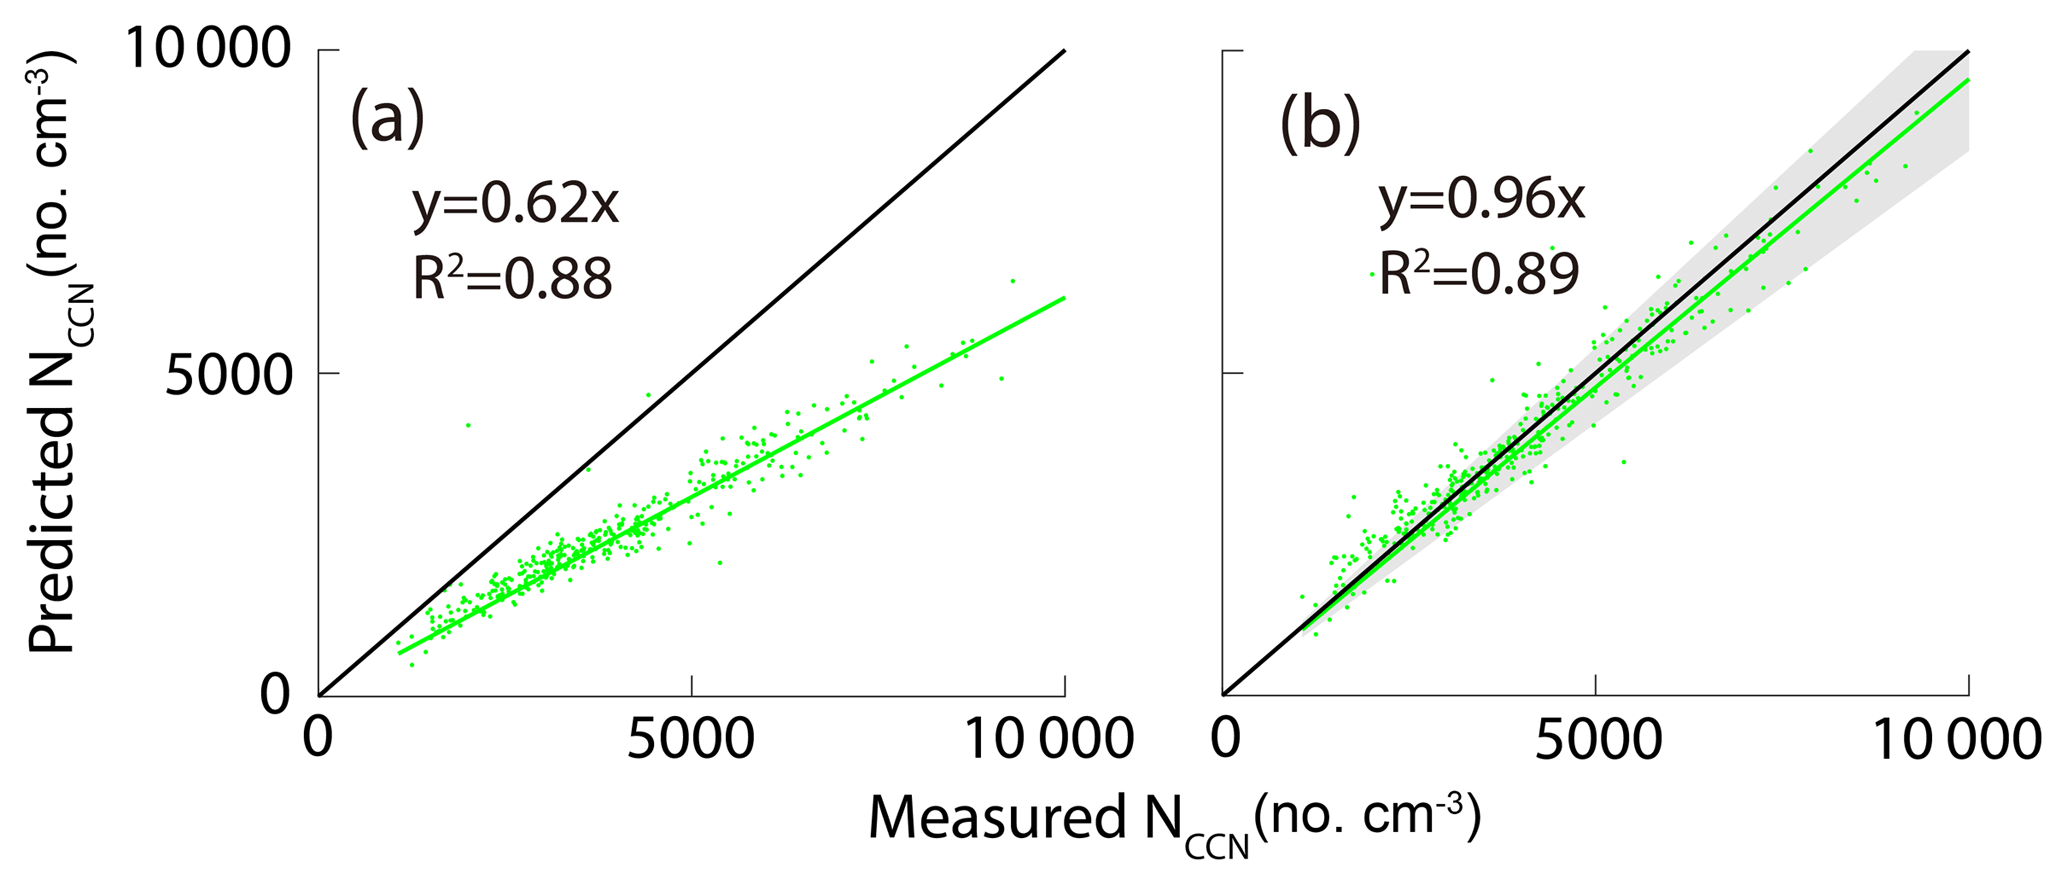
Figure 12The relationship between measured NCCN and predicted NCCN at SS 0.1 % based on size-resolved chemical composition using (a) and and (b). The shadow area represents the variation of the linear fit using the σs∕a values from 0.054 to 0.062 N m−1.
The CCN activity is an important parameter that determines the extent to which atmospheric particles can influence cloud formation. It is hence essential to predict CCN activity so that a quantitative assessment of atmospheric particles on cloud formation can be made. While numerous studies were performed to investigate the CCN activity under different atmospheric conditions around the world, only a few of them were made in the PRD region in China. In this study, several advanced instruments (i.e., the SMCA, AMS, and HTDMA) were used to, respectively, measure CCN activity, chemical composition, and hygroscopicity in PRD during wintertime 2014. A variety of schemes was proposed to determine the CCN activity based on the measurements. Here, two important properties were considered when evaluating the CCN activity: the hygroscopic parameter κ and the surface tension of the particles. Three methods (i.e., the SMCA, the AMS plus ZSR, and the HTDMA) were employed to calculate the κ values based on our measurements. The results show that the deviation between κAMS and κCCN became larger at low supersaturation ratios, indicating that the organic components in larger size particles were more aged and hygroscopic. The activation curve became smoother at the low SS, which could be partly attributed to the higher heterogeneity of chemical composition for larger particles. In general, the Gf-PDF measured by the HTDMA exhibited a bimodal distribution with a less-hygroscopic mode and a more-hygroscopic mode. The less-hygroscopic mode was more significant at smaller diameters, indicating a more external mixing for smaller particles, while the more-hygroscopic mode increased with diameter and became broader, implying higher hygroscopicity and more complex chemical composition for larger particles. The shapes of activation curve were related to the σ values of the Gf-PDF. The higher σ values suggest the higher heterogeneity of chemical composition and smooth activation curve. A κ value of 0.22–0.30 measured by the HTDMA was obtained for 40–200 nm particles in this study during the measurement period, larger than those previously measured in the PRD region, indicating an increasing mass fraction of nitrate in recent years.
Organic compounds could influence CCN activity through modifying the hygroscopicity and surface tension of the particles. The impacts of organics on CCN activity were also investigated in this study. The increase of organic mass fraction in the particles could lead to the decrease of the aerosol hygroscopicity and hence increase the D50, especially at low supersaturation. In addition, organics could decrease the surface tension σs∕a. This could lead to the underestimated CCN activity if the pure water solution is assumed when inverting the HTDMA data. We evaluated the impact of the surface tension on the activation ratios over a wide range of σs∕a values (0.03–0.07 N m−1) for several measured size particles (40, 80, 110, and 150 nm) and found that a σs∕a value of 0.058 N m−1 was the best fit between predicted AR and measured AR, which could then be used to predict the CCN activity in the PRD region. Based on the hygroscopicity and chemical composition measured in this study, we proposed several schemes to predict the CCN activity. Overall, the predicted NCCN agreed well with the measure one. The slope and R2 of NCCN predicted from average data were similar to the NCCN predicted from real-time data. The NCCN obtained from HTDMA measurement was underpredicted if the pure water assumption was used, and better agreement with the measured values can be achieved by using the adjusted σs∕a (i.e., N m−1). Similarly, the NCCN predicted from AMS measurement was underestimated at low supersaturations and overestimated at high supersaturations, due to an assumption of fixed 0.1 for κorg and the external mixing state. Better predicted CCN concentrations can be obtained by using and in the calculation, especially at low supersaturations. For high supersaturations, the effect of internal mixing assumption should be taken into consideration. We concluded that better agreement between predicted and measured CCN concentrations could be achieved by taking the effects of organics into account on the hygroscopicity, surface tension, and the mixing state of the particles. More work on the roles of organics in the CCN activity is obviously needed in order to better understand the impacts of atmospheric particles on cloud formation and hence climate.
The field observational and the lab experimental data used in this study are available from one of the corresponding authors (HT) upon request (Haobo Tan via hbtan@grmc.gov.cn).
The supplement related to this article is available online at: https://doi.org/10.5194/acp-18-16419-2018-supplement.
MC, HT, and JZ designed the research; MC, HT, CC, YQ, HX, FL, MS, and LL performed the field work. MC, HT, and JZ analyzed the data; MC, HT, and JZ wrote the paper.
The authors declare that they have no conflict of interest.
This article is part of the special issue “Multiphase chemistry of secondary aerosol formation under severe haze”. It is not associated with a conference.
The authors acknowledge the support from the following funding agencies:
National Key R&D Program of China
(2016YFC0201901, 2017YFC0209500, 2016YFC2003305), National Natural Science
Foundation of China (NSFC) (91644225, 21577177, 41775117), and Guangdong
provincial scientific planning project (2014A020216008, 2016B050502005).
Jun Zhao also acknowledges the funding from the “111 Plan” Project of China
(grant B17049).
Edited by: Hang Su
Reviewed by: three anonymous referees
Ahn, W. S., Shin, K. C., and Chang, S.: The effect of curvature dependency correction for the surface tension on the result of pore distribution analysis, J. Colloid Interf. Sci., 51, 232–238, https://doi.org/10.1016/0021-9797(75)90108-3, 1975.
Asa-Awuku, A., Engelhart, G. J., Lee, B. H., Pandis, S. N., and Nenes, A.: Relating CCN activity, volatility, and droplet growth kinetics of β-caryophyllene secondary organic aerosol, Atmos. Chem. Phys., 9, 795–812, https://doi.org/10.5194/acp-9-795-2009, 2009.
Bogdan, A.: Thermodynamics of the curvature effect on ice surface tension and nucleation theory, J. Chem. Phys., 106, 1921–1929, 1997.
Cai, M., Tan, H., Chan, C. K., Mochida, M., Hatakeyama, S., Kondo, Y., Schurman, M. I., Xu, H., Li, F., and Shimada, K.: Comparison of Aerosol Hygroscopcity, Volatility, and Chemical Composition between a Suburban Site in the Pearl River Delta Region and a Marine Site in Okinawa, Aerosol Air Qual. Res., 17, 3194–3208, 2017.
Cao, G., Zhang, X., Wang, Y., and Zheng, F.: Estimation of emissions from field burning of crop straw in China, Chinese Sci. Bull., 53, 784–790, 2008.
Cerully, K. M., Raatikainen, T., Lance, S., Tkacik, D., Tiitta, P., Petäjä, T., Ehn, M., Kulmala, M., Worsnop, D. R., Laaksonen, A., Smith, J. N., and Nenes, A.: Aerosol hygroscopicity and CCN activation kinetics in a boreal forest environment during the 2007 EUCAARI campaign, Atmos. Chem. Phys., 11, 12369–12386, https://doi.org/10.5194/acp-11-12369-2011, 2011.
Chan, M. N., Kreidenweis, S. M., and Chan, C. K.: Measurements of the hygroscopic and deliquescence properties of organic compounds of different solubilities in water and their relationship with cloud condensation nuclei activities, Environ. Sci. Technol., 42, 3602–3608, 2008.
Chang, R. Y.-W., Slowik, J. G., Shantz, N. C., Vlasenko, A., Liggio, J., Sjostedt, S. J., Leaitch, W. R., and Abbatt, J. P. D.: The hygroscopicity parameter (κ) of ambient organic aerosol at a field site subject to biogenic and anthropogenic influences: relationship to degree of aerosol oxidation, Atmos. Chem. Phys., 10, 5047–5064, https://doi.org/10.5194/acp-10-5047-2010, 2010.
Cheung, H., Yeung, M., Li, Y., Lee, B., and Chan, C.: Relative Humidity-Dependent HTDMA Measurements of Ambient Aerosols at the HKUST Supersite in Hong Kong, China, Aerosol Sci. Technol., 49, 643–654, https://doi.org/10.1080/02786826.2015.1058482, 2015.
DeCarlo, P. F., Slowik, J. G., Worsnop, D. R., Davidovits, P., and Jimenez, J. L.: Particle Morphology and Density Characterization by Combined Mobility and Aerodynamic Diameter Measurements. Part 1: Theory, Aerosol Sci. Technol., 38, 1206–1222, 2004.
DeCarlo, P. F., Kimmel, J. R., Achim, T., Northway, M. J., Jayne, J. T., Aiken, A. C., Marc, G., Katrin, F., Thomas, H., and Docherty, K. S.: Field-deployable, high-resolution, time-of-flight aerosol mass spectrometer, Anal. Chem., 78, 8281–8289, 2006.
Deng, Z. Z., Zhao, C. S., Ma, N., Liu, P. F., Ran, L., Xu, W. Y., Chen, J., Liang, Z., Liang, S., Huang, M. Y., Ma, X. C., Zhang, Q., Quan, J. N., Yan, P., Henning, S., Mildenberger, K., Sommerhage, E., Schäfer, M., Stratmann, F., and Wiedensohler, A.: Size-resolved and bulk activation properties of aerosols in the North China Plain, Atmos. Chem. Phys., 11, 3835–3846, https://doi.org/10.5194/acp-11-3835-2011, 2011.
Engelhart, G. J., Asa-Awuku, A., Nenes, A., and Pandis, S. N.: CCN activity and droplet growth kinetics of fresh and aged monoterpene secondary organic aerosol, Atmos. Chem. Phys., 8, 3937–3949, https://doi.org/10.5194/acp-8-3937-2008, 2008.
Farmer, D. K., Cappa, C. D., and Kreidenweis, S. M.: Atmospheric Processes and Their Controlling Influence on Cloud Condensation Nuclei Activity, Chem. Rev., 115, 4199–4217, https://doi.org/10.1021/cr5006292, 2015.
Good, N., Topping, D. O., Allan, J. D., Flynn, M., Fuentes, E., Irwin, M., Williams, P. I., Coe, H., and McFiggans, G.: Consistency between parameterisations of aerosol hygroscopicity and CCN activity during the RHaMBLe discovery cruise, Atmos. Chem. Phys., 10, 3189–3203, https://doi.org/10.5194/acp-10-3189-2010, 2010.
Gysel, M., Crosier, J., Topping, D. O., Whitehead, J. D., Bower, K. N., Cubison, M. J., Williams, P. I., Flynn, M. J., McFiggans, G. B., and Coe, H.: Closure study between chemical composition and hygroscopic growth of aerosol particles during TORCH2, Atmos. Chem. Phys., 7, 6131–6144, https://doi.org/10.5194/acp-7-6131-2007, 2007.
Gysel, M., McFiggans, G. B., and Coe, H.: Inversion of tandem differential mobility analyser (TDMA) measurements, J. Aerosol Sci., 40, 134–151, 2009.
Hansen, A. M. K., Hong, J., Raatikainen, T., Kristensen, K., Ylisirniö, A., Virtanen, A., Petäjä, T., Glasius, M., and Prisle, N. L.: Hygroscopic properties and cloud condensation nuclei activation of limonene-derived organosulfates and their mixtures with ammonium sulfate, Atmos. Chem. Phys., 15, 14071–14089, https://doi.org/10.5194/acp-15-14071-2015, 2015.
Hong, J., Häkkinen, S. A. K., Paramonov, M., äijälä, M., Hakala, J., Nieminen, T., Mikkilä, J., Prisle, N. L., Kulmala, M., Riipinen, I., Bilde, M., Kerminen, V.-M., and Petäjä, T.: Hygroscopicity, CCN and volatility properties of submicron atmospheric aerosol in a boreal forest environment during the summer of 2010, Atmos. Chem. Phys., 14, 4733–4748, https://doi.org/10.5194/acp-14-4733-2014, 2014.
Itahashi, S., Yumimoto, K., Uno, I., Hayami, H., Fujita, S.-I., Pan, Y., and Wang, Y.: A 15-year record (2001–2015) of the ratio of nitrate to non-sea-salt sulfate in precipitation over East Asia, Atmos. Chem. Phys., 18, 2835–2852, https://doi.org/10.5194/acp-18-2835-2018, 2018.
Jiang, R., Tan, H., Tang, L., Cai, M., Yin, Y., Li, F., Liu, L., Xu, H., Chan, P. W., and Deng, X.: Comparison of aerosol hygroscopicity and mixing state between winter and summer seasons in Pearl River Delta region, China, Atmos. Res., 169, 160–170, 2016.
Jimenez, J. L., Jayne, J. T., Shi, Q., Kolb, C. E., Worsnop, D. R., Yourshaw, I., Seinfeld, J. H., Flagan, R. C., Zhang, X., and Smith, K. A.: Ambient aerosol sampling using the aerodyne aerosol mass spectrometer, J. Geophys. Res.-Atmos., 108, 8425–8438, https://doi.org/10.1029/2001JD001213, 2003.
Kammermann, L., Gysel, M., Weingartner, E., Herich, H., Cziczo, D. J., Holst, T., Svenningsson, B., Arneth, A., and Baltensperger, U.: Subarctic atmospheric aerosol composition: 3. Measured and modeled properties of cloud condensation nuclei, J. Geophys. Res.-Atmos., 115, D04202, https://doi.org/10.1029/2009JD012447, 2010.
Köhler, H.: The nucleus in and the growth of hygroscopic droplets, T. Faraday Soc., 32, 1152–1161, 1936.
Lambe, A. T., Onasch, T. B., Massoli, P., Croasdale, D. R., Wright, J. P., Ahern, A. T., Williams, L. R., Worsnop, D. R., Brune, W. H., and Davidovits, P.: Laboratory studies of the chemical composition and cloud condensation nuclei (CCN) activity of secondary organic aerosol (SOA) and oxidized primary organic aerosol (OPOA), Atmos. Chem. Phys., 11, 8913–8928, https://doi.org/10.5194/acp-11-8913-2011, 2011.
Lance, S., Raatikainen, T., Onasch, T. B., Worsnop, D. R., Yu, X.-Y., Alexander, M. L., Stolzenburg, M. R., McMurry, P. H., Smith, J. N., and Nenes, A.: Aerosol mixing state, hygroscopic growth and cloud activation efficiency during MIRAGE 2006, Atmos. Chem. Phys., 13, 5049–5062, https://doi.org/10.5194/acp-13-5049-2013, 2013.
Lee, B. P., Li, Y. J., Yu, J. Z., Louie, P. K., and Chan, C. K.: Physical and chemical characterization of ambient aerosol by HR-ToF-AMS at a suburban site in Hong Kong during springtime 2011, J. Geophys. Res.-Atmos., 118, 8625–8639, 2013.
Liu, H. J., Zhao, C. S., Nekat, B., Ma, N., Wiedensohler, A., van Pinxteren, D., Spindler, G., Müller, K., and Herrmann, H.: Aerosol hygroscopicity derived from size-segregated chemical composition and its parameterization in the North China Plain, Atmos. Chem. Phys., 14, 2525–2539, https://doi.org/10.5194/acp-14-2525-2014, 2014.
Liu, P. F., Zhao, C. S., Göbel, T., Hallbauer, E., Nowak, A., Ran, L., Xu, W. Y., Deng, Z. Z., Ma, N., Mildenberger, K., Henning, S., Stratmann, F., and Wiedensohler, A.: Hygroscopic properties of aerosol particles at high relative humidity and their diurnal variations in the North China Plain, Atmos. Chem. Phys., 11, 3479–3494, https://doi.org/10.5194/acp-11-3479-2011, 2011.
Massoli, P., Lambe, A., Ahern, A., Williams, L., Ehn, M., Mikkilä, J., Canagaratna, M., Brune, W., Onasch, T., and Jayne, J.: Relationship between aerosol oxidation level and hygroscopic properties of laboratory generated secondary organic aerosol (SOA) particles, Geophys. Res. Lett., 37, L24801, https://doi.org/10.1029/2010GL045258, 2010.
Mei, F., Setyan, A., Zhang, Q., and Wang, J.: CCN activity of organic aerosols observed downwind of urban emissions during CARES, Atmos. Chem. Phys., 13, 12155–12169, https://doi.org/10.5194/acp-13-12155-2013, 2013.
Meng, J. W., Yeung, M. C., Li, Y. J., Lee, B. Y. L., and Chan, C. K.: Size-resolved cloud condensation nuclei (CCN) activity and closure analysis at the HKUST Supersite in Hong Kong, Atmos. Chem. Phys., 14, 10267–10282, https://doi.org/10.5194/acp-14-10267-2014, 2014.
Mochida, M., Nishita-Hara, C., Kitamori, Y., Aggarwal, S. G., Kawamura, K., Miura, K., and Takami, A.: Size-segregated measurements of cloud condensation nucleus activity and hygroscopic growth for aerosols at Cape Hedo, Japan, in spring 2008, J. Geophys. Res.-Atmos., 115, D21207, https://doi.org/10.1029/2009JD013216, 2010.
Moore, R., Ingall, E., Sorooshian, A., and Nenes, A.: Molar mass, surface tension, and droplet growth kinetics of marine organics from measurements of CCN activity, Geophys. Res. Lett., 35, L07801, https://doi.org/10.1029/2008GL033350, 2008.
Moore, R., Nenes, A., and Medina, J.: Scanning Mobility CCN Analysis – A Method for Fast Measurements of Size-Resolved CCN Distributions and Activation Kinetics, Aerosol Sci. Tech., 44, 861–871, 2010.
Moore, R., Cerully, K., Bahreini, R., Brock, C., Middlebrook, A., and Nenes, A.: Hygroscopicity and composition of California CCN during summer 2010, J. Geophys. Res.-Atmos., 117, D00V12, https://doi.org/10.1029/2011JD017352, 2012.
Moore, R. H., Bahreini, R., Brock, C. A., Froyd, K. D., Cozic, J., Holloway, J. S., Middlebrook, A. M., Murphy, D. M., and Nenes, A.: Hygroscopicity and composition of Alaskan Arctic CCN during April 2008, Atmos. Chem. Phys., 11, 11807–11825, https://doi.org/10.5194/acp-11-11807-2011, 2011.
Ovadnevaite, J., Zuend, A., Laaksonen, A., Sanchez, K. J., Roberts, G., Ceburnis, D., Decesari, S., Rinaldi, M., Hodas, N., Facchini, M. C., Seinfeld, J. H., and O'Dowd, C.: Surface tension prevails over solute effect in organic-influenced cloud droplet activation, Nature, 546, 637–641, 2017.
Pajunoja, A., Lambe, A. T., Hakala, J., Rastak, N., Cummings, M. J., Brogan, J. F., Hao, L., Paramonov, M., Hong, J., and Prisle, N. L.: Adsorptive uptake of water by semisolid secondary organic aerosols, Geophys. Res. Lett. 42, 3063–3068, 2015.
Petters, M. D. and Kreidenweis, S. M.: A single parameter representation of hygroscopic growth and cloud condensation nucleus activity, Atmos. Chem. Phys., 7, 1961–1971, https://doi.org/10.5194/acp-7-1961-2007, 2007.
Petters, M. D. and Kreidenweis, S. M.: A single parameter representation of hygroscopic growth and cloud condensation nucleus activity – Part 3: Including surfactant partitioning, Atmos. Chem. Phys., 13, 1081–1091, https://doi.org/10.5194/acp-13-1081-2013, 2013.
Petters, M. D., Wex, H., Carrico, C. M., Hallbauer, E., Massling, A., McMeeking, G. R., Poulain, L., Wu, Z., Kreidenweis, S. M., and Stratmann, F.: Towards closing the gap between hygroscopic growth and activation for secondary organic aerosol – Part 2: Theoretical approaches, Atmos. Chem. Phys., 9, 3999–4009, https://doi.org/10.5194/acp-9-3999-2009, 2009.
Qin, Y. M., Tan, H. B., Li, Y. J., Schurman, M. I., Li, F., Canonaco, F., Prévôt, A. S. H., and Chan, C. K.: Impacts of traffic emissions on atmospheric particulate nitrate and organics at a downwind site on the periphery of Guangzhou, China, Atmos. Chem. Phys., 17, 10245–10258, https://doi.org/10.5194/acp-17-10245-2017, 2017.
Rose, D., Gunthe, S. S., Mikhailov, E., Frank, G. P., Dusek, U., Andreae, M. O., and Pöschl, U.: Calibration and measurement uncertainties of a continuous-flow cloud condensation nuclei counter (DMT-CCNC): CCN activation of ammonium sulfate and sodium chloride aerosol particles in theory and experiment, Atmos. Chem. Phys., 8, 1153–1179, https://doi.org/10.5194/acp-8-1153-2008, 2008.
Rose, D., Nowak, A., Achtert, P., Wiedensohler, A., Hu, M., Shao, M., Zhang, Y., Andreae, M. O., and Pöschl, U.: Cloud condensation nuclei in polluted air and biomass burning smoke near the mega-city Guangzhou, China – Part 1: Size-resolved measurements and implications for the modeling of aerosol particle hygroscopicity and CCN activity, Atmos. Chem. Phys., 10, 3365–3383, https://doi.org/10.5194/acp-10-3365-2010, 2010.
Sánchez Gácita, M., Longo, K. M., Freire, J. L. M., Freitas, S. R., and Martin, S. T.: Impact of mixing state and hygroscopicity on CCN activity of biomass burning aerosol in Amazonia, Atmos. Chem. Phys., 17, 2373–2392, https://doi.org/10.5194/acp-17-2373-2017, 2017.
Salma, I., Ocskay, R., Varga, I., and Maenhaut, W.: Surface tension of atmospheric humic-like substances in connection with relaxation, dilution, and solution pH, J. Geophys. Res.-Atmos., 111, D23205, https://doi.org/10.1029/2005JD007015, 2006.
Schurman, M. I., Kim, J. Y., Cheung, H. H. Y., and Chan, C. K.: Atmospheric particle composition-hygroscopic growth measurements using an in-series hybrid tandem differential mobility analyzer and aerosol mass spectrometer, Aerosol Sci. Tech., 51, 694–703, 2017.
Seinfeld, J. H. and Pandis, S. N.: Atmospheric chemistry and physics-from air pollution to climate change, Wiley Interscience, 2nd Edn., 1232 pp., 2006.
Sjogren, S., Gysel, M., Weingartner, E., Alfarra, M. R., Duplissy, J., Cozic, J., Crosier, J., Coe, H., and Baltensperger, U.: Hygroscopicity of the submicrometer aerosol at the high-alpine site Jungfraujoch, 3580 m a.s.l., Switzerland, Atmos. Chem. Phys., 8, 5715–5729, https://doi.org/10.5194/acp-8-5715-2008, 2008.
Sorjamaa, R., Svenningsson, B., Raatikainen, T., Henning, S., Bilde, M., and Laaksonen, A.: The role of surfactants in Köhler theory reconsidered, Atmos. Chem. Phys., 4, 2107–2117, https://doi.org/10.5194/acp-4-2107-2004, 2004.
Stocker, D. Q.: Climate change 2013: The physical science basis, Working Group I Contribution to the Fifth Assessment Report of the Intergovernmental Panel on Climate Change, Summary for Policymakers, IPCC, 2013.
Stokes, R. and Robinson, R.: Interactions in aqueous nonelectrolyte solutions. I. Solute-solvent equilibria, J. Phys. Chem., 70, 2126–2131, 1966.
Stolzenburg, M. R. and McMurry, P. H.: Equations Governing Single and Tandem DMA Configurations and a New Lognormal Approximation to the Transfer Function, Aerosol Sci. Tech., 42, 421–432, 2008.
Tan, H., Xu, H., Wan, Q., Li, F., Deng, X., Chan, P. W., Xia, D., and Yin, Y.: Design and Application of an Unattended Multifunctional H-TDMA System, J. Atmos. Ocean. Tech., 30, 1136–1148, 2013a.
Tan, H., Yin, Y., Gu, X., Li, F., Chan, P. W., Xu, H., Deng, X., and Wan, Q.: An observational study of the hygroscopic properties of aerosols over the Pearl River Delta region, Atmos. Environ., 77, 817–826, 2013b.
Tan, H., Yin, Y., Li, F., Liu, X., Chan, P. W., Deng, T., Deng, X., Wan, Q. and Wu, D.: Measurements of particle number size distributions and new particle formation events during winter in the pearl river delta region, China, J. Trop. Meteorol., 22, 191–199, 2016.
Topping, D. O., McFiggans, G. B., and Coe, H.: A curved multi-component aerosol hygroscopicity model framework: Part 1 – Inorganic compounds, Atmos. Chem. Phys., 5, 1205–1222, https://doi.org/10.5194/acp-5-1205-2005, 2005.
Tritscher, T., Dommen, J., DeCarlo, P. F., Gysel, M., Barmet, P. B., Praplan, A. P., Weingartner, E., Prévôt, A. S. H., Riipinen, I., Donahue, N. M., and Baltensperger, U.: Volatility and hygroscopicity of aging secondary organic aerosol in a smog chamber, Atmos. Chem. Phys., 11, 11477–11496, https://doi.org/10.5194/acp-11-11477-2011, 2011.
Väisänen, O., Ruuskanen, A., Ylisirniö, A., Miettinen, P., Portin, H., Hao, L., Leskinen, A., Komppula, M., Romakkaniemi, S., Lehtinen, K. E. J., and Virtanen, A.: In-cloud measurements highlight the role of aerosol hygroscopicity in cloud droplet formation, Atmos. Chem. Phys., 16, 10385–10398, https://doi.org/10.5194/acp-16-10385-2016, 2016.
Wang, J., Cubison, M. J., Aiken, A. C., Jimenez, J. L., and Collins, D. R.: The importance of aerosol mixing state and size-resolved composition on CCN concentration and the variation of the importance with atmospheric aging of aerosols, Atmos. Chem. Phys., 10, 7267–7283, https://doi.org/10.5194/acp-10-7267-2010, 2010.
Wang, Z., Cheng, Y., Ma, N., Mikhailov, E., Pöschl, U., and Su, H.: Dependence of the hygroscopicity parameter κ on particle size, humidity and solute concentration: implications for laboratory experiments, field measurements and model studies, Atmos. Chem. Phys. Discuss., https://doi.org/10.5194/acp-2017-253, in review, 2017.
Wu, Z. J., Poulain, L., Henning, S., Dieckmann, K., Birmili, W., Merkel, M., van Pinxteren, D., Spindler, G., Müller, K., Stratmann, F., Herrmann, H., and Wiedensohler, A.: Relating particle hygroscopicity and CCN activity to chemical composition during the HCCT-2010 field campaign, Atmos. Chem. Phys., 13, 7983–7996, https://doi.org/10.5194/acp-13-7983-2013, 2013.
Zdanovskii, A.: New methods for calculating solubilities of electrolytes in multicomponent systems, Zhur. Fiz. Khim., 22, 1475–1485, 1948.
Zhang, X. Y., Wang, J. Z., Wang, Y. Q., Liu, H. L., Sun, J. Y., and Zhang, Y. M.: Changes in chemical components of aerosol particles in different haze regions in China from 2006 to 2013 and contribution of meteorological factors, Atmos. Chem. Phys., 15, 12935–12952, https://doi.org/10.5194/acp-15-12935-2015, 2015.
Zhao, D. F., Buchholz, A., Kortner, B., Schlag, P., Rubach, F., Kiendler-Scharr, A., Tillmann, R., Wahner, A., Flores, J. M., Rudich, Y., Watne, Å. K., Hallquist, M., Wildt, J., and Mentel, Th. F.: Size-dependent hygroscopicity parameter (κ) and chemical composition of secondary organic cloud condensation nuclei, Geophys. Res. Lett., 42, 10920–10928, 2015.