the Creative Commons Attribution 4.0 License.
the Creative Commons Attribution 4.0 License.
 | 19 Nov 2018
Transport, mixing and feedback of dust, biomass burning and anthropogenic pollutants in eastern Asia: a case study
Derong Zhou
Ke Ding
Lixia Liu
Qiang Liu
Zhengning Xu
Fei Jiang
Congbin Fu
Anthropogenic fossil fuel (FF) combustion, biomass burning (BB) and desert dust are the main sources of air pollutants around the globe but are particularly intensive and important for air quality in Asia in spring. In this study, we investigate the vertical distribution, transport characteristics, source contribution and meteorological feedback of these aerosols in a unique pollution episode that occurred in eastern Asia based on various measurement data and modeling methods. In this episode, the Yangtze River Delta (YRD) in eastern China experienced persistent air pollution, dramatically changing from secondary fine particulate pollution to dust pollution in late March 2015. The Eulerian and Lagrangian models were conducted to investigate the vertical structure, transport characteristics and mechanisms of the multi-scale, multisource and multiday air pollution episode. The regional polluted continental aerosols mainly accumulated near the surface, mixed with dust aerosol downwash from the upper planetary boundary layer (PBL) and middle–lower troposphere (MLT), and further transported by large-scale cold fronts and warm conveyor belts. BB smoke from Southeast Asia was transported by westerlies around the altitude of 3 km from southern China, was further mixed with dust and FF aerosols in eastern China and experienced long-range transport over the Pacific. These pollutants could all be transported to the YRD region and cause a structure of multilayer pollution there. These pollutants could also cause significant feedback with MLT meteorology and then enhance local anthropogenic pollution. This study highlights the importance of intensive vertical measurement in eastern China and the downwind Pacific Ocean and raises the need for quantitative understanding of environmental and climate impacts of these pollution sources.


With rapid economic development and tremendous energy consumption in the past decades, East Asia, especially eastern China, has experienced increasingly severe air pollution (Zhang et al., 2012; van Donkelaar et al., 2010; Ding et al., 2016). Air pollution in this region is very complicated because of not only dense and intense anthropogenic activities, but also multiple natural pollution sources (like windblown dust, biomass burning (BB) and biogenic emissions) and a complex monsoon climate. The unique monsoon climate and strong human perturbations jointly make East Asia one of the important regions for studying the interactions between atmospheric physical and chemical processes of mixed pollutants (Ding et al., 2017).
Dust is one of the most important aerosols influencing air quality and regional climate in East Asia and even other continents (Huang et al., 2014; Nie et al., 2014). In cold seasons, especially in spring, dust could be transported from the inner Asian continent, such as the Taklimakan and Gobi deserts, and pass over eastern China to the Pacific and even North America (Zhang et al., 2010; Liu et al., 2016). These dust aerosols are usually mixed with anthropogenic pollutants along their transport pathways (Mori et al., 2003; Huang et al., 2010; Nie et al., 2014; Huang et al., 2014), resulting in complex interactions between physical and chemical processes and even meteorological feedbacks (Nie et al., 2014; Xie et al., 2015; Cheng et al., 2016; Liu et al., 2016; Yang et al., 2017). Based on field measurement at a mountain site in southern China and the Station for Observing Regional Processes of the Earth System (SORPES) in eastern China, respectively, Nie et al. (2014) and Xie et al. (2015) reported that the mixed dust and anthropogenic pollutants promoted new particle formation and growth via heterogeneous photochemical chemistry. These newly formed aerosols, particularly sulfate particles, could further influence cloud condensation nuclei (CCN) over the downwind regions (Nie et al., 2014). Dust aerosols and anthropogenic black carbon aerosols (soot) could influence the dynamics of the planetary boundary layer (PBL) through radiative perturbations and subsequent impacts on energy balance of the Earth–atmosphere system (Ding et al., 2016; Liu et al., 2016; Petäjä et al., 2016; Yang et al., 2017).
The mixing of soot or dust with scattering aerosol components has strong direct and indirect impacts on radiation transfer (Li et al., 2011; Wu et al., 2016). The thermal effects on the dynamics in the lower troposphere could in turn influence the dispersion and accumulation of air pollutants in megacities, which further influence the vertical distribution of air pollutants (Ding et al., 2016, 2017; Yang et al., 2017; Huang et al., 2018). Therefore, studying the transport, mixing and feedback processes and mechanisms of dust and anthropogenic pollutants is very important for deepening current understandings of air pollution and its interactions with regional climate in East Asia. In early spring, strong continental outflow of BB smoke particles and gases from mainland Southeast Asia also play an important role in increasing the peak values of trace gases in the middle–lower troposphere (MLT) of eastern China (Hsu et al., 2003; Jacob et al., 2003; Zhou et al., 2013; Dong and Fu, 2015; Cohen et al., 2017). BB plumes from mainland Southeast Asia could be transported up the terrain through the westerlies to southeast China and even to the Pacific Ocean (Jacob et al., 2003; Reid et al., 2013; Lin et al., 2014). The long-range transported plumes not only affected air quality at the ground surface in the downwind regions, but also at the same time the uplifted plumes in the MLT could also change the structure of atmospheric components and meteorological parameters over the downwind areas in lower latitudes and the northwestern Pacific in the east (Gong et al., 2014; Cohen et al., 2017).
In Asia, the cyclones and fronts are the most dominant synoptic weather to loft air pollutants from the PBL to MLT (Liu et al., 2003; Cooper et al., 2004; Ding et al., 2009, 2017), and this kind of synoptic weather is particularly frequent in spring (Chen et al., 1991; Jacob et al., 2003). A number of efforts have been conducted to observe the concentration and composition of mixed air pollutants in the MLT in Asia and to simulate the pathway of continental air masses (Jacob et al., 2003; Huebert et al., 2003; Liu et al., 2003; Hsu et al., 2003; Lee et al., 2014). However, most of the existing studies focused on the northwestern Pacific region, and less work has been conducted in the coastal region of eastern China, a transition region with intense regional pollution and ocean influence. As one of the largest city clusters in the world, the Yangtze River Delta (YRD) region is located at the most southern tip of the polluted northern and eastern plains in coastal eastern China. In spring, the YRD region is generally downwind of the plain area in the north, but also has intense anthropogenic emissions because of the huge amount of fossil fuel combustion (Ding et al., 2013a, b). The unique geographic location makes this region an ideal place to study the transport, mixing and feedback of dust and anthropogenic pollutants before they are transported over the Pacific. In this study, we integrated field measurements and numerical simulations for a unique case in March 2015 to investigate the mixing of Asian dust, BB and anthropogenic aerosols and their meteorological feedback in the MLT in eastern China. We describe the data and methods in Sect. 2 and then present the results of the observations and simulations of the dynamic structure and transport mechanisms for this case. We discuss the meteorological feedback and the environmental impacts of this case in Sect. 3. Finally, a summary is given in Sect. 4.
2.1 Data
To investigate the pollution characteristics and validate the model's performance, several sets of observational data were utilized in this study. The mass concentrations of PM2.5, PM10 and PM2.5–10 (with an aerodynamic diameter less than 2.5 and 10 µm and ranging from 2.5 to 10 µm, respectively) and hourly mass concentrations of inorganic ions (, , Cl−, , Na+, K+, Ca2+, Mg+) in PM2.5 were measured at a supersite in downtown Nanjing by the Jiangsu Key Laboratory of Environmental Engineering. Descriptions of the site and instrumentation were given in detail in Zhou et al. (2017). Meanwhile, aerosol optical depth (AOD) satellite retrievals by the Moderate Resolution Imaging Spectrometer (MODIS, MYD08_D3) were employed to illustrate the spatial patterns of aerosol. Moreover, hourly PM2.5 and PM10 concentration data were acquired through online access to ambient air monitoring data publicly released by the Ministry of Environmental Protection of the People's Republic of China (http://www.zhb.gov.cn/, last access: 1 May 2018) and were used to analyze the regional PM10 and PM2.5 characteristics and validate the corresponding simulations. In addition, the CALIPSO level 1 aerosol profiles and vertical features of the aerosol subtype were provided to investigate vertical distribution and transport of mixed aerosols in the MLT (Winker et al., 2009). Radiosonde observations from the Integrated Global Radiosonde Archive (IGRA), which are performed at 08:00 and 20:00 local time (LT; note that throughout this paper the time refers to LT, unless UTC is specifically mentioned), are collected and compared with NCEP (National Centers for Environmental Prediction) global final analysis (FNL) data to investigate meteorological responses to aerosols.
2.2 Numerical simulation
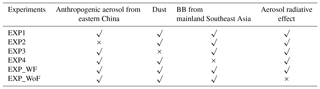
To investigate the vertical distribution and meteorology feedback of mixed air pollutants in the MLT, we conducted numerical simulations using the Weather Research and Forecasting model coupled with Chemistry (WRF-Chem), which is a three-dimensional Eulerian chemical transport model considering the feedback between meteorology and chemical processes (Grell et al., 2005). In this work, WRF-Chem version 3.6 was run in a domain with 186×162 grids and a horizontal resolution of 20 km. The model has 30 vertical layers extending from the ground surface to the 50 hPa pressure level, with a much higher density in the lower atmosphere. The initial and boundary conditions of meteorological fields were provided by the 6 h NCEP FNL data on 1×1 grids. The chemical initial and boundary conditions were MOZART-4 results acquired from the National Center for Atmospheric Research (NCAR). We adopted the Noah land-surface scheme, the Monin–Obukhov surface layer scheme (Alizadeh Choobari et al., 2012) and GOCART dust emission module (Ginoux et al., 2001) in this study. The simulations were run from 11 to 26 March 2015, with the first 8-day simulation as spin-up. We performed two groups of simulations. The first group aims to discuss the distribution and sources of the three layers of mixed pollutants in the MLT over eastern China, based on four parallel experiments (Table 1): (1) with all emissions (EXP1), (2) no anthropogenic emissions from eastern China (EXP2), (3) no dust emissions (EXP3) and (4) no BB emissions from mainland Southeast Asia (EXP4), to disentangle the individual contribution of transport and mixing processes of different sources. The other group contains two parallel simulations, with and without aerosol radiative feedback (EXP_WF and EXP_WoF), to understand the impact of air pollution on meteorology. BB emission rate was derived from Global Fire Emissions Database version 4.1 (GFED4s), and the MIX database was used for anthropogenic emissions for present WRF-Chem modeling (http://www.meicmodel.org/dataset-mix, last access: 15 March 2017). The spatial pattern of various emission sources is shown in Fig. 1. Similar model configurations in our previous works have been proven to perform well in reproducing the spatiotemporal pattern of pollution in East Asia (Ding et al., 2016; Liu et al., 2016).
Lagrangian particle dispersion modeling was conducted to research the transport mechanisms of air pollutants for the case using the FLEXPART model (Stohl et al., 2005). This model has been widely used in many studies (e.g., Stohl et al., 2002). The model was also driven by the FNL data. For each target air mass, 4000 particles were released and backwardly run for 7 days. We calculated the averaged residence time of particles of a layer of 100 m above the ground surface as the retroplume to investigate the possible impact of surface anthropogenic emissions on the target air mass (Ding et al., 2009, 2013c). We also calculated the averaged vertical cross section of the residence time along the main transport pathways to understand the three-dimensional structure of air pollution transport and dispersion (Ding et al., 2015). We used the Hybrid Single-Particle Lagrangian Integrated Trajectory (HYSPLIT) model (Stein et al., 2015) to calculate single-particle trajectories based on Global Data Assimilation System data.
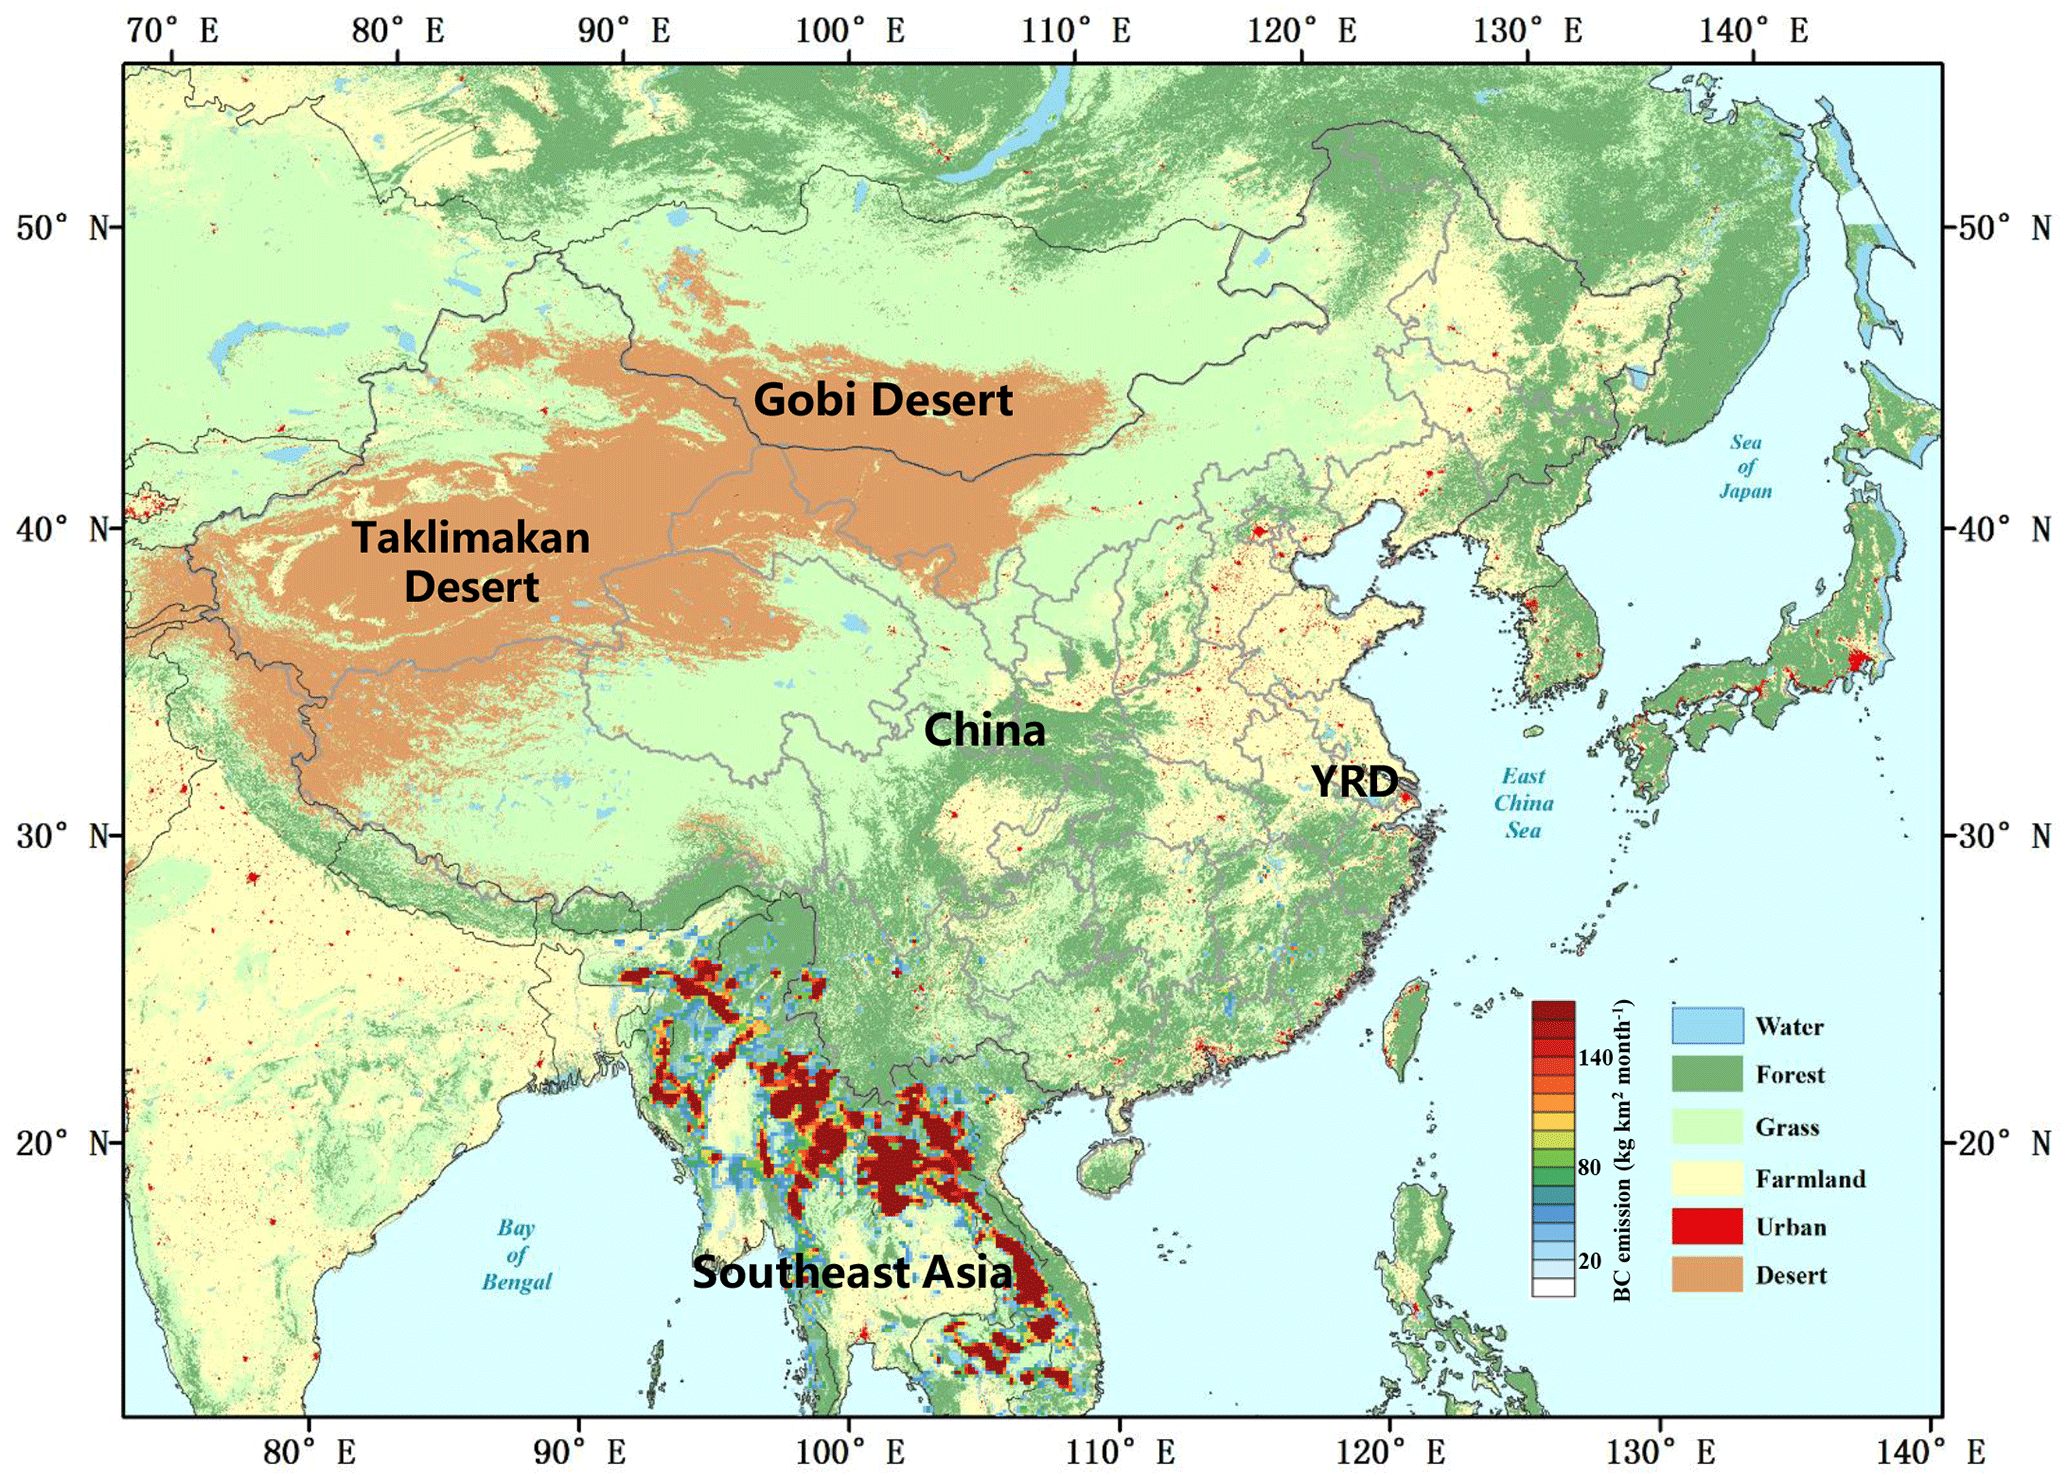
Figure 1Map showing the land cover and averaged carbon emissions from biomass burning in March in East Asia. Note that the land cover data are the 2012 MODIS Land Cover Type product and biomass burning emission data are from the GFED4 emission inventory.
3.1 Surface observations on anthropogenic aerosols and dust storms
In late March of 2015, Nanjing was influenced by Asian dust, BB and anthropogenic aerosol concurrently. The temporal variation in PM and its chemical compositions measured in downtown Nanjing demonstrated a multiday episode of particle pollution, with a maximum of PM2.5 and PM10 occurring on 19 and 23 March, respectively (Fig. 2). In the first few days of this period, the PM2.5 ∕ PM10 ratio was generally higher than 0.7, and the secondary water-soluble inorganic compositions like , and were the main contributors to PM2.5 mass concentrations. Apparently, haze episodes before 23 March were attributed to secondary aerosol formation mainly from anthropogenic pollution. However, the PM2.5 ∕ PM10 ratio started to drop as low as about 0.2 in the afternoon of 23 March when the PM10 reached up to the maximum of 261 µg m−3, but PM2.5 remained less than 50 µg m−3, indicating possible influence from windblown dust. In the meantime, the mass concentration of Ca2+, a tracer of soil-derived dust, showed a peak value of over 6 µg m−3. Such variation patterns of different aerosol composition further confirm strong impacts from dust in Nanjing after 23 March. Interestingly, a synchronous small peak of (around 12 µg m−3) could be observed as the dust plume approached. During existing field campaigns, sulfate-coated dust particles were often observed during the long-range transport of dust storms, which has been proven to be caused by heterogeneous uptake on mineral dust (Levin et al., 1996; Song et al., 2005). In Nanjing, we observed enhanced oxidation of precursors during a dust storm in late spring of 2012 (Xie et al., 2015). The results in this work further demonstrate that secondary sulfate formation could be promoted when the dust storm mixed with anthropogenic pollution. It highlights that in the YRD, which is a fossil fuel (FF) emission-intensive area and downwind of Asian dust, the mixing of Asian dust and anthropogenic SO2 may lead to complex chemical transformations, posing a significant impact on the regional-scale atmospheric composition and oceanic biogeochemical cycle.
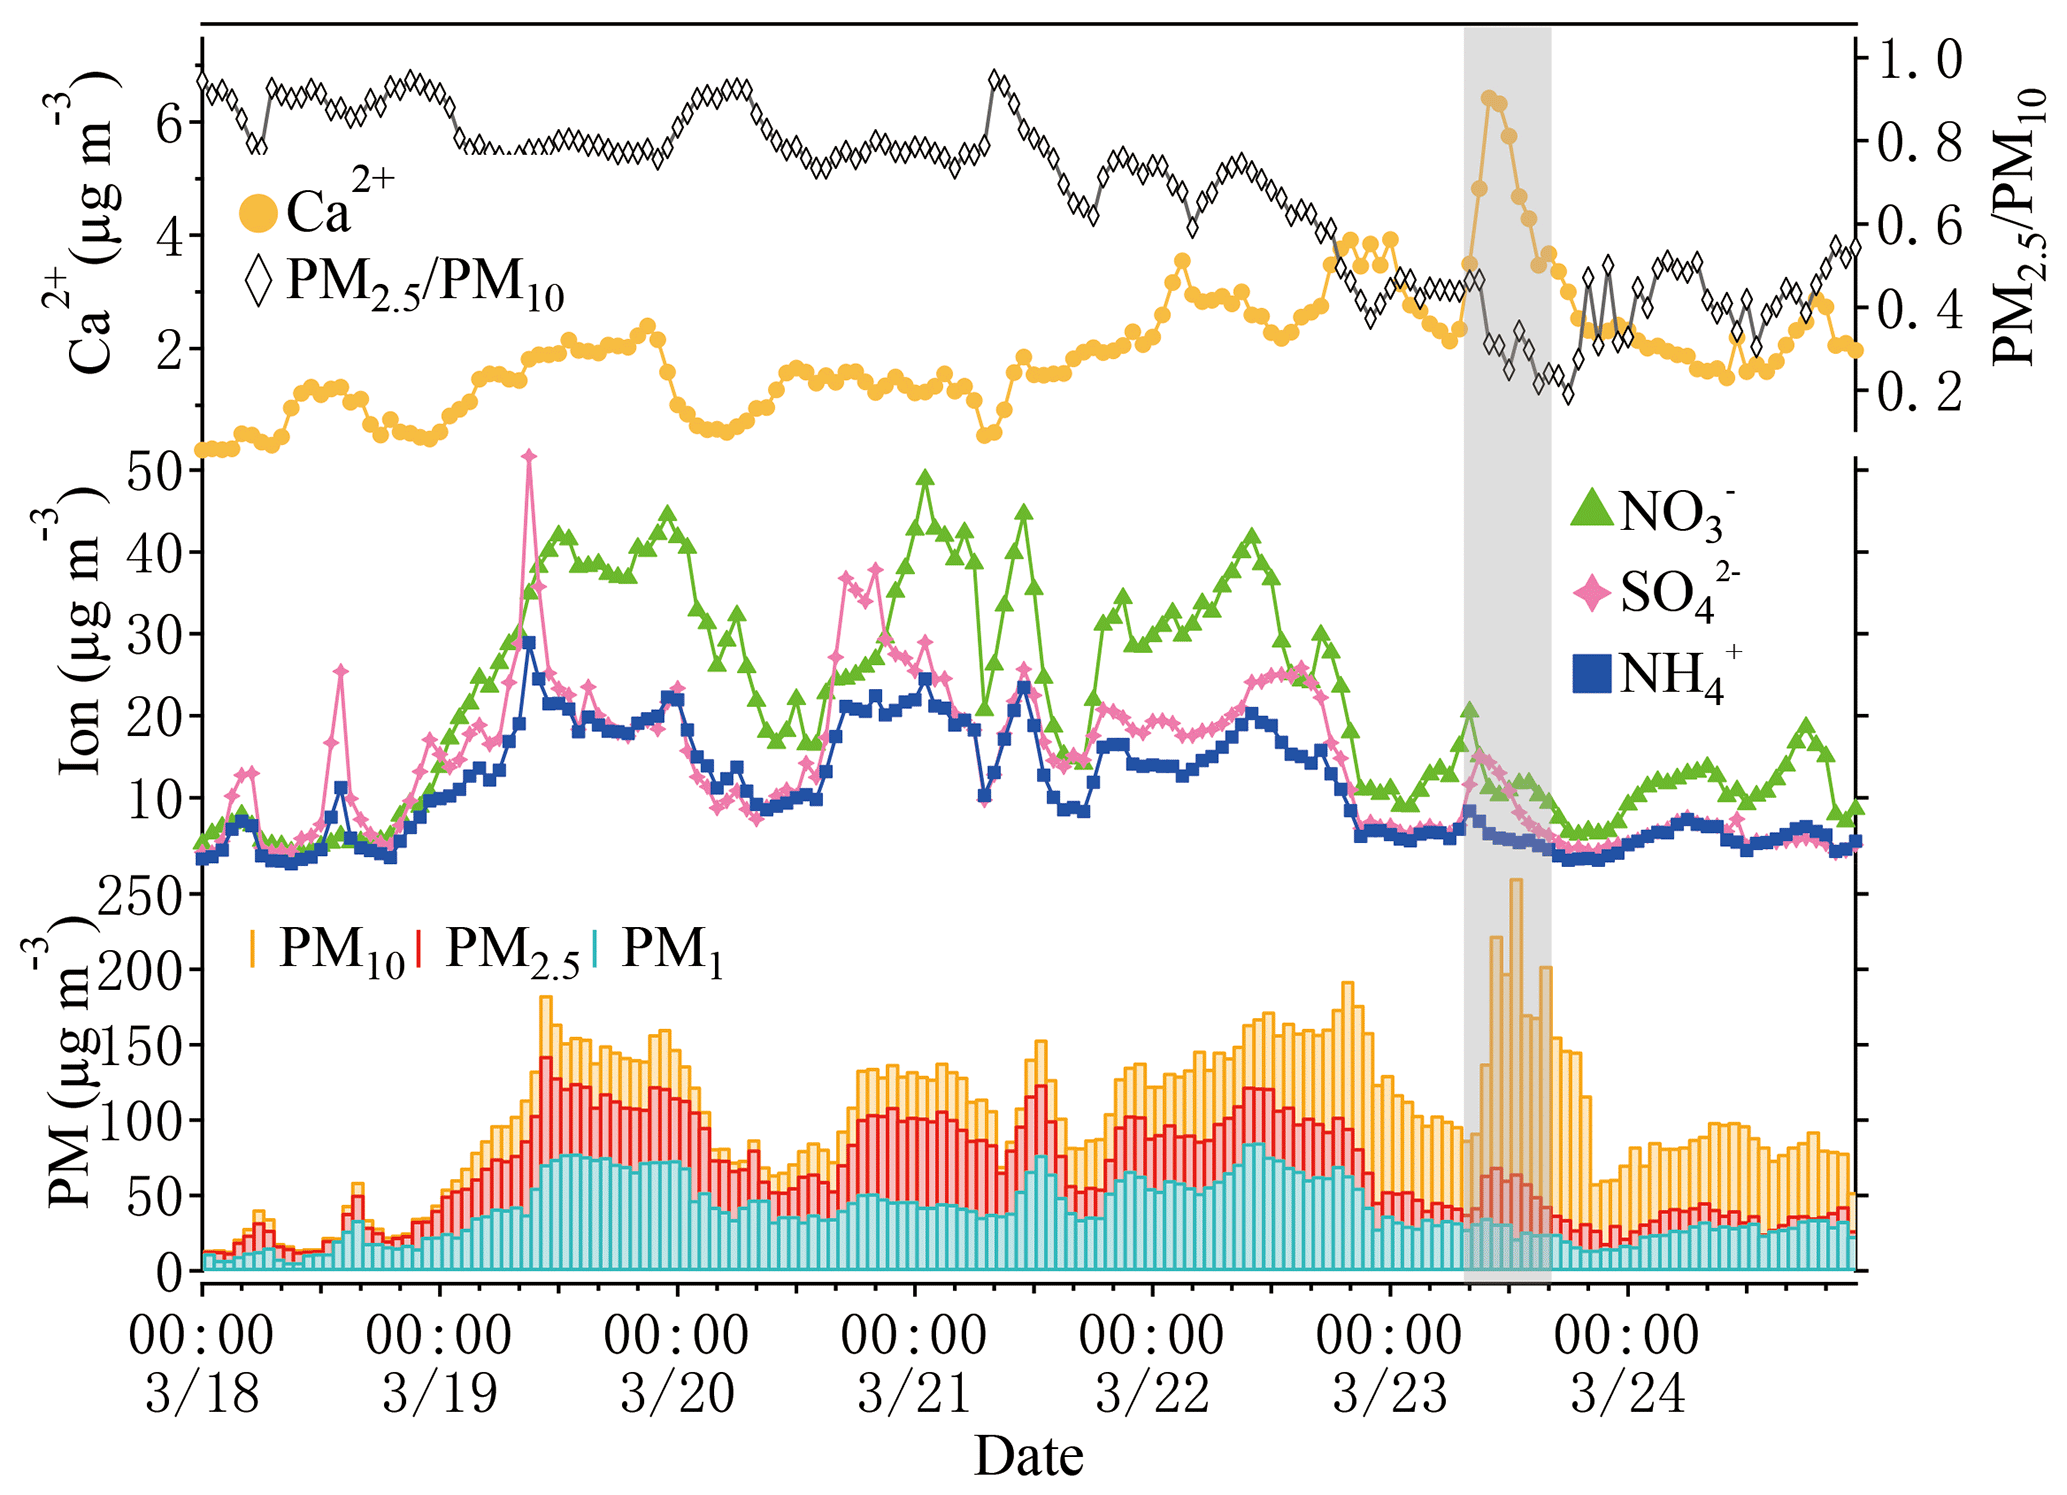
Figure 2Time series of the concentrations of PM10, PM2.5, PM1 and the main water-soluble ions of PM2.5 (, , , Ca2+) measured in Nanjing during 18–23 March 2015.
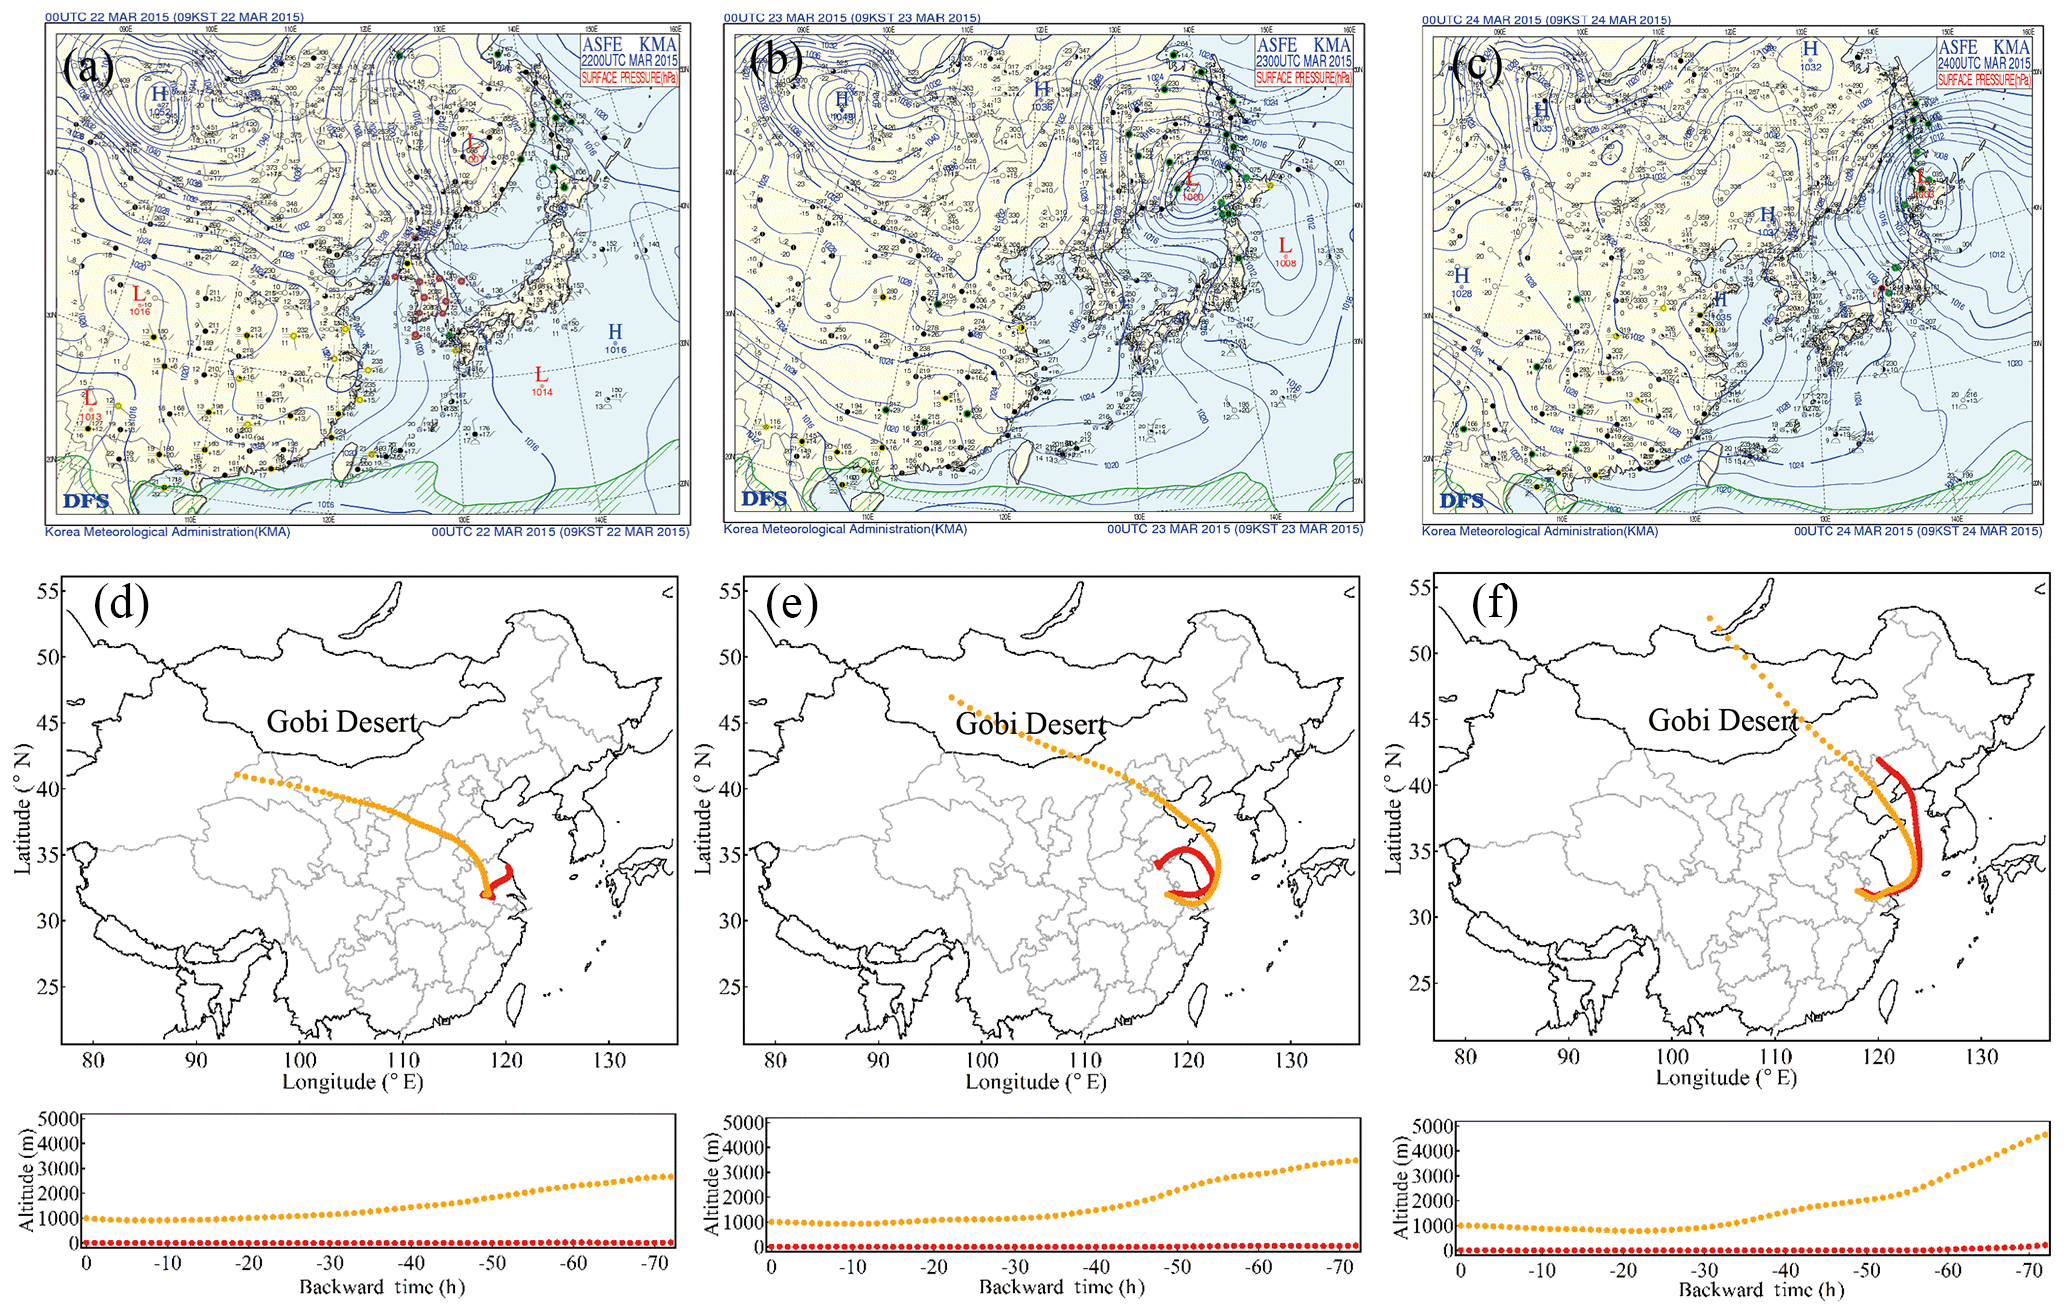
Figure 3Weather charts and 3-day backward trajectories starting at altitudes of 10 and 1000 m over Nanjing at 08:00 LT on (a, d) 22, (b, e) 23 and (c, f) 24 March 2015.
The in situ measurement gave us a clue that air pollution in Nanjing transferred from anthropogenic FF dominant to dust dominant around 23 March, accompanied by distinct changes in physicochemical properties of particle. To clearly identify the source region and the air mass transport pattern before, during and after the dust event, we calculated 3-day backward trajectories, starting at the altitudes of 10 and 1000 m over Nanjing at 08:00 LT on 22–24 March using the HYSPLIT model. As indicated by the weather charts together with the backward trajectories for the three days in Fig. 3, before the dust event (i.e., 22 March), a surface with high pressure dominated the Mongolian Plateau with its tongue extended to eastern China. The air mass in Nanjing was transported very slowly from the plain area with high anthropogenic emissions in the northeast (see the trajectory in red). On 23 March, when the high pressure moved southeastwardly and dominated the continental area, air masses at the ground surface in Nanjing showed a transport pathway from the YRD city clusters. However, the air masses at the altitude of 1000 m originated from the Gobi Desert and swept the North China Plain before recirculating from the ocean, as demonstrated in Fig. 3e. Although dust particles are usually transported long range in the upper air, they could stretch down to the ground and mix with near-surface anthropogenic pollution through daytime vertical mixing. This transport pathway and mixing mechanism was confirmed by the fact that coarse-particle concentration at the ground surface rapidly increased in Nanjing at noontime on 23 March, similar to the observations during dust storms reported by Xie et al. (2015) and Nie et al. (2014). On 24 March, when the continental high pressure moved eastwardly with separated centers located in coastal eastern China and northeastern China, the backward trajectories at 10 and 1000 m in altitude showed a much faster transport from northeastern China through the ocean.
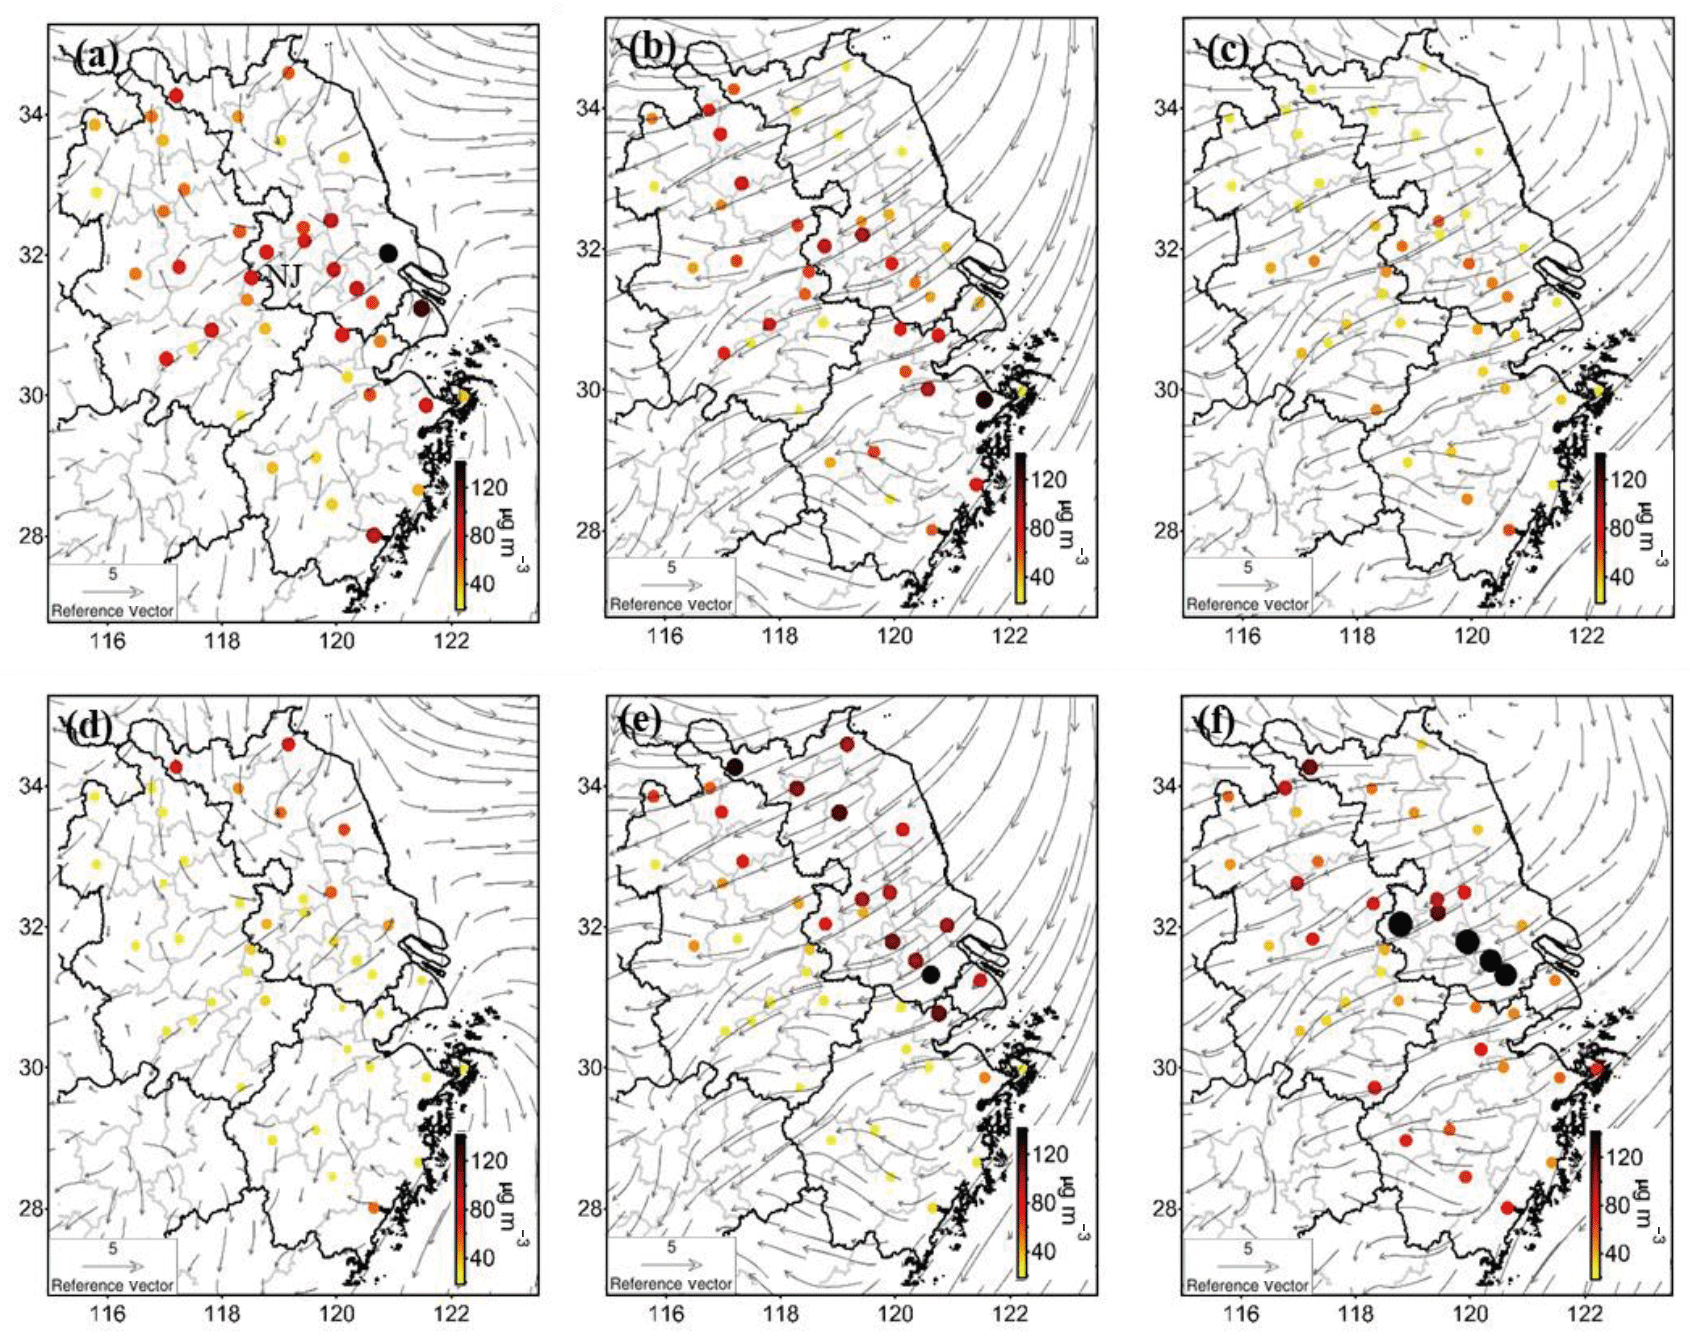
Figure 4Spatial distributions of wind and observed hourly concentrations of PM2.5 (a–c) and PM2.5–10 (d–f) over the Yangtze River Delta at 12:00 LT on 21, 22 and 23 March 2015.
Spatiotemporal variations in observed hourly concentrations of PM2.5 and PM2.5–10 by the monitoring network of the Ministry of Environmental Protection in YRD were adopted to examine the evolution of this multiday episode in the YRD region. As shown in Fig. 4, the YRD region was influenced by a regional haze event on 21 March, with PM2.5 over 120 µg m−3 in coastal cities in the eastern YRD (Fig. 4a); however, PM2.5–10, i.e., the coarse particles, shows a different distribution pattern, with only moderated concentration in the northern part of the domain (Fig. 4d). On 22 March, the concentration of coarse particles in the northern part of the domain was enhanced substantially (Fig. 4e) but the PM2.5 plumes moved further south, showing a contrast in spatial distribution in the south and north. The spatial pattern was separated by a cold front extending from the northwest to southeast YRD (see also Fig. 3b). Behind the cold front, high-concentration dust aerosols were carried by the cold front from the north; however, the strong wind speed weakened the surface PM2.5 pollution by transporting it southward or by lifting it to high altitude. In front of the cold front, a calm condition favored the accumulation and formation of secondary PM from anthropogenic sources. Here the contrast distribution of PM2.5 and dust on both sides of the cold front implies that at ground surface mixing of dust with aged secondary PM in the surface is limited because of their different locations with respect to the cold front. On 23 March, when the cold front moved further south, PM2.5 in the entire YRD region further decreased but the coarse particles were enhanced in the middle YRD, especially on the axis from Nanjing to Shanghai (see big black dots in Fig. 4f), corresponding to the surface PM10 maximum on those days (Fig. 2).
To clearly investigate the transport of the dust storms, we collected ground-based measurements of PM2.5 and PM10 at several air quality monitoring stations from north to south along the main transport pathways, including Shijiazhuang (SJZ), Jinan (JN), Nanjing (NJ), Shanghai (SH) and Hangzhou (HZ) (the geographic locations are shown in Fig. 5a). The time series of PM2.5–10 in Fig. 5b indicates that all the stations were influenced by the dust storm during 22–23 March, with a rapid increase in coarse-particle concentration. Temporally, dust covered northern stations like SJZ and JN on 22 March and arrived at the YRD on the following day. Interestingly, not all dust occurrences at these sites showed a time lag from northwest to southeast. For example, on 22 March, the occurrence of a dust peak at JN was even earlier than that at SJZ. On 23 March, the occurrence of a dust peak at NJ, the most northwestern city in the YRD region, was the latest among the three YRD cities. These spatiotemporal variations were caused by different transport processes. The forward trajectory for the peak hours at these cities shows that the dust plumes from the northern sites were less directly transported to YRD but rather were transported to the ocean area from north of Jiangsu Province. The non-lagged transport pathway indicates that the transport of dust to a lower latitude was not from horizontal advection following the ground surface but most probably transport at a high altitude. The upper-level dust hence could influence the ground surface through the daytime vertical mixing associated with the development of the PBL (Xu et al., 2018). This phenomenon has been observed in Xie et al. (2015), in which the surface measurements did not show any obvious signal of dust until dust in the upper PBL was mixed downwards.
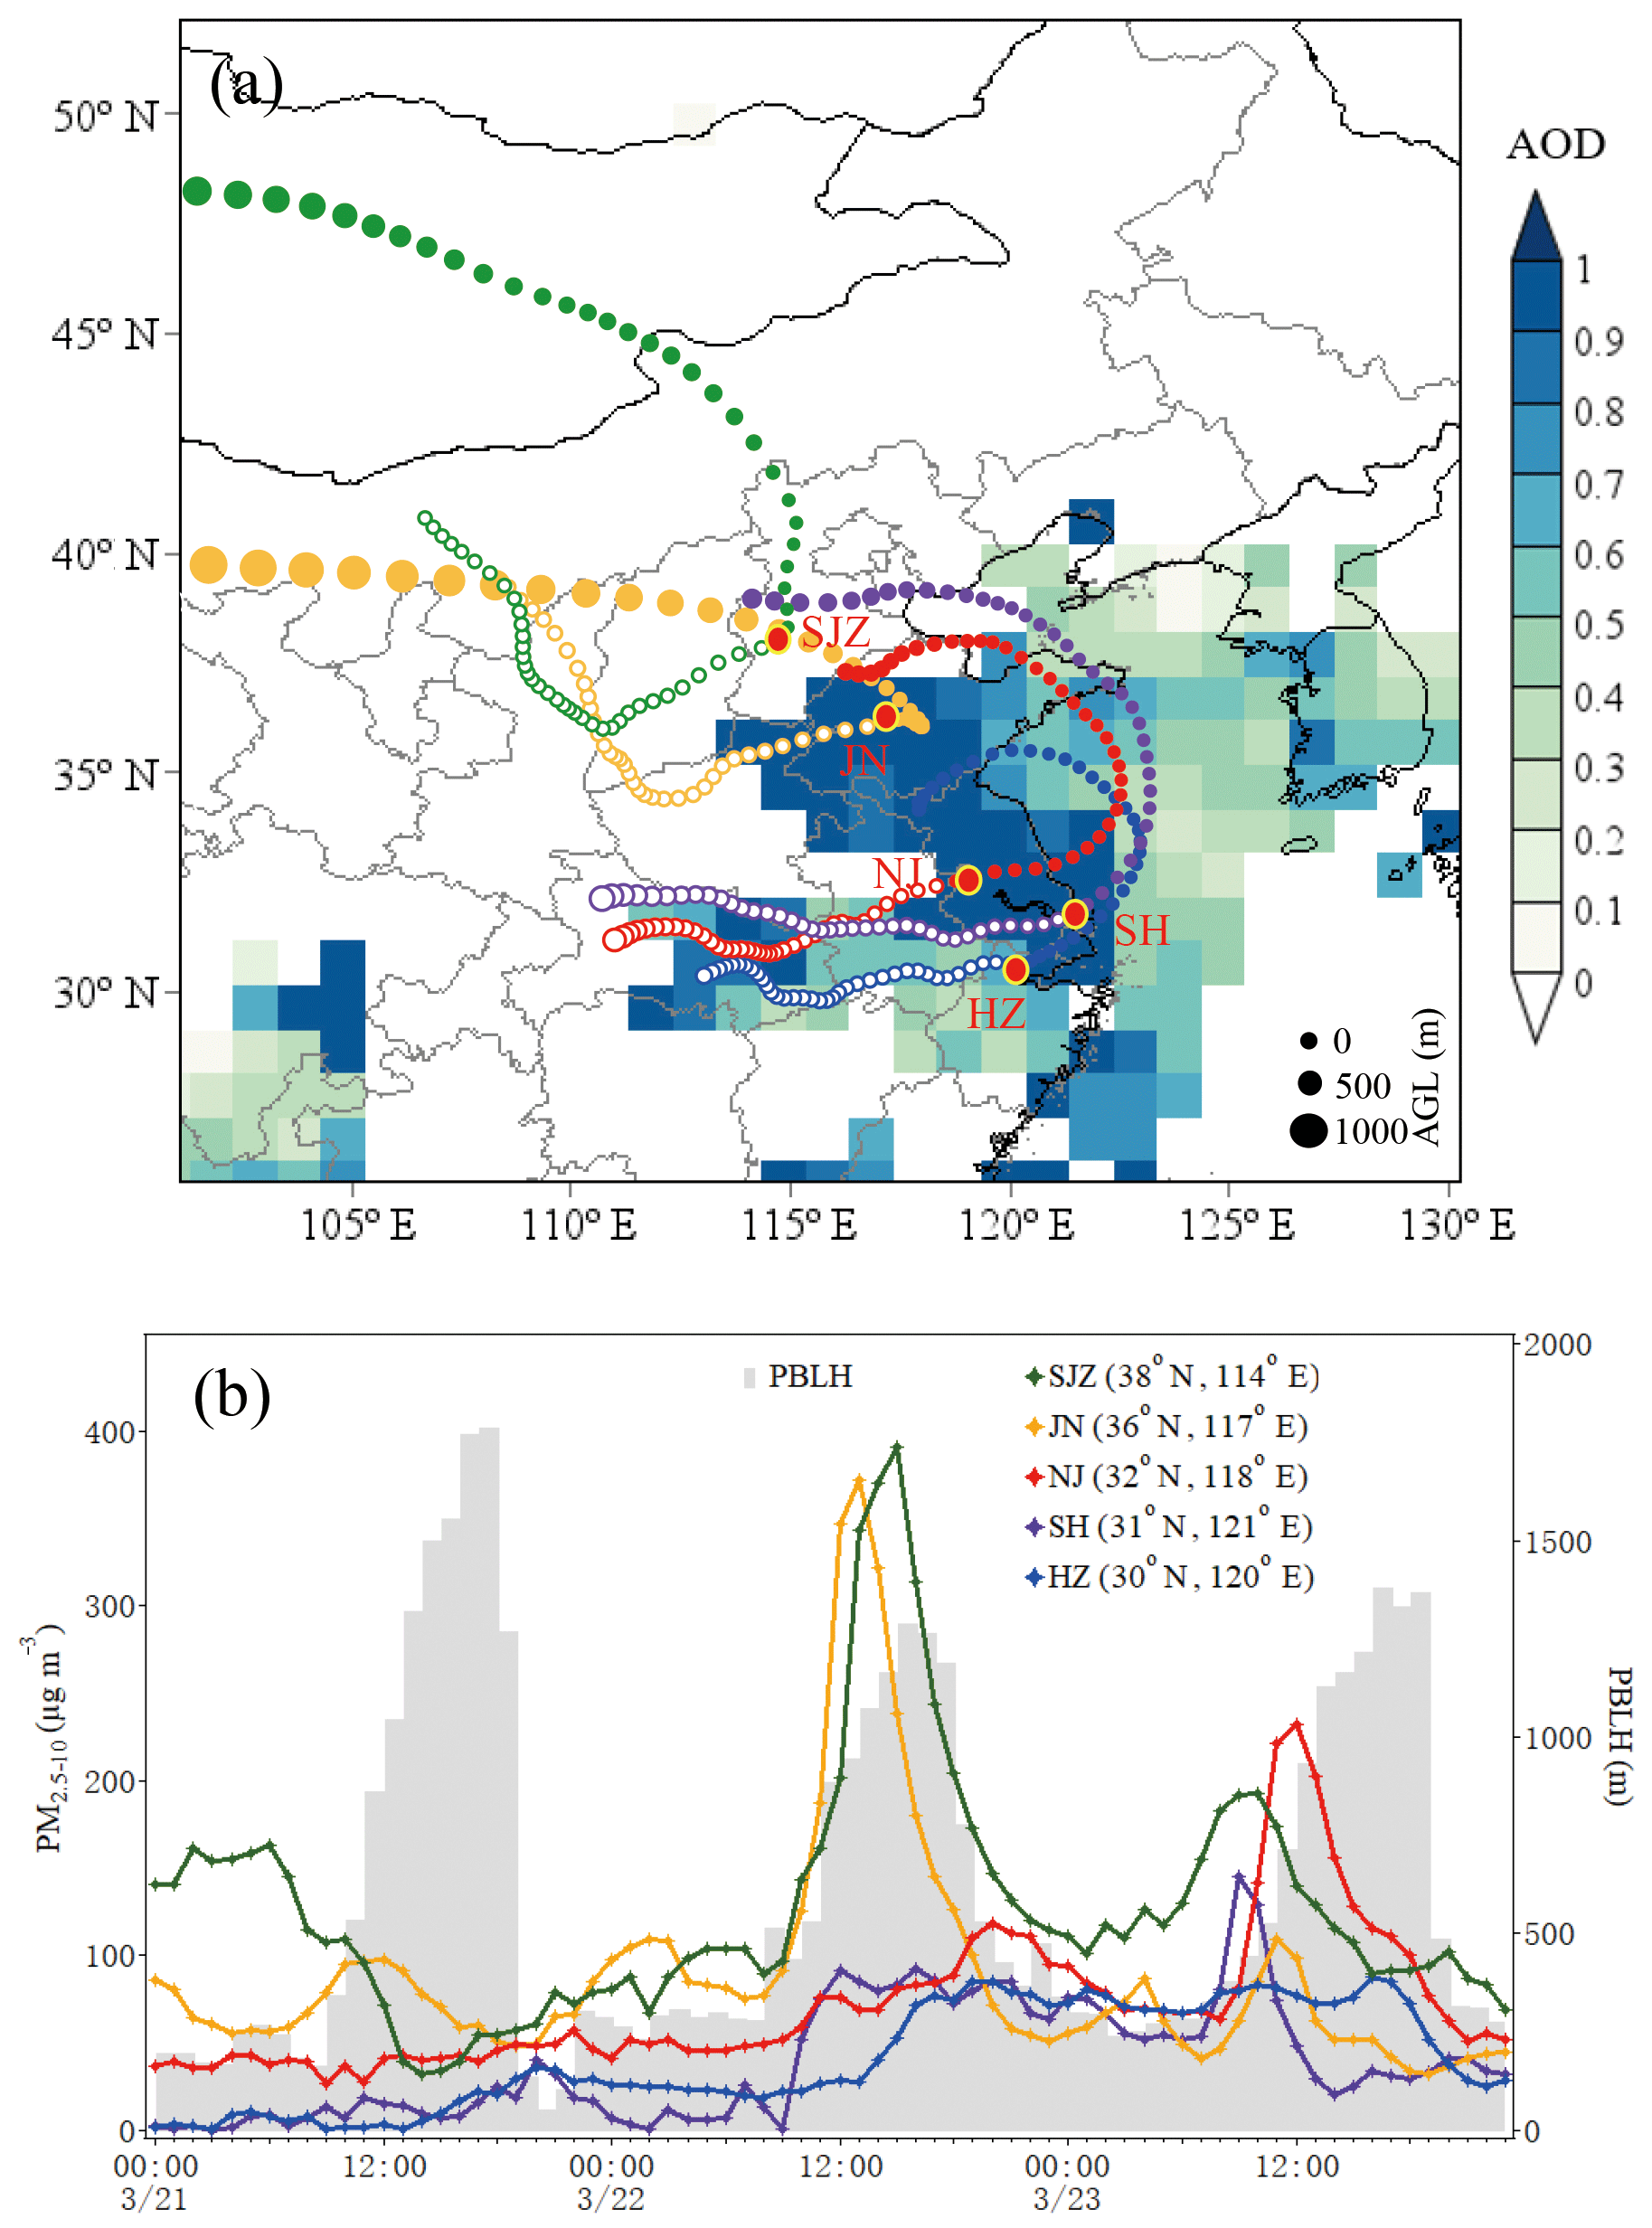
Figure 5(a) AOD distribution on 22 March and 72 h backward (solid circle) and forward (hollow circle) trajectories at 08:00 on 23 March 2015 and (b) time series of PM2.5–10 and averaged PBL height at five cities in eastern China during 21–23 March 2015.
3.2 Vertical source attribution of mixed pollution
As mentioned before, due to substantial influence from synoptic processes, this aerosol pollution episode featured mixing of multiple emission sources and significant vertical heterogeneity. Synoptic fronts usually extend from the surface up to the middle troposphere. Air pollutants can rise along the circulations ahead of cold fronts to the MLT, where pollutants can be transported further and have a longer atmospheric residence time, leading to multiple pollution layers in the vertical. Based on the analysis of the surface measurement above, there may be several aerosol layers in the YRD region during this case. A vertical cross section of aerosol subtype along the CALIPSO satellite track by observation at 02:04 LT on 23 March 2015 (Fig. 6a) showed us a direct vertical distribution picture of the mixed aerosols above YRD. On the ground the polluted dust aerosols mainly accumulated through the local anthropogenic emissions mixed with dust. The dust aerosols took control above the PBL to the altitude of about 5 km. The CALIPSO satellite track depicted the transport pathway of mineral dust from a higher altitude in northern China to downwind areas. It is noteworthy that there was a smoke plume above the dust layer in the south of Shanghai, which formed a huge pollution belt at the altitude of 5 km and extended about 10 latitudes above the East China Sea. To discuss the transport pathway and source contribution of mixed pollutants in different layers, a matrix of 7-day backward trajectories starting at 10 m, 2 km and 5 km above ground level was applied along the CALIPSO satellite track, as illustrated in Fig. 7. According to the trajectories starting at the ground level, we found that air masses near the southeast coast of China were mainly influenced by FF emission-intensive regions in eastern China, including both the YRD and the North China Plain. Comparatively, the backward trajectories at the altitude of 2 km indicated the air masses on the southeast coast of China mainly originated from the Gobi and Taklimakan deserts through long-distance transport. The clean marine aerosol located at about 20∘ N was from the South China Sea and then circulated through the southeast urban area and mixed with anthropogenic pollutants and dust. The air masses near the altitude of 5 km mainly came from mainland Southeast Asia with intensive BB emissions in March (van der Werf et al., 2006). It is clear that during this case the potential source regions of different vertical layers varied distinctly.
Table 2Statistical analyses of the simulated meteorological variables and PM10 versus the ground observations. MB, RMSE and R refer to mean bias, root-mean-square error and correlation coefficient, respectively, and AP and DP refer to the anthropogenic-dominated period and dust-dominated period.
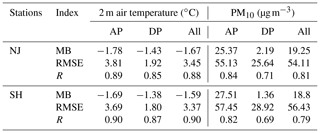

Figure 6(a) Vertical cross section of aerosol subtype along the (b) CALIPSO satellite track at 02:04 LT on 23 March 2015.
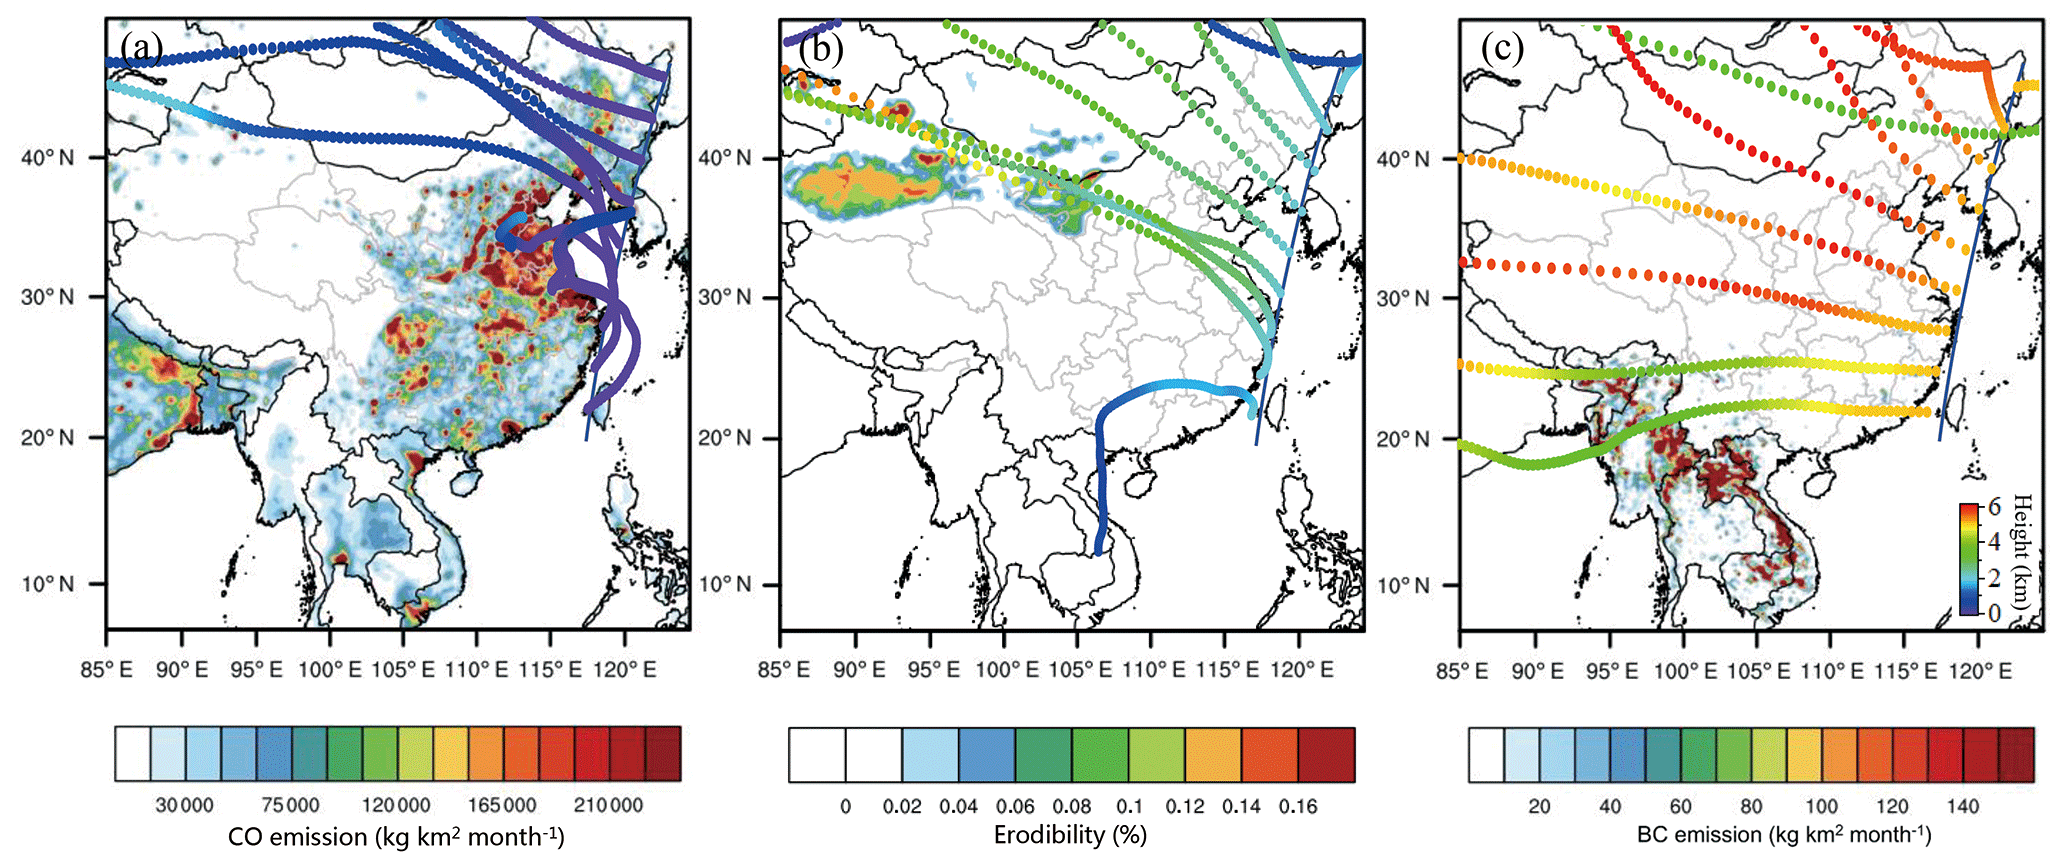
Figure 7The 7-day backward trajectory at different altitudes of (a) 10 m, (b) 2000 m and (c) 5000 m above ground level along the satellite orbit. Note that anthropogenic carbon monoxide emissions, soil erodibility and BC emissions from biomass burning are shown on these maps.
In order to clarify the potential source of MLT aerosol over the YRD region, which was identified as polluted dust according to CALIPSO retrievals, a matrix of 3-day backward trajectories was applied from the YRD region starting at 5 km above ground level. The air masses originated from the ground surface of an inland area in the southwest, with the trajectory recirculating in a small area between Hunan and Hubei provinces more than 1 day; they then traveled eastward a distance of hundreds of kilometers and reached the YRD at the altitude of 5 km. Pollutants in the MLT have a longer lifetime for there is no deposition and colder air temperatures (Zhou et al., 2013; Mu et al., 2018). The FLEXPART model was used to further illustrate the different modes of transport. The particles were released starting at 00:00 LT on 23 March. The particles were released at the height of about 5 km over the YRD region (red square in Fig. 8b). The air masses were derived from the boundary layer to the middle troposphere for about 12 h. When it reached the middle troposphere the air mass turned more easterly. The 3-day backward surface distribution (< 100 m) of particles released in the YRD was mainly concentrated on the locations of the southwest inland region. According to this large number of backward particles, we isolated those representing the warm conveyor belts (WCBs) by applying criteria from Eckhardt et al. (2004), which require 2-day air masses to travel eastward a distance at least 10 longitudes, northward exceeding five latitudes and vertically at least 50 % of the average tropopause height at the ending position. The tropopause height in the YRD region was about 11–12 km, yielding a 2-day ascent criterion of more than 5 km. Applying these criteria isolated most of the YRD region that was influenced by the WCBs. Ding et al. (2009) also reported the WCBs could transport megacities' plumes in the North China Plain to the mid-troposphere over northeastern Asia.
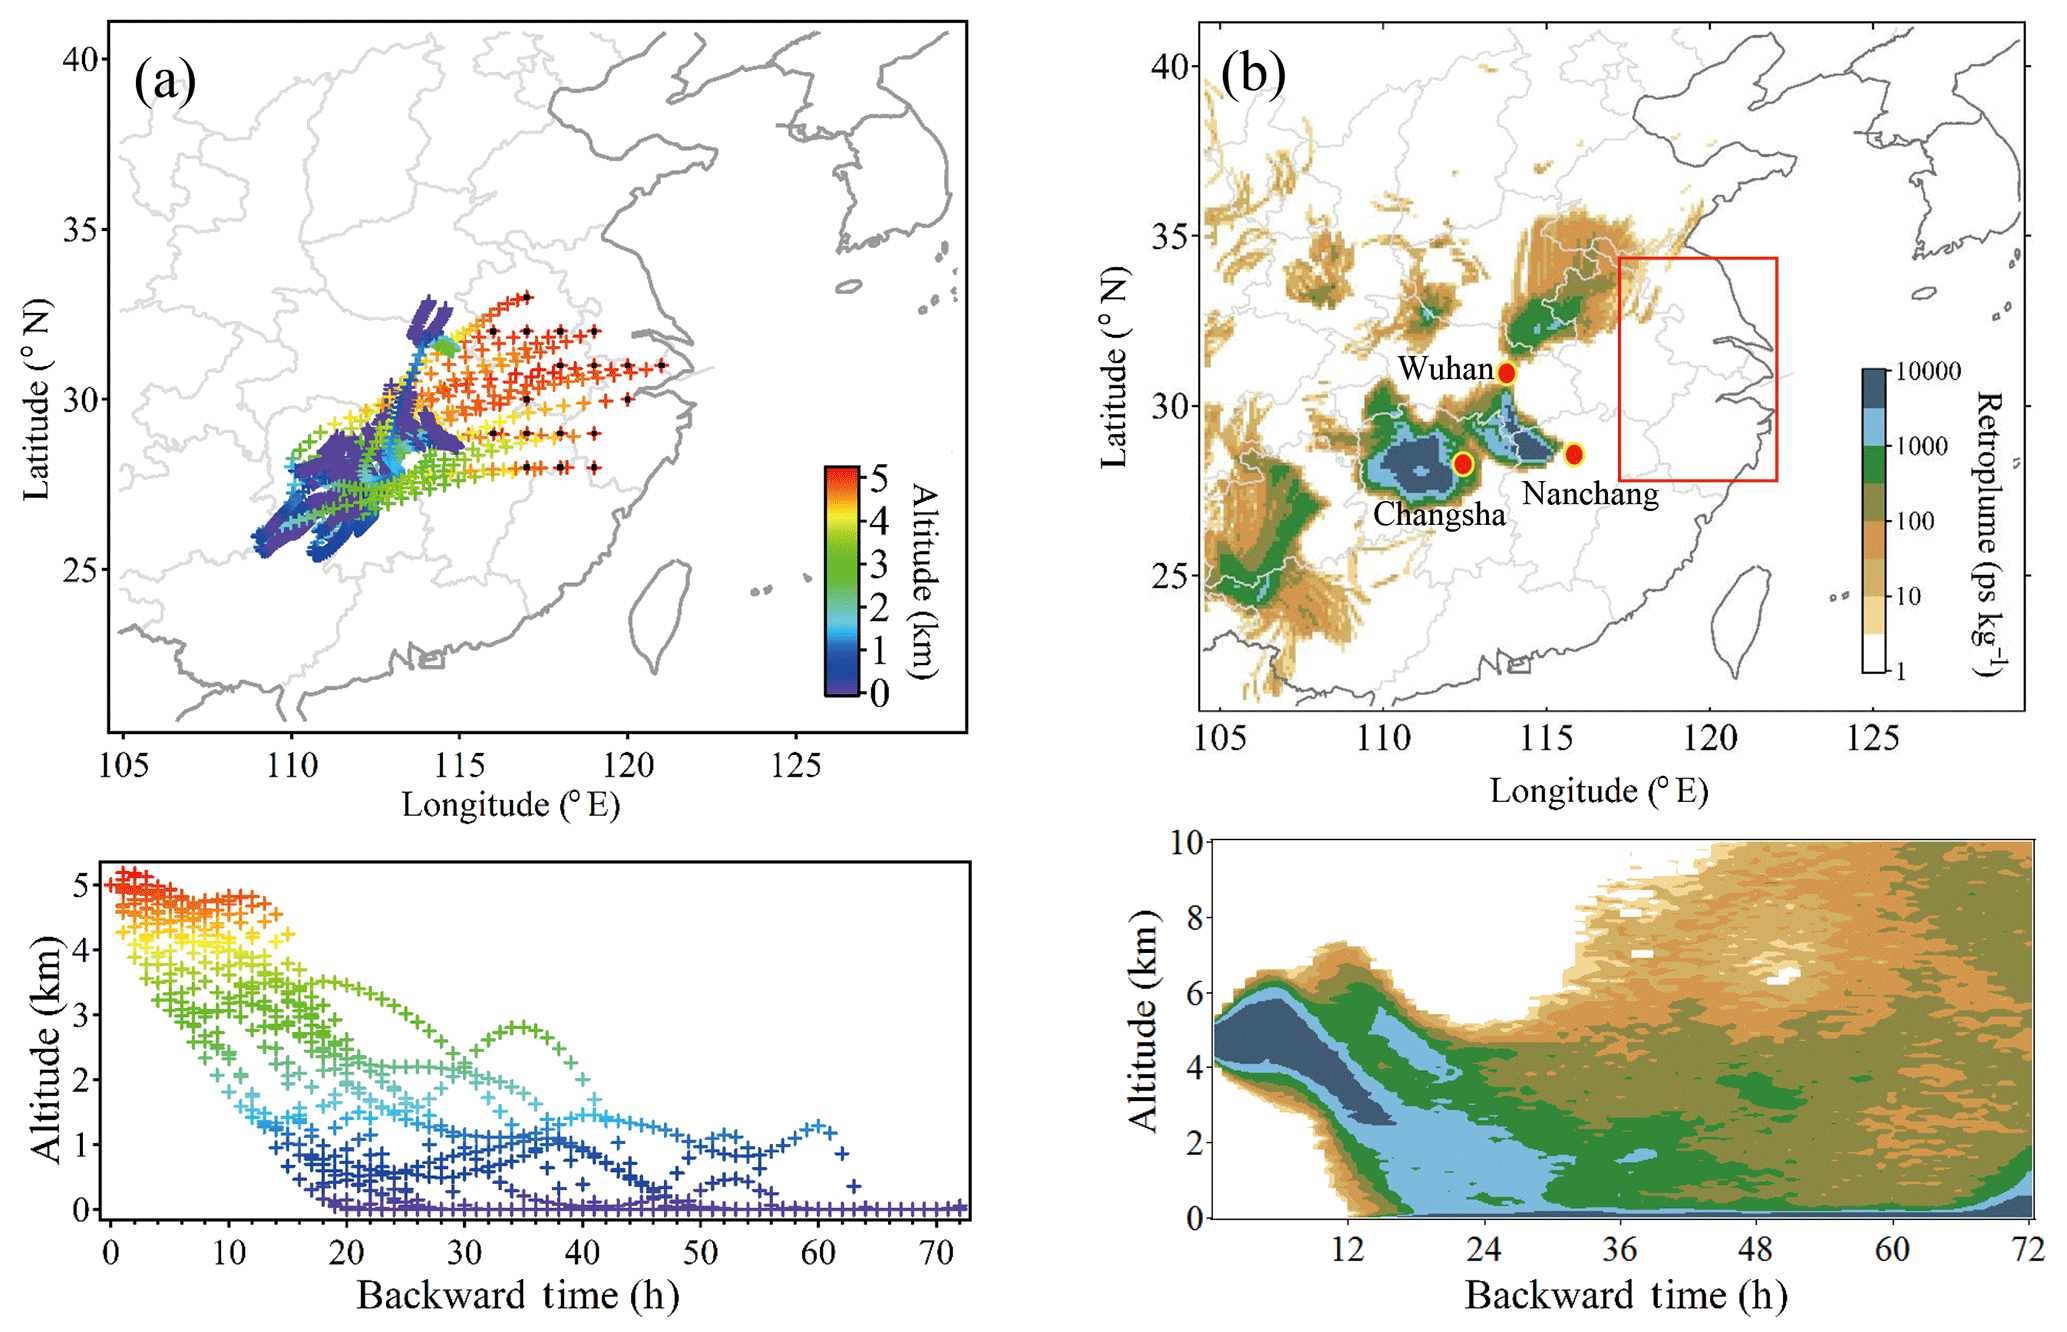
Figure 8(a) The 3-day backward trajectories and (b) averaged surface retroplume of particles released in the area in the red square at 00:00 LT on 23 March 2015. The lower panels give the vertical distribution of trajectories or particles.
To understand the evolution of the cold front and its impact on the vertical structure of atmospheric aerosol, we conducted simulations using the regional chemical transport model WRF-Chem. By comparing with available observations, the model is proven capable of reproducing the variations in meteorological fields and PM10 distributions in the YRD region (Table 2). Figure 9 demonstrated the vertical cross section of simulated PM2.5–10, anthropogenic CO and biomass burning black carbon (BC), wind field, and perturbation potential temperature along coastal eastern China at 08:00 LT on 23 March. We use CO here because it is a good tracer for the combustion source and an excellent tracer for studying long-range transport because it has a lifetime of weeks to months and is less influenced by wet deposition (Parrish et al., 1998; Wang et al., 2003). The position of frontal surface, which was identified by the mutation of the perturbation potential temperature and wind field, was marked in red in Fig. 9c. The dust and CO dominated behind the frontal surface and could be transported equatorward and eastward with the evolution of synoptic systems. The high concentrations of CO above the frontal surface were transported from inland ground and lifted by the frontal system, as discussed above. Dust can rise along circulations ahead of cold fronts. Behind cold fronts, pollution tends to be low near the ground, and mineral dust can be lofted in mesoscale wind systems (Huang et al., 2010; Liu et al., 2016). The dust mixed with anthropogenic pollution in the middle troposphere (6–10 km) behind the frontal surface. BC showed a high concentration ahead of the frontal system, which was mainly due to the tremendous emissions from BB in mainland Southeast Asia and subsequent transport along with the westerlies in the low troposphere. Thus, the BB pollutants could mix with anthropogenic and dust pollutants at the junction of the front. These vertical structure characteristics caused by the frontal system were clearly described by the model results and satellite observations.

Figure 9Vertical cross section of (a) PM2.5–10 and UV wind field (m s−1) (b) CO and potential temperature (contour lines, K) and (c) BC concentration obtained from the WRF-Chem simulation along coastal eastern China at 08:00 LT on 23 March 2015.
To attribute and analyze sources of the three layers of mixed pollutants in the MLT over eastern China, we performed four parallel simulations, experiments with all emissions (EXP1), no anthropogenic emissions from eastern China (EXP2), no dust emissions (EXP3) and no BB emissions from mainland Southeast Asia (EXP4), as mentioned in Sect. 2. Figure 10 shows the mixed pollutants from dust (PM2.5–10), anthropogenic emissions (CO) and BB (BC) at 5 km in altitude and vertical cross sections of mixed pollutants averaged from the area in the black box at 08:00 LT on 19, 21 and 23 March. Eastern China is one of the world's most FF emission-intensive areas with fast industrialization and urbanization. During the early stage of the event on 19 March, the greatest level of surface CO (> 400 ppbv) was mostly concentrated in eastern China. With the development of the frontal system, CO was gradually lofted from the ground surface to the altitude of 5–6 km on 23 March. The spatial pattern of CO at the altitude of 5 km in Fig. 10a–c gives a clear picture of how CO was elevated by the cold frontal system. As the CO-concentrated air masses reached the middle troposphere, they began to be transported eastward, evidently demonstrated by an area with a CO concentration exceeding 100 ppbv at the altitude of 5 km in the south YRD in the early morning on 23 March. At the same time, the dust storm that was accompanied by cold fronts swept over eastern China from 21 to 25 March. This dust event mainly originated from the Taklimakan Desert due to extremely high wind shear and was transported with westerly wind in the free troposphere and then approached the YRD on 21 March. On that day the dust layer was suspended at the altitude of 4–6 km. Increasingly stronger vertical mixing and deposition processes brought the dust down to the surface (Fig. 10f), whereby substantial dust signals like an extremely high PM2.5 ∕ PM10 ratio and Ca2+ concentration peak were detected at the ground station in Nanjing (Fig. 2). Furthermore, March features most intensive forest fires in mainland Southeast Asia (Jacob et al., 2003; Zhou et al., 2013; Lin et al., 2014; Dong and Fu, 2015). Both CALIPSO observations and WRF-Chem simulation indicated that during this case BB was pumped along the mountain area and transported south of the YRD region and even the East China Sea by the westerlies. BB pollution influenced the YRD on 23 March and mainly concentrated around 4–6 km (Fig. 10c and f). The FF pollutants and dust mixed well in large areas of eastern China from ground level to the low troposphere and were staggered with the BB aerosol belt in coastal regions of southeast China in the free troposphere.
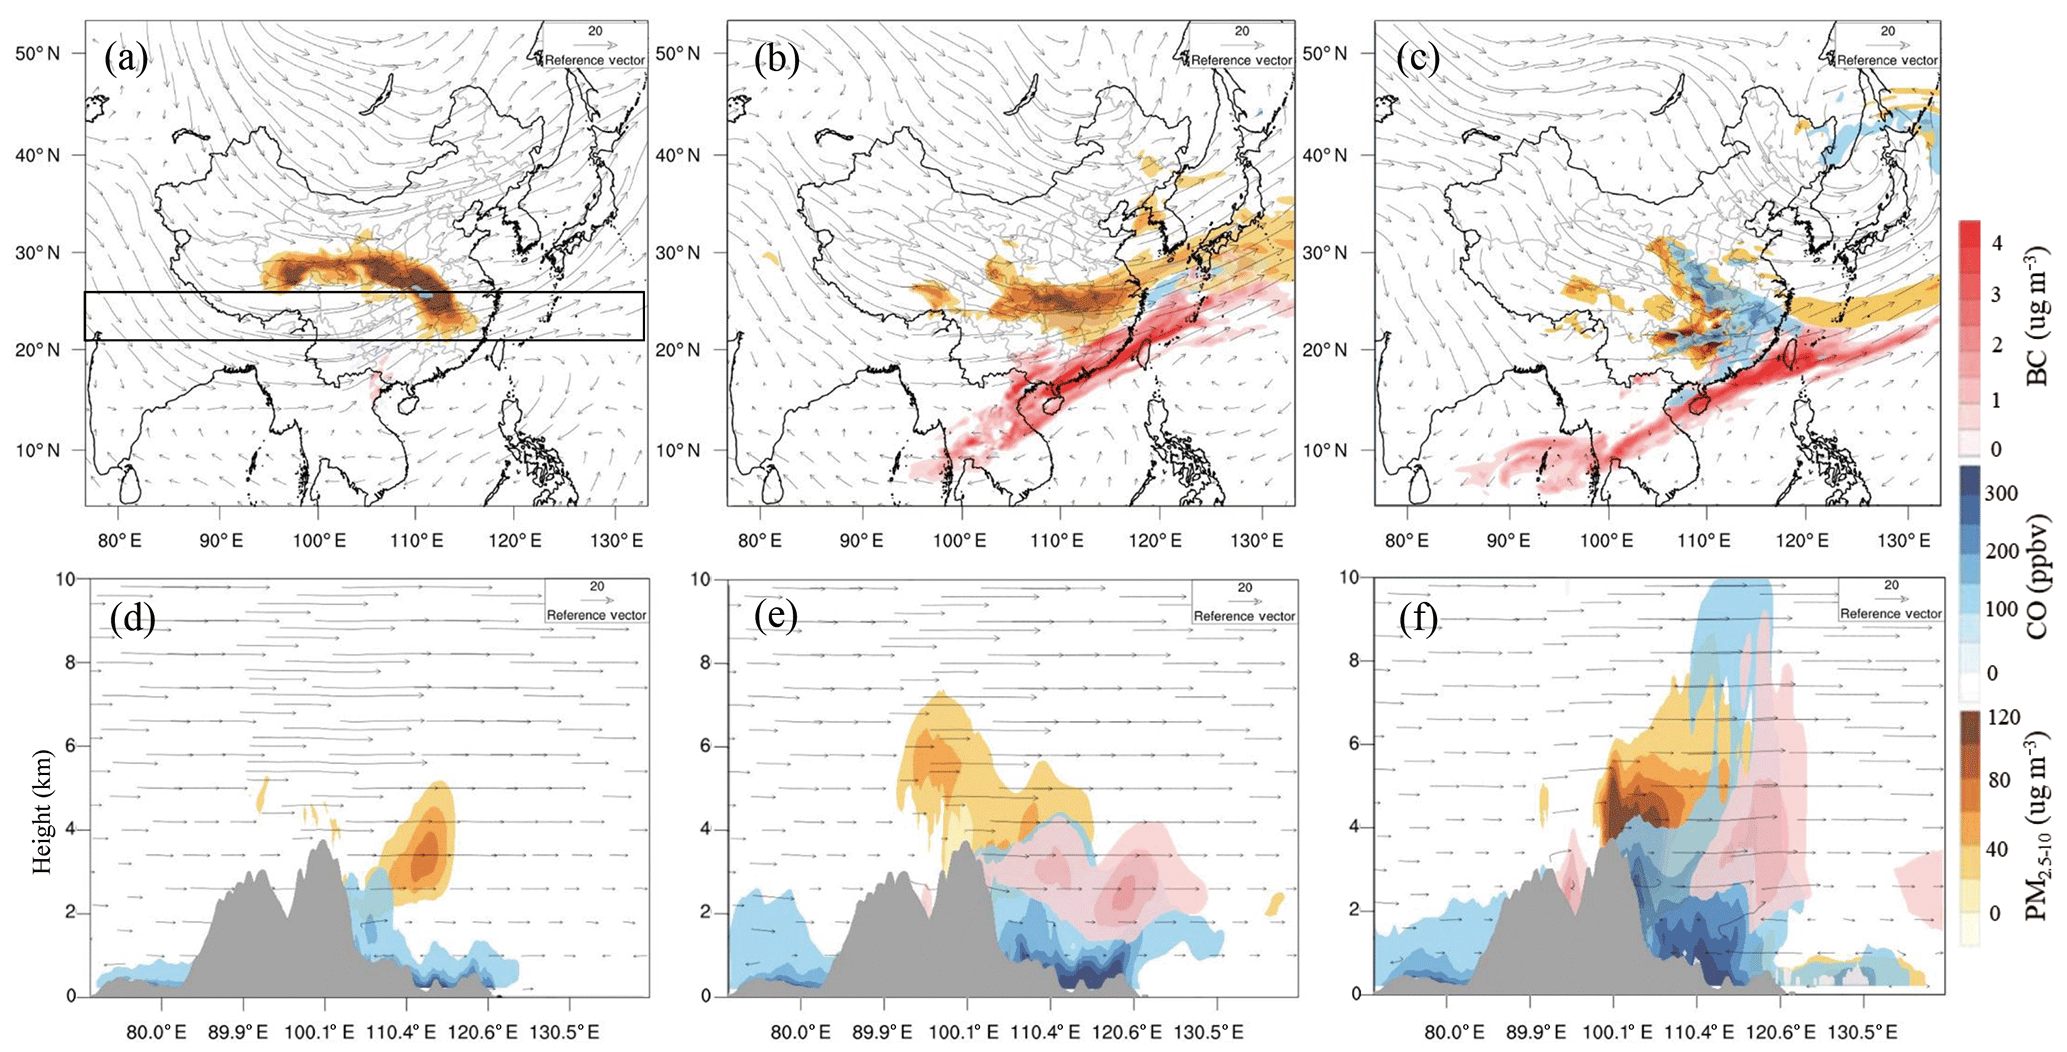
Figure 10WRF-Chem-simulated mixed pollutants from dust (PM2.5–10), anthropogenic emissions (CO) and BB (BC) at 5 km in altitude and vertical cross sections of mixed pollutants averaged from the area in the black box in Fig. 10a at 08:00 LT on (a, d) 19 March, (b, e) 21 March and (c, f) 23 March.
Asian dust and inland anthropogenic emissions can be transported to eastern China through both slow transport near the surface and relatively fast transport in the MLT, thereby influencing regional air quality. Eastern China is under the influence of the typical Asian monsoon, and the long-range passage of cold fronts associated with the Asian winter monsoon could cause lots of accumulated air pollutants and dust plumes to be easily transported to downwind coastal city clusters in eastern and southern China (Mori et al., 2003; Huang et al., 2010; Liu et al., 2011; Xie et al., 2015; Zhang et al., 2016; Ding et al., 2017) and further mixed with BB pollutants transported from mainland Southeast Asia. The degradation of air quality could pose an adverse effect on human health in eastern China. Under the control of the Asian monsoon, the climatological occurrence of fronts has suggested a high frequency of pollution-lifting events in eastern China in winter and early spring.
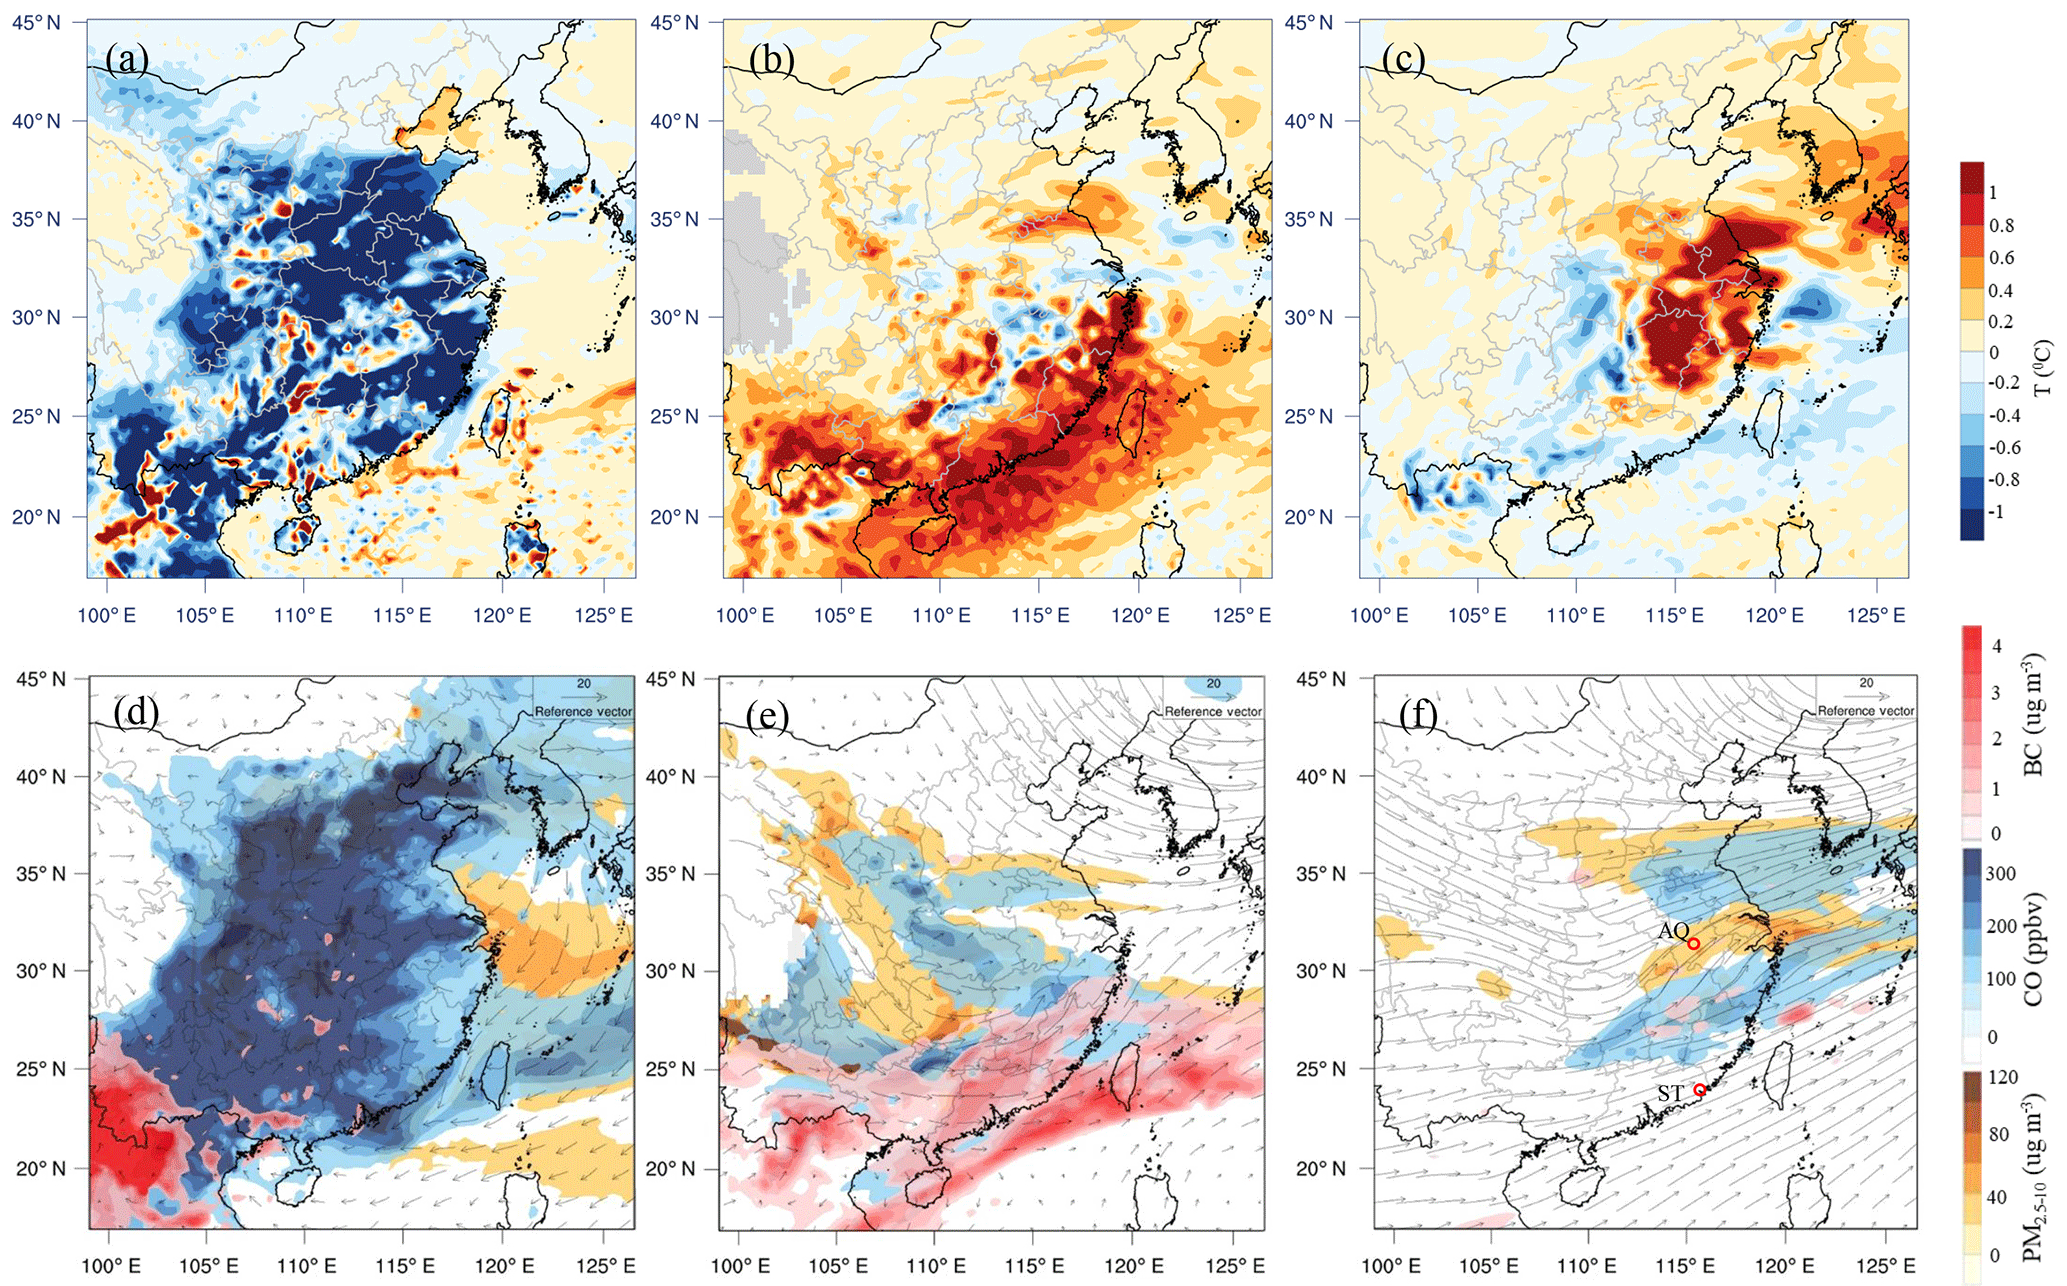
Figure 11Spatial distributions of modeled air temperature change due to the meteorological feedback of mixed pollutants and pollutant distribution at (a, d) ground surface, (b, e) 4 km in altitude and (c, f) 8 km in altitude at 12:00 LT on 23 March 2015.
3.3 Meteorological feedback of mixed pollutants
As discussed above, the frontal system lifted multiple-source pollutants up and resulted in multiple aerosol layers in the MLT. Meanwhile, it is noteworthy that both dust and BB aerosols feature high light-absorbing efficiency, which certainly exerts substantial impacts on radiation transfer and regional climate. To shed more light on aerosol–MLT meteorological feedback, we conduct two parallel simulations with (EXP_WF) and without (EXP_WoF) aerosol radiative effects. Spatial distributions of particle and temperature response to their radiative effect at different altitudes on 23 March 2015 are shown in Fig. 11. At the ground surface, light scattering and also absorption due to multi-layer aerosol resulted in substantial dimming effect. The spatial pattern of surface dimming was generally consistent with those of pollution. On the other hand, upper-air heating was found at both altitudes of 4 and 8 km (Fig. 11b–c). The 4 km warming mainly stretched along the coastal southeast China, correspondent with BC from BB in mainland Southeast Asia transported to the coastal southeast China and staggered with FF and dust aerosol belt in north of coastal regions. Meanwhile, after long-range transport, windblown dust reaching the downwind YRD suspended aloft and the influence of dust on temperature would be stronger with the several-day heating accumulation (Liu et al., 2016), which efficiently heated the surrounding air near 8 km. Previous modeling and observation studies have emphasized the importance of upper-air aerosols in changing temperature stratification because of more incident solar radiation and less efficient vertical heat exchange (Samset et al., 2014; Ding et al., 2016; Wang et al., 2018; Huang et al., 2018). In this case, BB and dust aloft caused by frontal system were expected to exert important role in changing the air temperature in the MLT. The reduced ground surface temperature and heating trend in the upper air could jointly favor the accumulation of pollutants within the boundary layer (Ding et al., 2016; Petäjä et al., 2016; Huang et al., 2018) and loft of dust in the atmosphere (Huang et al., 2015; Liu et al., 2016; Yang et al., 2017).
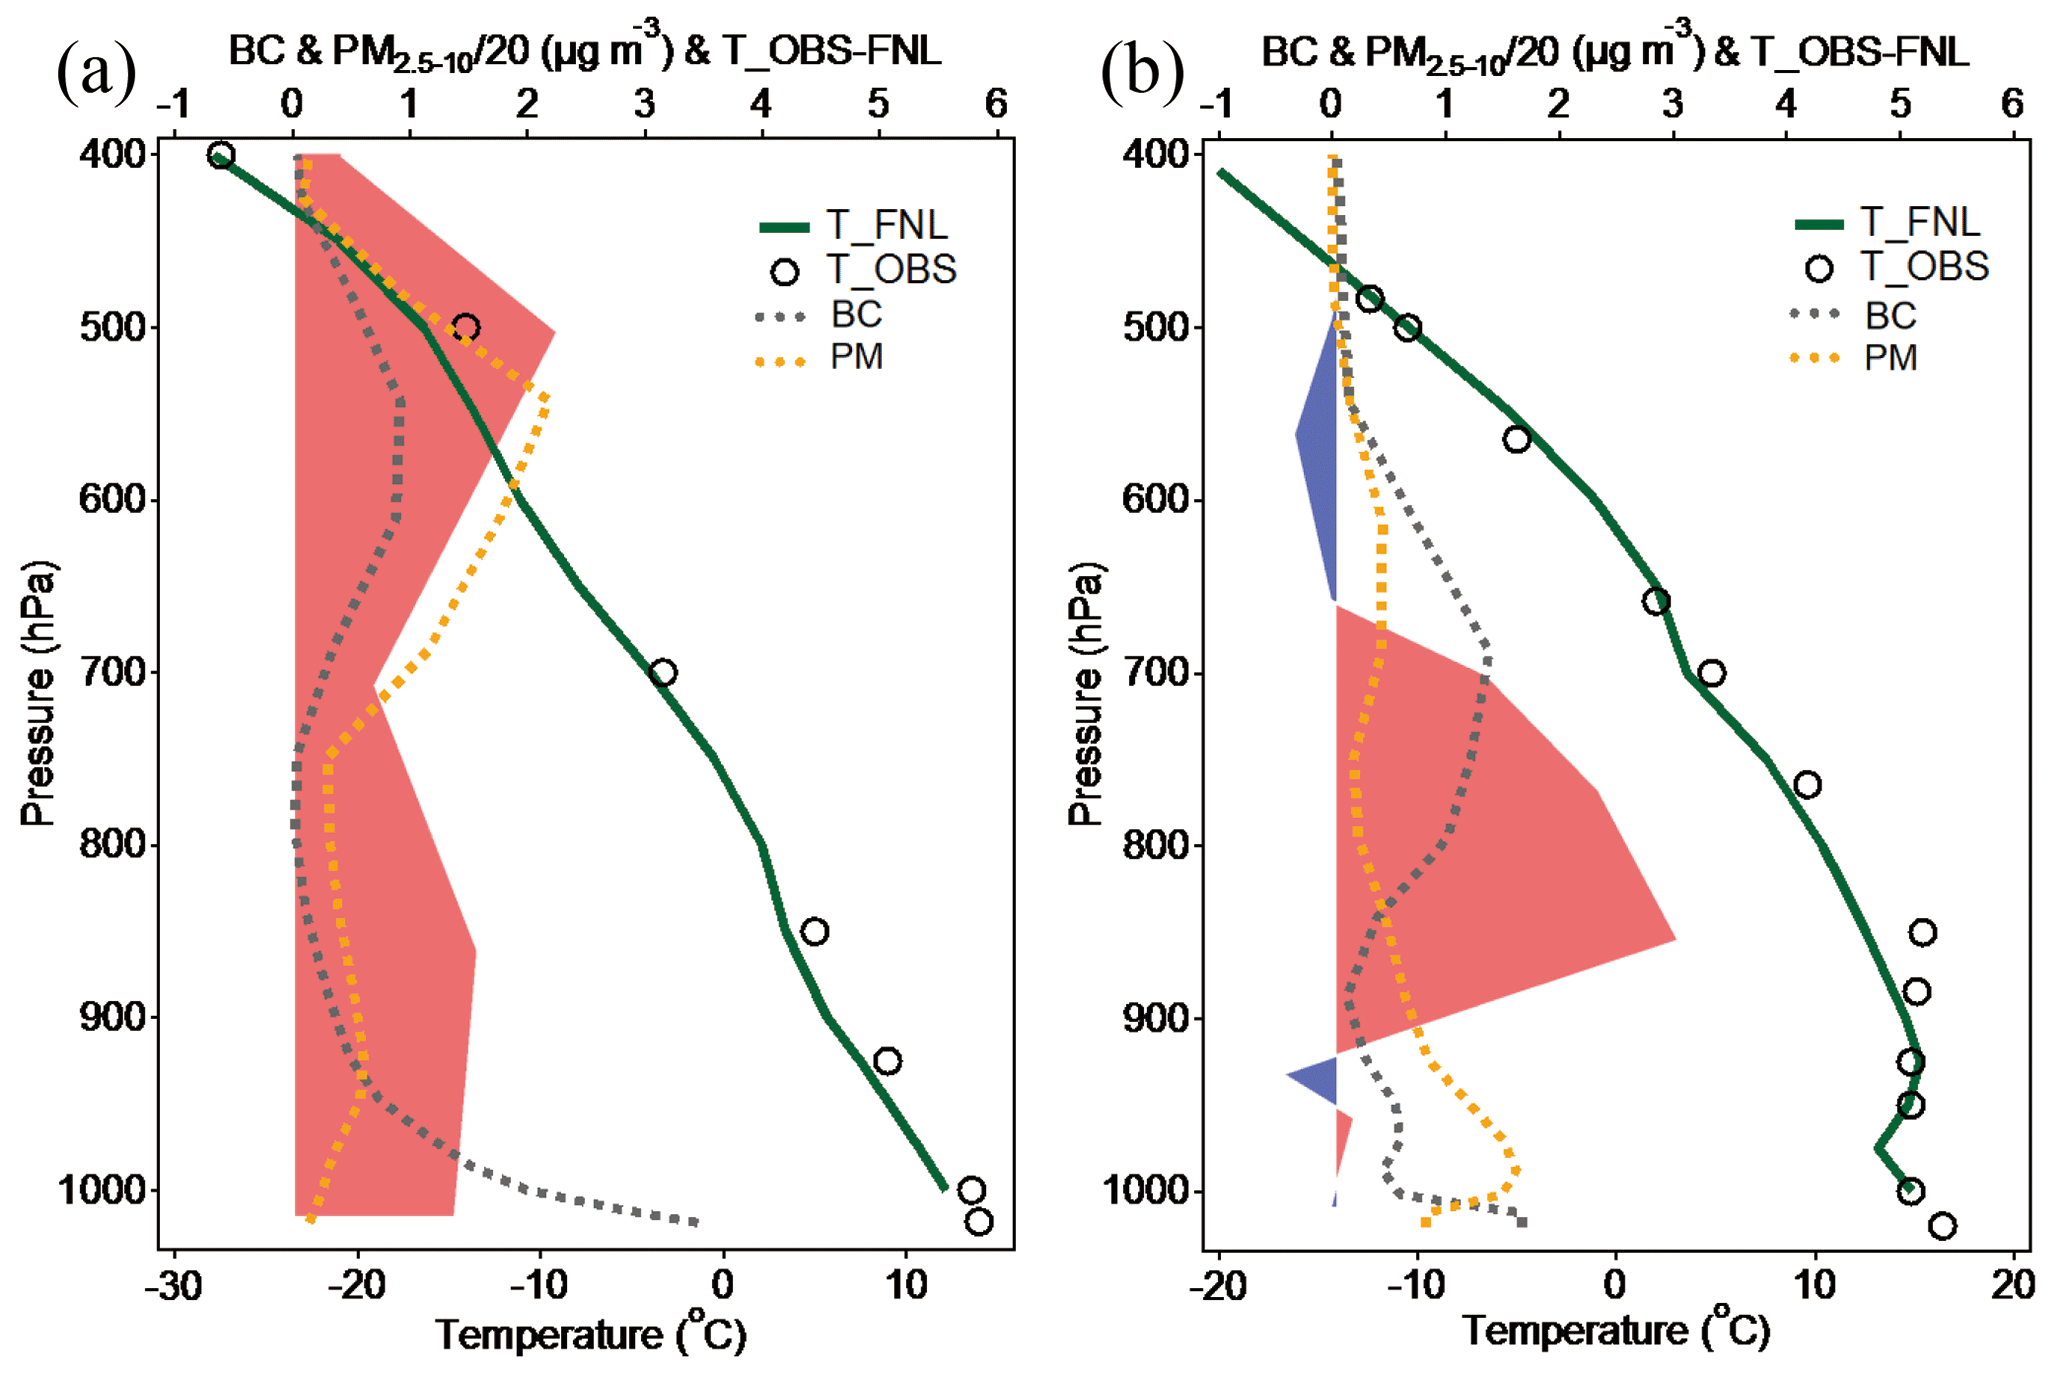
Figure 12Vertical profiles of air temperature from NCEP FNL Operational Global Analysis data, the corresponding radiosonde observations (black circles), temperature difference between observation and the FNL data (filled red and blue to zero), and calculated BC and PM2.5–10 for (a) Anqing (30.5∘ N, 117.1∘ E) and (b) Shantou (23.3∘ N, 116.7∘ E) at 20:00 LT on 23 March 2015.

Figure 13Cross section of averaged pollutants from FF (CO), BB (BC), and dust (PM2.5–10) and air temperature change diagnosed by EXP_WF and EXP_WoF (∘C) at (a) 115∘ E and (b) 120∘ E during 22–24 March 2015.
To further understand the role of dust and polluted aerosols in the aerosol-MLT meteorological feedback, we compared air temperature between FNL reanalysis data and radiosonde observations in Anqing and Shantou (locations are marked in red circle in Fig. 11f) during this case in Fig. 12. Without considering the aerosols' feedback, the NCEP FNL Operational Global Analysis data minus the observation data could be utilized to evaluate the strength of the meteorological feedback caused by aerosol. Overall, the FNL temperature profiles were basically consistent with the sounding observations. However, at the crucial layers with significant dust or BB pollution, FNL temperature showed a negative bias. Specifically, an obvious underestimation (2.3 ∘C) was apparent at 500 hPa compared with sounding data in Anqing. As mentioned above Anqing was under control of mixed pollutants uplifted by the frontal system and transport by the westerly streamline, suggesting an important role of polluted aerosols in changing the air temperature in the middle troposphere. While from 900 to 700 hPa a substantial underestimation (1.2–2.9 ∘C) was found in Shantou, indicating the temperature increase influenced by the vertical distribution of the BB aerosols in the low troposphere transported from South Asia as shown in Fig. 12b.
Cross section of averaged pollutants from FF, BB and dust and corresponding temperature perturbations along 115 and 120∘ E from 22 to 24 March were shown in Fig. 13. As shown the FF and dust pollutants dominated in the whole PBL, and lifted by the cold front to the free troposphere in the mid-latitude area. The BC calculated from BB emissions in mainland Southeast Asia was lifted by the terrain followed by eastward transport in the free troposphere and mainly distributed between 15 and 30∘ N. Since the lifted pollutants especially the BC and dust aerosol could efficiently warm the free troposphere, the MLT temperature change diagnosed by the EXP_WF and EXP_WoF averaged during these three days displays similar pattern with pollution distribution in Fig. 13. BC in the MLT and high concentrations of FF and dust pollutants accumulated in the PBL could lead to stronger warming. The 115∘ E cross section mainly passes through eastern China's urban agglomerations, and the FF and dust pollution concentrations are higher than the 120∘ E section of the eastern ocean. The warming of the inland section at 15–30∘ N and 2–8 km height is even more pronounced, especially at an altitude of 2–4 km, which is related to the higher concentration of BB aerosols over southern China. On the eastern surface of the ocean, the temperature increase at 30–45∘ N in the ground level of the eastern ocean is stronger, which is related to more apparent warming effect of FF and dust aerosol over the ocean. All these proved that the mixed pollutants and their perturbation on meteorology could transport eastward to the Pacific.
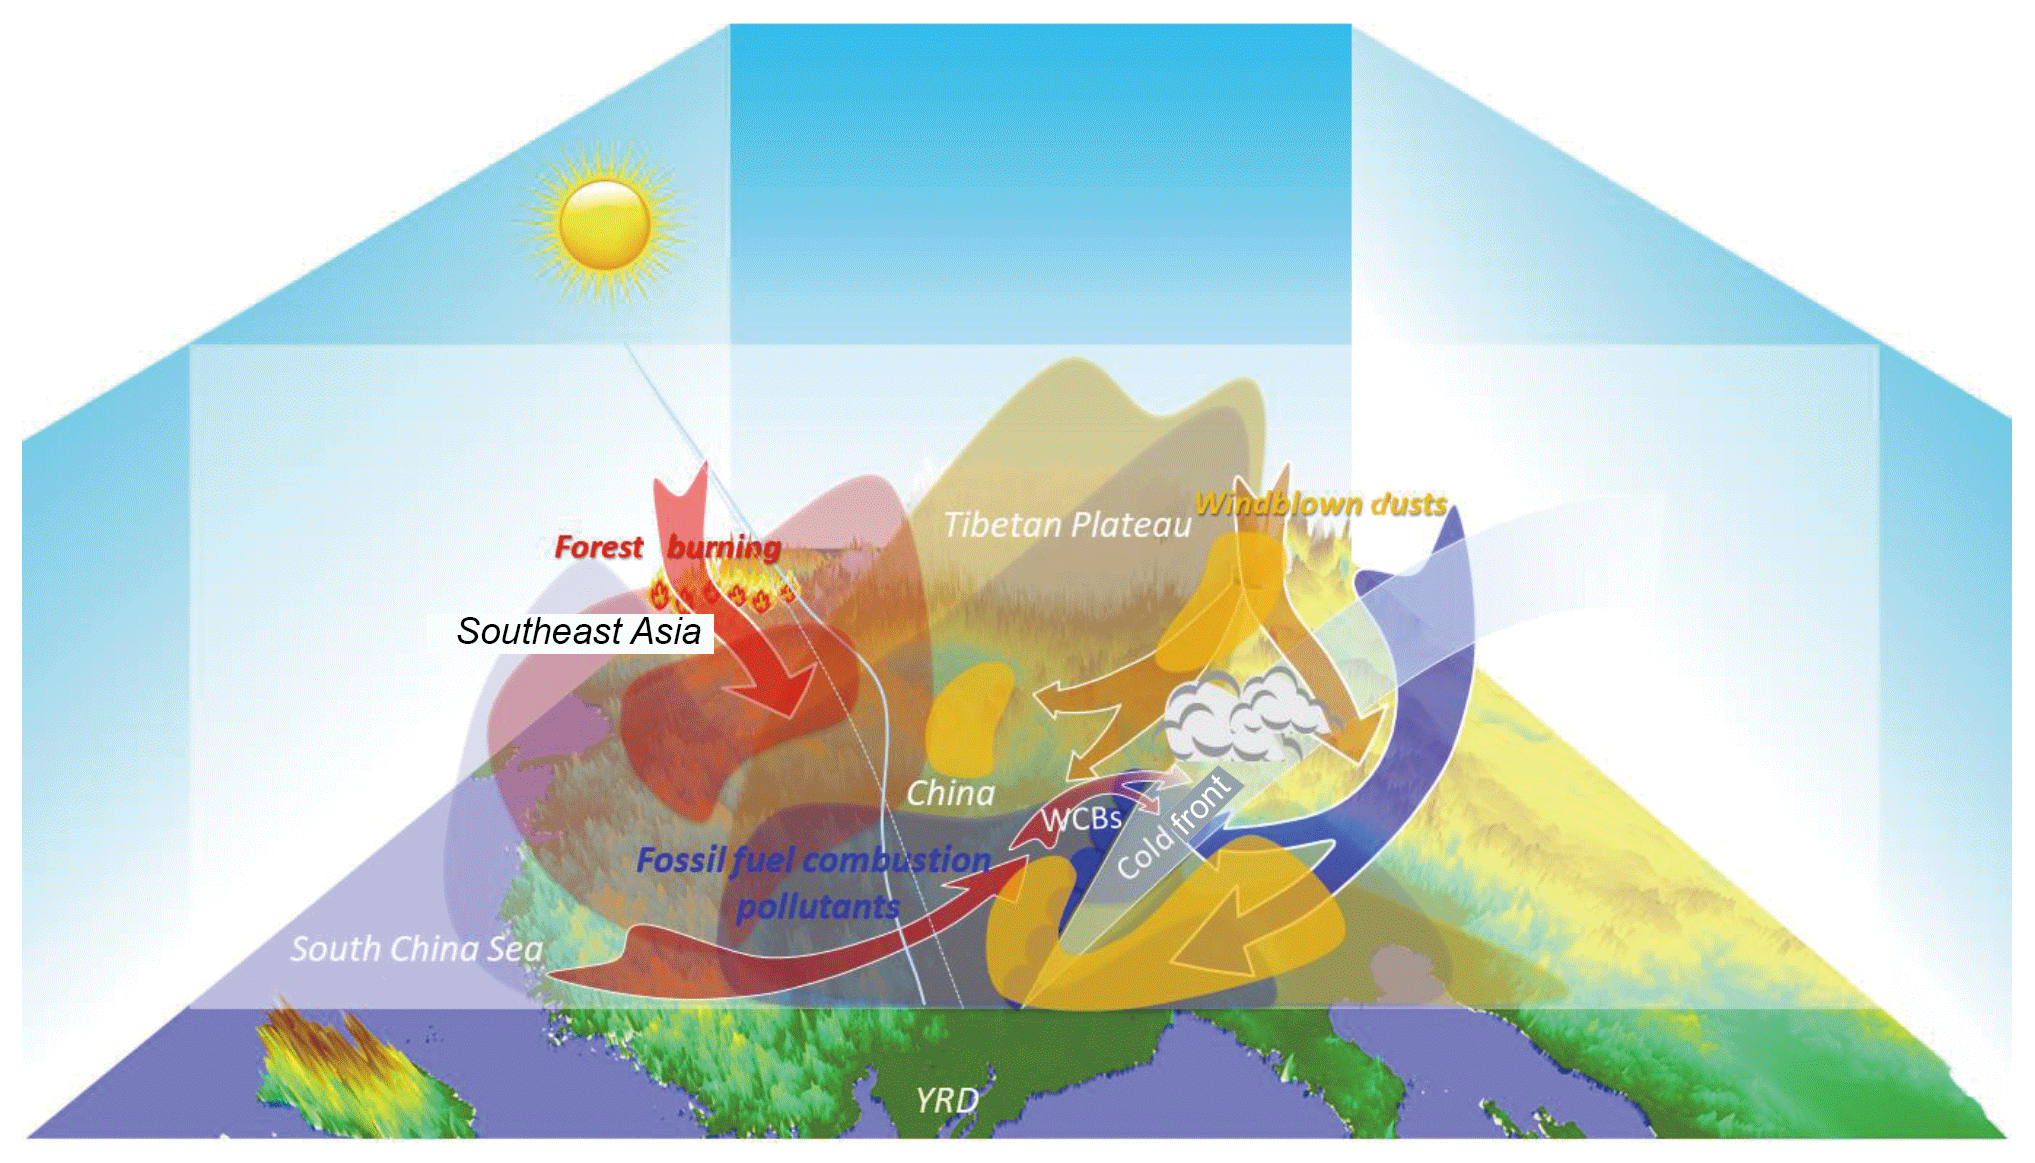
Figure 14A schematic figure for the transport, mixing and feedback of dust, biomass burning and fossil fuel combustion pollutants in eastern Asia.
Meteorological parameters are very important factors influencing routine air quality. The transport and dispersion of air pollutants was strongly affected by the synoptic weather and boundary layer dynamics. Meanwhile, high concentration of aerosols could change meteorological parameters, synoptic dynamics and even climate change through their strong radiative feedback (Hansen et al., 1997; Li et al., 2011; IPCC, 2013; Huang et al., 2015). Our previous works found how the air pollution-boundary layer feedback modifies weather and in turn how the modified meteorological conditions enhance the accumulation of air pollution (Ding et al., 2013a, 2016, 2017; Liu et al., 2016; Wang et al., 2018). This two-way interaction between air pollution and meteorological conditions was widely discussed within the PBL (Fan et al., 2015; Gao et al., 2015; Wang et al., 2015; Wilcox et al., 2016). In this case, we proved this interaction could happen in the MLT due to the special vertical distribution and transport of the mixed pollutants associated with mesoscale or large-scale synoptic weather.
Ground-based measurements, satellite observations and numerical simulations with Lagrangian dispersion model and chemical transport model are combined to investigate vertical structure, transport characteristics, source attribution and meteorological feedback for a unique multiday pollution episode in the YRD in March 2015, which was characterized by concurrent influence from multiple emission sources like fossil fuel combustion, biomass burning, and dust emission. In situ measurements in the YRD cities showed that this episode started with a high concentration of PM2.5, especially secondary inorganic compositions of , , and , and then changed into dust pollution dramatically. The secondary fine particulate pollution near the surface at the beginning was mainly influenced by local anthropogenic emissions from fossil fuel combustion sources, and the dust plumes mainly originated from the Taklimakan and Gobi deserts in northwestern China and were transported by cold fronts. The high concentrations of pollutants above the frontal system were transported from inland and lifted by the front, and the dust was mixed with anthropogenic pollution in the middle troposphere above and also behind the frontal surface. Biomass burning plumes in mainland Southeast Asia were uplifted through the terrain, transported by westerlies and staggered with anthropogenic and dust aerosols in coastal regions of southeast China in the free troposphere. The three types of pollutants could all be transported to eastern China, especially the YRD region around the latitude of 30∘ N, and caused a structure of multilayer pollutants and well-mixed pollutants there. These solar absorption aerosols, like black carbon and dust, could cause a heating effect in the MLT and cooling effect in the PBL in different quantities from south to north along the coastal China, which further caused the changes in the dynamics in the troposphere, especially in the PBL. All these processes could be summarized as a schematic figure in Fig. 14.
Spring has been considered a season with strong continental outflow in Asia. The polluted outflow will have great impact on the atmospheric environment as well as regional and global climate. What is emphasized in this study is that large-scale synoptic weather like cold fronts in spring played an important role not only in uplifting anthropogenic fossil fuel combustion sources but also in transporting naturally emitted dust and biomass burning aerosols. East Asia has experienced fast rapid industrialization and urbanization in the last decades, leading to intensive emissions of fossil fuel combustion pollutants. Simultaneously, this region is also under the influence of Asian dust storm and biomass burning in Southeast Asia in spring. Therefore, multiple-source and multilayer air pollution with distinguished emission sources can therefore be frequently observed in spring with periodic cold front activities. The mixed pollutants could experience complex chemical and physical processes in the atmosphere and subsequently modify the structure of atmospheric components and also meteorological parameters over the downwind areas, such as the Pacific Ocean. Unfortunately, existing field measurements in this region are predominately surface measurements. More emphasis ought to be laid on vertical characterization of pollution so as to get a better understanding of the vertical structure, transport and feedback mechanisms of mixed-pollutant pollution and its associated climate and environmental effects in the Asian region with intense human activities and strong monsoons.
PM2.5 and PM10 concentration data used in this work can be acquired from the radiosonde observations archived at the United States National Climatic Data Center (https://www1.ncdc.noaa.gov/pub/data/igra, last access: 10 May 2017). Model outputs are stored in the server of School of Atmospheric Sciences at Nanjing University and are available from the corresponding author upon request.
DZ, AD, had the original idea, KD, QL, and FJ performed the Model, LL, ZX, and DZ performed the integrative data analysis, DZ, AD, and XH wrote the manuscript. All authors discussed the results and commented on the paper.
The authors declare that they have no conflict of interest.
The study was supported by the National Key Research & Development Program of
China (2016YFC0200500), National Science Foundation of China (91544231,
41725020, 91744311), National Science and Technology Support Program
(2014BAC22B02 and 2014BAC22B05), Air Pollution Control Technology Support
Program of Jiangsu Province (BM2012063), and Science and Technology Support
Program of Jiangsu Province (SBE2014070928).
Edited by: Qiang Zhang
Reviewed by: three anonymous referees
Alizadeh Choobari, O., Zawar-Reza, P., and Sturman, A.: Feedback between windblown dust and planetary boundary-layer characteristics: sensitivity to boundary and surface layer parameterizations, Atmos. Environ., 61, 294–304, 2012.
Chen, S. J., Kuo, Y. H., Zhang, P. Z., and Bai, Q. F.: Synoptic Climatology of Cyclogenesis over East-Asia, 1958–1987, Mon. Weather Rev., 119, 1407–1418, https://doi.org/10.1175/1520-0493(1991)119<1407:Scocoe>2.0.Co;2, 1991.
Cheng, Y. F., Zheng, G. J., Wei, C., Mu, Q., Zheng, B., Wang, Z. B., Gao, M., Zhang, Q., He, K. B., Gregory, C., Ulrich, P., and Su, H.: Reactive nitrogen chemistry in aerosol water as a source of sulfate during haze events in China, Sci. Adv., 2, e1601530, https://doi.org/10.1126/sciadv.1601530, 2016.
Cohen, J. B., Lecoeur, E., and Hui Loong Ng, D.: Decadal-scale relationship between measurements of aerosols, land-use change, and fire over Southeast Asia, Atmos. Chem. Phys., 17, 721–743, https://doi.org/10.5194/acp-17-721-2017, 2017.
Cooper, O. R., Forster, C., Parrish, D., Trainer, M., Dunlea, E., Ryerson, T., Hubler, G., Fehsenfeld, F., Nicks, D., Holloway, J., de Gouw, J., Warneke, C., Roberts, J. M., Flocke, F., and Moody, J.: A case study of transpacific warm conveyor belt transport: Influence of merging airstreams on trace gas import to North America, J. Geophys. Res.-Atmos., 109, D23S08, https://doi.org/10.1029/2003jd003624, 2004.
Ding, A. J., Wang, T., Xue, L. K., Gao, J., Stohl, A., Lei, H. C., Jin, D. Z., Ren, Y., Wang, X. Z., Wei, X. L., Qi, Y. B., Liu, J., and Zhang, X. Q.: Transport of north China air pollution by midlatitude cyclones: Case study of aircraft measurements in summer 2007 (vol 114, D08304, 2007), J. Geophys. Res.-Atmos., 114, https://doi.org/10.1029/2009jd012339, 2009.
Ding, A. J., Fu, C. B., Yang, X. Q., Sun, J. N., Petäjä, T., Kerminen, V.-M., Wang, T., Xie, Y., Herrmann, E., Zheng, L. F., Nie, W., Liu, Q., Wei, X. L., and Kulmala, M.: Intense atmospheric pollution modifies weather: a case of mixed biomass burning with fossil fuel combustion pollution in eastern China, Atmos. Chem. Phys., 13, 10545–10554, https://doi.org/10.5194/acp-13-10545-2013, 2013a.
Ding, A. J., Fu, C. B., Yang, X. Q., Sun, J. N., Zheng, L. F., Xie, Y. N., Herrmann, E., Nie, W., Petäjä, T., Kerminen, V.-M., and Kulmala, M.: Ozone and fine particle in the western Yangtze River Delta: an overview of 1 yr data at the SORPES station, Atmos. Chem. Phys., 13, 5813–5830, https://doi.org/10.5194/acp-13-5813-2013, 2013b.
Ding, A. J., Wang, T., and Fu, C. B.: Transport characteristics and origins of carbon monoxide and ozone in Hong Kong, South China, J. Geophys. Res.-Atmos., 118, 9475–9488, https://doi.org/10.1002/jgrd.50714, 2013c.
Ding, A. J., Huang, X., Nie, W., Sun, J. N., Kerminen, V. M., Petaja, T., Su, H., Cheng, Y. F., Yang, X. Q., Wang, M. H., Chi, X. G., Wang, J. P., Virkkula, A., Guo, W. D., Yuan, J., Wang, S. Y., Zhang, R. J., Wu, Y. F., Song, Y., Zhu, T., Zilitinkevich, S., Kulmala, M., and Fu, C. B.: Enhanced haze pollution by black carbon in megacities in China, Geophys. Res. Lett., 43, 2873–2879, https://doi.org/10.1002/2016gl067745, 2016.
Ding, A. J., Huang, X., and Fu, C. B.: Air pollution and weather interaction in East Asia, Oxford Research Encyclopedia of Environmental Science, https://doi.org/10.1093/acrefore/9780199389414.013.536, 2017.
Ding, K., Liu, J., Ding, A., Liu, Q., Zhao, T. L., Shi, J., Han, Y., Wang, H., and Jiang, F.: Uplifting of carbon monoxide from biomass burning and anthropogenic sources to the free troposphere in East Asia, Atmos. Chem. Phys., 15, 2843–2866, https://doi.org/10.5194/acp-15-2843-2015, 2015.
Dong, X. and Fu, J. S.: Understanding biomass burning from Peninsular Southeast Asia, part II: interannual variability and different influences in lower and higher atmosphere levels, Atmos. Environ., 115, 9–18, 2015.
Eckhardt, S., Stohl, A., Wernli, H., James, P., Forster, C., and Spichtinger, N.: A 15-year climatology of warm conveyor belts, J. Clim., 17, 218–237, https://doi.org/10.1175/1520-0442(2004)017<0218:Aycowc>2.0.Co;2, 2004.
Fan, J. W., Rosenfeld, D., Yang, Y., Zhao, C., Leung, L. R., and Li, Z. Q.: Substantial contribution of anthropogenic air pollution to catastrophic floods in Southwest China, Geophys. Res. Lett., 42, 6066–6075, https://doi.org/10.1002/2015gl064479, 2015.
Gao, Y., Zhang, M., Liu, Z., Wang, L., Wang, P., Xia, X., Tao, M., and Zhu, L.: Modeling the feedback between aerosol and meteorological variables in the atmospheric boundary layer during a severe fog-haze event over the North China Plain, Atmos. Chem. Phys., 15, 4279–4295, https://doi.org/10.5194/acp-15-4279-2015, 2015.
Ginoux, P., Chin, M., Tegen, I., Prospero, J. M., Holben, B., Dubovik, O., and Lin, S. J.: Sources and distributions of dust aerosols simulated with the gocart model, J. Geophys. Res.-Atmos., 106, 20255–20273, 2001.
Gong, D. Y., Wang, W. S., Qian, Y., Bai, W. B., Guo, Y. X., and Mao, R.: Observed holiday aerosol reduction and temperature cooling over East Asia, J. Geophys. Res.-Atmos., 119, 6306–6324, https://doi.org/10.1002/2014jd021464, 2014.
Grell, G. A., Peckham, S. E., Schmitz, R., McKeen, S. A., Frost, G., Skamarock, W. C., and Eder, B.: Fully coupled “online” chemistry within the WRF model, Atmos. Environ., 39, 6957–6975, https://doi.org/10.1016/j.atmosenv.2005.04.027, 2005.
Hansen, J., Sato, M., and Ruedy, R.: Radiative forcing and climate response, J. Geophys. Res.-Atmos., 102, 6831–6864, https://doi.org/10.1029/96jd03436, 1997.
Hsu, N. C., Herman, J. R., and Tsay, S. C.: Radiative impacts from biomass burning in the presence of clouds during boreal spring in southeast Asia, Geophys. Res. Lett., 30, 5, https://doi.org/10.1029/2002gl016485, 2003.
Huang, K., Zhuang, G. S., Li, J. A., Wang, Q. Z., Sun, Y. L., Lin, Y. F., and Fu, J. S.: Mixing of Asian dust with pollution aerosol and the transformation of aerosol components during the dust storm over China in spring 2007, J. Geophys. Res.-Atmos., 115, D00K13, https://doi.org/10.1029/2009jd013145, 2010.
Huang, X., Song, Y., Zhao, C., Li, M. M., Zhu, T., Zhang, Q., and Zhang, X. Y.: Pathways of sulfate enhancement by natural and anthropogenic mineral aerosols in China, J. Geophys. Res.-Atmos., 119, 14165–14179, https://doi.org/10.1002/2014jd022301, 2014.
Huang, X., Song, Y., Zhao, C., Cai, X. H., Zhang, H. S., and Zhu, T.: Direct Radiative Effect by Multicomponent Aerosol over China, J. Clim., 28, 3472–3495, https://doi.org/10.1175/Jcli-D-14-00365.1, 2015.
Huang, X., Wang, Z., and Ding, A.: Impact of aerosol-PBL interaction on haze pollution: Multiyear observational evidences in North China, Geophys. Res. Lett., 45, 8596–8603, https://doi.org/10.1029/2018GL079239, 2018.
Huebert, B. J., Bates, T., Russell, P. B., Shi, G. Y., Kim, Y. J., Kawamura, K., Carmichael, G., and Nakajima, T.: An overview of ACE-Asia: Strategies for quantifying the relationships between Asian aerosols and their climatic impacts, J. Geophys. Res.-Atmos., 108, https://doi.org/10.1029/2003jd003550, 2003.
IPCC: Intergovernmental Panel on Climate Change (IPCC) Fifth Assessment Report: Climate Change 2013 (AR5), 2013.
Jacob, D. J., Crawford, J. H., Kleb, M. M., Connors, V. S., Bendura, R. J., Raper, J. L., Sachse, G. W., Gille, J. C., Emmons, L., and Heald, C. L.: Transport and Chemical Evolution over the Pacific (TRACE-P) aircraft mission: Design, execution, and first results, J. Geophys. Res.-Atmos., 108, 1–19, https://doi.org/10.1029/2002jd003276, 2003.
Lee, H. J., Kim, S. W., Brioude, J., Cooper, O. R., Frost, G. J., Kim, C. H., Park, R. J., Trainer, M., and Woo, J. H.: Transport of NOx in East Asia identified by satellite and in situ measurements and Lagrangian particle dispersion model simulations, J. Geophys. Res.-Atmos., 119, 2574–2596, https://doi.org/10.1002/2013jd021185, 2014.
Levin, Z., Ganor, E., and Gladstein, V.: The effects of desert particles coated with sulfate on rain formation in the eastern Mediterranean, J. Appl. Meteorol., 35, 1511–1523, https://doi.org/10.1175/1520-0450(1996)035<1511:Teodpc>2.0.Co;2, 1996.
Li, Z. Q., Niu, F., Fan, J. W., Liu, Y. G., Rosenfeld, D., and Ding, Y. N.: Long-term impacts of aerosols on the vertical development of clouds and precipitation, Nat. Geosci., 4, 888–894, https://doi.org/10.1038/Ngeo1313, 2011.
Lin, N. H., Sayer, A. M., Wang, S. H., Loftus, A. M., Hsiao, T. C., Sheu, G. R., Hsu, N. C., Tsay, S. C., and Chantara, S.: Interactions between biomass-burning aerosols and clouds over Southeast Asia: Current status, challenges, and perspectives, Environ. Pollut., 195, 292–307, https://doi.org/10.1016/j.envpol.2014.06.036, 2014.
Liu, H. Y., Jacob, D. J., Bey, I., Yantosca, R. M., Duncan, B. N., and Sachse, G. W.: Transport pathways for Asian pollution outflow over the Pacific: Interannual and seasonal variations, J. Geophys. Res.-Atmos., 108, D20, https://doi.org/10.1029/2002jd003102, 2003.
Liu, L. X., Huang, X., Ding, A. J., and Fu, C. B.: Dust-induced radiative feedbacks in north China: A dust storm episode modeling study using WRF-Chem, Atmos. Environ., 129, 43–54, https://doi.org/10.1016/j.atmosenv.2016.01.019, 2016.
Liu, Z. Q., Liu, Q. H., Lin, H. C., Schwartz, C. S., Lee, Y. H., and Wang, T. J.: Three-dimensional variational assimilation of MODIS aerosol optical depth: Implementation and application to a dust storm over East Asia, J. Geophys. Res.-Atmos., 116, D23206, https://doi.org/10.1029/2011jd016159, 2011.
Mori, I., Nishikawa, M., Tanimura, T., and Quan, H.: Change in size distribution and chemical composition of kosa (Asian dust) aerosol during long-range transport, Atmos. Environ., 37, 4253–4263, https://doi.org/10.1016/S1352-2310(03)00535-1, 2003.
Mu, Q., Shiraiwa, M., Octaviani, M., Ma, N., Ding, A. J., Su, H., Lammel, G., Pöschl, U., and Cheng, Y. F.: Temerature effect on phase state and reactivity controls atmospheric multiphase chemistry and transport of PAHs, Sci. Adv., 4, eaap7314, https://doi.org/10.1126/sciadv.aap7314, 2018.
Nie, W., Ding, A. J., Wang, T., Kerminen, V. M., George, C., Xue, L. K., Wang, W. X., Zhang, Q. Z., Petaja, T., Qi, X. M., Gao, X. M., Wang, X. F., Yang, X. Q., Fu, C. B., and Kulmala, M.: Polluted dust promotes new particle formation and growth, Sci. Rep., 4, 6634, https://doi.org/10.1038/srep06634, 2014.
Parrish, D. D., Trainer, M., Holloway, J. S., Yee, J. E., Warshawsky, M. S., and Fehsenfeld, F. C.: Relationships between ozone and carbon monoxide at surface sites in the North Atlantic region, J. Geophys. Res., 103, 13357–13376, 1998.
Petäjä, T., Jarvi, L., Kerminen, V. M., Ding, A. J., Sun, J. N., Nie, W., Kujansuu, J., Virkkula, A., Yang, X. Q., Fu, C. B., Zilitinkevich, S., and Kulmala, M.: Enhanced air pollution via aerosol-boundary layer feedback in China, Sci. Rep., 6, 18998, https://doi.org/10.1038/srep18998, 2016.
Reid, J. S., Hyer, E. J., Johnson, R. S., Holben, B. N., Yokelson, R. J., Zhang, J. L., Campbell, J. R., Christopher, S. A., Di Girolamo, L., Giglio, L., Holz, R. E., Kearney, C., Miettinen, J., Reid, E. A., Turk, F. J., Wang, J., Xian, P., Zhao, G. Y., Balasubramanian, R., Chew, B. N., Janjai, S., Lagrosas, N., Lestari, P., Lin, N. H., Mahmud, M., Nguyen, A. X., Norris, B., Oanh, N. T. K., Oo, M., Salinas, S. V., Welton, E. J., and Liew, S. C.: Observing and understanding the Southeast Asian aerosol system by remote sensing: An initial review and analysis for the Seven Southeast Asian Studies (7SEAS) program, Atmos. Res., 122, 403–468, https://doi.org/10.1016/j.atmosres.2012.06.005, 2013.
Samset, B. H., Myhre, G., Herber, A., Kondo, Y., Li, S.-M., Moteki, N., Koike, M., Oshima, N., Schwarz, J. P., Balkanski, Y., Bauer, S. E., Bellouin, N., Berntsen, T. K., Bian, H., Chin, M., Diehl, T., Easter, R. C., Ghan, S. J., Iversen, T., Kirkevåg, A., Lamarque, J.-F., Lin, G., Liu, X., Penner, J. E., Schulz, M., Seland, Ø., Skeie, R. B., Stier, P., Takemura, T., Tsigaridis, K., and Zhang, K.: Modelled black carbon radiative forcing and atmospheric lifetime in AeroCom Phase II constrained by aircraft observations, Atmos. Chem. Phys., 14, 12465–12477, https://doi.org/10.5194/acp-14-12465-2014, 2014.
Song, C. H., Maxwell-Meier, K., Weber, R. J., Kapustin, V., and Clarke, A.: Dust composition and mixing state inferred from airborne composition measurements during ACE-Asia C130 Flight #6, Atmos. Environ., 39, 359–369, https://doi.org/10.1016/j.atmosenv.2004.08.046, 2005.
Stein, A. F., Draxler, R. R., Rolph, G. D., Stunder, B. J. B., Cohen, M. D., and Ngan, F.: Noaa's Hysplit Atmospheric Transport and Dispersion Modeling System, B. Am. Meteorol. Soc., 96, 2059–2077, https://doi.org/10.1175/Bams-D-14-00110.1, 2015.
Stohl, A., Eckhardt, S., Forster, C., James, P., and Spichtinger, N.: On the pathways and timescales of intercontinental air pollution transport, J. Geophys. Res.-Atmos., 107, 4684, https://doi.org/10.1029/2001jd001396, 2002.
Stohl, A., Forster, C., Frank, A., Seibert, P., and Wotawa, G.: Technical note: The Lagrangian particle dispersion model FLEXPART version 6.2, Atmos. Chem. Phys., 5, 2461–2474, https://doi.org/10.5194/acp-5-2461-2005, 2005.
van der Werf, G. R., Randerson, J. T., Giglio, L., Collatz, G. J., Kasibhatla, P. S., and Arellano Jr., A. F.: Interannual variability in global biomass burning emissions from 1997 to 2004, Atmos. Chem. Phys., 6, 3423–3441, https://doi.org/10.5194/acp-6-3423-2006, 2006.
van Donkelaar, A., Martin, R. V., Brauer, M., Kahn, R., Levy, R., Verduzco, C., and Villeneuve, P. J.: Global Estimates of Ambient Fine Particulate Matter Concentrations from Satellite-Based Aerosol Optical Depth: Development and Application, Environ. Health. Persp., 118, 847–855, https://doi.org/10.1289/ehp.0901623, 2010.
Wang, H., Shi, G. Y., Zhang, X. Y., Gong, S. L., Tan, S. C., Chen, B., Che, H. Z., and Li, T.: Mesoscale modelling study of the interactions between aerosols and PBL meteorology during a haze episode in China Jing-Jin-Ji and its near surrounding region – Part 2: Aerosols' radiative feedback effects, Atmos. Chem. Phys., 15, 3277–3287, https://doi.org/10.5194/acp-15-3277-2015, 2015.
Wang, T., Ding, A. J., Blake, D. R., Zahorowski, W., Poon, C. N., and Li, Y. S.: Chemical characterization of the boundary layer outflow of air pollution to Hong Kong during February–April 2001, J. Geophys. Res.-Atmos., 108, 8787, https://doi.org/10.1029/2002JD003272, 2003.
Wang, Z., Huang, X., and Ding, A.: Dome effect of black carbon and its key influencing factors: a one-dimensional modelling study, Atmos. Chem. Phys., 18, 2821–2834, https://doi.org/10.5194/acp-18-2821-2018, 2018.
Wilcox, E. M., Thomas, R. M., Praveen, P. S., Pistone, K., Bender, F. A. M., and Ramanathan, V.: Black carbon solar absorption suppresses turbulence in the atmospheric boundary layer, P. Natl. Acad. Sci. USA, 113, 11794–11799, https://doi.org/10.1073/pnas.1525746113, 2016.
Winker, D. M., Vaughan, M. A., Omar, A., Hu, Y. X., Powell, K. A., Liu, Z. Y., Hunt, W. H., and Young, S. A.: Overview of the CALIPSO Mission and CALIOP Data Processing Algorithms, J. Atmos. Ocean. Tech., 26, 2310–2323, https://doi.org/10.1175/2009jtecha1281.1, 2009.
Wu, G. X., Li, Z. Q., Fu, C. B., Zhang, X. Y., Zhang, R. Y., Zhang, R. H., Zhou, T. J., Li, J. P., Li, J. D., Zhou, D. G., Wu, L., Zhou, L. T., He, B., and Huang, R. H.: Advances in studying interactions between aerosols and monsoon in China, Sci. China-Earth Sci., 59, 1–16, https://doi.org/10.1007/s11430-015-5198-z, 2016.
Xie, Y. N., Ding, A. J., Nie, W., Mao, H. T., Qi, X. M., Huang, X., Xu, Z., Kerminen, V. M., Petaja, T., Chi, X. G., Virkkula, A., Boy, M., Xue, L. K., Guo, J., Sun, J. N., Yang, X. Q., Kulmala, M., and Fu, C. B.: Enhanced sulfate formation by nitrogen dioxide: Implications from in situ observations at the SORPES station, J. Geophys. Res.-Atmos., 120, 12679–12694, https://doi.org/10.1002/2015jd023607, 2015.
Xu, Z., Huang, X., Nie, W., Shen, Y., Zheng, L., Xie, Y., Wang, T., Ding, K., Liu, L., Zhou, D., Qi, X., and Ding, A.: Impact of biomass burning and vertical mixing of residual-layer aged plumes on ozone in the Yangtze River Delta, China: A tethered-balloon measurement and modeling study of a multiday ozone episode, J. Geophys. Res.-Atmos., 123, JGRD54993, https://doi.org/10.1029/2018JD028994, 2018.
Yang, Y., Russell, L. M. Lou, S. J., Liao, H., Guo, J. P., Liu, Y., Singh, B., and Ghan, S. J.: Dust-wind interactions can intesnfiy aerosol pollution over eastern China, Nat. Commun., 8, 15333, https://doi.org/10.1038/ncomms15333, 2017.
Zhang, K., Chai, F. H., Zhang, R. J., and Xue, Z. G.: Source, route and effect of Asian sand dust on environment and the oceans, Particuology, 8, 319–324, https://doi.org/10.1016/j.partic.2010.03.016, 2010.
Zhang, X. Y., Wang, Y. Q., Niu, T., Zhang, X. C., Gong, S. L., Zhang, Y. M., and Sun, J. Y.: Atmospheric aerosol compositions in China: spatial/temporal variability, chemical signature, regional haze distribution and comparisons with global aerosols, Atmos. Chem. Phys., 12, 779–799, https://doi.org/10.5194/acp-12-779-2012, 2012.
Zhang, Y., Ding, A. J., Mao, H. T., Nie, W., Zhou, D. R., Liu, L. X., Huang, X., and Fu, C. B.: Impact of synoptic weather patterns and inter-decadal climate variability on air quality in the North China Plain during 1980–2013, Atmos. Environ., 124, 119–128, https://doi.org/10.1016/j.atmosenv.2015.05.063, 2016.
Zhou, D. R., Ding, A. J., Mao, H. T., Fu, C. B., Wang, T., Chan, L. Y., Ding, K., Zhang, Y., Liu, J., Lu, A., and Hao, N.: Impacts of the East Asian monsoon on lower tropospheric ozone over coastal South China, Environ. Res. Lett., 8, 044011, https://doi.org/10.1088/1748-9326/8/4/044011, 2013.
Zhou, D. R., Li, B., Huang, X., Virkkula, A., Wu, H. S., Zhao, Q. Y., Zhang, J., Liu, Q., Li, L., Li, C. Y., Chen, F., Yuan, S. Y., Qiao, Y. Z., Shen, G. F., and Ding, A. J.: The Impacts of Emission Control and Regional Transport on PM2.5 Ions and Carbon Components in Nanjing during the 2014 Nanjing Youth Olympic Games, Aerosol Air. Qual. Res., 17, 730–740, https://doi.org/10.4209/aaqr.2016.03.0131, 2017.