the Creative Commons Attribution 4.0 License.
the Creative Commons Attribution 4.0 License.
 | 08 Nov 2018
Solar and lunar tides in noctilucent clouds as determined by ground-based lidar
Jens Fiedler
Gerd Baumgarten
Noctilucent clouds (NLCs) occur during summer from midlatitudes to high latitudes. They consist of nanometer-sized ice particles in an altitude range from 80 to 90 km and are sensitive to ambient temperature and water vapor content, which makes them a suitable tracer for variability on all timescales. The data set acquired by the ALOMAR Rayleigh–Mie–Raman (RMR) lidar covers 21 years and is investigated regarding tidal signatures in NLCs. For the first time solar and lunar tidal parameters in NLCs were determined simultaneously from the same data. Several NLC parameters are subject to persistent mean variations throughout the solar day as well as the lunar day. Variations with lunar time are generally smaller compared to variations with solar time. NLC occurrence frequency shows the most robust imprint of the lunar semidiurnal tide. Its amplitude is about 50 % of the solar semidiurnal tide, which is surprisingly large. Phase progressions of NLC occurrence frequency indicate upward propagating solar tides. Below 84 km altitude the corresponding vertical wavelengths are between 20 and 30 km. For the lunar semidiurnal tide phase progressions vary symmetrically with respect to the maximum of the NLC layer.


Noctilucent clouds (NLCs) are a phenomenon of the mesopause region from midlatitudes to high latitudes. During summer temperatures fall below 150 K and cause the few ppmv of water vapor at these altitudes to freeze. The result is tiny ice particles which are observable with the naked eye. First documented observations were made during summer 1885 (Backhouse, 1885; Jesse, 1885; Leslie, 1885) and the altitude of the clouds was determined to about 83 km by optical triangulation (Jesse, 1896).
It has been shown that NLCs consist of aspherical ice particles of a few tens of nanometers, with a number density of about 100 per cm3 (Baumgarten et al., 2002; Hervig et al., 2001; von Cossart et al., 1999). NLC displays often show pronounced variability, which provides information about dynamic processes like horizontal wind and wave motions in their environment (Witt, 1962). Mesospheric ice particles are extremely sensitive to changes of atmospheric background parameters, like temperature and water vapor, and have been demonstrated to respond to various scales of variability, ranging from seconds to years (DeLand et al., 2003; Fiedler et al., 2017; Kaifler et al., 2013; Kirkwood and Stebel, 2003; Merkel et al., 2003; Russell III et al., 2014; Thomas et al., 1991).
One particular scale of interest is variations with solar time (Chu et al., 2001; Fiedler et al., 2005; Gerding et al., 2013; von Zahn et al., 1998). Such oscillations have been found to be persistent, even when epoch averaging over many years is applied, and were attributed to impacts of atmospheric thermal tides (Fiedler et al., 2011; Stevens et al., 2017). Solar tidal oscillations are globally forced due to absorption of solar irradiance throughout the day. Diurnal and semidiurnal components have a prominent influence; they are stimulated by absorption of solar radiation in the near-infrared bands of tropospheric water vapor and solar ultraviolet radiation by stratospheric ozone and mesospheric molecular oxygen, respectively (Chapman and Lindzen, 1970; Forbes, 1984).
The moon forces gravitational tidal signatures not only in Earth's oceans but also in the atmosphere. Sabine (1847) published the first reliable identification of lunar tidal signatures in surface pressure data. The semidiurnal lunar tide is the most significant component and was found in several parameters, even in the mesosphere and lower thermosphere like winds, temperatures and airglow emissions (Paulino et al., 2013; Stening et al., 1987; von Savigny et al., 2015). Studies of lunar tidal signatures in NLCs are sparse and mostly based on ground-based visual observations (Dalin et al., 2006; Gadsden, 1985; Kropotkina and Shefov, 1975). Only recently was the lunar semidiurnal tide identified in multiyear data sets of satellite instruments (Hoffmann et al., 2018; von Savigny et al., 2017). Ground- and satellite-based results partly differ from each other, especially for the lunar tidal amplitude.
In general, available observation methods of tides in NLCs have different pros and cons. Ground-based visual data can only be obtained around solar midnight hours when the lower troposphere is dark but sunlight still illuminates the upper mesosphere and is scattered at the ice particles. This hampers the identification of both solar and lunar tidal signatures. Ground-based lidars can cover the entire solar diurnal cycle and are thus able to identify solar and lunar tides. As they operate at fixed locations, the superposition of all tidal components above the instrument is measured, with the migrating components giving the distinct variations with solar time. Solar and lunar semidiurnal periods are close to each other (12.0 vs. 12.4 solar hours) and a separation requires adequate sampling and data accuracy. Satellite instruments usually operate in sun-synchronous orbits and cover only few solar times during longer time periods. On the one hand this hampers the identification of solar tidal signatures, and on the other hand they have less deterioration of the lunar signal by solar impacts. Moon's orbit around the Earth as well as Earth's rotation around its axis are of identical direction; however, Moon's orbital speed is slower. For this reason its apparent Earth revolution takes about 50 min longer than 24 h, which accumulates to a full day within a month's period. Hence it takes 1 month for sun-synchronous satellites to cover all lunar times.
In this study, for the first time, we will extract solar and lunar tidal signatures in NLCs simultaneously from a multiyear data set obtained using ground-based lidar. Moreover, phase progressions will be addressed through the investigation of altitude-resolved tidal parameters.
We use data obtained by the Rayleigh–Mie–Raman (RMR) lidar at the ALOMAR research station in northern Norway (69∘ N, 16∘ E). The lidar has been in regular operation since 1997 and is intensely used during the summer months for NLC detections whenever weather conditions permit. Because of the technical setup, NLCs are detectable during all local times, even during the highest solar elevation angles around 44∘. NLCs above ALOMAR usually occur between the beginning of June and mid-August, leading to our definition of the season length from day of year (DoY) 152 (1 June) to 227 (15 August). The data set covers 6400 measurement hours during 21 seasons. A subset of 3100 h contains NLCs, yielding a mean probability of ∼48 % of observing NLCs at this location.
The lidar transmitter emits light at 532 nm wavelength with approx. 50 MW power per laser pulse. Part of it is backscattered by air molecules and NLC particles and detected by the receiver, together with sunlight scattered by the atmosphere. After background subtraction the received signal is first converted into a backscatter ratio R(z), which is a measure for the presence of aerosol particles and defined as the ratio of the measured total signal to the molecular signal βM(z). Then the volume backscatter coefficient of NLC particles is calculated; βM(z) is calculated from air densities for the lidar location (Lübken, 1999). From the altitude profile βNLC(z) we determine the maximum value βmax, the total backscatter coefficient βtot (integral over the vertical layer extension) and the centroid altitude (zc). The ratio of time with NLC signatures over total measurement time yields the occurrence frequency (OF). For more details the reader is referred to Fiedler et al. (2009). To maintain homogeneous conditions during 21 seasons, the data were pre-integrated in time and altitude for about 15 min and 150 m.
In a next step, the measurements were sorted by local time; i.e., the individual pre-integrations were accumulated and averaged in their corresponding hourly time slots. This method is usually called superposed epoch analysis (Chree, 1912) and was applied for solar times as well as lunar times separately. Lunar, like solar, time follows from the azimuth position of the celestial body relative to the observer. For a given solar time Moon ephemerides were calculated using the PyEphem library (https://rhodesmill.org/pyephem/, last access: 6 November 2018). To extract tidal information from the temporal variations of NLC parameters, least-square fits of the sum of sinusoidal functions with periods of 24, 12, 8, and 6 h to the hourly mean values (solar as well as lunar epoch averages) were performed. Confidence intervals of the estimated fit parameters were calculated with the bootstrap method by resampling the data set within the uncertainties of the means (Efron and Tibshirani, 1993). The mean NLC parameters are randomly diversified within their error bars (1000 times for each hour), which results in an equivalent number of time series for which the fits are determined. Finally, the statistics of the distribution of each fit parameter is calculated, resulting in a mean value and its error.
3.1 Variations with solar time
Figure 1 shows the mean variations of NLC occurrence frequency and brightness with altitude and time. The plots contain 6400 measurement hours including 3100 h with NLCs and were composed using individual altitude profiles from 1997 to 2017. NLCs above ALOMAR can virtually exist in the entire altitude range between 78 and 90 km. They occur most often and have the largest vertical extent between midnight and 06:00 local solar time (LST), which was attributed to thermal tides at 83 km altitude (Fiedler et al., 2011). The altitude of maximum occurrence decreases by about 1 km during the morning hours. A second and weaker occurrence maximum is visible around 15:00 LST. The clouds reach their maximum brightness between 03:00 and 09:00 LST, which is 3 h later compared to the occurrence maximum. Nevertheless relatively strong (brighter) clouds contribute to this occurrence maximum. The secondary occurrence maximum, however, is caused only by fainter (dimmer) clouds. The altitude structure of brightness mirrors the growth-sedimentation scenario of NLC particles. They nucleate at low temperatures in the mesopause region around 88 km, grow in size by the uptake of water vapor and decrease in altitude due to selective turbulent diffusion and gravitation. The observed brightness depends strongly on particle size (∝ r6). Temperature increases with decreasing altitude, which causes the ice particles to sublimate. This leads to a sharp brightness decrease at the lower border of the particle existence range.
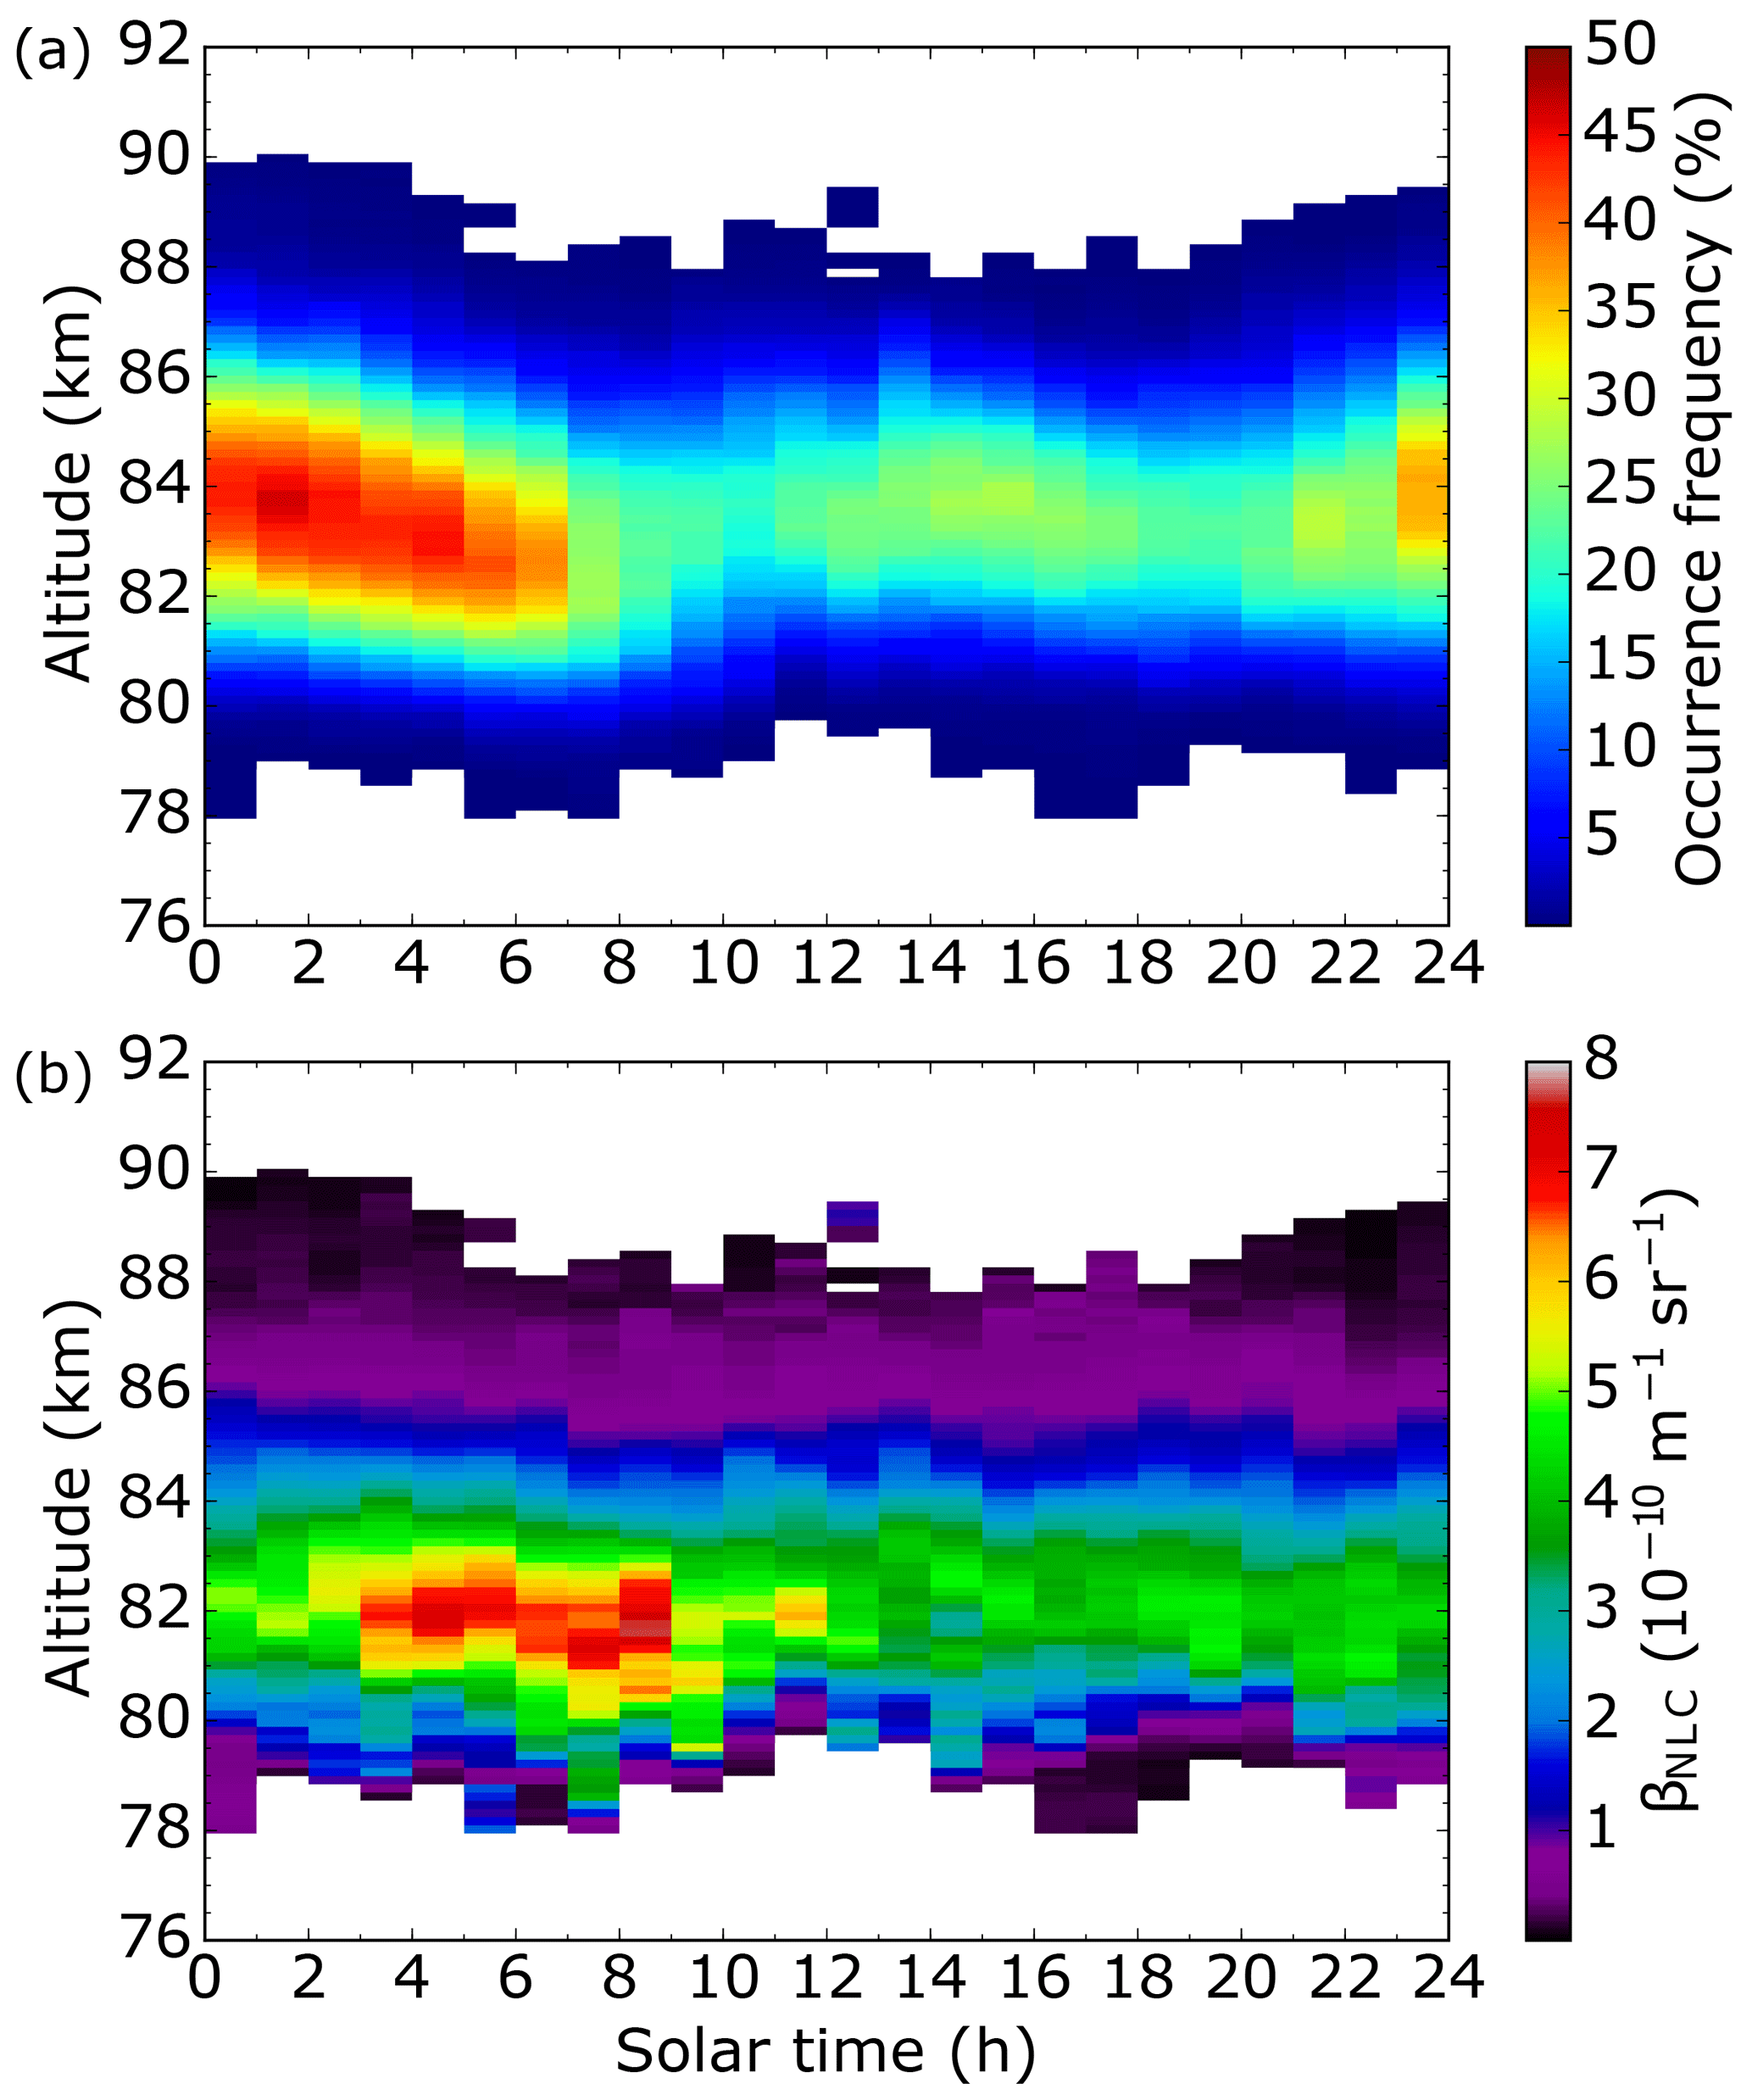
Figure 1Mean altitude and solar time variations of NLC occurrence frequency (a) and brightness (b) between 1 June and 15 August from 1997 to 2017. The plots are composed of altitude profiles covering 3100 h of NLC detections; panel (a) contains 6400 h total measurement time.
We would like to point out that one cannot prove from measurements at one location that observed local-time-dependent features are caused by tides. However, the persistence of features in our 21 year data set shown in Fig. 1 is a strong indication for atmospheric tides. Imprints of variability sources uncorrelated to solar time, like gravity waves, should cancel out on these multiyear timescales. Furthermore we observe a superposition of all existing tidal modes at a given time and cannot differentiate between migrating and nonmigrating parts.
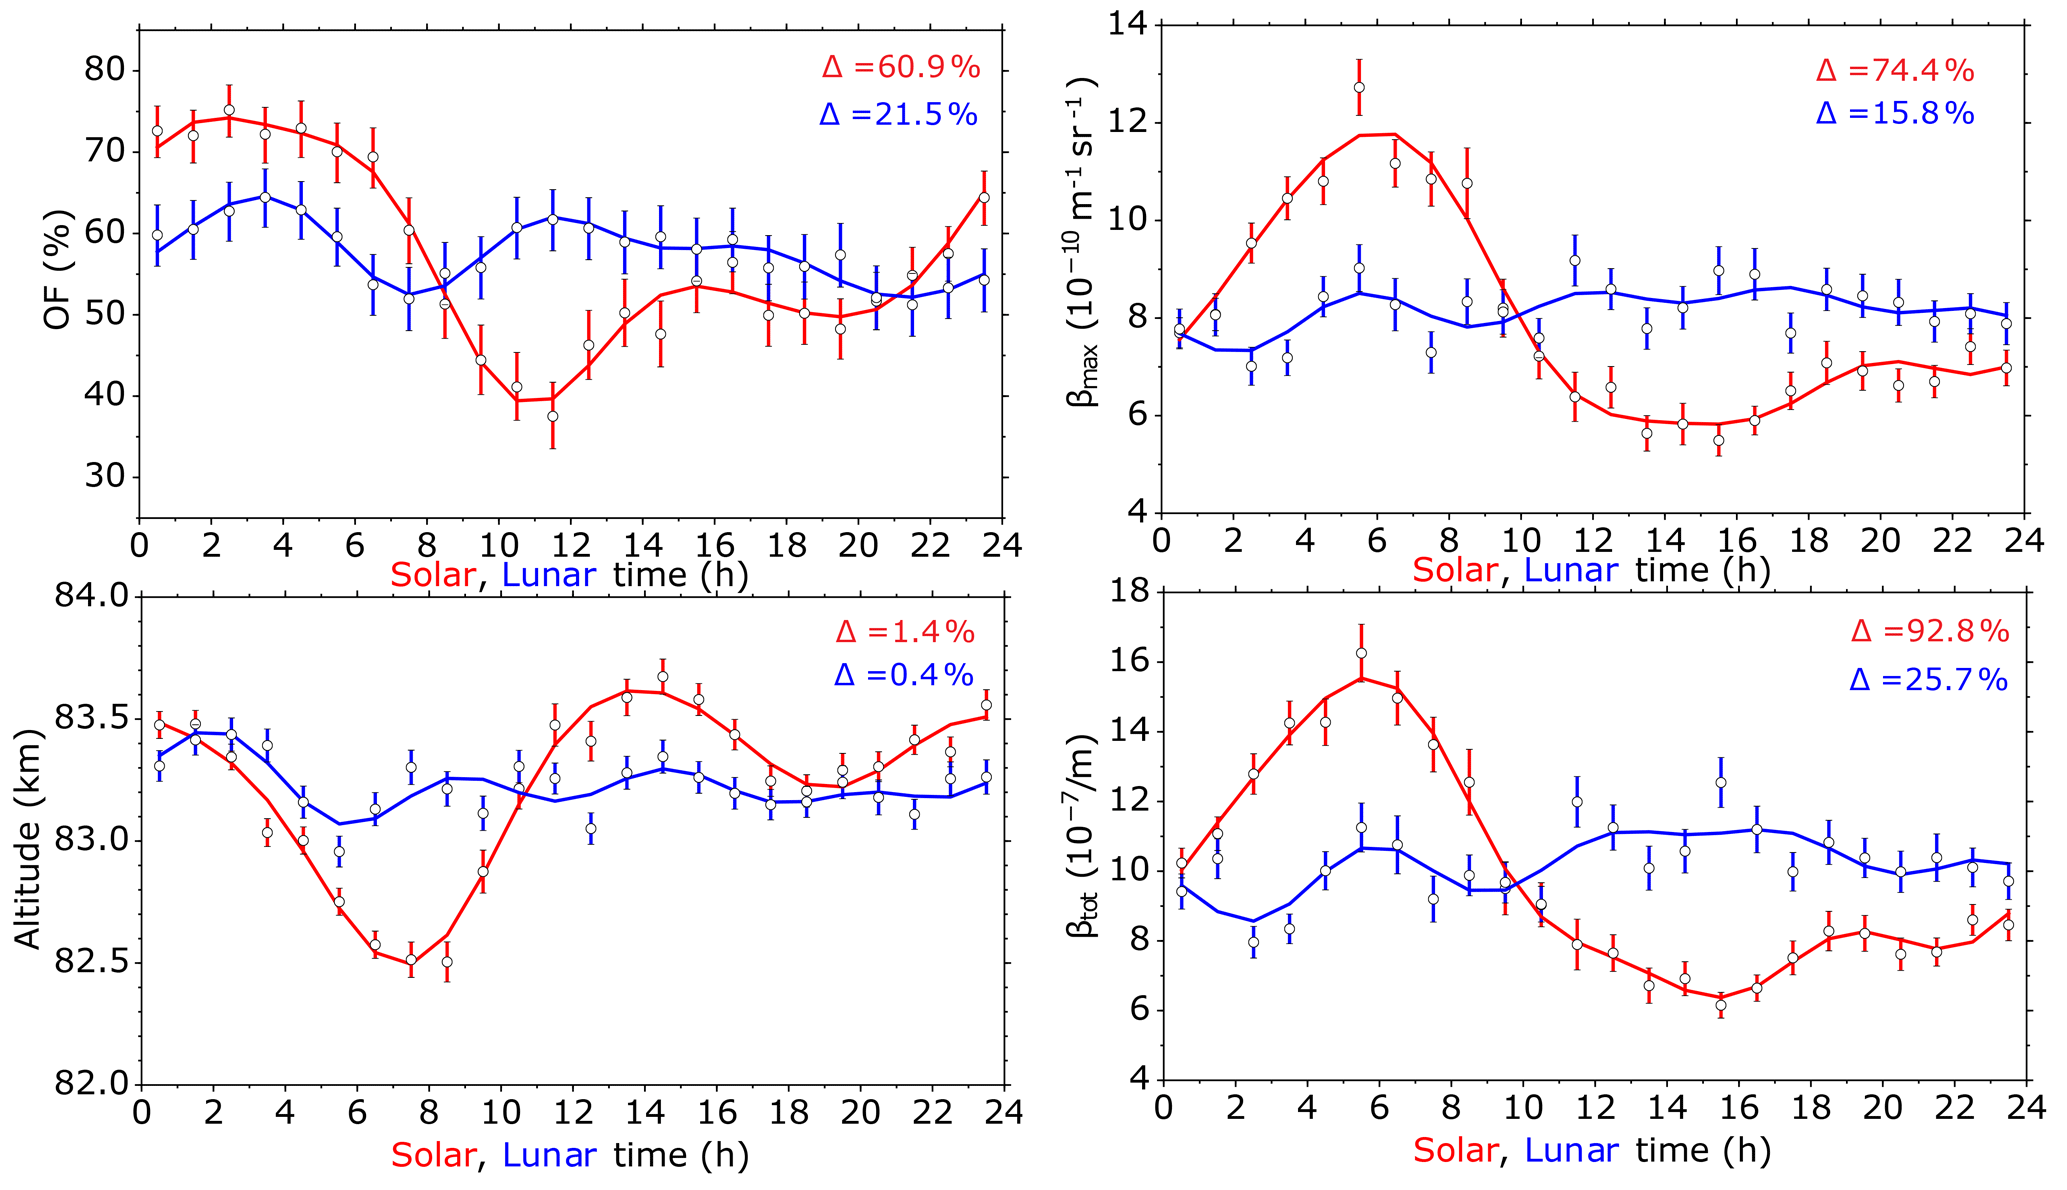
Figure 2Mean solar (red) and lunar (blue) time variations of NLC occurrence frequency (OF), altitude and the maximum and integrated brightness (βmax, βtot) between 19 June and 29 July from 1997 to 2017. Symbols are hourly mean values and vertical bars errors of the means. Solid lines are harmonic fits with periods of 24, 12, 8 and 6 h to the mean values. The relative variations of the fits over day are indicated.
3.2 Simultaneous solar and lunar tidal variations
We investigate the mean local time dependence of NLC parameters using a representative brightness value for each altitude profile. This method was applied earlier for our data set and is commonly used for ground-based lidars as well as satellite instruments. We determine for each altitude profile the value of the maximum brightness βmax as well as the integrated brightness βtot over all altitudes. Local time variability of NLC parameters depends on cloud brightness and its observation is additionally impacted by instrument sensitivity (Fiedler et al., 2005, 2011). For these reasons we usually apply a minimum brightness limit. In this study, however, we aim at identifying weak lunar signals embedded in a larger background of solar variability. The frequency distribution of brightness values satisfies an exponential law (cf. Fig. 1 in Fiedler et al., 2017) with a high occurrence of dim clouds. As a result, the application of our long-term brightness limit ( m−1 s−1) reduces the NLC detections by 48 % from 3100 to 1600 h. Sensitivity tests showed that data reductions of such extent prevent a reliable extraction of the lunar signal from our data set. It turned out that an exclusive limitation to the core of the season (without application of any brightness limit) is better suited as it restricts the sampling to stable summer conditions with high NLC occurrences. Therefore we choose a time period for which the daily NLC occurrence frequency exceeds the seasonal mean value, which is roughly the case between DoY 170 (19 June) and 210 (29 July); cf. Fig. 3 in Fiedler et al. (2009) and Fig. 2 in Fiedler et al. (2017). This reduces the NLC detections by 35 %.
The resulting solar and lunar time variations are shown in Fig. 2. The plots contain 3450 measurement hours including 2030 h with NLCs from 1997 to 2017. Throughout the solar day the results match the variations seen in Fig. 1. We again find the highest NLC occurrence between midnight and 06:00 LST and a weaker maximum around 15:00 LST. The maximum brightness is observed between 03:00 and 08:00 LST. The highest altitudes are reached around midnight and 14:00 LST, and the mean altitude variation during the solar day is ∼1.1 km. The daily variations of brightness and altitude are anti-correlated (); i.e., the brightest clouds occur at lowest altitudes and vice versa, which fits the above-mentioned growth-sedimentation scenario of mesospheric ice particles.
Such distinct variations throughout the solar day were first observed in 1997 at ALOMAR and have been found by ground-based lidar at other locations as well (Chu et al., 2001; Fiedler et al., 2005; Gerding et al., 2013; von Zahn et al., 1998). Satellites mostly operate in sun-synchronous orbits and are thus not able to cover NLC local time variations, with some exceptions (DeLand et al., 2011; Stevens et al., 2009). NLC variability during the solar day was also investigated by models (Schmidt et al., 2018; Stevens et al., 2010, 2017). In general, maximum values for occurrence and brightness are found in the first half of the solar day, which is attributed to temperature tides and tidal variations in background water vapor.
Table 1Amplitudes (A) and phases (P) of solar and lunar tidal oscillations as determined from harmonic fits with periods of 24, 12, 8 and 6 h to the data from 1997 to 2017. Amplitudes are given both in absolute and relative units. Absolute units (abs) are occurrence frequency (OF) in %, altitude (zc) in km, maximum brightness (βmax) in 10−10 m−1 s−1 and total brightness (βtot) in 10−7 sr−1. Relative units (rel) are in % with respect to the mean value. Fit quality is given as the correlation coefficient r.
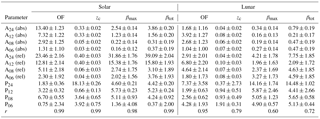
Figure 2 shows also the NLC parameters as a function of local lunar time (LLT) and we find variations in all parameters. NLCs occur most often around 03:00 and 11:00 LLT. The highest altitude is reached around 02:00 LLT, which is connected with a minimum in brightness. Variations with LLT are smaller compared to those with LST. The relative variation during solar (lunar) day is 60.9 % (21.5 %) for occurrence frequency, 1.4 % (0.4 %) for altitude, 74.4 % (15.8 %) for maximum brightness and 92.8 % (25.7 %) for total brightness.
To compare the impact of solar and lunar tides on NLCs we extracted amplitudes (A) and phases (P) of fits up to the fourth harmonic of the day to the data. The results are listed in Table 1. For checking purposes we calculated the fits additionally for only two harmonics (24 and 12 h periods). It turned out that the fit algorithm is fairly robust; the amplitudes and phases resulting from both fit versions are close to each other. For example, for the 12 h component of the maximum brightness the deviations between including/omitting 8 and 6 h periods are 1.7 % for amplitude value, 1.0 % for amplitude error, 8.7 % for phase value and 3.9 % for phase error. We note the only moderate correlation coefficients for altitude and especially brightness variations with the lunar day, indicating these parameters to be additionally impacted by other sources of variability. Solar tidal variations are dominated by diurnal and semidiurnal periods. Amplitude ratios A24 ∕ A12 are 1.8, 2.1 and 2.5 for occurrence frequency and brightness (maximum, total), respectively. For altitude both periods identically contribute to solar time variations.
Investigations of NLCs regarding lunar tidal signatures are sparse and mostly based on ground-based visual observations. Such observations are limited to a couple of hours around midnight because of the illumination conditions of mesospheric altitudes by the sun. The results partly differ from each other and show lunar variations of the NLC occurrence with amplitudes from 4 % to 30 % in a monthly period (Dalin et al., 2006; Gadsden, 1985; Kropotkina and Shefov, 1975). Only recently were lunar tides in NLCs identified in multi-decade data sets of SBUV (Solar Backscatter Ultraviolet) satellite instruments (von Savigny et al., 2017). The authors found clear lunar semidiurnal tidal signatures in NLC occurrence frequency, albedo, and ice water content. For the Northern Hemisphere (55–75∘ N) they extracted a relative amplitude A12(rel) of 5.2 % and a phase P12 of 3.3 h LLT for the NLC occurrence frequency, which is so far the only value determined by instrumental observations. The present study is the first identification of lunar tidal signatures in ground-based lidar observations. Our values of A12(rel) = 6.8 % and P12 = 2.0 h LLT are in good agreement with von Savigny et al. (2017). From visual NLC observations published by Gadsden (1985), maximum NLC occurrences around 3 h LLT follow (cf. discussion in von Savigny et al., 2017). Thus three independent data sets show occurrence maxima between 2 and 3 h LLT, which indicates a robust determination of the corresponding semidiurnal lunar tide. One should keep in mind that sun-synchronous satellite instruments cannot distinguish between the semidiurnal and the semimonthly lunar tide and thus measure a superposition of both components. It is commonly expected that the semidiurnal component dominates, which is, however, still debated (cf. discussion in Hoffmann et al., 2018).
von Savigny et al. (2017) suggested temperature variations in the mesopause region as the main driver of lunar tidal signatures in NLCs. They investigated 7 years of satellite temperature data from the MLS (Microwave Limb Sounder) instrument and found consistent features at 83 km altitude with respect to lunar NLC variations, namely minimum temperatures from 1 to 4 h LLT. Hoffmann et al. (2018) analyzed 9 years of data from the SOFIE (Solar Occultation for Ice Experiment) satellite instrument and found temperature variations with LLT as well. In general temperature variations with lunar time are very small, with maximum amplitudes of about 0.2 K.
Brightness-related parameters (albedo, ice water content) were determined by von Savigny et al. (2017) to be A12(rel) ∼ 6 % and P12 ∼ 3 h LLT. In SOFIE data, Hoffmann et al. (2018) found A12(rel) = 2.5 % and P12 = 2.5 h LLT for the ice water content in the Northern Hemisphere. Our values of A12(rel) = 2.1 % and P12 = 4.4 h LLT for brightness (βtot) match the satellite data reasonably. We notice, however, that the semidiurnal component is the weakest of all extracted harmonic components for our NLC brightness (cf. Table 1). The superposition of all four oscillations results in a brightness minimum around 2 h LLT, compared to a maximum in the satellite observations. Hoffmann et al. (2018) also extracted lunar tidal NLC altitude variations, which were determined to A12(abs) = 60 m and P12 = 2.2 h LLT. This fits remarkably our values of A12(abs) = 80 m and P12 = 0.9 h LLT. A difference between satellite results and the present study is the phasing of altitude to brightness. Whereas Hoffmann et al. (2018) find them to be in phase (clouds with larger ice water content are at higher altitudes), our results show the common anti-phase behavior known from solar tidal variations (cf. Fig. 2). When only the semidiurnal components are taken into account, the lunar phases of altitude and brightness (βtot) differ by about 3.5 h, which is midway between in phase and anti-phase. We make the reader aware that the statistical significance for our brightness fits is relatively low and thus this particular result should not be overestimated; see also below.
From Table 1 we find solar tidal amplitudes to be always larger than lunar ones, which is expected. For example, the ratios of semidiurnal solar to lunar amplitudes are ∼1.9 for occurrence frequency, ∼4.1 for altitude and ∼7.5 for brightness. Dalin et al. (2017) extracted this ratio to ∼7.7 for horizontal winds from radar measurements in the mesopause region at 68∘ N. For our data set we notice that the extracted harmonics contribute differently to the observed lunar tidal behavior of the NLC parameters. For occurrence frequency and altitude, the semidiurnal component is dominant, whereas it is the weakest one for brightness. From models, it is shown that a diurnal lunar tide is anticipated to be significantly smaller compared to the semidiurnal lunar tide (Chapman and Lindzen, 1970; Pedatella et al., 2012). Stening (1989) found a diurnal modulation of the lunar tide and suggested this to be caused by interactions with solar tides during upward propagation of the lunar tide; cf. also Stening and Vincent (1989). Concerning the 8 and 6 h LLT oscillations we see no resilient reason to attribute it to be directly caused by the Moon and will estimate the robustness of extracted lunar oscillations in the following chapter.
3.3 Reliability of tidal parameters
For analysis of simultaneous solar and lunar tidal variations we use 41 days in the core of the NLC season (DoY 170–210). As our measurements cover many solar times, and solar tidal amplitudes are large, the actual distribution of measurements times during each year might cause a residual impact on the extracted lunar amplitudes (sampling issue). This would introduce a systematic error on top of the statistical error of the lunar tidal parameters. We investigated this topic using the following simulations.
First the mean solar time dependencies for NLC occurrence frequency, altitude and brightness were reconstructed using amplitudes and phases of the harmonic solar periods. Then the constructed NLC parameter value at the solar time of each actual measurement was taken and assigned to the corresponding lunar time (method 1). This results in mean lunar time dependencies for the NLC parameters which should be ideally flat curves representing the mean values of the NLC parameters. We find deviations from this ideal case indicating residual impacts of solar tidal parameters on lunar tidal parameters (thick green curves in Fig. 3a, c, and e). For occurrence frequency enhanced values are visible from 04:00 to 06:00 LLT and from 11:00 to 16:00 LLT. For altitude, enhanced values are shown, especially from 10:00 to 12:00 LLT, and decreased values are shown from 16:00–18:00 LLT. The measured hourly mean values with respect to lunar time are also shown for reference (blue symbols and curves in Fig. 3a, c and e). Comparing these curves with the simulations we find that NLC occurrence frequency as well as altitude are only little impacted during the lunar morning, whereas during the lunar afternoon solar impacts are large compared to the measured values. For NLC brightness the situation is worse. Here solar impacts reach larger values during extended lunar time periods, even during the lunar morning.
We also calculated a second simulation (method 2). For this purpose, artificial solar times were randomly generated, with the total number matching the number of measurements. Then, like in the first simulation, the constructed NLC parameter value at each artificial generated solar time was taken and assigned to the corresponding lunar time. This procedure was executed several times. The results are the thin green curves in Fig. 3a, c and e. Again we find residual solar tidal impacts; however, they do not exceed the ones from the first simulation.

Figure 3Simulated residual impact of solar on lunar (a, c, e) and lunar on solar (b, d, f) tidal variations, as introduced by the distribution of measurement times between 19 June and 29 July from 1997 to 2017. Method 1: actual times (thick green curves). Method 2: randomly generated times (thin green curves). Causative variations were reconstructed from harmonic fits with periods of 24, 12, 8 and 6 h; see Table 1. For details see text. NLC parameters are occurrence frequency (a, b), altitude (c, d) and brightness (e, f). (a, c, e) Measured lunar dependence (blue) and simulated impact from solar variations (green). (b, d, f) Measured solar dependence (red), simulated impact from lunar variations (green).
In general, the actual sampling of the measurements concerning solar time impacts the extracted lunar time dependence of NLC parameters. This impact is smallest for occurrence frequency, moderate for altitude and largest for brightness. We notice that 1.7 times more data are available for determination of occurrence frequencies (entire measurement time) compared to NLC layer parameters (only NLC measurement time). Thus, enhanced lunar amplitudes especially for the higher harmonics (8 and 6 h lunar periods) of altitude and brightness might be caused by an insufficient amount of data, although the data set covers 21 seasons.
For completeness we performed the same investigations regarding lunar residual impacts on solar tidal parameters. The results are shown in Fig. 3b, d, and f and indicate only negligible effects.
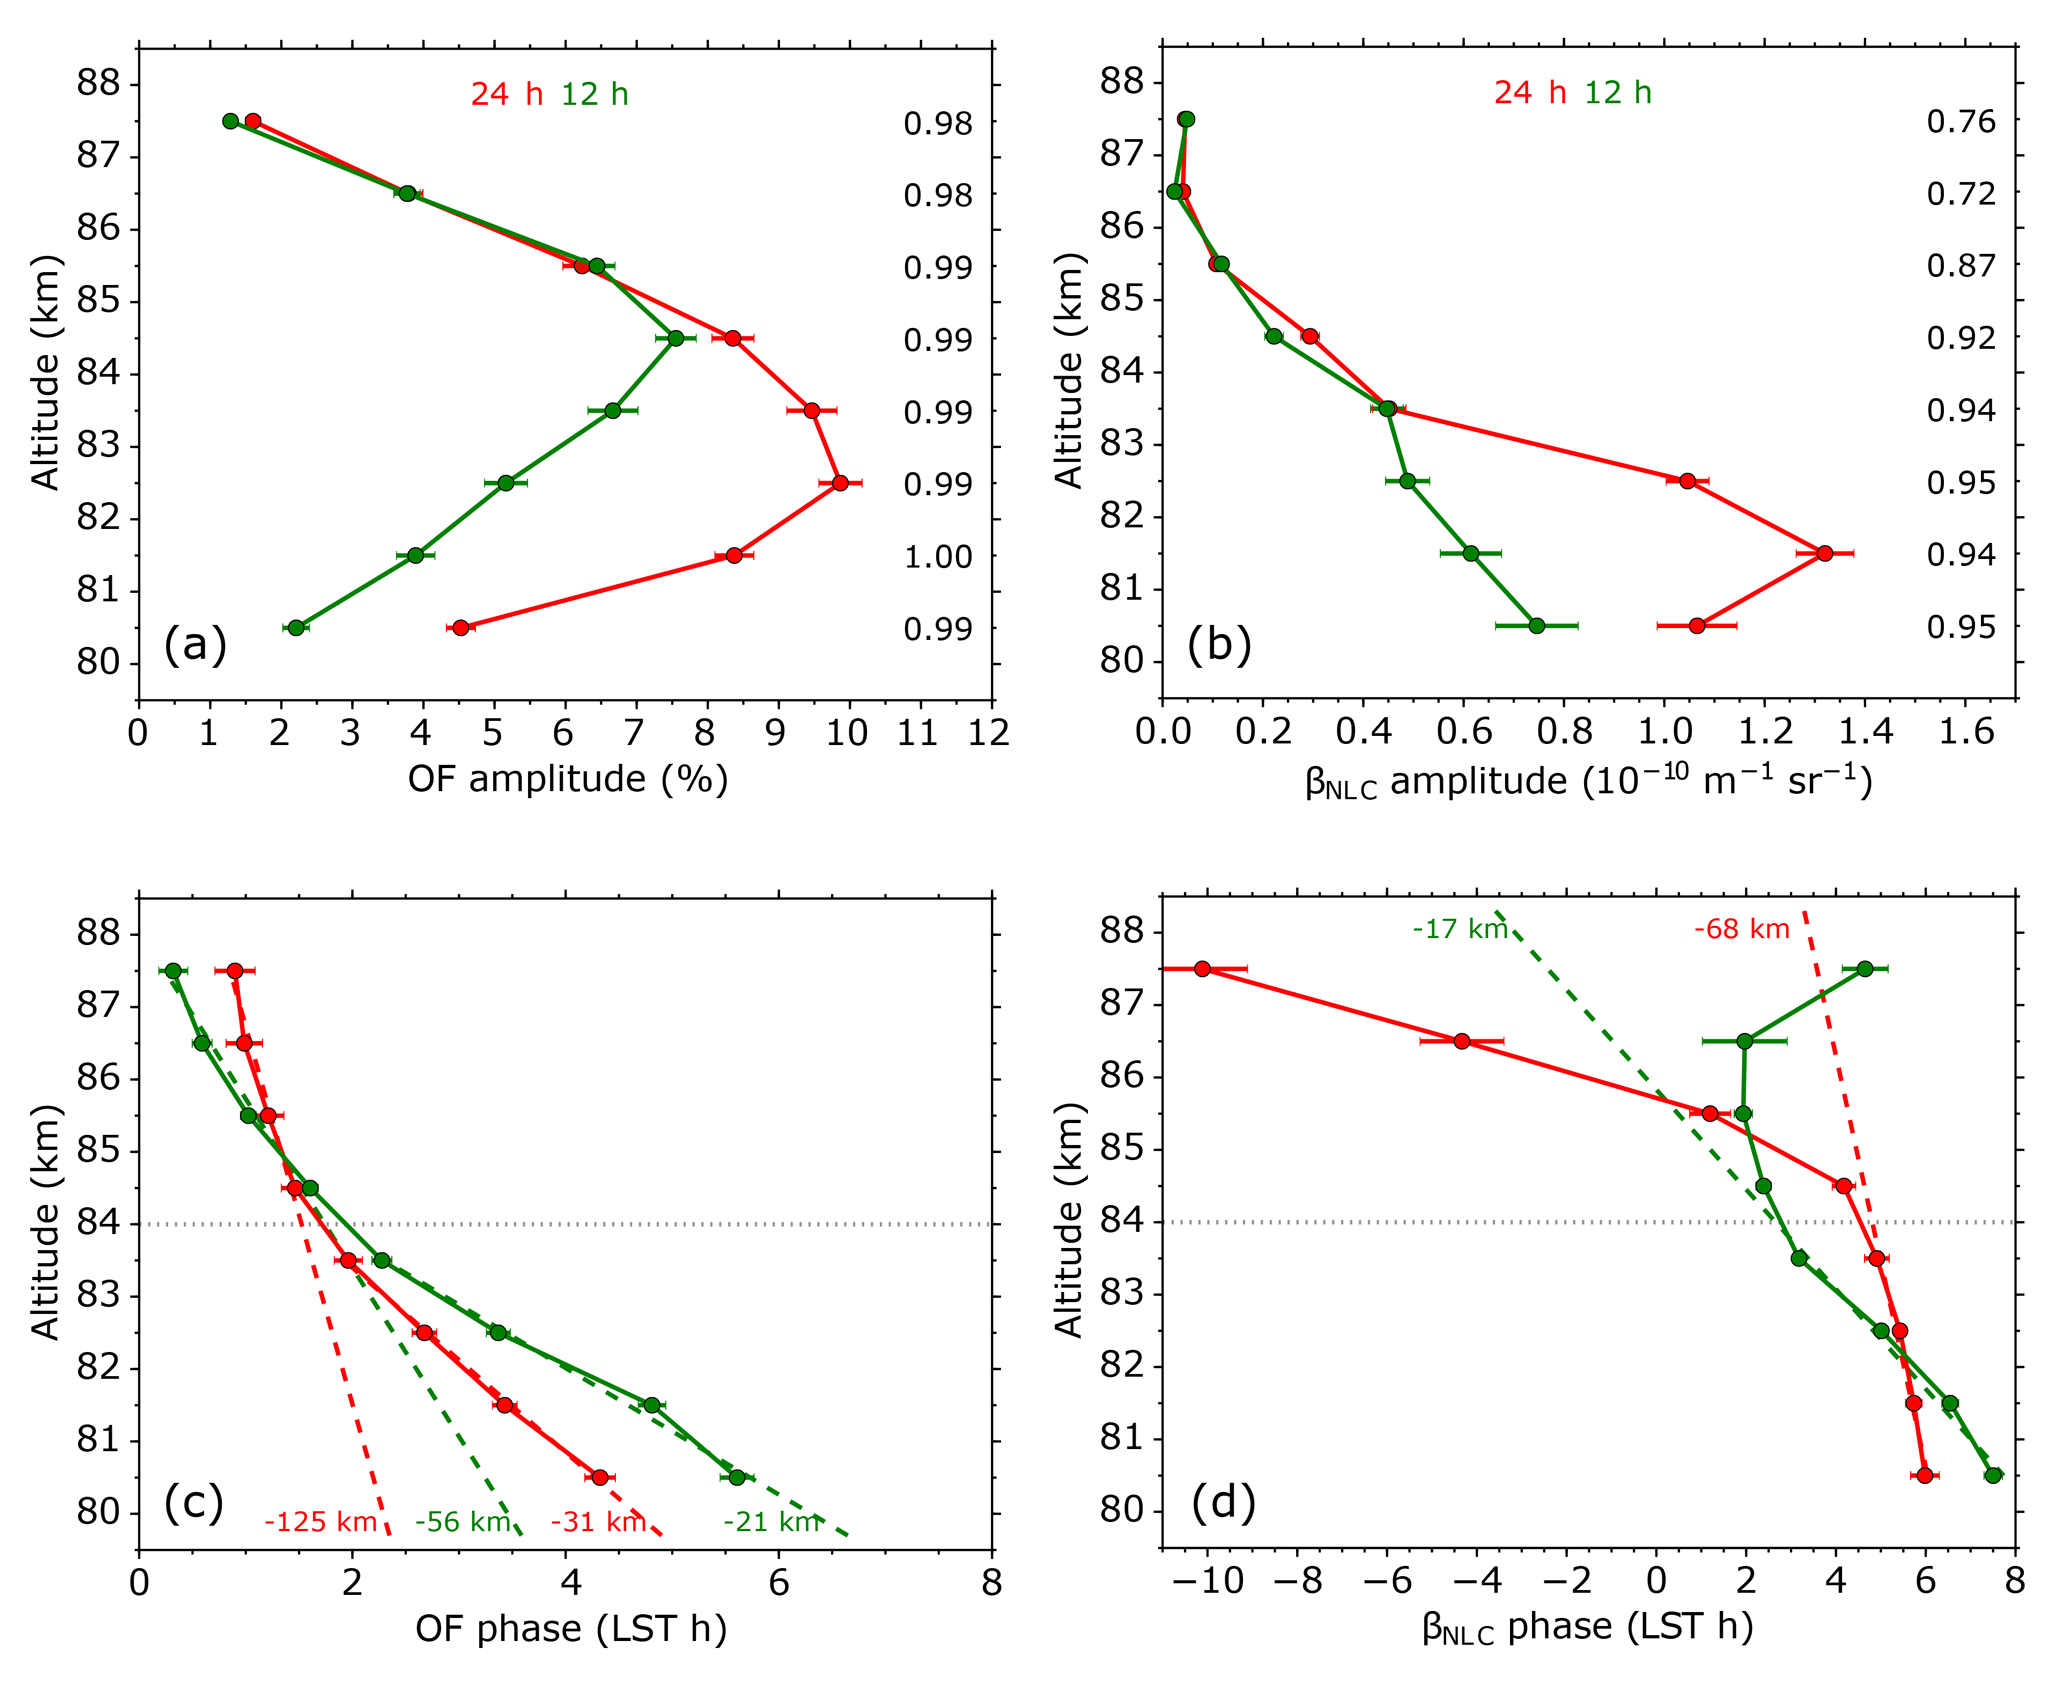
Figure 4Mean solar amplitudes (a, b) and phases (c, d) of NLC occurrence frequency (OF, a, c) and brightness (βNLC, b, d) between 1 June and 15 August from 1997 to 2017. Diurnal components are in red, and semidiurnal components are in green. Black numbers at the panels a and b are correlation coefficients of the harmonic fits for the corresponding altitudes. Colored numbers in panels c and d are vertical wavelengths as calculated from the phase slopes (dashed lines), separated for altitudes below and above 84 km (gray dotted line).

Figure 5(a) Mean variations of NLC occurrence frequency with altitude and lunar time from 1997 to 2017. The plot contains 3450 h of lidar measurements between 19 June and 29 July. (b) Semidiurnal amplitudes and phases determined from data of (a). Black numbers are correlation coefficients of the harmonic fits for the corresponding altitudes.
3.4 Altitude dependence of tidal parameters
Now we study altitude-resolved tidal parameters. For this purpose the altitude range between 80 and 88 km was divided into eight slices of 1 km extent each (cf. Fig. 1). For each altitude slice amplitudes (A24, A12) and phases (P24, P12) of diurnal and semidiurnal harmonic oscillations were extracted. The result for solar tides is shown in Fig. 4. Amplitudes of the occurrence frequency reach values up to 10 %. The lower half of the altitude range is dominated by the diurnal component, being partly 1.9 times stronger compared to the semidiurnal component. At higher altitudes the amplitudes of both components decrease and are nearly identical. The brightness shows roughly a similar behavior. The diurnal component dominates by a factor up to 2.2. However, the altitude dependences of A12 are different for occurrence frequency and brightness. While the former has its maximum at 84.5 km, the one of the brightness is monotonically decreasing with increasing altitude.
Phases for both tidal components of occurrence frequency and brightness decrease continuously with altitude, as is expected for upward propagating tides, with only one exception (P12 of brightness). We notice the existence of two altitude ranges with different phase progressions, separated at about 84 km. From the slopes we determined corresponding vertical wavelengths λz, which are also shown in Fig. 4. For the occurrence frequency, vertical wavelengths in the lower altitude range are −31 km (P24) and −21 km (P12). Values increase in the upper altitude range to −125 km (P24) and −56 km (P12). For brightness we extract vertical wavelengths of −68 km (P24) and −17 km (P12) below 84 km altitude. Above this limit the progression of P24 increases substantially, whereas the progression of P12 tends to change sign. This phase behavior, however, is accompanied by small amplitude values and might lack robustness. We notice that vertical wavelengths connected with diurnal phases have generally larger absolute values compared to those of semidiurnal phases.
Hough modes of classical tidal theory are distinguished by their vertical wavelength (Chapman and Lindzen, 1970). Wavelengths between 17 and 21 km as they were observed for the semidiurnal tide below 84 km correspond to higher order Hough modes H(2,9)–H(2,11). For the diurnal tide we find solely wavelengths ≥31 km, which indicates negative Hough modes. We note, however, that the excitation intensity of modes decreases towards higher latitudes according to linear theory. Thus at 69∘ N nonlinear wave interactions might play a major role.
To the best of our knowledge, vertical phase progressions in NLCs have never been published so far. Thus we compare our results to other parameters like temperature and horizontal winds measured in the summer mesopause region. Lübken et al. (2011) investigated thermal tides at Davis (69∘ S) by means of a resonance lidar. During January 2011 they found downward progressing P24, with a vertical wavelength of −30 km between 84 and 89 km altitude. P12 shows the opposite behavior, namely upward progression (their Fig. 3). Murphy et al. (2006) published a climatology of tides in the Antarctic mesosphere determined by radar wind measurements. They found between December and February in the 80 to 86 km range vertical wavelengths from −37 to −55 km for P12 (migrating), but also values marked as large. Vertical wavelengths associated with P24 are large or even positive; cf. their Fig. 7. At midlatitudes She et al. (2002) (Figs. 2 and 3) found tidal temperature variations between 84 and 89 km altitude during summer, corresponding to vertical wavelengths of −27 km (P12) and −19 km (P24), using a resonance lidar. Again at midlatitudes, from lidar temperature soundings by Kopp et al. (2015) vertical wavelengths of −9 km (P12) and −14 km (P24) follow at around 85 km altitude in July (cf. their Fig. 7). These numbers might not be representative, as their results show large variabilities during the summer period.
In general, solar tidal phases determined from our NLC observations show a consistent behavior, indicating that corresponding vertical wavelengths are robust. The wavelengths fall within the range of values extracted from other measurements published in the literature. We notice the variability of λz values which might be caused by different time periods covered by the measurements (days to years) as well as the tidal variability itself. Changes in phase progressions around 84 km altitude could be caused by the combined effects of tracer (ice particles) and background atmosphere. With increasing altitude, the particle size decreases towards the mesopause at around 89 km where they nucleate. Simultaneously, turbulent mixing of the background atmosphere increases with altitude, which impacts the microphysical properties of NLC particles. Baumgarten et al. (2010) found a correlation between particle size and distribution width for mean sizes up to 40 nm, which are reached at an altitude of about 84 km. For larger particles (lower altitudes) the distribution width is roughly constant. Following this, one could speculate that tidal impacts might depend on the turbulent regime of the atmosphere.
We have shown that occurrence frequency is the most robust NLC parameter of our data set concerning lunar time variations. Therefore we investigated the altitude dependence of its semidiurnal component by applying the same procedure like for solar time variations. The results are shown in Fig. 5. The semidiurnal component maximizes shortly above the altitude of maximum occurrence frequency. Phases vary between 1.5 and 4.4 h LLT; their progression is positive below 84 km and negative above. Corresponding vertical wavelengths are approx. −27 and +36 km.
Phase progressions of the lunar semidiurnal tide in layered phenomena of the summer mesopause region have not been studied so far. In temperature data of the SABER (Sounding of the Atmosphere Using Broadband Emission Radiometry) satellite instrument, Paulino et al. (2013) found both positive and negative phase progressions between 80 and 90 km altitude, depending on latitude. They also identified several modes of the lunar semidiurnal tide, including nonmigrating, and suggested an interaction between lunar tide and other tides and/or waves at higher altitudes.
The 21-year data set of the ALOMAR RMR lidar contains the largest NLC archive acquired by ground-based lidar and was investigated regarding solar and lunar tides in NLCs. Distinct variations with solar as well as lunar time were found in several NLC parameters. This study represents the first identification of lunar tidal signatures in ground-based lidar observations. The results may be summarized as follows.
-
Throughout the solar day the highest NLC occurrence frequency was found between midnight and 06:00 LST, the brightness maximizes between 03:00 and 08:00 LST and highest altitudes are reached around midnight and 14:00 LST. Throughout the lunar day NLCs occur most often around 03:00 and 11:00 LLT, and the highest altitudes are reached around 02:00 LLT. Variations with lunar time are generally smaller compared to variations with solar time.
-
Solar time variations are dominated by diurnal and semidiurnal tidal components. For NLC occurrence frequency and brightness, the diurnal component is roughly twice as large as the semidiurnal component. For NLC altitude both components identically contribute to the variability.
-
The relative amplitude of the lunar semidiurnal tide in NLC occurrence frequency is 6.8 % and the phase is 2 h LLT. The lunar semidiurnal tide in NLC altitude has an amplitude of 60 m and a phase of 0.9 h LLT. Both findings are in good agreement with results from satellite observations.
-
For the first time solar and lunar tidal parameters in NLCs were determined simultaneously from the same data set. For occurrence frequency the lunar semidiurnal amplitude is approx. 50 % of the solar semidiurnal amplitude, which is surprisingly large.
-
For the first time, we showed vertical phase progressions in NLCs. For occurrence frequency, phases of solar diurnal and semidiurnal components decrease with altitude, suggesting upward propagating tides. Corresponding vertical wavelengths are −31 and −21 km below 84 km and larger above. Lunar semidiurnal phases stay in the range between 1.5 and 4.4 h LLT and vary symmetrically with respect to the maximum of the NLC layer. Corresponding vertical wavelengths vary from approx. −27 to +36 km.
-
Simulations of sampling effects showed that the distribution of lidar measurements in terms of solar time has impacts on the extracted lunar tidal parameters. In this way solar tidal variations cause residual variations in terms of lunar time. Such impacts are smallest for occurrence frequency, moderate for altitude and largest for brightness. On the other hand lunar tidal variations have a negligible impact on extracted solar tidal parameters. Following this, trend investigations of our NLC time series are not significantly affected by lunar tidal variations.
Data used in this article are available upon request from Jens Fiedler.
JF analyzed the NLC data and calculated the simulations. Interpretation of the data set was done by JF and GB. JF prepared the paper with feedback from GB.
The authors declare that they have no conflict of interest.
This article is part of the special issue “Layered phenomena in the mesopause region (ACP/AMT inter-journal SI)”. It is a result of the LPMR workshop 2017 (LPMR-2017), Kühlungsborn, Germany, 18–22 September 2017.
We gratefully acknowledge the support of the ALOMAR staff in helping to
accumulate the extensive data set of NLC observations. The observations were
also supported by a large number of voluntary lidar operators. We thank
Götz von Cossart for the excellent support in maintaining the lasers of the
ALOMAR RMR lidar. We are also grateful to Uwe Berger for suggestions for
improving the manuscript.
The publication of
this article was funded by the
Open Access Fund of the
Leibniz Association.
Edited by: Martin
Dameris
Reviewed by: two anonymous referees
Backhouse, T. W.: The luminous cirrus clouds of June and July, Meteorol. Mag., 20, 133 pp., 1885. a
Baumgarten, G., Fricke, K. H., and von Cossart, G.: Investigation of the shape of noctilucent cloud particles by polarization lidar technique, Geophys. Res. Lett., 29, 1630, https://doi.org/10.1029/2001GL013877, 2002. a
Baumgarten, G., Fiedler, J., and Rapp, M.: On microphysical processes of noctilucent clouds (NLC): observations and modeling of mean and width of the particle size-distribution, Atmos. Chem. Phys., 10, 6661–6668, https://doi.org/10.5194/acp-10-6661-2010, 2010. a
Chapman, S. and Lindzen, R. S.: Atmospheric Tides, D. Reidel, Norwell, MA, 201 pp., 1970. a, b, c
Chree, C.: Some phenomena of sunspots and of terrestrial magnetism at Kew observatory, Philos. T. Roy. Soc. A, 212, 75–116, 1912. a
Chu, X., Gardner, C. S., and Papen, G.: Lidar observations of polar mesospheric clouds at South Pole: Diurnal variations, Geophys. Res. Lett., 28, 1937–1940, https://doi.org/10.1029/2000GL012525, 2001. a, b
Dalin, P., Pertsev, N. N., and Romejko, V. A.: Significance of lunar impact on noctilucent clouds, J. Atmos. Sol.-Terr. Phy., 68, 1653–1663, https://doi.org/10.1016/j.jastp.2006.06.005, 2006. a, b
Dalin, P., Kirkwood, S., Pertsev, N., and Perminov, V.: Influence of Solar and Lunar Tides on the Mesopause Region as Observed in Polar Mesosphere Summer Echoes Characteristics, J. Geophys. Res., 122, 10369–10383, https://doi.org/10.1002/2017JD026509, 2017. a
DeLand, M. T., Shettle, E. P., Thomas, G. E., and Olivero, J. J.: Solar backscattered ultraviolett (SBUV) observations of polar mesospheric clouds (PMCs) over two solar cycles, J. Geophys. Res., 108, 8445, https://doi.org/10.1029/2002JD002398, 2003. a
DeLand, M. T., Shettle, E. P., Thomas, G. E., and Olivero, J. J.: Direct observations of PMC local time variations by Aura OMI, J. Atmos. Sol.-Terr. Phy., 73, 2049–2064, https://doi.org/10.1016/j.jastp.2010.11.019, 2011. a
Efron, B. and Tibshirani, R. J.: An Introduction to the Bootstrap, Chapman and Hall, New York, NY, 1993. a
Fiedler, J., Baumgarten, G., and von Cossart, G.: Mean diurnal variations of noctilucent clouds during 7 years of lidar observations at ALOMAR, Ann. Geophys., 23, 1175–1181, https://doi.org/10.5194/angeo-23-1175-2005, 2005. a, b, c
Fiedler, J., Baumgarten, G., and Lübken, F.-J.: NLC observations during one solar cycle above ALOMAR, J. Atmos. Sol.-Terr. Phy., 71, 424–433, https://doi.org/10.1016/j.jastp.2008.11.010, 2009. a, b
Fiedler, J., Baumgarten, G., Berger, U., Hoffmann, P., Kaifler, N., and Lübken, F.-J.: NLC and the background atmosphere above ALOMAR, Atmos. Chem. Phys., 11, 5701–5717, https://doi.org/10.5194/acp-11-5701-2011, 2011. a, b, c
Fiedler, J., Baumgarten, G., Berger, U., and Lübken, F.-J.: Long-term variations of noctilucent clouds at ALOMAR, J. Atmos. Sol.-Terr. Phy., 162, 79–89, https://doi.org/10.1016/j.jastp.2016.08.006, 2017. a, b, c
Forbes, J. M.: Middle atmosphere tides, J. Atmos. Sol.-Terr. Phy., 46, 1049–1067, https://doi.org/10.1016/0021-9169(84)90008-4, 1984. a
Gadsden, M.: Observations of noctilucent clouds from North-West Europe, Ann. Geophys., 3, 119–126, 1985. a, b, c
Gerding, M., Kopp, M., Hoffmann, Höffner, J., and Lübken, F.-J.: Diurnal variation of midlatitude NLC parameters observed by daylight-capable lidar and their relation to ambient parameters, Geophys. Res. Lett., 40, 6390–6394, https://doi.org/10.1002/2013GL057955, 2013. a, b
Hervig, M., Thompson, R. E., McHugh, M., Gordley, L. L., Russell III, J. M., and Summers, M. E.: First confirmation that water ice is the primary component of polar mesospheric clouds, Geophys. Res. Lett., 28, 971–974, https://doi.org/10.1029/2000GL012104, 2001. a
Hoffmann, C. G., von Savigny, C., Hervig, M. E., and Oberbremer, E.: The lunar semidiurnal tide at the polar summer mesopause observed by SOFIE, J. Atmos. Sol.-Terr. Phy., 167, 134–145, https://doi.org/10.1016/j.jastp.2017.11.014, 2018. a, b, c, d, e, f
Jesse, O.: Auffallende Abenderscheinungen am Himmel, Meteorol. Z., 2, 311–312, 1885. a
Jesse, O.: Die Höhe der leuchtenden Nachtwolken, Astron. Nachr., 140, 161–168, 1896. a
Kaifler, N., Baumgarten, G., Fiedler, J., and Lübken, F.-J.: Quantification of waves in lidar observations of noctilucent clouds at scales from seconds to minutes, Atmos. Chem. Phys., 13, 11757–11768, https://doi.org/10.5194/acp-13-11757-2013, 2013. a
Kirkwood, S. and Stebel, K.: Influence of planetary waves on noctilucent cloud occurrence over NW Europe, J. Geophys. Res., 108, 8440, https://doi.org/10.1029/2002JD002356, 2003. a
Kopp, M., Gerding, M., Höffner, J., and Lübken, F.-J.: Tidal signatures in temperatures derived from daylight lidar soundings above Kühlungsborn (54∘ N, 12∘ E), J. Atmos. Sol.-Terr. Phy., 127, 37–50, https://doi.org/10.1016/j.jastp.2014.09.002, 2015. a
Kropotkina, Y. P. and Shefov, N. N.: Influence of lunar tides on the probability of appearance of noctilucent clouds, Russ. Acad. Sci., Phys. Atmos. Ocean, 11, 1184–1186, 1975. a, b
Leslie, R. C.: Sky glows, Nature, 32, 245 pp., 1885. a
Lübken, F.-J.: Thermal structure of the arctic summer mesosphere, J. Geophys. Res., 104, 9135–9149, https://doi.org/10.1029/1999JD900076, 1999. a
Lübken, F.-J., Höffner, J., Viehl, T. P., Kaifler, B., and Morris, R. J.: First measurements of thermal tides in the summer mesopause region at Antarctic latitudes, Geophys. Res. Lett., 38, L24806, https://doi.org/10.1029/2011GL050045, 2011. a
Merkel, A. W., Thomas, G. E., Palo, S. E., and Bailey, S. M.: Observations of the 5-day planetary wave in PMC measurements from the Student Nitric Oxide Explorer satellite, Geophys. Res. Lett., 30, 1196, https://doi.org/10.1029/2002GL016524, 2003. a
Murphy, D. J., Forbes, J. M., Walterscheid, R. L., Hagan, M. E., Avery, S. K., Aso, T., Fraser, G. J., Fritts, D. C., Jarvis, M. J., McDonald, A. J., Riggin, D. M., Tsutsumi, M., and Vincent, R. A.: A climatology of tides in the Antarctic mesosphere and lower thermosphere, J. Geophys. Res., 111, D23104, https://doi.org/10.1029/2005JD006803, 2006. a
Paulino, A. R., Batista, P. P., and Batista, I. S.: A global view of the atmospheric lunar tide, J. Geophys. Res., 118, 13128–13139, https://doi.org/10.1002/2013JD019818, 2013. a, b
Pedatella, N. M., Liu, H.-L., and Richmond, A. D.: Atmospheric semidiurnal lunar tide climatology simulated by the Whole Atmosphere Community Climate Model, J. Geophys. Res., 117, A06327, https://doi.org/10.1029/2012JA017792, 2012. a
Russell III, J. M., Rong, P., Hervig, M. E., Siskind, D. E., Stevens, M. H., Bailey, S. M., and Gumbel, J.: Analysis of northern midlatitude noctilucent cloud occurrences using satellite data and modeling, J. Geophys. Res., 119, 3238–3250, https://doi.org/10.1002/2013JD021017, 2014. a
Sabine, E.: On the lunar atmospheric tide at St. Helena, Philos. T. Roy. Soc., 137, 45–50, 1847. a
Schmidt, F., Baumgarten, G., Berger, U., Fiedler, J., and Lübken, F.-J.: Local time dependence of polar mesospheric clouds: a model study, Atmos. Chem. Phys., 18, 8893–8908, https://doi.org/10.5194/acp-18-8893-2018, 2018. a
She, C.-Y., Chen, S., Williams, B. P., Hu, Z., Krueger, D. A., and Hagan, M. E.: Tides in the mesopause region over Fort Collins, Colorado (41∘ N, 105∘ W) based on lidar temperature observations covering full diurnal cycles, J. Geophys. Res., 107, 4350, https://doi.org/10.1029/2001JD001189, 2002. a
Stening, R. J.: A diurnal modulation of the lunar tide in the upper atmosphere, Geophys. Res. Lett., 16, 307–310, https://doi.org/10.1029/GL016i004p00307, 1989. a
Stening, R. J. and Vincent, R. A.: A Measurement of Lunar Tides in the Mesosphere at Adelaide, South Australia, J. Geophys. Res., 94, 10121–10129, 1989. a
Stening, R. J., Meek, C. E., and Manson, A. H.: Lunar Tidal Winds in the Upper Atmosphere (78–105 km) at Saskatoon, Canada, J. Atmos. Sci., 44, 1143–1151, 1987. a
Stevens, M. H., Englert, C., Hervig, M., Petelina, S. V., Singer, W., and Nielsen, K.: The diurnal variation of polar mesospheric cloud frequency near 55∘ N observed by SHIMMER, J. Atmos. Sol.-Terr. Phy., 71, 401–407, https://doi.org/10.1016/j.jastp.2008.10.009, 2009. a
Stevens, M. H., Siskind, D. E., Eckermann, S. D., Coy, L., McCormack, J. P., Englert, C. R., Hoppel, K. W., Nielsen, K., Kochenash, A. J., Hervig, M. E., Randall, C. E., Lumpe, J., Bailey, S. M., Rapp, M., and Hoffmann, P.: Tidally induced variations of polar mesospheric cloud altitudes and ice water content using a data assimilation system, J. Geophys. Res., 115, D18209, https://doi.org/10.1029/2009JD013225, 2010. a
Stevens, M. H., Liebermann, R. S., Siskind, D. E., McCormack, J. P., Hervig, M. E., and Englert, C. R.: Periodicities of polar mesospheric clouds inferred from a meteorological analysis and forecast system, J. Geophys. Res., 122, 4508–4527, https://doi.org/10.1002/2016JD025349, 2017. a, b
Thomas, G. E., McPeters, R. D., and Jensen, E. J.: Satellite observations of polar mesospheric clouds by Solar Backscattered Ultraviolet spectral radiometer: Evidence of a solar cycle dependence, J. Geophys. Res., 96, 927–939, https://doi.org/10.1029/90JD02312, 1991. a
von Cossart, G., Fiedler, J., and von Zahn, U.: Size distributions of NLC particles as determined from 3-color observations of NLC by ground-based lidar, Geophys. Res. Lett., 26, 1513–1516, https://doi.org/10.1029/1999GL900226, 1999. a
von Savigny, C., Lednyts'kyy, O., Forbes, J. M., and Zhang, X.: Lunar semidiurnal tide in the terrestrial airglow, Geophys. Res. Lett., 42, 3553–3559, https://doi.org/10.1002/2015GL063567, 2015. a
von Savigny, C., DeLand, M. T., and Schwartz, M. J.: First identification of lunar tides in satellite observations of noctilucent clouds, J. Atmos. Sol.-Terr. Phy., 162, 116–121, https://doi.org/10.1016/j.jastp.2016.07.002, 2017. a, b, c, d, e, f
von Zahn, U., von Cossart, G., Fiedler, J., and Rees, D.: Tidal variations of noctilucent clouds measured at 69∘ N latitude by groundbased lidar, Geophys. Res. Lett., 25, 1289–1292, https://doi.org/10.1029/98GL00546, 1998. a, b
Witt, G.: Height, structure and displacements of noctilucent clouds, Tellus, 14, 1–18, 1962. a