the Creative Commons Attribution 4.0 License.
the Creative Commons Attribution 4.0 License.
 | 08 Nov 2018
UV measurements at Marambio and Ushuaia during 2000–2010
Alberto Redondas
Outi Meinander
Laura Thölix
Britta Hamari
Antonio Fernando Almansa
Virgilio Carreno
Rosa Delia García
Carlos Torres
Guillermo Deferrari
Hector Ochoa
Germar Bernhard
Ricardo Sanchez
Gerrit de Leeuw
Solar ultraviolet (UV) irradiances were measured with NILU-UV multichannel radiometers at Ushuaia (54∘ S) and Marambio (64∘ S) between 2000 and 2013. The measurements were part of the Antarctic NILU-UV network, which was started in cooperation between Spain, Argentina and Finland. The erythemally weighted UV irradiance time series of both stations were analysed for the first time. The quality assurance procedures included a travelling reference instrument to transfer the irradiance scale to the stations. The time series were homogenized and high quality measurements were available for the period 2000–2010. During this period UV indices of 11 or more were measured on 5 and 35 days at Marambio and Ushuaia, respectively. At Marambio, the peak daily maximum UV index of 12 and daily doses of around 7 kJ m−2 were measured in November 2007. The highest UV daily doses at both stations were typically around 6 kJ m−2 and occurred when the stations were inside the polar vortex, resulting in very low total ozone amount. At both stations, daily doses in late November could even exceed those in the summer. At Marambio, in some years, also daily doses in October can be as high as those during the summer. At Ushuaia, the peak daily maximum UV index of 13 was measured twice: in November 2003 and 2009. Also during those days, the station of Ushuaia was inside the polar vortex.


The Antarctic NILU-UV network was established in 1999/2000 in scientific cooperation between the Spanish Agencia Estatal de Meteorología (AEMET), the Finnish Meteorological Institute (FMI) and the Argentinian Dirección Nacional del Antártico-Instituto Antártico Argentino (DNA-IAA) and Centro Austral de Investigaciones Cientificas (CADIC). The goal was to promote research of stratospheric ozone and ultraviolet (UV) radiation in the Antarctic region and to serve multidisciplinary research by providing UV and ozone data.
The well-known Antarctic ozone depletion was first discovered by Farman et al. (1985) in the mid-1980s. Satellite measurements confirmed that the ozone hole existed over the whole of Antarctica. Soon after, more in situ measurements were started to monitor total ozone and UV radiation. Also, regular balloon soundings were launched to monitor the vertical distribution of ozone in the atmosphere (e.g. Karhu et al., 2003). Knowledge of the mechanisms of the ozone depletion increased, and the role of ozone depleting substances and cold temperatures inside the polar vortex was understood (Pazmiño et al., 2005; WMO, 1990, 1999). The sites of the Antarctic NILU-UV network were chosen based on their location relative to the polar vortex: Belgrano (77∘ S, 35∘ W) was mostly located inside, Marambio (64∘ S, 56∘ W) at the edge and Ushuaia (54∘ S, 68∘ W) outside the polar vortex. NILU-UV multichannel radiometers (Høiskar et al., 2003) were set up at the stations to continuously monitor total ozone and UV irradiance.
The measurements of the network were interrupted in 2014, and the whole UV time series of Ushuaia and Marambio are analysed for the first time in this study. Since the start of the measurements, special attention was given to quality assurance in order to make measurements worldwide comparable (Lakkala et al., 2005). A travelling reference was used to transfer the irradiance scale to both Marambio and Ushuaia. The instrument of Belgrano did not follow the same quality assurance procedure. The time series for Belgrano is therefore not discussed in this study even though the instrument was regularly exchanged with a newly calibrated radiometer.
The first measurements of the network started in 2000 when the Antarctic ozone hole firmly established (WMO, 2003, 2007). Later, the recovery of stratospheric ozone was predicted (Andrady et al., 2009), and nowadays, 30 years after signing the Montreal Protocol restricting ozone depleting substances, first signs of the stratospheric ozone recovery have been observed (Solomon et al., 2016). The NILU-UV time series of Ushuaia and Marambio presented in this study are important for the future: the time series serve as reference representing a period when severe stratospheric ozone depletion occurred.
Observations at these locations complement measurements with spectroradiometers at the South Pole, McMurdo Station (78∘ S), Palmer Station (65∘ S) and Ushuaia, which started in the early 1990s and are part of the U.S. National Science Foundation's (NSF) UV Monitoring Network (Bernhard et al., 2010; Booth et al., 1994). Bernhard et al. (2008, 2010) analysed the data of these sites and found a large effect of the ozone hole on the UV index at the three Antarctic sites, and to a lesser extent at Ushuaia. Their analysis showed that at the South Pole the UV index is on average 20 %–80 % higher during the ozone hole period than between January and March. They studied the UV index compared to estimates of the UV index prior to the ozone hole period, and found that the average UV index between 1991 and 2006 was 55 %–85 % higher than the estimates for the period 1963–1980. The highest UV index measured at Palmer was 14.8. At Ushuaia, UV indices as high as 11.5 were measured in October, when the ozone hole was over the city. Eleftheratos et al. (2015) studied changes in irradiances at 305 and 325 nm at southern latitudes 55–77∘S, but did not find any statistically significant changes between 1990 and 2011.
2.1 NILU-UV radiometers at Ushuaia and Marambio
The NILU-UV multichannel radiometer measures UV radiation in five spectral bands with center wavelengths at 305, 312, 320, 340 and 380 nm. The full width at half maximum (FWHM) of the measured wavelength band is around 10 nm. A sixth channel measures the photosynthetically active radiation (PAR) at wavelengths between 400 and 700 nm. Erythemally weighted irradiances, UVB (280–320 nm) and UVA (320–400 nm) irradiances can be retrieved from the measurements. In addition to UV irradiances, total ozone and information about the cloud optical depth can be calculated.
The instrument is described in detail in Høiskar et al. (2003). It is weatherproof and designed to operate in harsh environments. The instrument has a flat Teflon diffuser, interference filters and silicon detectors. In order to keep the instrument stable at different temperatures, internal heating keeps the temperature constant at 40∘ C.
In routine operation, 1 min averages are recorded by a built-in data logger. This allows the detection of rapid changes in cloudiness and total ozone amounts. There is a possibility to record measurements each second, and this option was used during lamp measurements. Three weeks of 1 min averages can be stored in the memory of the instrument. In the NILU-UV network, the data were however daily/weekly transferred automatically or manually to the servers of AEMET and FMI.
Ushuaia is located in the archipelago of Tierra del Fuego, Argentina. The NILU-UV instrument was set up on the roof of the CADIC facility next to a SUV-100 spectroradiometer that was part of the U.S. National Science Foundation's Ultraviolet Spectral irradiance Monitoring Network (Booth et al., 1994). The altitude of the station is 23 m. The station is surrounded by mountains, which have snow cover most of the year. In the south, there is the Beagle Channel, which connects Ushuaia to the South Pacific Ocean. There is snow on the ground from June to September.
The Marambio research station, Base Marambio II, is located at the end of the North East Antarctic Peninsula. At Marambio, the NILU-UV was set up on the roof of the main scientific building. The altitude of the station is 196 m. The climate is characterized by mean temperatures below zero the whole year and strong winds. The temperatures range from −15 ∘C in June to −2 ∘C in December (from http://www.smn.gov.ar/serviciosclimaticos/, last access: 26 October 2018). Fog is frequent, and the most foggy months are December and January. Summer is the cloudiest season and winter has the least clouds. The snow stays on the ground the year round.
Erythemally weighted UV products
The time series of erythemally weighted UV irradiances were calculated using the method described in Dahlback (1996). According to this method, UV dose rates (D) were derived from measurements of the NILU-UV's five UV channels using a linear combination (Eq. 1) where the raw data (Vi) measured by each channel (i) are multiplied by coefficients (ai).
The coefficients (ai) of Eq. (1) were in turn determined by solving the system of linear equations described by Eq. (7) of Dahlback (1996) (here Eq. 2):
The coefficients ki are calibration factors. In our implementation, these factors were derived from a vicarious calibration of the NILU-UV's raw data with measurements of the spectroradiometer of the Norwegian Radiation Protection Authority (NRPA) (Johnsen et al., 2002), which were weighted with the relative spectral response functions of the NILU-UV's channels (Eq. 3 of Dahlback, 1996). Aλ is the erythemal action spectrum (McKinlay and Diffey, 1987) and Fλ are model spectra calculated with radiative transfer model using pseudo spherical DISORT.
In this work the UV indices and daily doses, calculated from the erythemally weighted dose rates, were studied. The UV index was calculated by multiplying the erythemally weighted dose rate expressed in unit W m−2 by 40 (e.g. WMO, 1997). The erythemally weighted daily doses (H) were calculated by integrating the erythemally weighted dose rates over the whole day (Eq. 3, T1=00:00 and T2=24:00 local time).
For each day of the year, the mean daily maximum UV index and mean daily dose were calculated from the respective days of each year of observation. From now on in this paper, these means are called “daily climatology”, even if they are not real climatological means from statistical point of view as the time period is too short. Daily deviations (DEV) as percentage were calculated from this daily climatology following Eq. (4), where X is the daily maximum UV index or daily dose and “clim” is the daily climatology.
Radiation amplification factors (RAFs) were calculated for erythemally weighted UV irradiances during clear skies at SZA between 69.95 and 70.05 for Marambio. Clear-sky data were selected using the cloud transmission factor (CLT) calculated from the NILU-UV irradiance at 380 nm (Høiskar et al., 2003). RAF values were calculated from the power law (e.g. Booth and Madronich, 1994)
using a least square fit, where is the highest total ozone value observed during the time series and UV∗ is the corresponding erythemally weighted UV irradiance.
2.2 QC of UV data at Marambio and Ushuaia
The quality control of the NILU-UVs of Marambio and Ushuaia was performed by the operators at the station. Daily activities included cleaning of the diffuser, check of levelling and clock adjustment. Regular lamp measurements were performed at the stations and the data were regularly transferred to the databases of AEMET and FMI. The quality control of the NILU-UV network is described in detail in Lakkala et al. (2005) and briefly summarized in the next section.
Lamp measurements
Lamp measurements were performed at the station every two weeks to monitor the stability of the NILU-UV radiometer. A 100 W lamp was mounted on a lamp holder and placed over the NILU-UV. After the lamp had warmed up, the irradiance was measured during 15 min with a time step of 1 s. The temperature of the instrument was also recorded. Each time two lamps were measured and every third time a third lamp was measured in addition. This led to different burn-times of the lamps, which afforded the detection of drifts in lamp irradiances.
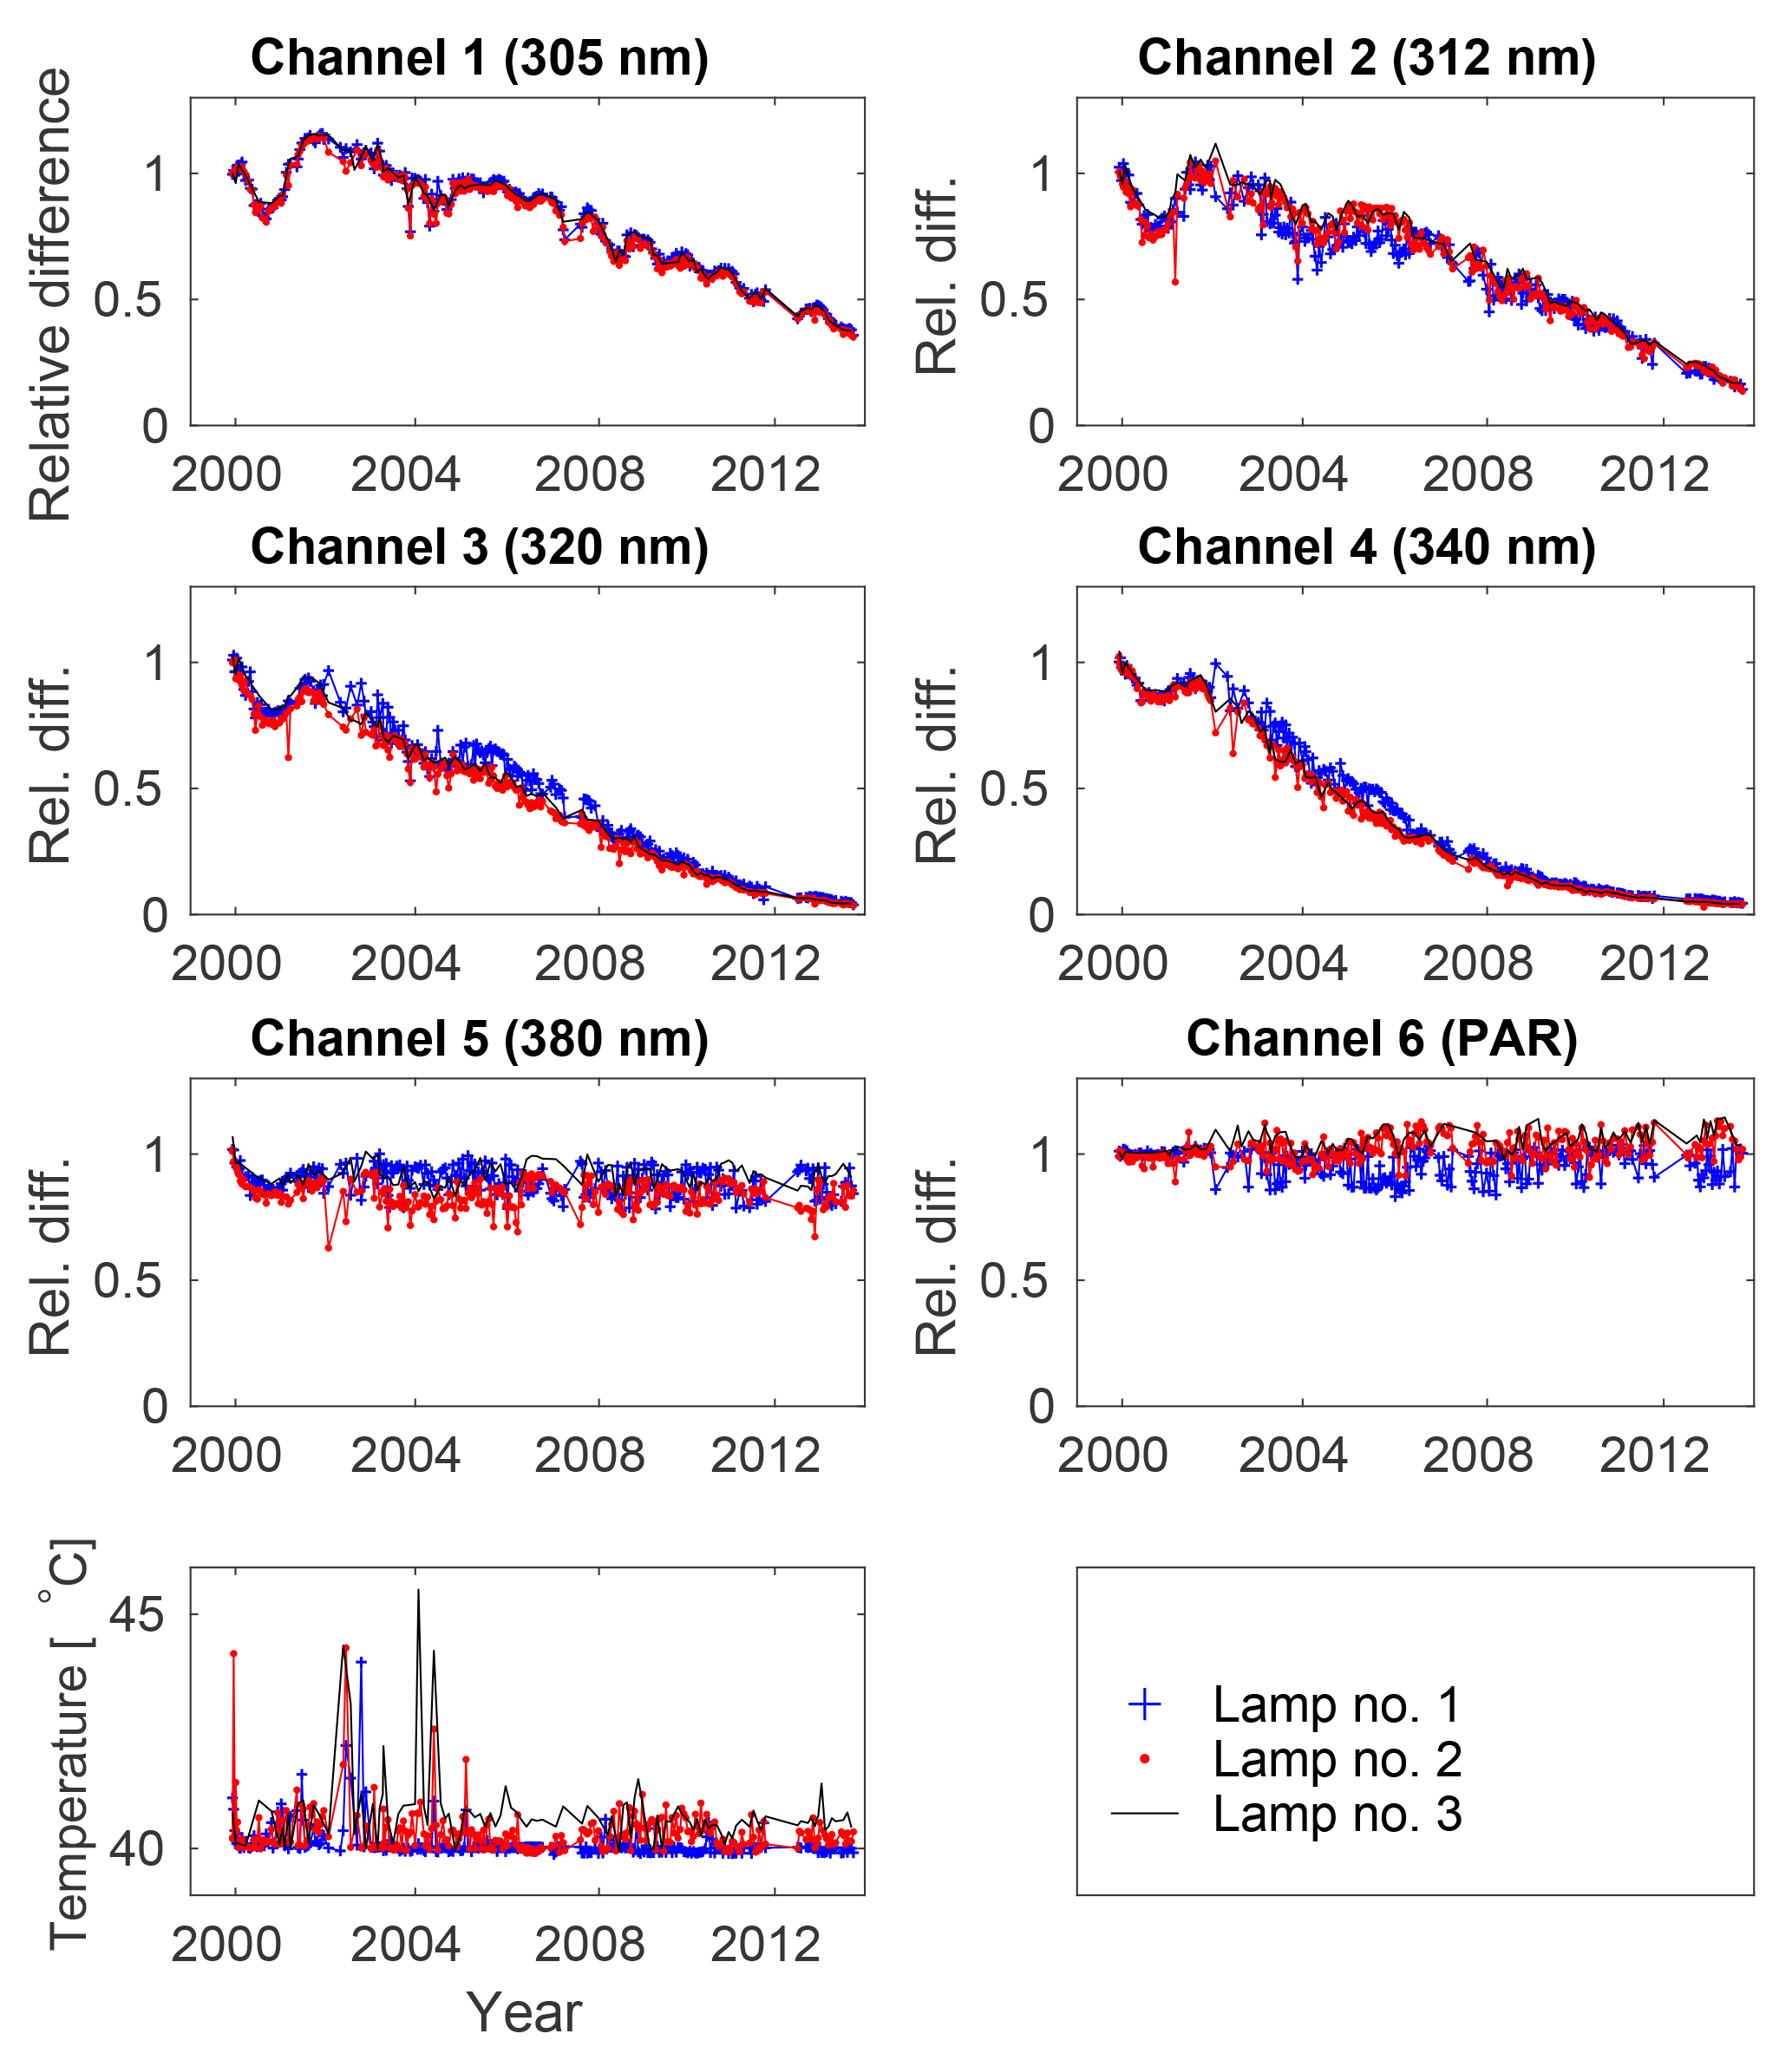
Each lamp test was compared to the average of the first three measurements at each channel (Figs. 1 and 2). Severe drifts in the sensitivities of the instrument were already detected in channels 1–4 after a couple of years of operation of the NILU-UV. These large drifts were caused by the material from which the filters were made, which degraded due to exposure to UV radiation. After 4 years of operation, decreases of up to 40 % in the sensitivity of some filters were observed (Lakkala et al., 2005). The degradation continued throughout the whole period of measurements. After 2010, the sensitivity of channels 2–4 decreased more than 80 % (Figs. 1 and 2). Due to these large changes, it was no longer possible to correct data after 2010. Until that year, the data were corrected using the scaling of the channels to those of the travelling reference during solar comparisons (see Sect. 2.3.2). The results of the lamp tests were used to confirm the observed changes in the scaling coefficients, but not to perform absolute calibration. The data of the years 2011–2013 had to be excluded from the analysis.
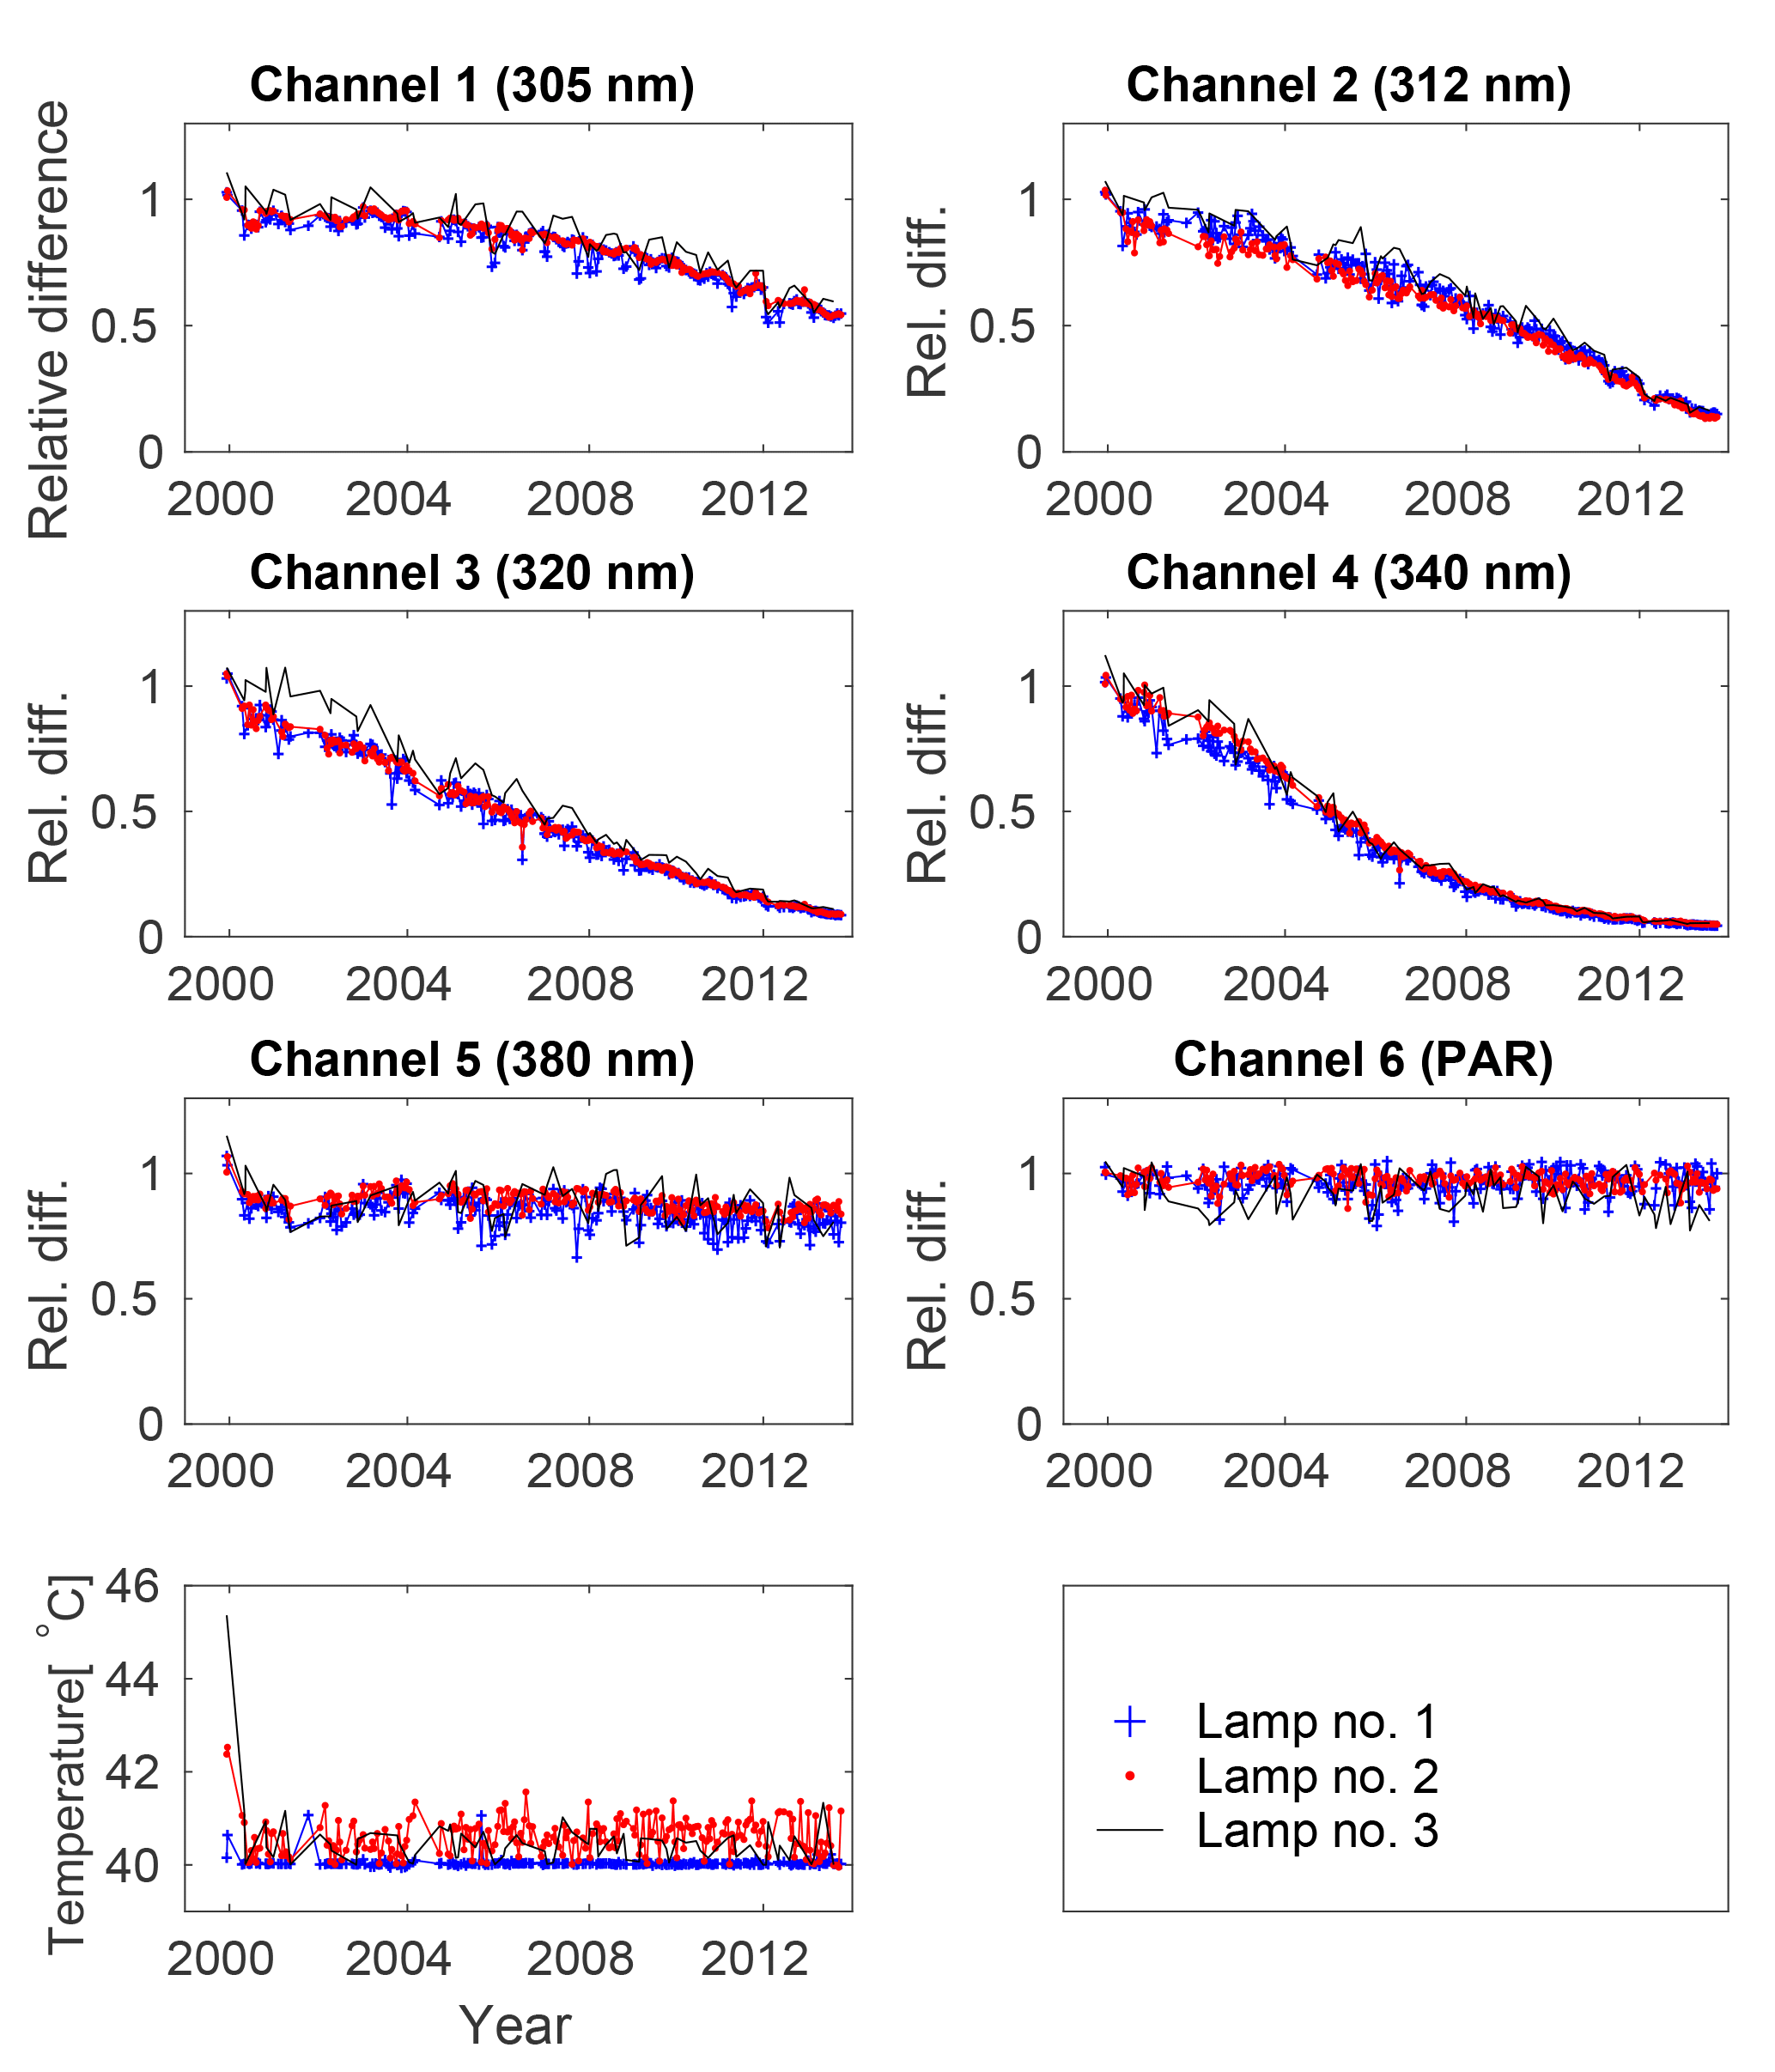
Figure 1Lamp measurements at Ushuaia during 2000–2013. The raw data of the lamp are divided by the mean of the three first measurements. The temperature of the NILU-UV during the measurement is also shown.
2.3 QA of the network
The quality assurance of the network was based on the use of a travelling reference to transfer the irradiance scale to the NILU-UV radiometers of Ushuaia and Marambio. The details are explained in Lakkala et al. (2005) and the procedures are shortly described in the next sections.
2.3.1 Travelling reference
The travelling reference of the network was a NILU-UV radiometer, which had filters with similar spectral responses to the NILU-UV radiometers of Ushuaia and Marambio. It was calibrated by the manufacturer in Norway in 1999, 2000, 2001, 2002, 2004, 2005, 2007 and 2010. The irradiance scale was traceable to the National Institute of Standards and Technology (NIST) via the Swedish Testing and Research Institute (SP) (Johnsen et al., 2002).
The quality control of the travelling reference included lamp tests before and after each solar comparison. The quality assurance included comparisons with spectroradiometers in Finland and Ushuaia. In Finland, the travelling reference was compared to the Brewer spectroradiometers of FMI at either Sodankylä (67∘ N) or Jokioinen (61∘ N). The irradiance scale of the Brewer was traceable via the National Standard Laboratory MIKES, Aalto University, Finland, to the scale maintained by SP (Heikkilä et al., 2016; Lakkala et al., 2008). At Ushuaia, measurements were compared to data of the SUV-100 spectroradiometer of the NSF UV monitoring network. This network also included high-latitude sites in Antarctica and the Arctic (Bernhard et al., 2010). The irradiance scale was traceable to NIST (Bernhard et al., 2003). SUV-100 measurements at Ushuaia were discontinued in December 2008.
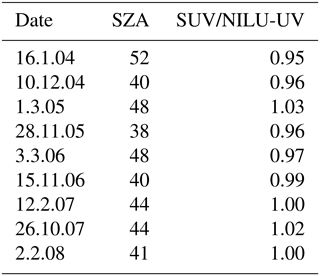
In this study, results of the comparisons done in 2004–2012 were analysed for clear-sky conditions (Tables 1 and 2). Results prior to 2004 were analysed and discussed in Lakkala et al. (2005). All comparisons showed that the difference between the travelling reference and the spectroradiometers was within 5 % until February 2008. In 2009, the comparison with the Finnish Brewer spectroradiometer in Jokioinen showed a difference of 20 % in erythemally weighted dose rates. In 2010, the NILU-UV reference radiometer was sent to Norway to be recalibrated. The next comparisons were in 2011 and 2012, when the differences were 8 % and 26 %, respectively, which suggest an increased rate of degradation of the instrument. After 2011, the channels of the travelling reference had drifted so severely that even recalibration would not have helped, and measurements with that instrument were not possible after 2012.
2.3.2 Solar comparisons to transfer the irradiance scale
The travelling reference typically visited Marambio twice and Ushuaia three times each year in spring–autumn. During these site visits, solar comparisons were performed to transfer the irradiance scale. Each channel of the site radiometer was scaled to the corresponding channel of the travelling reference. The method is described in detail in Lakkala et al. (2005). In the method, the calibration of the site instruments relevant for solar data was entirely based on the comparisons with the reference instrument.
Table 1The ratios of erythemally weighted UV dose rates between the reference NILU-UV and Brewer spectroradiometers no. 037 and no. 107 during 2004–2012. The date format is day.month.year (two digits).
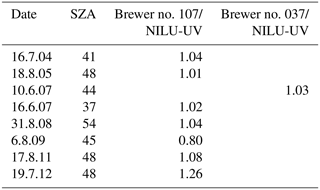
Table 2The ratios of erythemally weighted UV dose rates between the reference NILU-UV and the SUV spectroradiometer during 2004–2006. For 2007–2008 the comparisons were done between the NILU-UV of Ushuaia and the SUV spectroradiometer. The date format is day.month.year (two digits).
The differences between measurements of the travelling reference and the site instrument before the calibration were used as scaling coefficients and their time series is shown in Fig. 3. The differences for channels 1–3 of the travelling reference and site NILU-UV were less than or around 50 % until 2010, for both site instruments. Channel 2 of the instrument at Marambio had however smaller differences than the corresponding channel of the instrument at Ushuaia. Differences for channel 4, which degraded the fastest, exceeded 80 % already in 2008.
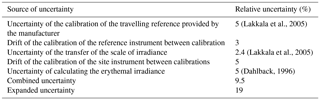
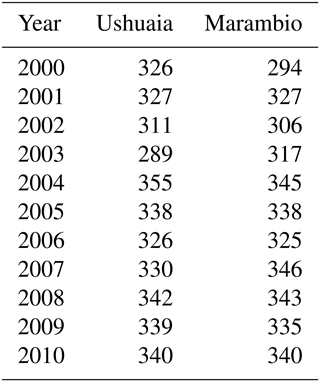
For the years 2000–2008 and 2010, all measurements at Ushuaia and Marambio were scaled according to the method described by Lakkala et al. (2005) and the erythemally weighted UV dose rates were calculated. The highest step between calibrations occurred in Marambio in January 2000 and was 11 % for erythemally weighted UV dose rates. A typical step between calibrations ranged from 1 % to 5 % during the summer months. An uncertainty budget was established based on uncertainty related to the drift of the calibration of the site instrument (5 %), the drift of the travelling reference between calibrations (3 % for 2004–2006), the uncertainty of the calibration of the travelling reference (Lakkala et al., 2005), the uncertainties related to the transfer of the irradiance scale (Lakkala et al., 2005) and the uncertainty of the method to calculated the dose rates (Dahlback, 1996). The combined uncertainty was calculated to be 9.5 % and the expanded uncertainty was 19 % using a coverage factor of 2 (Table 3). In 2009, the results of solar comparison between the FMI Brewer spectroradiometer and the travelling reference showed a difference of 20 %. For that year all dose rates referenced to the travelling reference were scaled by 20 % to account for the drift of this system. Thus the uncertainty of the measurements of the year 2009 was higher than for the other years. The number of days with measurements used in this study are shown in Table 4 for each year.

Figure 3Scaling factors of the UV channels of the Ushuaia (⋅) and Marambio (+) NILU-UV instruments.
Table 3Uncertainty budget of the erythemally weighted UV irradiances during 2000–2008.
2.4 Potential vorticity analysis
Both Ushuaia and Marambio can be located inside, at the edge or outside the polar vortex. The impact of the location with respect to the polar vortex was studied by calculating the potential vorticity (PV) at Ushuaia and Marambio for measurement days. The modified PV, in which the PV was scaled to 475 K (Lait, 1994) using the ERA-Interim data, was used. If the PV is larger than 36 (in the Southern Hemisphere smaller than −36), the station is situated inside the vortex.
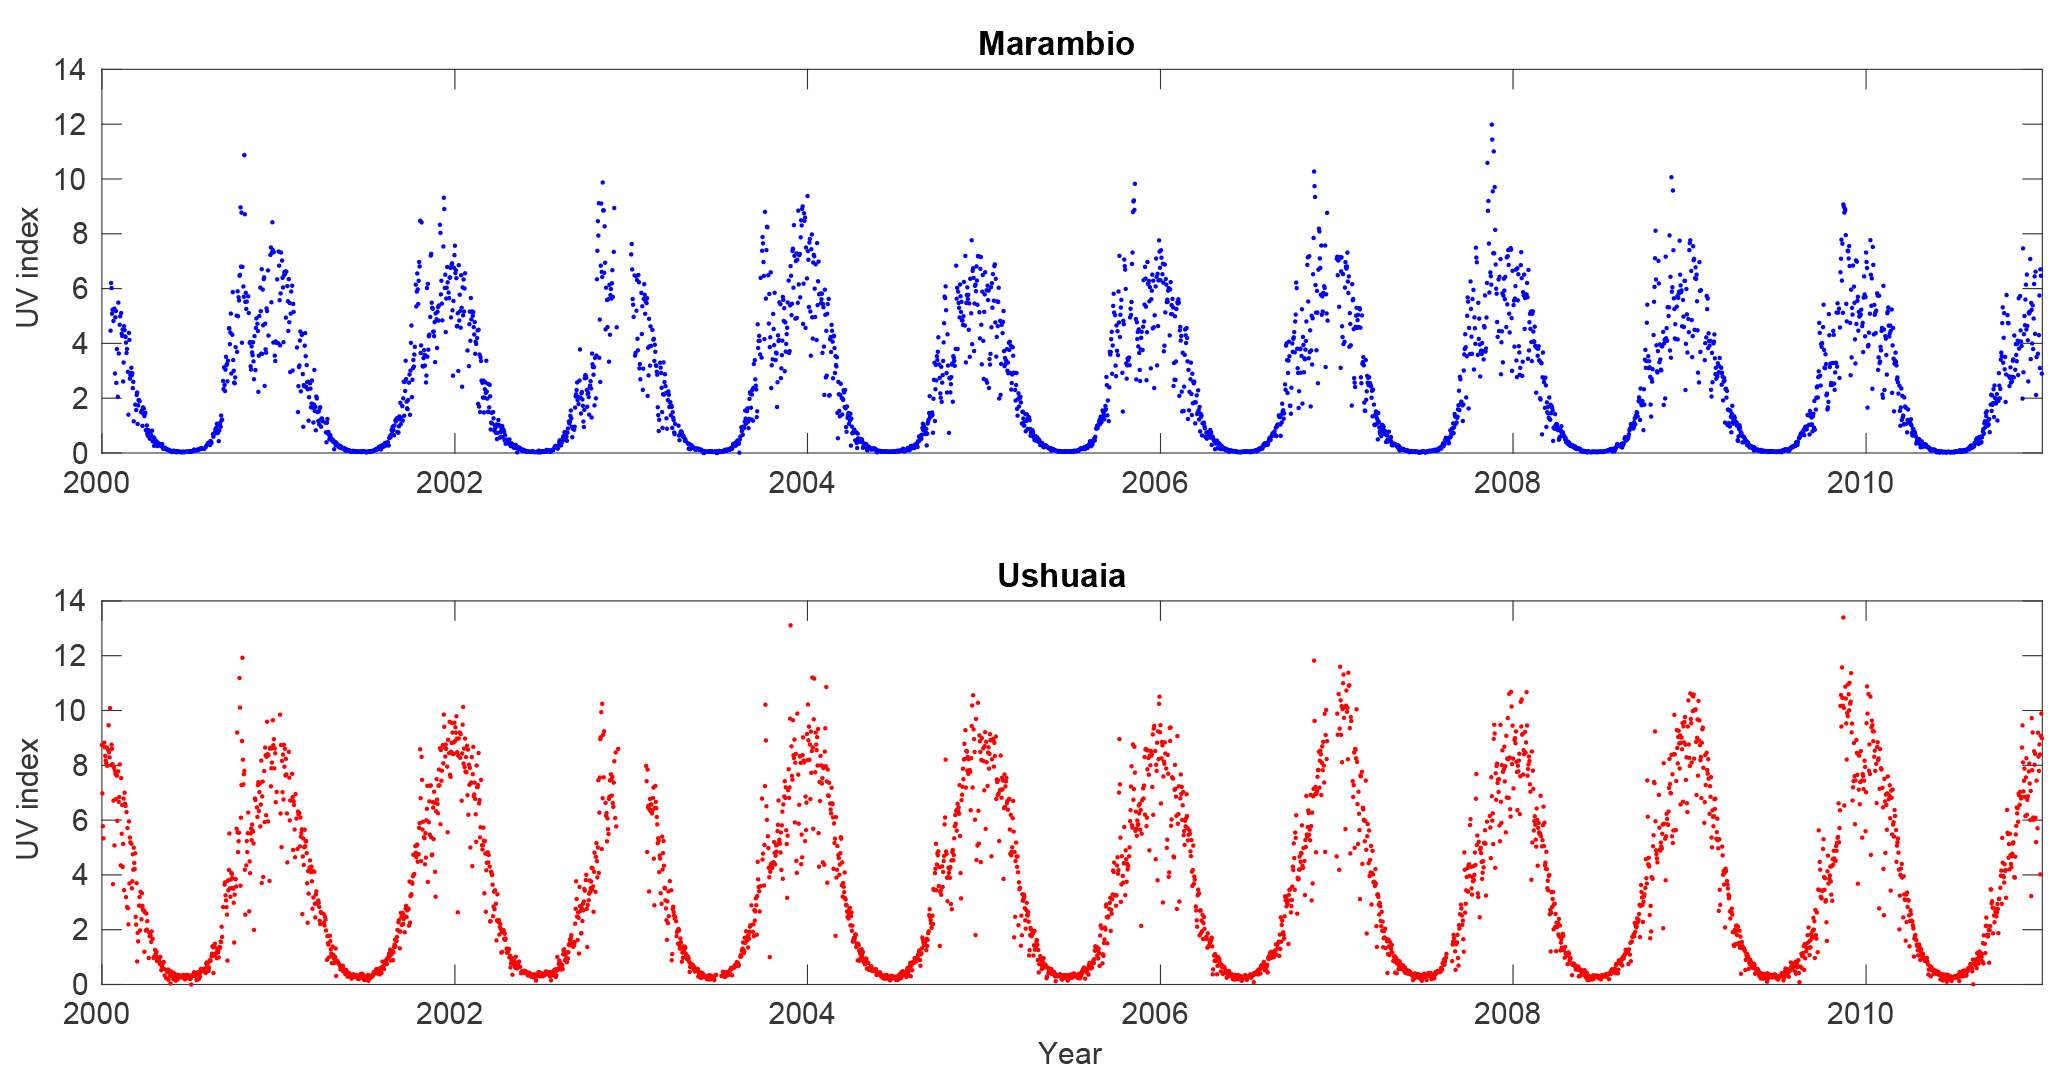
After the quality assurance procedures mentioned in the earlier sections, the time series of erythemally weighted UV irradiances for Ushuaia and Marambio were calculated for the time period 2000–2010. Maximum daily UV indices and daily doses calculated from the results are presented in Figs. 4 and 5 and discussed in the next sections. The data are archived and can be downloaded from the FMI Arctic Space Centre open-access database at http://litdb.fmi.fi.
3.1 UV index time series
At both stations, the highest UV indices were measured between the end of October and the end of November. As this period is before the summer solstice, factors other than the SZA must be responsible for the observed time shift of the maximum UV index. These factors include spring-time Antarctic ozone depletion (WMO, 2003) and snow cover at Marambio. The well-known Antarctic ozone depletion occurs during October–November (WMO, 2003) and there is snow cover during these months in Marambio. Both factors increase UV irradiances near the ground. Furthermore, clear skies or broken cloudiness conditions occurred during days when the highest UV values were measured.
At Marambio, “extreme” (i.e. UV indices of 11 or more; WMO, 1997) daily maximum UV indices were measured on 5 days, and the peak value of 12 was measured on 18 November 2007. The daily variation of the UV index on that record day is shown in Fig. 6. The total ozone amount on that day was 213 DU. The daily maximum UV was “very high” (i.e. 8–10) on 85 days and “high” (i.e. 6–7) on 524 days. The climatology of the daily maximum UV indices for the 2000–2010 period is shown in Fig. 7. The climatology (UV index of 6) peaked in late November, December and January. Figure 7 shows that the values of the daily climatology were not symmetrically distributed around mid summer, but were higher in spring (October) compared to days with the same noon-time SZA in autumn. Peak UV indices occurred between late October and late November, depending on how long the polar vortex stayed above the station. That was also the period during which the maximum UV indices deviated the most from the daily climatology (Fig. 8). Also, snow typically enhanced UV radiation in spring (Meinander et al., 2014). The RAF was calculated to be 1.16, when excluding the winter months May–July from the analysis. When calculating the RAF from data of months with the highest snow amount (August, September, October, March and April) the RAF was 1.18 (Fig. 9). For summer months November–February the RAF was calculated to be 0.91. Measured mid-summer clear-sky daily maximum UV indices were between 7 and 8. In June, no UV radiation was measured at the station. For comparison, at the same latitude in the Northern Hemisphere, in Finland, the highest measured UV indices were between 5 and 6. The main reasons for higher summer UV indices in Marambio were lower total ozone amounts and a smaller Earth–Sun distance.
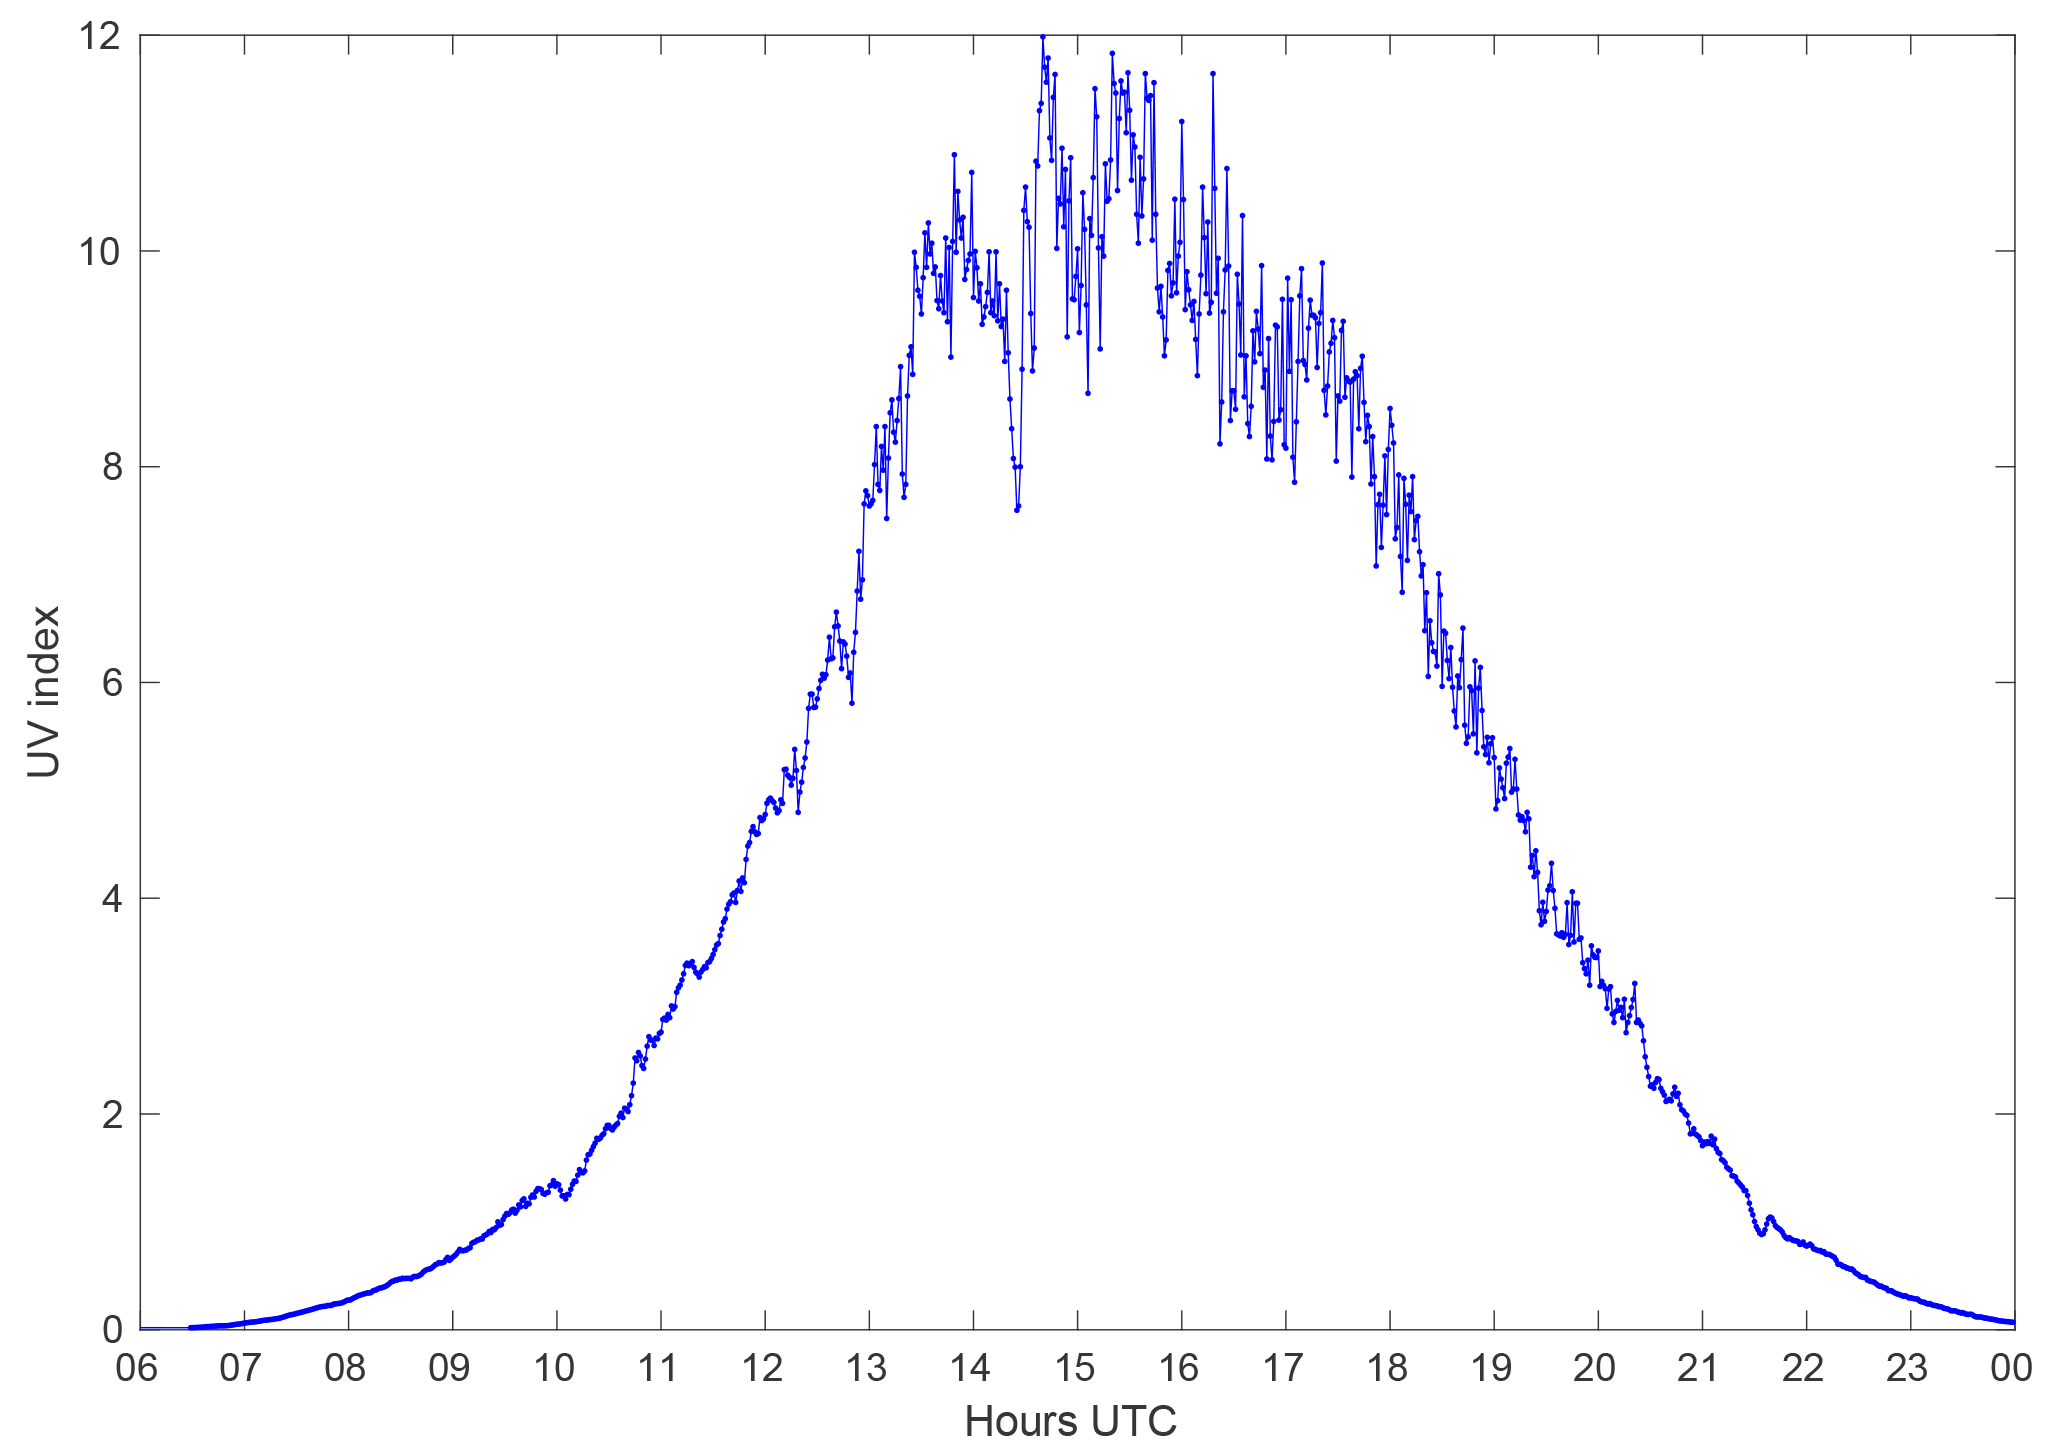
Figure 6UV indices measured by the NILU-UV radiometer at Marambio on the day of the record high UV index on 18 November 2007.
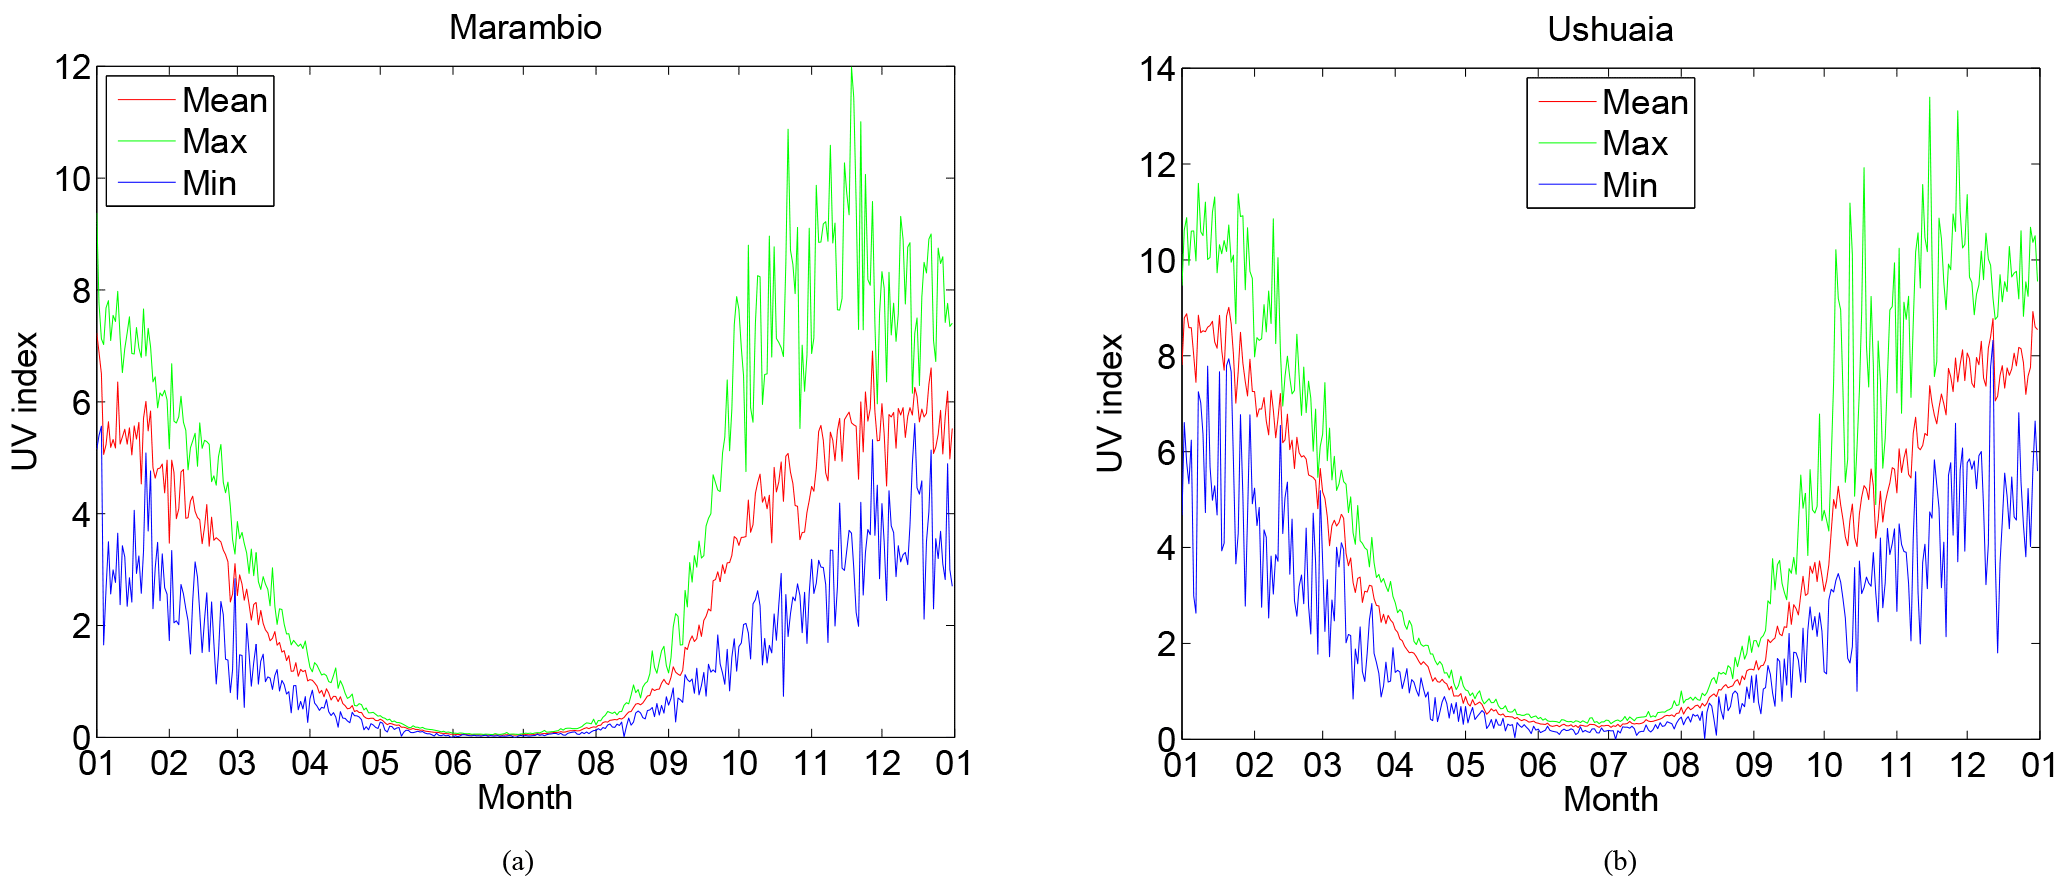
Figure 7The mean, maximum and minimum values of the daily maximum UV index calculated for each day of the year in the period 2000–2010 in (a) Marambio and (b) Ushuaia.
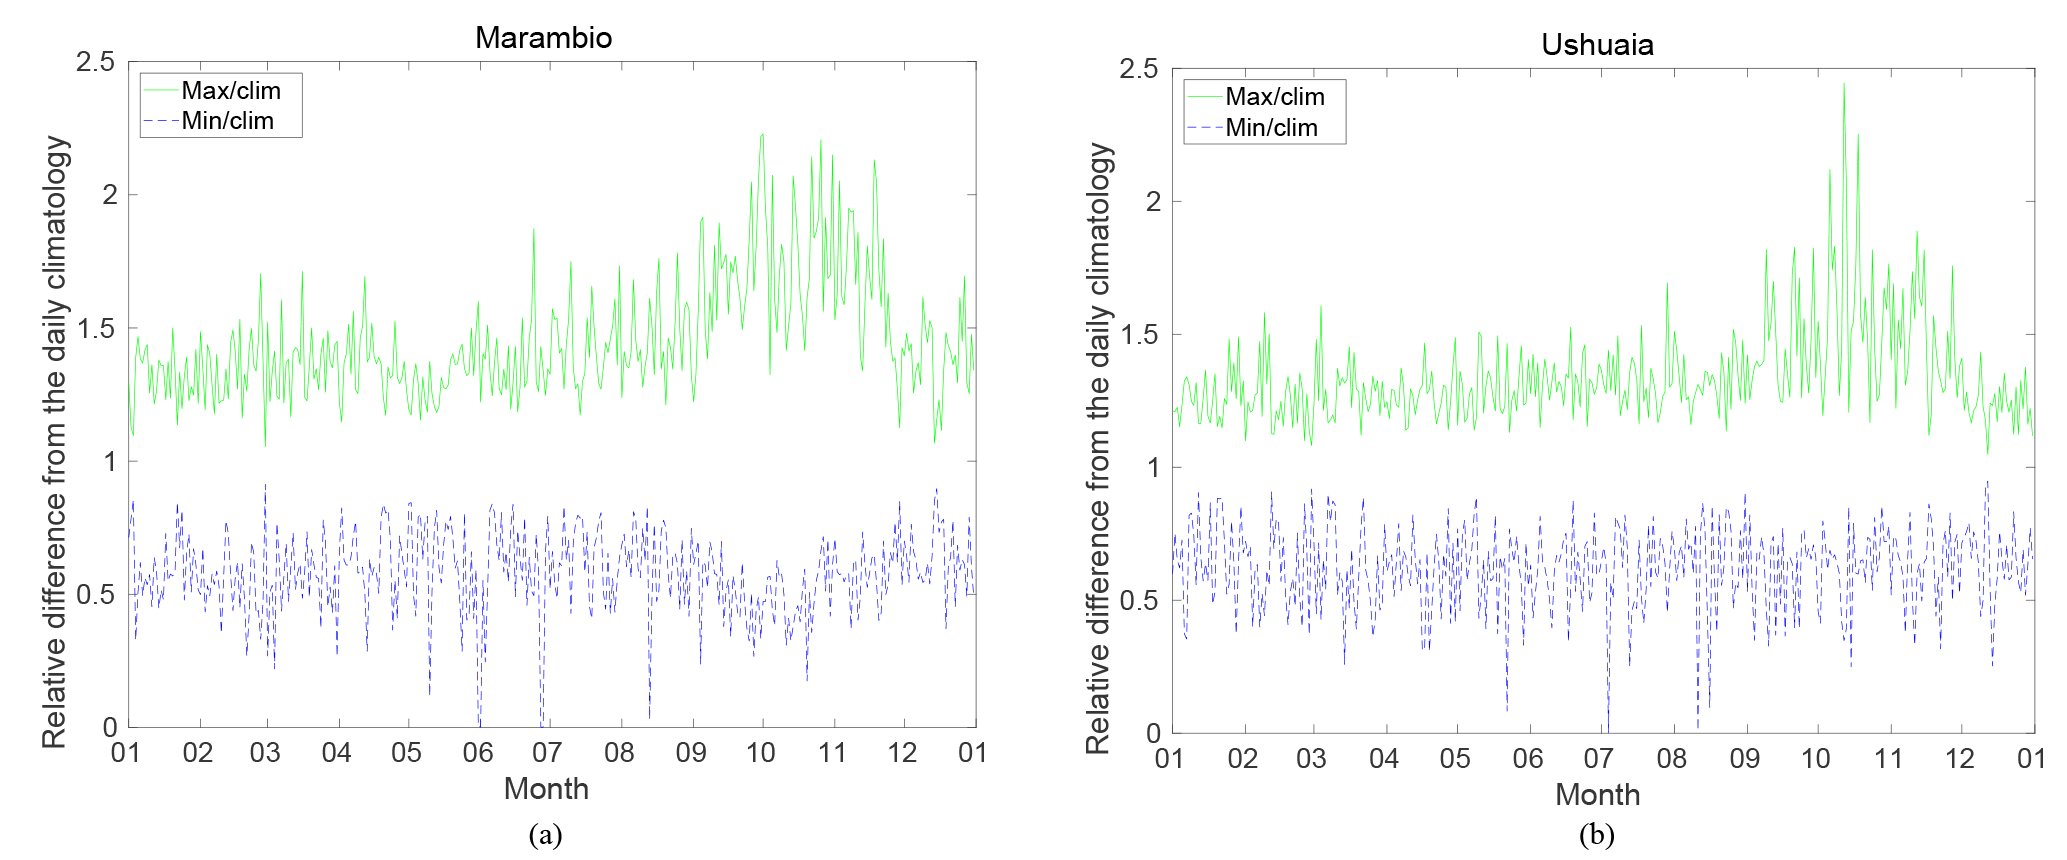
Figure 8The maximum and minimum values of the daily maximum UV index divided by the daily climatology of the maximum UV index on that day in (a) Marambio and (b) Ushuaia during 2000–2010.
At Ushuaia, “extreme” daily maximum UV indices were measured on 35 days. The highest value, UV index 13, was measured twice: on 27 November 2003 and on 15 November 2009. The corresponding total ozone amount on 27 November 2003 was 268 DU, but no ozone data were recorded for 15 November 2009. However, low ozone was evident as the total ozone amounts of the previous and next days were 176 and 215 DU, respectively. “Very high” daily maximum UV indices were measured on 515 days and “high” on 1045 days. Daily climatology calculated from the daily maximum UV indices in the period 2000–2010 were highest in January, with values of 8–9 (Fig. 7). The graph of the daily climatology showed the same but not as pronounced features as at Marambio: enhanced daily maximum UV indices in October (Fig. 8). When the station was inside the polar vortex in October the maximum UV indices could be as high as those measured in the summer of between 10 and 11.
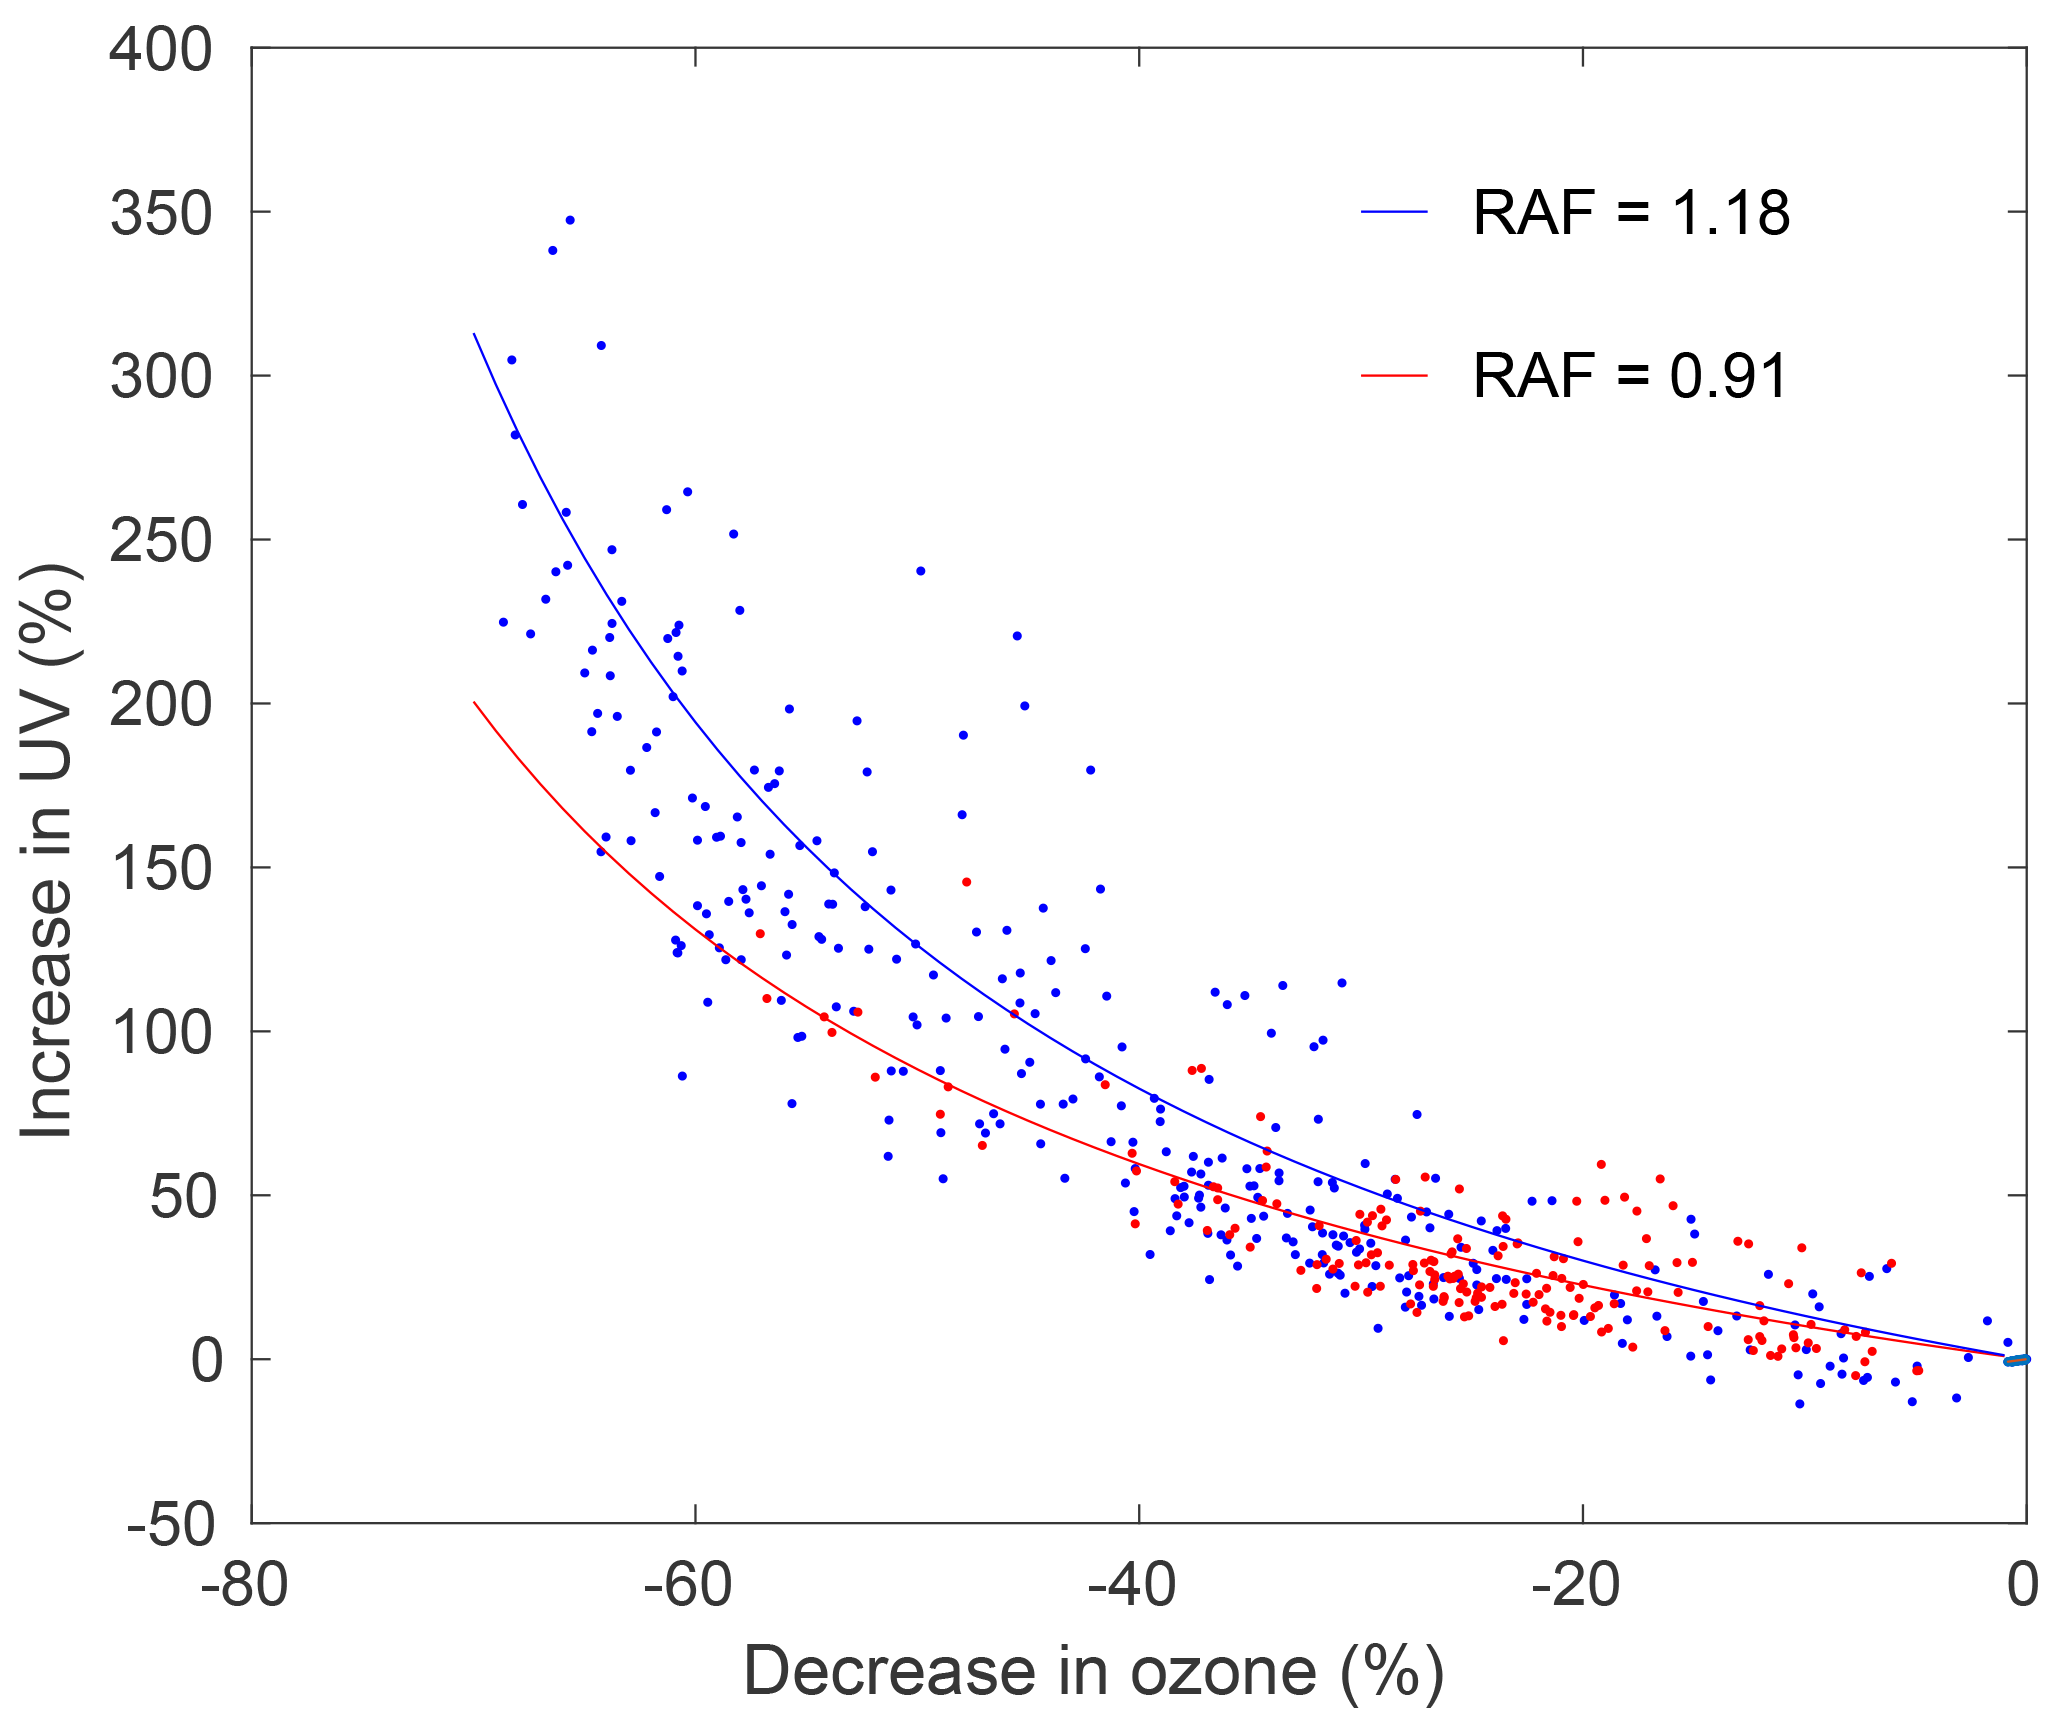
Figure 9Total ozone decrease from the highest total ozone value measured in Marambio during the measurement period 2000–2010 and the corresponding increase in erythemally weighted irradiances. Blue dots correspond to months when there is probably more snow on the ground (August, September, October, March and April) and the red dots correspond to summer months (November, December, January and February). The RAF is shown for the two periods and the theoretical increases in UV radiation using the RAFs are plotted as curves.
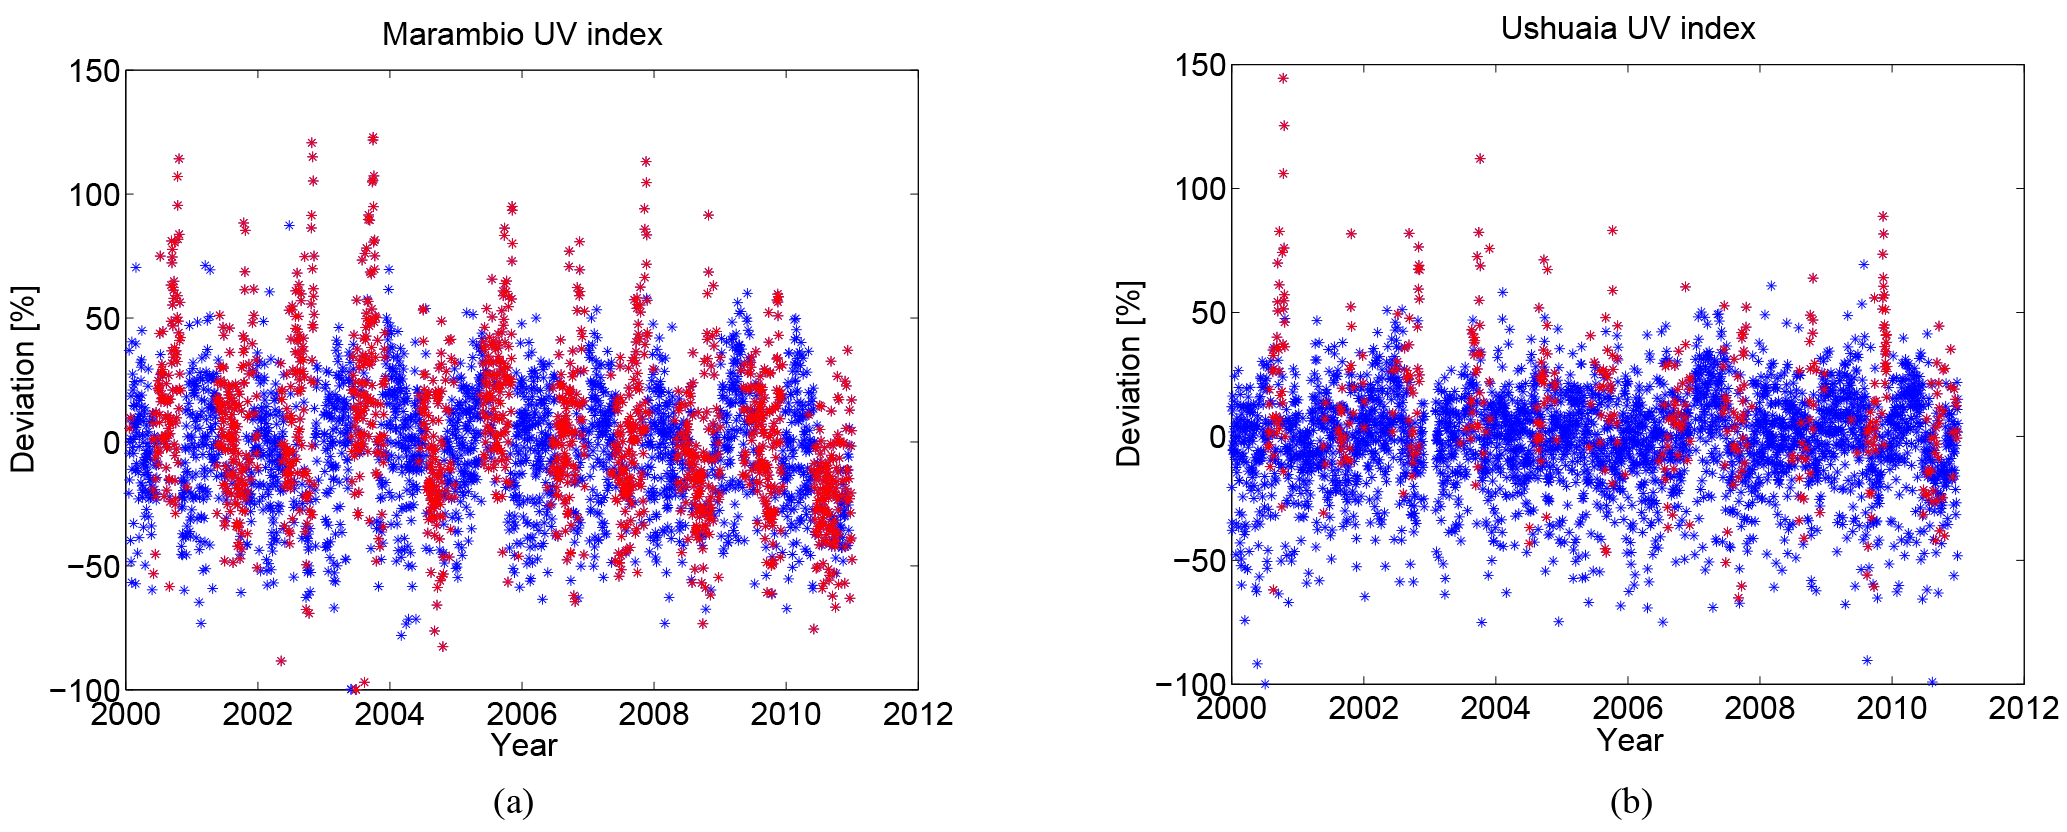
Figure 10Deviation from the daily climatology of maximum UV index in (a) Marambio and (b) Ushuaia for the years 2000–2010. Days for which the station was inside the polar vortex are indicated with red symbols, the others in blue.
The deviations from the daily climatology were calculated for each day (Fig. 10) and analysed with respect to the location of the polar vortex. All deviations larger than 80 % from the mean occurred when the stations were inside the polar vortex. At Ushuaia this was the case especially in 2000–2004 and in 2009. At Marambio, deviations of over 100 % were measured in 2000, 2002, 2003 and 2007. The highest deviations were 122 % on 1 October 2003 and 145 % on 12 October 2000 at Marambio and Ushuaia, respectively. During cloudy days, the daily maximum UV index did not reach high values, even when the station was inside the polar vortex. The lowest values occurred during days with heavy cloudiness or rainy days, with deviations of −100 % from the daily climatology.
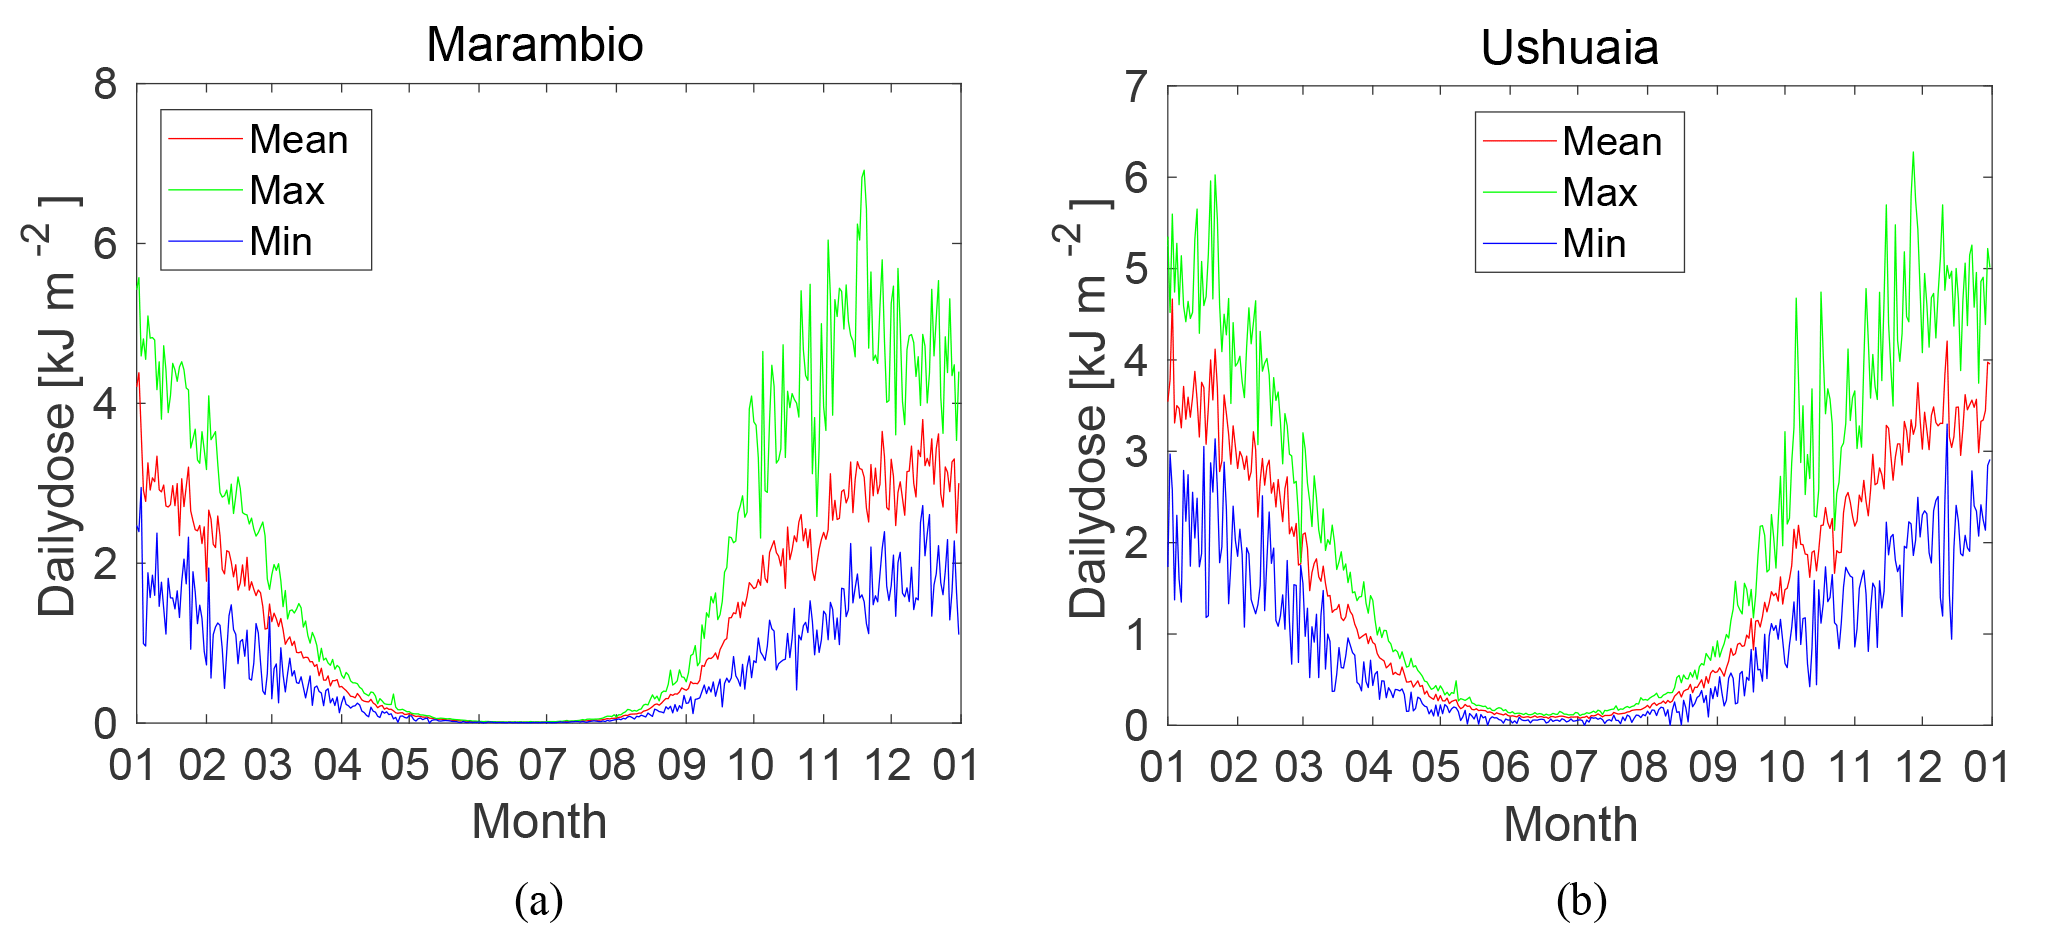
Figure 11The mean, minimum and maximum erythemally weighted daily dose (kJ m−2) calculated from the respective days of each year of observations in (a) Marambio and (b) Ushuaia during 2000–2010.
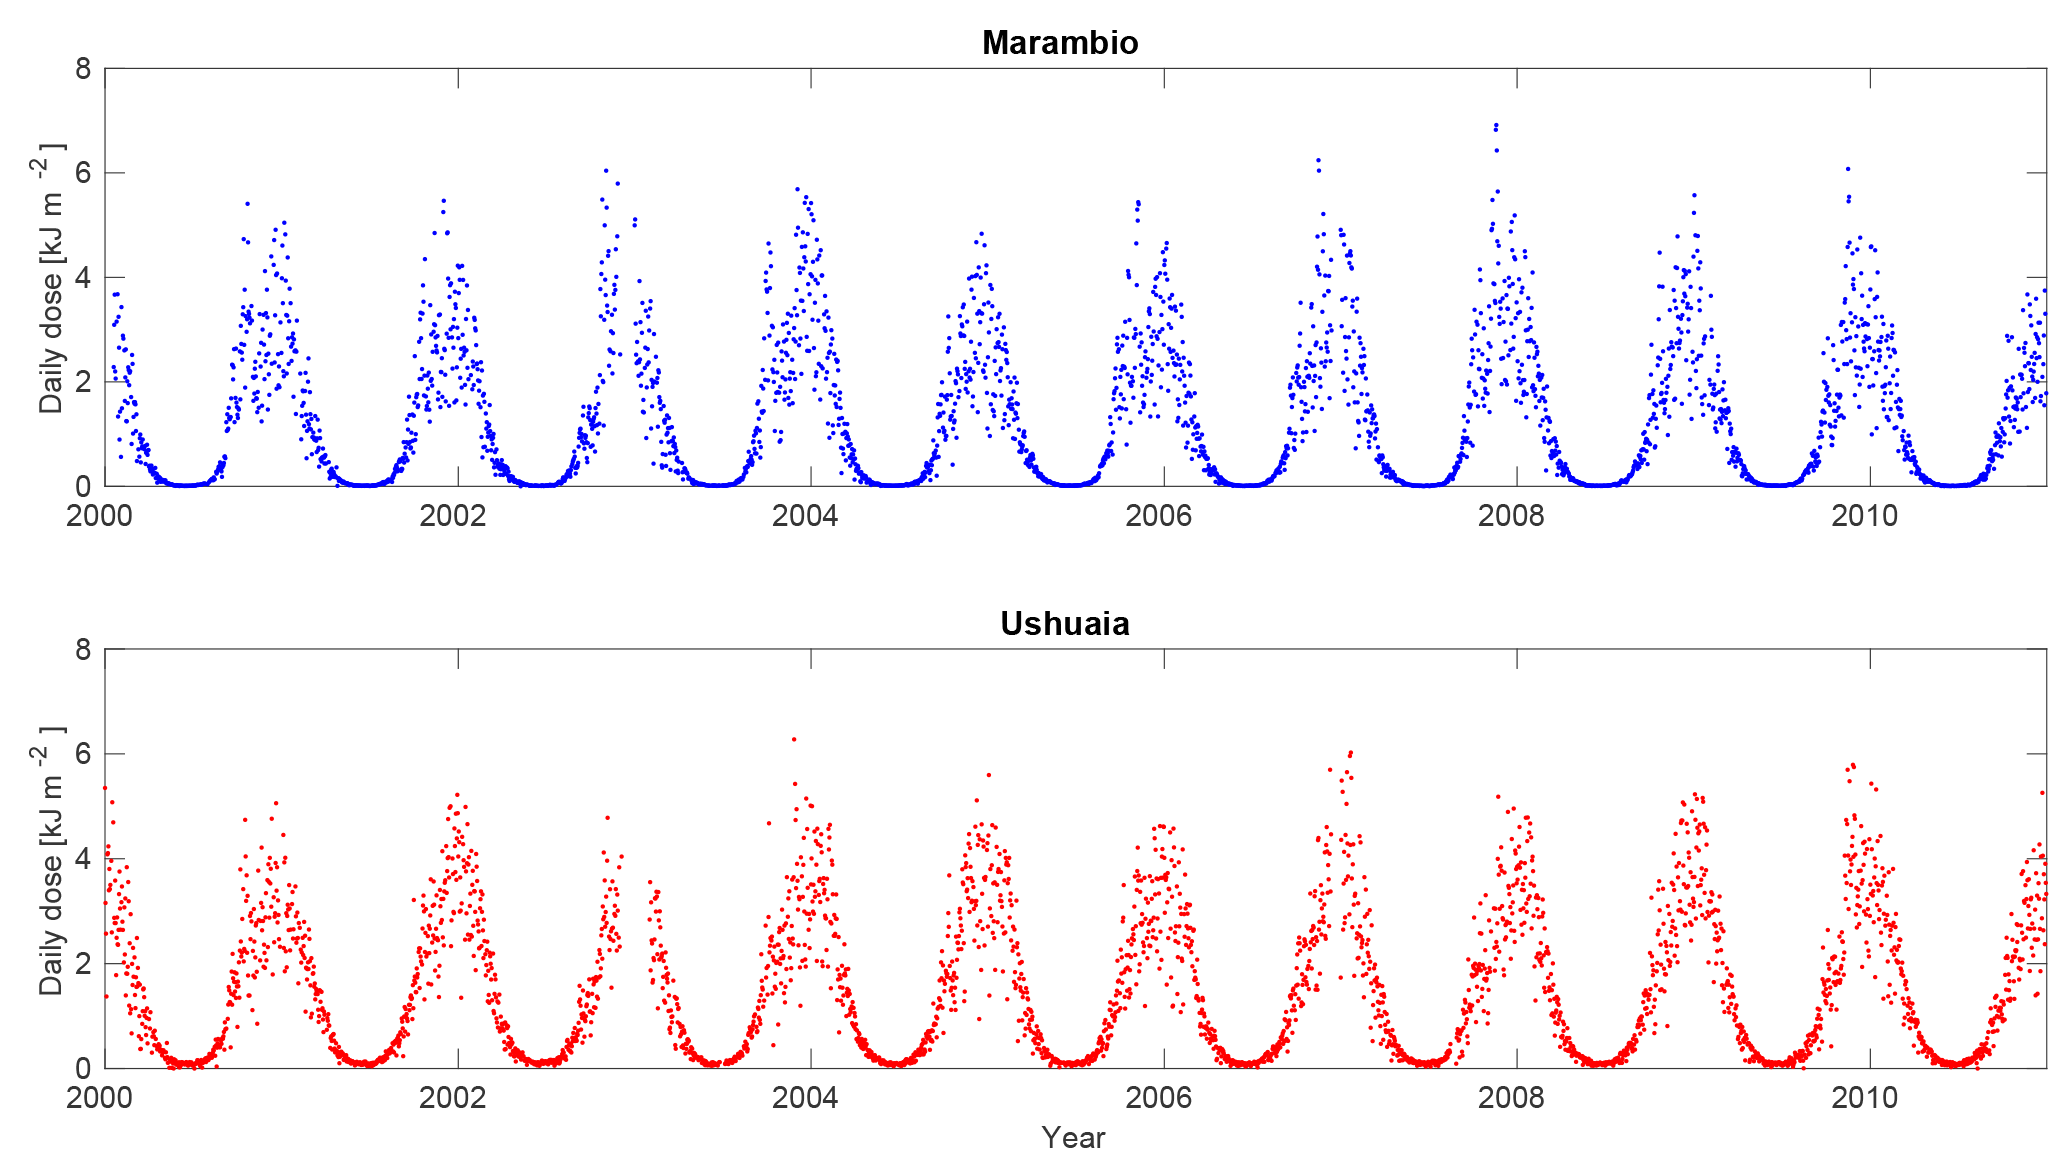
3.2 UV daily dose time series
Daily doses were strongly dependent on the total ozone amount and cloudiness conditions. For some days with low total ozone and clear sky, the daily dose time series show that peak daily doses were more pronounced than peak UV indices (Fig. 4). The highest daily doses were around 6 kJ m−2, at both Marambio and Ushuaia, even though the difference in latitude between these sites is 10∘. At Marambio, a daily dose of 7 kJ m−2 was measured in 2007, when the station was inside the polar vortex and episodes with low total ozone occurred. The highest daily doses were measured at Ushuaia and Marambio on 27 November 2003 and 19 November 2007, respectively.
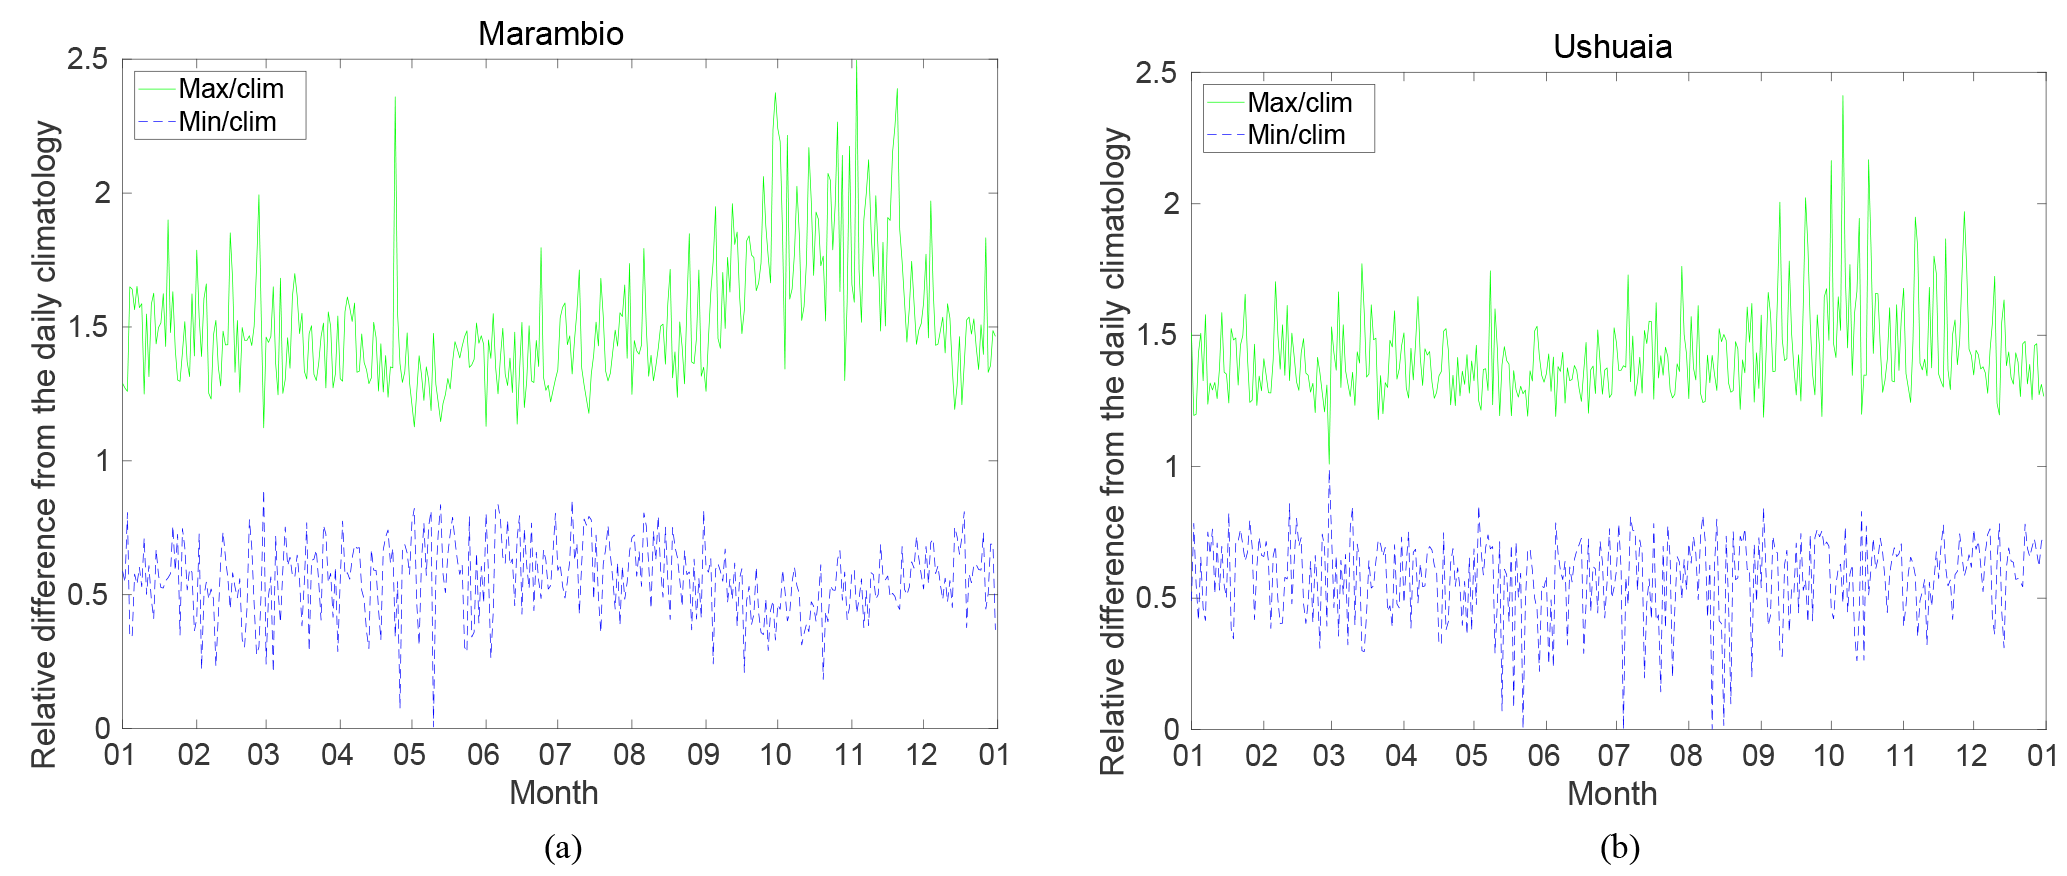
Figure 12The minimum and maximum erythemally weighted daily doses calculated from respective days of each year of observations divided by the daily climatology in (a) Marambio and (b) Ushuaia during 2000–2010.
The graph of the daily climatology of the daily doses (Fig. 11) showed features similar to those of the daily climatology of maximum UV indices (Fig. 7). The impact of low ozone episodes in October is seen, but not as clearly as for daily maximum UV indices. At Marambio, the highest mean daily doses occurred between late November and the end of December. When the station was inside the polar vortex and clear sky conditions occurred the typical daily dose was around 5 kJ m−2 in November. On typical summer days, the daily dose ranged between about 2.5 and 3.5 kJ m−2 but increased to 4.5 kJ m−2 for clear days. The high fluctuation in maximum values (Fig. 12) is due to the impact of year to year changes in cloudiness and total ozone.

Figure 13Deviations from the daily climatology of erythemal daily doses in (a) Marambio and (b) Ushuaia for the years 2000–2010. Days for which the station was inside the polar vortex are indicated with red symbols, the others in blue.
At Ushuaia, typical daily doses were between 3 and 4 kJ m−2 in summer. The graph of the daily climatology of daily doses showed maxima between late December and the end of January. Highest daily doses, between 4.5 and 5 kJ m−2, occurred typically in late January. However, daily doses of the same amount were measured on days with clear sky and low total ozone in late November. Compared to Marambio, the period of highest daily doses was shorter. At Marambio the period of highest daily doses, over 4 kJ m−2, started already in the beginning of October, while it started at Ushuaia in November. At Marambio, in addition to more frequent low total ozone conditions, also the snow on the ground increased the UV irradiances due to high surface reflection of the incoming radiation.
Both stations were inside the polar vortex on most of the days when the daily dose deviated by more than 75 % from the daily climatology (Fig. 13). At Ushuaia this was the case in 2000–2003. The highest deviation of 141 % above the mean was measured on 6 October 2003. At Marambio, in all cases except one, the station was inside the polar vortex when the daily doses deviated by more than 100 % from the daily climatology of that day. The highest deviation of 150 % from the daily climatology was measured on 3 November 2002. Deviations exceeded 100 % from the daily climatology also in 2000, 2003, 2005, 2007 and 2008.
After the operation of the Antarctic NILU-UV network, co-operative Argentinian–Finnish UV measurements were continued using erythemally weighted UV sensors. In cooperation between FMI and Servicio Meteorológico Nacional (SMN), Argentina, UV broadband radiometers of type SL501A manufactured by Solar Light Co. were installed in Marambio on 4 February 2013 to measure the local UV albedo (Meinander et al., 2014). One instrument was installed to measure UV radiation reflected from the ground, and a second one to measure global UV irradiance. Using these measurements, the UV index time series could be continued, as those measurements are also traceable, via the primary calibration lamp, to MIKES. The official SL501A trace is to NIST. The difference in calibration coefficients using NIST and MIKES has been found to be less than 2 %, and in comparison of spectral UV irradiance scales maintained by NIST, PTB and Aalto University (HUT), no major differences have been found (Jokela et al., 2000). Hence, the irradiance scale of these new SL501A radiometers is comparable to that of the NILU-UV measurements within 2 %.
As part of the scientific cooperation between SMN and FMI, a new GUV-2511 multi-filter radiometer, manufactured by Biospherical Instruments Inc., was installed at Marambio in 2017. It features five channels at UV wavelengths and two channels at visible radiation wavelengths (Bernhard et al., 2005). Two GUV radiometers were bought by FMI to ensure continuous measurements at Marambio: while one of them is installed at the site, the other one is calibrated and also available for comparison campaigns. These measurements continue the NILU-UV time series, as the central wavelengths of the channels are nearly identical to those of the NILU-UV channels and the bandwidths are similar. The first calibration of the GUVs were performed by Biospherical Instruments, Inc. Comparisons with FMI's spectroradiometers showed that the measurements were within 5 % from each other. These results are promising for the future of the UV time series at Marambio, and for monitoring the impact of the predicted ozone layer recovery on surface UV radiation in the Antarctic. The measurements will also serve as important validation data for satellite measurements, similar to the NILU-UV measurements previously.
In this paper, UV measurements from the Antarctic NILU-UV network at Marambio (64∘ S) and Ushuaia (54∘ S) were quality controlled and analysed. The time series included measurements from 2000 to 2013. The quality assurance procedures included in situ lamp measurements and solar comparisons with the travelling reference of the network.
The results showed that after the year 2010 the filters of the radiometers degraded and their sensitivity to UV radiation was reduced by more than 80 % in some channels. Due to this problem, accurate data were available only until 2010. The irradiances measured by the travelling reference were compared to those of well-maintained spectroradiometers in Finland and Argentina. The results showed that the travelling reference can be used to transfer the calibration to the stations and that the uncertainty of the measurements increased after 2008. Homogenized UV irradiance time series were calculated.
In both Ushuaia's and Marambio's time series, the effect of low total ozone amount during days that the station was inside the polar vortex was clearly seen. At Marambio, daily doses for late October and November could even exceed those measured in the summer. The maximum daily dose was as large as 7 kJ m−2, which was measured in November 2007. The highest daily doses were typically around 6 kJ m−2 at both stations, even if the difference in latitude is 10∘. In the whole measurement period (2000–2010) there were 5 days when “extreme” UV indices and 85 days when “very high” UV indices were measured at Marambio. The highest daily maximum UV index of 12 was measured in November 2007. At Ushuaia, “extreme” UV indices were measured on 35 days. The highest UV index of 13 was measured twice: in November 2003 and 2009. The largest deviations from the daily means exceeded 100 % and occurred in October and November when the stations were inside the polar vortex. At Ushuaia, the largest deviations from the mean occurred during the first years 2000–2003 of the time series.
The data can be downloaded at the FMI Arctic Space Centre open-access database: http://litdb.fmi.fi (Ylitalo, 2018).
KL: primarily responsible for the QA of the UV data, analysed the data and led the manuscript preparation. AR: Principal Investigator on the Antarctic NILU-UV project and contributed to the manuscript. OM: QC of the travelling reference. One of the main authors of the FARPOCC and SAARA research plans of Esko Kyrö. LT: analysed the polar vortex and contributed to the manuscript. BH: QA of the UV data 2007–2013. AFA: QA of the Antarctic NILU-UV network. VC: QA of the Antarctic NILU-UV network. RDG: QA of the Antarctic NILU-UV network. CT: QA of the Antarctic NILU-UV network. GD: daily housekeeping and QC of NILU-UV data at Ushuaia. HO: daily housekeeping and QC of NILU-UV data at Marambio. GB: QA of the SUV spectroradiometer data at Ushuaia. Calibration of FMI's GUV radiometers. Contributed to the writing of the manuscript. RS: QC of the GUV measurements at Marambio. GdL: overseeing the work in the group and contributed to the writing of the manuscript.
The authors declare that they have no conflict of interest.
This article is part of the special issue “Quadrennial Ozone Symposium 2016 – Status and trends of atmospheric ozone (ACP/AMT inter-journal SI)”. It is a result of the Quadrennial Ozone Symposium 2016, Edinburgh, United Kingdom, 4–9 September 2016.
The Academy of Finland supported this work financially
through projects FARPOCC and SAARA. The MAR Project was financed by
the National R+D Plan of the Spanish Ministry of Science and
Technology (National Research Program in the Antarctic) under contract
REN2000-0245-C02-01. The SUV-100 spectroradiometer UV data from
Ushuaia were provided by the NSF UV Monitoring Network, operated by
Biospherical Instruments Inc. and funded by the U.S. National Science
Foundation's Office of Polar Programs. We thank the operators of the
MAR project at Marambio and Ushuaia. Arne Dahlback and Björn Johnsen
are acknowledged for the calibration of the NILU-UVs. We thank the
operators of the FMI Brewers at Sodankylä and Jokioinen. Tapani Koskela is acknowledged for processing the Brewer data of
Jokioinen. The OMI/AURA and TOMS teams are thanked for the satellite
ozone data. We thank Eija Asmi and Edith Rodriguez from FMI for
logistics, and Lasse Ylianttila from the Finnish Radiation and
Nucleation Safety Authority (STUK) for calibration of SL501A
radiometers.
Edited by: Alkiviadis Bais
Reviewed by: two anonymous referees
Andrady, A., Aucamp, P. J., Bais, A. F., Ballaré, C. L., Björn, L. O., Borman, J. F., Calwell, M., Cullen, A. P., Erickson, D. J., De Gruil, F. R., Häder, D.-F., Ilyas, M., Kulandaivelu, G., Kumar, H. D., Longstreth, J., McKenzie, R. L., Norval, M., Paul, N., Redhwi, H. H., Smith, R. C., Salomo, K. R., Sulzberger, B., Takizawa, Y., Tang, X., Teramura, A. H., Torikai, A., Van Der Leun, J. C., Wilson, S. R., Worrest, R. C., and Zepp, R.: United Nations Environment Programme, Environmental Effects Assessment Panel, 2009, Environmental Effects of ozone depletion and its interactions with climate change: progress report, 2008, Photoch. Photobio. Sci., 8, 13–22, https://doi.org/10.1039/b820432m, 2009. a
Bernhard, G., Booth, C. R., and McPeters, R. D.: Calculation of total column ozone from global UV spectra at high latitudes, J. Geophys. Res., 108, 4532, https://doi.org/10.1029/2003JD003450, 2003. a
Bernhard, G., Booths, C. R., and Ehramjian, J. C.: Real-time ultraviolet and column ozone from multichannel ultraviolet radiometers deployed in the National Science Foundation's ultraviolet monitoring network, Opt. Eng., 44, 041011, https://doi.org/10.1117/1.1887195, 2005. a
Bernhard, G., Booth, C. R., and Ehramjian, J. C.: Comparison of UV irradiance measurements at Summit, Greenland; Barrow, Alaska; and South Pole, Antarctica, Atmos. Chem. Phys., 8, 4799–4810, https://doi.org/10.5194/acp-8-4799-2008, 2008. a
Bernhard, G., Booth, C. R., and Ehramjian, J. C.: Climatology of Ultraviolet Radiation at High Latitudes Derived from Measurements of the National Science Foundation's Ultraviolet Spectral Irradiance Monitoring Network, in: UV Radiation in Global Climate Change: Measurements, Modeling and Effects on Ecosystems, edited by: Gao, W., Schmoldt, D. L., and Slusser, J. R., Tsinghua University Press, Beijing, China and Springer, New York, USA, 2010. a, b, c
Booth, C., Lucas, T., Morrow, J., Weiler, C., and Penhale, P.: The United States National Science Foundation's Polar Network for Monitoring Ultraviolet Radiation, in: Antarctic Research Series, edited by: Weiler, C. and Penhale, P., vol. 62, 17–37, American Geophysical Union, Washington, D.C., USA, 1994. a, b
Booth, C. R. and Madronich, S.: Radiation amplification factors: improved formulation accounts for large increases in ultraviolet radiation associated with Antarctic ozone depletion, in: Ultraviolet Radiation in Antarctica: Measurement and Biological Effects, edited by: Weiler, C. S. and Penhale, P. S., Antarct. Res. Ser., 62, 39–52, AGU, Washington, D.C., USA, 1994. a
Dahlback, A.: Measurements of biologically effective UV doses, total ozone abundances, and cloud effects with multichannel, moderate bandwidth filter instruments, Appl. Optics, 35, 6514–6521, 1996. a, b, c, d, e
Eleftheratos, K., Kazadzis, S., Zerefos, C. S., Tourpali, K., Meleti, C., Balis, D., Zyrichidou, I., Lakkala, K., Feister, U., Koskela, T., Heikkilä, A., and Karhu, J. M.: Ozone and Spectroradiometric UV Changes in the Past 20 Years over High Latitudes, Atmos. Ocean, 53, 117–125, https://doi.org/10.1080/07055900.2014.919897, 2015. a
Farman, J., Gardiner, B., and Shanklin, J.: Large losses of total ozone in Antarctica reveal seasonal CLOx∕NOx interaction, Nature, 315, 207–210, 1985. a
Heikkilä, A., Sakari Mäkelä, J., Lakkala, K., Meinander, O., Kaurola, J., Koskela, T., Karhu, J. M., Karppinen, T., Kyrö, E., and de Leeuw, G.: In search of traceability: two decades of calibrated Brewer UV measurements in Sodankylä and Jokioinen, Geosci. Instrum. Method. Data Syst., 5, 531–540, https://doi.org/10.5194/gi-5-531-2016, 2016. a
Høiskar, B., Haugen, R., Danielsen, T., Kylling, A., Edvardsen, K., Dahlback, A., Johnsen, B., Blumthaler, M., and Schreder, J.: Multichannel moderate-bandwidth filter instrument for measurement of the ozone-column anount, cloud transmittance, and ultraviolet dose rates, Appl. Optics, 42, 3472–3479, 2003. a, b, c
Johnsen, B., Mikkelborg, O., Hannevik, M., Nilsen, L., Saxebøl, G., and Blaasaas, K.: The Norwegian UV-monitoring program Period 1995/96 to 2001, Strålevern Rapport 2002:4, Norwegian Radiation Protection Authority, Østerås, Norway, 2002. a, b
Jokela, K., Ylianttila, L., Visuri, R., Leszczynski, K., Kärhä, P., and Ikonen, E.: Intercomparison of lamp and detector-based UV-irradiance scales for solar UV radiometry, J. Geophys. Res.-Atmos., 105, 4821–4827, https://doi.org/10.1029/1999JD900398, 2000. a
Karhu, J. A., Taalas, P., Damski, J., Kaurola, J., Ginzburg, M., Villanueva, C. A., Piacentini, E., and Garcia, M.: Vertical distribution of ozone at Marambio, Antarctic Peninsula, during 1987–1999, J. Geophys. Res.-Atmos., 108, 4545, https://doi.org/10.1029/2003JD001435, 2003. a
Lait, L. R.: An Alternative Form for Potential Vorticity, J. Atmos. Sci., 51, 1754–1759, https://doi.org/10.1175/1520-0469(1994)051<1754:AAFFPV>2.0.CO;2, 1994. a
Lakkala, K., Redondas, A., Meinander, O., Torres, C., Koskela, T., Cuevas, E., Taalas, P., Dahlback, A., Deferrari, G., Edvardsen, K., and Ochoa, H.: Quality assurance of the solar UV network in the Antarctic, J. Geophys. Res., 110, D15101, https://doi.org/10.1029/2004JD005584, 2005. a, b, c, d, e, f, g, h, i, j, k
Lakkala, K., Arola, A., Heikkilä, A., Kaurola, J., Koskela, T., Kyrö, E., Lindfors, A., Meinander, O., Tanskanen, A., Gröbner, J., and Hülsen, G.: Quality assurance of the Brewer spectral UV measurements in Finland, Atmos. Chem. Phys., 8, 3369–3383, https://doi.org/10.5194/acp-8-3369-2008, 2008. a
McKinlay, A. F. and Diffey, B. L.: A reference action spectrum for ultraviolet induced erythema in human skin, CIE J., 6, 17–22, 1987. a
Meinander, O., Asmi, E., Neitola, K., Laurila, T., Lihavainen, H., Aaltonen, V., Poikonen, A., Aarva, A., Rodriguez, E., Kyrö, E., de Leeuw, G., Sanchez, R., and Mei, M.: Finnish-Argentinian Measurements on Snow UV Albedo in Marambio, in: FINNARP, Science and Support in Antarctica, Finnish Antarctic Research Program (FINNARP), Nykypaino Oy, Vantaa, Finland, 37 pp., 2014. a, b
Pazmiño, A., Godin-Beekmann, S., Ginzburg, M., Bekki, S., Hauchecorne, A., Piacentini, R., and Quel, E.: Impact of Antarctic polar vortex occurences on total ozone and UVB radiation at southern Argentinean and Antarctic stations during 1997–2003 period, J. Geophys. Res., 110, D03103, https://doi.org/10.1029/2004JD005304, 2005. a
Solomon, S., Ivy, D. J., Kinnison, D., Mills, M. J., Neely, R. R., and Schmidt, A.: Emergence of healing in the Antarctic ozone layer, Science, 353, 269–274, https://doi.org/10.1126/science.aae0061, 2016. a
WMO: Scientific Assessment of Stratospheric ozone: 1989, World Meteorological Organization (WMO), Global Ozone Research and Monitoring Project-Report No. 20, Geneva, Switzerland, 1990. a
WMO: Report of the WMO-WHO Meeting of Experts on Standardization of UV Indices and their Dissemination to the Public, World Meteorological Organization (WMO), Global Atmosphere Watch Report No. 127, Geneva, Switzerland, 1997. a, b
WMO: Scientific Assessment of Ozone Depletion:1998, World Meteorological Organization (WMO), Global Ozone Research and Monitoring Project-Report No. 44, Geneva, Switzerland, 1999. a
WMO: Scientific Assessment of Ozone Depletion:2002, World Meteorological Organization (WMO), Global Ozone Research and Monitoring Project-Report No. 47, Geneva, Switzerland, 2003. a, b, c
WMO: Scientific Assessment of Ozone Depletion: 2006, World Meteorological Organization (WMO), Global Ozone Research and Monitoring Project-Report No. 50, Geneva, Switzerland, 2007. a
Ylitalo, R.: Antarctic UV, in: Observations at the Arctic Space Centre, available at: http://litdb.fmi.fi, last access: 29 October 2018. a