the Creative Commons Attribution 4.0 License.
the Creative Commons Attribution 4.0 License.
 | 30 Oct 2018
Long-range transport impacts on surface aerosol concentrations and the contributions to haze events in China: an HTAP2 multi-model study
Xinyi Dong
Qingzhao Zhu
Jian Sun
Jiani Tan
Terry Keating
Takashi Sekiya
Kengo Sudo
Louisa Emmons
Simone Tilmes
Jan Eiof Jonson
Michael Schulz
Huisheng Bian
Mian Chin
Yanko Davila
Daven Henze
Toshihiko Takemura
Anna Maria Katarina Benedictow
Kan Huang
Haze has been severely affecting the densely populated areas in China recently. While many of the efforts have been devoted to investigating the impact of local anthropogenic emission, limited attention has been paid to the contribution from long-range transport. In this study, we apply simulations from six participating models supplied through the Task Force on Hemispheric Transport of Air Pollution phase 2 (HTAP2) exercise to investigate the long-range transport impact of Europe (EUR) and Russia–Belarus–Ukraine (RBU) on the surface air quality in eastern Asia (EAS), with special focus on their contributions during the haze episodes in China. The impact of 20 % anthropogenic emission perturbation from the source region is extrapolated by a factor of 5 to estimate the full impact. We find that the full impacts from EUR and RBU are 0.99 µg m−3 (3.1 %) and 1.32 µg m−3 (4.1 %) during haze episodes, while the annual averaged full impacts are only 0.35 µg m−3 (1.7 %) and 0.53 µg m−3 (2.6 %). By estimating the aerosol response within and above the planetary boundary layer (PBL), we find that long-range transport from EUR within the PBL contributes to 22–38 % of the total column density of aerosol response in EAS. Comparison with the HTAP phase 1 (HTAP1) assessment reveals that from 2000 to 2010, the long-range transport from Europe to eastern Asia has decreased significantly by a factor of 2–10 for surface aerosol mass concentration due to the simultaneous emission reduction in source regions and emission increase in the receptor region. We also find the long-range transport from the Europe and RBU regions increases the number of haze events in China by 0.15 % and 0.11 %, and the North China Plain and southeastern China has 1–3 extra haze days (<3 %). This study is the first investigation into the contribution of long-range transport to haze in China with multi-model experiments.
- Article
(14593 KB) -
Supplement
(323 KB) - BibTeX
- EndNote


Frequent low visibility due to heavy haze has been one of the most important environmental concerns in China recently. Long-term monitoring data suggest that visibility degradation has been identified during the past 30 years over the North China Plain, Pearl River Delta, and Yangtze River Delta (Fu et al., 2014; J. D. Wang et al., 2014), where more than 40 % of the national population is hosted. As the most apparent symptom of air pollution, visibility degradations induced by haze not only interrupt highway and airline operations, but also indicate critical deterioration of public health. The China Ministry of Environmental Protection (MEP) reported that air quality in 265 of the 338 major cities failed to attain the national air quality standard in 2015 (Jia and Wang, 2017), and studies also suggest that 350 000–400 000 of annual premature deaths are attributable to air pollution exposure (WorldBank, 2007; Cao et al., 2017; Li et al., 2018) in China during the past decade.
China haze is usually associated with high concentrations and rapid hygroscopic growth of fine-particulate matter (Im et al., 2018). Some pilot studies have focused on the research topics including ambient air quality conditions under haze (Huang et al., 2012; Wang et al., 2015), spatial distribution and long-term trends of haze in China (Fu et al., 2014), meteorology conditions that favor the formation of haze (J. D. Wang et al., 2014), chemical components and size distributions of aerosols (Guo et al., 2014; Ho et al., 2016; Shen et al., 2017; Yin et al., 2012; Zhang et al., 2012), source apportionment of fine particles during haze episodes (Hua et al., 2015; L. T. Wang et al., 2014; Y. J. Wang et al., 2014), and also the public health impact of haze (Gao et al., 2017; Tie et al., 2009; Xu et al., 2013).
Although these studies helped to improve the fundamental understanding of haze in China, very limited attention has been paid to reveal the role of long-range transport. The research community has realized the hemispheric transport could also exacerbate local air quality problems since the early 20th century (Akimoto, 2003), and several international collaborated programs have been initiated to investigate the long-range transport of air pollutants since then (Carmichael et al., 2008; Rao et al., 2011). One of these is the Task Force on Hemispheric Transport of Air Pollution (TF HTAP), designated to advance the understanding of intercontinental transport of air pollutants in the Northern Hemisphere (Streets et al., 2010).
The abovementioned prior efforts, however, have a limited assessment of the long-range transport impact on haze. In order to achieve a better air quality condition and reduce the frequency of haze events, China is investing billions to reduce the local anthropogenic emissions (Li and Zhu, 2014; Liu et al., 2015). However, the background concentrations of PM and the contributions from long-range transport are poorly documented. A few studies have demonstrated the existence of long-range transport into China with campaign measurements (Kong et al., 2010) and attempted to quantify the O3 response in eastern Asia due to intercontinental transport (Fu et al., 2012), but the contribution of external emissions to China's PM2.5 pollution remains unknown. Understanding of the long-range transport impact is essential for estimating the background concentrations of air pollutants and estimating the efficiency and effectiveness of local emission control. It is also an important scientific support for policy makers that allows them to better organize the international collaborations.
In this study, we evaluate the long-range transport impact on haze in China by estimating the PM concentration response and visibility change based on multi-model data provided through the second phase of HTAP (HTAP2). We focused on transport from two source regions designed by the HTAP2 framework: Europe (EUR) and Russia–Belarus–Ukraine (RBU), since they are the most important upwind areas with respect to eastern Asia (EAS) as the receptor region. The modeling framework and baseline evaluation are described in Sect. 2. Results and discussions are summarized in Sect. 3, including the demonstration of long-range transport seasonality, comparison of PM transport above and within the planetary boundary layer (PBL), the assessment of the full impact and relative importance of long-range transport, and also the contributions during haze episodes in China. Conclusions are summarized in Sect. 4.
2.1 Configuration of models, emissions, and simulations
The HTAP2 participating models all utilize the same anthropogenic emission inventories for SO2, NOx, CO, nonmethane VOC (NMVOC), NH3, PM10, PM2.5, black carbon (BC) and organic carbon (OC). The emissions are compiled from several regional inventories for the year 2010 with monthly temporal resolution and grid resolution, with more details reported in Janssens-Maenhout et al. (2015). Emissions of year 2008 and 2009 are also prepared in the same format as that of 2010 through the HTAP2 effort, yet model simulations for these 2 years are of lower priority. So in this study we mainly focus on the 2010 model experiments and briefly probe the interannual variability by utilizing the 2008 and 2009 data. Emissions from biomass burning and natural sources are not prescribed by the HTAP2 framework, but most of the participating models used the recommended Global Fire Emissions Database version 3 (GFED3) and Model of Emissions of Gases and Aerosols from Nature (MEGAN) for biomass burning and biogenic emissions, respectively. Emission perturbation is conducted with all anthropogenic emissions cut off by 20 % over the source region. To examine the relative importance of long-range transport compared to local emission change, emission perturbation is also performed for the receptor region only. This study utilizes the simulations from four scenarios: (1) BASE scenario with all baseline emissions; (2) EURALL scenario with all anthropogenic emissions from EUR reduced by 20 %, (3) RBUALL scenario with all anthropogenic emissions from RBU reduced by 20 %, and (4) EASALL scenario with all anthropogenic emissions from EAS reduced by 20 %. Domain configurations of these regions are shown in Fig. 1. Note that all model experiments are conducted at global scale but the analysis of this study will focus on EUR, RBU, and EAS only.
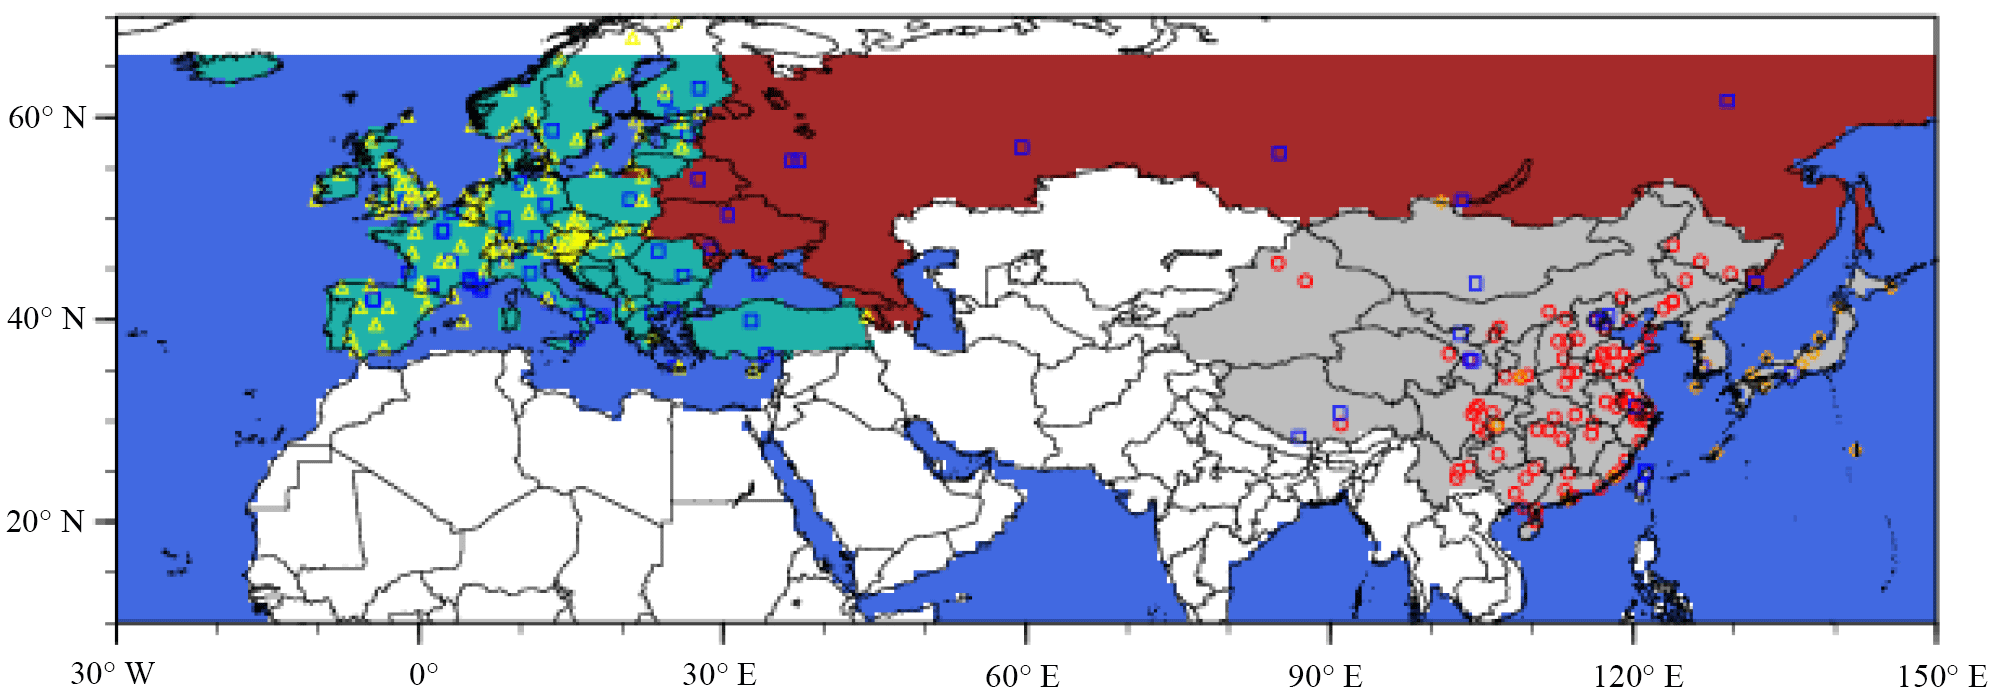
Figure 1The HTAP2 source and receptor regions for EUR (green), RBU (red), and EAS (grey). Sites marked with the same symbols are from the same observation network: red circles represent API, blue squares represent AERONET, orange diamonds represent EANET, and yellow triangles represent EBAS.
This study takes input from six global models with their grid resolution, meteorology, and references listed in Table 1. These models are selected because of the model-level PM mass concentration data availability. Long-range transport of air pollutants may occur near the PBL or occur in the upper free troposphere and then descend into the PBL (Eckhardt et al., 2003; Stohl et al., 2002). Since near-surface aerosol plays a more important role in haze event than that in the upper air, it is necessary to understand the contributions from within and above the PBL.
2.2 Model evaluation
Before analyzing the source–receptor (S–R) relationship, we applied measurements from multiple observation networks to evaluate the models performances at the EUR, RBU, and EAS regions. Surface observations are collected from four programs: EBAS from the Norwegian Institute for Air Research (http://ebas.nilu.no, last access: 10 October 2017), Air Pollution Index (API) from the China Ministry of Environmental Protection (http://datacenter.mep.gov.cn/, last access: 19 September 2017), Acid Deposition Monitoring Network in eastern Asia (EANET, 2007), and the AERONET (http://aeronet.gsfc.nasa.gov, last access: 18 October 2017) from NASA. EBAS (Tørseth et al., 2012) sites are all located in Europe so the data are used for model evaluation in EUR. API includes PM10 concentrations from 86 cities over China (Dong et al., 2016), and EANET has observations of PM2.5, PM10, O3, CO, SO2, NH3, NO2, , , and at more than 30 sites over eastern Asia countries (Dong and Fu, 2015a, b), so these two data sets are used for model evaluation in EAS. AERONET (level 2.0, version 2) has AOD (aerosol optical depth) measurements at more than 1400 sites with global coverage (Dubovik et al., 2000). As some of the sites may not have valid measurements during the simulation period, only those with valid data are used and their locations are shown in Fig. 1. Satellite-retrieved AOD is collected from the daily MODIS product (MOD08, MYD08, https://modis.gsfc.nasa.gov/, last access: 19 October 2017) with a grid resolution to investigate the spatial distributions and column densities of aerosol simulated by the participating models.

Figure 2Monthly mean surface concentrations of O3 (a, d), PM2.5 (b, c), and PM10 (c, f) for the year 2010 in the EUR (a, b, c) and EAS (d, e, f) regions from observations and model simulations. Observations (bold black lines with vertical error bars) represent the averages of all sites falling within the same ensemble grid (bold red lines), and the vertical error bars depict the standard deviation across the sites in the same ensemble grid. Models are sampled at the nearest grid to each station; multiple stations within the same model grid are averaged to represent the paring observation.
Monthly mean surface concentrations from participating models are sampled at their own model grid cells containing the observational sites, and the corresponding measurements are also averaged on monthly scale to facilitate the evaluation. No valid data are found for surface measurements of air pollutants in the RBU region. The monthly variations of surface O3, PM2.5, and PM10 are shown only for EUR and EAS in Fig. 2. Evaluation statistics including mean bias (MB) and coefficient of determination (R2) are indicated in Fig. 2 for the model ensemble mean, calculated as the average of all participating models at grid resolution. Measurements of aerosol subspecies including sulfate (), nitrate (), ammonium (), organic aerosols (OA), and gas-phase species such as CO, NH3, NO2, and SO2 are also available at some of the EBAS and EANET stations. However, the data coverage is very sparse in terms of both number of sites and sampling periods, so the evaluations of these species are not discussed here but presented in the Supplement (Table S1). In general, all participating models successfully reproduce the seasonal cycle of O3 in EUR and EAS. The model ensemble mean shows an MB of only 4.4 µg m−3 compared to the EBAS observation in EUR. Relatively large biases (8–15 µg m−3) are indicated in warmer months (June–September). However, meanwhile the standard deviation of measurement (indicated by vertical error bars in Fig. 2) is even larger (10–15 µg m−3), indicating that the measured O3 concentrations vary significantly among the EBAS sites in the same model ensemble grid. Seasonal variation of O3 is also simulated well in EAS with moderate overestimation throughout the year.
Simulations of surface PM2.5 concentrations are consistent among the participating models, except that GEOSCHEMADJOINT suggests larger seasonal variation than the other models. In EUR, the model ensemble mean shows the MB as −4.6 µg m−3 against EBAS measurements and generally captures the monthly changes with R2 of 0.7. Underestimation of surface PM2.5 concentration in EUR might be due to the fact that some of the measurements are affected by the local environment. PM2.5 are available from five EBAS stations, and one of the stations is close to a highway (49.90∘ N, 4.63∘ E). These local impacts can hardly be captured by global models due to their coarse-grid resolutions. In the EAS region, the model ensemble mean shows an MB as small as −1.6 µg m−3 but poor correlation with the measurement R2 is 0.2. The monthly dynamics of PM2.5 is more prominent in EAS than in EUR and the models tend to miss the high peaks in spring (April–May). As the anthropogenic emission in Asia is developed with top-down method, the predefined seasonal profile has been demonstrated to affect the model's capability of reproducing the seasonal changes in PM2.5 (Dong and Fu, 2015a). The simulation of PM10 concentration shows good agreement between the model ensemble mean and the measurements in EUR, with an MB of −0.7 µg m−3. The models systematically underestimate surface PM10 by −30.7 µg m−3 in EAS but successfully reproduce the seasonal cycle. This is likely due to the fact that the majority of the API and EANET stations are located in the urban area and are thus frequently affected by the local sources. Previous studies (Dong and Fu, 2015a) also suggested that the anthropogenic emission of primary PM10 might be underestimated in China and subsequently lead to negative MB.
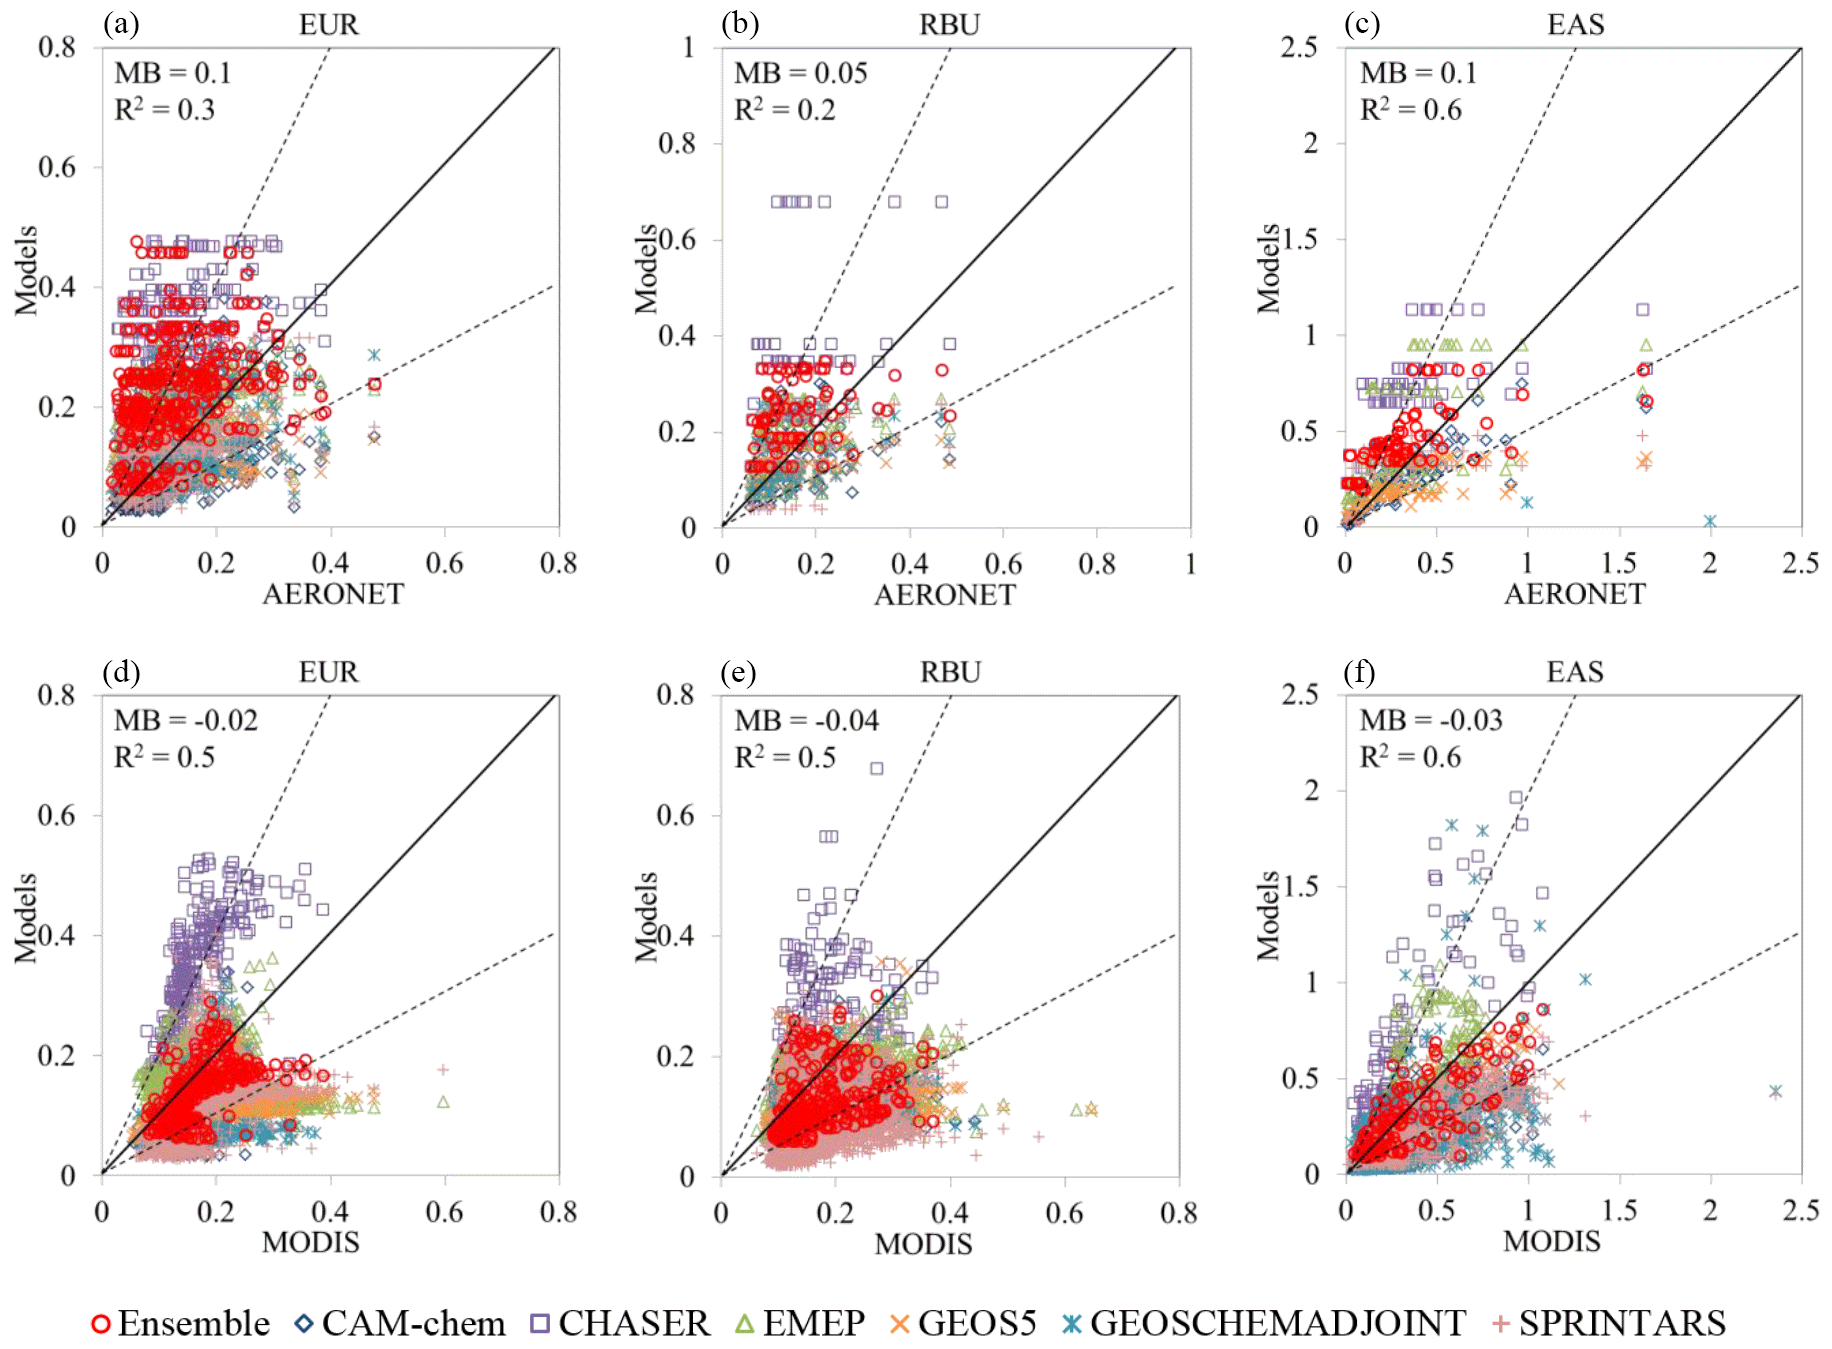
Figure 3Monthly average AOD comparison between the models and AERONET (a, b, c) and between the models and the MODIS (d, e, f) in EUR (a, d), RBU (b, e), and EAS (c, f). Models are represented by markers with different colors and styles. Evaluation statistics (MB and R2) are indicated for the model ensemble mean in the upper-left corner of the scatter plot. The solid black line is the 1:1 line, whereas the black dashed contours represent the 1:2 and 2:1 lines.
As no surface measurement of air pollutants is available the RBU region, we evaluate the model-simulated AOD against the AERONET measurement and MODIS satellite product on a monthly scale in all three regions as shown in Fig. 3. Most of the models fall into the 2-fold range at both AERONET stations and MODIS grid cells. Models tend to overestimate AOD in the EUR region compared to the AERONET observation with 0.1 MB and 0.3 R2 for the model ensemble mean. In the RBU region, the model ensemble mean shows an MB of only 0.05, yet the R2 is only 0.2, indicating that there is a large discrepancy between model simulation and AERONET in terms of the seasonal changes in AOD. The model ensemble mean has best performance in EAS among all the three regions with an MB of 0.1 and R2 of 0.6, suggesting that models have good agreement with the AERONET observation for both the level and the seasonal cycles of AOD. The simulated AODs are generally consistent between models, except that CHASER is always 1–2 times higher than the others. The validations against the MODIS product suggest a slightly better model performance, as the model ensemble mean shows R2 values as 0.5, 0.4, and 0.6 in EUR, RBU, and EAS. In contrast to the overall overestimation indicated by AERONET, MODIS suggests models tend to slightly underestimate the AODs in all three regions with MBs of −0.02, −0.04, and −0.03 in the EUR, RBU, and EAS regions. This shall be due to the fact that AERONET has limited number of stations – there are 73, 11, and 15 stations in the EUR, RBU, and EAS regions that have valid observations covering the simulation period – while MODIS has more comparable grid cells over the study domain.
The discrepancy between AERONET observations and MODIS product indicates that limited number of surface observations may not be sufficient to judge the overall performance of model since there is a high chance that the observation may be affected by the local sources, subsequently biasing the assessment. Spatial distributions of the simulated AOD from all participating models and the MODIS product are compared as shown in Fig. 4. The Aerosol Comparisons between Observations and Models (AEROCOM) project has conducted a thorough evaluation of 14 global models and suggested the simulated AOD is in a 2-fold range of the observations with mean normalized bias (MNB) varied between −44 % and 27 % (Huneeus et al., 2011). As presented in Fig. 4, the model ensemble mean in this study shows good agreement with the MODIS production in terms of spatial distribution, and the MNB values are 9.3 %, 18.1 %, and 44.9 % in the EUR, RBU, and EAS regions. These evaluation statistics are consistent with AEROCOM. However, we also find some exceptions as CHASER significantly overestimate the AOD in China, especially over the central and eastern coastal areas, indicating that the simulation bias may be generated by the model's treatment of the intensive anthropogenic emission over these areas. SPRINTARS is also found to significantly overestimate AOD over the Taklamakan Desert area, indicating that the bias shall be attributed to the treatment of wind-blown dust.

Figure 4Spatial distributions of AOD from MODIS and model simulations. Evaluation statistics of each model are indicated in the lower-left corners of the plots.
3.1 Seasonality of long-range transport impacts at the surface layer
We start evaluating the long-range transport of PM2.5 from the EUR and RBU source regions to the EAS receptor region by estimating the surface PM2.5 concentration response on domain average scale under the emission perturbation scenarios. PM response (ΔPM) is defined as the concentration difference between the baseline scenario and the perturbation scenarios as follows:
To also understand the responses of aerosol subspecies, simulations of , , , OA, and black carbon (BC) are collected from each of the participating models if it is available. Dust and sea salt are not analyzed in this study because emission perturbations are performed for anthropogenic sectors only. So in this study we assume that ΔPMOA + ΔBC . For those models reporting organic carbon (OC) instead of OA, an OC-to-OA conversion factor such as 1.8 is applied to estimate OA following the method discussed in Stjern et al. (2016). For those models reporting only some of the subspecies and total PM2.5, an extra species, “other”, is defined as subtracting the available subspecies from PM2.5. For example, GEOS5 and SPRINTARS report mass concentrations of , OA, BC, and PM2.5, then for these two models we use other = PM2.5 − (). Note that the CAM-chem model reports subspecies for all scenarios but for BASE scenario only, so no Δother is estimated for this model.

Figure 5Monthly averages of surface aerosol response in the EAS receptor region under the EURALL scenario. Solid bars with different colors represent the responses of different aerosols.
Long-range transport impacts from the EUR region are presented in Fig. 5. Large variations of the simulated PM2.5 responses are found among the models. The largest estimation of ΔPM2.5 is 0.16 µg m−3 estimated by GEOS5 in March, and the smallest ΔPM2.5 is 0.01 µg m−3 estimated by EMEP in July. Regarding the seasonal cycle, the majority of the models suggest that long-range transport has a higher impact in winter and spring and lower impact in summer, consistent with the O3 long-range transport seasonality reported by the HTAP1 assessment (Streets et al., 2010). In contrast to other models that show the most significant responses in winter or spring, CAM-chem suggests higher values of OA +ΔBC + Δ in July. The prominent difference in seasonality may attributed to the model diversity in terms of meteorology, aerosol mechanisms, and convection scheme. CAM-chem-simulated surface air temperature is ∼2 K higher than other models in EUR region. Im et al. (2018) suggested wind speed and PBL height may play a more important role in resulting model diversities of aerosol burden, but unfortunately only one of the participating models (SPRINTARS) provides the PBL data. Stjern et al. (2016) suggested that the differences of aerosol schemes and treatments of OC, OA, and SOA lead to additional intermodel variability. An additional specifically designed model experiment is necessary to explicitly identify the causes of intermodel variability. For most of the participating models, Δ and/or ΔOA make larger contributions to ΔPM2.5 and show more prominent monthly changes than other subspecies. CAM-chem- and GEOSCHEMADJOINT-simulated Δ show monthly variations with a factor of 5, and GEOS5 suggests the monthly dynamics of ΔOA is with a factor of 8. The model ensemble mean suggests that the largest long-range transport impact of ΔPM2.5 is 0.064 µg m−3 in March and the smallest impact is 0.035 µg m−3 in September, and the contributions from ΔBC, Δ, ΔOA, Δ, and Δ are 3 %, 45 %, 19 %, 17 %, and 16 %.
Long-range transport from the RBU to the EAS region is presented in Fig. 6. The highest ΔPM2.5 is estimated by GEOS5 as 0.19 µg m−3 in March, and the lowest ΔPM is indicated by GEOSCHEMADJOINT as 0.018 µg m−3 in July. Similarly to the response under EURALL scenario, long-range transport from the RBU region is also mainly contributed by Δ, but Δ and Δ share more significant portions in ΔPM2.5. Most of the models suggest relatively lower values of ΔOA except for GEOS5, which suggests up to 0.1 µg m−3 ΔOA in March. The model ensemble mean suggests maxima of ΔPM2.5 as 0.101 µg m−3 in March and the minima as 0.065 µg m−3 in August, and the contributions from ΔBC, Δ, ΔOA, Δ, and Δ are 2 %, 43 %, 14 %, 20 %, and 21 %. Percentage contributions are generally less than 3 %, yet the highest contributions could be up to 3–4 % for Δ, Δ, and Δ as suggested by EMEP. The relatively lower contribution of ΔOA and higher contributions of Δ and Δ is probably due to the low temperature in the RBU source region, which may extend the lifetime of gas-phase precursors (SO2, NOx, and NH3) and enhance the export of secondary inorganic aerosols produced during the journey of long-range transport. Low temperature also favors SOA production from VOC due to the partitioning to the condensed phase. CAM-chem suggests the contribution of ΔSOA in ΔOA is 32 % under the RBUALL scenario and 28 % under the EURALL scenario, and the model ensemble mean also shows that more OA is transported from RBU (0.01 µg m−3) than that from EUR (0.008 µg m−3), although the anthropogenic NMVOC and OC emissions from EUR are 10 % and 70 % higher. However, the low temperature seems affect the SO2, NOx, and NH3 more by influencing the chemical kinetics and slowing down the production of PM at the source region, which may allow more uplift motion of the gas-phase precursors and finally result in more Δ, Δ, and Δ produced during the long-range transport pathway. More research effort is necessary to explicitly understand the export of precursors and secondary inorganic aerosols traveling from high-latitude areas.
3.2 Long-range transport above and within the PBL
The HTAP phase 1 (HTAP1) report (Streets et al., 2010) suggests that long-range transport of air pollutants from Europe to Asia are identified at two major different heights: within and above 3 km, and the upper path is believed to be more important due to the existence of the westerlies, especially when the emission source area is close to the jet stream (Eckhardt et al., 2003; Stohl et al., 2002) The Europe to Asia transport pathways are identified based on spatial distributions of simulated CO column density, and the contributions from upper- and lower-level transport remain unknown. The transport pathways above and within 3 km are commonly used by previous studies in order to distinguish the long-range transport above and within the free troposphere, but 3 km was apparently a rough estimation of the PBL height. The intensity of long-range transport exclusively within the PBL is believed to be negligible because it is frequently affected by the land surface, turbulence, and exchange with the free troposphere. The transport from Europe to Asia estimated with model experiment in this study, however, may show some significance within the PBL since the emission perturbation is performed on a continental scale, and there is a large portion of remote areas with flat topography in the central Asia region between Europe and eastern Asia. Annual average PBL height is about 1.5 km (880–850 hPa) above the surface over our study domain on an annual average scale, and instead of assuming a constant PBL height, we use the monthly PBL data from the SPRINTARS model because it is the only one that uploads. To enable the comparison of PM transported within and above the PBL, we use the column density instead of mass concentration, defined below:
where ΔPMabove (ΔPMwithin) is the ΔPM transported above (within) the PBL, ΔPMC is the mass concentration response under the perturbation scenarios at each layer, and HT is the model layer thickness. Figure 7 presents the spatial distributions of model-simulated ΔPMwithin and ΔPMabove under the EURALL scenario, as well as the longitude-pressure cross sections of ΔPMC estimated by the participating models. It is important to note that PM mentioned in this section refers to the lump sum of , OA, and BC (because these are the subspecies available from all participating models) to enable the intermodel comparison.
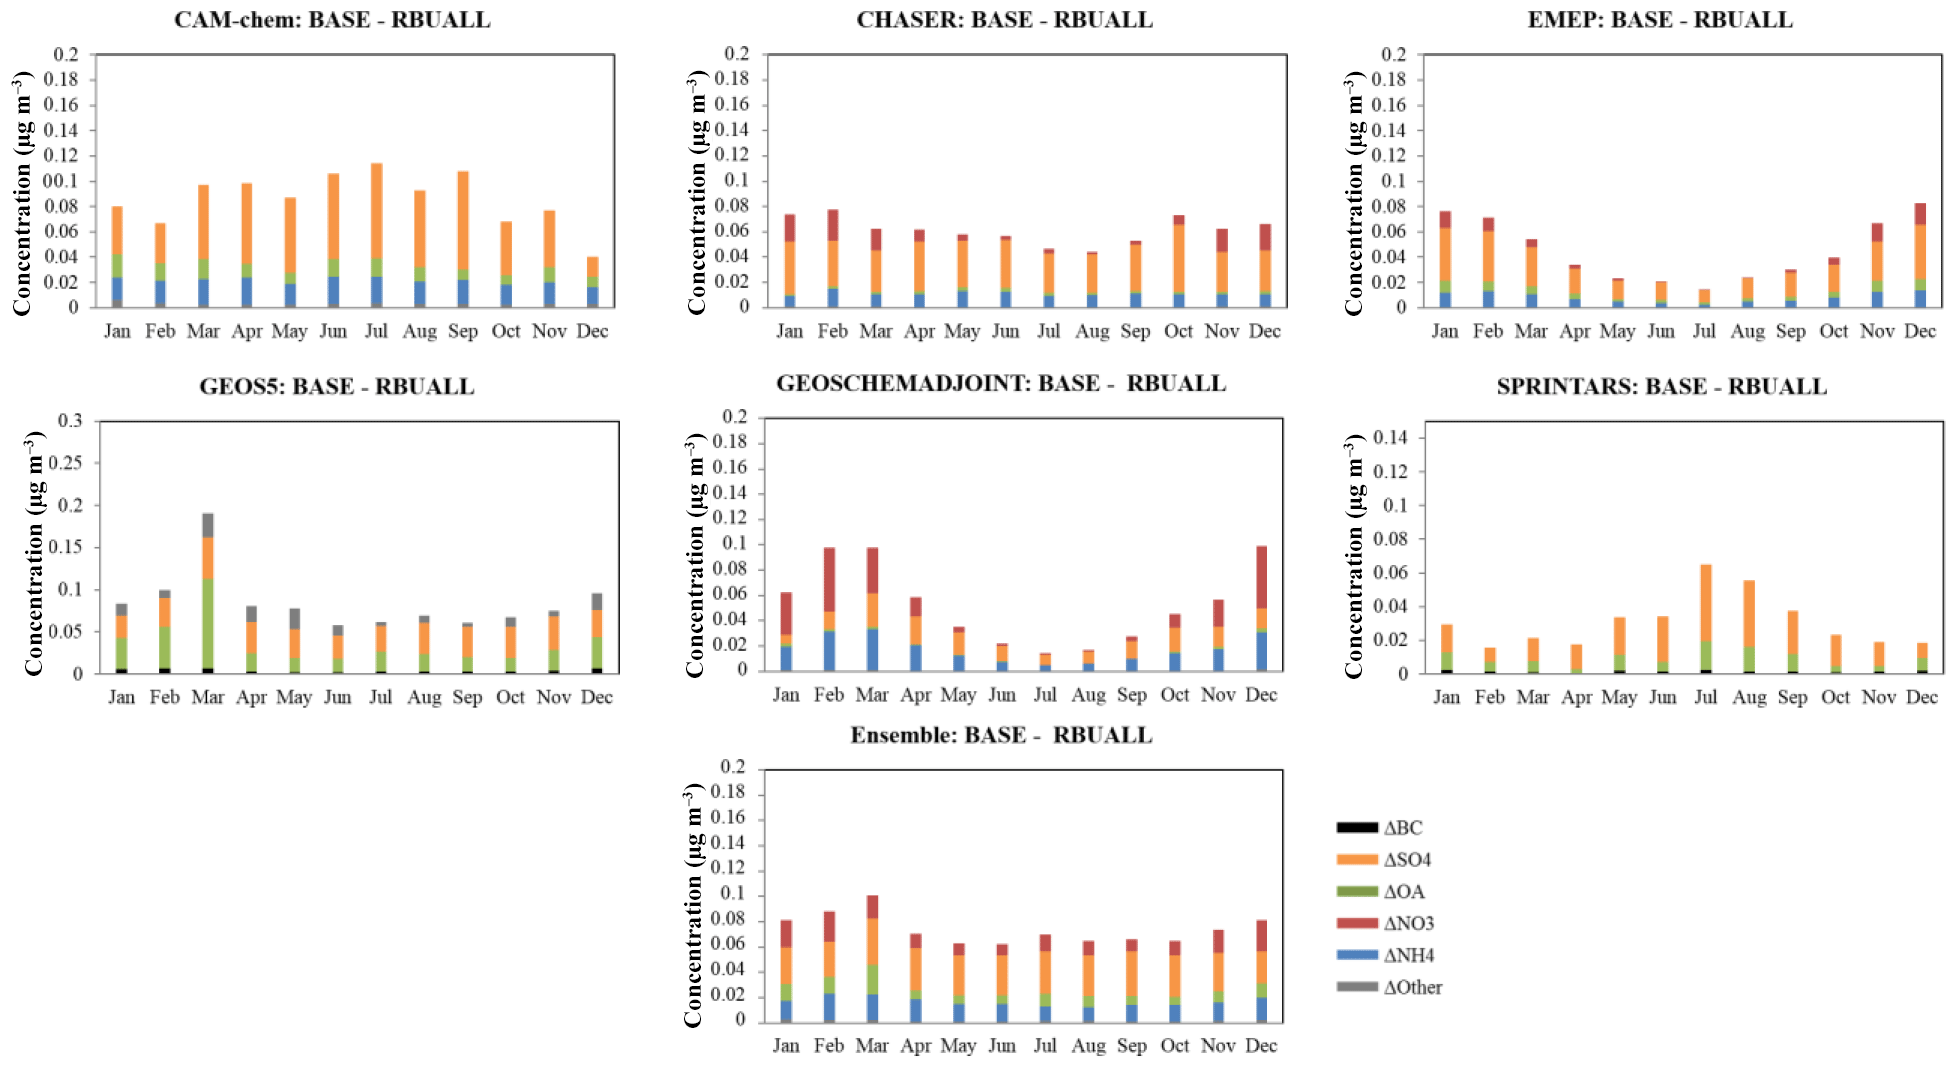
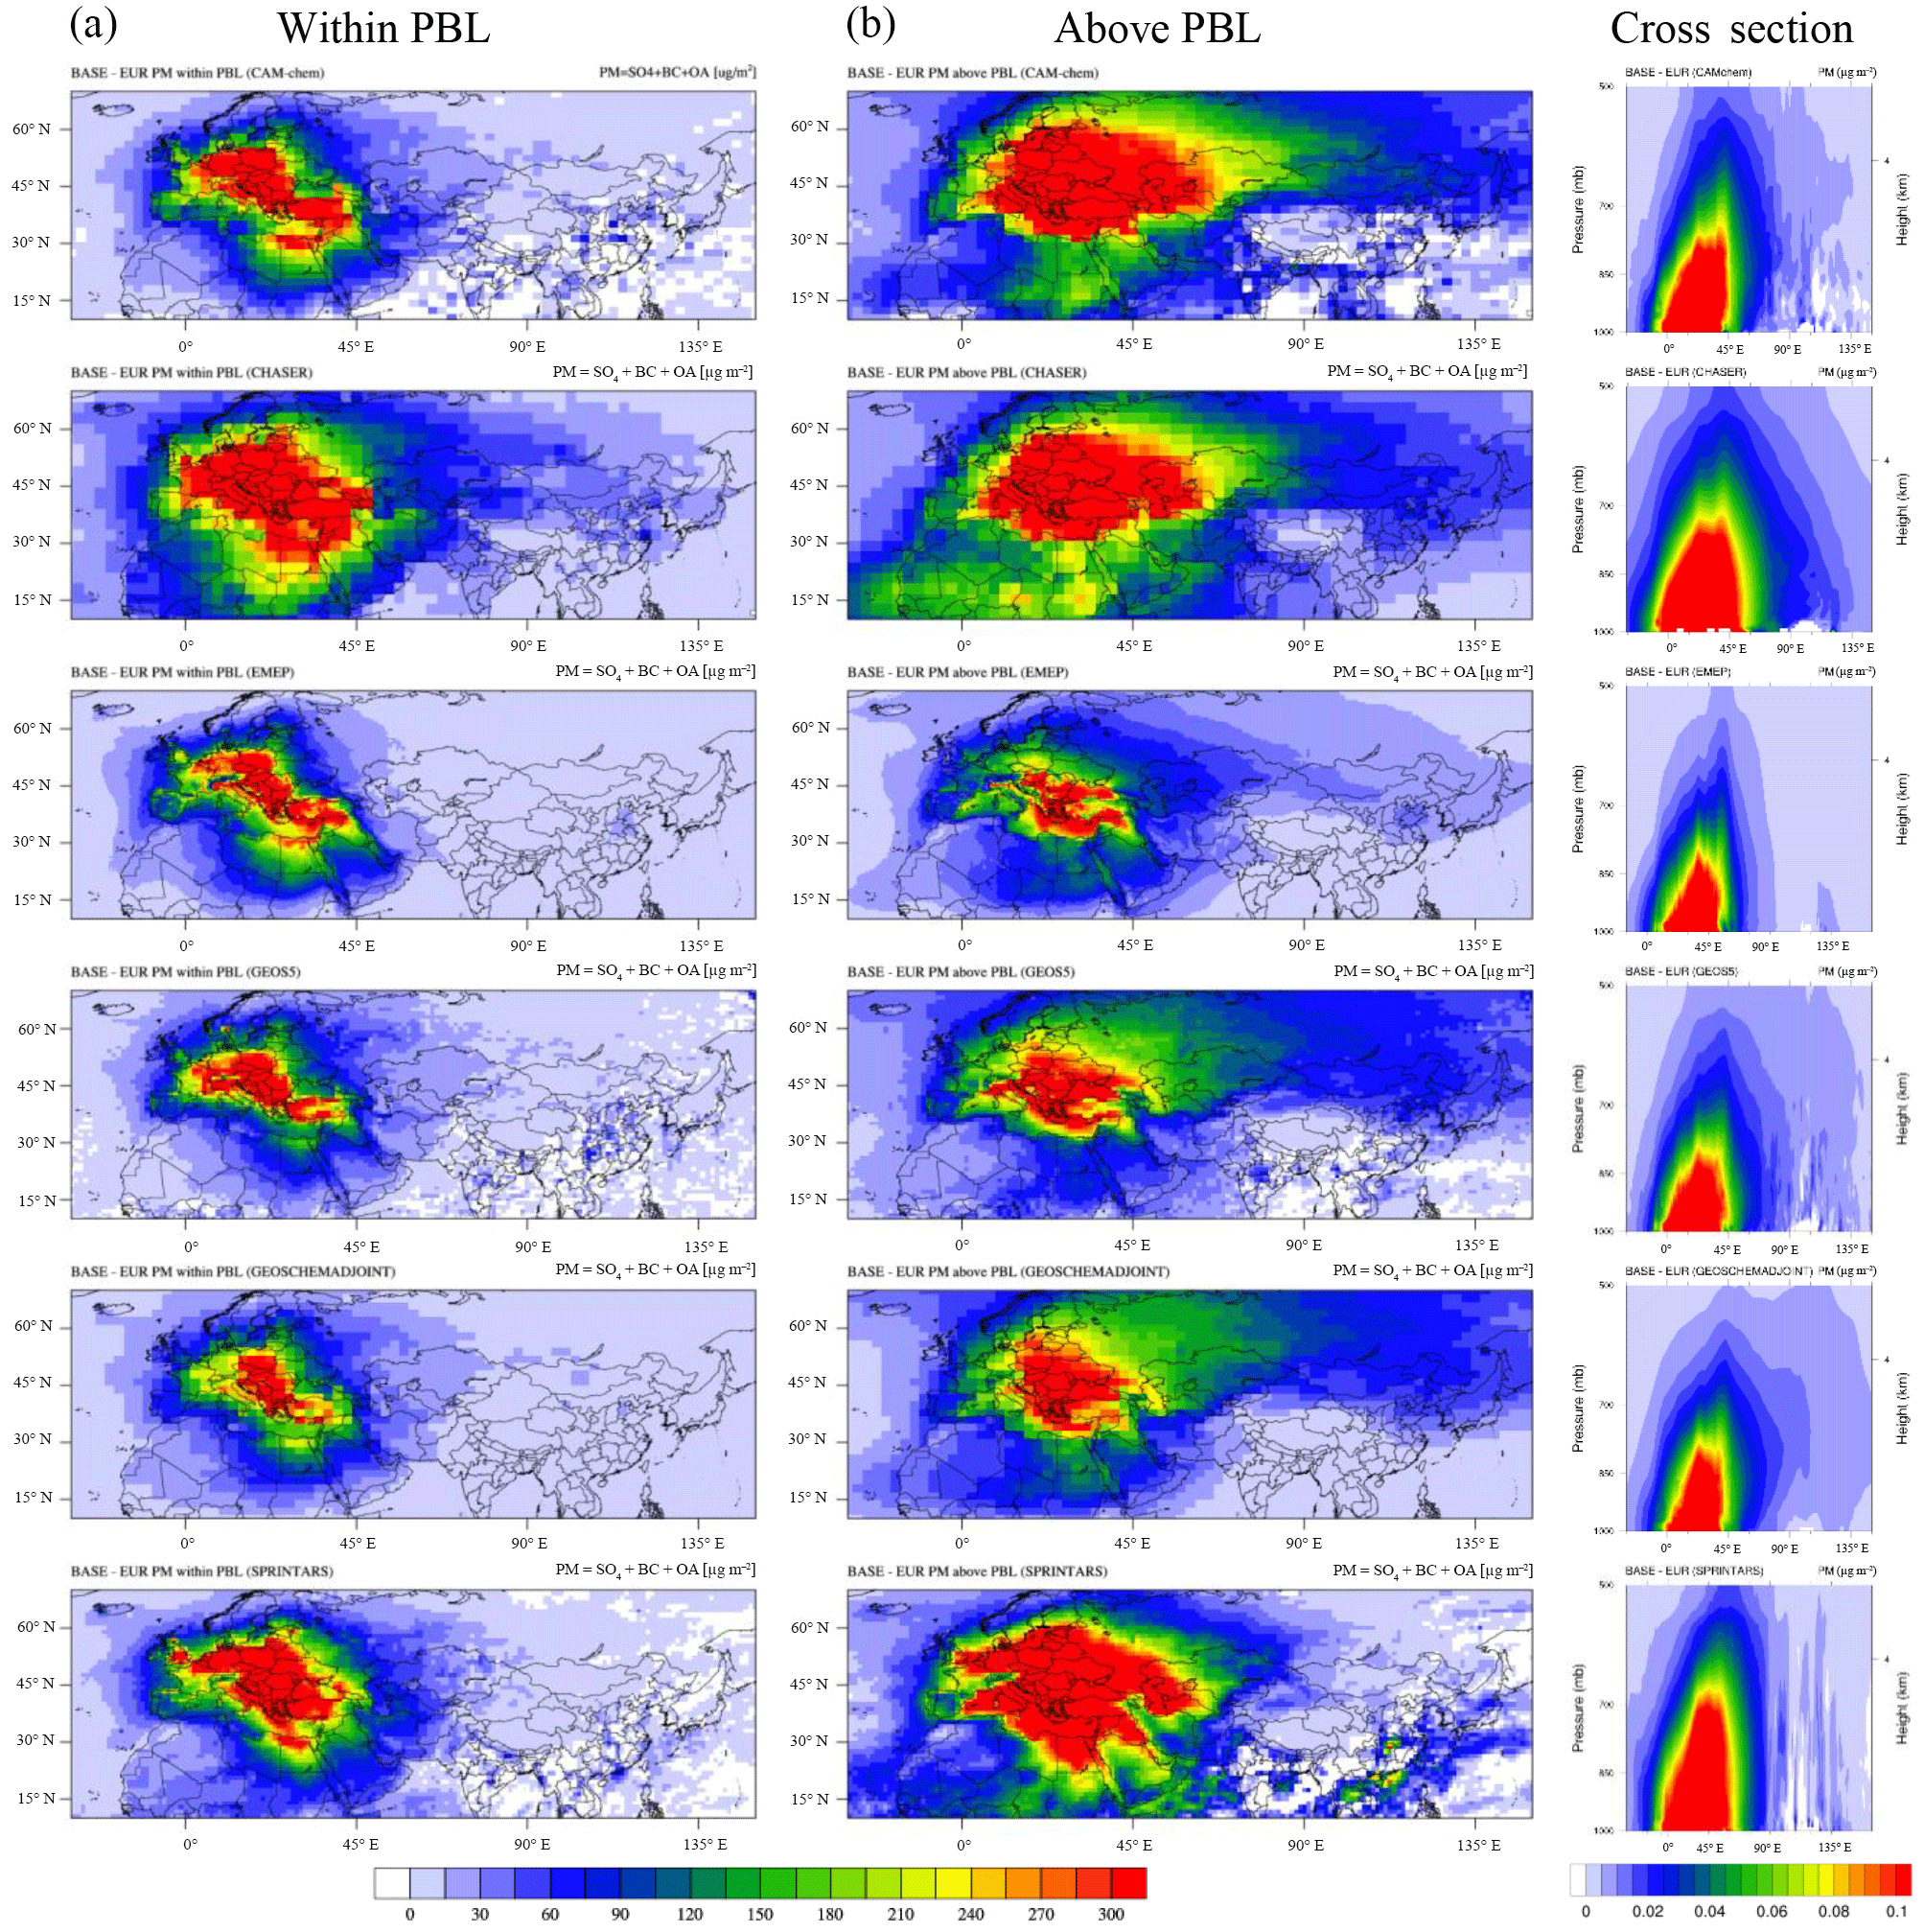
Figure 7Annual averages of PM column density responses (calculated as ΔPM =ΔBC OA) under the EURALL scenario within (a) and above the (b) PBL, and the corresponding longitude-pressure cross sections of PM concentrations (averaged over 10–70∘ N) estimated by participating models.
Transport from the EUR to the EAS region shows generally consistent spatial distributions between participating models. Long-range transport of PM above the PBL is mainly distributed along 40∘ N and higher latitudes, where the impact can reach even further towards the western Pacific. The lower-latitude (30–40∘ N) transport of PM is blocked by the Pamirs, Tianshan, and Altay Mountains due to the elevated topography along the western boundary of China. Long-range transport within PBL is mostly blocked shortly after exported from Europe at the eastern side of the Black Sea along Iran, Georgia, and Armenia, while the rest of it travels along 45∘ N and above latitudes towards eastern Asia. All participating models suggest that PM is firstly carried from EUR in a northeastern direction over Siberia, Mongolia and northeastern part of China, and then down to lower-latitude areas over North China Plain (NCP). This transport pathway is consistent with the HTAP1 assessment (Streets et al., 2010). ΔPMabove is found substantially higher than ΔPMwithin over the EAS receptor region. Large values of ΔPMabove suggest that the long-range transport may also play an important role in affecting the shortwave radiative forcing budget, since the aerosol may be suspended above the cloud. Deposition of PM from upper air down to the surface layer may also subsequently affect the near-surface layer air quality. Most models show gradually decreased ΔPMabove and ΔPMwithin from EUR to EAS, but SPRINTARS shows nonnegligible PM changes along the southeastern coast of China, which could be due to the production of secondary converted from long-range transport SO2, discussed earlier in Sect. 3.1. The largest long-range transport impact is estimated by CHASER and the smallest impact is estimated by EMEP, but no significant model diversities are found. The longitude-pressure cross sections of the PM responses present a clear depiction of the long-range transport from EUR to EAS at different heights. The PM responses at the the longitude can reach up to more than 500 hPa over the EUR region (10–40∘ E), indicating a significant uplift motion of the air pollutants over Europe. Majority of the eastward transport PM is blocked at 45–50∘ E due to the elevated topography. In the upper layer above 800 hPa, however, PM is slightly less affected by the topography and can transport further towards the EAS region, where it subsequently deposits on near-surface layer. Both the spatial distributions of ΔPMwithin and the cross sections of ΔPMC suggested that the intercontinental transport of aerosol does occur within PBL, although the intensity is less significant compared to that above PBL. Under the ERUALL scenario, ΔPMwithin contribution to the total column density of ΔPM is 34 % estimated by the model ensemble mean, with the lowest contribution estimated by EMEP as 22 % and highest contribution estimated by GEOSCHEMADJOINT as 38 %.
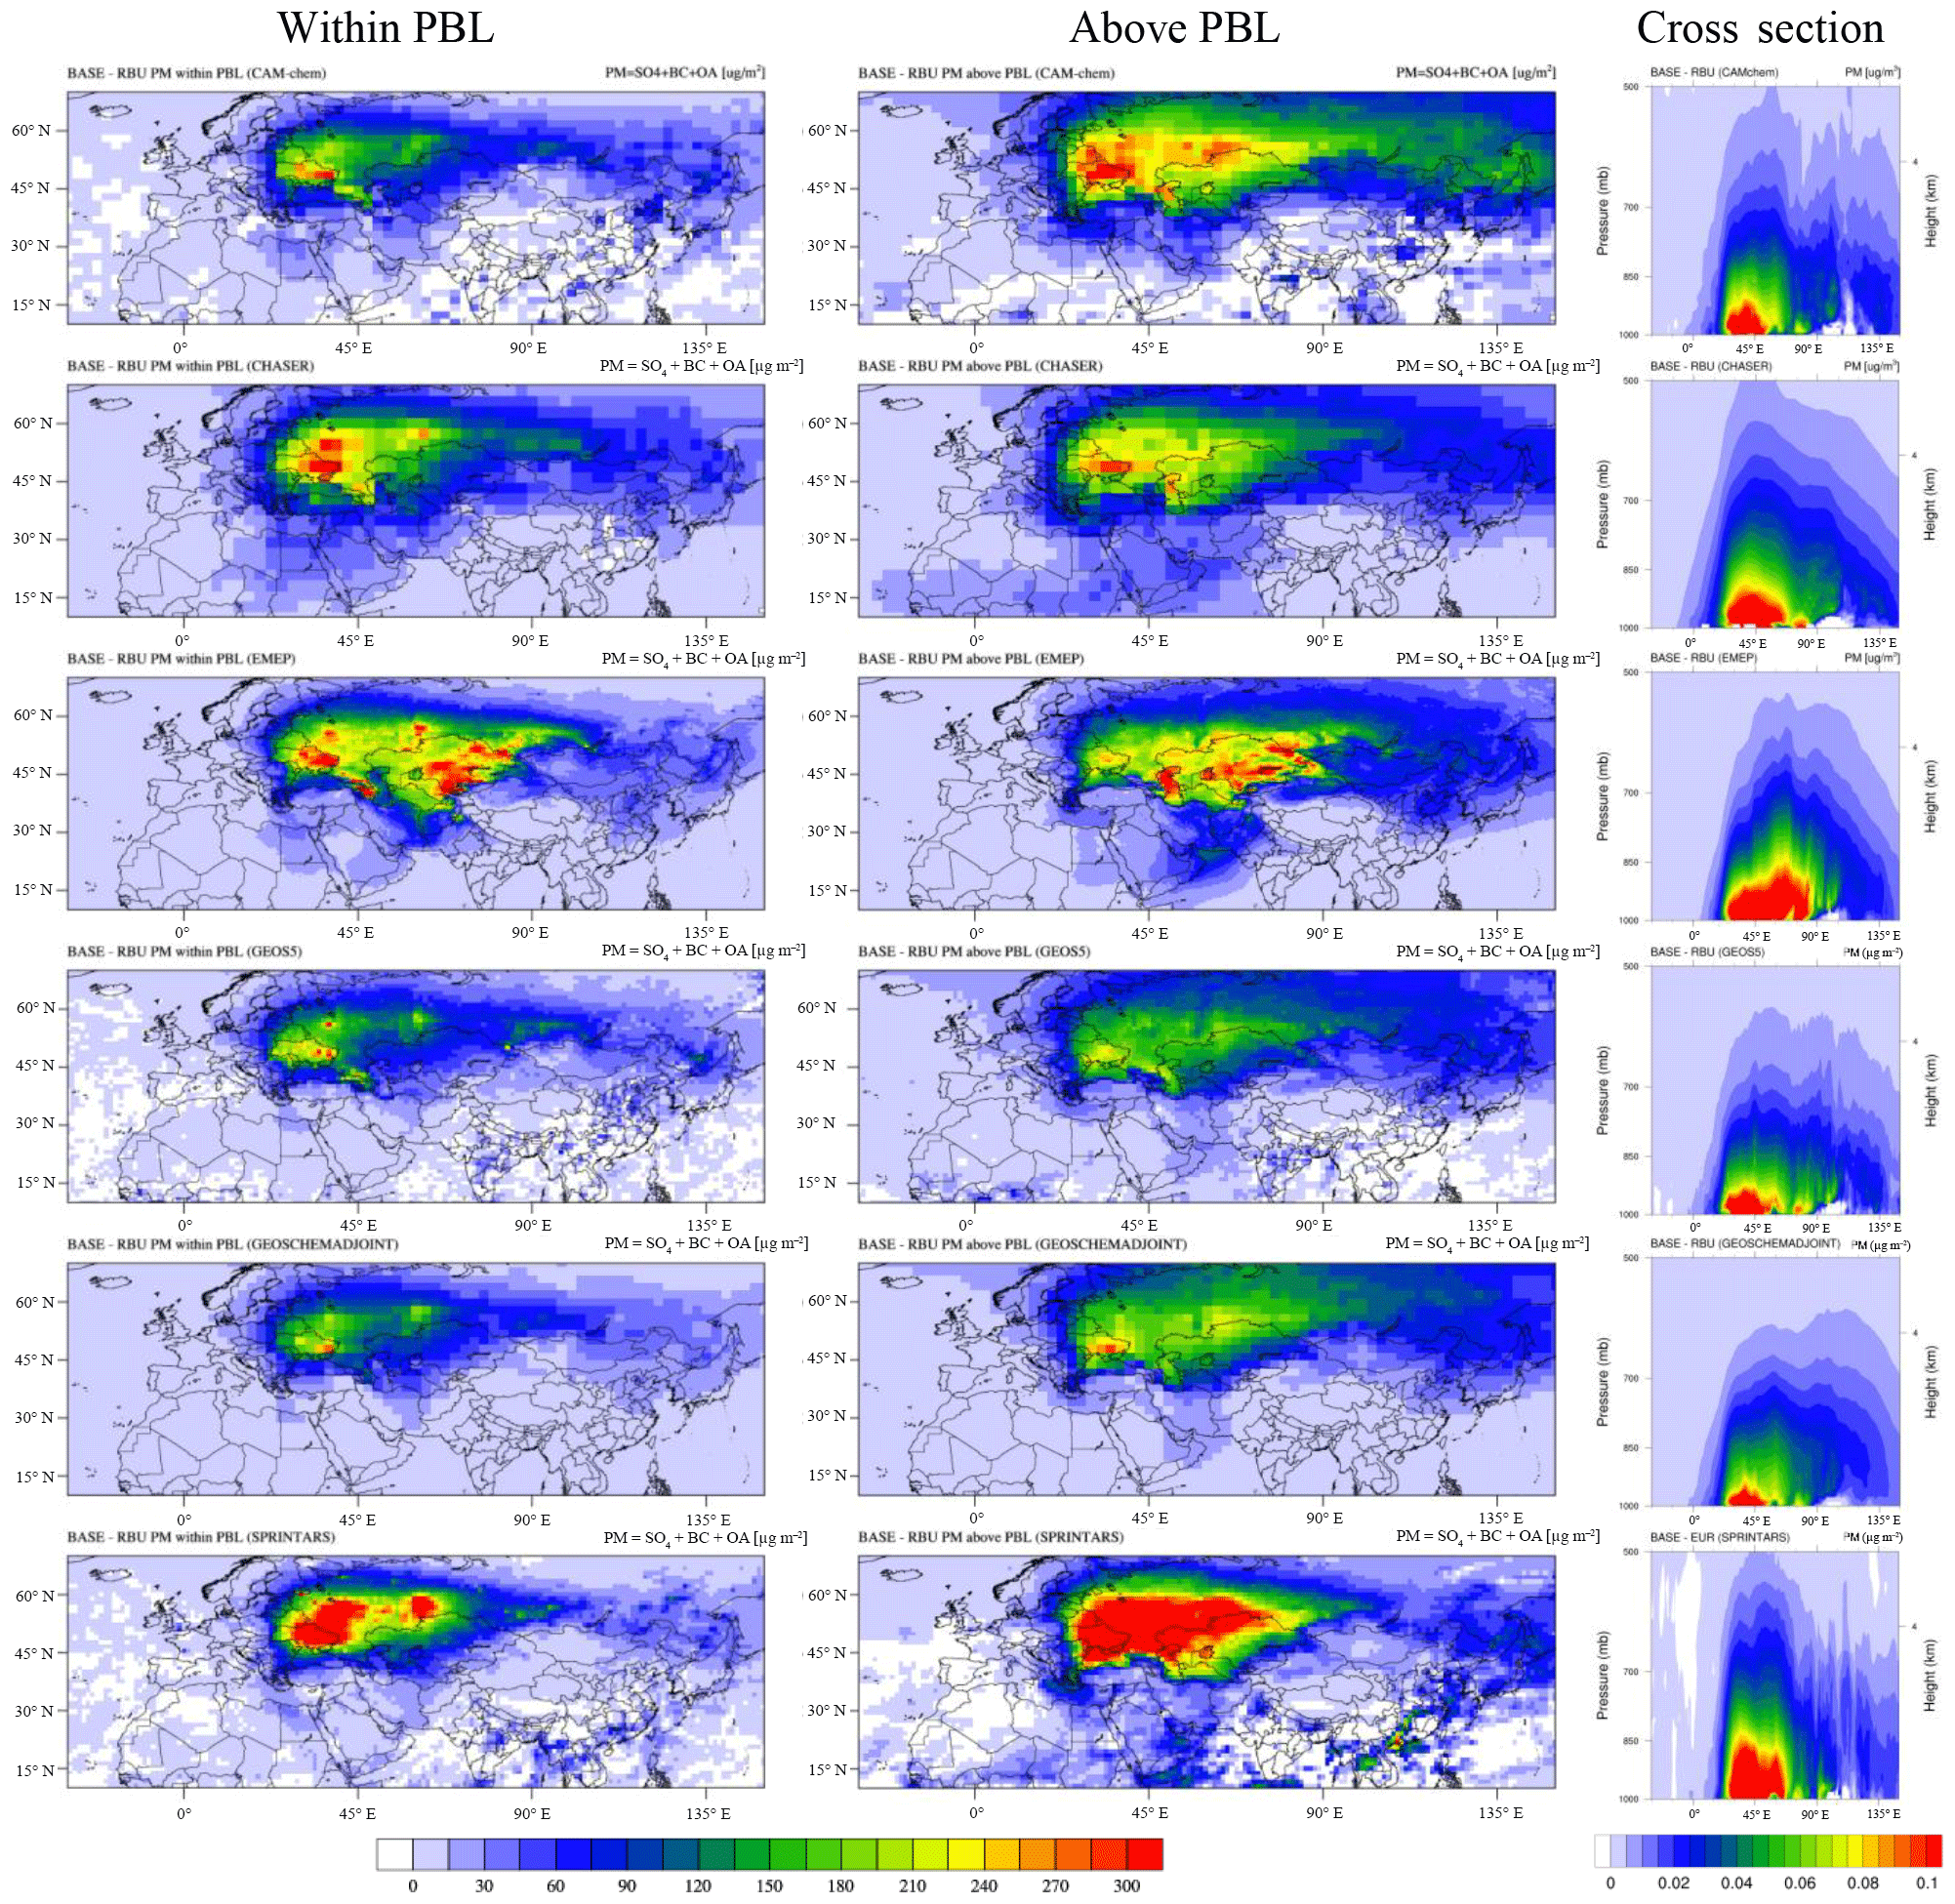
Long-range transport from RBU follows a similar pathway to that from EUR to EAS, as shown in Fig. 8, which is likely because most of the RBU anthropogenic emissions are located in the European part of Russia and Ukraine. PM responses are also relatively more significant in the upper air above the PBL, which spread along 45∘ N and higher latitude and affect the northern part of China, North Korea, South Korea, and Japan. Long-range transport from RBU is slightly larger than that from EUR for both above and within the PBL. Spatial distributions of ΔPMabove and ΔPMwithin suggest that RBU exported air pollutants can travel further towards the western Pacific. Cross sections of PM concentrations suggest that RBU-emitted PM shows a much lower plume rise height in the source region compared to that over EUR. PM response under the RBUALL scenario is also found to exist up to 500 hPa in the source region, but the majority of plume is within 800 hPa.
3.3 Change and interannual variability of the long-range transport
The global anthropogenic emissions have changed significantly, especially over eastern Asia during the past decade (Li et al., 2017); thus the long-range transport impact and its relative importance may have also changed as well. In this section, we compare the impact estimated for the year 2010 with the assessment reported by HTAP1 for the year 2000. We also analyze the HTAP2 simulations for the year 2008 and 2009 to probe the interannual variability. To properly interpret the HTAP1 report and the HTAP2 modeling results, it is important to realize that the regions definitions are moderately different between the two experiments. HTAP1 used straight latitude and longitude boundaries to define the domain coverage of each region (Fiore et al., 2009), while HTAP2 applies national boundaries (one exception in the Northern Hemisphere is the Arctic region, defined as being north of 66∘ N latitude); thus the spatial coverage of “EU” (25–65∘ N; 10∘ W–50∘ E) defined by HTAP1 is slightly different from “EUR” defined by HTAP2, although both of them represent the European region. A similar discrepancy exists for the definition of eastern Asia between the two experiments, as the HTAP1-defined “EA” (15–50∘ N; 95–160∘ E) is smaller than the EAS region with less coverage on the western and northern sides of China. Consequently, when referring to “long-range transport from Europe to eastern Asia”, neither the source (Europe) nor the receptor (eastern Asia) region share exactly the same meaning for HTAP1 and HTAP2. In addition, emission perturbations in source regions performed in both HTAP1 and HTAP2 experiments are 20 % instead of 100 %; thus the full contributions from the EUR or RBU to the EAS region remain unknown. Although the PM response is not exactly proportional to emission perturbation, previous studies (Leibensperger et al., 2011; Liu et al., 2008) suggested that it is reasonable to linearly extrapolate it when evaluating the intercontinental source–receptor relationship because the nonlinear relationship between precursor emission changes and PM responses is only locally effective. The HTAP1 assessment reported that surface concentrations are reduced by 12 %–14 % from 20 % local emission reduction in eastern Asia, Europe, and North America, corresponding to 60 %–70 % reduction under 100 % local emission reduction if the responses are extrapolated linearly. Yet model experiments show that the real 100 % emission perturbation simulations suggest 80 %–82 % surface concentration reduction due to “oxidant limitation” over these polluted areas. However, this relationship becomes linear during transoceanic transport due to the relatively short lifetime of precursors compared to the travel duration. So in this study, we use the Full_Impact to represent the PM responses from 100 % emission perturbation at EUR and RBU by scaling the PM responses under the 20 % emission perturbation conditions by a factor of 5, which provide a rough but direct estimation of the full contributions of long-range transport. This method has been applied by the HTAP1-related studies to estimate the long-range transport of O3 (Fiore et al., 2009; West et al., 2009; Zhang et al., 2009).
and
In addition, we also defined the Relative_Impact in this study to represent the relative importance of long-range transport in contrast to the local emission, as the ratio of PM responses under 20 % emission perturbation in source regions (i.e., EUR, RBU) to the PM responses under 20 % emission perturbation in the receptor region (i.e., EAS):
The full impact and relative impact are calculated with the model ensemble mean to represent the averages, and with individual modeling results to estimate the minima and maxima, as summarized in Table 2. The HTAP1 experiment only reported the assessment of , BC, and OA, so this section will focus on the analysis and comparison of these species. As mentioned earlier, the EAS region is different from the EA region defined in HTAP1, so we also calculate the full impact and relative impact for the EA region but with HTAP2 modeling data to enable the comparison. We first compare the 2000 EU impact on EA with the 2010 EUR impact on EA. The long-range transport shows a prominent decreasing change for all investigated species. The full impact of Europe long-range transport on surface concentration decreased from 0.15 µg m−3 (5.0 %) in 2000 to 0.02 µg m−3 (0.5 %) in 2010, which shall be due to the significant reduction of SO2 anthropogenic emission in Europe from 9.95 Tg in 2000 to 6.18 Tg in 2010 (anthropogenic emissions are summarized in Table S2). The full impacts of Europe long-range transport on surface BC and OA also decreased by a factor of 2–5 for both absolute concentrations and percentage contributions during the 10-year period. Anthropogenic emissions of BC, OC, NMVOC, and primary PM in Europe decreased by 21 %, 4 %, 37 %, and 2 % and their emissions in eastern Asia increased by 39 %, 21 %, 38 %, and 32 % from 2000 to 2010. The emission increase in eastern Asia shall be responsible for the enhanced surface PM concentrations simulated under the baseline scenario. The emission reductions in EUR are consistent with the decreasing change in the long-range transport contributions estimated by the models.
Table 2Annual average long-range transport impacts of surface PM concentrations and percentage contributions from the EUR and RBU source regions to the EAS receptor region. Numbers collected from the HTAP1 assessment are presented in italic font; aerosol surface concentrations (Surf. Conc.) under the baseline scenario are presented in bold font. Numbers in the parentheses indicate the range of each variable among the participating models.
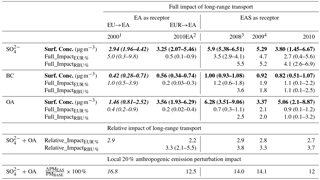
1 Numbers shown for 2000 are collected from the HTAP1 report that represent the long-range transport impact from EU to EA. 2 2010EA is calculated with the HTAP2 data by using the HTAP1 domain configuration for EA. 3 Only data from two models (CAM-chem and CHASER) are available for the EURALL scenario in 2008, and only data from one model (CAM-chem) are available for RBUALL scenario in 2008, so no range is calculated for RBU %. 4 Only data from one model (CAM-chem) 2009 are available so no range is calculated for EUR % and RBU %.
We then investigate the interannual variability of the long-range transport by examining the EUR to EAS and the RBU to EAS impacts from 2008 to 2010. The model-estimated full impactEUR % shows annual changes of 15 %–30 % for all species. The full impactRBU % shows relatively larger interannual changes. As the anthropogenic emissions from the RBU region steadily decreased by ∼9 % from 2008 to 2010, the large dynamics of full impactRBU % is more likely due to the fact that only one model (CAM-chem) is available to estimate the RBU impact in 2008 and 2009 and thus the assessment may be biased. While the estimation for 2010 is calculated with the multi-model ensemble mean, the estimations for the other 2 years are determined by CAM-chem only and need to be validated further.
We finally analyze the relative importance of long-range transport. The HTAP1 reported that the overall contribution to and OA from EU to EA is 2.9 % in 2000, and the relative impact in 2010 is 2.2 %, indicating that long-range transport is playing a less important role compared to the local anthropogenic emission. In contrast, 20 % anthropogenic emission reductions in the EAS region led to a surface concentration of + OA that decreased by 16.8 % in 2000 and 14.1 % in 2010, suggesting that the nonlinear relationship between the precursor and PM becomes more significant when the anthropogenic emissions increase. It also indicates that, to achieve a better air quality with lower PM concentrations, more efforts shall be devoted to reduce the emissions in 2010 because the top 20 % emission reduction would lead to a smaller PM response compared to in 2000.
3.4 Long-range transport impact during the haze episode
We first use the National Climate Data Center (NCDC) observations to identify the locations and periods of haze in China, and then analyze the long-range transport impacts during these identified haze episodes. Haze can be quantitatively identified with visibility less than 10 km and relative humidity less than 90 % (Fu et al., 2014). As most of the haze (locations of NCDC sites and full map of haze shown in Fig. S1 in the Supplement) are located over the central and eastern parts of China (CEC), in this section we focus the analysis of long-range transport impacts on the CEC subdomain (20–55∘ N; 100–135∘ E). The full impacts during the haze episodes (HAZE) are estimated and compared with the annual averaged full impacts, as shown in Table 3.
Table 3Long-range transport full impacts on an annual average scale and during the haze episodes. Numbers in the parentheses indicate the percentage contributions.
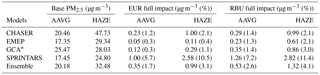
* GCA: GEOSCHEMADJOINT
CAM-chem and GEOS5 have no daily surface data available, so data from the remaining four participating models are analyzed in this section. The models suggest that the PM2.5 baseline concentrations during haze episodes are substantially higher than the annual averages shown in Table 3. The full impacts of long-range transport from the source regions are also higher during the haze episodes by a factor of 2–3 than the annual averages. Higher values of Full_ImpactEUR and Full_ImpactRBU suggest that more fine particles are transported from the EUR and RBU source regions when China is suffering from haze.

Figure 9Spatial distributions and histograms of the full impacts of long-range transport during the haze episodes. Model grids with no NCDC observation sites are assigned to fill values.
As shown in Fig. 9, the spatial distributions of the full impact of the long-range transport during the haze episodes demonstrate a very similar pattern among the participating models. The Full_ImpactEUR % is most significant over the northeastern corner of China, and gradually decreases towards the southeastern direction. The intensity of Full_ImpactEUR % estimated by models, however, shows large differences, as the maximum estimated by SPRINTARS is 10.5 % and the minimum estimated by EMEP is 0.4 %. The numbers presented in Table 3 have demonstrated the general full impacts during all haze episodes, but we are still unaware of how those individual haze episodes are affected by long-range transport. So, we also summarize the histograms of daily full impacts during the haze episodes. The frequency of the histogram is calculated as follows:
and it satisfies
We define MaxFI =15 to represent the upper boundary as Full_Impact ≥15 %. This value (i.e., 15 %) contribution is selected in order to compare the full impact from long-range transport against the PM2.5 response under 20 % local emission control in the EAS region. As shown in Table 2, the surface concentration of + OA is reduced by ∼15 % under the EASALL scenario. So, if Full_ImpactEUR≥15 %, it indicates that the long-range transport from EUR may have an equivalent or even more significant contribution to the surface PM2.5 than that produced from 20 % of the local anthropogenic emission. We define #HazeEventi % as the number of haze events that satisfy and are calculated as follows:
is the haze event at day d, row r, and column c, defined as follows:
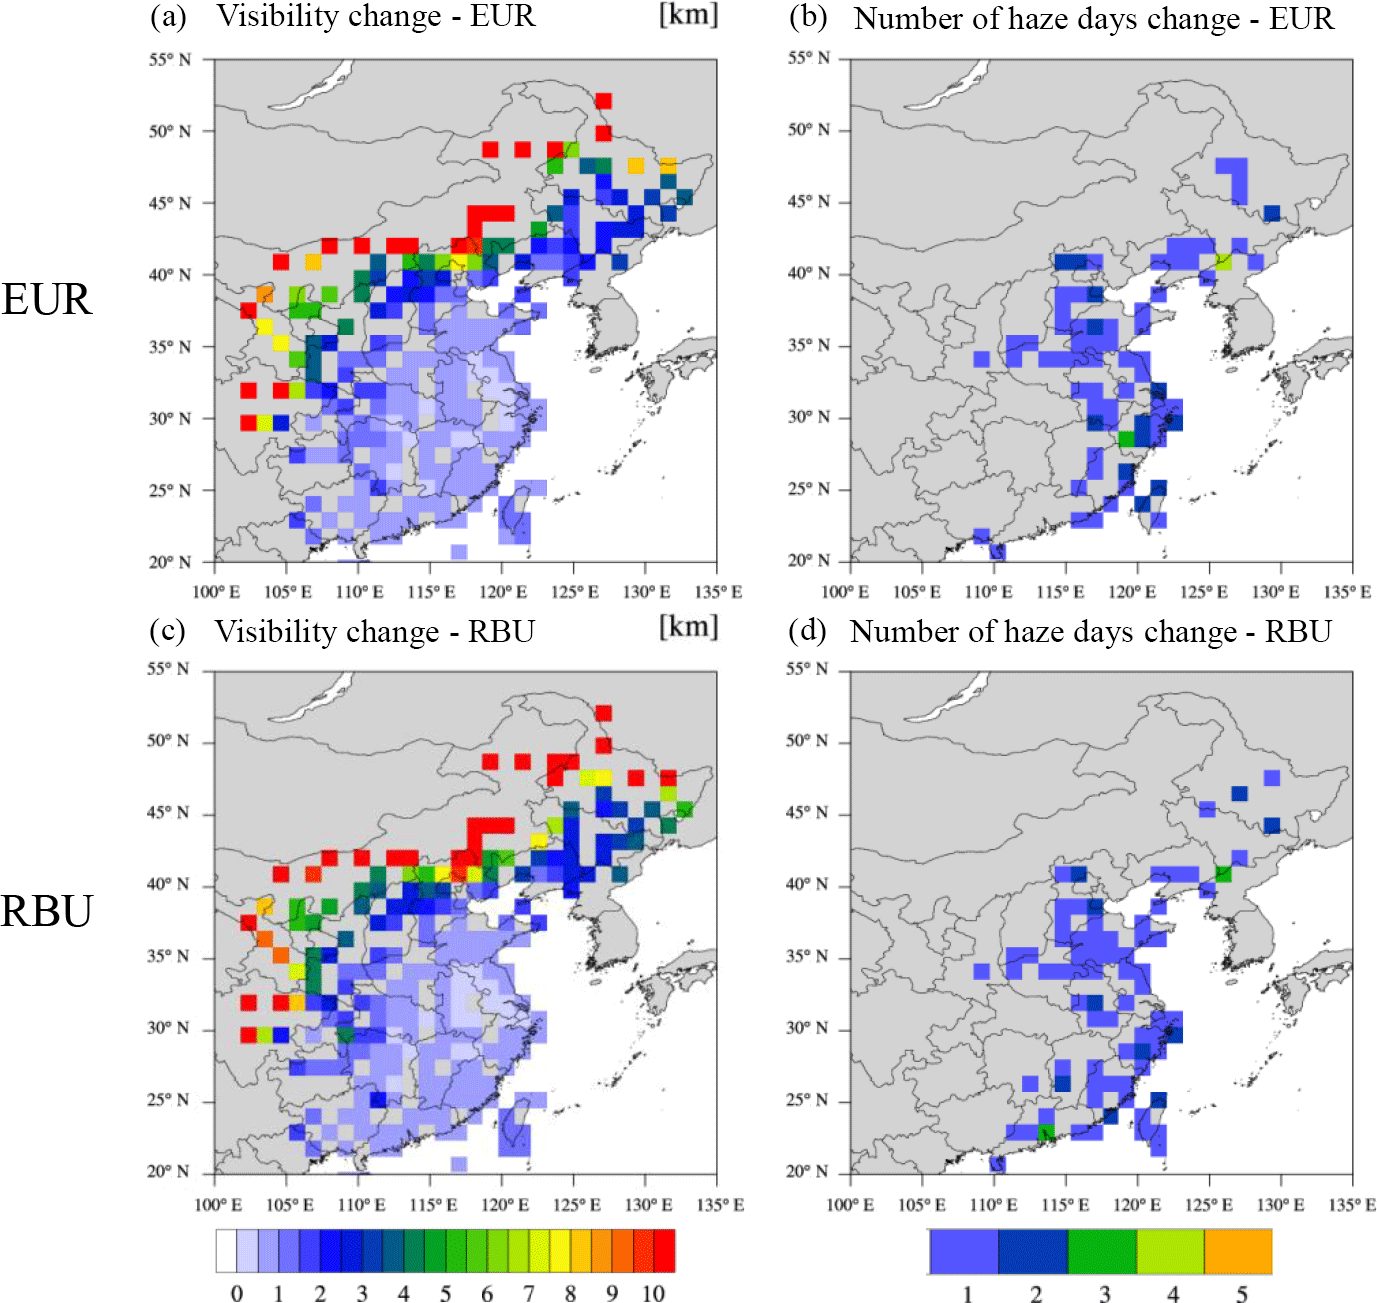
Figure 10Reduction of visibility (a, c) and enhancement of number of haze days (b, d) under the EURALL (a, b) and RBUALL (c, d) scenarios.
So with FrequencyFull_Impact=i %, we can estimate the percentage of the haze episodes for which the long-range transport contributes to i % of the surface PM2.5. The values of FrequencyFull_Impact=15 % are indicated in the histogram plots as shown in Fig. 9. The SPRINTARS-estimated FrequencyFull_Impact=15 % is 5.5 %, suggesting that during almost 5.5 % of the haze episodes in China, long-range transport from Europe contributed to at least the equivalent amount of surface PM2.5 concentration as that generated from 20 % of local anthropogenic emission, while the other model estimations range from 0.01 % to 1.9 %. The influence from the RBU region shows a slightly higher value of FrequencyFull_Impact=15 % as 2.2 %. Although significant variations are found among the model estimations, all participating models suggest nonnegligible values of FrequencyFull_Impact=15 %, indicating the important contributions of long-range transport to haze episodes in China.
The high surface PM2.5 is believed to be the most direct cause of haze conditions. However, visibility cannot be represented by PM2.5 mass concentration only, since it is also determined by the optical properties, number concentrations, and size distributions of the aerosols. Thus the analysis of the PM concentration response only partially depicts the impact of long-range transport during haze episodes. Calculating model-predicted visibility requires the detailed aerosol information mentioned above which is not available from any of the participating models. So we use the Koschmieder equation (Han et al., 2013) to estimate the model-simulated visibility from aerosol extinction coefficient (β) as follows:
Modeled visibility is calculated for SPRINTARS only since the other participating models have no surface layer extinction coefficient available. The long-range transport impact on visibility change and number of haze days change are shown in Fig. 10. It shall be noted that SPRINTARS-estimated long-range transport impact of surface PM2.5 is the highest among the participating models; thus the analysis of visibility change shown in Fig. 10 may represent the upper boundary of model estimations. The spatial distribution of visibility changes agree well with that of surface PM2.5 responses. Visibility is reduced by up to 10 km along the northeastern boundary of China, which is likely due to the fact that these areas receive the most significant amount of the long-range transport aerosols from the EUR and RBU regions. The number of haze days changes, however, are mostly prominent in the NCP and along the eastern coast of China. The long-range transport results in 1–3 days (<3 %) of extra haze over these areas throughout the year. The total number of haze events () estimated by the SPRINTARS model is 18 566, 18 538, and 18 546 under the BASE, EURALL, and RBUALL scenarios, suggesting that transport from the EUR and RBU regions contributes to an additional 0.15 % and 0.11 % of haze events.
To estimate the long-range transport contributions to the surface aerosol concentrations in eastern Asia, this study uses six global models participating in the HTAP2 experiment. Simulations for the year 2010 from the baseline scenario and 20 % anthropogenic emission perturbation scenarios are explored to estimate the long-range transport from the Europe and Russia–Belarus–Ukraine source regions. We find that on an annual average scale, long-range transport from Europe contributes 0.04–0.06 µg m−3 (0.2–0.8 %) to the surface PM2.5 concentration in eastern Asia as indicated by the 20 % emission perturbation experiment, with the majority of the transported aerosols as and OA at 43 % and 19 %. Long-range transport from Russia–Belarus–Ukraine shows slightly higher impact with contributions of 0.07–0.10 µg m−3 (0.3–0.9 %) to the surface PM2.5 in eastern Asia, within which the and responses share bigger slices as 20 % and 21 %, larger than that of OA as 14 %. As compared to the impact from Europe to eastern Asia, more secondary inorganic aerosols are transported from the Russia–Belarus–Ukraine region despite the fact that the 2010 anthropogenic emission from RBU is 40–50 % lower than that from EUR for SO2, NOx, and NH3. Our analysis suggests that the lower temperature in RBU may result in extended lifetime of the gas-phase precursors, which are gradually converted to secondary inorganic aerosols during the transport pathway to eastern Asia, yet further modeling experiment is necessary to explicitly explore the temperature impact on long-range transport.
By investigating the PM responses in different atmosphere layers, we find that long-range transport exist both within and above the PBL, although the upper-level transport takes a larger portion as 66 % of the total PM column density response in eastern Asia. Spatial distributions of the PM responses suggest that the long-range transport from Europe and Russia–Belarus–Ukraine are both predominantly blocked at western side of China due to the elevated topography of Pamirs, Tianshan, and Altay Mountains, where the rest of the exported pollutants are carried by the Westerlies along 45∘ N and higher latitude towards China, North Korea, South Korea, Japan, and the western Pacific.
Comparison between the HTAP1 assessment and the estimation from this study reveals the 10 years of decreasing change in long-range transport from Europe to eastern Asia. When extrapolating the impact of 20 % anthropogenic emission perturbation by a factor of 5 to estimate the full impact, contributions to surface concentrations are decreased from 5.0 %, 1.0 %, and 0.4 % in 2000 to 0.5 %, 0.2 %, and 0.2 % in 2010 for , BC, and OA. This comparison may contain uncertainty because of the different model ensemble compositions between HTAP1 and this study, but the change in the long-range transport impacts from 2000 to 2010 found in this study was consistent with the implications from the emissions changes. The simultaneous emission reduction in Europe and emission enhancement in eastern Asia shall be responsible for the decreasing change. The surface concentrations of , BC, and OA in eastern Asia are also increased by 14 %, 50 %, and 140 % from 2000 to 2010, consistent with many of the local measurements reported in recent years (Chen et al., 2016; Feng et al., 2014; Lu et al., 2010; Zhu et al., 2012). It is important to emphasize that, based on the model ensemble mean estimations, despite the fact that baseline of 2010 anthropogenic emission is substantially higher (20 %–40 %) than that in 2000, the same percentage reduction in the local anthropogenic emission will lead to a smaller benefit in terms of reducing the ambient PM concentrations in the 2010 scenario, indicating the increasing difficulty for air quality management in eastern Asia.
The long-range transport impact during haze episodes in China is estimated by using the NCDC surface observations to identify the haze events, on top of which the HTAP2 experiments are analyzed to quantify the changes in surface PM2.5, visibility, and number of haze days. Despite the significant discrepancy between the models, all participants demonstrate that the full impact during haze episodes is more significant than that on an annual average scale. Estimations with the model ensemble mean suggest that the full impacts from EUR and RBU are 0.99 µg m−3 (3.1 %) and 1.32 µg m−3 (4.1 %) during haze episodes, significantly higher than the annual averages. The model ensemble also suggests that during 5.5–5.7 % of the haze episodes, long-range transport can contribute to surface PM2.5 as much as that generated from 20 % of local anthropogenic emission. Based on analysis with the SPRINTARS model output, visibility is reduced by up to 10 km, with the largest impact found along northeastern China, and the impact gradually decreases towards the southeast and causes visibility reduction of less than 500 m. The enhancement of the number of haze days, however, is found mainly located at the North China Plain and southeastern coastal area of China, where most of the places receive an extra 1–3 haze days due to the influence of long-range transport. We find that, throughout the year of 2010, the number of haze events in our study domain is increased by 0.15 % and 0.11 % due to the long-range transport from the Europe and Russia–Belarus–Ukraine regions.
The HTAP Phase II modeling data can be obtained through the AeroCom servers and web interfaces, accessible at http://aerocom.met.no (last access: 10 August 2017).
The supplement related to this article is available online at: https://doi.org/10.5194/acp-18-15581-2018-supplement.
XD and JSF designed the study, analyzed the data and wrote the manuscript. QZ, JS, JT and KH helped to process modeling and observation data. TK organized the collaboration and communication between groups from different institutions and commented on the research idea. TS and KS provided CHASER data. LE and ST provided CAM-chem data. JEJ and MS provided the EMEP data. HB and MC provided the GEOS5 data. YD and DH provided the GEOSCHEMADJOINT data. TT provided the SPRINTARS data. AMKB provided all modeling data management and access to observation data.
The authors declare that they have no conflict of interest.
This article is part of the special issue “Global and regional assessment of intercontinental transport of air pollution: results from HTAP, AQMEII and MICS”. It is not associated with a conference.
This work was partly supported by the Natural Science Foundation of China
(41429501). We would like to thank the UN-ECE CLRTAP (EMEP), AMAP, and NILU
for supporting the EBAS database with air pollutant measurements. We thank
Keiichi Sato and Ayako Aoyagi from Asia Center for Air Pollution Research for
providing the EANET data. We would also like to acknowledge NOAA NCDC for
providing the public accessible meteorology observations. We thank the Oak
Ridge Leadership Computing Facility (OLCF) at Oak Ridge National Lab (ORNL)
for providing computational sources. Funding for open access to this research
was provided by University of Tennessee's Open Publishing Support
Fund.
Edited by: Stefano Galmarini
Reviewed by: three anonymous referees
Akimoto, H.: Global air quality and pollution, Science, 302, 1716–1719, 2003.
Cao, Q. L., Liang, Y., and Niu, X. T.: China's Air Quality and Respiratory Disease Mortality Based on the Spatial Panel Model, Int. J. Environ. Res. Pu., 14, 1081, https://doi.org/10.3390/Ijerph14091081, 2017.
Carmichael, G. R., Sakurai, T., Streets, D., Hozumi, Y., Ueda, H., Park, S. U., Fung, C., Han, Z., Kajino, M., Engardt, M., Bennet, C., Hayami, H., Sartelet, K., Holloway, T., Wang, Z., Kannari, A., Fu, J., Matsuda, K., Thongbooncho, N., and Amann, M.: MICS-Asia II: The model intercomparison study for Asia Phase II methodology and overview of findings, Atmos. Environ., 42, 3468–3490, 2008.
Chen, Y., Schleicher, N., Fricker, M., Cen, K., Liu, X. L., Kaminski, U., Yu, Y., Wu, X. F., and Norra, S.: Long-term variation of black carbon and PM2.5 in Beijing, China with respect to meteorological conditions and governmental measures, Environ. Pollut., 212, 269–278, https://doi.org/10.1016/j.envpol.2016.01.008, 2016.
Dong, X., Fu, J. S., Huang, K., Tong, D., and Zhuang, G.: Model development of dust emission and heterogeneous chemistry within the Community Multiscale Air Quality modeling system and its application over East Asia, Atmos. Chem. Phys., 16, 8157–8180, https://doi.org/10.5194/acp-16-8157-2016, 2016.
Dong, X. Y. and Fu, J. S.: Understanding interannual variations of biomass burning from Peninsular Southeast Asia, part I: Model evaluation and analysis of systematic bias, Atmos. Environ., 116, 293–307, 2015a.
Dong, X. Y. and Fu, J. S.: Understanding interannual variations of biomass burning from Peninsular Southeast Asia, part II: Variability and different influences in lower and higher atmosphere levels, Atmos. Environ., 115, 9–18, 2015b.
Dubovik, O., Smirnov, A., Holben, B. N., King, M. D., Kaufman, Y. J., Eck, T. F., and Slutsker, I.: Accuracy assessments of aerosol optical properties retrieved from Aerosol Robotic Network (AERONET) Sun and sky radiance measurements, J. Geophys. Res.-Atmos., 105, 9791–9806, 2000.
EANET: EANET Data Report 2006, Acid Deposition Monitoring Network in East Aisa (EANET), 2007.
Eckhardt, S., Stohl, A., Beirle, S., Spichtinger, N., James, P., Forster, C., Junker, C., Wagner, T., Platt, U., and Jennings, S. G.: The North Atlantic Oscillation controls air pollution transport to the Arctic, Atmos. Chem. Phys., 3, 1769–1778, https://doi.org/10.5194/acp-3-1769-2003, 2003.
Feng, J. L., Zhong, M., Xu, B. H., Du, Y., Wu, M. H., Wang, H. L., and Chen, C. H.: Concentrations, seasonal and diurnal variations of black carbon in PM2.5 in Shanghai, China, Atmos. Res., 147, 1–9, https://doi.org/10.1016/j.atmosres.2014.04.018, 2014.
Fiore, A. M., Dentener, F. J., Wild, O., Cuvelier, C., Schultz, M. G., Hess, P., Textor, C., Schulz, M., Doherty, R. M., Horowitz, L. W., MacKenzie, I. A., Sanderson, M. G., Shindell, D. T., Stevenson, D. S., Szopa, S., Van Dingenen, R., Zeng, G., Atherton, C., Bergmann, D., Bey, I., Carmichael, G., Collins, W. J., Duncan, B. N., Faluvegi, G., Folberth, G., Gauss, M., Gong, S., Hauglustaine, D., Holloway, T., Isaksen, I. S. A., Jacob, D. J., Jonson, J. E., Kaminski, J. W., Keating, T. J., Lupu, A., Marmer, E., Montanaro, V., Park, R. J., Pitari, G., Pringle, K. J., Pyle, J. A., Schroeder, S., Vivanco, M. G., Wind, P., Wojcik, G., Wu, S., and Zuber, A.: Multimodel estimates of intercontinental source-receptor relationships for ozone pollution, J. Geophys. Res.-Atmos., 114, D04301, https://doi.org/10.1029/2008jd010816, 2009.
Fu, G. Q., Xu, W. Y., Yang, R. F., Li, J. B., and Zhao, C. S.: The distribution and trends of fog and haze in the North China Plain over the past 30 years, Atmos. Chem. Phys., 14, 11949–11958, https://doi.org/10.5194/acp-14-11949-2014, 2014.
Fu, J. S., Dong, X. Y., Gao, Y., Wong, D. C., and Lam, Y. F.: Sensitivity and linearity analysis of ozone in East Asia: The effects of domestic emission and intercontinental transport, Japca J. Air Waste Ma., 62, 1102–1114, https://doi.org/10.1080/10962247.2012.699014, 2012.
Gao, J. H., Woodward, A., Vardoulakis, S., Kovats, S., Wilkinson, P., Li, L. P., Xu, L., Li, J., Yang, J., Li, J., Cao, L., Liu, X. B., Wu, H. X., and Liu, Q. Y.: Haze, public health and mitigation measures in China: A review of the current evidence for further policy response, Sci. Total Environ., 578, 148–157, https://doi.org/10.1016/j.scitotenv.2016.10.231, 2017.
Guo, S., Hu, M., Zamora, M. L., Peng, J. F., Shang, D. J., Zheng, J., Du, Z. F., Wu, Z., Shao, M., Zeng, L. M., Molina, M. J., and Zhang, R. Y.: Elucidating severe urban haze formation in China, P. Natl. Acad. Sci. USA, 111, 17373–17378, https://doi.org/10.1073/pnas.1419604111, 2014.
Han, X., Zhang, M. G., Tao, J. H., Wang, L. L., Gao, J., Wang, S. L., and Chai, F. H.: Modeling aerosol impacts on atmospheric visibility in Beijing with RAMS-CMAQ, Atmos. Environ., 72, 177–191, https://doi.org/10.1016/j.atmosenv.2013.02.030, 2013.
Henze, D. K., Hakami, A., and Seinfeld, J. H.: Development of the adjoint of GEOS-Chem, Atmos. Chem. Phys., 7, 2413–2433, https://doi.org/10.5194/acp-7-2413-2007, 2007.
Ho, K. F., Ho, S. S. H., Huang, R. J., Chuang, H. C., Cao, J. J., Han, Y. M., Lui, K. H., Ning, Z., Chuang, K. J., Cheng, T. J., Lee, S. C., Hu, D., Wang, B., and Zhang, R. J.: Chemical composition and bioreactivity of PM2.5 during 2013 haze events in China, Atmos Environ, 126, 162–170, 2016.
Hua, Y., Cheng, Z., Wang, S. X., Jiang, J. K., Chen, D. R., Cai, S. Y., Fu, X., Fu, Q. Y., Chen, C. H., Xu, B. Y., and Yu, J. Q.: Characteristics and source apportionment of PM2.5 during a fall heavy haze episode in the Yangtze River Delta of China, Atmos. Environ., 123, 380–391, https://doi.org/10.1016/j.atmosenv.2015.03.046, 2015.
Huang, K., Zhuang, G., Lin, Y., Fu, J. S., Wang, Q., Liu, T., Zhang, R., Jiang, Y., Deng, C., Fu, Q., Hsu, N. C., and Cao, B.: Typical types and formation mechanisms of haze in an Eastern Asia megacity, Shanghai, Atmos. Chem. Phys., 12, 105–124, https://doi.org/10.5194/acp-12-105-2012, 2012.
Huneeus, N., Schulz, M., Balkanski, Y., Griesfeller, J., Prospero, J., Kinne, S., Bauer, S., Boucher, O., Chin, M., Dentener, F., Diehl, T., Easter, R., Fillmore, D., Ghan, S., Ginoux, P., Grini, A., Horowitz, L., Koch, D., Krol, M. C., Landing, W., Liu, X., Mahowald, N., Miller, R., Morcrette, J.-J., Myhre, G., Penner, J., Perlwitz, J., Stier, P., Takemura, T., and Zender, C. S.: Global dust model intercomparison in AeroCom phase I, Atmos. Chem. Phys., 11, 7781–7816, https://doi.org/10.5194/acp-11-7781-2011, 2011.
Im, U., Christensen, J. H., Geels, C., Hansen, K. M., Brandt, J., Solazzo, E., Alyuz, U., Balzarini, A., Baro, R., Bellasio, R., Bianconi, R., Bieser, J., Colette, A., Curci, G., Farrow, A., Flemming, J., Fraser, A., Jimenez-Guerrero, P., Kitwiroon, N., Liu, P., Nopmongcol, U., Palacios-Peña, L., Pirovano, G., Pozzoli, L., Prank, M., Rose, R., Sokhi, R., Tuccella, P., Unal, A., Vivanco, M. G., Yarwood, G., Hogrefe, C., and Galmarini, S.: Influence of anthropogenic emissions and boundary conditions on multi-model simulations of major air pollutants over Europe and North America in the framework of AQMEII3, Atmos. Chem. Phys., 18, 8929–8952, https://doi.org/10.5194/acp-18-8929-2018, 2018.
Janssens-Maenhout, G., Crippa, M., Guizzardi, D., Dentener, F., Muntean, M., Pouliot, G., Keating, T., Zhang, Q., Kurokawa, J., Wankmüller, R., Denier van der Gon, H., Kuenen, J. J. P., Klimont, Z., Frost, G., Darras, S., Koffi, B., and Li, M.: HTAP_v2.2: a mosaic of regional and global emission grid maps for 2008 and 2010 to study hemispheric transport of air pollution, Atmos. Chem. Phys., 15, 11411–11432, https://doi.org/10.5194/acp-15-11411-2015, 2015.
Jia, P. and Wang, L.: Peering into China's thick haze of air pollution, Chem. Eng. News, 95, 19–22, 2017.
Kong, S., Han, B., Bai, Z., Chen, L., Shi, J., Xu, Z.: Receptor modelling of PM2.5, PM10 and TSP in different seasons and long-range transport analysis at a coastal site of Tianjin China, Sci. Total Environ., 408, 4681–4694, https://doi.org/10.1016/j.scitotenv.2010.06.005, 2010.
Leibensperger, E. M., Mickley, L. J., Jacob, D. J., and Barrett, S. R. H.: Intercontinental influence of NOx and CO emissions on particulate matter air quality, Atmos. Environ., 45, 3318–3324, https://doi.org/10.1016/j.atmosenv.2011.02.023, 2011.
Li, M., Zhang, Q., Kurokawa, J.-I., Woo, J.-H., He, K., Lu, Z., Ohara, T., Song, Y., Streets, D. G., Carmichael, G. R., Cheng, Y., Hong, C., Huo, H., Jiang, X., Kang, S., Liu, F., Su, H., and Zheng, B.: MIX: a mosaic Asian anthropogenic emission inventory under the international collaboration framework of the MICS-Asia and HTAP, Atmos. Chem. Phys., 17, 935–963, https://doi.org/10.5194/acp-17-935-2017, 2017.
Li, W. J., Cao, Y., Li, R. K., Ma, X. M., Chen, J. Y., Wu, Z. L., and Xu, Q.: The spatial variation in the effects of air pollution on cardiovascular mortality in Beijing, China, J. Expo. Sci. Env. Epid., 28, 297–304, https://doi.org/10.1038/jes.2016.21, 2018.
Li, Y. and Zhu, L.: Cost of energy saving and CO2 emissions reduction in China's iron and steel sector, Appl. Energ., 130, 603–616, 2014.
Liu, J., Mauzerall, D. L., and Horowitz, L. W.: Source-receptor relationships between East Asian sulfur dioxide emissions and Northern Hemisphere sulfate concentrations, Atmos. Chem. Phys., 8, 3721–3733, https://doi.org/10.5194/acp-8-3721-2008, 2008.
Liu, L. W., Chen, C. X., Zhao, Y. F., and Zhao, E. D.: China's carbon-emissions trading: Overview, challenges and future, Renew. Sust. Energ. Rev., 49, 254–266, https://doi.org/10.1016/j.rser.2015.04.076, 2015.
Lu, Z., Streets, D. G., Zhang, Q., Wang, S., Carmichael, G. R., Cheng, Y. F., Wei, C., Chin, M., Diehl, T., and Tan, Q.: Sulfur dioxide emissions in China and sulfur trends in East Asia since 2000, Atmos. Chem. Phys., 10, 6311–6331, https://doi.org/10.5194/acp-10-6311-2010, 2010.
Rao, S. T., Galmarini, S., and Puckett, K.: Air Quality Model Evaluation International Initiative (AQMEII) Advancing the State of the Science in Regional Photochemical Modeling and Its Applications, B. Am. Meteorol. Soc., 92, 23–30, 2011.
Rienecker, M. M., Suarez, M. J., Todling, R., Bacmeister, J., Takacs, L., Liu, H.-C., Gu, W., Sienkiewicz, M., Koster, R. D., Gelaro, R., Stajner, I., and Nielsen, J. E.: The GEOS-5 Data Assimilation System – Documentation of Versions 5.0.1, 5.1.0, and 5.2.0, NASA, Publication series: NASA/TM; 2008-104606, Technical report series on global modeling and data assimilation, Vol. 27, 2008.
Shen, R. R., Schafer, K., Shao, L. Y., Schnelle-Kreis, J., Wang, Y. S., Li, F. X., Liu, Z. R., Emeis, S., and Schmid, H. P.: Chemical characteristics of PM2.5 during haze episodes in spring 2013 in Beijing, Urban Clim., 22, 51–63, https://doi.org/10.1016/j.uclim.2016.01.003, 2017.
Simpson, D., Benedictow, A., Berge, H., Bergström, R., Emberson, L. D., Fagerli, H., Flechard, C. R., Hayman, G. D., Gauss, M., Jonson, J. E., Jenkin, M. E., Nyíri, A., Richter, C., Semeena, V. S., Tsyro, S., Tuovinen, J.-P., Valdebenito, Á., and Wind, P.: The EMEP MSC-W chemical transport model – technical description, Atmos. Chem. Phys., 12, 7825–7865, https://doi.org/10.5194/acp-12-7825-2012, 2012.
Stjern, C. W., Samset, B. H., Myhre, G., Bian, H., Chin, M., Davila, Y., Dentener, F., Emmons, L., Flemming, J., Haslerud, A. S., Henze, D., Jonson, J. E., Kucsera, T., Lund, M. T., Schulz, M., Sudo, K., Takemura, T., and Tilmes, S.: Global and regional radiative forcing from 20 % reductions in BC, OC and SO4 – an HTAP2 multi-model study, Atmos. Chem. Phys., 16, 13579–13599, https://doi.org/10.5194/acp-16-13579-2016, 2016.
Stohl, A., Eckhardt, S., Forster, C., James, P., and Spichtinger, N.: On the pathways and timescales of intercontinental air pollution transport, J. Geophys. Res.-Atmos., 107, ACH 6-1–ACH 6-17, https://doi.org/10.1029/2001JD001396, 2002.
Streets, D. G., van Aardenne, J., Battye, B., Garivait, S., Grano, D., Guenther, A., Klimont, Z., Lamarque, J. F., Lu, Z., Maenhout, G., Ohara, T., Parrish, D. J., Smith, S. J., and Vallack, H.: Emission Inventories and Projections, in: Hemispheric Transport of Air Pollution (2010) Part A: Ozone and Particulate Matter, chap. 3, Air Pollution Studies No. 17, edited by: Dentener, F., Keating, T., and Akimoto, H., UNECE Information Service, Geneva, Switzerland, 77–133, 2010.
Sudo, K., Takahashi, M., Kurokawa, J., and Akimoto, H.: CHASER: A global chemical model of the troposphere – 1. Model description, J. Geophys. Res.-Atmos., 107, ACH 7-1–ACH 7-20, https://doi.org/10.1029/2001JD001113, 2002.
Takemura, T., Nozawa, T., Emori, S., Nakajima, T. Y., and Nakajima, T.: Simulation of climate response to aerosol direct and indirect effects with aerosol transport-radiation model, J. Geophys. Res.-Atmos., 110, D02202, https://doi.org/10.1029/2004jd005029, 2005.
Tie, X. X., Wu, D., and Brasseur, G.: Lung cancer mortality and exposure to atmospheric aerosol particles in Guangzhou, China, Atmos. Environ., 43, 2375–2377, https://doi.org/10.1016/j.atmosenv.2009.01.036, 2009.
Tilmes, S., Lamarque, J.-F., Emmons, L. K., Kinnison, D. E., Marsh, D., Garcia, R. R., Smith, A. K., Neely, R. R., Conley, A., Vitt, F., Val Martin, M., Tanimoto, H., Simpson, I., Blake, D. R., and Blake, N.: Representation of the Community Earth System Model (CESM1) CAM4-chem within the Chemistry-Climate Model Initiative (CCMI), Geosci. Model Dev., 9, 1853–1890, https://doi.org/10.5194/gmd-9-1853-2016, 2016.
Tørseth, K., Aas, W., Breivik, K., Fjæraa, A. M., Fiebig, M., Hjellbrekke, A. G., Lund Myhre, C., Solberg, S., and Yttri, K. E.: Introduction to the European Monitoring and Evaluation Programme (EMEP) and observed atmospheric composition change during 1972–2009, Atmos. Chem. Phys., 12, 5447–5481, https://doi.org/10.5194/acp-12-5447-2012, 2012.
Wang, J. D., Wang, S. X., Jiang, J. K., Ding, A. J., Zheng, M., Zhao, B., Wong, D. C., Zhou, W., Zheng, G. J., Wang, L., Pleim, J. E., and Hao, J. M.: Impact of aerosol-meteorology interactions on fine particle pollution during China's severe haze episode in January 2013, Environ. Res. Lett., 9, 094002, https://doi.org/10.1088/1748-9326/9/9/094002, 2014.
Wang, L. T., Wei, Z., Yang, J., Zhang, Y., Zhang, F. F., Su, J., Meng, C. C., and Zhang, Q.: The 2013 severe haze over southern Hebei, China: model evaluation, source apportionment, and policy implications, Atmos. Chem. Phys., 14, 3151–3173, https://doi.org/10.5194/acp-14-3151-2014, 2014.
Wang, Q. Z., Zhuang, G. S., Huang, K., Liu, T. N., Deng, C. R., Xu, J., Lin, Y. F., Guo, Z. G., Chen, Y., Fu, Q. Y., Fu, J. S. S., and Chen, J. K.: Probing the severe haze pollution in three typical regions of China: Characteristics, sources and regional impacts, Atmos. Environ., 120, 76–88, 2015.
Wang, Y. J., Li, L., Chen, C. H., Huang, C., Huang, H. Y., Feng, J. L., Wang, S. X., Wang, H. L., Zhang, G., Zhou, M., Cheng, P., Wu, M. H., Sheng, G. Y., Fu, J. M., Hu, Y., Russell, A. G., and Wumaer, A.: Source apportionment of fine particulate matter during autumn haze episodes in Shanghai, China, J. Geophys. Res.-Atmos., 119, 1903–1914, https://doi.org/10.1002/2013JD019630, 2014.
West, J. J., Naik, V., Horowitz, L. W., and Fiore, A. M.: Effect of regional precursor emission controls on long-range ozone transport – Part 1: Short-term changes in ozone air quality, Atmos. Chem. Phys., 9, 6077–6093, https://doi.org/10.5194/acp-9-6077-2009, 2009.
WorldBank, T.: Cost of Pollution in China, Rural Development, Natural Resources and Environmetn Management Unit, Washington, DC, 2007.
Xu, P., Chen, Y. F., and Ye, X. J.: Haze, air pollution, and health in China, Lancet, 382, 2067–2067, https://doi.org/10.1016/S0140-6736(13)62693-8, 2013.
Yin, L. Q., Niu, Z. C., Chen, X. Q., Chen, J. S., Xu, L. L., and Zhang, F. W.: Chemical compositions of PM2.5 aerosol during haze periods in the mountainous city of Yong'an, China, J. Environ. Sci.-China, 24, 1225–1233, 2012.
Zhang, L., Jacob, D. J., Kopacz, M., Henze, D. K., Singh, K., and Jaffe, D. A.: Intercontinental source attribution of ozone pollution at western US sites using an adjoint method, Geophys. Res. Lett., 36, L11810, https://doi.org/10.1029/2009gl037950, 2009.
Zhang, X. Y., Wang, Y. Q., Niu, T., Zhang, X. C., Gong, S. L., Zhang, Y. M., and Sun, J. Y.: Atmospheric aerosol compositions in China: spatial/temporal variability, chemical signature, regional haze distribution and comparisons with global aerosols, Atmos. Chem. Phys., 12, 779–799, https://doi.org/10.5194/acp-12-779-2012, 2012.
Zhu, J. L., Liao, H., and Li, J. P.: Increases in aerosol concentrations over eastern China due to the decadal-scale weakening of the East Asian summer monsoon, Geophys. Res. Lett., 39, L09809, https://doi.org/10.1029/2012gl051428, 2012.