the Creative Commons Attribution 4.0 License.
the Creative Commons Attribution 4.0 License.
 | 02 Feb 2018
Air quality modelling in the summer over the eastern Mediterranean using WRF-Chem: chemistry and aerosol mechanism intercomparison
George K. Georgiou
Theodoros Christoudias
Yiannis Proestos
Jonilda Kushta
Panos Hadjinicolaou
Jos Lelieveld
We employ the WRF-Chem model to study summertime air pollution, the intense photochemical activity and their impact on air quality over the eastern Mediterranean. We utilize three nested domains with horizontal resolutions of 80, 16 and 4 km, with the finest grid focusing on the island of Cyprus, where the CYPHEX campaign took place in July 2014. Anthropogenic emissions are based on the EDGAR HTAP global emission inventory, while dust and biogenic emissions are calculated online. Three simulations utilizing the CBMZ-MOSAIC, MOZART-MOSAIC, and RADM2-MADE/SORGAM gas-phase and aerosol mechanisms are performed. The results are compared with measurements from a dense observational network of 14 ground stations in Cyprus. The model simulates T2 m, Psurf, and WD10 m accurately, with minor differences in WS10 m between model and observations at coastal and mountainous stations attributed to limitations in the representation of the complex topography in the model. It is shown that the south-eastern part of Cyprus is mostly affected by emissions from within the island, under the dominant (60 %) westerly flow during summertime. Clean maritime air from the Mediterranean can reduce concentrations of local air pollutants over the region during westerlies. Ozone concentrations are overestimated by all three mechanisms (9 % ≤ NMB ≤ 23 %) with the smaller mean bias (4.25 ppbV) obtained by the RADM2-MADE/SORGAM mechanism. Differences in ozone concentrations can be attributed to the VOC treatment by the three mechanisms. The diurnal variability of pollution and ozone precursors is not captured (hourly correlation coefficients for O3 ≤ 0.29). This might be attributed to the underestimation of NOx concentrations by local emissions by up to 50 %. For the fine particulate matter (PM2.5), the lowest mean bias (9 µg m−3) is obtained with the RADM2-MADE/SORGAM mechanism, with overestimates in sulfate and ammonium aerosols. Overestimation of sulfate aerosols by this mechanism may be linked to the SO2 oxidation in clouds. The MOSAIC aerosol mechanism overestimates PM2.5 concentrations by up to 22 µg m−3 due to a more pronounced dust component compared to the other two mechanisms, mostly influenced by the dust inflow from the global model. We conclude that all three mechanisms are very sensitive to boundary conditions from the global model for both gas-phase and aerosol pollutants, in particular dust and ozone.
- Article
(5722 KB) -
Supplement
(978 KB) - BibTeX
- EndNote


Many years of intense population growth have rendered the eastern Mediterranean and the Middle East (EMME) region into a very densely populated area, with more than 350 million inhabitants over an area with a 2000 km radius. Strong industrialization and a lack of air pollution policy in the countries in the region have resulted, in recent decades, in an increase of anthropogenic emissions to the atmosphere. Compared to other regions in the Northern Hemisphere, background concentrations of important trace gases and aerosols over the EMME region are very high (Lelieveld et al., 2002), whilst the Mediterranean Basin is found to be the region with the highest background ozone (O3) levels in Europe. Several locations in the Middle East are characterized by much higher nitrogen dioxide (NO2) column densities than major cities in Europe (Lelieveld et al., 2009).
The eastern Mediterranean atmospheric O3 concentrations are characterized by seasonal variability with the maxima observed during the summer (Kouvarakis et al., 2000; Gerasopoulos et al., 2005; Kalabokas et al., 2008; Kleanthous et al., 2014) due to intense photochemical activity and the prevailing meteorological conditions. The collocation of the south-eastern Europe/Balkan Peninsula high-pressure system and the Asian monsoon low-pressure regime to the east causes northerly circulation over the Aegean Sea that sheers to north-westerly over the eastern Mediterranean (Tyrlis et al., 2013; Anagnostopoulou et al., 2014). As a result, the EMME region is affected by near-surface transport of polluted air masses from various distance sources such as the Middle East, eastern and central Europe (Lelieveld et al., 2002; Gerasopoulos et al., 2005; Ladstätter-Weißenmayer et al., 2007; Kalabokas et al., 2008; Kanakidou et al., 2011). Kleanthous et al. (2014) reported that long-range transport (LRT) has important impacts on the air quality over the island of Cyprus and it is directly linked to high O3 levels. Local precursor emissions such as nitrogen oxide (NO) and carbon monoxide (CO) have been found to account only for 6 % of the observed O3 levels.
Downward transport from the upper troposphere and lower stratosphere associated with enhanced subsidence and limited horizontal divergence has been found to be another important mechanism, which increases the already elevated O3 concentrations over the EMME region (Zanis et al., 2014). During the summer period, the contribution of tropopause folds in mid-tropospheric and lower tropospheric O3 concentrations is more significant over the south-eastern Mediterranean (Akritidis et al., 2016). LRT also enhances carbon monoxide (CO) surface concentrations, with 60 % to 80 % of the boundary-layer CO over the Mediterranean attributed to polluted air masses originating from western and eastern Europe, while the eastern Mediterranean is mainly affected by emissions from Ukraine and Russia (Lelieveld et al., 2002).
During the second phase of the Air Quality Model Evaluation International Initiative (AQMEII), the nine working groups using the Weather Research and Forecasting model coupled with chemistry (WRF-Chem) operationally reported an overall underestimation of the annual surface ozone (O3) levels reaching up to 18 % over Europe and 22 % over North America (Im et al., 2015b) with autumn overestimation and winter underestimation. The meteorological and chemical configurations of the different groups were found to have a considerable effect on simulated O3 levels. Model performance was strongly influenced from the boundary conditions, especially during autumn and winter. Regarding particulate matter 2.5 µm or less in diameter (PM2.5) concentrations, large overestimations over Europe were reported (Im et al., 2015a). Tuccella et al. (2012) compared WRF-Chem model output against ground-based observations over the European domain for the year 2007 with time-invariant boundary conditions. The model simulated temperature satisfactorily with a small negative bias, but wind speed was highly overpredicted. O3 daily maxima were underestimated, while mean O3 concentrations during spring (autumn) were underestimated (overestimated). Ritter et al. (2013) applied the model over a Swiss domain for 2 years on a 2 km horizontal resolution. The model reproduced well temperature and solar radiation, but failed to capture short-term peaks in pollutant concentrations for several days.
In the literature various gas-phase chemistry and aerosol mechanisms have shown different behaviour in terms of predicting the atmospheric concentrations of pollutants over specific regions. Gupta and Mohan (2015) compared the Carbon Bond Mechanism (CBM-Z) and the Regional Atmospheric Chemical Model (RACM) gas-phase chemistry mechanisms over the mega city of Delhi, India, at a horizontal grid resolution of 10 km for the innermost model domain. Results showed that both mechanisms tend to overestimate O3 concentrations. It was noted that the use of a finer grid resolution may improve the overall model performance. Mar et al. (2016) evaluated the performance of the Regional Acid Deposition Model (RADM2) and MOZART-4 gas-phase chemistry mechanisms at a horizontal grid resolution of 45 km over Europe. Simulated O3 consecrations by MOZART-4 were found to be up to 20 µg m−3 higher than RADM2 during the summer due to a higher photochemical O3 production rate. On the other hand, RADM2 showed a negative bias for the whole year, while both mechanisms slightly underestimated nitrogen oxide (NOx) concentrations. Knote et al. (2014) performed box-model intercomparison of several formulations for tropospheric gas-phase chemistry under idealized meteorological conditions in the framework of the second phase of AQMEII. They found significant variabilities in the prediction of gaseous pollutants and key radicals and they highlight that the choice of gas-phase mechanism is a crucial component in modelling studies. Balzarini et al. (2015) showed that predicted total PM mass concentrations as well as aerosol subcomponents vary between the MADE/SORGAM and MOSAIC aerosol mechanisms. Differences were attributed to the approach each mechanism uses to simulate the aerosol size distribution (modal or sectional bin) and the gas-phase chemistry mechanisms these are coupled with in the WRF-Chem model since they affect the concentrations of aerosol precursors.
A very limited number of studies have dealt with online air quality modelling over the EMME region, with apparent limitations. Safieddine et al. (2014) employed the WRF-Chem model to study the tropospheric O3 over the Mediterranean during the summer season at a horizontal grid resolution of 50 km. The coarse model horizontal grid resolution was proposed by the authors as a possible reason for model biases in their study. Other studies in the region that utilize coupled meteorological and chemistry models are usually short term. For example, Bossioli et al. (2016) carried out WRF-Chem simulations for a limited time period focusing on the contribution of biomass burning on PM levels. However they reported an increase in O3 levels by 50 % when boundary conditions from the MOZART-4 global model were used. Kushta et al. (2014) highlighted the importance of natural aerosols when simulating the photochemical state of the atmosphere during a dust episode in April 2004.
In this study we employ and intercompare three coupled gas-phase chemistry and aerosol mechanisms to study the long-range transport of air pollutants and the intense photochemical activity over the eastern Mediterranean with focus on the island of Cyprus, over the summer period, using high temporal and spatial resolution down to 4 km. During July 2014, the CYprus PHotochemical EXperiment (CYPHEX) campaign took place near Ineia, Paphos, a background measurement site on the western coast of Cyprus, to investigate the photochemistry and air mass transport of the eastern Mediterranean, providing us with an extensive observation data set.
The paper is structured as follows. In Sect. 2 we briefly describe the three gas-phase chemistry and aerosol mechanisms used in the simulations, the basic model configuration including the model domains, the common parameterizations and the emission data used. In Sect. 3 we present the results from sensitivity tests dealing with the effects of boundary conditions on the concentrations of gas-phase pollutants and aerosols (Sect. 3.1). We examine the ability of the model to predict the basic meteorological parameters (Sect. 3.2), the concentrations of gas-phase pollutants (Sect. 3.3) and fine particulate matter (Sect. 3.4). Our conclusions are given in Sect. 4.
2.1 Gas-phase chemistry and aerosol mechanisms
The Weather Research and Forecasting (WRF) model is a state-of-the-art regional meteorological model. Various gas-phase chemistry and aerosol mechanisms have been implemented into the WRF model, creating the online WRF-Chem model (Grell et al., 2005). In this study, we employ WRF-Chem version 3.61 with three widely used gas-phase chemistry and two aerosol mechanisms to simulate air quality over the eastern Mediterranean:
- CBMZ-MOSAIC (CM)
-
The lumped CBM-Z chemical mechanism (Zaveri and Peters, 1999) is based on the Carbon Bond Mechanism (CBM-IV) developed by Gery et al. (1989). The Carbon Bond Mechanism includes 73 chemical species and 237 reactions. CBM-Z is coupled with the Model for Simulating Aerosol Interactions and Chemistry (MOSAIC) developed by Zaveri et al. (2008). MOSAIC uses a sectional bin approach for the representation of the aerosol size distribution. In the WRF-Chem model the user can choose between four and eight size bins which are defined by their lower and upper dry particle diameters. In both cases, only one bin is dedicated to aerosols with diameter between 2.5 and 10 µm. Therefore, when four aerosol bins are used, three bins are dedicated to aerosols less than 2.5 µm in diameter, and when eight aerosol bins are used, seven bins are dedicated to aerosols with diameters within this range. Since this study focuses on the total PM2.5 mass concentrations and not on detailed aerosol microphysics or effects on clouds, it is sufficient to use the four-bin option to reduce computational complexity.
- MOZART-MOSAIC (MM)
-
The MOZART gas chemical mechanism, developed by Emmons et al. (2010), is also used coupled with the MOSAIC aerosol scheme. It includes 85 chemical species and 196 reactions and is consistent with the chemistry used in the global model that provides the chemical boundary conditions for our simulations. The MOZART mechanism has been widely used with WRF-Chem for simulations outside Europe, but only a limited number of studies have applied it over the European domain.
- RADM2-MADE/SORGAM (RMS)
-
The second generation Regional Acid Deposition Model (RADM2) chemical mechanism for regional air quality modelling (Stockwell et al., 1990) includes 59 chemical species and 157 reactions. RADM2 is a widely used mechanism over the European domain and it is coupled with the Modal Aerosol Dynamics for Europe (MADE) (Ackermann et al., 1998). MADE uses a modal approach for aerosol treatment and is coupled with the Secondary Organic Aerosol Model (SORGAM) (Schell et al., 2001). SORGAM is capable of simulating secondary organic aerosol (SOA) formation including the production of low-volatility products and their subsequent gas–particle partitioning.
2.2 Model configuration
All our simulations are conducted with the same model physics configuration (Table 1) to facilitate intercomparison. We modified the WRF-Chem v3.6.1 code to take into account dust particles in the accumulation size mode (0.1 µg m−3 ≤ particle size ≤ 2.5 µg m−3) for the calculation of the total PM mass concentration in the RMS mechanism. Three nested domains are used, as shown in Fig. 1a. The outermost domain (d1) with a horizontal grid resolution of 80 km extends from 16 to 4∘ N and from 10∘ W to 50∘ E in order to include a large part of Europe and the Black Sea region, which have a significant contribution to the pollution of air masses that reach the EMME region, as well as a large part of the Sahara and Middle Eastern deserts in order to utilize the dust emission schemes included in the WRF-Chem model. The second domain (d2) with a horizontal grid resolution of 16 km is located over the Levantine Basin, including all the surrounding major urban centres. The third innermost domain (d3) is located over the island of Cyprus (Fig. 1b) with a horizontal grid resolution of 4 km, allowing for a more accurate representation of the state of the atmosphere over the complex terrain of the island close to the surface observation stations. The WRF-Chem model uses a terrain-following hydrostatic-pressure vertical coordinate system. In our study 29 layers are used from the surface up to 50 hPa. The first layer on average extends to a height of 70 m. Control experiments that were conducted during the model set-up showed that increasing the number of vertical layers (in the lowest 70 m or throughout the vertical extent of the atmosphere) does not significantly alter the concentrations of pollutants near the surface, at the station locations, due to mixing within the boundary layer.
(Morrison et al., 2005)(Grell, 1993, 2002)(Chen and Dudhia, 2001)(Mlawer et al., 1997)(Hong et al., 2006)(Mlawer et al., 1997)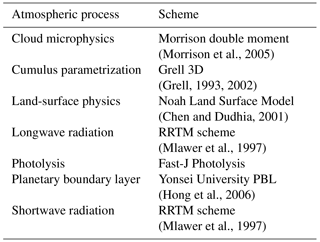

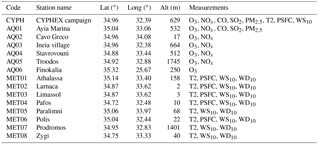
Figure 1Model simulation domains, terrain elevation, mean wind direction at 850 hPa for July 2014, and the location of the Finokalia station (a) and meteorological stations (squares), air pollution stations (circles), CYPHEX campaign (star), and mean night-time (red vectors) and mean daytime (green vectors) wind direction at 10 m (b). Monitoring station details are shown in Table 2.
Meteorological initial and boundary conditions are provided by the Global Forecast System (GFS) at a horizontal grid resolution of . Time-variant chemical boundary conditions are provided from the global Model for OZone And Related chemical Tracers (MOZART-4; Emmons et al., 2010). The MOZART-4 model output datasets are available at a horizontal grid resolution of and interpolated in space every 6 h to our model domain and the chemical species of each mechanism. Biogenic emissions are calculated online by the the Model of Emissions of Gases and Aerosols from Nature version 2.1 (MEGAN2.1) by Guenther et al. (2012). We use the Air Force Weather Agency (AFWA) dust scheme that was developed based on the Marticorena and Bergametti (1995) dust emission scheme in the Goddard Global Ozone Chemistry Aerosol Radiation and Transport (GOCART) model (Chin et al., 2000). The EDGAR-HTAP (Emission Database for Global Atmos. Res. for Hemispheric Transport of Air Pollution) Version 2, compiled by the European Commission, Joint Research Center (JRC)/Netherlands Environmental Assessment Agency (LRTAP-Wiki, 2014) is utilized. This dataset includes emissions of gaseous pollutants such as sulfur dioxide (SO2), NOx, CO, non-methane volatile organic compounds (NMVOCs) and ammonia (NH3) and particulate matter with carbonaceous speciation (PM10; PM2.5; black carbon, BC; and organic carbon, OC) from anthropogenic and biomass burning sectors (Janssens-Maenhout et al., 2012). PM2.5 is a subset of PM10 and includes BC, OC, , , crustal material, metal, and other dust particles. The dataset used in this study is available in 0.1∘ × 0.1∘ emission grid maps for the year 2010 and can be downloaded from the EDGAR JRC website per year, per substance, and per sector. Anthropogenic emissions were interpolated in space and time to produce daily emissions using the anthro_emiss utility (Kumar, 2017).
2.3 Observational data
The model output is compared against observational data from a dense station network which spans the island of Cyprus and covers a large variety of monitoring sites, including seaside and mountainous areas. Specifically, the modelled meteorology is compared against meteorological hourly observations from eight ground stations operated by the Cyprus Department of Meteorology (Fig. 1, squares), and meteorological data from the CYPHEX campaign, which took place from 7 to 31 July 2014, near the village of Ineia (Fig. 1, star). Modelled pollutant concentrations are compared against observational data from five background air quality monitoring ground stations operated by the Cyprus Department of Labour Inspection – DLI (Fig. 1, circles) and data from the CYPHEX campaign. The Finokalia station in Crete, which is part of the European Monitoring and Evaluation Programme (EMEP) network, is used as a reference station to discuss O3 discrepancies on measurements over Cyprus. The frequency of all air pollutant concentrations measurements is hourly, except for PM2.5 concentrations measurements by the CYPHEX campaign, which are provided every 6 h. The location of the air pollution and meteorology monitoring stations and the measurements carried out at each station are given in detail in Table 2.
3.1 Boundary condition sensitivity tests
Previous studies have shown that lateral boundary conditions affect the modelled near-surface O3 concentrations. Akritidis et al. (2013) highlighted the importance of time variant chemical boundary conditions on O3 concentrations over Europe. Kushta et al. (2017) (accepted for publication) showed that chemical boundary conditions from the MOZART-4 global model have an important effect on the modelled concentrations over the region of study. More specifically, in their study, an important O3 overestimation by the WRF-Chem model was attributed to the effect of chemical boundary conditions. When the O3 inflow from the boundaries was reduced by 30 %, model results were closer to observations. Based on these results and the MOZART-4 model evaluation (Emmons et al., 2010), O3 inflow from the global model was reduced by 30 % in our study. Figure 2a shows the observed O3 concentrations at the five air quality stations and the CYPHEX campaign and the modelled concentrations from (a) the base run using the RMS mechanism (blue) and (b) a simulation where initial O3 concentrations and O3 inflow from the global model were reduced by 30 % (red). The average NMB decreased from 21 to 9 % when O3 from the global model was reduced. Similar results appear at the Finokalia background station, where NMB was reduced from 18 to 7 % when O3 inflow from the global model was reduced by 30 %. The results for the CM and MM mechanisms are analogous. O3 overestimation due to the effect of boundary conditions from the MOZART-4 model was also reported by Abdallah et al. (2016). In their study, the Polyphemus chemical transport model was found to highly overestimate O3 concentrations over Lebanon when using boundary conditions from the MOZART-4 model. Bossioli et al. (2016) also reported a significant contribution of boundary conditions over the O3 levels in the area. Therefore, O3 from the global model was reduced by 30 % for the simulations of this study.
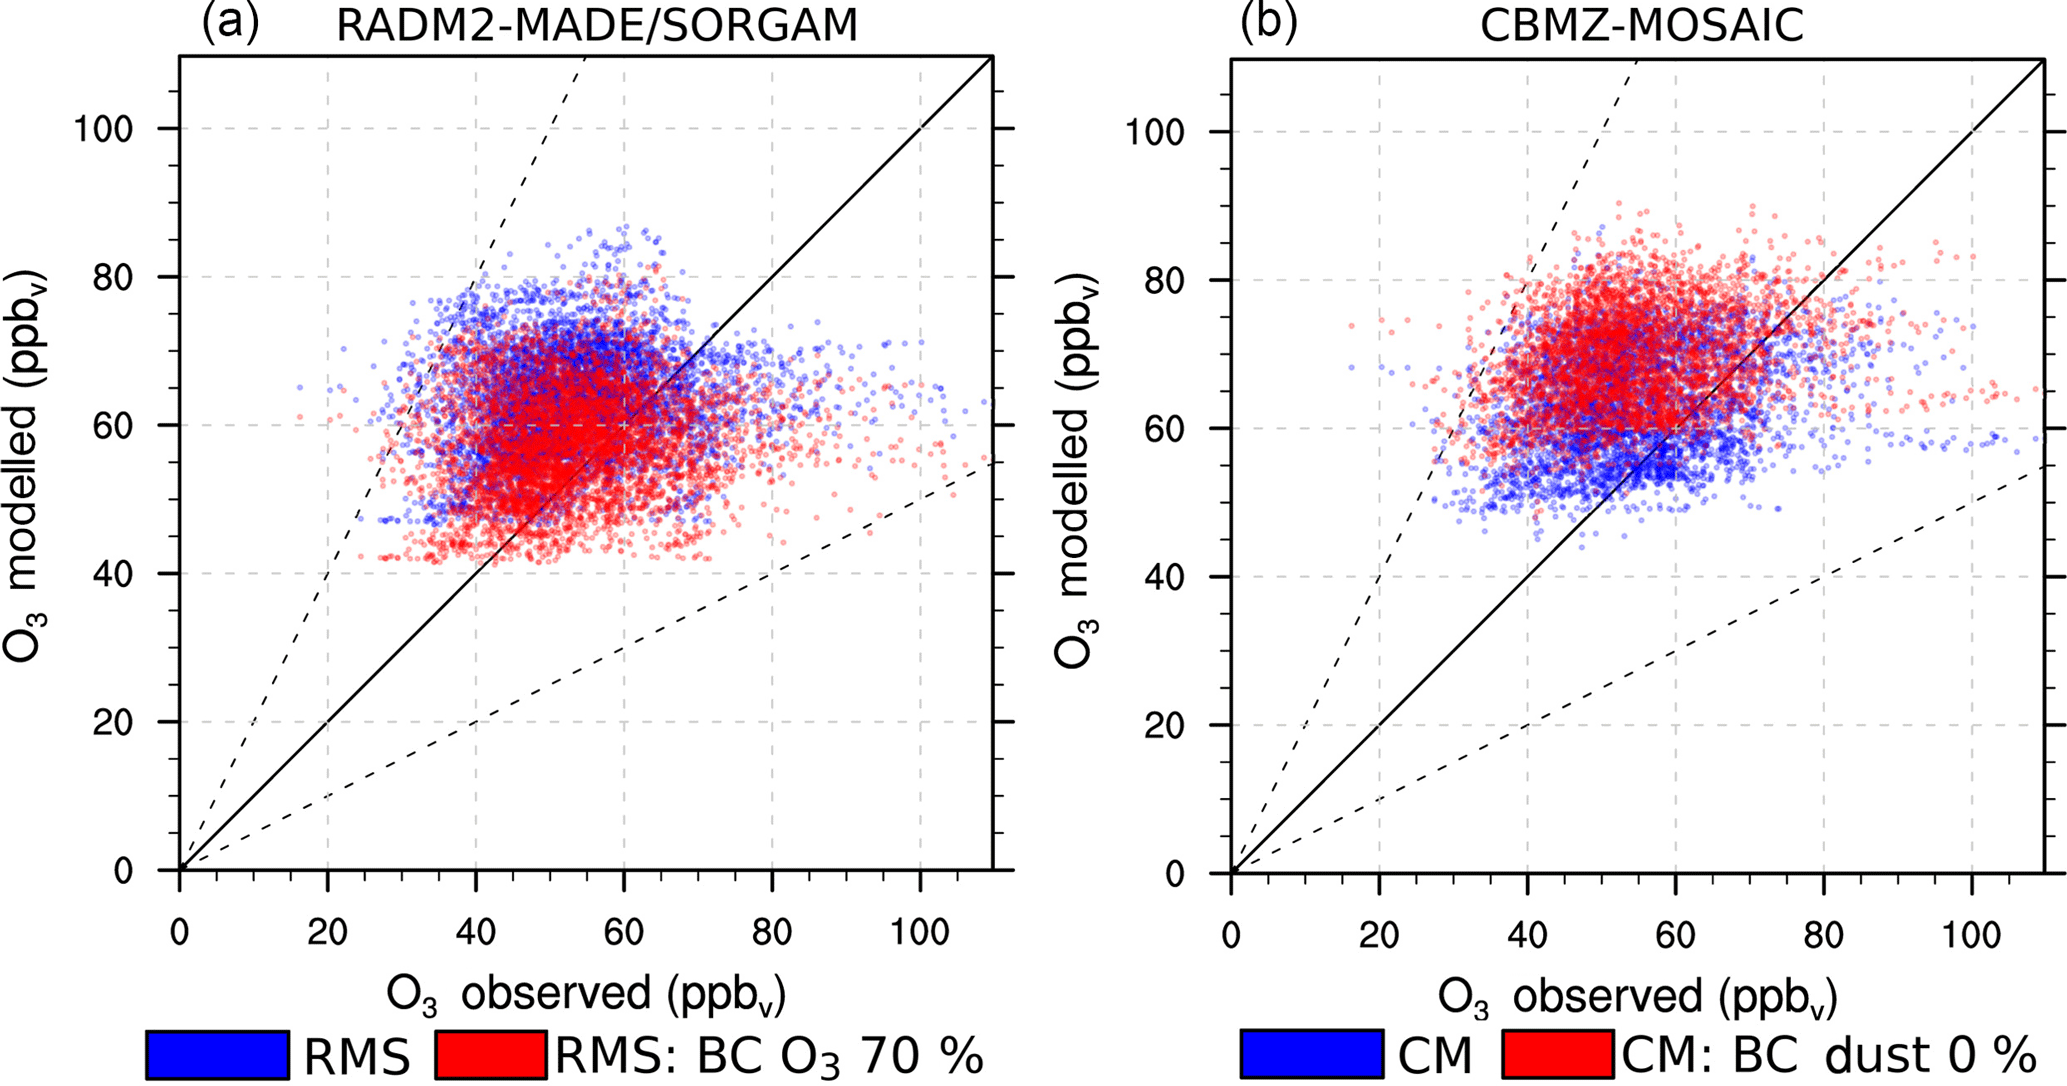
Figure 2O3 observed and modelled concentrations using the RADM2 chemical mechanism with 100 % (blue markers) and 70 % (red markers) O3 inflow from MOZART-4 (a), and O3 observed and modelled concentrations using the CBMZ chemical mechanism with (blue markers) and without (red markers) dust influx from MOZART-4 (b).
Since dust is an important parameter of air quality in the region of study and important dust sources are not included in our outermost domain, dust inflow from the global model was taken into account in our simulations. The effect of dust from the boundaries by the MOZART-4 on the WRF-Chem PM2.5 concentrations is examined. In the CM mechanism much higher PM2.5 concentrations than those observed occur between 11 and 13 July. To investigate this discrepancy we performed two CM simulations (Fig. 3) with (continuous blue line) and without (dashed blue line) dust influx from the boundaries.
Incoming dust results in an increase of the order of 19 % in PM2.5 modelled concentrations during the whole study period. This increase is more pronounced from 11 to 13 July (40 %). Dust presence also influences O3 concentrations though aerosol–radiation feedbacks and their impact on photolysis rates. Figure 2b shows the observed and modelled O3 concentrations with (blue markers) and without (red markers) dust influx from the global model. The inclusion of dust particles results in a decrease of 10 % in modelled O3 concentrations due to changes in solar radiation through aerosol–radiation interactions.
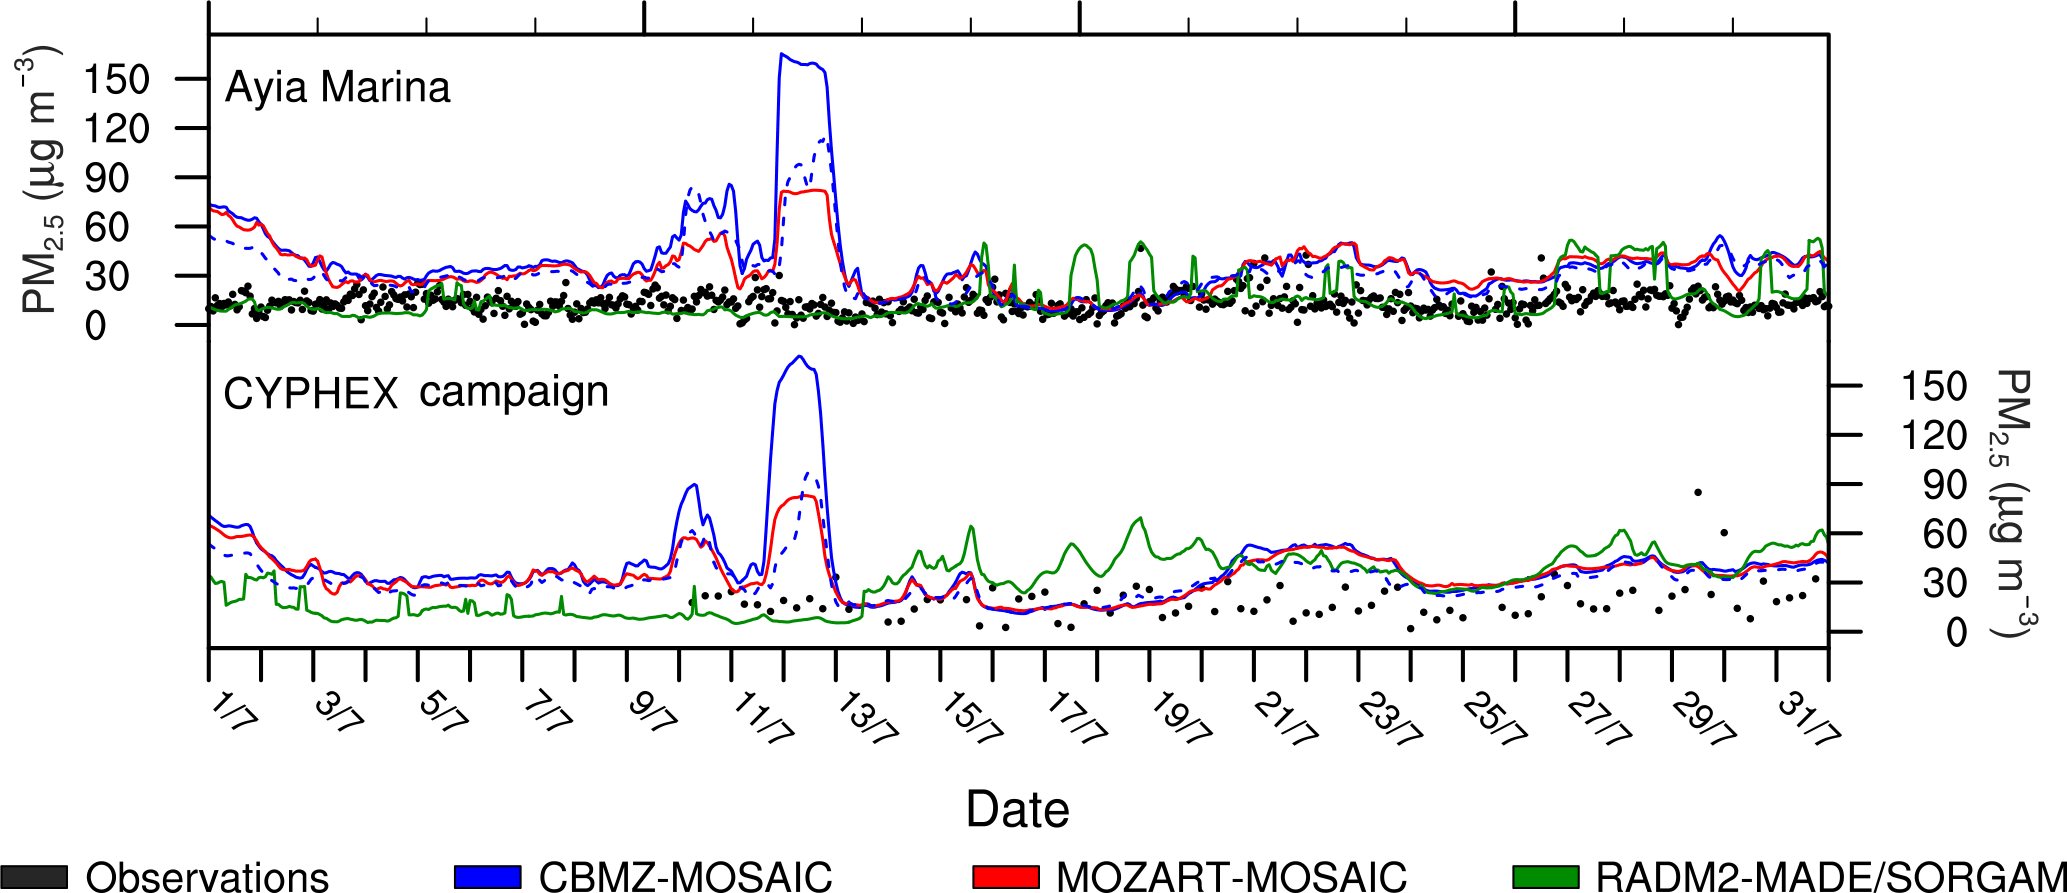
Figure 3Observed (black markers) and modelled PM2.5 concentrations from the CM (blue line), MM (red line), and RMS (green line) mechanisms. The dashed blue line represents the CM simulation without dust influx from the global model. All model simulation output and observations are given in hourly resolution, expect for the CYPHEX campaign measurements, which are provided in 6-hourly resolution.
The comparison of model to station data is performed using the first free model layer. The actual altitude of four stations, located in regions with very complex terrain, was found to differ from the model terrain height (CYPHEX campaign, Ineia village, Troodos air quality monitoring station, and the nearby Prodromos meteorological station). As a test, we performed the comparison using modelled concentrations taking into account the actual altitude of the stations. This resulted only in a slightly better agreement in the predicted surface pressure at the CYPHEX campaign and the Prodromos station. Results in all other locations were not influenced because of the mixing within the model boundary layer.
3.2 Meteorology
We evaluate the model performance regarding basic meteorological parameters. Statistical metrics are derived by comparing the output of the three model simulations to hourly measurements at ground stations. Pearson's correlation coefficient (R), mean bias (MB), normalized mean bias (NMB), and root mean squared error (RMSE) for temperature at 2 m (T2 m), wind speed at 10 m (WS10 m), and surface pressure (Psurf) averaged over all stations are shown on Table 3. Meteorology statistical metrics for individual stations can be found in the Supplement (Table S1). Modelled T2 m is in good agreement with observations (NMB = 2 to 3 %) with similar RSME values (2.72 to 2.78 ∘C) for all three mechanisms. The diurnal cycle of T2 m is reproduced at the majority of the stations (R∼0.66). The model though does not capture the T2 m diurnal variability at the Larnaca meteorological station (R<0.20). The station is very close to the sea and the Larnaca Salt Lake, which might influence the thermal circulation in the area.
The model tends to overestimate WS10 m at the majority of the stations by an average of 1.71 to 1.83 m s−1 (R ∼ 0.46) for all three mechanisms. Mar et al. (2016) and Zhang et al. (2013) also reported WS10 m overpredictions by the WRF model over the Mediterranean. The latter study attributed this model behaviour to the poor representation of surface drag exerted by the unresolved topography (mountains, hills and valleys) and other smaller scale terrain features.
Local circulation is successfully predicted by the model. Figure 1a shows the average 10 m wind direction from 12:00 to 17:00 LST in green and from 00:00 to 05:00 LST in red. The model simulates sea breezes during daytime and katabatic winds during the night in agreement with observations. The wind roses at the Athalassa station from the observational data (Fig. 4a top left panel) and the three simulations show that wind direction is reproduced quite well by the model (Fig. 4). The inland dominating wind direction is mainly westerly and north-westerly with frequency of occurrence 60 and 20 % respectively. Similar results appear for the majority of the stations (not shown here). Some discrepancies between model and observations at the Prodromos station are attributed to the complex mountainous topography of the Troodos area. Both model simulations and observational data reveal predominant south-westerly winds at the southern coastline of the island during day and night. The summertime general circulation pattern over the eastern Mediterranean with predominant northerly and westerly winds, as well as the anticyclonic flow over western Africa (Fig. 1a), is also resembled by the model.
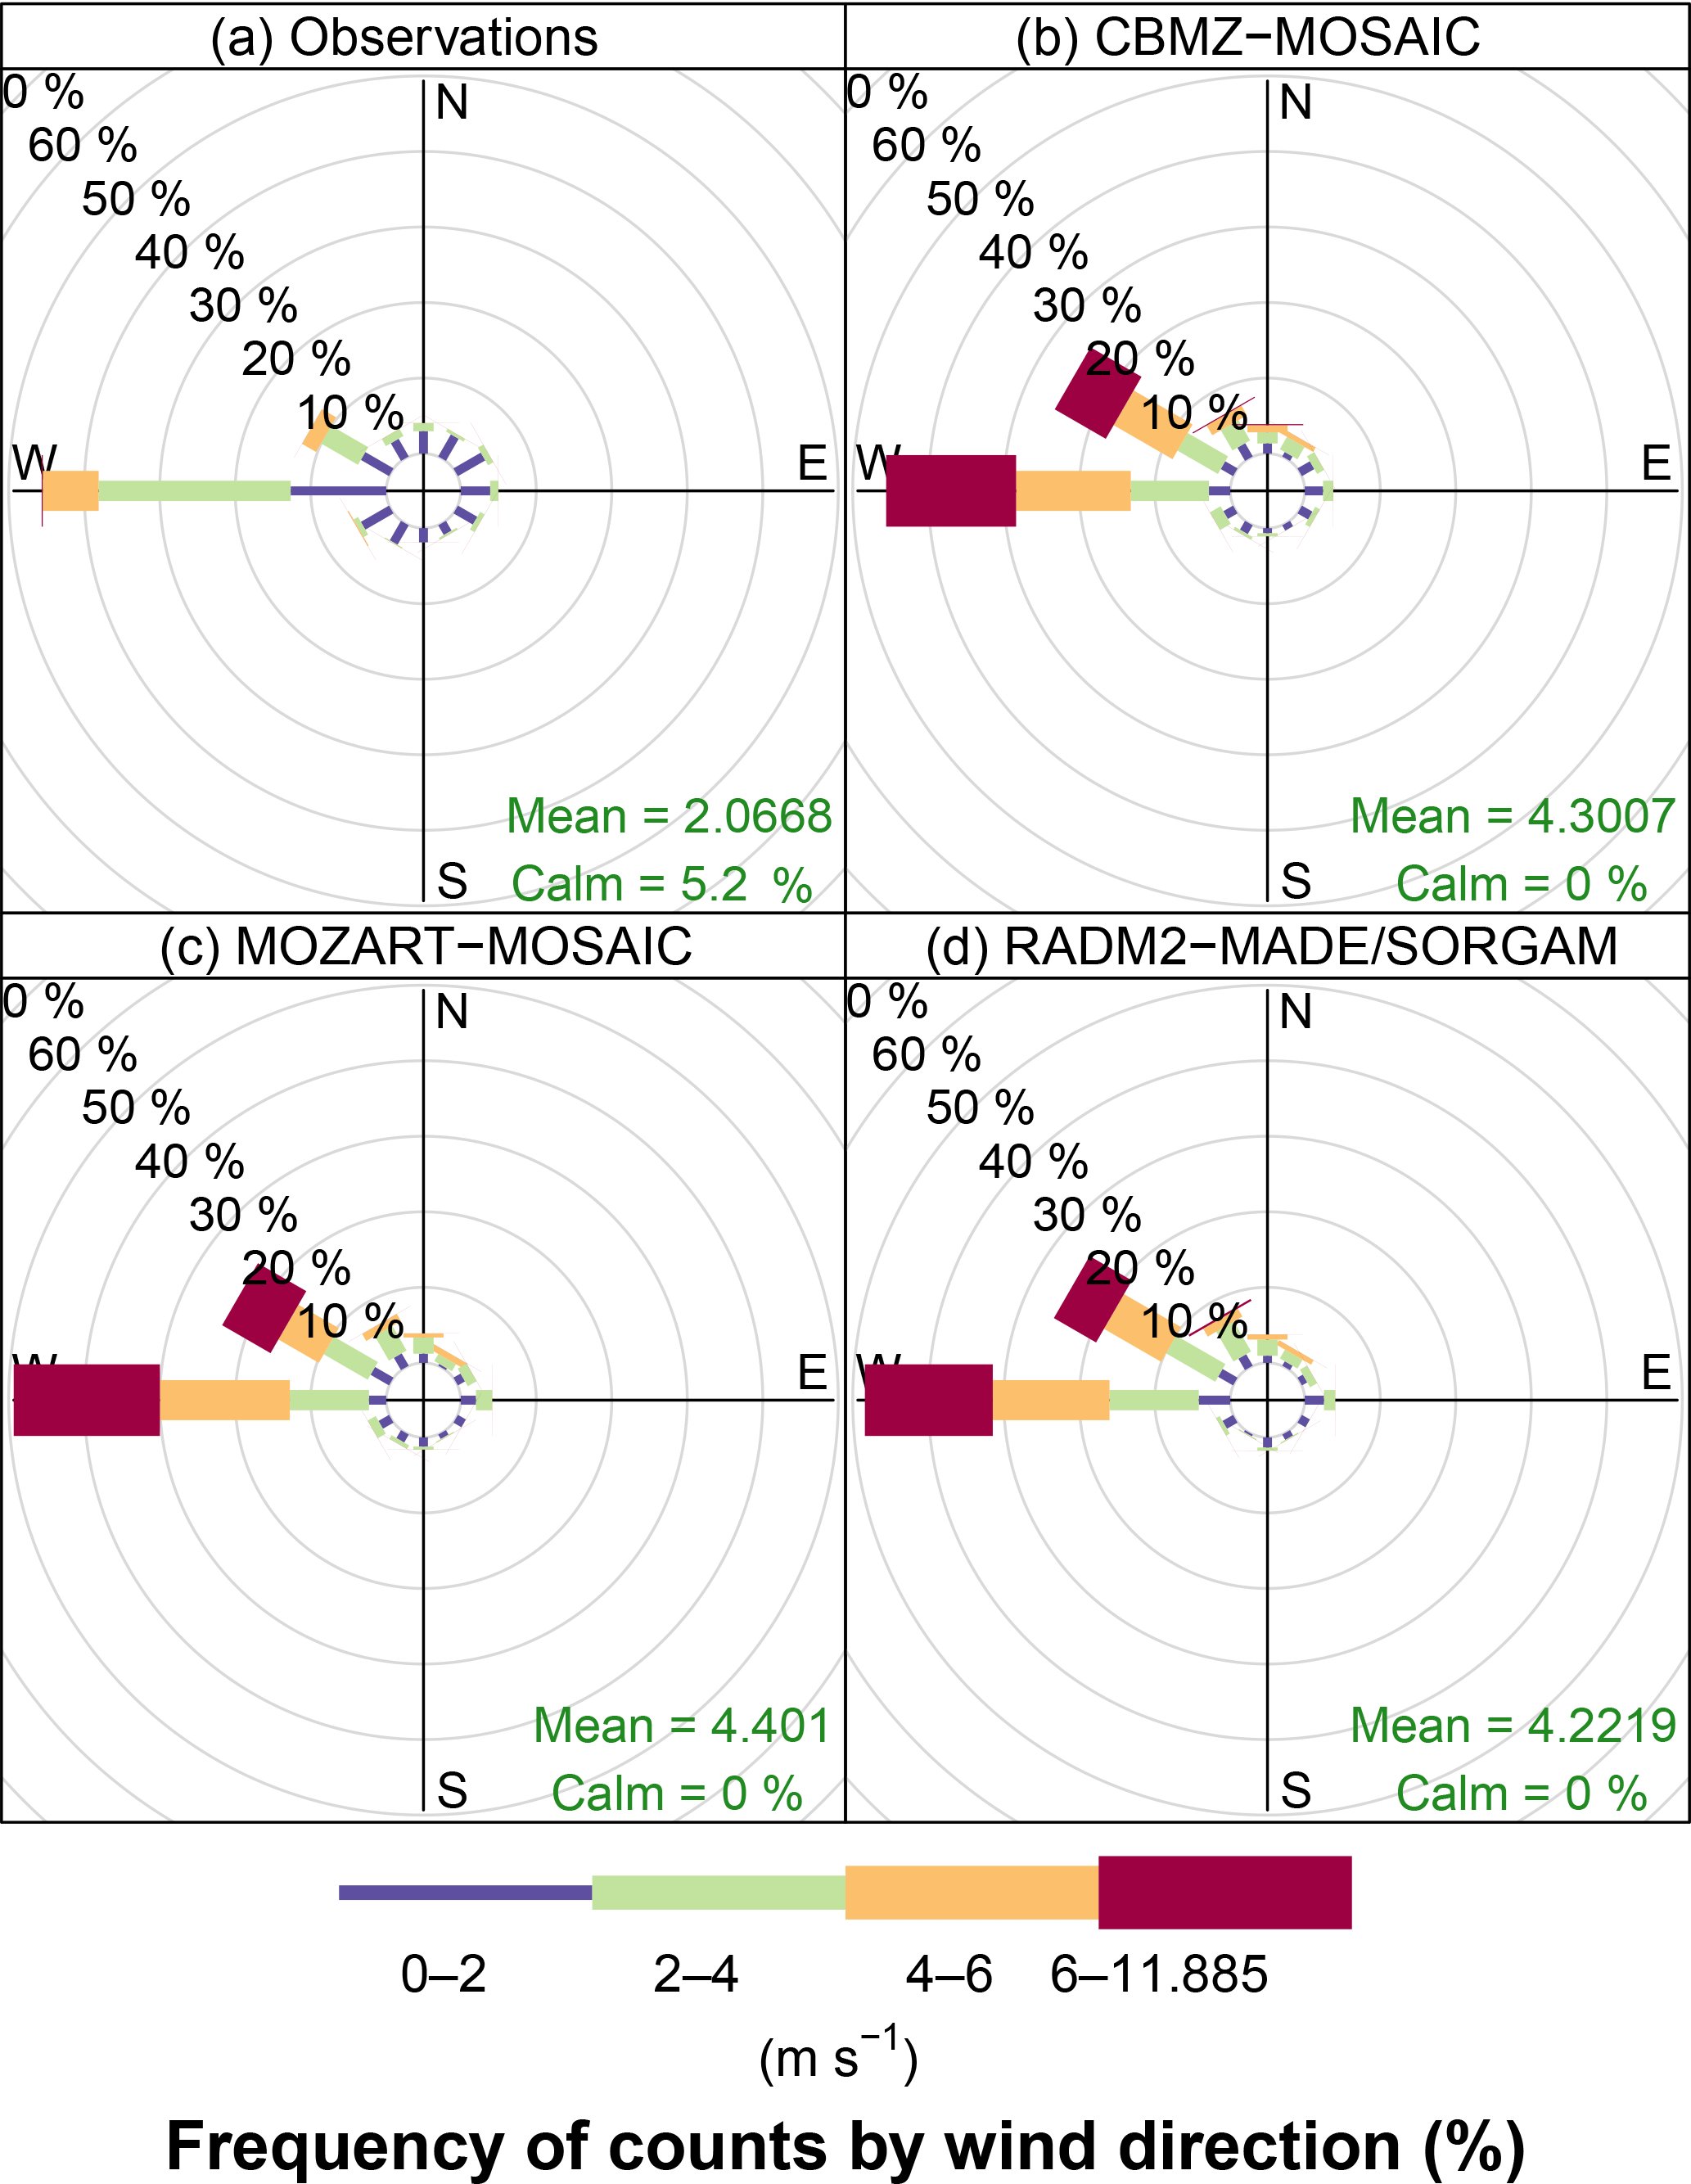
Figure 4Wind roses (monthly mean wind speed and direction at 10 m) at the Athalassa meteorological station (a), and from the CM (b), MM (c), and RMS (d) simulations.
There is very good agreement between observed and modelled Psurf with high hourly correlation coefficients (R≥0.87) and normalized mean bias of 1 %. Some negligible discrepancies exist between the three mechanisms. The differences in the meteorological components are attributed to the inclusion of the aerosol–radiation feedbacks in the simulations. The model performance regarding aerosol concentrations is discussed later in the paper.
Table 3Pearson's correlation coefficient (R), mean bias (MB), normalized mean bias (NMB), and root mean squared error (RMSE) of hourly values of temperature at 2 m, wind speed at 10 m, and surface pressure for the CBMZ-MOSAIC (CM), MOZART-MOSAIC (MM), and RADM2-MADE/SORGAM (RMS) mechanisms, averaged over all stations, with O3 inflow (reduced by 30 %), and dust inflow from the boundaries. Hourly data availability exceeds 90 % at all stations.
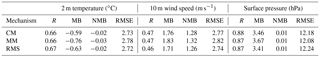
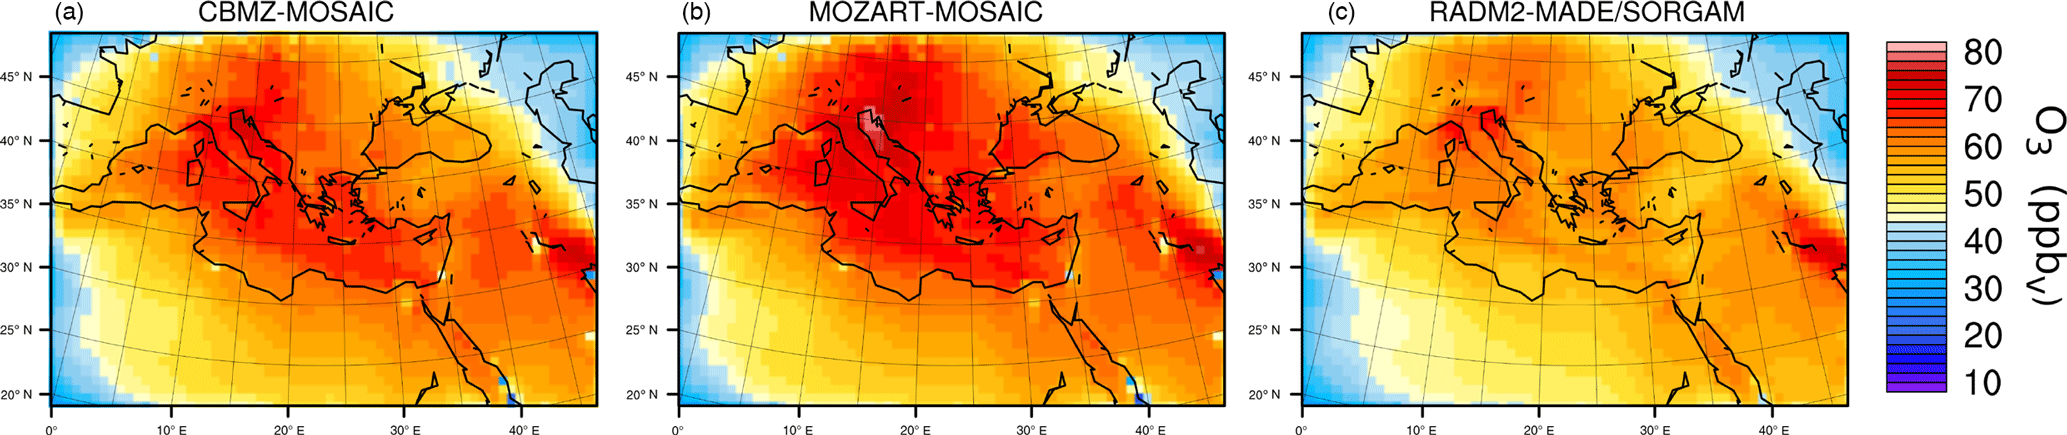
Figure 5O3 monthly average ground-level concentrations for CM (a), MM (b), and RMS (c) mechanisms.
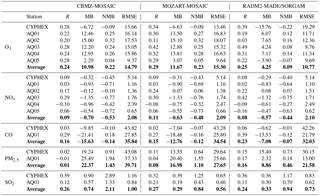
Table 4Pearson's correlation coefficient (R), mean bias (MB), normalized mean bias (NMB), and root mean squared error (RMSE) of hourly values of O3, NOx, CO, PM2.5, and SO2 for the CBMZ-MOSAIC (CM), MOZART-MOSAIC (MM), and RADM2-MADE/SORGAM (RMS) mechanisms, with O3 inflow (reduced by 30 %), and dust inflow from the boundaries. Average metrics over all stations are shown in bold. The CYPHEX campaign was excluded from the monthly mean calculations for O3. Hourly data availability exceeds 90 % at all stations except the Ineia station (> 72 %) and from the CYPHEX campaign (> 82 %).
3.3 Main gaseous pollutants
Observed average monthly O3 concentrations for July 2014 fall within the climatological averaged summer values given by Kleanthous et al. (2014). In their study, July monthly means of O3 concentrations over a period of 15 years were found to be 54.3 ± 4.7 ppbV over all stations. The mean observed value during our simulation period at the DLI stations is 52 ppbV. The mean modelled values vary from 56.2 ppbV (NMB = 9 %) in the RMS mechanism to 63 ppbV (NMB = 22 %) and 65.2 ppbV (NMB = 23 %) in the CM and MM mechanism respectively, showing a strong overestimation of the latter two. Figure 5 shows the average O3 ground-level modelled concentrations for the three mechanisms for the outermost domain (Europe – Mediterranean and North Africa). Differences between the three mechanisms are more pronounced over southern Europe and the Mediterranean. Over these regions O3 concentrations predicted by the MM mechanisms are up to 10 and 20 ppbV higher compared to the CM and RMS mechanisms respectively.
The CYPHEX campaign station has been excluded from the analysis of O3. This station gives significantly higher average monthly O3 concentration (71.40 ppbV) that deviates from the climatological and observed mean, even though the station of the campaign was located only a few hundred metres away from the Ineia site of DLI (51.93 ppbV). A direct comparison between these two stations is shown on Fig. S1 in the Supplement. We further investigated this deviation by comparing with the mean monthly O3 for July 2014 at the Finokalia station (from the European Monitoring and Evaluation Programme – EMEP), which reaches 52.43 ppbV. We choose Finokalia because it is located on the island of Crete (approximately 600 km west of Ineia) with no pollution sources in between (Fig. 1a, red star). Thus Ineia and Finokalia have similar pollution features, being subject to air mass transport from eastern Europe.
Table 4 shows the statistical performance of the three gas-phase and aerosol mechanisms against hourly observations from six ground stations. The CM and MM mechanisms significantly overestimate O3 concentrations with normalized mean biases of 22 and 23 % respectively. A normalized mean bias of 9 % appears for the RMS mechanism, which corresponds to 4.25 ppbV. This mechanism shows the lowest RMSE (10.77 ppbV) compared to CM and MM (14.79 and 15.30 ppbV respectively), which is a significant improvement compared to the global MOZART-4 model (NMB = 37 %, RMSE = 20.96 ppbV). A further improvement of the order of 3 % is shown when moving from the coarse to the finer WRF-Chem domain on O3 concentrations (Supplement Table S2, Fig. S4).
Air quality modelling studies over the eastern Mediterranean in the literature focus on O3. During the second phase of the Air Quality Model Evaluation International Initiative (AQMEII), the majority of the modelling groups using the RMS and CM mechanisms with the WRF-Chem model also reported O3 concentrations overestimation over the eastern Mediterranean (Im et al., 2015a). However, Mar et al. (2016) reported an underestimation of about 5 ppbV on summertime O3 concentrations WRF-Chem model using the RMS mechanism.
Our sensitivity tests showed that high PM2.5 concentrations affect the O3 concentrations through the aerosol–radiation feedbacks by altering the radiation budget and as a consequence, the photochemical activity and the concentration of secondary pollutants. Specifically, when the dust inflow from the boundaries for the CM mechanism was not taken into account, O3 concentrations at the stations locations increased by 10 %. Since the CM mechanism shows the higher PM2.5 concentrations and relatively high O3 concentrations, we conclude that we can rule out the aerosol concentrations and therefore the different aerosol mechanisms, as the responsible factor for the differences in O3 concentrations between the three simulations. Knote et al. (2014) attributed the differences in pollutants concentrations between these mechanisms to the differences in the treatment of VOCs, since the rate constants for the basic O3 production and loss reactions are similar. Hourly correlation coefficients for O3 are low (less than 0.30) for all three mechanisms which is comparable to the findings of Mar et al. (2016). In their study, summertime O3 hourly correlation coefficients at the Ayia Marina station (AQ01) were close to 0.2. The low correlation coefficients for O3 in combination with underestimated NOx concentrations (NMB varies from −54 to −44 %) and low hourly correlation coefficients for NOx as well suggest that nearby anthropogenic emission sources are not represented in the emission inventory used in the simulations. The monthly average diurnal cycles for O3 and NOx (Figs. S2 and S3 respectively) show a weak diurnal cycle from observational data at the majority of the stations, indicating that long-range transport is an important aspect of air quality over Cyprus. A more pronounced diurnal cycle for NOx appears at the Stavrovouni station due to the fact that the station is located close to the highway.
The hourly modelled and observed O3 concentrations at six background stations over Cyprus are depicted in Fig. 6. The three mechanisms show similar behaviour for 1 to 13 July. However, from 13 July until the end of the month O3 concentrations from CM and MM appear slightly higher than RMS. The fact that such differences do not appear for O3 precursors NOx (Fig. 7) indicates that the different behaviour during this period is possibly due to aerosol–radiation interactions and changes in photolysis rates. Similar patterns appear for CO (Fig. 8). There is a good agreement between the three mechanisms from 1 to 13 July. The RMS mechanism gives higher CO concentrations for the rest of the simulation period. Due to the long CO atmospheric residence time, these differences can be attributed to long-range transport, and therefore the effect the three different gas-phase chemistry and aerosol mechanisms have on the predicted meteorology.
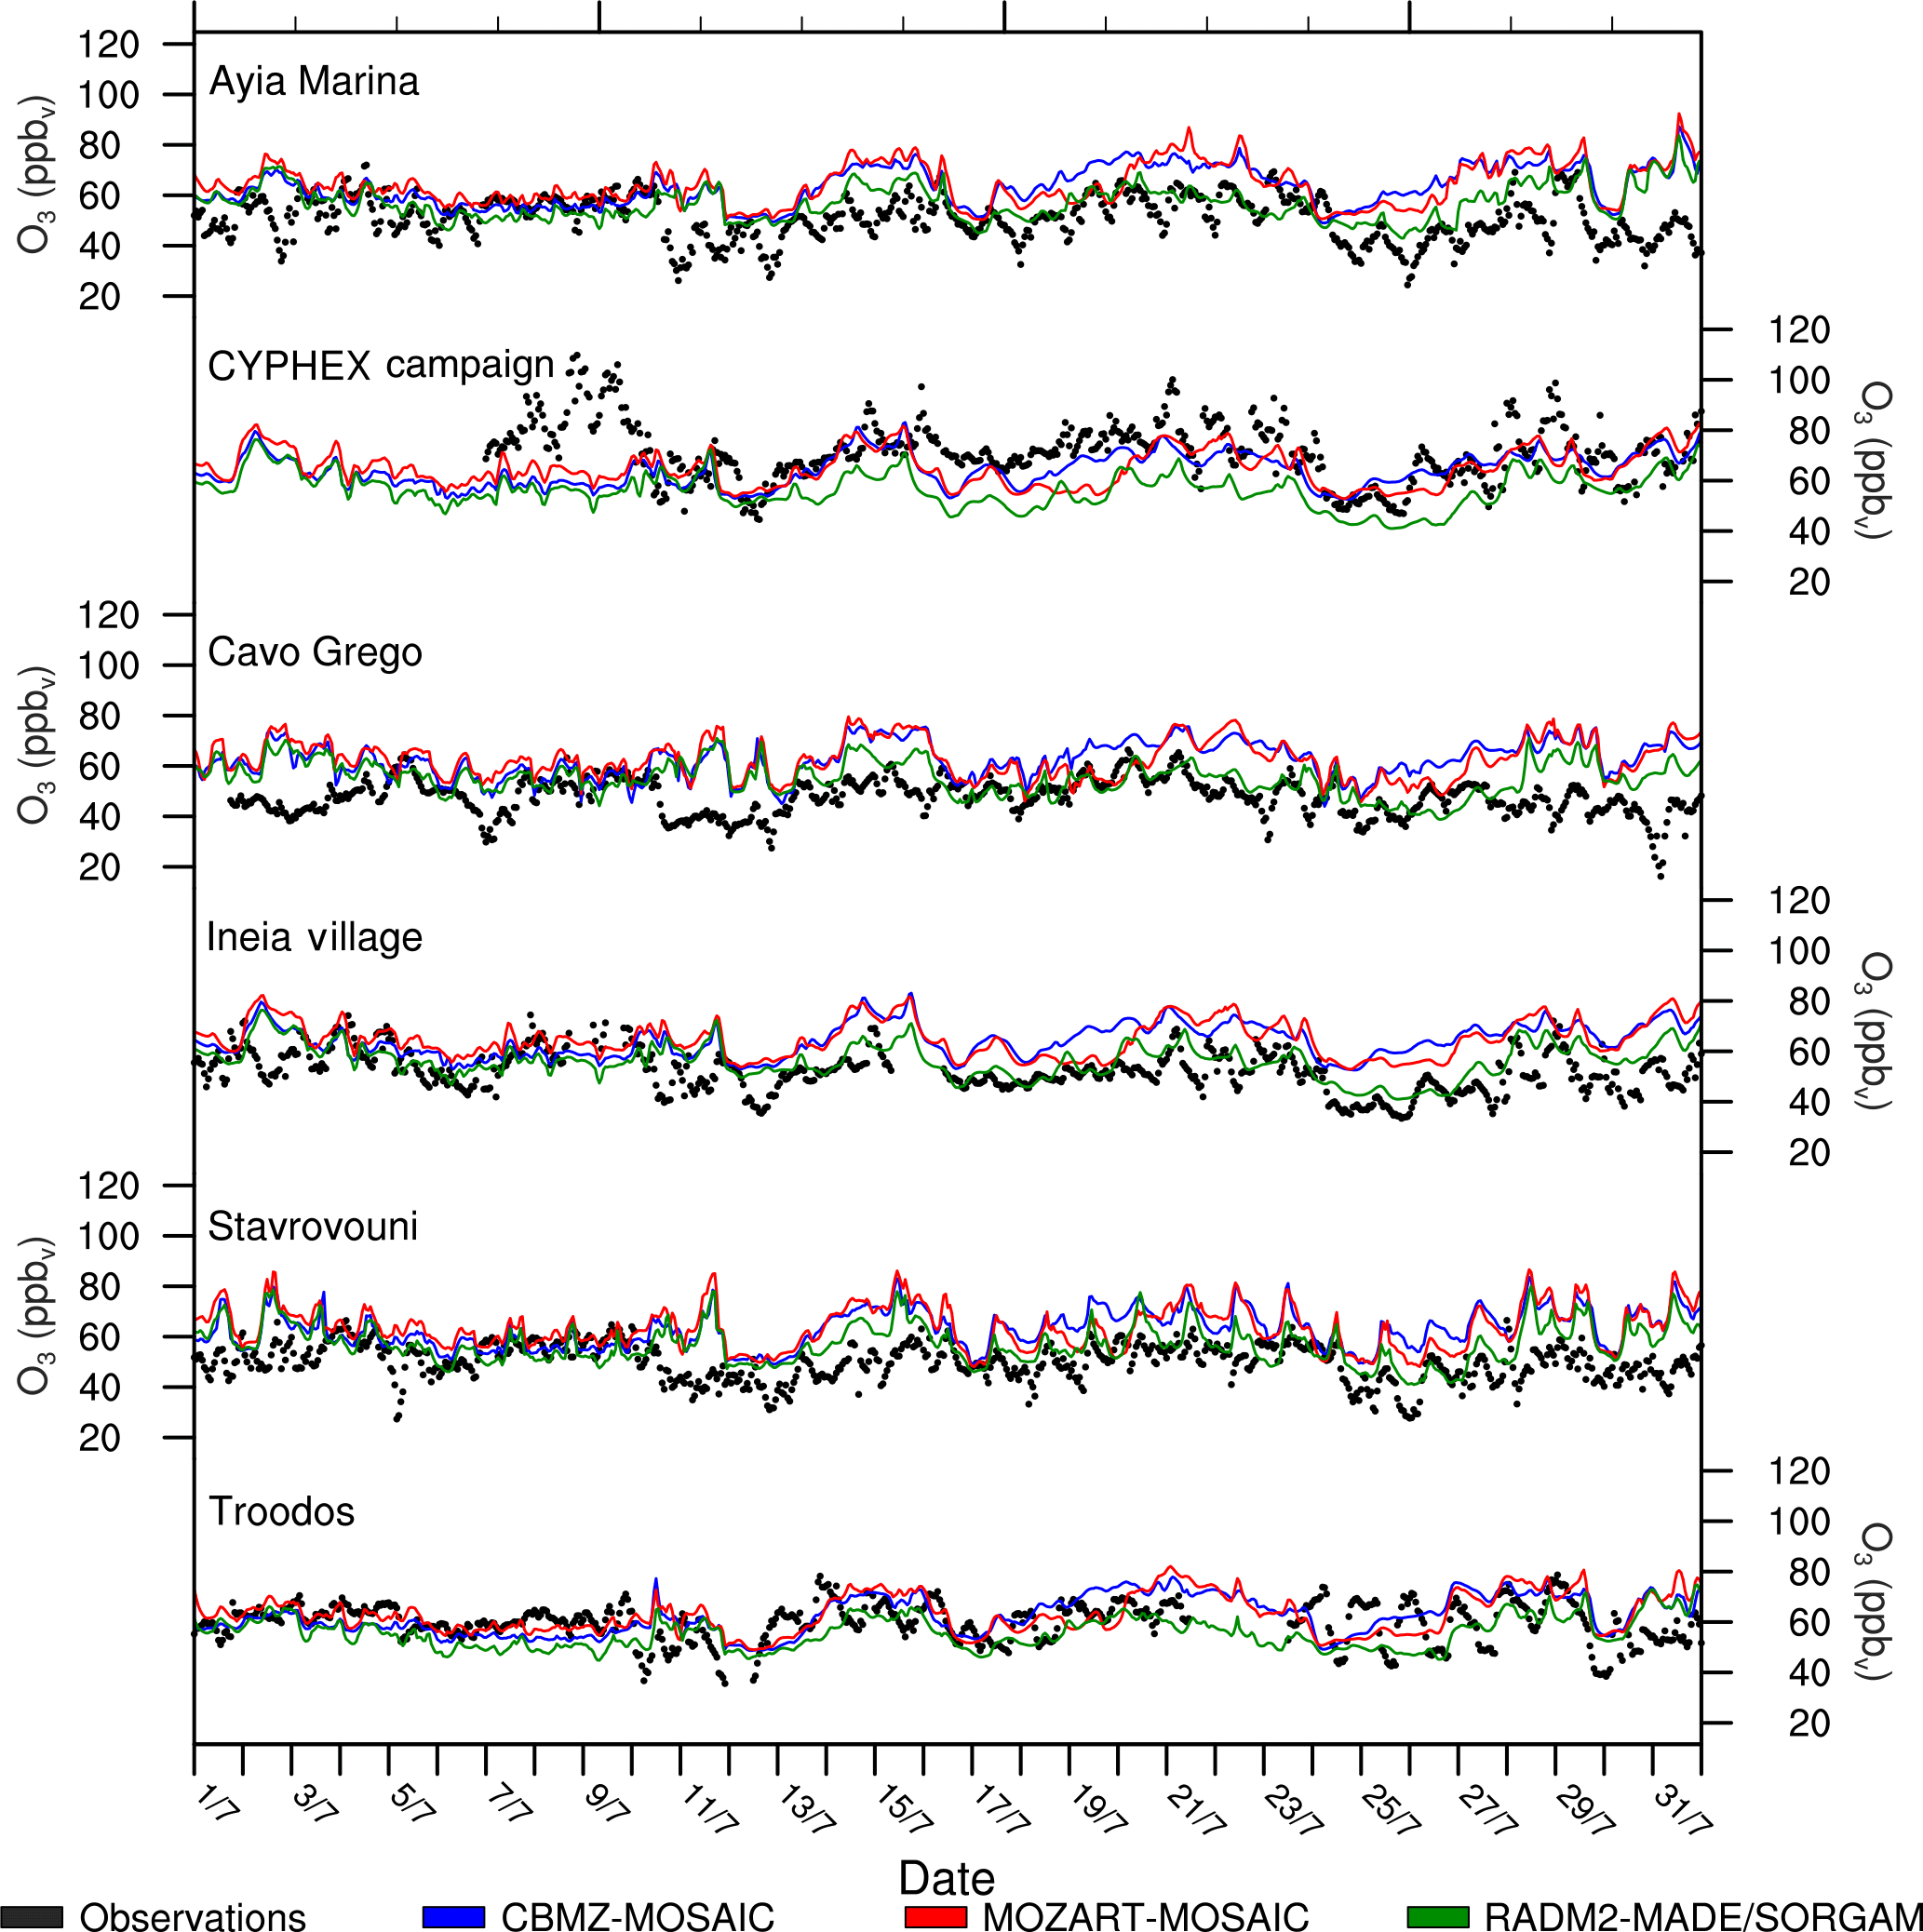
Figure 6Observed (black markers) and modelled O3 concentrations from the CBMZ-MOSAIC (blue line), MOZART-MOSAIC (red line), and RADM2-MADE/SORGAM (green line) mechanisms.
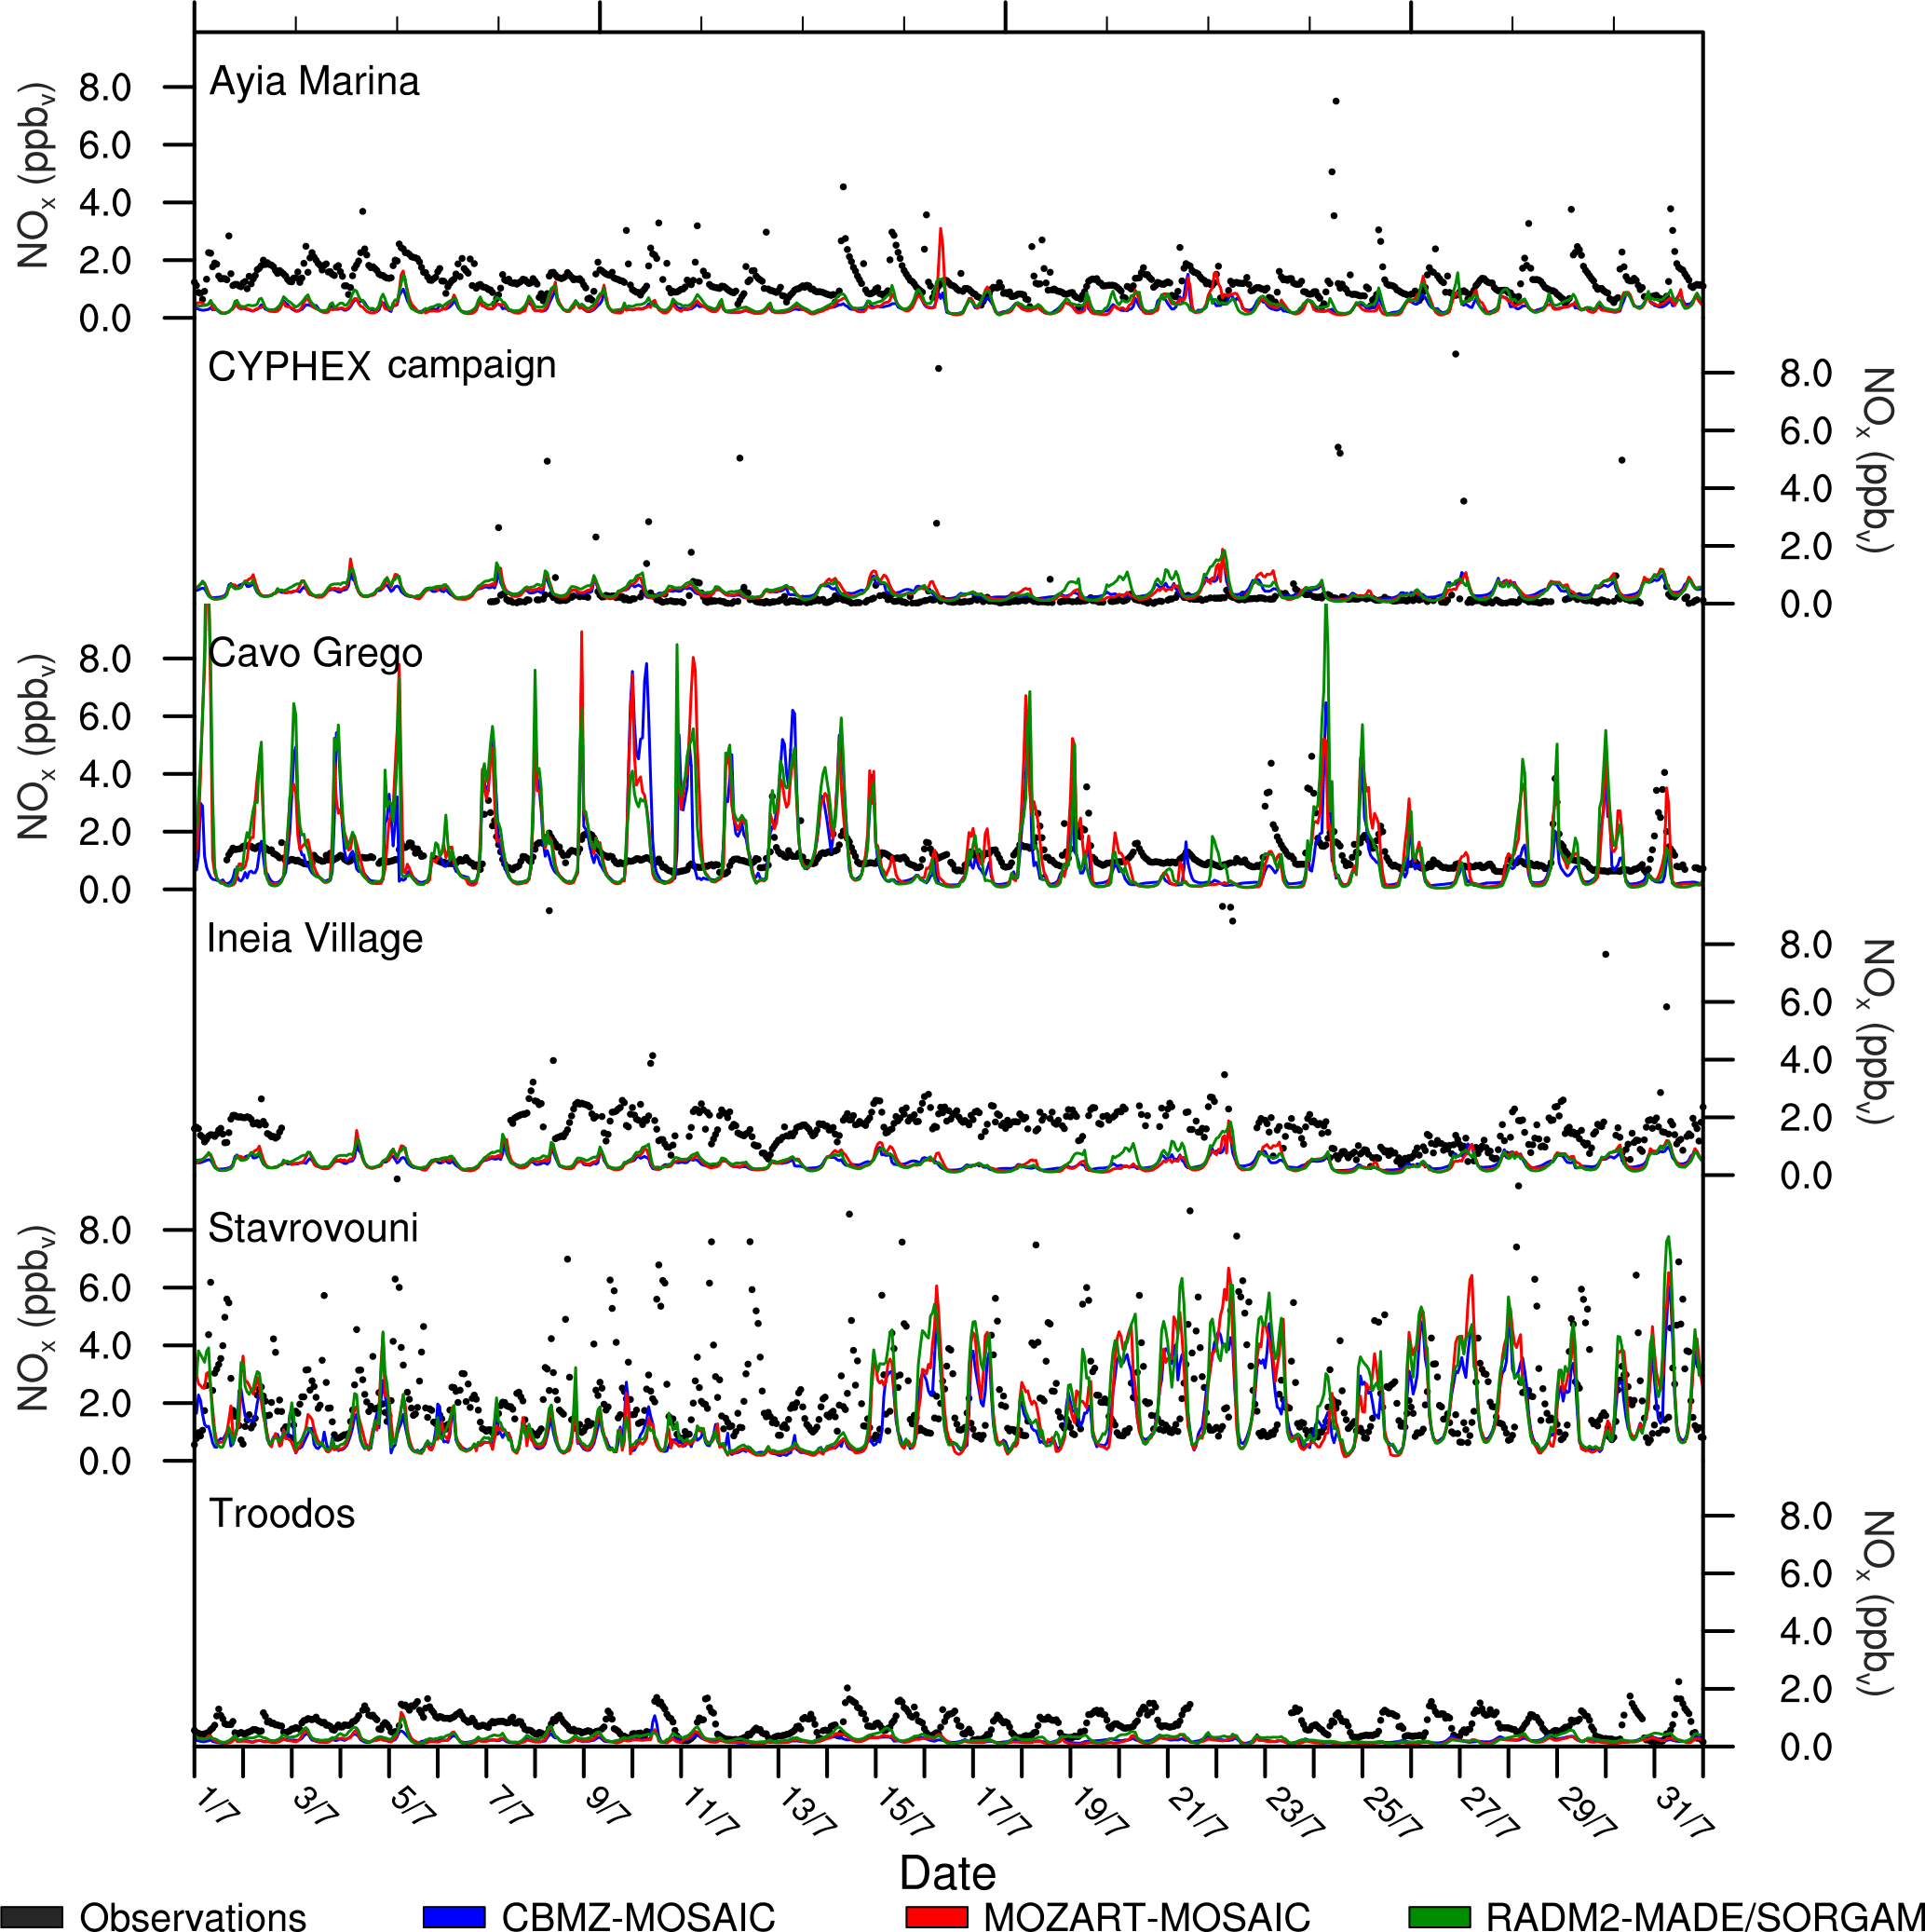
Figure 7Observed (black markers) and modelled NOx concentrations from the CBMZ-MOSAIC (blue line), MOZART-MOSAIC (red line), and RADM2-MADE/SORGAM (green line) mechanisms.
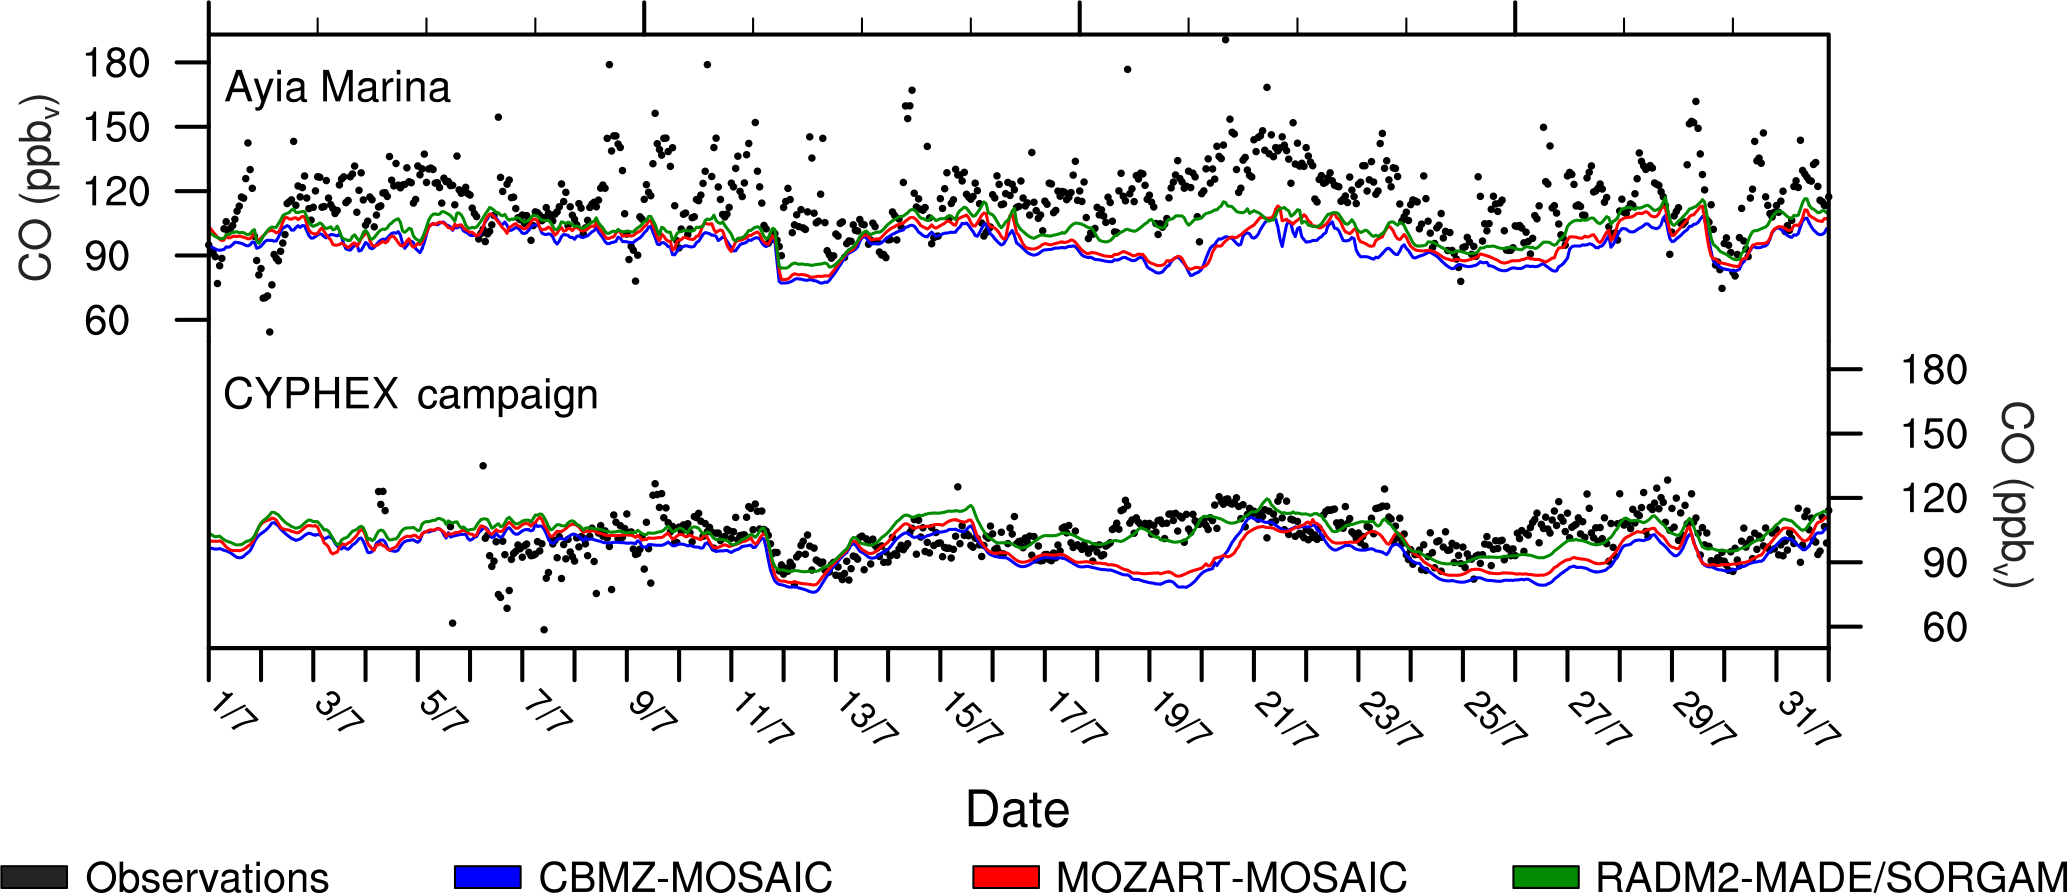
Figure 8Observed (black markers) and modelled CO concentrations from the CBMZ-MOSAIC (blue line), MOZART-MOSAIC (red line), and RADM2-MADE/SORGAM (green line) mechanisms.
An abrupt decrease in O3 concentrations in observations from 11 to 13 July is also captured by all three mechanisms at all stations except Cavo Greco, which is located in the eastern part of the island (Fig. 6). This decrease in O3 concentrations is accompanied by a decrease in CO concentrations as demonstrated from the observational data from the CYPHEX campaign and the WRF-Chem model. No abrupt changes are shown in NOx concentrations either by the observational data or the model. During this period model results reveal that westerlies account for more than 70 % at the stations where decreases in O3 and CO concentrations occur, indicating the transfer of cleaner maritime air from the Mediterranean. In general, wind direction appears to have an important impact on pollutant concentrations over Cyprus. Kleanthous et al. (2014) showed that at the Ayia Marina station northerlies are associated with 3–5 % higher O3 concentrations compared to westerlies and southerlies during all seasons. Similar results appear for modelled O3 concentrations at this station. More specifically, northerlies are associated with 4–12 % higher O3 concentrations compared to westerlies and southerlies for July 2014.
All three mechanisms tend to underestimate NOx concentrations at the majority of the stations (NMB varies from −53 to −44 %). The Ayia Marina and the Troodos stations are located in a mountainous region which is characterized by steep changes in altitude within short distances. The complexity of the terrain results in inaccuracies in the representation of the local wind circulation by the model, which affects the transport of pollutants. This is also supported by the CO model underestimation at the Ayia Marina station. Modelled NOx concentrations are significantly higher, and in better agreement with observations at the Cavo Greco and Stavrovouni stations. The latter is located a few kilometres to the east of an industrial area, which is represented in the anthropogenic emission inventory used in the simulations. On the other hand, a large nearby highway is not captured by the anthropogenic emission inventory, resulting in peaks in NOx concentrations from traffic, which are not captured by the model. The Cavo Greco station is located in the eastern part of the island. Model results showed that when westerlies occur at this location, NOx concentrations are significantly higher compared to southerlies for all three mechanisms, indicating that the eastern part of Cyprus is affected by transported pollutants, which are emitted within the island. Average NOx concentrations during northerlies are also higher compared to southerlies since the station is located south of the main power station of the island (Dekeleia).
3.4 Fine particulate matter (PM2.5)
As shown previously in Fig. 3, all three mechanisms overestimate PM2.5 concentrations at the Ayia Marina station and the CYPHEX campaign site. The lowest MB appears for MADE/SORGAM (MB = 8.96 µg m−3), whereas the MB for MOSAIC is 22.37 µg m−3 when coupled with CBMZ and 16.98 µg m−3 when coupled with MOZART.
Differences in PM2.5 concentrations between the three simulations are pronounced from 11 to 13 July. During this period, the average PM2.5 concentrations at the Ayia Marina station were 93.95, 53.81, 7.17 µg m−3 for CM, MM, and RMS respectively, whereas the average PM2.5 concentration from observational data was 13.72 µg m−3.
Investigating the inorganic mass in the MOSAIC aerosol mechanism, which represents fine dust particles (Zaveri et al., 2008), we find the overestimation is drve by the dust component. Since observations do not show elevated aerosol levels near the surface from 11 to 13 July, the dust component has been subtracted from the simulated total PM2.5 concentrations (Fig. 9). PM2.5 concentrations were significantly reduced and are in better agreement with observations for CM and MM simulations, especially from 11 to 13 July. This indicates that in the MOSAIC aerosol mechanism dust has a great contribution to PM2.5 concentrations during this period. On the other hand, smaller differences are shown for the MADE/SORGAM aerosol mechanism. The large difference in PM2.5 from mid-month coincides with the time frame where large discrepancies in gaseous pollutants occur between the three mechanisms, as discussed in Sect. 3.3. This underlines the importance of the interactions between aerosols and radiation and consequently photolytic reactions and air quality.
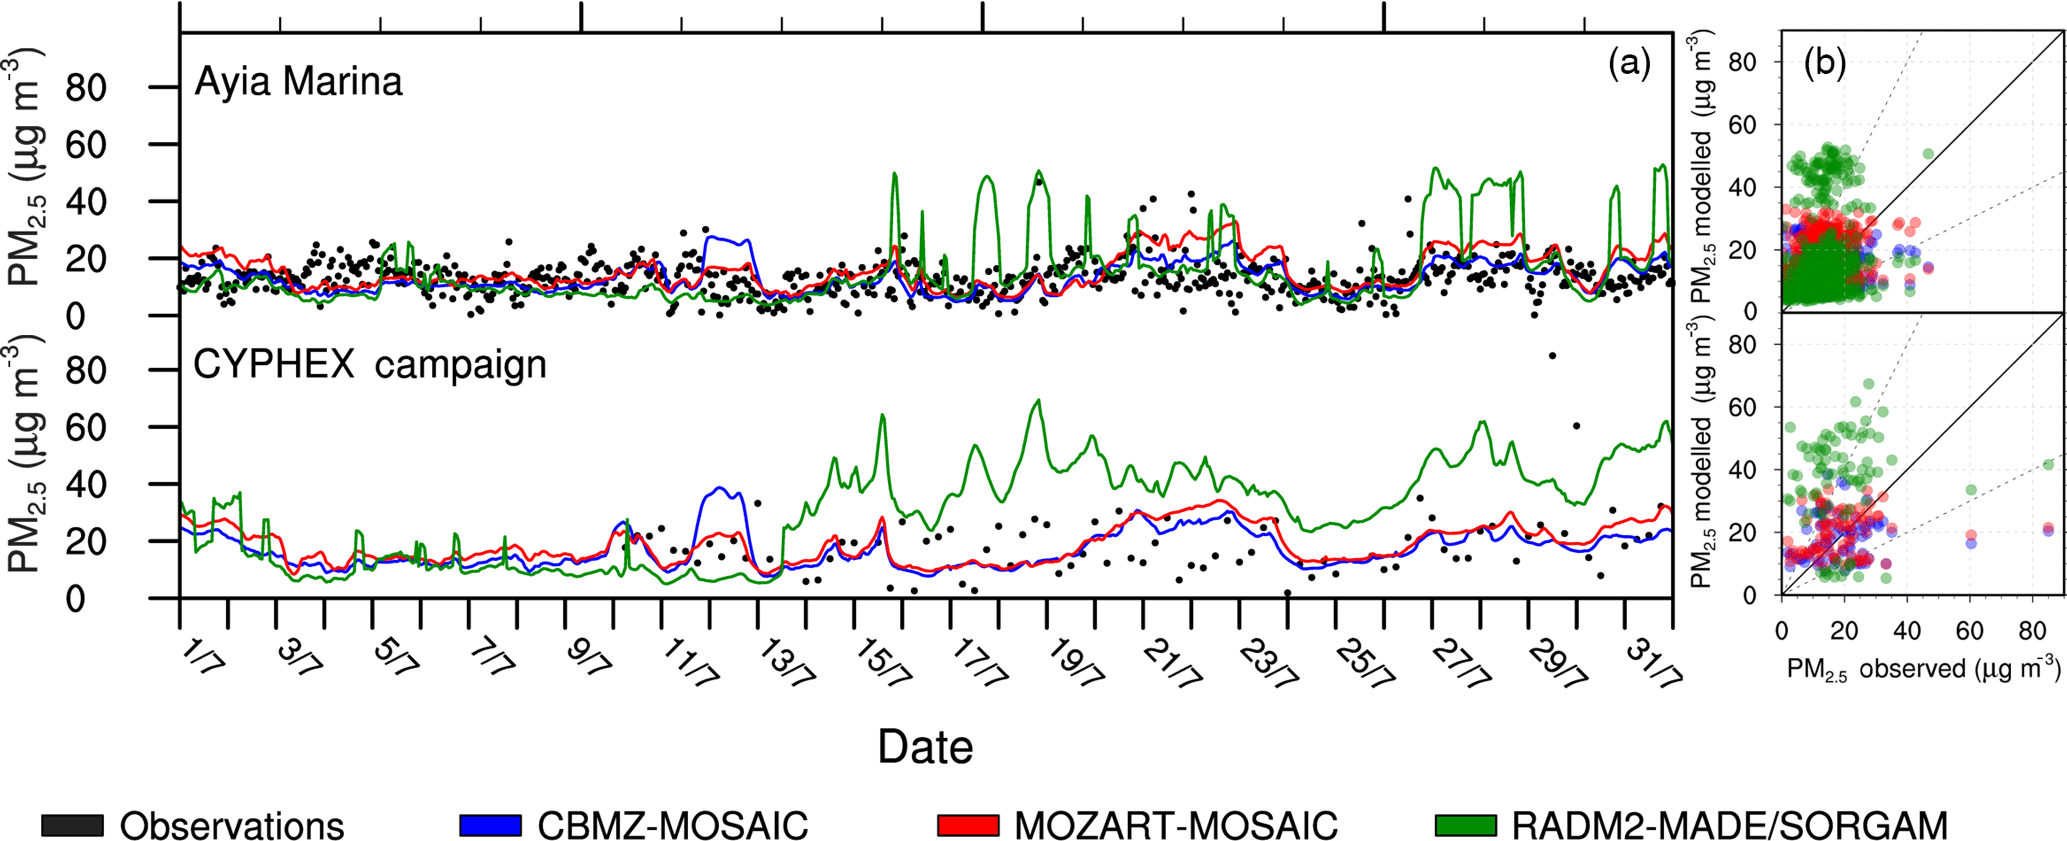
Figure 9Time series of observed and modelled PM2.5 concentrations from the CM, MM, and RMS mechanisms (a) and scatter plots (b) at the Ayia Marina station and the CYPHEX campaign. The dust component from the modelled concentrations has been removed from all simulations.
In order to better understand individual components of PM2.5, and examine differences in behaviour by the aerosol mechanisms, we analyse the aerosol species that dominate the PM2.5 concentrations separately. Figure 10 presents the components from observed and modelled sulfate (), ammonium (), and nitrate () aerosol mass concentrations and elemental carbon concentrations at the Ayia Marina station during the study period. Monthly mean sulfate aerosol concentrations for the three mechanisms vary from 5.14 to 7.02 µg m−3, which is close to observed values (5.05 µg m−3). The lowest monthly mean concentrations are produced by the CM mechanism. This mechanism shows the highest sulfate dioxide (SO2) concentrations during the whole study period (Fig. 11). Since this simulation uses the same aerosol mechanism with the MM simulation, and therefore the same heterogeneous nucleation rates from sulfuric acid (H2SO4) to sulfate aerosols, the differences between the CM and MM simulations are attributed to the chemical processes that act as sources/sinks of H2SO4. The RMS mechanism includes the heterogeneous SO2 cloud oxidation (de Brugh et al., 2011; Balzarini et al., 2015), which results in higher sulfate aerosol concentrations compared to CM and MM.
Elemental carbon is underestimated by all three simulations. The lowest NMB appears for RMS (−34 %) followed by CM (−35 %). Since the three simulations use the same anthropogenic emission inventory, these differences between RMS and MM can be partially attributed to the different treatment of aerosols by the modal and sectional bin approaches. The MM mechanism highly underestimates EC concentrations due to the absent of anthropogenic emissions in this mechanism.
Ammonium aerosol mean monthly values are close to observed 1.43 µg m−3 for the CM and MM simulations (1.74 and 1.87 µg m−3 respectively), while a higher value is shown for RMS (3.24 µg m−3). Nitrate aerosols are highly overestimated by the RMS mechanism with maximum values and outliers well above the period average. These outliers are due to nitrate aerosol transport from the north, when favoured by wind speed and direction. In contrast, nitrate aerosols are slightly underestimated by CM and MM. These differences lie in the differrent treatment of the gas-to-particle partitioning from the nitric acid to ammonium nitrate as a function of humidity from the two aerosol mechanisms used (Balzarini et al., 2015). MADE uses the Mozurkewich (1993) approach and MOSAIC uses the Zaveri et al. (2008) method. The diurnal cycle of compounds that are crucial to night-time chemistry (NO3, N2O5) vary significantly between the three mechanisms (not shown). The RMS mechanism exhibits 3 times higher night-time NO3 concentrations than the CM mechanism. This indicates considerable uncertainty in the representation of this important part of tropospheric chemistry that also affects aerosol formation. These results are supported by the findings of Knote et al. (2014) that also report 3 times higher pan-European averaged NO3 in the RADM2 mechanism compared to CBMZ in the middle of the night-time chemistry cycle.
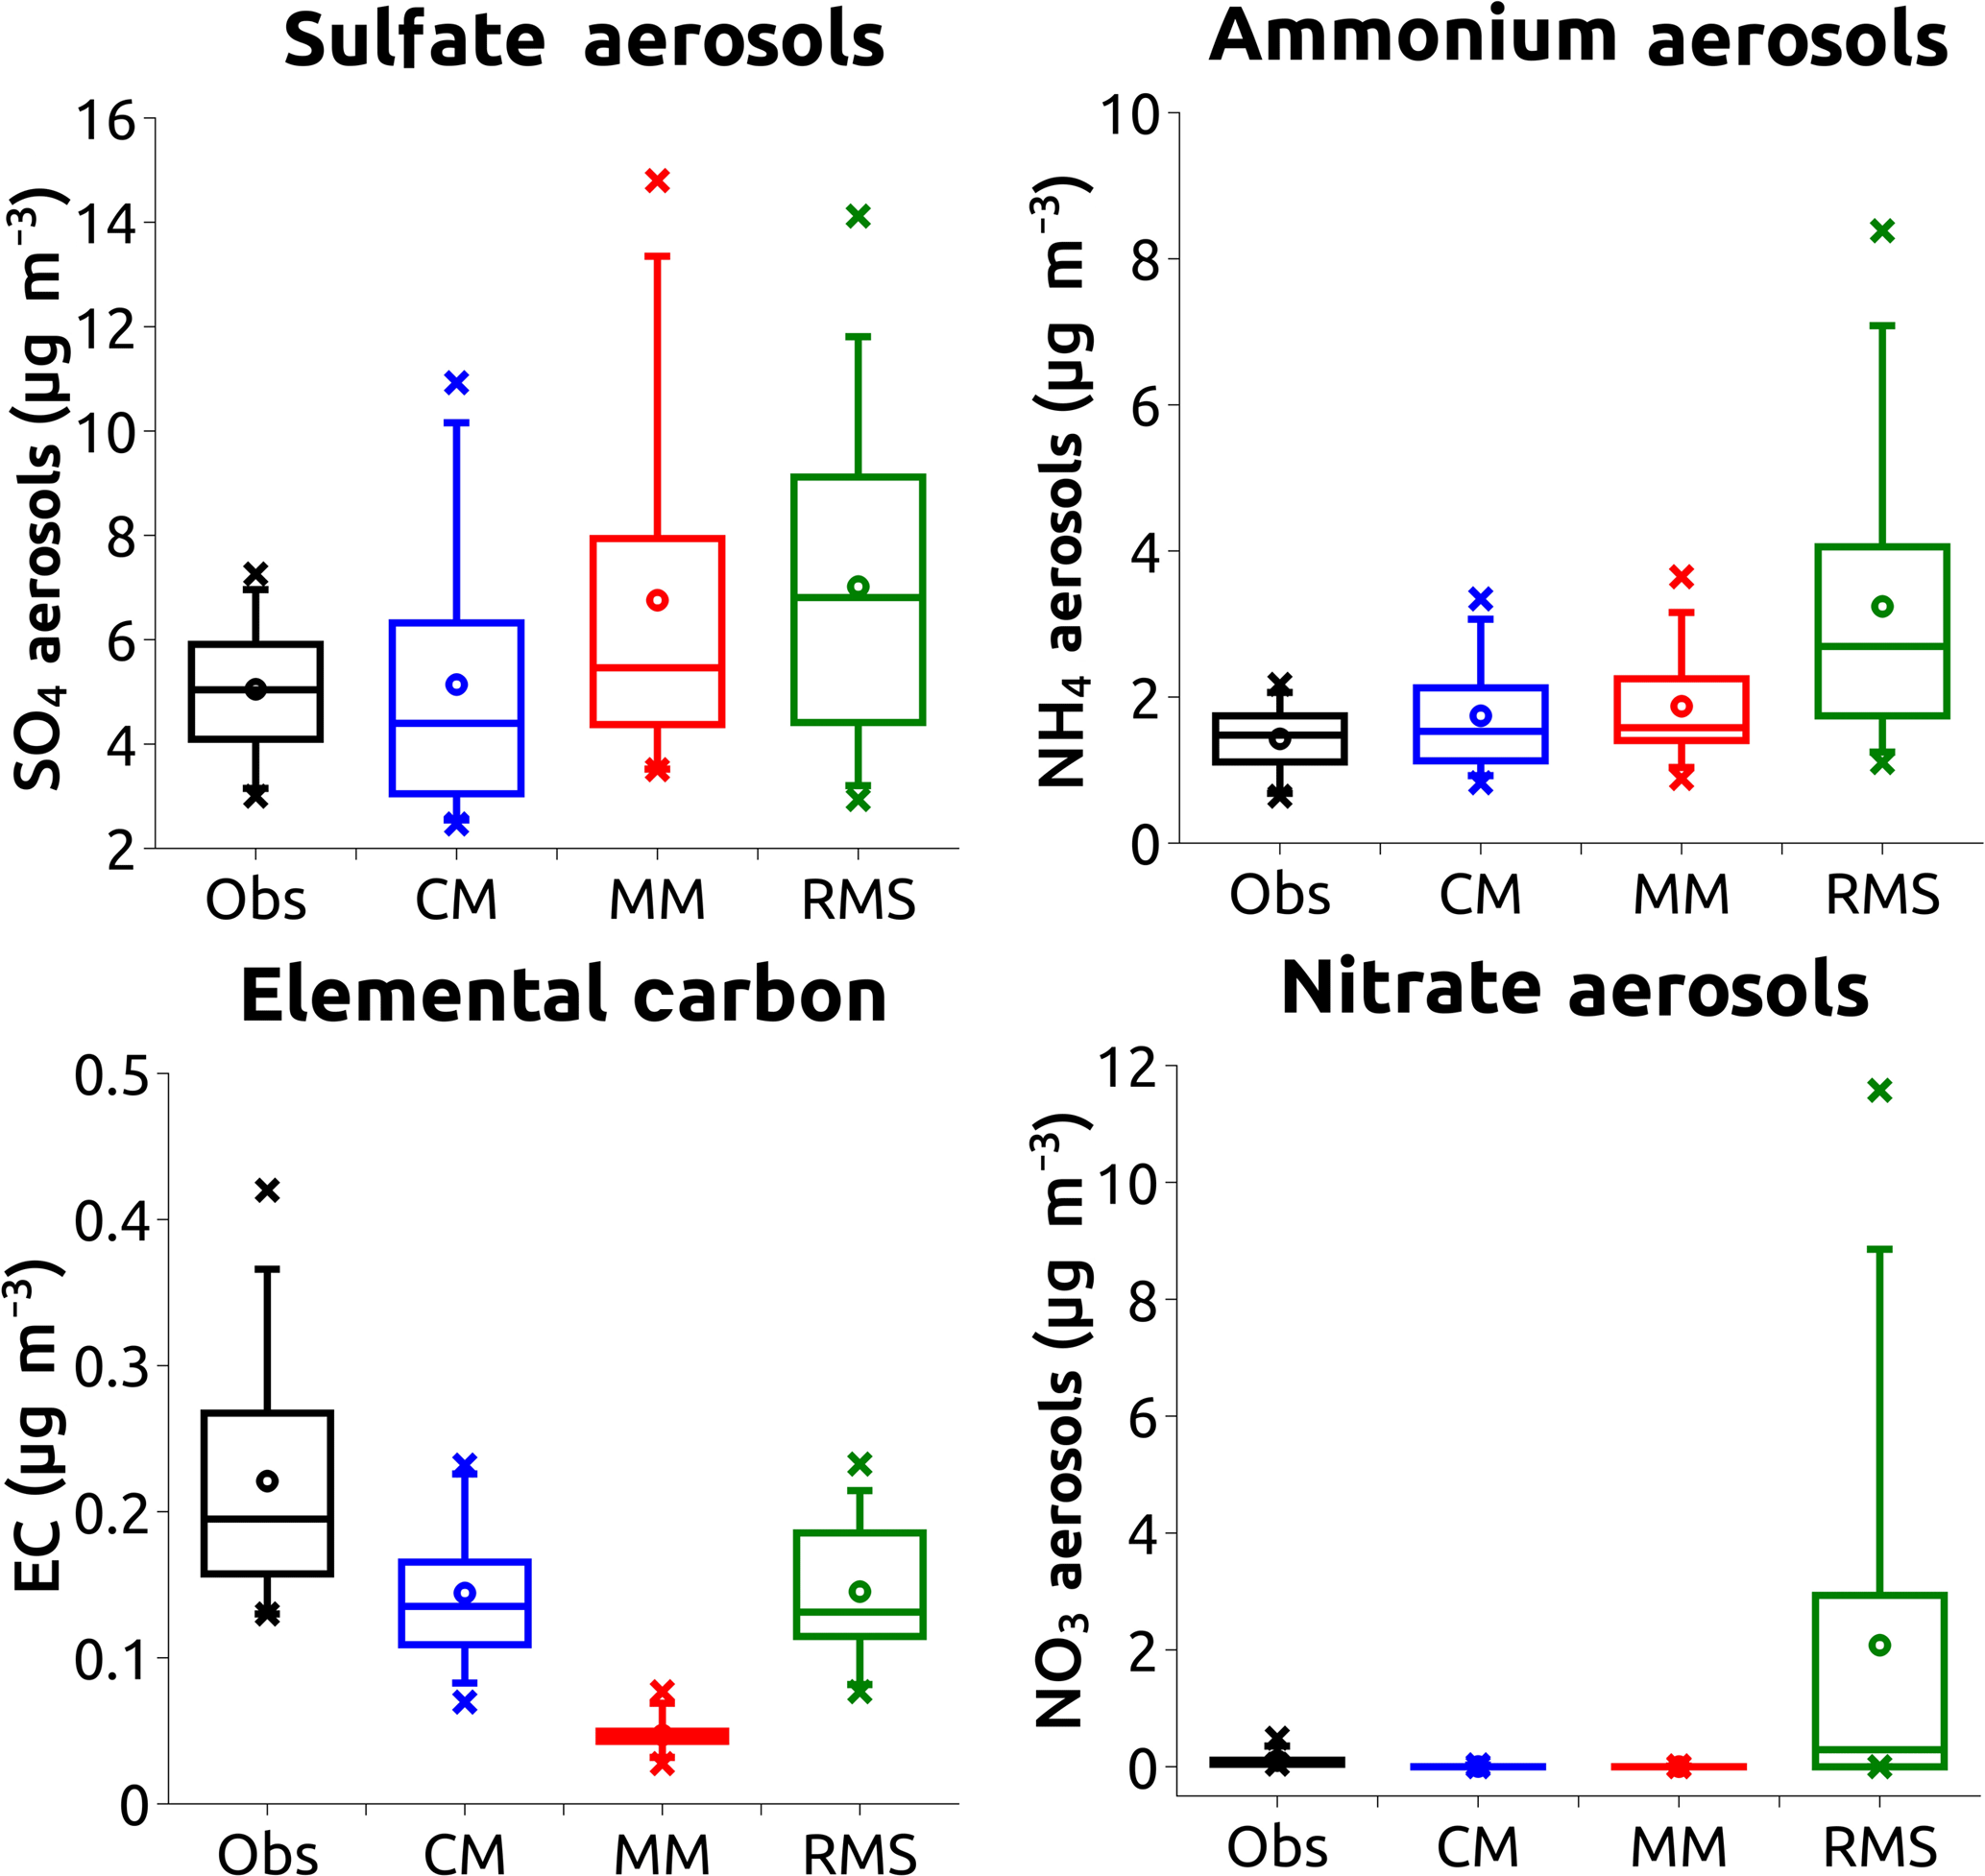
Figure 10Box-and-whisker plots of observed and modelled sulfate, ammonium, and nitrate aerosols and elemental carbon at the Ayia Marina station for July 2014.
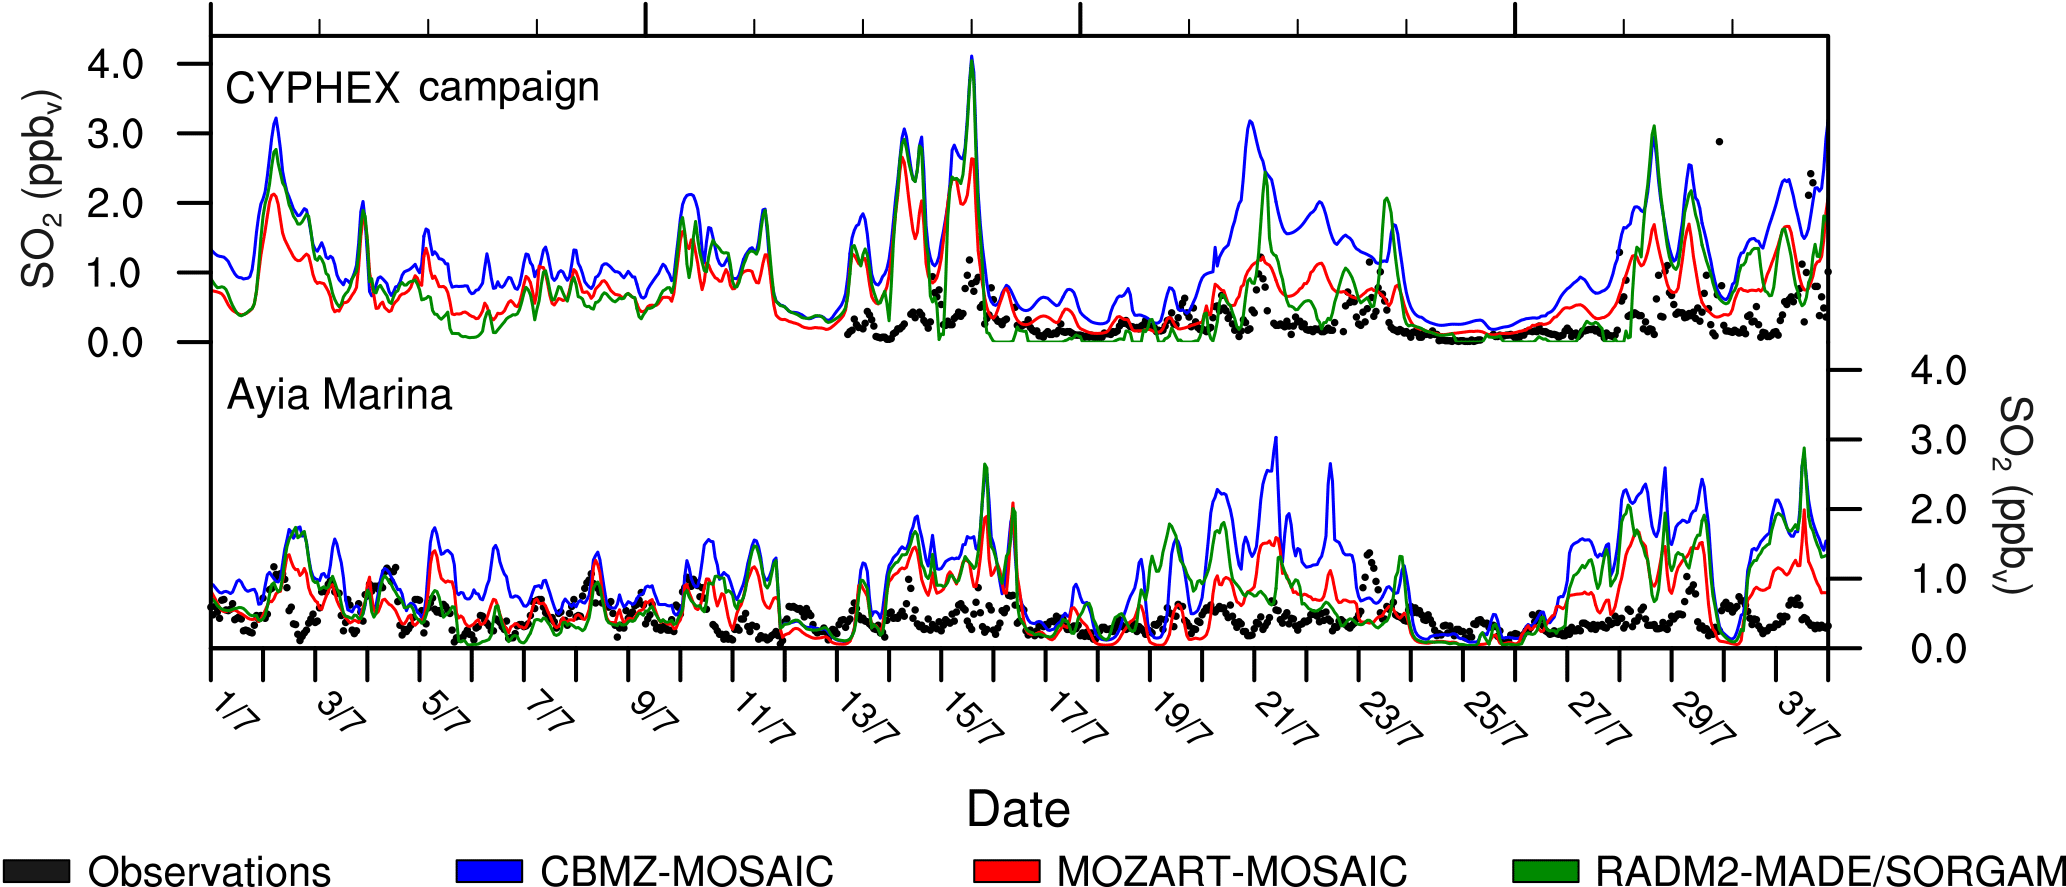
Figure 11Observed (black markers) and modelled SO2 concentrations from the CBMZ-MOSAIC (blue line), MOZART-MOSAIC (red line), and RADM2-MADE/SORGAM (green line) mechanisms.
We simulated atmospheric gases and aerosols using the WRF-Chem model over the eastern Mediterranean during the summer. The performance of three gas-phase chemistry and aerosol mechanisms is investigated during the CYPHEX campaign in July 2014. Model output is compared with meteorological and air quality observational data from 14 ground stations. The model reproduces the summertime synoptic wind circulation over the region and the local circulation. It overestimates wind speed at the majority of the stations by an average of 1.71 to 1.83 m s−1. Near-surface temperature and pressure are reproduced accurately both in magnitude and diurnal variation. Some discrepancies in modelled and observed meteorological parameters may be attributed to the limited representation of the topography by the model.
Monthly average concentrations of O3 are overestimated by the CM and MM mechanisms by 22 and 23 % respectively, whereas a small underestimation is obtained by RMS (9 %). Sensitivity tests showed that PM2.5 concentrations can affect secondary pollutant formation though aerosol–radiation feedbacks. A decrease of the order of 19 % in PM2.5 concentrations, as a result of setting the dust inflow from the global model to zero, resulted in 10 % increase in O3 concentrations. The differences in O3 concentrations are attributed to the different treatment of VOCs as suggested by Knote et al. (2014). Hourly correlation coefficients are low for all three mechanisms. NOx concentrations do not differ between the simulations, with underestimation at the majority of the stations, suggesting that nearby/local anthropogenic emission sources are not well represented in the emission inventory.
Differences in O3 and CO concentrations between the three simulations, during the second half of the simulation period, are attributed to differences in meteorology that derive from the aerosol–radiation interactions. Concurrent abrupt decreases in O3 and CO concentrations (observations and model) during specific days are accompanied by dominance of westerlies carrying clean maritime air from the Mediterranean. Northerlies at the Ayia Marina station are associated with 4–12 % higher O3 modelled concentrations compared to westerlies and southerlies for July 2014, which is in good agreement with previous studies.
The terrain complexity in the mountainous areas is the reason for the inaccuracies in the representation of the local wind circulation by the model that affects the transport and vertical mixing of pollutants. As a result, the model performance at these stations (Ayia Marina, Troodos) regarding all pollutants is less satisfactory. On the other hand, the model performance is better in locations with less complex terrain such as the Stavrovouni and Cavo Greco stations. Increased NOx concentrations at the Cavo Greco station when westerlies occur indicate that the eastern part of Cyprus is affected by emission sources located on the island.
The model skill to reproduce PM2.5 concentrations is examined. The MOSAIC aerosol mechanism highly overestimates PM2.5 concentrations (NMB ≥ 100 %). When the dust component is subtracted from the total PM2.5 concentrations from all mechanisms there is a better agreement with observations. The RMS mechanism slightly overestimates sulfate and ammonium aerosol at the Ayia Marina station. The CM and MM modelled concentrations of these species are closer to observations (NMB = 2 and 34 % respectively). The lowest sulfate aerosol concentrations are produced by the CM mechanism and are accompanied by higher SO2 concentrations. The differences between the two simulations using the MOSAIC aerosol mechanism may be attributed to the chemical processes that act as sources/sinks of SO2. The inclusion of the heterogeneous SO2 cloud oxidation in the RMS mechanism results in higher sulfate aerosol concentrations (NMB = 38 %), as described in de Brugh et al. (2011) and Balzarini et al. (2015). Elemental carbon is underestimated by all three mechanisms indicating lack of emission sources. Differences between the RMS (NMB = −34 %) and the CM (NMB = −34 %) mechanisms are attributed to the different approach for the simulation of the aerosol size distribution. Observed and modelled (by CM and MM) nitrate aerosol concentrations at the Ayia Marina site are negligible. RMS simulations yield higher values, probably attributed to nitrate aerosol formation upwind of the measurement site. It is found that key night-time compounds like NO3 and N2O5 differ significantly between the three mechanisms.
We conclude that all three mechanisms are very sensitive to boundary conditions from the global model for both gas-phase and aerosol pollutants. Care has to be taken, for ozone in particular, which has an important impact on the modelled gas-phase pollutants for all mechanisms. In addition, dust has a great contribution to PM2.5 concentrations from the MOSAIC aerosol mechanism, while the corresponding concentrations from CBMZ-MOSAIC were found to be very sensitive to dust from the boundaries.
The data can be provided by the authors upon request.
The supplement related to this article is available online at: https://doi.org/10.5194/acp-18-1555-2018-supplement.
The authors declare that they have no conflict of interest.
The authors wish to thank the CYprus PHotochemical EXperiment (CYPHEX)
campaign, the Cyprus Department of Meteorology (DoM) and the Cyprus
Department of Labour Inspection (DLI), as well as the EMEP network for providing the observational data
used for model evaluation in this study.
Plots and diagrams were produced using the NCAR Command Language (NCL) version 6.3.0
(http://www.ncl.ucar.edu/), the openair R package (Carslaw and Ropkins, 2012), and Qtiplot (http://www.qtiplot.com/).
The Computational resources and support were provided
by the European Union Horizon 2020 research and innovation programme VI-SEEM
project under grant agreement 675121.
Edited by: Maria Kanakidou
Reviewed by: two anonymous referees
Abdallah, C., Sartelet, K., and Afif, C.: Influence of boundary conditions and anthropogenic emission inventories on simulated O3 and PM2.5 concentrations over Lebanon, Atmos. Pollut. Res., 1–9, https://doi.org/10.1016/j.apr.2016.06.001, 2016. a
Ackermann, I. I. J., Hass, H., Memmesheimer, M., Ebel, A., Binkowski, F. F. S., and Shankar, U.: Modal aerosol dynamics model for Europe: Development and first applications, Atmos. Environ., 32, 2981–2999, https://doi.org/10.1016/S1352-2310(98)00006-5, 1998. a
Akritidis, D., Zanis, P., Katragkou, E., Schultz, M. G., Tegoulias, I., Poupkou, A., Markakis, K., Pytharoulis, I., and Karacostas, T.: Evaluating the impact of chemical boundary conditions on near surface ozone in regional climate-air quality simulations over Europe, Atmos. Res., 134, 116–130, https://doi.org/10.1016/j.atmosres.2013.07.021, 2013. a
Akritidis, D., Pozzer, A., Zanis, P., Tyrlis, E., Škerlak, B., Sprenger, M., and Lelieveld, J.: On the role of tropopause folds in summertime tropospheric ozone over the eastern Mediterranean and the Middle East, Atmos. Chem. Phys., 16, 14025–14039, https://doi.org/10.5194/acp-16-14025-2016, 2016. a
Anagnostopoulou, C., Zanis, P., Katragkou, E., Tegoulias, I., and Tolika, K.: Recent past and future patterns of the Etesian winds based on regional scale climate model simulations, Clim. Dynam., 42, 1819–1836, https://doi.org/10.1007/s00382-013-1936-0, 2014. a
Balzarini, A., Pirovano, G., Honzak, L., Zabkar, R., Curci, G., Forkel, R., Hirtl, M., San José, R., Tuccella, P., and Grell, G. A.: WRF-Chem model sensitivity to chemical mechanisms choice in reconstructing aerosol optical properties, Atmos. Environ., 115, 604–619, https://doi.org/10.1016/j.atmosenv.2014.12.033, 2015. a, b, c, d
Bossioli, E., Tombrou, M., Kalogiros, J., Allan, J., Bacak, A., Bezantakos, S., Biskos, G., Coe, H., Jones, B. T., Kouvarakis, G., Mihalopoulos, N., and Percival, C. J.: Atmospheric composition in the Eastern Mediterranean: Influence of biomass burning during summertime using the WRF-Chem model, Atmos. Environ., 132, 317–331, https://doi.org/10.1016/j.atmosenv.2016.03.011, 2016. a, b
Carslaw, D. C. and Ropkins, K.: openair – An R package for air quality data analysis, Environ. Modell. Softw., 27–28, 52–61, https://doi.org/10.1016/j.envsoft.2011.09.008, 2012. a
Chen, F. and Dudhia, J.: Coupling an Advanced Land Surface–Hydrology Model with the Penn State–NCAR MM5 Modeling System. Part I: Model Implementation and Sensitivity, Mon. Weather Rev., 129, 569–585, https://doi.org/10.1175/1520-0493(2001)129<0569:CAALSH>2.0.CO;2, 2001. a
Chin, M., Rood, R. B., Lin, S.-J., Müller, J.-F., and Thompson, A. M.: Atmospheric sulfur cycle simulated in the global model GOCART: Model description and global properties, J. Geophys. Res., 105, 24671, https://doi.org/10.1029/2000JD900384, 2000. a
de Brugh, A. J. M. J., Schaap, M., Vignati, E., Dentener, F., Kahnert, M., Sofiev, M., Huijnen, V., and Krol, M. C.: The European aerosol budget in 2006, Atmos. Chem. Phys., 11, 1117–1139, https://doi.org/10.5194/acp-11-1117-2011, 2011. a, b
Emmons, L. K., Walters, S., Hess, P. G., Lamarque, J.-F., Pfister, G. G., Fillmore, D., Granier, C., Guenther, A., Kinnison, D., Laepple, T., Orlando, J., Tie, X., Tyndall, G., Wiedinmyer, C., Baughcum, S. L., and Kloster, S.: Description and evaluation of the Model for Ozone and Related chemical Tracers, version 4 (MOZART-4), Geosci. Model Dev., 3, 43–67, https://doi.org/10.5194/gmd-3-43-2010, 2010. a, b, c
Gerasopoulos, E., Kouvarakis, G., Vrekoussis, M., Kanakidou, M., and Mihalopoulos, N.: Ozone variability in the marine boundary layer of the eastern Mediterranean based on 7-year observations, J. Geophys. Res.-Atmos., 110, 1–12, https://doi.org/10.1029/2005JD005991, 2005. a, b
Gery, M. W., Whitten, G. Z., Killus, J. P., and Dodge, M. C.: A photochemical kinetics mechanism for urban and regional scale computer modeling, J. Geophys. Res., 94, 12925, https://doi.org/10.1029/JD094iD10p12925, 1989. a
Grell, G. a.: A generalized approach to parameterizing convection combining ensemble and data assimilation techniques, Geophys. Res. Lett., 29, 10–13, https://doi.org/10.1029/2002GL015311, 2002. a
Grell, G. A., Peckham, S. E., Schmitz, R., McKeen, S. A., Frost, G., Skamarock, W. C., and Eder, B.: Fully coupled “online” chemistry within the WRF model, Atmos. Environ., 39, 6957–6975, https://doi.org/10.1016/j.atmosenv.2005.04.027, 2005. a
Grell, G. A. G.: Prognostic Evaluation of Assumptions Used by Cumulus Parameterizations, Mon. Weather Rev., 121, 764–787, https://doi.org/10.1175/1520-0493(1993)121<0764:PEOAUB>2.0.CO;2, 1993. a
Guenther, A. B., Jiang, X., Heald, C. L., Sakulyanontvittaya, T., Duhl, T., Emmons, L. K., and Wang, X.: The Model of Emissions of Gases and Aerosols from Nature version 2.1 (MEGAN2.1): an extended and updated framework for modeling biogenic emissions, Geosci. Model Dev., 5, 1471–1492, https://doi.org/10.5194/gmd-5-1471-2012, 2012. a
Gupta, M. and Mohan, M.: Validation of WRF/Chem model and sensitivity of chemical mechanisms to ozone simulation over megacity Delhi, Atmos. Environ., 122, 220–229, https://doi.org/10.1016/j.atmosenv.2015.09.039, 2015. a
Hong, S.-Y., Noh, Y., and Dudhia, J.: A new vertical diffusion package with an explicit treatment of entrainment processes, Mon. Weather Rev., 134, 2318–2341, https://doi.org/10.1175/MWR3199.1, 2006. a
Im, U., Bianconi, R., Solazzo, E., Kioutsioukis, I., Badia, A., Balzarini, A., Baró, R., Bellasio, R., Brunner, D., Chemel, C., Curci, G., Flemming, J., Forkel, R., Giordano, L., Jiménez-Guerrero, P., Hirtl, M., Hodzic, A., Honzak, L., Jorba, O., Knote, C., Kuenen, J. J. P., Makar, P. A., Manders-Groot, A., Neal, L., Pérez, J. L., Pirovano, G., Pouliot, G., San Jose, R., Savage, N., Schroder, W., Sokhi, R. S., Syrakov, D., Torian, A., Tuccella, P., Werhahn, J., Wolke, R., Yahya, K., Zabkar, R., Zhang, Y., Zhang, J., Hogrefe, C., and Galmarini, S.: Evaluation of operational on-line-coupled regional air quality models over Europe and North America in the context of AQMEII phase 2. Part I: Ozone, Atmos. Environ., 115, 404–420, https://doi.org/10.1016/j.atmosenv.2014.09.042, 2015a. a, b
Im, U., Bianconi, R., Solazzo, E., Kioutsioukis, I., Badia, A., Balzarini, A., Baro, R., Bellasio, R., Giordano, L., Jimenez-Guerrero, P., Hirtl, M., Hodzic, A., Honzak, L., Jorba, O., Knote, C., Kuenen, J. J. P., Makar, P. A., Mandes-Groot, A., Neal, L., Perez, J. L., Pirovano, G., Pouliot, G., San Jose, R., Savage, N., Schroder, W., Sokhi, R. S., Syrakov, D., Torian, A., Tucella, P., Werhahn, J., Wolke, R., Yahya, K., Zabkar, R., Zhang, Y., Zhang, J., Hogrefe, C., and Galmarini, S.: Evaluation of operational on-lin-coupled regional air quality models over Europe and North America in the contexof AQMEII phase 1. Part II: Particulate matter, Atmos. Environ., 115, 421–441, https://doi.org/10.1016/j.atmosenv.2014.08.072, 2015b. a
Janssens-Maenhout, G., Dentener, F., Van Aardenne, J., Monni, S., Pagliari, V., Orlandini, L., Klimont, Z., Kurokawa, J.-I., Akimoto, H., Ohara, T., Wankmüller, R., Battye, B., Grano, D., Zuber, A., and Keating, T.: EDGAR-HTAP: a harmonized gridded air pollution emission dataset based on national inventories, Tech. rep., available at: https://doi.org/10.2788/14102, 2012. a
Kalabokas, P. D., Mihalopoulos, N., Ellul, R., Kleanthous, S., and Repapis, C. C.: An investigation of the meteorological and photochemical factors influencing the background rural and marine surface ozone levels in the Central and Eastern Mediterranean, Atmos. Environ., 42, 7894–7906, https://doi.org/10.1016/j.atmosenv.2008.07.009, 2008. a, b
Kanakidou, M., Mihalopoulos, N., Kindap, T., Im, U., Vrekoussis, M., Gerasopoulos, E., Dermitzaki, E., Unal, A., Koçak, M., Markakis, K., Melas, D., Kouvarakis, G., Youssef, A. F., Richter, A., Hatzianastassiou, N., Hilboll, A., Ebojie, F., Wittrock, F., von Savigny, C., Burrows, J. P., Ladstaetter-Weissenmayer, A., and Moubasher, H.: Megacities as hot spots of air pollution in the East Mediterranean, Atmos. Environ., 45, 1223–1235, https://doi.org/10.1016/j.atmosenv.2010.11.048, 2011. a
Kleanthous, S., Vrekoussis, M., Mihalopoulos, N., Kalabokas, P., and Lelieveld, J.: On the temporal and spatial variation of ozone in Cyprus, Sci. Total Environ., 476–477, 677–687, https://doi.org/10.1016/j.scitotenv.2013.12.101, 2014. a, b, c, d
Knote, C., Tuccella, P., Curci, G., Emmons, L., Orlando, J. J., Madronich, S., Baró, R., Jiménez-Guerrero, P., Luecken, D., Hogrefe, C., Forkel, R., Werhahn, J., Hirtl, M., Pérez, J. L., San José, R., Giordano, L., Brunner, D., Yahya, K., Zhang, Y., Baró, R., Jiménez-Guerrero, P., Luecken, D., Hogrefe, C., Forkel, R., Werhahn, J., Hirtl, M., Pérez, J. L., San José, R., Giordano, L., Brunner, D., Yahya, K., and Zhang, Y.: Influence of the choice of gas-phase mechanism on predictions of key gaseous pollutants during the AQMEII phase-2 intercomparison, Atmos. Environ., 115, 553–568, https://doi.org/10.1016/j.atmosenv.2014.11.066, 2014. a, b, c, d
Kouvarakis, G., Tsigaridis, K., Kanakidou, M., and Mihalopoulos, N.: Temporal variations of surface regional background ozone over Crete Island in the southeast Mediterranean, J. Geophys. Res.-Atmos., 105, 4399–4407, https://doi.org/10.1029/1999JD900984, 2000. a
Kumar, R.: anthro emiss utility, WRF/Chem Tools for the Community, available at: https://www2.acom.ucar.edu/wrf-chem/wrf-chem-tools-community (30 January 2018), 2017. a
Kushta, J., Kallos, G., Astitha, M., Solomos, S., Spyrou, C., Mitsakou, C., and Lelieveld, J.: Impact of natural aerosols on atmospheric radiation and consequent feedbacks with the meteorological and photochemical state of the atmosphere, J. Geophys. Res.-Atmos., 119, 1463–1491, https://doi.org/10.1002/2013JD020714, 2014. a
Kushta, J., Georgiou, G. K., Proestos, Y., Christoudias, T., and Lelieveld, J.: A modelling study of the atmospheric composition over Cyprus, Atmos. Pollut. Res., https://doi.org/10.1016/j.apr.2017.09.007, 2017. a
Ladstätter-Weißenmayer, A., Kanakidou, M., Meyer-Arnek, J., Dermitzaki, E. V., Richter, A., Vrekoussis, M., Wittrock, F., and Burrows, J. P.: Pollution events over the East Mediterranean: Synergistic use of GOME, ground-based and sonde observations and models, Atmos. Environ., 41, 7262–7273, https://doi.org/10.1016/j.atmosenv.2007.05.031, 2007. a
Lelieveld, J., Berresheim, H., Borrmann, S., Crutzen, P. J., Dentener, F. J., Fischer, H., Feichter, J., Flatau, P. J., Heland, J., Holzinger, R., Korrmann, R., Lawrence, M. G., Levin, Z., Markowicz, K. M., Mihalopoulos, N., Minikin, A., Ramanathan, V., De Reus, M., Roelofs, G. J., Scheeren, H. A., Sciare, J., Schlager, H., Schultz, M., Siegmund, P., Steil, B., Stephanou, E. G., Stier, P., Traub, M., Warneke, C., Williams, J., and Ziereis, H.: Global air pollution crossroads over the Mediterranean, Science, 298, 794–799, https://doi.org/10.1126/science.1075457, 2002. a, b, c
Lelieveld, J., Hoor, P., Jöckel, P., Pozzer, A., Hadjinicolaou, P., Cammas, J.-P., and Beirle, S.: Severe ozone air pollution in the Persian Gulf region, Atmos. Chem. Phys., 9, 1393–1406, https://doi.org/10.5194/acp-9-1393-2009, 2009. a
LRTAP-Wiki: HTAP harmonized emissions database 2006–2010, available at: http://iek8wikis.iek.fz-juelich.de/HTAPWiki/WP1.1?highlight= %25%2028%25%2028 WP1.1 %25%2029%25%2029%20 http://edgar.jrc.ec.europa.eu/htap_v2/ (last access: 30 January 2018), 2014. a
Mar, K. A., Ojha, N., Pozzer, A., and Butler, T. M.: Ozone air quality simulations with WRF-Chem (v3.5.1) over Europe: model evaluation and chemical mechanism comparison, Geosci. Model Dev., 9, 3699–3728, https://doi.org/10.5194/gmd-9-3699-2016, 2016. a, b, c, d
Marticorena, B. and Bergametti, G.: Modeling the atmospheric dust cycle: 1. Design of a soil-derived dust emission scheme, J. Geophys. Res., 100, 16415, https://doi.org/10.1029/95JD00690, 1995. a
Mlawer, E. J., Taubman, S. J., Brown, P. D., Iacono, M. J., and Clough, S. A.: Radiative transfer for inhomogeneous atmosphers: RRTM, a validated correlated0k model for the long-wave, J. Geophys. Res., 102, 16663–16682, 1997. a, b
Morrison, H., Curry, J. a., Shupe, M. D., and Zuidema, P.: A New Double-Moment Microphysics Parameterization for Application in Cloud and Climate Models. Part II: Single-Column Modeling of Arctic Clouds, J. Atmos. Sci., 62, 1678–1693, https://doi.org/10.1175/JAS3447.1, 2005. a
Mozurkewich, M.: The dissociation constant of ammonium nitrate and its dependence on temperature, relative humidity and particle size, Atmos. Environ. A-Gen., 27, 261–270, https://doi.org/10.1016/0960-1686(93)90356-4, 1993. a
Ritter, M., Müller, M. D., Jorba, O., Parlow, E., and Liu, L.-J. S.: Impact of chemical and meteorological boundary and initial conditions on air quality modeling: WRF-Chem sensitivity evaluation for a European domain, Meteorol. Atmos. Phys., 119, 59–70, https://doi.org/10.1007/s00703-012-0222-8, 2013. a
Safieddine, S., Boynard, A., Coheur, P.-F., Hurtmans, D., Pfister, G., Quennehen, B., Thomas, J. L., Raut, J.-C., Law, K. S., Klimont, Z., Hadji-Lazaro, J., George, M., and Clerbaux, C.: Summertime tropospheric ozone assessment over the Mediterranean region using the thermal infrared IASI/MetOp sounder and the WRF-Chem model, Atmos. Chem. Phys., 14, 10119–10131, https://doi.org/10.5194/acp-14-10119-2014, 2014. a
Schell, B., Ackermann, I. J., Hass, H., Binkowski, F. S., and Ebel, A.: Modeling the formation of secondary organic aerosol within a comprehensive air quality model system, J. Geophys. Res.-Atmos., 106, 28275–28293, https://doi.org/10.1029/2001JD000384, 2001. a
Stockwell, W. R., Middleton, P., Chang, J. S., and Tang, X.: The second generation regional acid deposition model chemical mechanism for regional air quality modeling, J. Geophys. Res., 95, 16343, https://doi.org/10.1029/JD095iD10p16343, 1990. a
Tuccella, P., Curci, G., Visconti, G., Bessagnet, B., Menut, L., and Park, R. J.: Modeling of gas and aerosol with WRF/Chem over Europe: Evaluation and sensitivity study, J. Geophys. Res.-Atmos., 117, 1–15, https://doi.org/10.1029/2011JD016302, 2012. a
Tyrlis, E., Lelieveld, J., and Steil, B.: The summer circulation over the eastern Mediterranean and the Middle East: Influence of the South Asian monsoon, Clim. Dynam., 40, 1103–1123, https://doi.org/10.1007/s00382-012-1528-4, 2013. a
Zanis, P., Hadjinicolaou, P., Pozzer, A., Tyrlis, E., Dafka, S., Mihalopoulos, N., and Lelieveld, J.: Summertime free-tropospheric ozone pool over the eastern Mediterranean/Middle East, Atmos. Chem. Phys., 14, 115–132, https://doi.org/10.5194/acp-14-115-2014, 2014. a
Zaveri, R. a. and Peters, L. K.: A new lumped structure photochemical mechanism for large-scale applications, J. Geophys. Res., 104, 30387, https://doi.org/10.1029/1999JD900876, 1999. a
Zaveri, R. A., Easter, R. C., Fast, J. D., and Peters, L. K.: Model for Simulating Aerosol Interactions and Chemistry (MOSAIC), J. Geophys. Res., 113, D13204, https://doi.org/10.1029/2007JD008782, 2008. a, b, c
Zhang, Y., Sartelet, K., Wu, S.-Y., and Seigneur, C.: Application of WRF/Chem-MADRID and WRF/Polyphemus in Europe – Part 1: Model description, evaluation of meteorological predictions, and aerosol–meteorology interactions, Atmos. Chem. Phys., 13, 6807–6843, https://doi.org/10.5194/acp-13-6807-2013, 2013. a