the Creative Commons Attribution 4.0 License.
the Creative Commons Attribution 4.0 License.
 | 29 Oct 2018
Seasonal influences on surface ozone variability in continental South Africa and implications for air quality
Tracey Leah Laban
Pieter Gideon van Zyl
Johan Paul Beukes
Ville Vakkari
Kerneels Jaars
Nadine Borduas-Dedekind
Miroslav Josipovic
Anne Mee Thompson
Markku Kulmala
Lauri Laakso
Although elevated surface ozone (O3) concentrations are observed in many areas within southern Africa, few studies have investigated the regional atmospheric chemistry and dominant atmospheric processes driving surface O3 formation in this region. Therefore, an assessment of comprehensive continuous surface O3 measurements performed at four sites in continental South Africa was conducted. The regional O3 problem was evident, with O3 concentrations regularly exceeding the South African air quality standard limit, while O3 levels were higher compared to other background sites in the Southern Hemisphere. The temporal O3 patterns observed at the four sites resembled typical trends for O3 in continental South Africa, with O3 concentrations peaking in late winter and early spring. Increased O3 concentrations in winter were indicative of increased emissions of O3 precursors from household combustion and other low-level sources, while a spring maximum observed at all the sites was attributed to increased regional biomass burning. Source area maps of O3 and CO indicated significantly higher O3 and CO concentrations associated with air masses passing over a region with increased seasonal open biomass burning, which indicated CO associated with open biomass burning as a major source of O3 in continental South Africa. A strong correlation between O3 on CO was observed, while O3 levels remained relatively constant or decreased with increasing NOx, which supports a VOC-limited regime. The instantaneous production rate of O3 calculated at Welgegund indicated that ∼40 % of O3 production occurred in the VOC-limited regime. The relationship between O3 and precursor species suggests that continental South Africa can be considered VOC limited, which can be attributed to high anthropogenic emissions of NOx in the interior of South Africa. The study indicated that the most effective emission control strategy to reduce O3 levels in continental South Africa should be CO and VOC reduction, mainly associated with household combustion and regional open biomass burning.


High surface O3 concentrations are a serious environmental concern due to their detrimental impacts on human health, crops and vegetation (NRC, 1991). Photochemical smog, comprising O3 as a constituent together with other atmospheric oxidants, is a major air quality concern on urban and regional scales. Tropospheric O3 is also a greenhouse gas that directly contributes to global warming (IPCC, 2013).
Tropospheric O3 concentrations are regulated by three processes, i.e. chemical production–destruction, atmospheric transport, and losses to the surface through dry deposition (Monks et al., 2015). The photolysis of nitrogen dioxide (NO2) in the presence of sunlight is the only known way of producing O3 in the troposphere (Logan, 1985). O3 can recombine with nitric oxide (NO) to regenerate NO2, which will again undergo photolysis to regenerate O3 and NO. This continuous process is known as the NOx-dependent photostationary state (PSS) and results in no net production or consumption of ozone (null cycle). However, net production of O3 in the troposphere occurs outside the PSS when peroxy radicals (HO2 and RO2) alter the PSS by oxidizing NO to produce “new” NO2 (Cazorla and Brune, 2010), resulting in net O3 production. The main source of these peroxy radicals in the atmosphere is the reaction of the hydroxyl radical (OH•) with volatile organic compounds (VOCs) or carbon monoxide (CO) (Cazorla and Brune, 2010).
O3 precursor species can be emitted from natural and anthropogenic sources. Fossil fuel combustion is considered to be the main source of NOx in South Africa, which includes coal-fired power generation, petrochemical operations, transportation, and residential burning (Wells et al., 1996; Held et al., 1996). Satellite observations indicate a well-known NO2 hotspot over the South African Highveld (Lourens et al., 2012) attributed to industrial activity in the region. CO is produced from three major sources, i.e. fossil fuel combustion, biomass burning, and the oxidation of methane (CH4) and VOCs (Novelli et al., 1992). Anthropogenic sources of VOCs are largely due to industrial and vehicular emissions (Jaars et al., 2014), while biogenic VOCs are also naturally emitted (Jaars et al., 2016). Regional biomass burning, which includes household combustion for space heating and cooking, agricultural waste burning, and open biomass burning (wild fires), is a significant source of CO, NOx, and VOCs (Macdonald et al., 2011; Crutzen and Andreae, 1990; Galanter et al., 2000; Simpson et al., 2011) in southern Africa. In addition, stratospheric intrusions of O3-rich air to the free troposphere can also lead to elevated tropospheric O3 concentrations (Diab et al., 1996, 2004). O3 production from natural precursor sources, the long-range transport of O3, and the injections from stratospheric O3 contribute to background O3 levels, which is beyond the control of regulators (Lin et al., 2012).
Since O3 concentrations are regulated in South Africa, O3 monitoring is carried out across South Africa through a network of air quality monitoring stations established mainly by provincial governments, local municipalities, and industries (http://www.saaqis.org.za, last access: 30 November 2017). High O3 concentrations are observed in many areas within the interior of South Africa, which exceed the South African standard O3 limit, i.e. an 8 h moving average of 61 ppb (e.g. Laakso et al., 2013). These exceedances can be attributed to high anthropogenic emissions of NOx and VOCs in dense urban and industrial areas (Jaars et al., 2014), regional biomass burning (Lourens et al., 2011), and O3-conducive meteorological conditions (e.g. sunlight). Since O3 is a secondary pollutant, high levels of O3 can also be found in rural areas downwind of city centres and industrial areas. In order for South Africa to develop an effective management plan to reduce O3 concentrations by controlling NOx and VOC emissions, it is important to determine whether a region is NOx or VOC limited. However, O3 production has a complex and non-linear dependence on precursor emissions (e.g. NRC, 1991), which makes its atmospheric levels difficult to control (Holloway and Wayne, 2010). Under VOC-limited conditions, O3 concentrations increase with increasing VOCs, while a region is considered NOx limited when O3 production increases with increasing NOx concentrations. Results from a photochemical box model study in South Africa, for instance, revealed that the Johannesburg–Pretoria megacity is within a VOC-limited regime (Lourens et al., 2016). VOC reductions would, therefore, be most effective in reducing O3, while NOx controls without VOC controls may lead to O3 increases. In general, it is considered that O3 formations in regions close to anthropogenic sources are VOC limited, while rural areas distant from source regions are NOx limited (Sillman, 1999).
Previous assessments of tropospheric O3 over continental South Africa have focused on surface O3 (Venter et al., 2012; Laakso et al., 2012; Lourens et al., 2011; Josipovic et al., 2010; Zunckel et al., 2004), as well as free tropospheric O3 based on soundings and aircraft observations (Diab et al., 1996, 2004; Thompson, 1996; Swap et al., 2003). Two major field campaigns (SAFARI-92 and SAFARI 2000) were conducted to improve the understanding of the effects of regional biomass burning emissions on O3 over southern Africa. These studies indicated a late winter–early spring (August and September) maximum over the region that was mainly attributed to increased regional open biomass burning during this period, while Lourens et al. (2011) also attributed higher O3 concentrations in spring in the Mpumalanga Highveld to increased regional open biomass burning. A more recent study demonstrated that NOx strongly affects O3 levels in the Highveld, especially in winter and spring (Balashov et al., 2014). A regional photochemical modelling study (Zunckel et al., 2006) has attempted to explain surface O3 variability, which found no dominant source(s) of elevated O3 levels.
The aim of the current study is to provide an up-to-date assessment of the seasonal and diurnal variations in surface O3 concentrations over continental South Africa, as well as to identify local and regional sources of precursors contributing to surface O3. Another objective is to use available ambient data to qualitatively assess whether O3 formation is NOx or VOC limited in different environments. An understanding of the key precursors that control surface O3 production is critical for the development of an effective O3 control strategy.
2.1 Study area and measurement stations
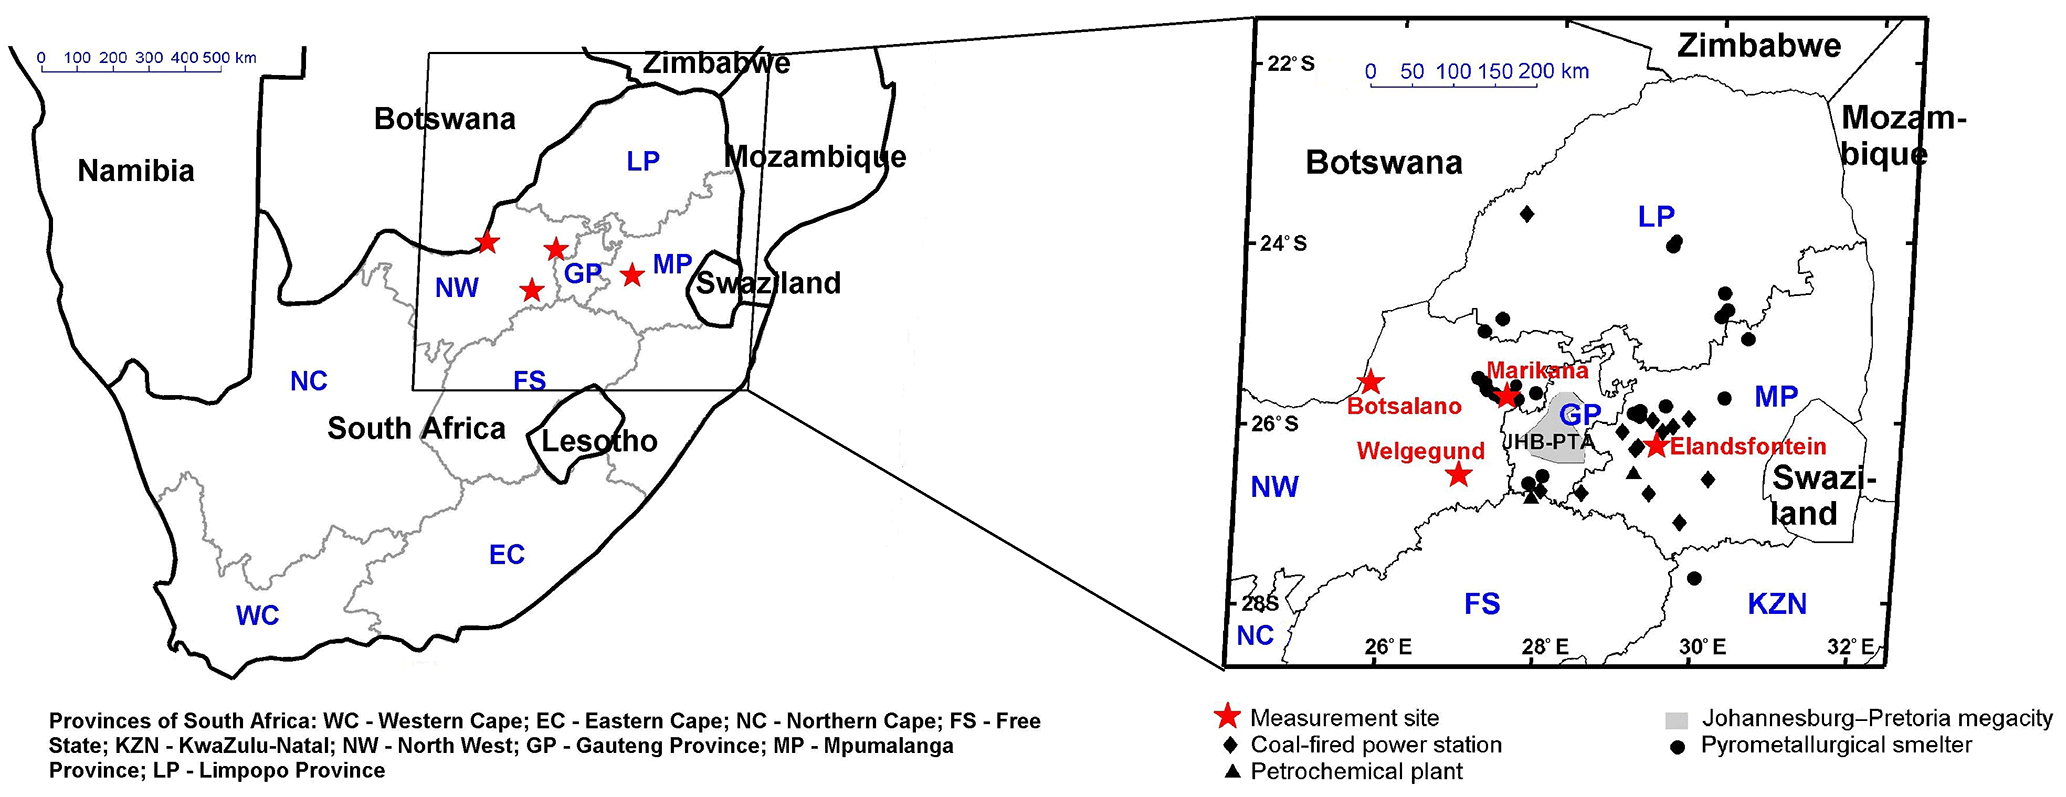
Continuous in situ O3 measurements obtained from four research stations in the north-eastern interior of South Africa, indicated in Fig. 1, which include Botsalano (25.54∘ S, 25.75∘ E, 1420 m a.s.l.), Marikana (25.70∘ S, 27.48∘ E, 1170 m a.s.l.), Welgegund (26.57∘ S, 26.94∘ E, 1480 m a.s.l.), and Elandsfontein (26.25∘ S, 29.42∘ E, 1750 m a.s.l.), were analysed. This region is the largest industrial (indicated by major point sources in Fig. 1) area in South Africa, with substantial gaseous and particulate emissions from numerous industries, domestic fuel burning, and vehicles (Lourens et al., 2012, 2011), while the Johannesburg–Pretoria megacity is also located in this area (Fig. 1). A combination of meteorology and anthropogenic activities has amplified the pollution levels within the region. The seasons in South Africa correspond to typical austral seasons, i.e. winter from June to August, spring from September to November, summer from December to February and autumn from March to May. The climate is semi-arid with an annual average precipitation of approximately 400 to 500 mm (Klopper et al., 2006; Dyson et al., 2015), although there is considerable inter-annual variability associated with the El Niño–Southern Oscillation (ENSO) phenomenon. Precipitation in the north-eastern interior occurs mostly during the austral summer, from October to March, whereas the region is characterized by a distinct cold and dry season from May to September, i.e. late autumn to mid-spring, during which almost no precipitation occurs. During this period, the formation of several inversion layers is present in the region, which limits the vertical dilution of air pollution, while more pronounced anticyclonic recirculation of air masses also occurs. This synoptic-scale meteorological environment leads to an accumulation of pollutants in the lower troposphere in this region, which can be transported for several days (Tyson and Preston-Whyte, 2000; Garstang et al., 1996). The SAFARI-92 and SAFARI 2000 campaigns indicated that locations in southern Africa, thousands of kilometres apart, are linked through regional anticyclonic circulation (Swap et al., 2003).
2.1.1 Botsalano
The Botsalano measurement site is situated in a game reserve in the North West Province of South Africa, which is considered to be representative of regional background air. The surrounding vegetation is typical of a savannah biome, consisting of grasslands with scattered shrubs and trees (Laakso et al., 2008). The area is quite sparsely populated and has no local anthropogenic pollution sources (Laakso et al., 2008; Vakkari et al., 2013). The western Bushveld Igneous Complex, where numerous platinum, base metal, vanadium, and chromium mining–smelting industries are situated, is the largest regional anthropogenic pollution source, with the Rustenburg area located approximately 150 km to the east. Botsalano is also occasionally impacted by plumes passing over the industrialized Mpumalanga Highveld and the Johannesburg–Pretoria megacity (Laakso et al., 2008; Vakkari et al., 2011). In addition, the site is influenced by seasonal regional savannah wildfires during the dry period (Laakso et al., 2008; Vakkari et al., 2011; Mafusire et al., 2016). Measurements were conducted from 20 July 2006 until 5 February 2008 (Laakso et al., 2008; Vakkari et al., 2011, 2013).
2.1.2 Marikana
The Marikana measurement site is located within the western Bushveld Igneous Complex, which is a densely populated and highly industrialized region, where mining and smelting are the predominant industrial activities. Marikana is a small mining town located approximately 30 km east of Rustenburg and approximately 100 km north-west of Johannesburg. The measurement site is located in the midst of a residential area, comprising low-cost housing settlements and municipal buildings (Hirsikko et al., 2012; Venter et al., 2012). Anthropogenic emissions from household combustion, traffic, and industry in the wider region have a strong influence on the measurement site (Venter et al., 2012). Data were collected from 8 February 2008 to 16 May 2010 and have been previously used in other studies (Venter et al., 2012; Vakkari et al., 2013; Petäjä et al., 2013; Hirsikko et al., 2012, 2013).
2.1.3 Welgegund
This measurement site is approximately 100 km west of Johannesburg and is located on a commercial arable and pastoral farm. The station is surrounded by grassland savannah (Jaars et al., 2016). The station can be considered a regionally representative background site with few local anthropogenic sources. Air masses arriving at Welgegund from the west reflect a relatively clean regional background. However, the site is, similar to the Botsalano station, at times impacted by polluted air masses that are advected over major anthropogenic source regions in the interior of South Africa, which include the western Bushveld Igneous Complex, the Johannesburg–Pretoria megacity, the Mpumalanga Highveld, and the Vaal Triangle (Tiitta et al., 2014; Jaars et al., 2016; Venter et al., 2017). In addition, Welgegund is also affected by regional savannah and grassland fires that are common in the dry season (Vakkari et al., 2014). The atmospheric measurement station has been operating at Welgegund since 20 May 2010, with data measured up until 31 December 2015 utilized in this study.
2.1.4 Elandsfontein
Elandsfontein is an ambient air quality monitoring station operated by Eskom, the national electricity supply company, primarily for legislative compliance purposes. This station was upgraded and co-managed by researchers during the EUCAARI project (Laakso et al., 2012). The Elandsfontein station is located within the industrialized Mpumalanga Highveld at the top of a hill approximately 200 km east of Johannesburg and 45 km south-south-east of eMalahleni (previously known as Witbank), which is a coal mining area (Laakso et al., 2012). The site is influenced by several emission sources, such as coal mines, coal-fired power-generating stations, a large petrochemical plant, and traffic emissions. Metallurgical smelters to the north also frequently impact the site (Laakso et al., 2012). The Elandsfontein dataset covers the period 11 February 2009 until 31 December 2010 during the EUCAARI campaign (Laakso et al., 2012).
2.2 Measurements
A comprehensive dataset of continuous measurements of surface aerosols, trace gases, and meteorological parameters has been acquired through these four measurement sites (Laakso et al., 2008, 2012; Vakkari et al., 2011, 2013; Venter et al., 2012; Petäjä et al., 2013). In particular, measurements of ozone (O3), nitric oxide (NO), nitrogen dioxide (NO2), and carbon monoxide (CO), as well as meteorological parameters, such as temperature (∘C) and relative humidity (RH, %), were used in this study. Note that Botsalano, Marikana, and Welgegund measurements were obtained with the same mobile station (first located at Botsalano, then relocated to Marikana and thereafter permanently positioned at Welgegund), while Elandsfontein measurements were conducted with a routine monitoring station. O3 concentrations at Welgegund, Botsalano, and Marikana research stations were measured using the Environment SA 41M O3 analyser, while a Monitor Europe ML9810B O3 analyser was utilized at Elandsfontein. CO concentrations were determined at Welgegund, Botsalano, and Marikana with a Horiba APMA-360 analyser, while CO was not measured at Elandsfontein. NOx (NO+NO2) concentrations were determined with a Teledyne 200AU NO∕NOx analyser at Welgegund, Botsalano and Marikana, whereas a Thermo Electron 42i NO-NO2-NOx analyser was used at Elandsfontein. Temperature and RH were measured with a Rotronic MP 101A instrument at all the sites.
Data quality at these four measurement sites was ensured through regular visits to the sites, during which instrument maintenance and calibrations were performed. The data collected from these four stations were subjected to detailed cleaning (e.g. excluding measurements recorded during power interruptions, electronic malfunctions, calibrations, and maintenance) and the verification of data quality procedures (e.g. corrections were made to data according to in situ calibrations and flow checks). Therefore, the datasets collected at all four measurement sites are considered to represent high-quality, high-resolution measurements as indicated by other papers (Laakso et al., 2008, 2012; Petäjä et al., 2013; Venter et al., 2012; 2011; Vakkari et al., 2013). Detailed descriptions of the data post-processing procedures were presented by Laakso et al. (2008) and Venter et al. (2012). The data were available as 15 min averages and all plots using local time (LT) refer to local South African time, which is UTC + 2.
In order to obtain a representative spatial coverage of continental South Africa, O3 data from an additional 54 ambient monitoring sites were selected. These included O3 measurements from 18 routine monitoring station measurements (SAAQIS) for the period from January 2012 to December 2014 (downloaded from the JOIN web interface https://join.fz-juelich.de, last access: 15 July 2017; Schultz et al., 2017) and 36 passive sampling sites located in the north-eastern interior of South Africa where monthly O3 concentrations were determined for 2 years from 2006 to 2007 (Josipovic, 2009). Spatial analyses were conducted with a geographic information system mapping tool (ArcGIS software), which used ordinary kriging to interpolate the O3 concentrations measured at the 58 sites in order to build the spatial distribution. The interpolation method involved making an 80/20 % split of the data (80 % for model development, 20 % for evaluation), in which 20 % was used to calculate the root-mean-square error (RMSE =0.2804331). Optimal model parameters were selected using an iterative process and evaluated on the basis of the best performance statistics obtained (reported in the ArcGIS kriging output), with particular emphasis on minimizing the RMSE. The extent of area was 23.00154974 (top), −29.03070026 (bottom), 25.74238974 (left), and 32.85246366 (right).
2.3 Air mass history
Individual hourly 4-day back trajectories for air masses arriving at an arrival height of 100 m above ground level were calculated for the entire measurement period at each monitoring site, using HYSPLIT 4.8 (Hybrid Single-Particle Lagrangian Integrated Trajectory model) (Stein et al., 2015; Draxler and Hess, 1998). The model was run with the GDAS meteorological archive produced by the US National Weather Service's National Centre for Environmental Prediction (NCEP) and archived by ARL (Air Resources Laboratory, 2017). Overlay back trajectory maps were generated by superimposing individual back trajectories onto a southern African map divided into grid cells. In addition, source maps were compiled by assigning each grid cell with a mean measured O3 and CO concentration associated with trajectories passing over that cell, similar to previous methods (Vakkari et al., 2011, 2013; Tiitta et al., 2014). A minimum of 10 trajectories per cell were required for the statistical reliability.
2.4 Modelling instantaneous production rate of O3
The only speciated VOC dataset available and published in South Africa exists for Welgegund (Jaars et al., 2016, 2014), which could be used to model instantaneous O3 production at this site. The concentration of these biogenic and anthropogenic VOCs was obtained from grab samples taken between 11:00 and 13:00 LT over the course of two extensive field campaigns conducted from February 2011 to February 2012 and from December 2013 to February 2015. During this time, six trace gases, 19 biogenic VOCs, and 20 anthropogenic VOCs, including 13 aromatic and seven aliphatic compounds were measured. The VOC reactivity was calculated from the respective rate coefficients of each VOC with •OH radicals obtained from chemical kinetic databases such as JPL, NIST, and the MCM (e.g. Jaars et al., 2014) to estimate ozone production at 11:00 LT at Welgegund. Specifically, each VOC reactivity was then summed to obtain the total VOC reactivity for each measurement, i.e. VOC reactivity . The major contributors to VOC reactivity are depicted in Fig. A1 and include, in approximate order of contribution, o-xylene, CO, styrene, p,m-xylene, toluene, ethylbenzene limonene, isoprene, α-pinene, β-pinene, and hexane. Of note, key compounds such as methane are not included, which could contribute to VOC reactivity, and therefore this VOC reactivity can only be a lower estimate. However, if a global ambient concentration of 1.85 ppm and a rate of oxidation by •OH radicals of cm3 molec−1 s−1 are assumed (Srinivasan et al., 2005), a VOC reactivity of 0.3 s−1 would be obtained and would therefore account for a small increase in the VOC reactivity calculated in Figs. A1 and 10.
A mathematical box model was applied to model O3 production as a function of VOC reactivity and NO2 concentrations. This model involves three steps, i.e. (1) the estimation of HOx (sum of •OH and radicals) production, (2) the estimation of the •OH radical concentration, and (3) the calculation for O3 production (Murphy et al., 2006; Geddes et al., 2009). The VOC concentrations are the limiting factor in the ability to model O3 production at Welgegund since only data for the 11:00 to 13:00 LT grab samples were available (Fig. A1). Therefore, the model approach does not coincide with peak O3 typically observed around 14:00 to 15:00 LT and therefore likely represents a lower estimate.

Figure 2Seasonal and diurnal variation in median O3 concentrations at Welgegund, Botsalano, Marikana, and Elandsfontein. The O3 measurement periods varied among sites, which combined spanned a period from July 2006 to December 2015.
The production rate of HOx (P(HOx)) depends on the photolysis rate of O3 (), concentration of O3, and vapour pressure of water (Jaeglé et al., 2001). The photolysis rate proposed for the Southern Hemisphere, i.e. s−1 (Wilson, 2015), was used, from which P(HOx) was calculated as follows:
and estimated to be 6.09×10⁶ molec cm−3 s−1 or 0.89 ppbv h−1 (calculated for a campaign O3 average of 41 ppbv and a campaign RH average of 42 % at 11:00 LT each day) at STP. The P(HOx) at Welgegund is approximately a factor of 2 lower compared to other reported urban P(HOx) values (Geddes et al., 2009). The factors and reactions that affect [•OH] include
-
linear dependency between •OH and NOx due to the reaction , until •OH begins to react with elevated NO2 concentrations to form HNO3 ();
-
P(HOx) affected by solar irradiance, temperature, O3 concentrations, and humidity; and
-
partitioning of HOx among RO2, HO2, and OH.
[•OH] was calculated at 11:00 LT each day as follows:
The instantaneous production rate of O3, P(O3), could then be calculated as a function of NO2 levels and VOC reactivity. A set of reactions used to derive the equations that describe the dependence of the •OH, peroxy radicals (), and P(O3) on NOx is given by Murphy et al. (2006), which presents the following equation to calculate P(O3):
where k2eff is the effective rate constant of NO oxidation by peroxy radicals (chain propagation and termination reactions in the production of O3). The values of the rate constants and other parameters used as input parameters to solve the equation above can be found in Murphy et al. (2006) and Geddes et al. (2009).
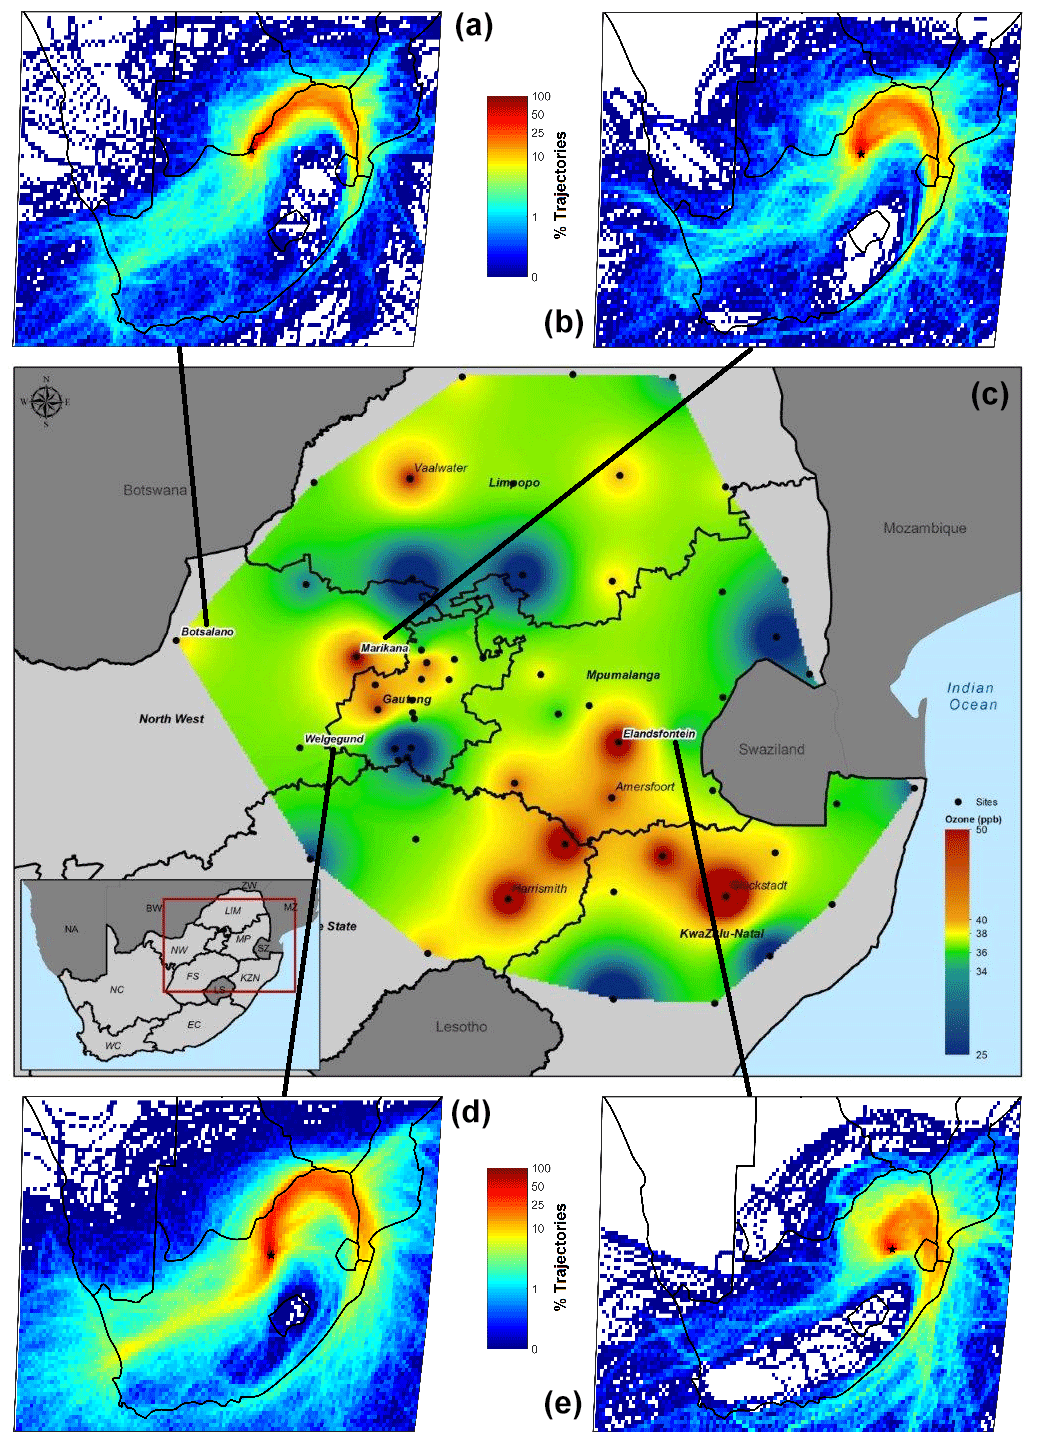
Figure 3The main (central) map indicating spatial distribution of mean surface O3 levels during springtime over the north-eastern interior of southern Africa ranging between 23.00 and 29.03∘ S and between 25.74 and 32.85∘ E. The data for all sites were averaged for years when the ENSO cycle was not present (by examining sea surface temperature anomalies in the Niño 3.4 region). Black dots indicate the sampling sites. The smaller maps (top and bottom) indicate 96 h overlay back trajectory maps for the four main study sites, over the corresponding springtime periods.
3.1 Temporal variation in O3
In Fig. 2, the monthly and diurnal variations for O3 concentrations measured at the four sites in this study are presented (time series plotted in Fig. A2). Although there is some variability among the sites, monthly O3 concentrations show a well-defined seasonal variation at all four sites, with maximum concentrations occurring in late winter and spring (August to November), which is expected for the South African interior as indicated above and previously reported (Zunckel et al., 2004; Diab et al., 2004). In Fig. A3 monthly averages of meteorological parameters and total monthly rainfall for Welgegund are presented to indicate typical seasonal meteorological patterns for continental South Africa. These O3 peaks in continental South Africa generally point to two major contributors of O3 precursors, i.e. open biomass burning (wild fires) (Vakkari et al., 2014) and increased low-level anthropogenic emissions, e.g. increased household combustion for space heating and cooking (Oltmans et al., 2013; Lourens et al., 2011). In addition to the seasonal patterns of O3 precursor species, during the dry winter months, synoptic-scale recirculation is more predominant and inversion layers are more pronounced, while precipitation is minimal (e.g. Tyson and Preston-Whyte, 2000). These changes in meteorology result in the build-up of precursor species that reach a maximum in August–September when photochemical activity starts to increase. The diurnal concentration profiles of O3 at the four locations follow the typical photochemical cycle, i.e. increasing during daytime in response to maximum photochemical production and decreasing during the night-time due to titration with NO. O3 levels peaked from midday to afternoon, with a maximum at approximately 15:00 (LT, UTC + 2). From Fig. 2, it is also evident that night-time titration of O3 at Marikana is more pronounced, as indicated by the largest difference between daytime and night-time O3 concentrations in comparison to the other sites, especially compared to Elandsfontein where night-time concentrations of O3 remain relatively high in winter.
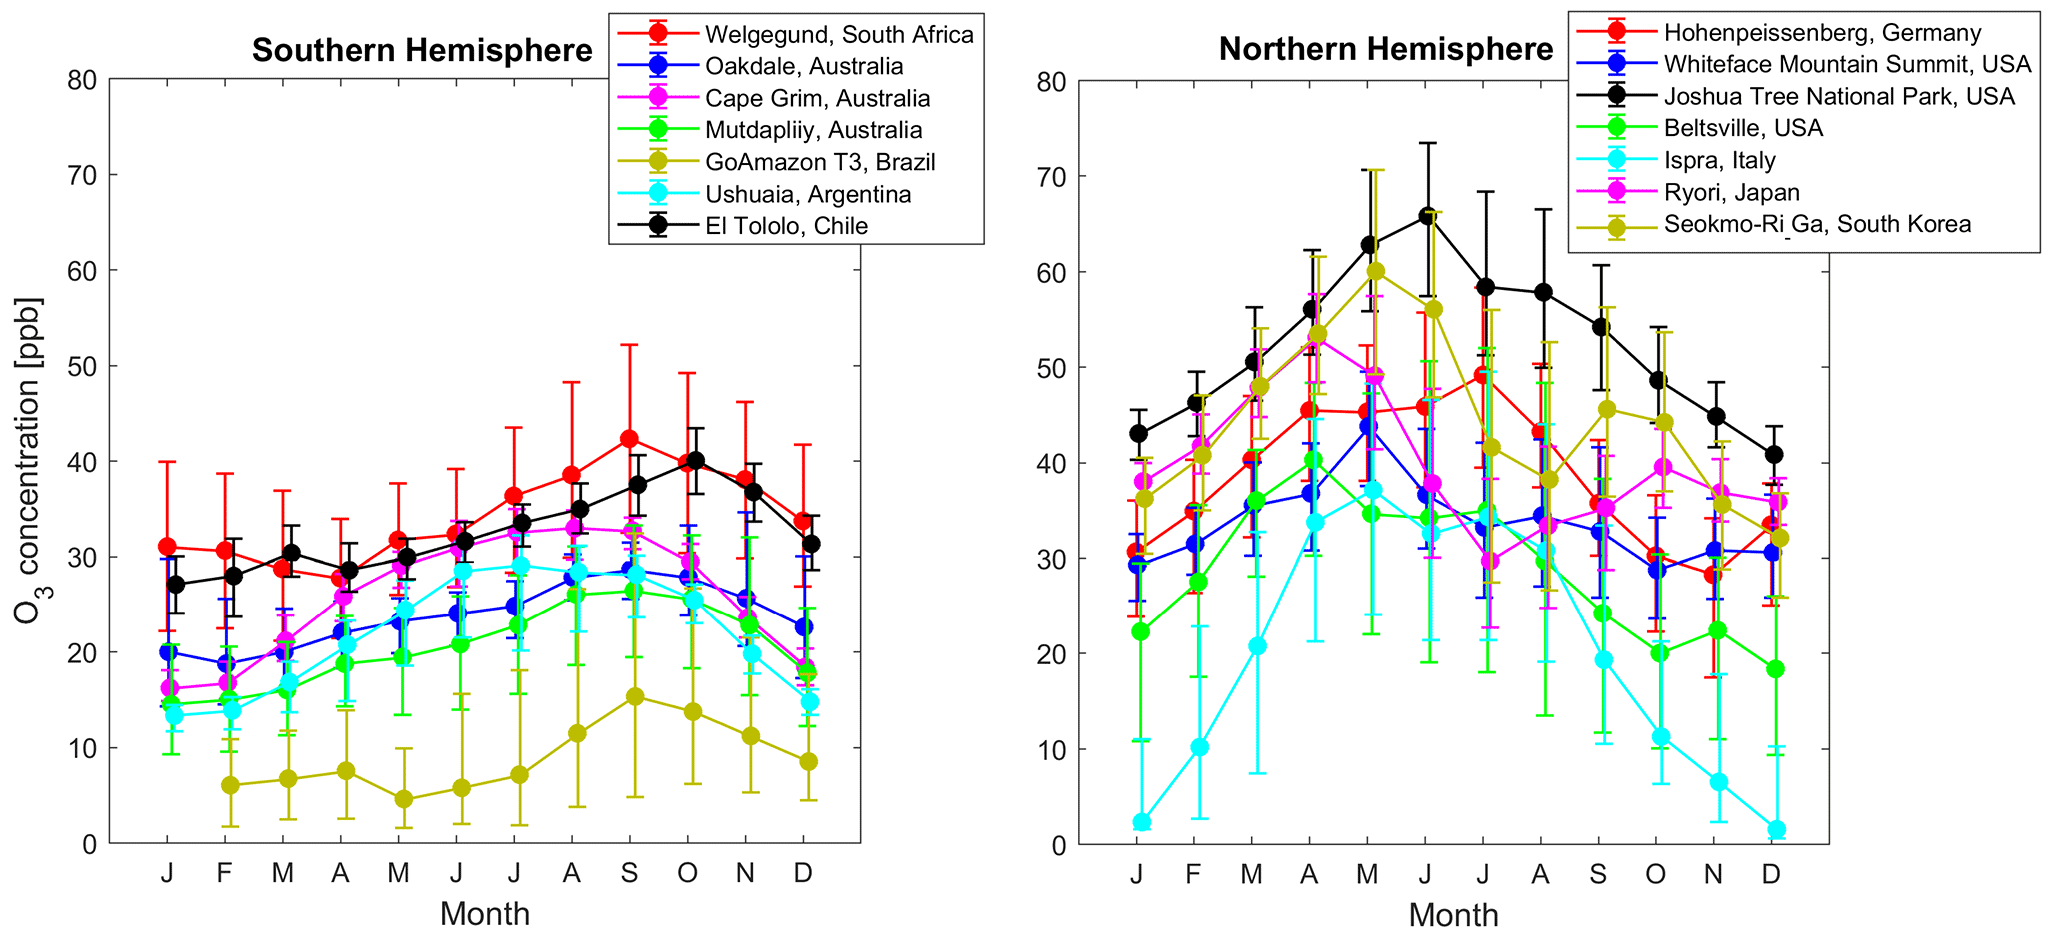
Figure 4Seasonal cycle of O3 at rural sites in other parts of the world. The dots indicate monthly median (50th percentile) and the upper and lower limits the 25th and 75th percentiles, respectively, for monthly O3 concentrations. The data are averaged from May 2010 to December 2014, except in a few instances in which 2014 data were not available.
3.2 Spatial distribution of O3 in continental South Africa
Figure 3 depicts the spatial pattern of mean surface O3 concentrations over continental South Africa during springtime (September–October–November), when O3 is usually at a maximum, as indicated above. Also presented in Fig. 3, are 96 h overlay back trajectory maps for the four main study sites over the corresponding springtime periods. The mean O3 concentration over continental South Africa ranged from 20 to 60 ppb during spring. From Fig. 3, it can be seen that O3 concentrations at the industrial sites Marikana and Elandsfontein were higher than O3 levels at Botsalano and Welgegund. As mentioned previously, Elandsfontein is located within the industrialized Mpumalanga Highveld with numerous large point sources of O3 precursor species. It is also evident from Fig. 3 that rural measurement sites downwind from Elandsfontein, such as Amersfoort, Harrismith, and Glückstadt had significantly higher O3 concentrations, which can be attributed to the formation of O3 during the transport of precursor species from source regions. Lourens et al. (2011) indicated that higher O3 concentrations were associated with sites positioned in more rural areas in the Mpumalanga Highveld. Venter et al. (2012) attributed high O3 concentrations at Marikana, which exceeded South African standard limits on a number of occasions, to the influence of local household combustion for cooking and space heating, as well as to regional air masses with high O3 precursor concentrations. Higher O3 concentrations were also measured in the north-western parts of Gauteng, at sites situated within close proximity to the Johannesburg–Pretoria megacity, while the rural Vaalwater site in the north also has significantly higher O3 levels. From Fig. 3, it is evident that O3 can be considered a regional problem, with O3 concentrations being relatively high across continental South Africa during spring. Figure 3 also clearly indicates that the four research sites where surface O3 was assessed in this study are representative of continental South Africa.
3.3 Comparison with international sites
In an effort to contextualize the O3 levels measured in this study, the monthly O3 concentrations measured at Welgegund were compared to monthly O3 levels measured at monitoring sites in other parts of the world (downloaded from the JOIN web interface https://join.fz-juelich.de; Schultz et al., 2017) as indicated in Fig. 4. Welgegund was used in the comparison since it had the most extensive data record, while the measurement time period considered was from May 2010 to December 2014. The seasonal O3 cycles observed at other sites in the Southern Hemisphere are comparable to the seasonal cycle at Welgegund, with slight variations in the time of year when O3 peaks, as indicated in Fig. 4. Cape Grim, Australia; GoAmazon T3 Manancapuru, Brazil; Ushuaia, Argentina; and Cerro Tololo, Chile, are regional background GAW (Global Atmosphere Watch) stations with O3 levels lower than the South African sites. However, the O3 concentrations at Cerro Tololo, Chile, are comparable to Welgegund. Oakdale, Australia, and Mutdapilly, Australia, are semi-rural and rural locations, which are influenced by urban and industrial pollution sources and also had lower O3 concentrations compared to Welgegund.
The northern hemispheric O3 peak over mid-latitude regions is similar to seasonal patterns in the Southern Hemisphere where a springtime O3 maximum is observed (i.e. Whiteface Mountain Summit, Beltsville, Ispra, Ryori, and Seokmo-Ri Ga). However, there are other sites in the Northern Hemisphere where a summer maximum is more evident (Vingarzan, 2004), i.e. Joshua Tree and Hohenpeissenberg. The discernible difference between the hemispheres is that the spring maximum in the Southern Hemisphere refers to maximum O3 concentrations in late winter and early spring, while in the Northern Hemisphere, it refers to a late spring and early summer O3 maximum (Cooper et al., 2014). The spring maximum in the Northern Hemisphere is associated with stratospheric intrusions (Zhang et al., 2014; Parrish et al., 2013), while the summer maximum is associated with photochemical O3 production from anthropogenic emissions of O3 precursors being at its highest (Logan, 1985; Chevalier et al., 2007). Maximum O3 concentrations at background sites in the United States and Europe are similar to values at Welgegund in spring with the exception of Joshua Tree National Park in the United States, which had significantly higher O3 levels. This is most likely due its high elevation and deep boundary layer (∼4 km a.s.l.) during spring and summer allowing free-tropospheric O3 to be more effectively mixed down to the surface (Cooper et al., 2014). Maximum O3 levels at the two sites in East Asia (Ryori and Seokmo-Ri Ga) were also generally higher than at Welgegund, especially at Seokmo-Ri Ga.
3.4 Sources contributing to surface O3 in continental South Africa
As indicated above (Sect. 3.1), the O3 peaks in continental South Africa usually reflect increased concentrations of precursor species from anthropogenic sources during winter, as well as the occurrence of regional open biomass burning in late winter and early spring. In addition, stratospheric O3 intrusions during spring (Lefohn et al., 2014) could also partially contribute to increased surface O3 levels.
3.4.1 Anthropogenic and open biomass burning emissions
A comparison of the O3 seasonal cycles at background and polluted locations is useful for source attribution. From Fig. 2, it is evident that daytime O3 levels peaked at Elandsfontein, Marikana and Welgegund during late winter and spring (August to October), while O3 levels at Botsalano peaked later in the year during spring (September to November). This suggests that Elandsfontein, Marikana and Welgegund were influenced by increased levels of O3 precursors from anthropogenic and open biomass burning emissions (i.e. NOx and CO indicated in Figs. A4 and A5, respectively – time series plotted in Figs. A7 and A8), while O3 levels at Botsalano were predominantly influenced by regional open biomass burning (Fig. A5). Although Welgegund and Botsalano are both background sites, Botsalano is more removed from anthropogenic source regions than Welgegund is (Sect. 2.1.3), which is therefore not directly influenced by the increased concentrations of O3 precursor species associated with anthropogenic emissions during winter. Daytime O3 concentrations were the highest at Marikana throughout most of the year, which indicates the influence of local and regional sources of O3 precursors at this site (Venter et al., 2012). In addition, a larger difference between O3 concentrations in summer and winter–spring is observed at Marikana compared to Welgegund and Botsalano, which can be attributed to local anthropogenic emissions (mainly household combustion) of O3 precursors at Marikana.
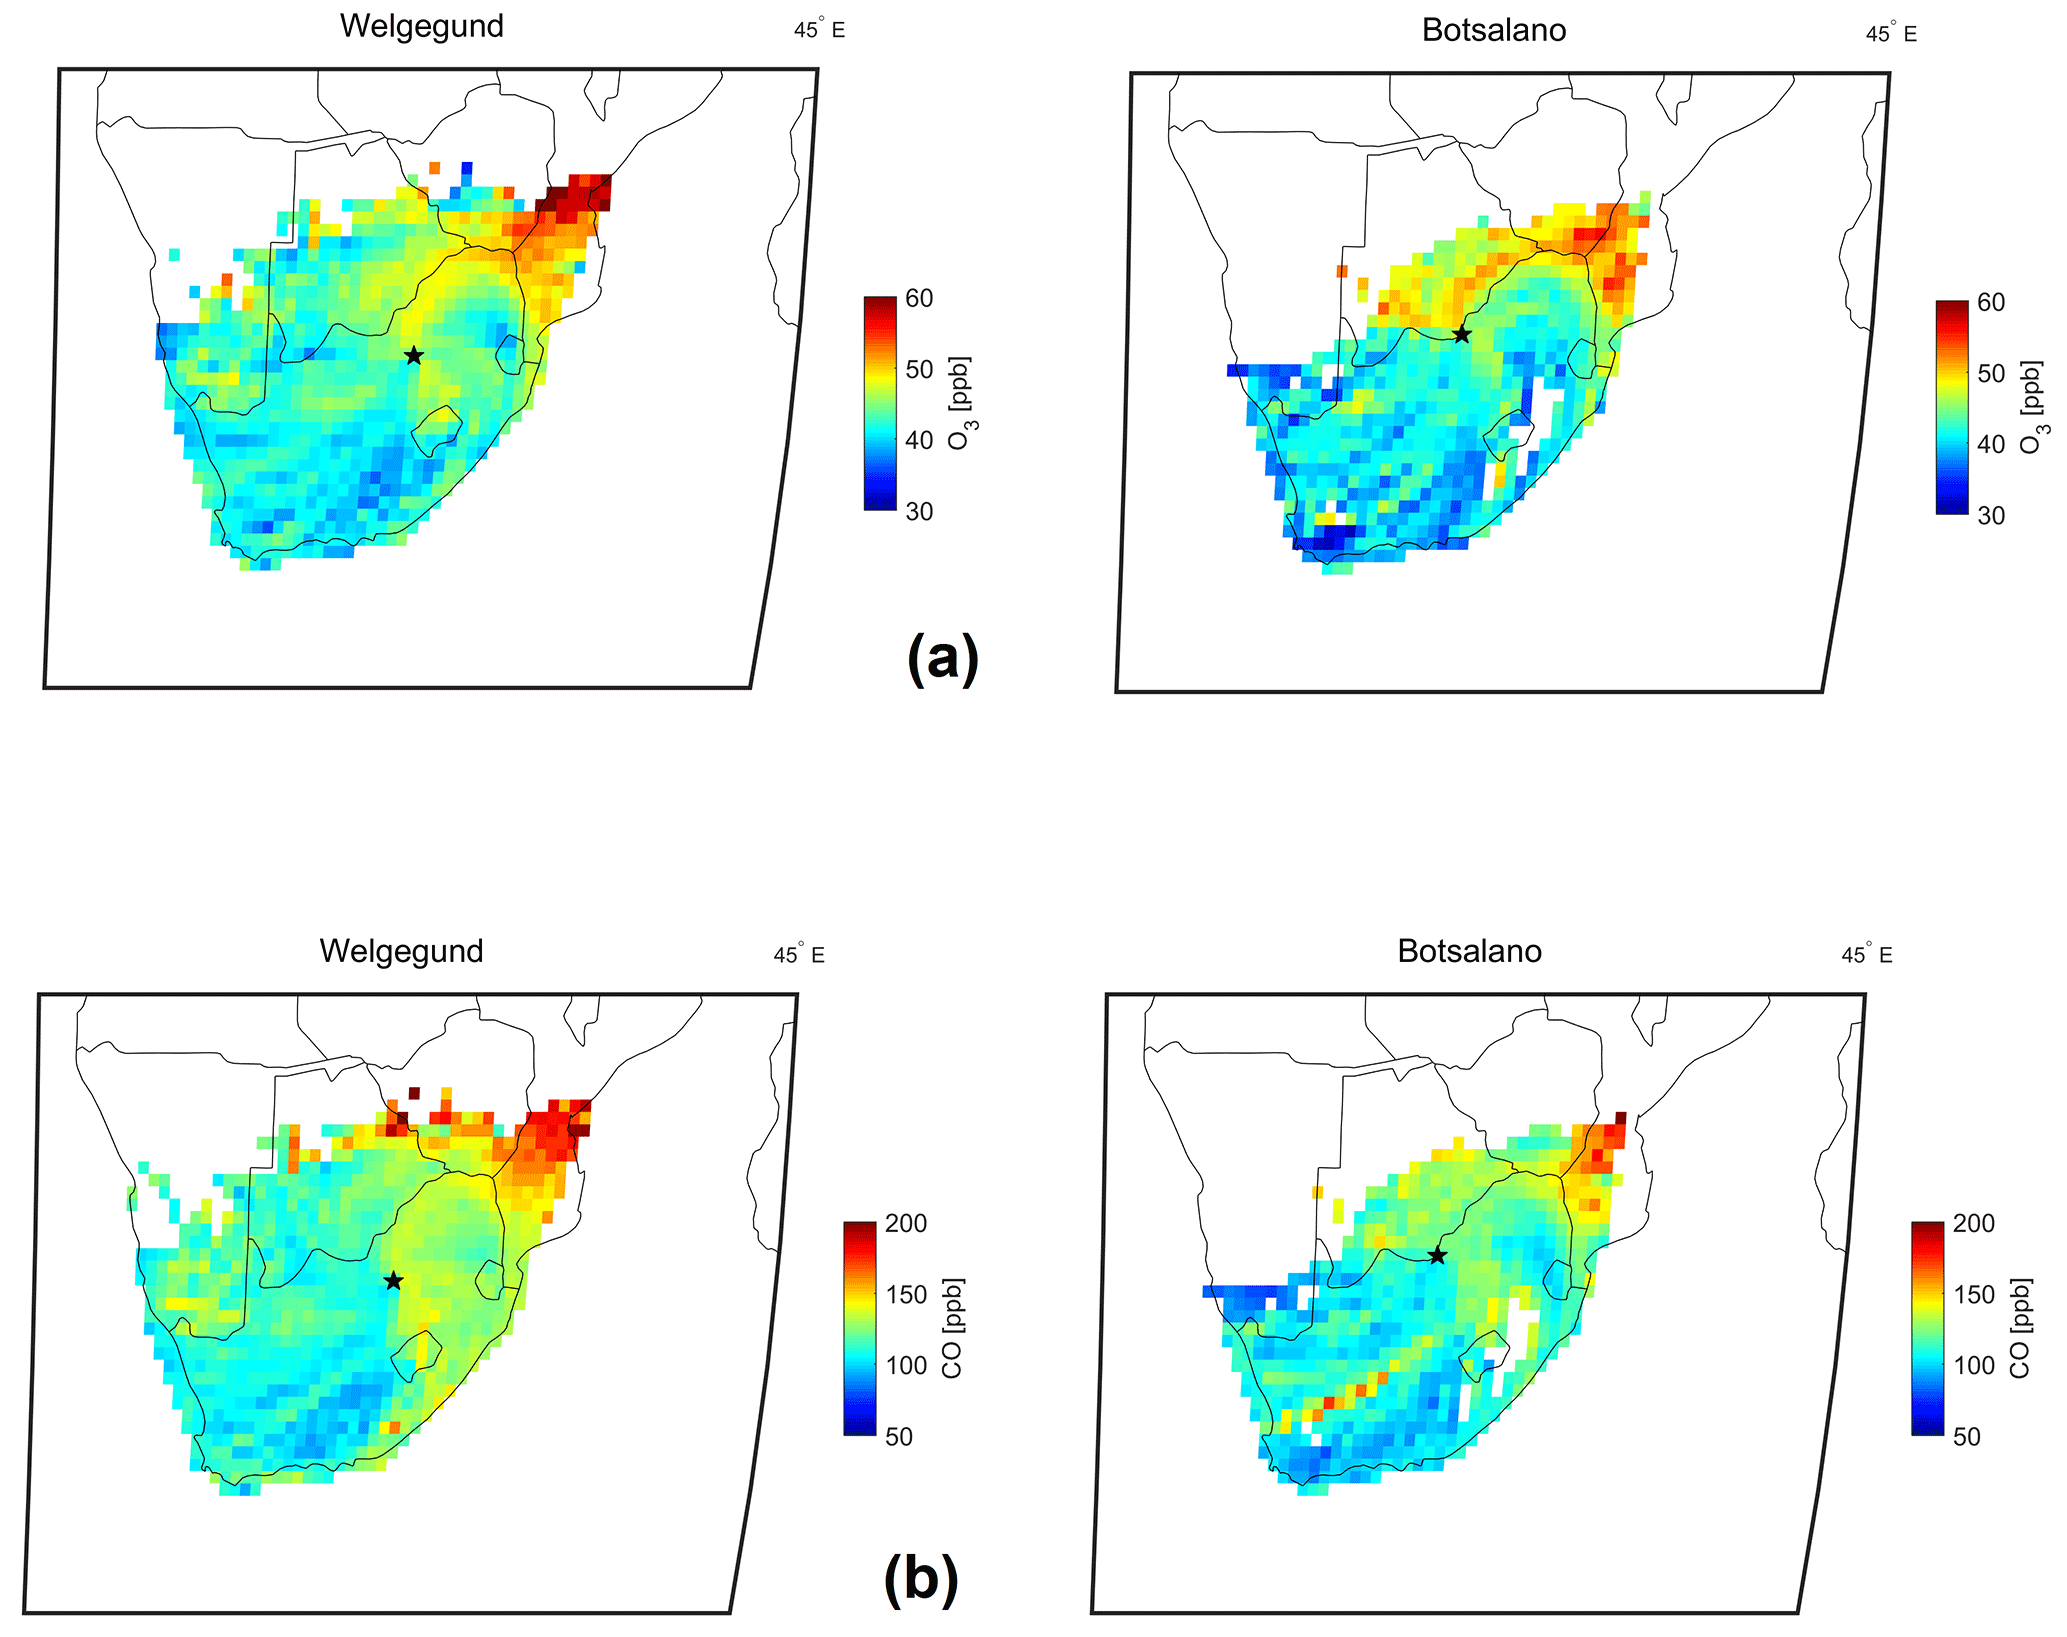
Figure 5Source area maps of (a) O3 concentrations and (b) CO concentrations for the background sites Welgegund and Botsalano. The black star represents the measurement site and the colour of each pixel represents the mean concentration of the respective gas species. At least 10 observations per pixel are required.
O3 concentrations at Elandsfontein were lower compared to the other three sites throughout the year, with the exception of the winter months (June to August). The major point sources at Elandsfontein include NOx emissions from coal-fired power stations and are characterized by high-stack emissions, which are emitted above the low-level night-time inversion layers. During daytime, downwards mixing of these emitted species occurs, which results in daytime peaks of NOx (as indicated in Fig. A4 and by Collett et al., 2010) and subsequent O3 titration. In contrast, Venter et al. (2012) indicated that, at Marikana, low-level emissions associated with household combustion for space heating and cooking were a significant source of O3 precursor species, i.e. NOx and CO. The diurnal pattern of NOx and CO (Figs. A4 and A5, respectively) at Marikana was characterized by bimodal peaks during the morning and evening, which resulted in increased O3 concentrations during daytime and night-time titration of O3, especially during winter. Therefore, the observed differences in night-time titration at Marikana and Elandsfontein can be attributed to different sources of O3 precursors, i.e. mainly low-level emissions (household combustion) at Marikana (Venter et al., 2012) compared to predominantly high-stack emissions at Elandsfontein (Collett et al., 2010). The higher O3 concentrations at Elandsfontein during winter are most likely attributed to the regional increase in O3 precursors.

Figure 6Spatial distribution of fires in 2007, 2010, and 2015 from the MODIS burnt area product. Blue stars indicate (from left to right) Botsalano, Welgegund, Marikana, and Elandsfontein.
The spring maximum O3 concentrations can be attributed to increases in widespread regional biomass burning in this region during this period (Vakkari et al., 2014; Lourens et al., 2011). Biomass burning has strong seasonality in southern Africa, extending from June to September (Galanter et al., 2000), and is an important source of O3 and its precursors during the dry season. In an effort to elucidate the influence of regional biomass burning on O3 concentrations in continental South Africa, source area maps of O3 were compiled by relating O3 concentrations measured with air mass history, which are presented in Fig. 5a. Source area maps were only generated for the background sites Welgegund and Botsalano since local sources at the industrial sites Elandsfontein and Marikana would obscure the influence of regional biomass burning. In addition, maps of spatial distribution of fires during 2007, 2010, and 2015 were compiled with the MODIS Collection 5 burnt area product (Roy et al., 2008, 2005, 2002) and are presented in Fig. 6.
The highest O3 concentrations measured at Welgegund and Marikana were associated with air masses passing over a sector north to north-east of these sites, i.e. southern and central Mozambique, southern Zimbabwe, and south-eastern Botswana. O3 concentrations associated with air masses passing over central and southern Mozambique were particularly high. In addition to O3 source maps, CO source maps were also compiled for Welgegund and Botsalano, as indicated in Fig. 5b. It is evident that the CO source maps indicated a similar pattern to that observed for O3, with the highest CO concentrations corresponding with the same regions where O3 levels are the highest. From the fire maps in Fig. 6, it can be observed that a large number of fires occur in the sector, associated with higher O3 and CO concentrations, with the fire map indicating, in particular, a high fire frequency occurring in central Mozambique. During 2007, more fires occurred in Botswana compared to the other two years, which is also reflected in the higher O3 levels measured at Botsalano during that year for air masses passing over this region. Open biomass burning is known to emit more CO than NOx, while CO also has a relatively long atmospheric lifetime (1 to 2 months; Kanakidou and Crutzen, 1999) compared to NOx (6 to 24 h, Beirle et al., 2003) and VOCs (a few hours to a few weeks; Kanakidou and Crutzen, 1999) emitted from open biomass burning. Enhanced CO concentrations have been used previously to characterize the dispersion of biomass burning emissions over southern Africa (Mafusire et al., 2016). Therefore, the regional transport of CO and VOCs (and NOx to a lesser extent) associated with biomass burning occurring from June to September in southern Africa can be considered an important source of surface O3 in continental South Africa (Fig. A5).
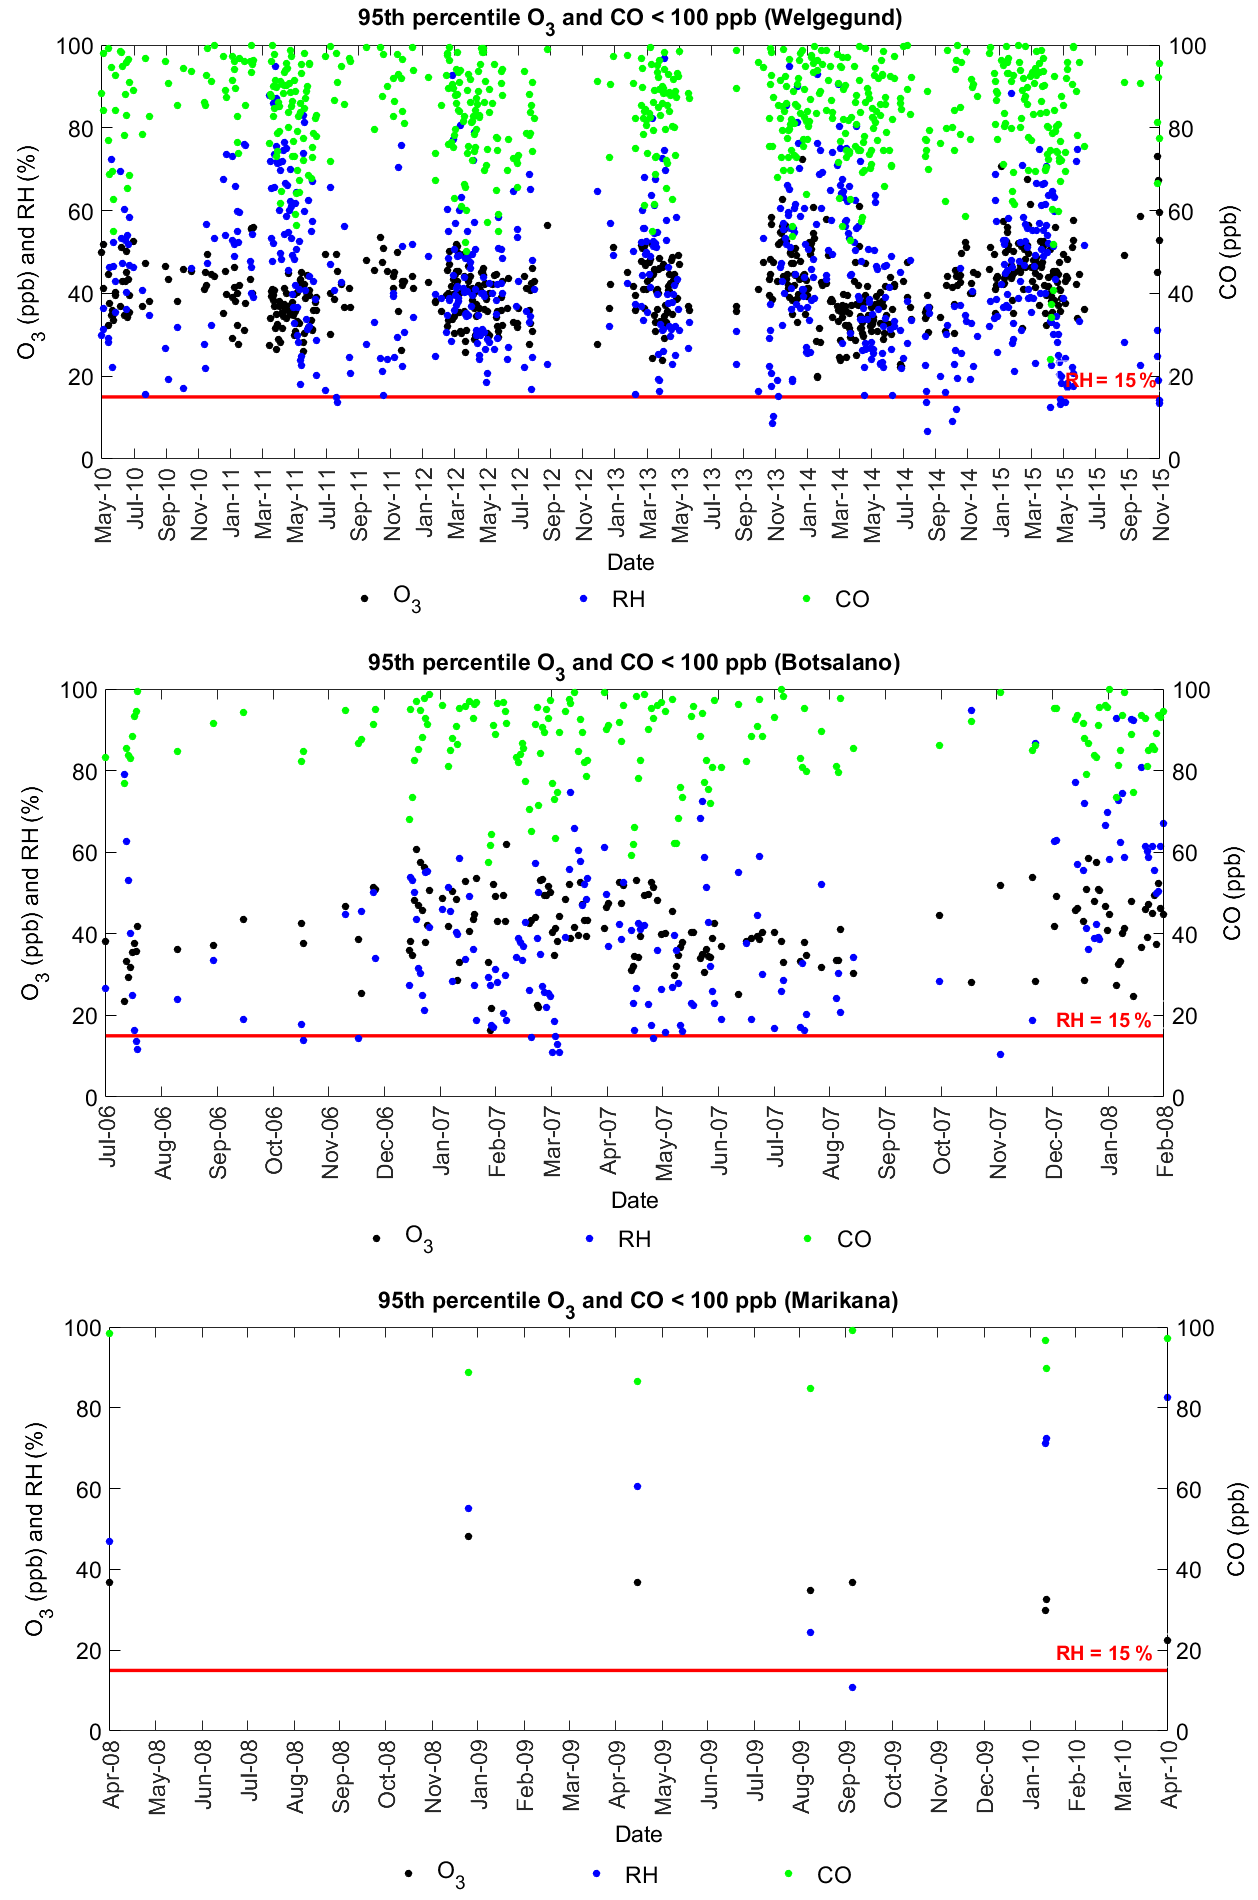
Figure 7Simultaneous measurements of O3 (daily 95th percentile), CO (daily average ppb), and RH (daily average) from 07:00 to 18:00 LT at Welgegund, Botsalano, and Marikana.
3.4.2 Stratospheric O3
Elevated levels of tropospheric O3 may also be caused by stratospheric intrusion of O3-rich air (Zhang et al., 2014; Parrish et al., 2013; Lin et al., 2012), especially on certain days during late winter and spring when O3 is the highest on the South African Highveld (Thompson et al., 2014). However, the importance of the stratospheric source over continental South Africa has not yet been specifically addressed. The assessment of meteorological fields and air quality data at high-elevation sites is required to determine the downward transport of stratospheric O3. Alternatively, stratospheric O3 intrusions can be estimated through concurrent in situ measurements of ground-level O3, CO, and humidity since stratospheric intrusions of O3 into the troposphere are characterized by elevated levels of O3, high potential vorticity, low levels of CO, and low water vapour (Stauffer et al., 2017; Thompson et al., 2015, 2014). Thompson et al. (2015) defined low CO as 80 to 110 ppbv, while low RH is considered <15 %. In Fig. 7, the 95th percentile O3 levels (indicative of “high O3”) corresponding to low daily average CO concentrations (<100 ppb) are presented together with the daily average RH. Only daytime data from 07:00 to 18:00 LT were considered in order to exclude the influence of night-time titration. From Fig. 7, it is evident that very few days complied with the criteria indicative of stratospheric O3 intrusion, i.e. high O3, low CO, and low RH, which indicates a very small influence of stratospheric intrusion on surface O3 levels. However, it must be noted that the attempt in this study to relate surface O3 to stratospheric intrusions is a simplified qualitative assessment and more quantitative detection methods should be applied to understand the influence of stratospheric intrusions on surface O3 for this region.
3.5 Insights into the O3 production regime
The relationship among O3, NOx, and CO was used as an indicator to infer the O3 production regime at Welgegund, Botsalano, and Marikana (no CO measurements were conducted at Elandsfontein as indicated above) since no continuous VOC measurements were conducted at each of these sites. However, as indicated in Sect. 2.4, a 2-year VOC dataset was available for Welgegund (Jaars et al., 2016, 2014), which was used to calculate the instantaneous production rate of O3 as a function of NO2 levels and VOC reactivity (Geddes et al., 2009; Murphy et al., 2006).
3.5.1 The relationship among NOx, CO, and O3
In Fig. 8, the correlations among O3, NOx, and CO concentrations at Welgegund, Botsalano, and Marikana are presented, which clearly indicate higher O3 concentrations associated with increased CO levels, while O3 levels remain relatively constant (or decrease) with increasing NOx. The highest O3 concentrations occur for NOx levels below 10 ppb since the equilibrium between photochemical production of O3 and chemical removal of O3 shifts towards the former, i.e. greater O3 formation. In general, there seems to exist a marginal negative correlation between O3 and NOx (Fig. A6) at all four sites, which is a reflection of the photochemical production of O3 from NO2 and the destruction of O3 through NOx titration. These correlations among NOx, CO, and O3 indicate that O3 production in continental South Africa is limited by CO (and VOCs) concentrations, i.e. VOC limited.
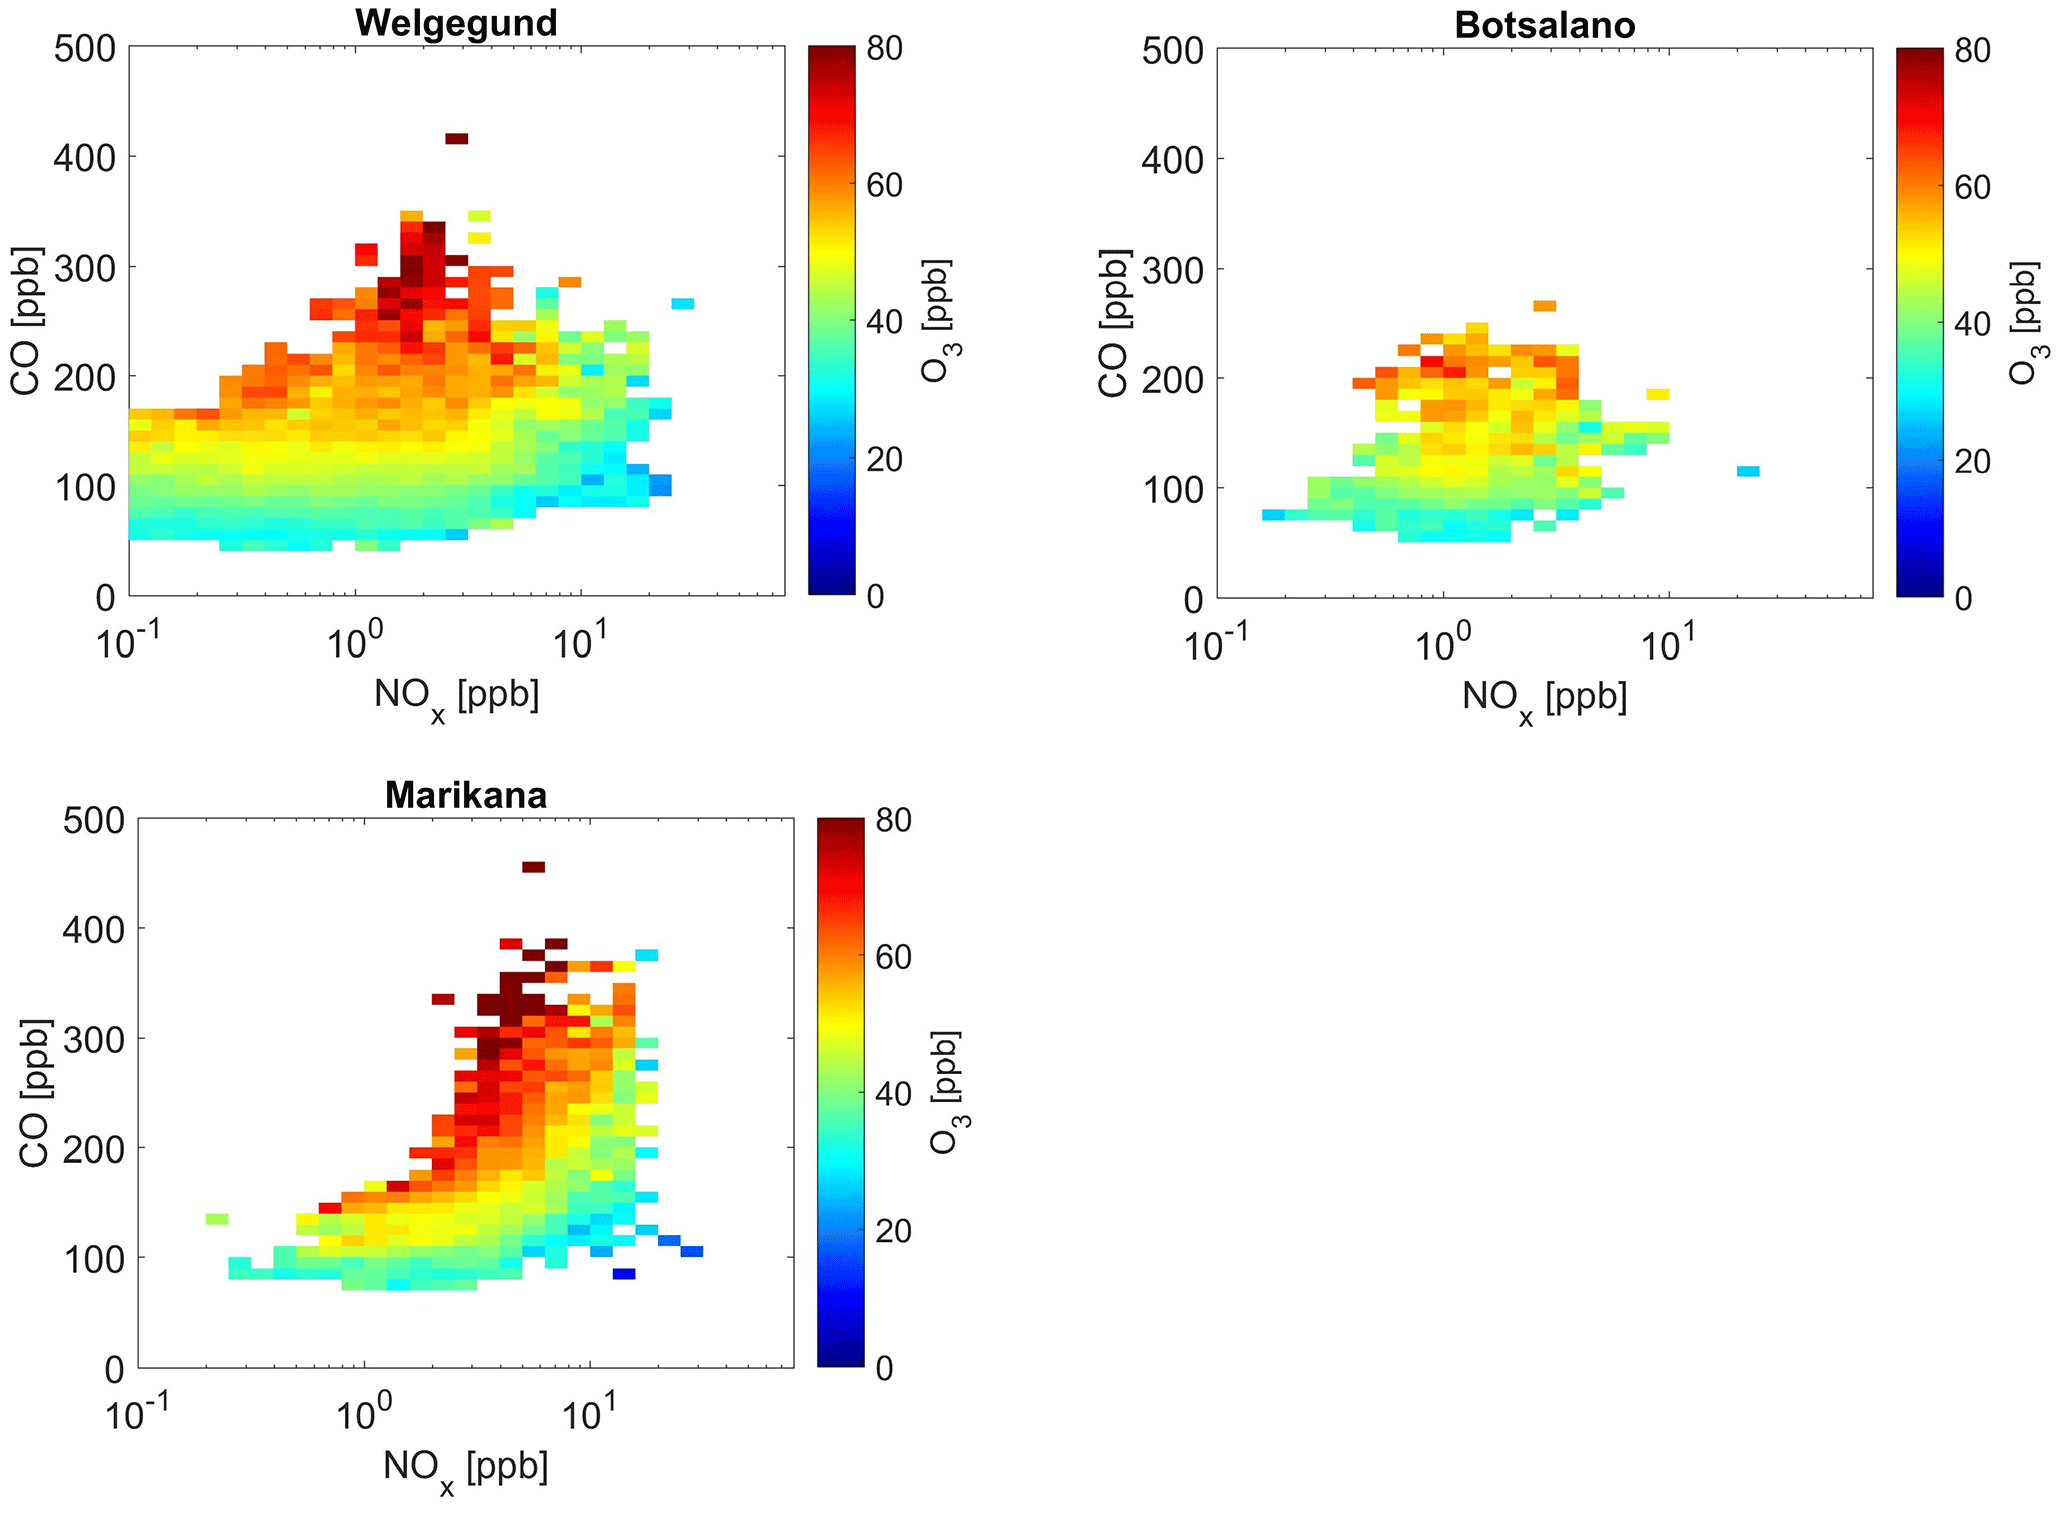
Figure 8Mean O3 concentration averaged for NOx and CO bins. Measurements were only taken from 11:00 to 17:00 LT when photochemical production of O3 was at a maximum.
This finding shows a strong correlation between O3 and CO and suggests that high O3 can be attributed to the oxidation of CO in the air masses; i.e. as long as there is a sufficient amount of NOx present in a region, CO serves to produce O3. Although NOx and VOCs are usually considered the main precursors in ground-level O3 formation, CO acts together with NOx and VOCs in the presence of sunlight to drive photochemical O3 formation. According to Fig. 8, reducing CO emissions should result in a reduction in surface O3 and it is assumed that this response is analogous to that of VOCs. It is, however, not that simple since the ambient NOx and VOC concentrations are directly related to the instantaneous rate of production of O3 and not necessarily to the ambient O3 concentration at a location, which is the result of chemistry, deposition, and transport that have occurred over several hours or a few days (Sillman, 1999). Notwithstanding the various factors contributing to increased surface O3 levels, the correlation between ambient CO and O3 is especially relevant given the low reactivity of CO with respect to •OH radicals compared to most VOCs, which implies that the oxidation of CO probably takes place over a timescale of several days. It seems that the role of CO is of major importance in tropospheric chemistry in this region, where sufficient NOx is present across continental South Africa and biogenic VOCs are relatively less abundant (Jaars et al., 2016), to fuel the O3 formation process.
3.5.2 Seasonal change in O3–precursors relationship
Seasonal changes in the relationship between O3 and precursor species can be indicative of different sources of precursor species during different times of the year. In Fig. 9, the correlations between O3 levels and NOx and CO are presented for the different seasons, which indicate seasonal changes in the dependence of elevated O3 concentrations on these precursors. The very high CO concentrations relative to NOx, i.e. high CO-to-NOx ratios, are associated with the highest O3 concentrations, which are most pronounced (highest CO∕NOx ratios) during winter and spring. This indicates that the winter and spring O3 maximum is primarily driven by increased peroxy radical production from CO and VOCs. The seasonal maximum in O3 concentration coincides with the maximum CO concentration at the background sites, while the O3 peak occurs just after June–July when CO peaked at the polluted site Marikana (Fig. A5). This observed seasonality in O3 production signifies the importance of precursor species emissions from open biomass burning during winter and spring in this region, while household combustion for space heating and cooking is also an important source of O3 precursors, as previously discussed. The strong diurnal CO concentration patterns observed during winter at Marikana (Fig. A5) substantiate the influence of household combustion on CO levels, as indicated by Venter et al. (2012).
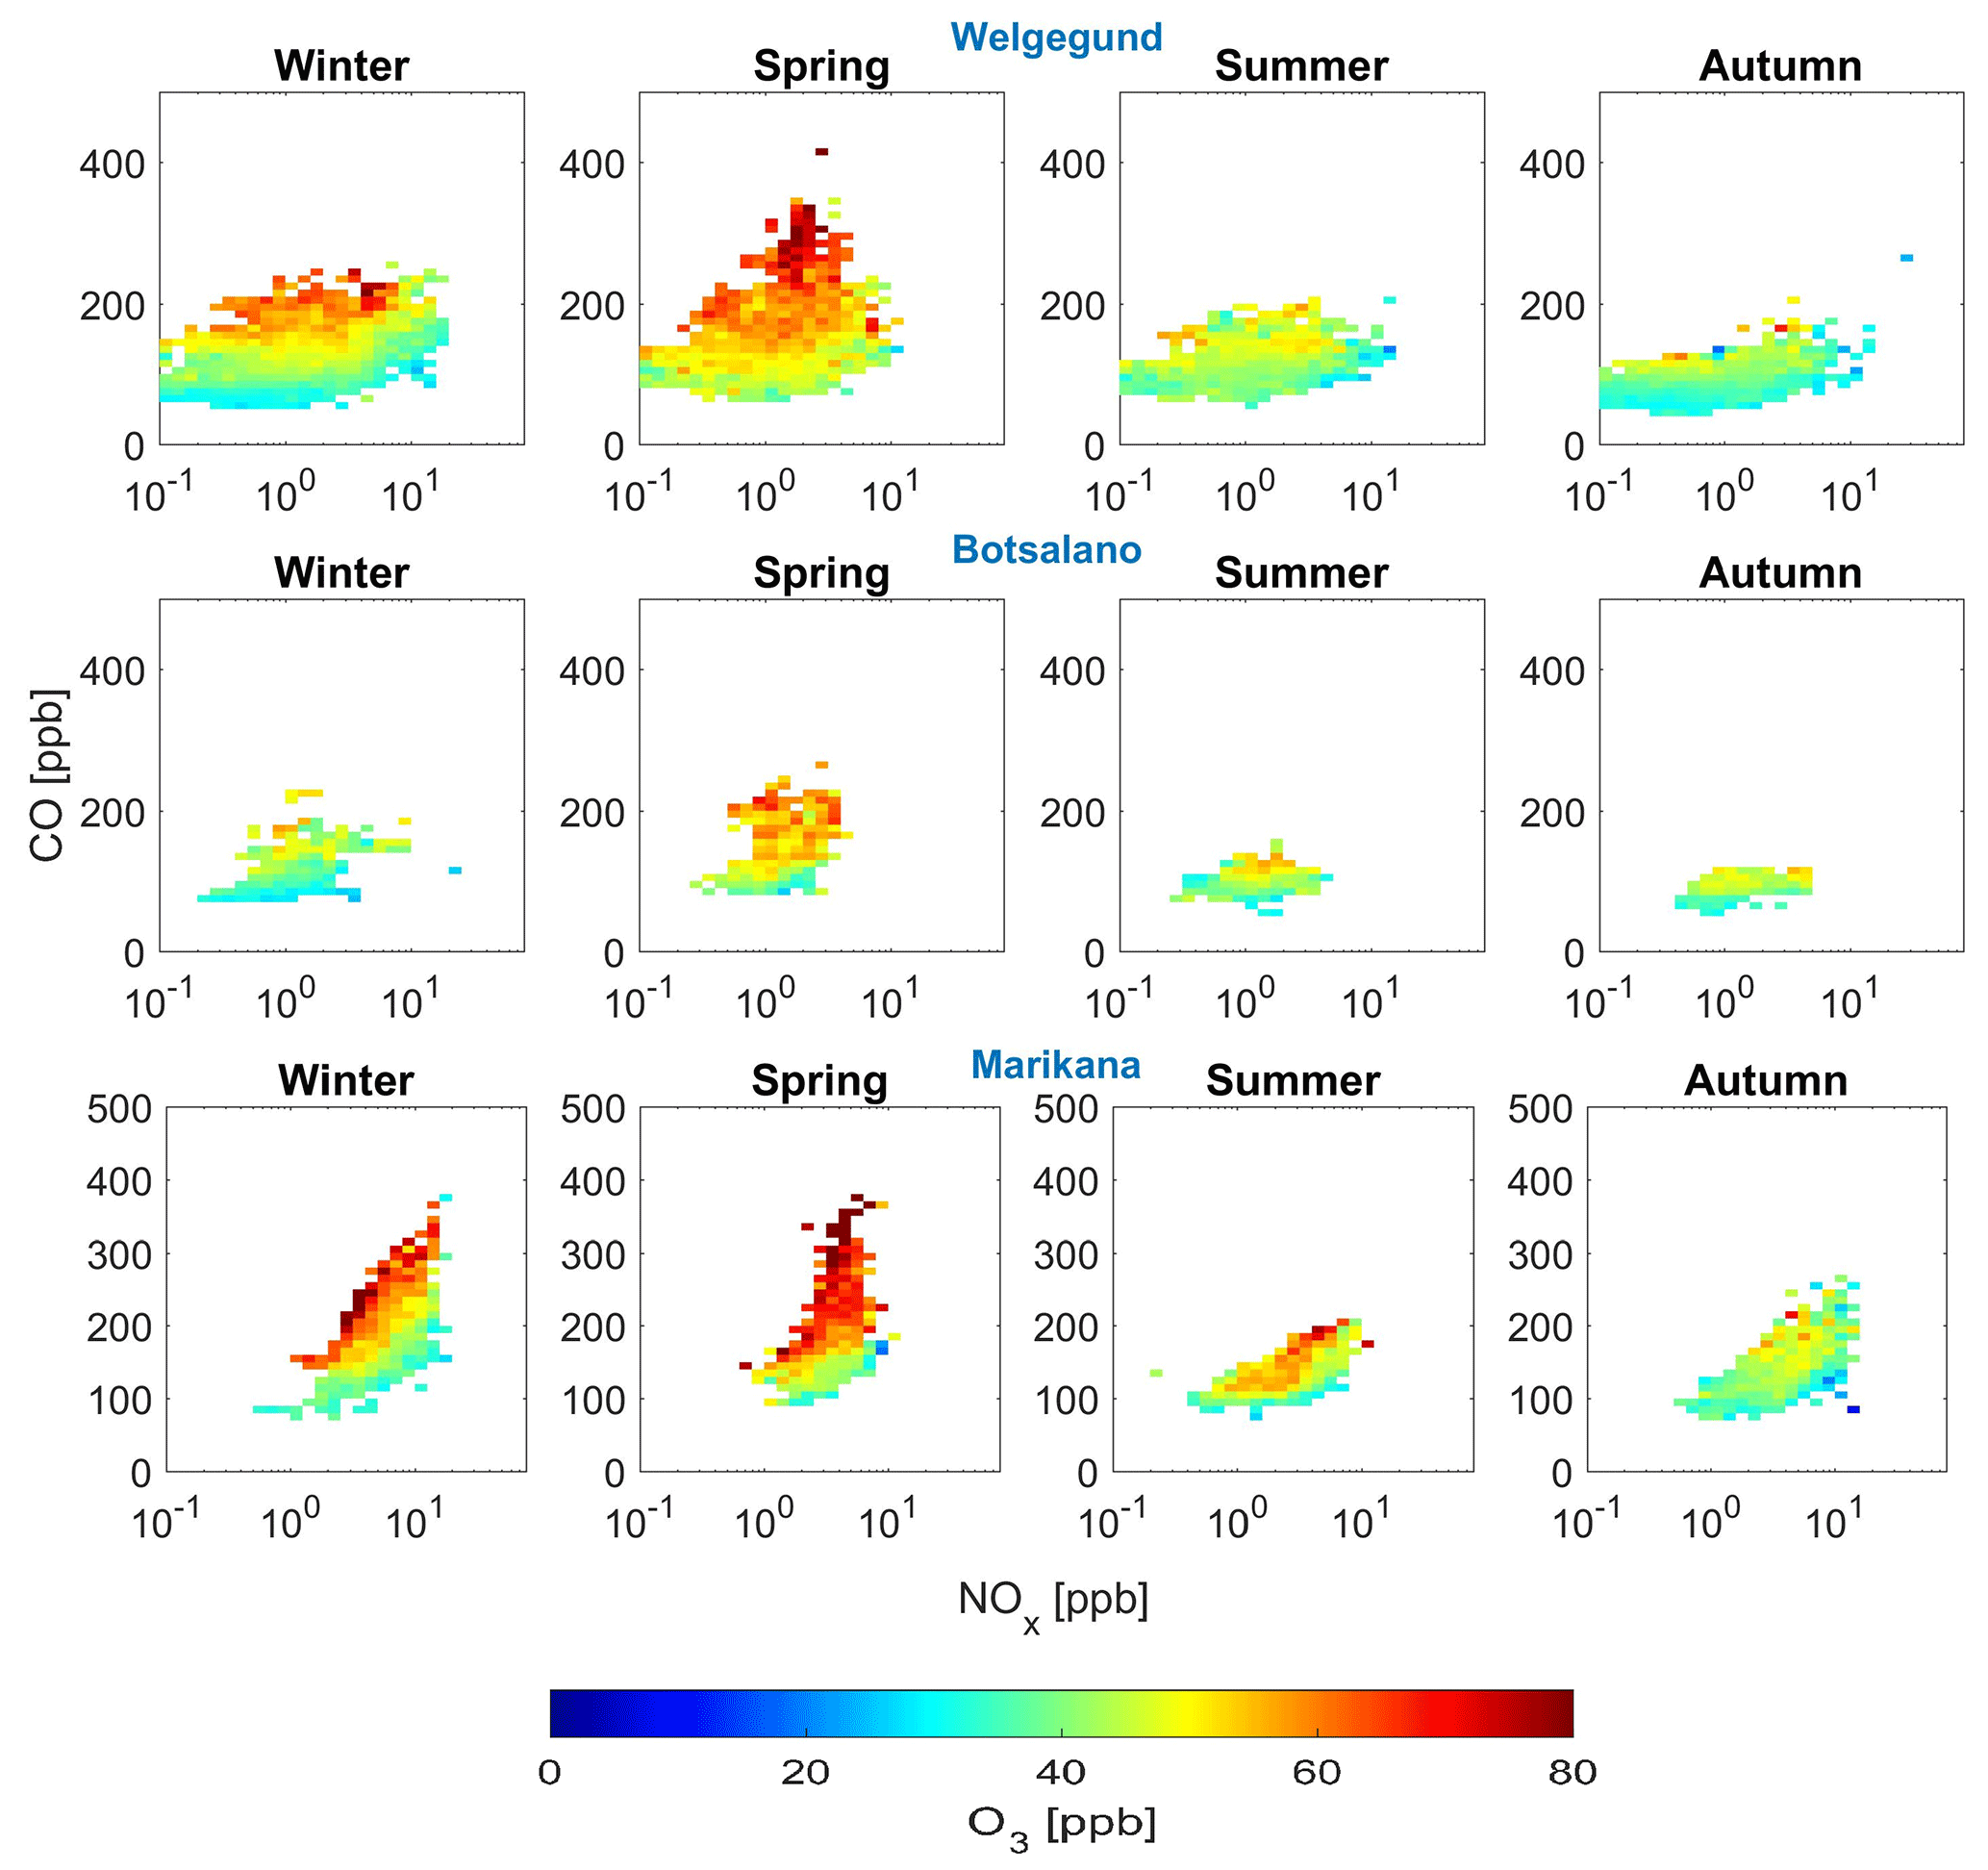
Figure 9Seasonal plots of the relationship among O3, NOx, and CO at Welgegund, Botsalano, and Marikana.
3.5.3 O3 production rate
In Fig. 10, P(O3) as a function of VOC reactivity calculated from the available VOC dataset for Welgegund (Sect. 2.4) and NO2 concentrations is presented. O3 production at Welgegund during two field campaigns, specifically at 11:00 LT, was found to range between 0 and 10 ppbv h−1. The average P(O3) values over the 2011 to 2012 and the 2014 to 2015 campaigns combined were 3.0±1.9 and 3.2±3.0 ppbv h−1, respectively. The dashed black line in Fig. 10, called the ridge line, separates the NOx- and VOC-limited regimes. To the left of the ridge line is the NOx-limited regime, when O3 production increases with increasing NOx concentrations. The VOC-limited regime is to the right of the ridge line, when O3 production decreases with increasing NOx. According to the O3 production plot presented, approximately 40 % of the data are found in the VOC-limited regime area, which would support the regional O3 analysis conducted for continental South Africa in this study. However, the O3 production plot for Welgegund transitions between NOx- and VOC-limited regimes, with Welgegund being in a NOx-limited production regime the majority of the time, especially when NOx concentrations are very low (<1 ppb). As indicated in Sect. 2.4, limitations to this analysis include limited VOC speciation data, as well as a single time-of-day grab sample. The O3 production rates can therefore only be inferred at 11:00 LT despite O3 concentrations peaking during the afternoon at Welgegund. Therefore, clean background air O3 production is most likely NOx limited (Tiitta et al., 2014), while large parts of the regional background of continental South Africa can be considered VOC limited.

Figure 10Contour plot of instantaneous O3 production (P(O3)) at Welgegund using daytime (11:00 LT) grab sample measurements of VOCs and NO2. The blue dots represent the first campaign (2011–2012), and the red dots indicate the second campaign (2014–2015).
3.6 Implications for air quality management
3.6.1 Ozone exceedances
The South African National Ambient Air Quality Standard (NAAQS) for O3 is an 8 h moving-average limit of 61 ppbv with 11 exceedances allowed annually (Government Gazette, 2009). Figure 11 shows the average number of days per month when this O3 standard limit was exceeded at the four measurement sites. It is evident that the daily 8 h O3 maximum concentrations regularly exceeded the NAAQS threshold for O3 and the number of exceedances annually allowed at all the sites, including the most remote of the four sites, Botsalano. At the polluted locations of Marikana and Elandsfontein, the O3 exceedances peak early on in the dry season (June onwards), while at the background locations of Welgegund and Botsalano, the highest numbers of exceedances occur later in the dry season (August to November). These relatively high numbers of O3 exceedances at all the sites (background and industrial) highlight the regional O3 problem in South Africa, with background sites being impacted by the regional transport of O3 precursors from anthropogenic and biomass burning source regions.
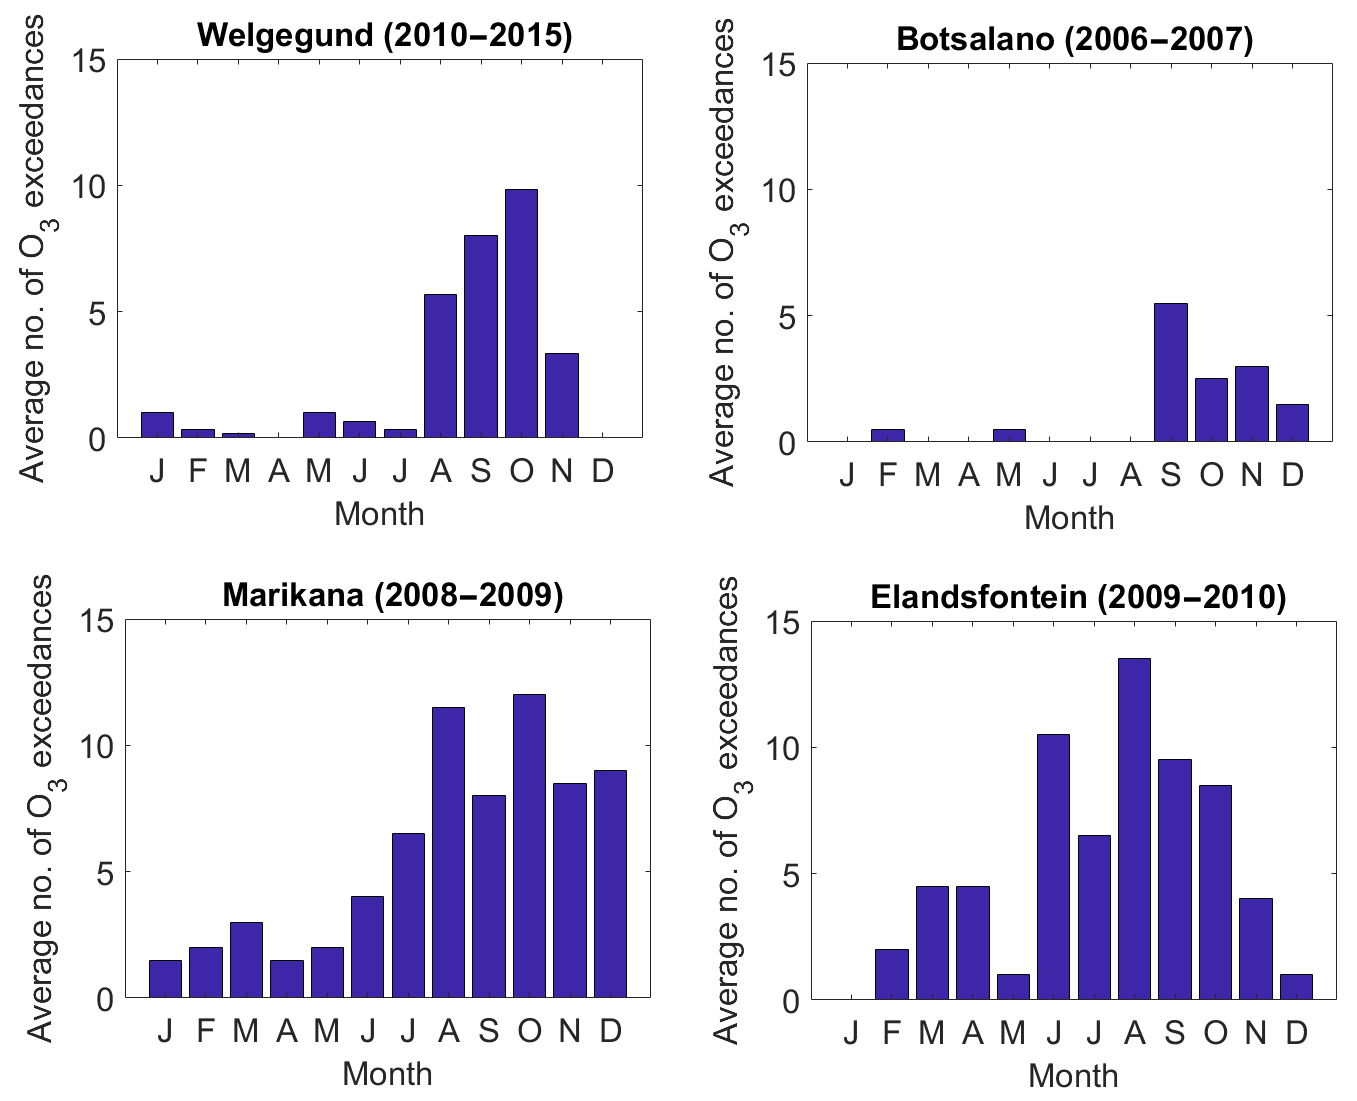
Figure 11Monthly number of exceedances of the daily 8 h O3 maximum (i.e. highest value of all available 8 h moving averages in that day) above 61 ppbv at Welgegund, Botsalano, Marikana, and Elandsfontein.
3.6.2 O3 control strategies
As indicated above (Sect. 3.4 and 3.5), O3 formation in the regions where Welgegund, Botsalano, and Marikana are located can be considered VOC limited, while the highly industrialized region with high NOx emissions where Elandsfontein is located could also be considered VOC limited. Rural remote regions are generally considered to be NOx limited due to the availability of NOx and the impact of biogenic VOCs (BVOCs) (Sillman, 1999). However, Jaars et al. (2016) indicated that BVOC concentrations at a savannah grassland were at least an order of magnitude lower compared to other regions in the world. Therefore, very low BVOC concentrations, together with high anthropogenic emissions of NOx in the interior of South Africa, result in VOC-limited conditions at background sites in continental South Africa.
It is evident that reducing CO and VOC concentrations associated with anthropogenic emissions, e.g. household combustion, vehicular emissions, and industries, would be the most efficient control strategy to reduce peak O3 concentrations in the interior of South Africa. It is also imperative to consider the seasonal variation in the CO and VOC source strength in managing O3 pollution in continental southern Africa. This study also revealed the significant contribution of biomass burning to O3 precursors in this region, which should also be considered when implementing O3 control strategies. However, since open biomass burning in southern Africa is of anthropogenic and natural origin, while O3 concentrations in continental South Africa are also influenced by trans-boundary transport of O3 precursors from open biomass burning occurring in other countries in southern Africa (as indicated above), it is more difficult to control. Nevertheless, open biomass burning caused by anthropogenic practices (e.g. crop residue, pasture maintenance fires, opening burning of garbage) can be addressed.
A spatial distribution map of O3 levels in the interior of South Africa indicated the regional O3 problem in continental South Africa, which was signified by the regular exceedance of the South African air quality standard limit. The seasonal and diurnal O3 patterns observed at the four sites in this study resembled typical trends for O3 in continental South Africa, with O3 concentrations peaking in late winter and early spring (see Zunckel et al., 2004), while daytime O3 corresponded to increased photochemical production. The seasonal O3 trends observed in continental southern Africa could mainly be attributed to the seasonal changes in emissions of O3 precursor species and local meteorological conditions. Increased O3 concentrations in winter at Welgegund, Marikana, and Elandsfontein reflected increased household combustion for space heating and the trapping of low-level pollutants near the surface. A spring maximum observed at all the sites was attributed to increased regional open biomass burning. Significantly higher O3 concentrations, which corresponded with increased CO concentrations, were associated with air masses passing over a region in southern Africa, where a large number of open biomass burning occurred from June to September. Therefore, the regional transport of CO associated with open biomass burning in southern Africa was considered a significant source of surface O3 in continental South Africa. A very small contribution from the stratospheric intrusion of O3-rich air to surface O3 levels at the four sites was indicated.
The relationship among O3, NOx, and CO at Welgegund, Botsalano, and Marikana indicated a strong correlation between O3 and CO, while O3 levels remained relatively constant (or decreased) with increasing NOx. Although NOx and VOCs are usually considered to be the main precursors in ground-level O3 formation, CO can also drive photochemical O3 formation. The seasonal changes in the relationship between O3 and precursors species also reflected the higher CO emissions associated with increased household combustion in winter and open biomass burning in late winter and spring. The calculation of the P(O3) from a 2-year VOC dataset at Welgegund indicated that at least 40 % of O3 production occurred in the VOC-limited regime. These results indicated that large parts in continental South Africa can be considered VOC limited, which can be attributed to high anthropogenic emissions of NOx in this region. It is, however, recommended that future studies should investigate more detailed relationships among NOx, CO, VOCs, and O3 through photochemical modelling analysis, while concurrent measurement of atmospheric VOCs and •OH would also contribute to the better understanding of surface O3 in this region.
In this paper, some new aspects of O3 for continental South Africa have been indicated, which must be taken into consideration when O3 mitigation strategies are deployed. Emissions of O3 precursor species associated with the concentrated location of industries in this area could be regulated, while CO and VOC emissions associated with household combustion and regional open biomass burning should also be targeted. However, emissions of O3 precursor species related to factors such as household combustion associated with poor socio-economic circumstances and long-range transport provide a bigger challenge for regulators.
The data of this paper are available upon request to Pieter van Zyl (pieter.vanzyl@nwu.ac.za) or Johan Paul Beukes (paul.beukes@nwu.ac.za).
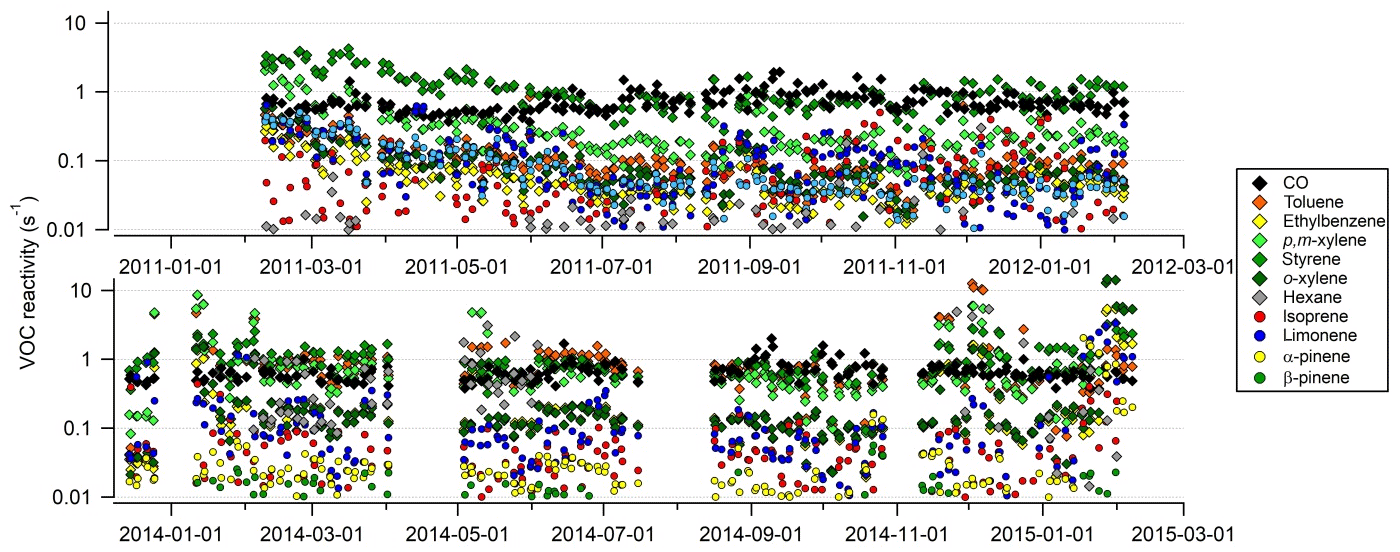
Figure A1Individual VOC reactivity time series. In the calculation of instantaneous O3 production (P(O3)), CO was treated as a VOC.
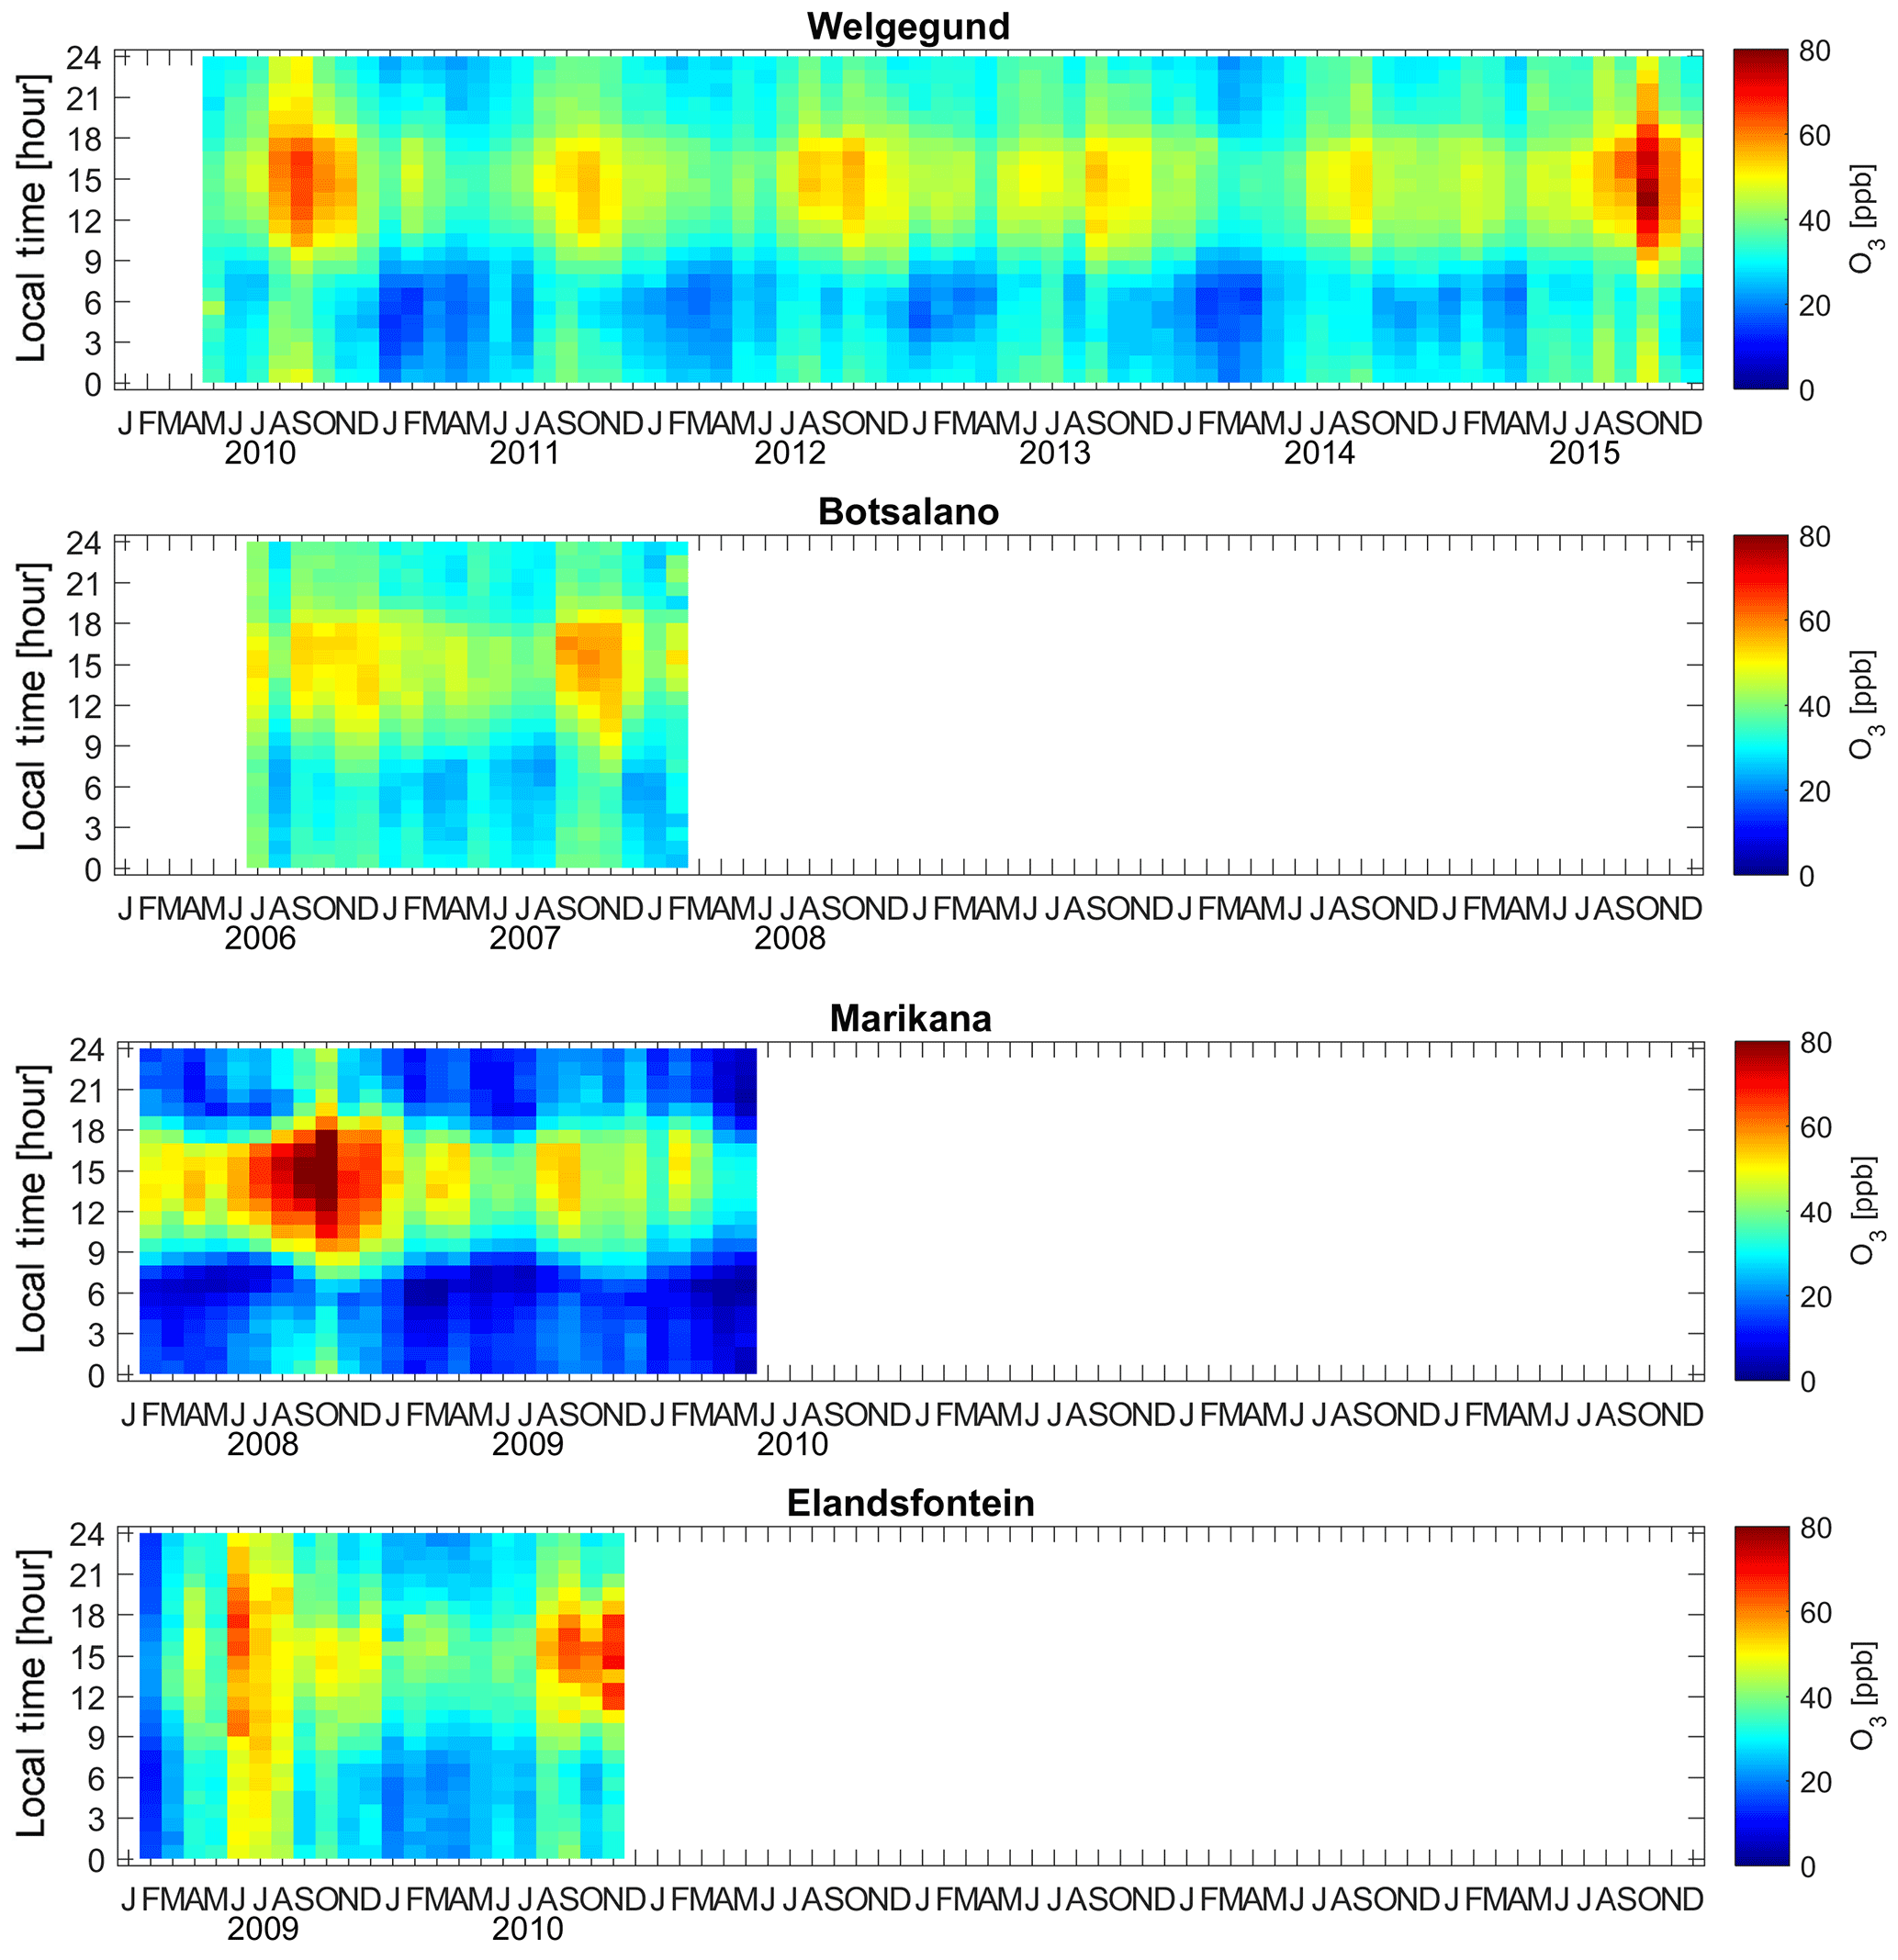
Figure A2Time series of monthly median O3 concentrations for each hour of the day at the four sites.
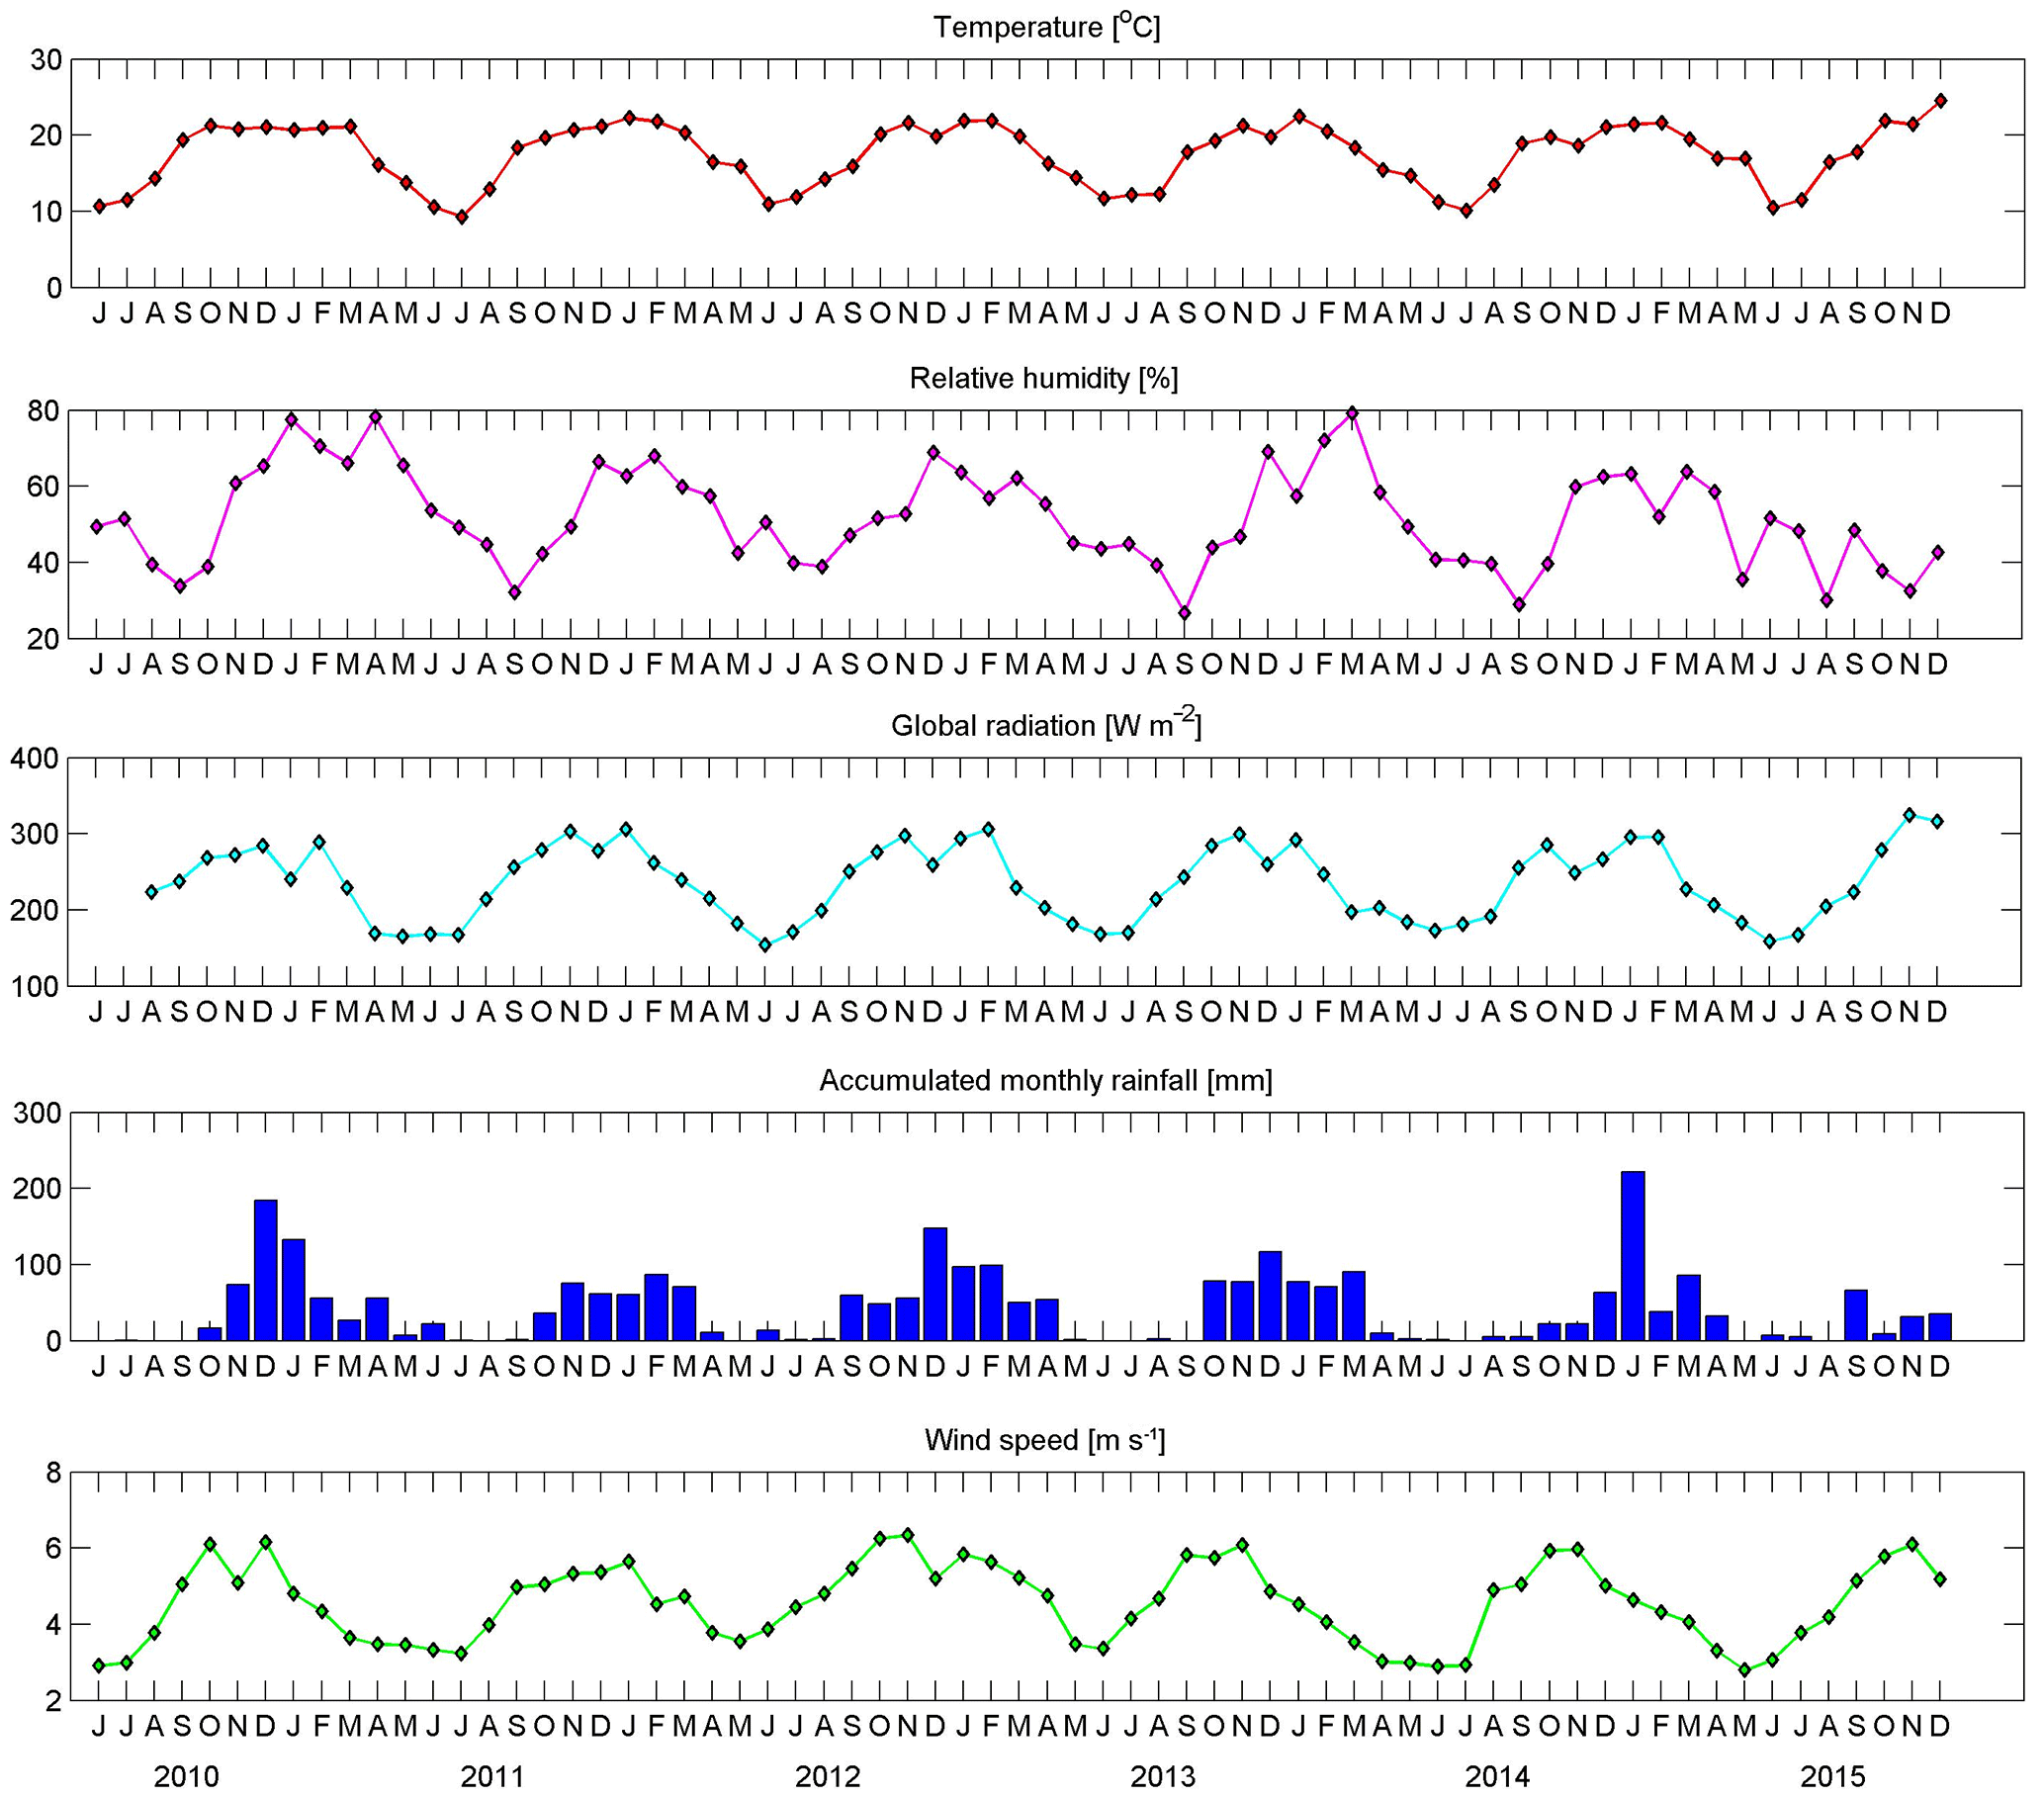
Figure A3Monthly averages of meteorological parameters at Welgegund to show typical seasonal patterns in continental South Africa. In the case of rainfall, the total monthly rainfall values are shown.
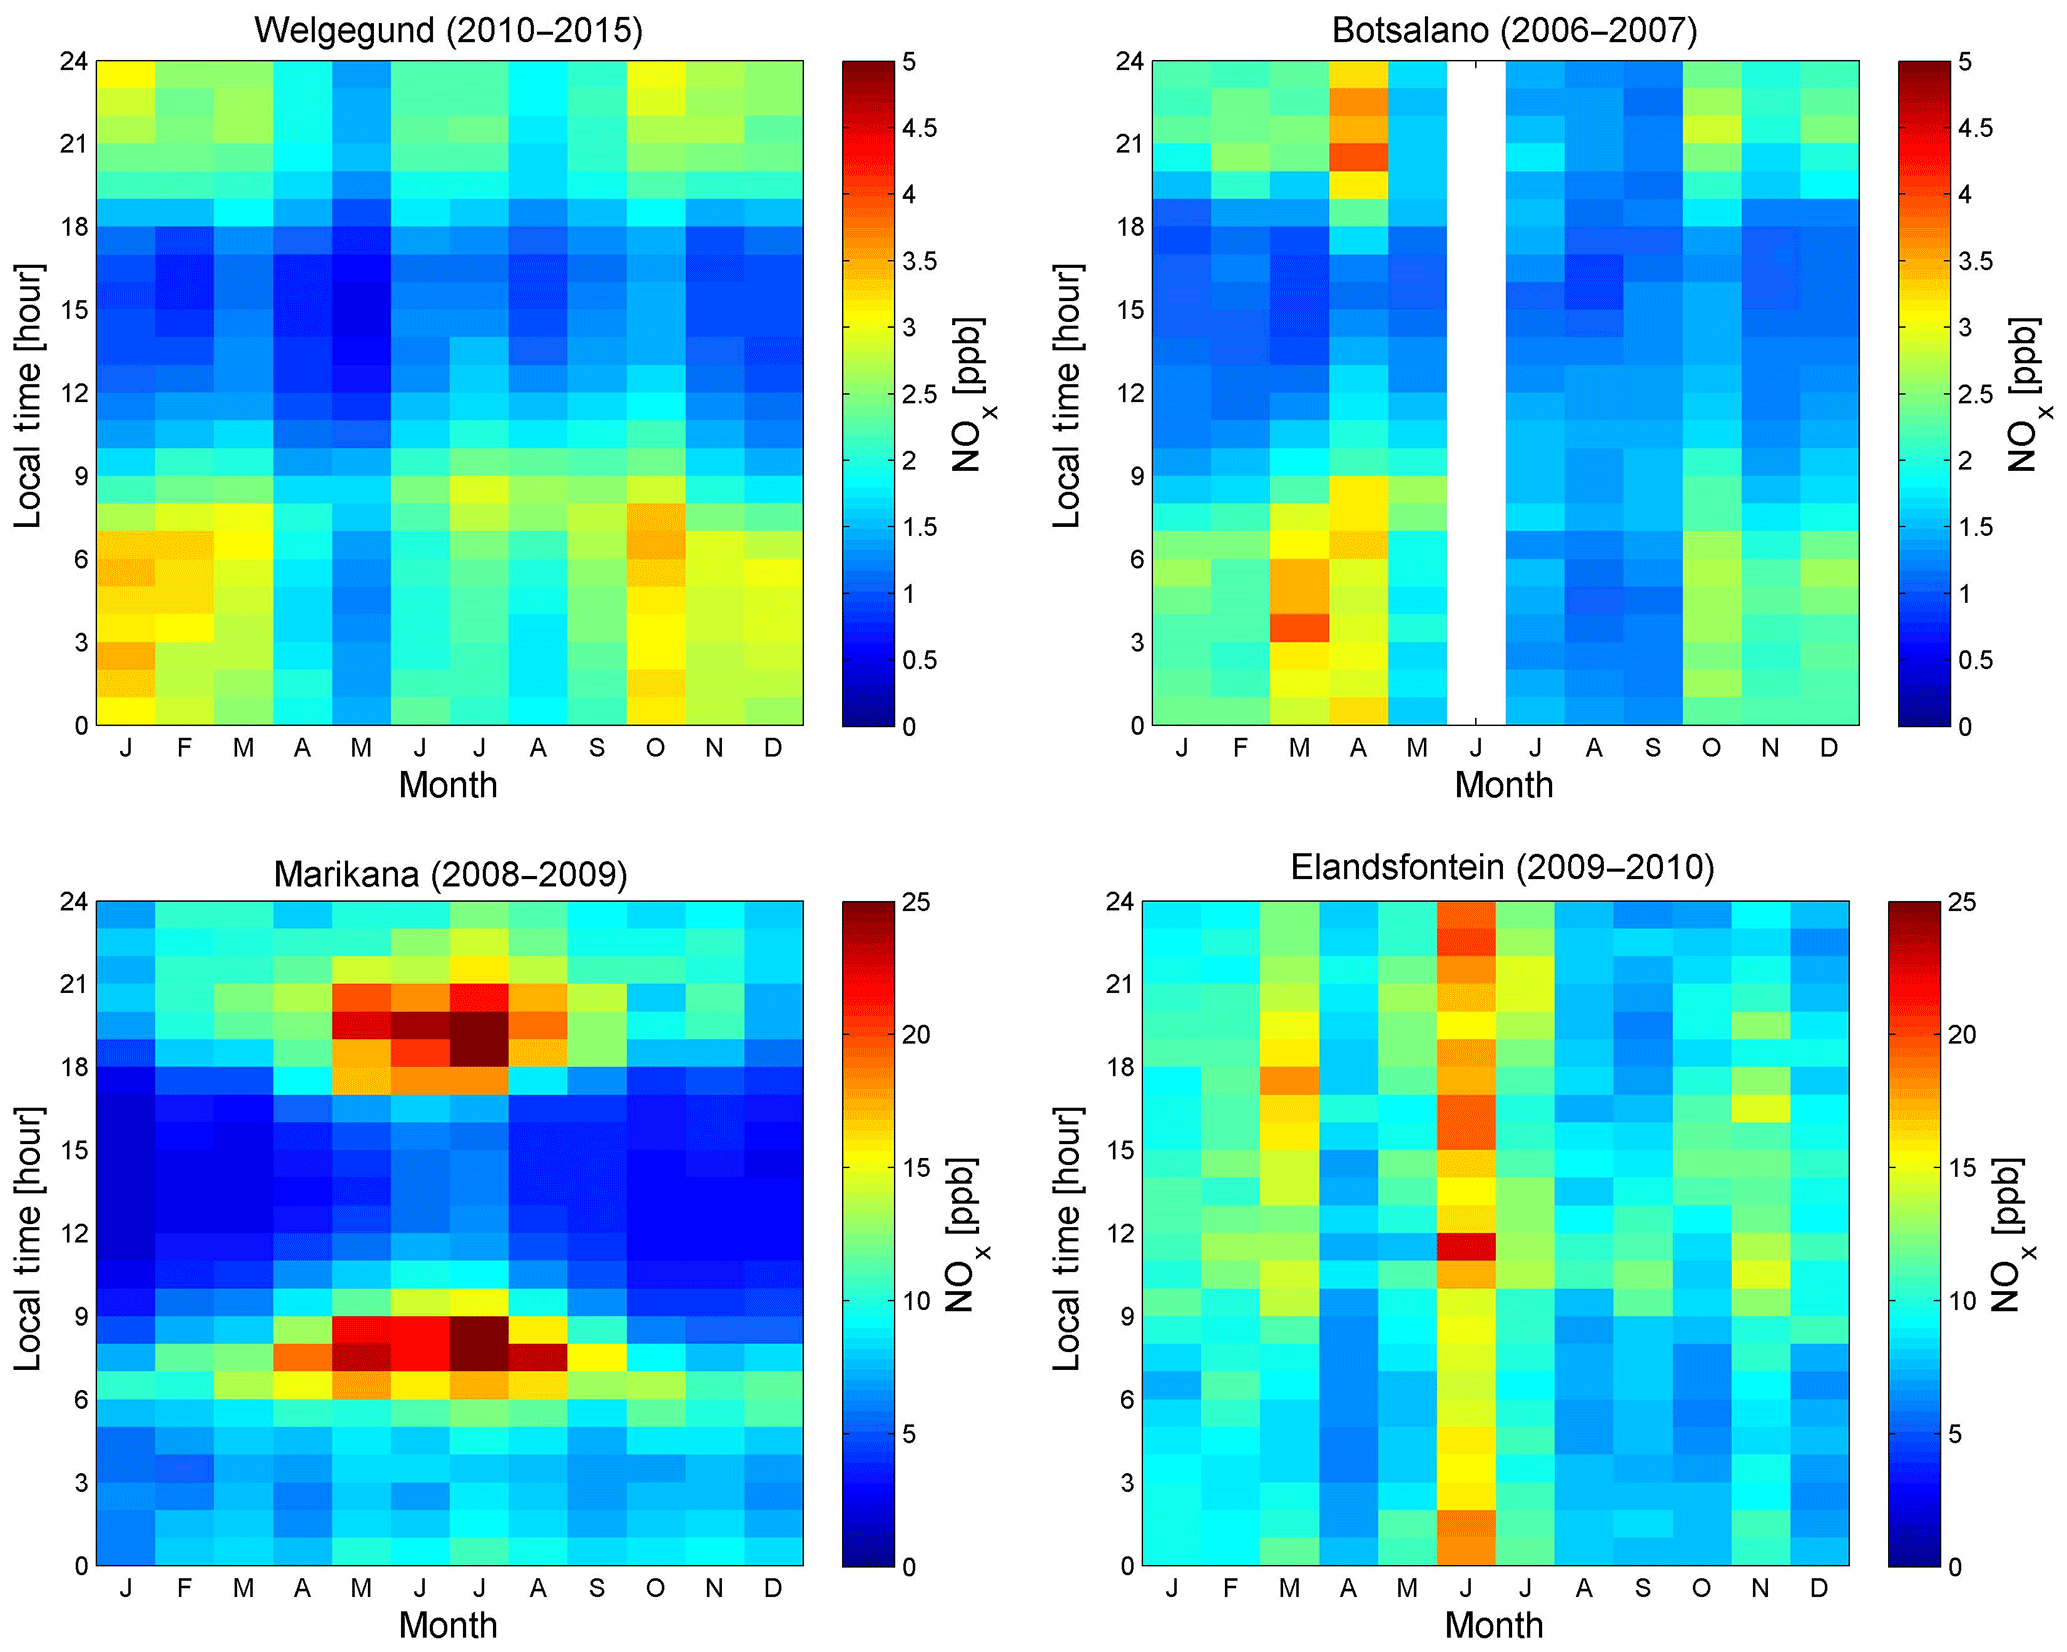
Figure A4Seasonal and diurnal variation in NOx at Welgegund, Botsalano, Marikana, and Elandsfontein (median values of NOx concentration were used).

Figure A5Seasonal and diurnal variation in CO at Welgegund, Botsalano, and Marikana (median values of CO concentration were used). Note that CO was not measured at Elandsfontein.

Figure A6Scatter plots of O3 vs. NOx for daytime (09:00 to 16:52 LT), and night-time (17:00 to 08:52 LT) at Welgegund, Botsalano, Marikana, and Elandsfontein. The correlation coefficient (r) has a significance level of , which means that r is statistically significant (p<0.01).
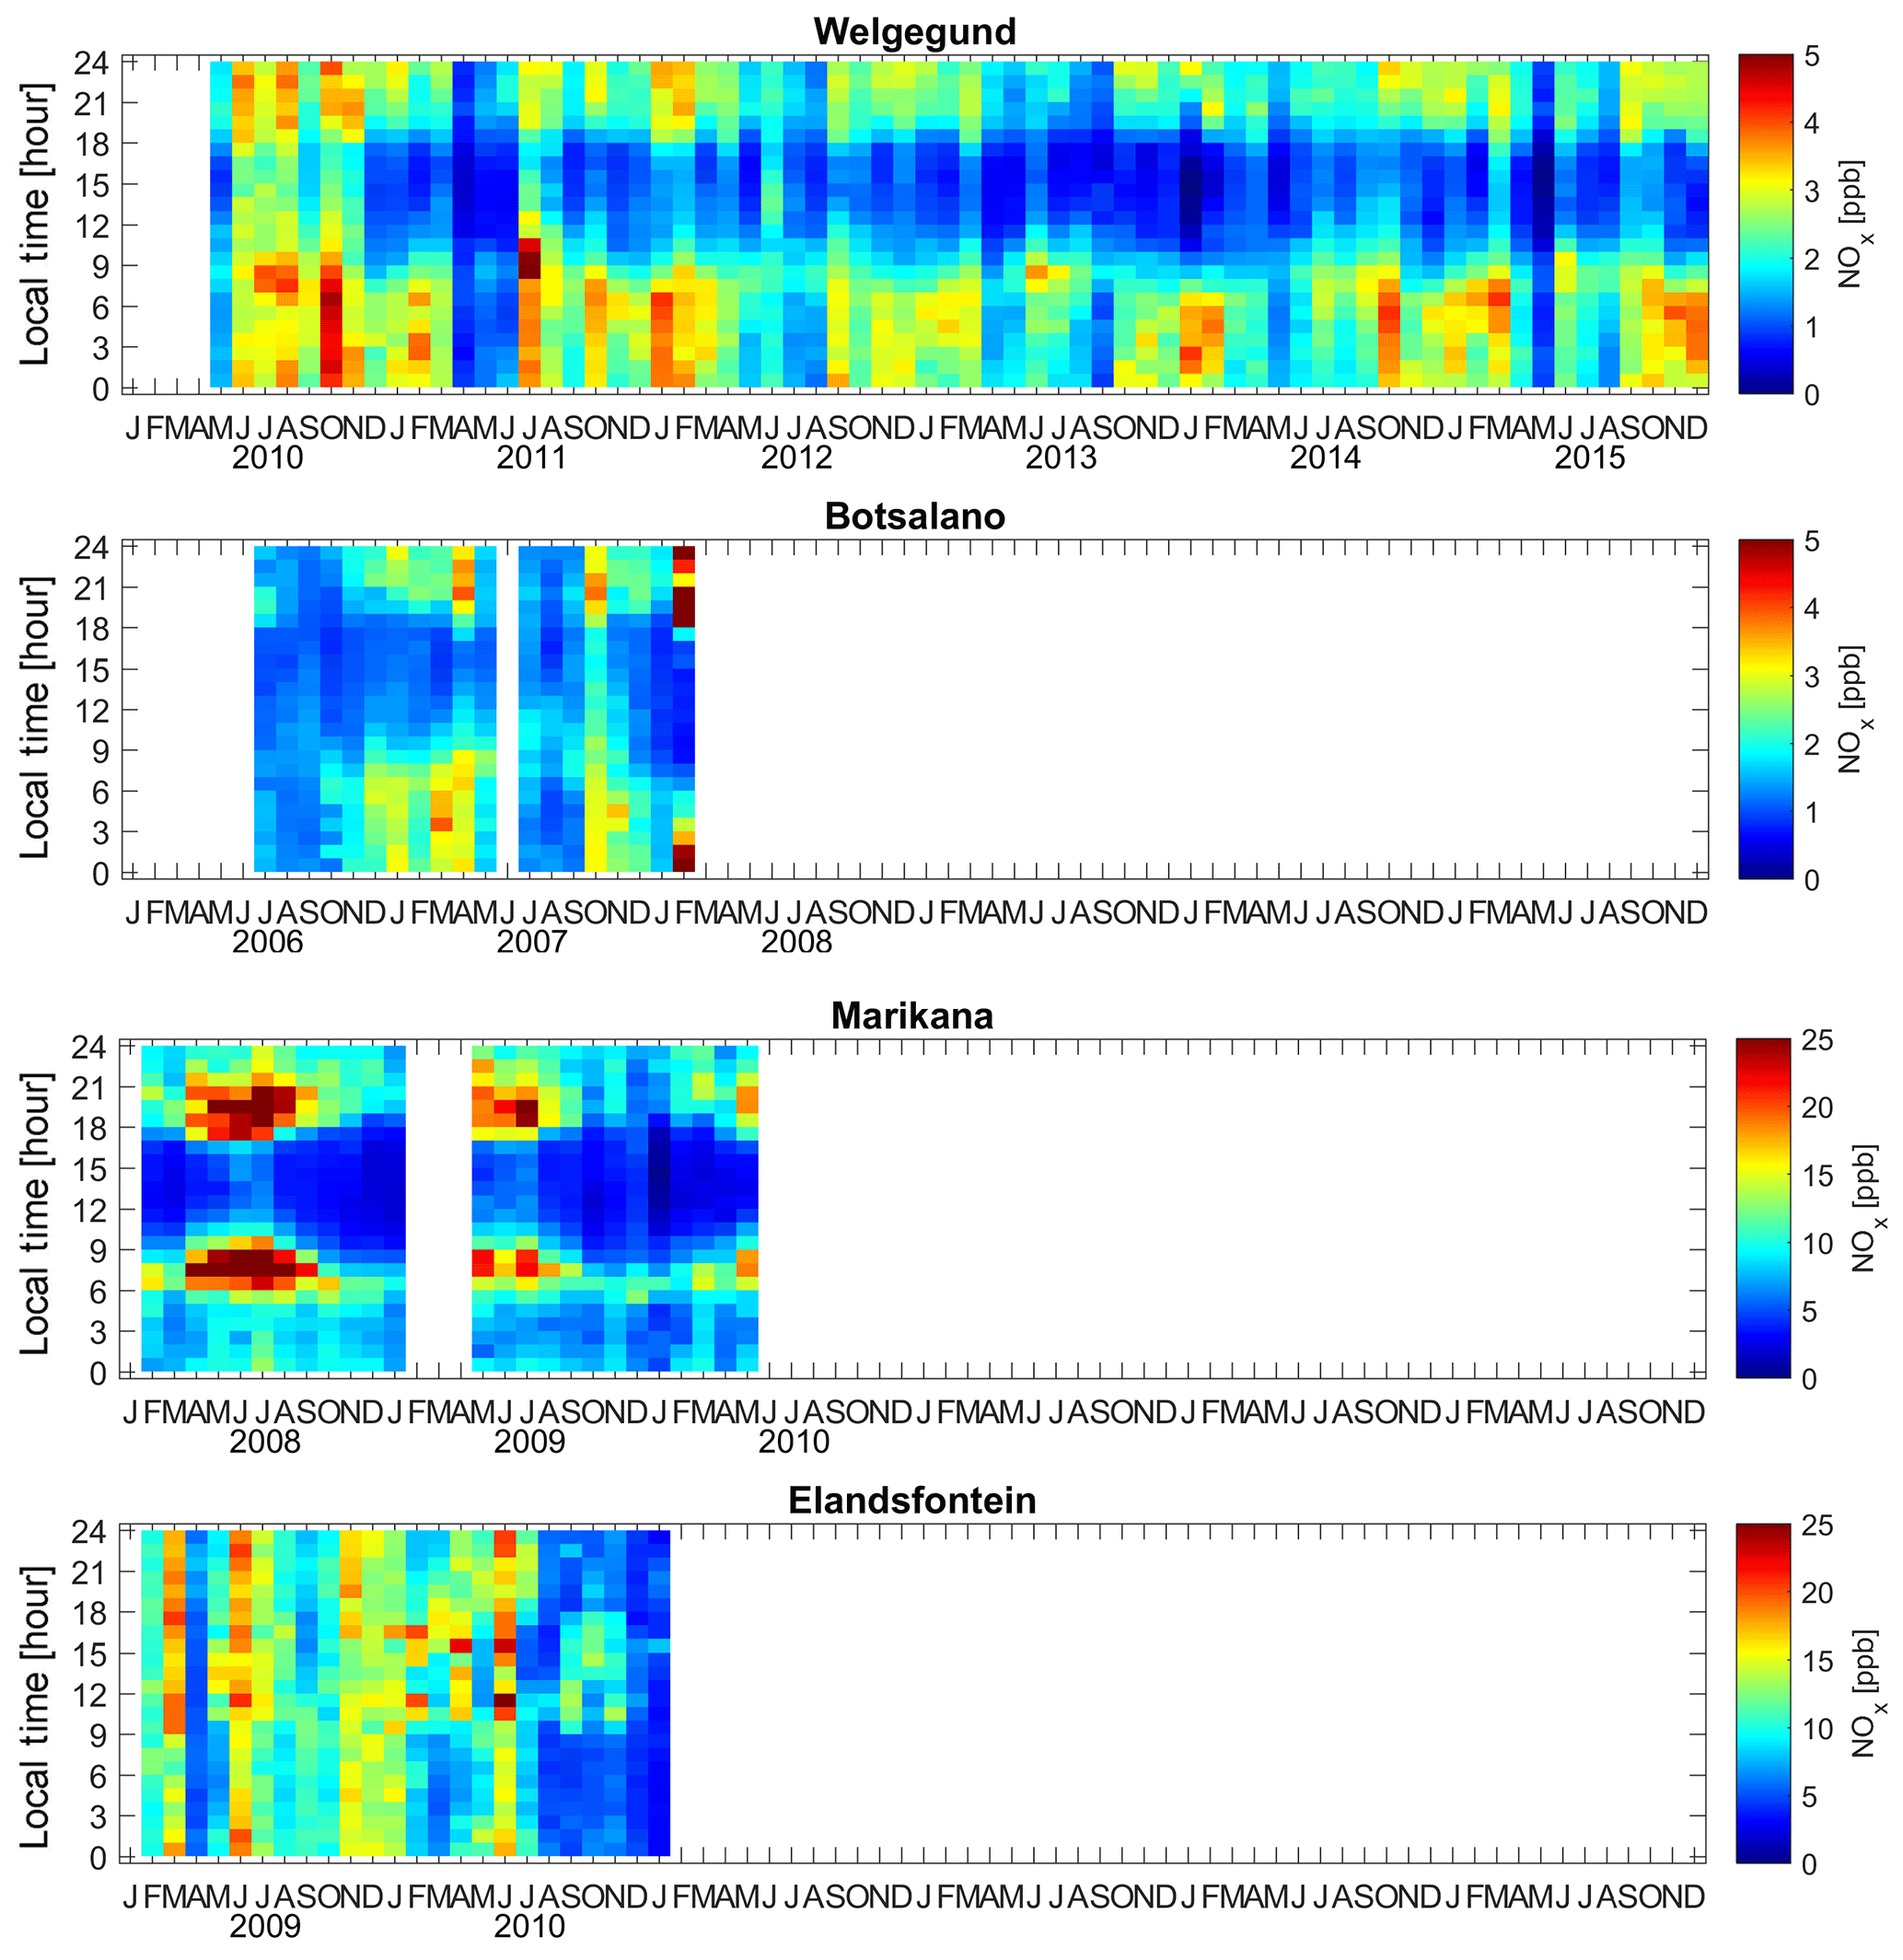
Figure A7Time series of monthly median NOx concentrations for each hour of the day at the four sites.
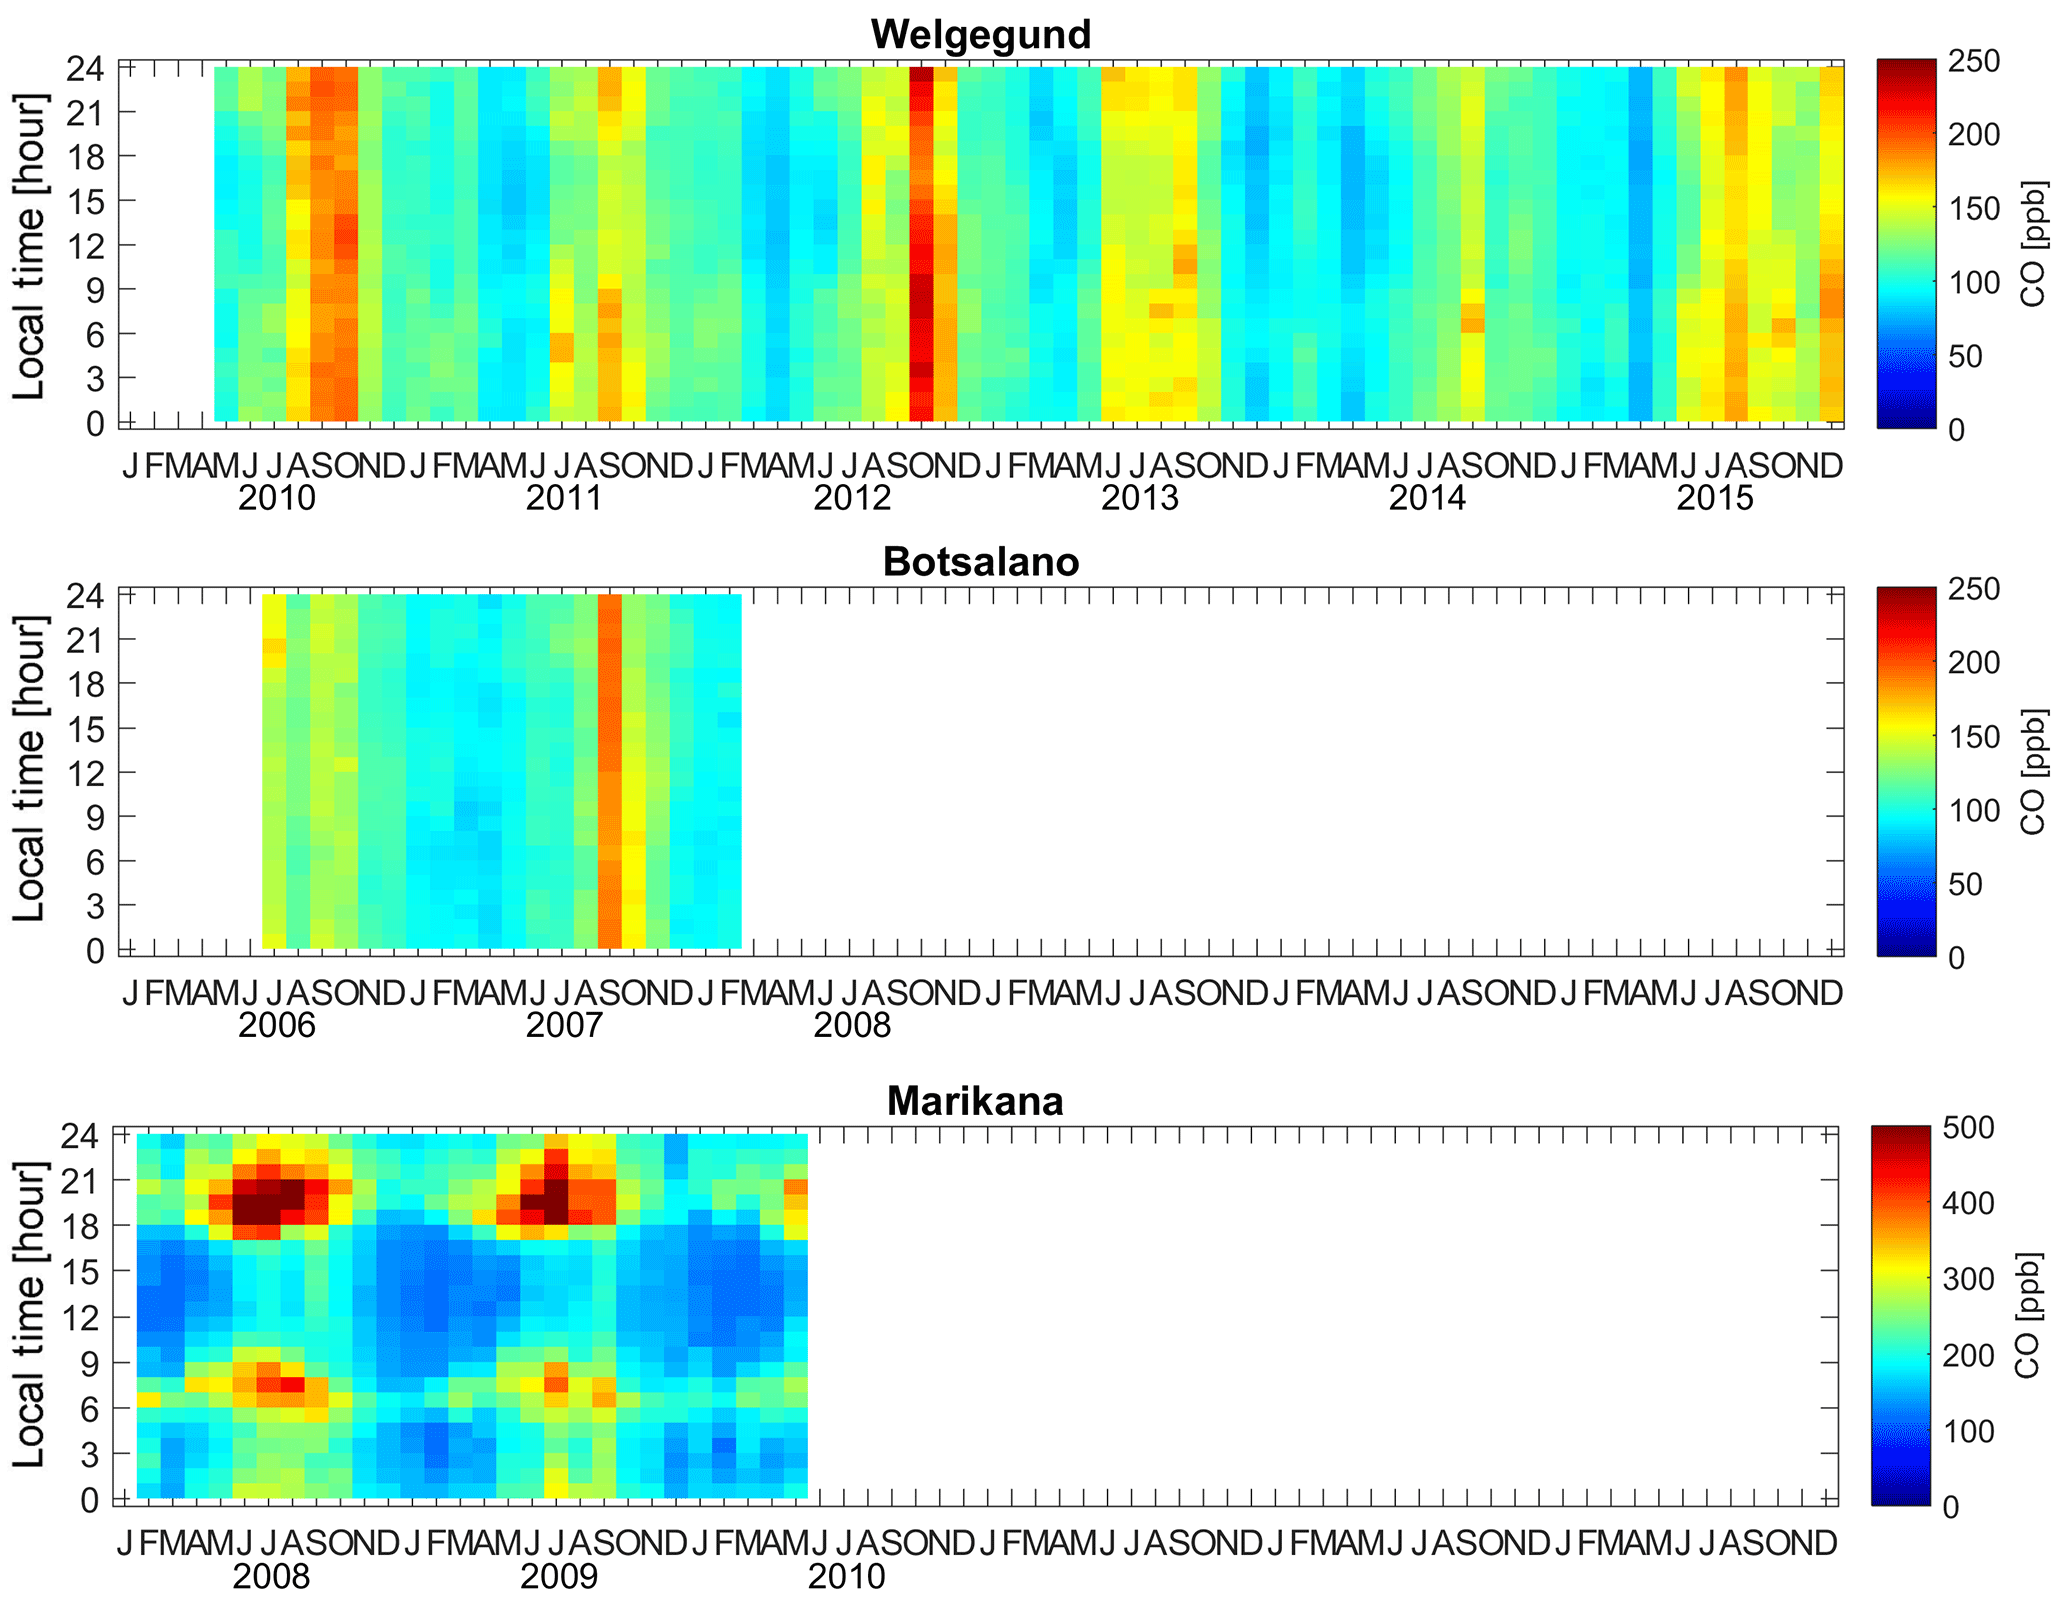
Figure A8Time series of monthly median CO concentrations for each hour of the day at the four sites.
TLL, PGvZ, and JPB were the main investigators in this study. PGvZ and JPB were project leaders of the study and wrote the manuscript. TLL conducted this study as part of her PhD degree and performed most of the data analysis. PGvZ, JPB, and AMT were study leaders for the PhD. VV assisted with data analyses and made conceptual contributions. KJ conducted volatile organic carbon measurements, while NBD modelled instantaneous ozone production rate. MJ assisted with data collection. AMT, MK, and LL made conceptual contributions.
The authors declare that they have no conflict of interest.
Opinions expressed and conclusions arrived at are those of the authors and are not necessarily to be attributed to the National Research Foundation (NRF).
The financial assistance of the National Research Foundation (NRF) towards
this research is hereby acknowledged. We thank the Tropospheric Ozone Assessment Report (TOAR)
initiative for providing the surface ozone data used in this publication.
The authors are also grateful to Eskom for supplying the Elandsfontein data.
Thanks are also due to Dirk Cilliers from the NWU for the GIS assistance. Ville Vakkari is a beneficiary of an AXA Research Fund postdoctoral grant. This
work was partly funded by the Academy of Finland Centre of Excellence
program (grant no. 272041).
Edited by: Ulrich Pöschl
Reviewed by: Mathew Evans and one anonymous referee
Air Resources Laboratory: Gridded Meteorological Data Archives, available at: https://www.ready.noaa.gov/archives.php (last access: 22 March 2018), 2017.
Balashov, N. V., Thompson, A. M., Piketh, S. J., and Langerman, K. E.: Surface ozone variability and trends over the South African Highveld from 1990 to 2007, J. Geophys. Res.-Atmos., 119, 4323–4342, https://doi.org/10.1002/2013JD020555, 2014.
Beirle, S., Platt, U., Wenig, M., and Wagner, T.: Weekly cycle of NO2 by GOME measurements: a signature of anthropogenic sources, Atmos. Chem. Phys., 3, 2225–2232, https://doi.org/10.5194/acp-3-2225-2003, 2003.
Cazorla, M. and Brune, W. H.: Measurement of Ozone Production Sensor, Atmos. Meas. Tech., 3, 545–555, https://doi.org/10.5194/amt-3-545-2010, 2010.
Chevalier, A., Gheusi, F., Delmas, R., Ordóñez, C., Sarrat, C., Zbinden, R., Thouret, V., Athier, G., and Cousin, J.-M.: Influence of altitude on ozone levels and variability in the lower troposphere: a ground-based study for western Europe over the period 2001–2004, Atmos. Chem. Phys., 7, 4311–4326, https://doi.org/10.5194/acp-7-4311-2007, 2007.
Collett, K. S., Piketh, S. J., and Ross, K. E.: An assessment of the atmospheric nitrogen budget on the South African Highveld, S. Afr. J. Sci., 106, 220, https://doi.org/10.4102/sajs.v106i5/6.220, 2010.
Cooper, O. R., Parrish, D. D., Ziemke, J., Balashov, N. V., Cupeiro, M., Galbally, I. E., Gilge, S., Horowitz, L., Jensen, N. R., Lamarque, J.-F., Naik, V., Oltmans, S. J., Schwab, J., Shindell, D. T., Thompson, A. M., Thouret, V., Wang, Y., and Zbinden, R. M.: Global distribution and trends of tropospheric ozone: An observation-based review, Elem. Sci. Anth., 2, 000029, https://doi.org/10.12952/journal.elementa.000029, 2014.
Crutzen, P. J. and Andreae, M. O.: Biomass Burning in the Tropics: Impact on Atmospheric Chemistry and Biogeochemical Cycles, Science, 250, 1669–1678, https://doi.org/10.1126/science.250.4988.1669, 1990.
Diab, R. D., Thompson, A. M., Zunckel, M., Coetzee, G. J. R., Combrink, J., Bodeker, G. E., Fishman, J., Sokolic, F., McNamara, D. P., Archer, C. B., and Nganga, D.: Vertical ozone distribution over southern Africa and adjacent oceans during SAFARI-92, J. Geophys. Res.-Atmos., 101, 23823–23833, https://doi.org/10.1029/96JD01267, 1996.
Diab, R. D., Thompson, A., Mari, K., Ramsay, L., and Coetzee, G.: Tropospheric ozone climatology over Irene, South Africa, from 1990 to 1994 and 1998 to 2002, J. Geophys. Res.-Atmos., 109, D20301, https://doi.org/10.1029/2004JD004793, 2004.
Draxler, R. R. and Hess, G. D.: An overview of the HYSPLIT_4 modeling system of trajectories, dispersion, and deposition, Aust. Meteorol. Mag., 47, 295–308, 1998.
Dyson, L. L., Van Heerden, J., and Sumner, P. D.: A baseline climatology of sounding-derived parameters associated with heavy rainfall over Gauteng, South Africa, Int. J. Climatol., 35, 114–127, 2015.
Galanter, M., Levy, H., and Carmichael, G. R.: Impacts of biomass burning on tropospheric CO, NOx, and O3, J. Geophys. Res.-Atmos., 105, 6633–6653, 2000.
Garstang, M., Tyson, P. D., Swap, R., Edwards, M., Kållberg, P., and Lindesay, J. A.: Horizontal and vertical transport of air over southern Africa, J. Geophys. Res.-Atmos., 101, 23721–23736, https://doi.org/10.1029/95JD00844, 1996.
Geddes, J. A., Murphy, J. G., and Wang, D. K.: Long term changes in nitrogen oxides and volatile organic compounds in Toronto and the challenges facing local ozone control, Atmos. Environ., 43, 3407–3415, https://doi.org/10.1016/j.atmosenv.2009.03.053, 2009.
Government Gazette: Air Quality Act, 2004 (Act no. 39 of 2004), National ambient air quality standards, Department of Environmental Affairs, National Environmental Management, 6–9, 2009.
Held, G., Scheifinger, H., Snyman, G., Tosen, G., and Zunckel, M.: The climatology and meteorology of the Highveld, Air pollution and its impacts on the South African Highveld, Environmental Scientific Association, Johannesburg, South Africa, 60–71, 1996.
Hirsikko, A., Vakkari, V., Tiitta, P., Manninen, H. E., Gagné, S., Laakso, H., Kulmala, M., Mirme, A., Mirme, S., Mabaso, D., Beukes, J. P., and Laakso, L.: Characterisation of sub-micron particle number concentrations and formation events in the western Bushveld Igneous Complex, South Africa, Atmos. Chem. Phys., 12, 3951–3967, https://doi.org/10.5194/acp-12-3951-2012, 2012.
Hirsikko, A., Vakkari, V., Tiitta, P., Hatakka, J., Kerminen, V.-M., Sundström, A.-M., Beukes, J. P., Manninen, H. E., Kulmala, M., and Laakso, L.: Multiple daytime nucleation events in semi-clean savannah and industrial environments in South Africa: analysis based on observations, Atmos. Chem. Phys., 13, 5523–5532, https://doi.org/10.5194/acp-13-5523-2013, 2013.
Holloway, A. M. and Wayne, R. P.: Atmospheric chemistry, Royal Society of Chemistry, Cambridge, UK, xiii, 271 pp., 2010.
IPCC: Climate change 2013: The physical science basis: contribution of Working Group I to the Fifth Assessment Report of the Intergovernmental Panel on Climate Change, edited by: Stocker, T. F., Qin, D., Plattner, G.-K., Tignor, M., Allen, S. K., Boschung, J., Nauels, A., Xia, Y., Bex, B., and Midgley, B., Cambridge University Press, New York, USA, 2013.
Jaars, K., Beukes, J. P., van Zyl, P. G., Venter, A. D., Josipovic, M., Pienaar, J. J., Vakkari, V., Aaltonen, H., Laakso, H., Kulmala, M., Tiitta, P., Guenther, A., Hellén, H., Laakso, L., and Hakola, H.: Ambient aromatic hydrocarbon measurements at Welgegund, South Africa, Atmos. Chem. Phys., 14, 7075–7089, https://doi.org/10.5194/acp-14-7075-2014, 2014.
Jaars, K., van Zyl, P. G., Beukes, J. P., Hellén, H., Vakkari, V., Josipovic, M., Venter, A. D., Räsänen, M., Knoetze, L., Cilliers, D. P., Siebert, S. J., Kulmala, M., Rinne, J., Guenther, A., Laakso, L., and Hakola, H.: Measurements of biogenic volatile organic compounds at a grazed savannah grassland agricultural landscape in South Africa, Atmos. Chem. Phys., 16, 15665–15688, https://doi.org/10.5194/acp-16-15665-2016, 2016.
Jaeglé, L., Jacob, D. J., Brune, W. H., and Wennberg, P. O.: Chemistry of HOx radicals in the upper troposphere, Atmos. Environ., 35, 469–489, https://doi.org/10.1016/S1352-2310(00)00376-9, 2001.
Josipovic, M.: Acidic deposition emanating from the South African Highveld: A critical levels and critical loads assessment, PhD thesis, University of Johannesburg, Johannesburg, South Africa, 2009.
Josipovic, M., Annegarn, H. J., Kneen, M. A., Pienaar, J. J., and Piketh, S. J.: Concentrations, distributions and critical level exceedance assessment of SO2, NO2 and O3 in South Africa, Environ. Monit. Assess., 171, 181–196, https://doi.org/10.1007/s10661-009-1270-5, 2010.
Kanakidou, M. and Crutzen, P. J.: The photochemical source of carbon monoxide: Importance, uncertainties and feedbacks, Chemosphere, 1, 91–109, 1999.
Klopper, E., Vogel, C. H., and Landman, W. A.: Seasonal climate forecasts–potential agricultural-risk management tools?, Climatic Change, 76, 73–90, 2006.
Laakso, L., Laakso, H., Aalto, P. P., Keronen, P., Petäjä, T., Nieminen, T., Pohja, T., Siivola, E., Kulmala, M., Kgabi, N., Molefe, M., Mabaso, D., Phalatse, D., Pienaar, K., and Kerminen, V.-M.: Basic characteristics of atmospheric particles, trace gases and meteorology in a relatively clean Southern African Savannah environment, Atmos. Chem. Phys., 8, 4823–4839, https://doi.org/10.5194/acp-8-4823-2008, 2008.
Laakso, L., Vakkari, V., Virkkula, A., Laakso, H., Backman, J., Kulmala, M., Beukes, J. P., van Zyl, P. G., Tiitta, P., Josipovic, M., Pienaar, J. J., Chiloane, K., Gilardoni, S., Vignati, E., Wiedensohler, A., Tuch, T., Birmili, W., Piketh, S., Collett, K., Fourie, G. D., Komppula, M., Lihavainen, H., de Leeuw, G., and Kerminen, V.-M.: South African EUCAARI measurements: seasonal variation of trace gases and aerosol optical properties, Atmos. Chem. Phys., 12, 1847–1864, https://doi.org/10.5194/acp-12-1847-2012, 2012.
Laakso, L., Beukes, J. P., Van Zyl, P. G., Pienaar, J. J., Josipovic, M., Venter, A. D., Jaars, K., Vakkari, V., Labuschagne, C., Chiloane, K., and Tuovinen, J.-P.: Ozone concentrations and their potential impacts on vegetation in southern Africa, in: Climate change, air pollution and global challenges understanding and perspectives from forest research, edited by: Matyssek, R., Clarke, N., Cudlin, P., Mikkelsen, T. N., Tuovinen, J.-P., Wieser, G., and Paoletti, E., 1 online resource, Elsevier, Oxford, UK, 647 pp., 2013.
Lefohn, A. S., Emery, C., Shadwick, D., Wernli, H., Jung, J., and Oltmans, S. J.: Estimates of background surface ozone concentrations in the United States based on model-derived source apportionment, Atmos. Environ., 84, 275–288, https://doi.org/10.1016/j.atmosenv.2013.11.033, 2014.
Lin, M., Fiore, A. M., Cooper, O. R., Horowitz, L. W., Langford, A. O., Levy, H., Johnson, B. J., Naik, V., Oltmans, S. J., and Senff, C. J.: Springtime high surface ozone events over the western United States: Quantifying the role of stratospheric intrusions, J. Geophys. Res.-Atmos., 117, D00V22, https://doi.org/10.1029/2012JD018151, 2012.
Logan, J. A.: Tropospheric ozone: Seasonal behavior, trends, and anthropogenic influence, J. Geophys. Res.-Atmos., 90, 10463–10482, https://doi.org/10.1029/JD090iD06p10463, 1985.
Lourens, A. S., Beukes, J. P., Van Zyl, P. G., Fourie, G. D., Burger, J. W., Pienaar, J. J., Read, C. E., and Jordaan, J. H.: Spatial and temporal assessment of gaseous pollutants in the Highveld of South Africa, S. Afr. J. Sci., 107, 1–8, 2011.
Lourens, A. S. M., Butler, T. M., Beukes, J. P., Van Zyl, P. G., Beirle, S., Wagner, T. K., Heue, K.-P., Pienaar, J. J., Fourie, G. D., and Lawrence, M. G.: Re-evaluating the NO2 hotspot over the South African Highveld, S. Afr. J. Sci., 108, 11–12, https://doi.org/10.4102/sajs.v108i11/12.1146, 2012.
Lourens, A. S. M., Butler, T. M., Beukes, J. P., Van Zyl, P. G., Fourie, G. D., and Lawrence, M. G.: Investigating atmospheric photochemistry in the Johannesburg-Pretoria megacity using a box model, S. Afr. J. Sci., 112, 1–11, https://doi.org/10.17159/sajs.2016/2015-0169, 2016.
Macdonald, A. M., Anlauf, K. G., Leaitch, W. R., Chan, E., and Tarasick, D. W.: Interannual variability of ozone and carbon monoxide at the Whistler high elevation site: 2002–2006, Atmos. Chem. Phys., 11, 11431–11446, https://doi.org/10.5194/acp-11-11431-2011, 2011.
Mafusire, G., Annegarn, H. J., Vakkari, V., Beukes, J. P., Josipovic, M., Van Zyl, P. G., and Laakso, L.: Submicrometer aerosols and excess CO as tracers for biomass burning air mass transport over southern Africa, J. Geophys. Res.-Atmos., 121, 10262–10282, https://doi.org/10.1002/2015JD023965, 2016.
Monks, P. S., Archibald, A. T., Colette, A., Cooper, O., Coyle, M., Derwent, R., Fowler, D., Granier, C., Law, K. S., Mills, G. E., Stevenson, D. S., Tarasova, O., Thouret, V., von Schneidemesser, E., Sommariva, R., Wild, O., and Williams, M. L.: Tropospheric ozone and its precursors from the urban to the global scale from air quality to short-lived climate forcer, Atmos. Chem. Phys., 15, 8889–8973, https://doi.org/10.5194/acp-15-8889-2015, 2015.
Murphy, J. G., Day, D. A., Cleary, P. A., Wooldridge, P. J., Millet, D. B., Goldstein, A. H., and Cohen, R. C.: The weekend effect within and downwind of Sacramento: Part 2. Observational evidence for chemical and dynamical contributions, Atmos. Chem. Phys. Discuss., 6, 11971–12019, https://doi.org/10.5194/acpd-6-11971-2006, 2006.
Novelli, P. C., Steele, L. P., and Tans, P. P.: Mixing ratios of carbon monoxide in the troposphere, J. Geophys. Res.-Atmos., 97, 20731–20750, 1992.
NRC (National Research): Rethinking the Ozone Problem in Urban and Regional Air Pollution, The National Academies Press, Washington, D.C., USA, 524 pp., 1991.
Oltmans, S. J., Lefohn, A. S., Shadwick, D., Harris, J. M., Scheel, H. E., Galbally, I., Tarasick, D. W., Johnson, B. J., Brunke, E. G., Claude, H., Zeng, G., Nichol, S., Schmidlin, F., Davies, J., Cuevas, E., Redondas, A., Naoe, H., Nakano, T., and Kawasato, T.: Recent tropospheric ozone changes – A pattern dominated by slow or no growth, Atmos. Environ., 67, 331–351, https://doi.org/10.1016/j.atmosenv.2012.10.057, 2013.
Parrish, D. D., Law, K. S., Staehelin, J., Derwent, R., Cooper, O. R., Tanimoto, H., Volz-Thomas, A., Gilge, S., Scheel, H. E., Steinbacher, M., and Chan, E.: Lower tropospheric ozone at northern midlatitudes: Changing seasonal cycle, Geophys. Res. Lett., 40, 1631–1636, https://doi.org/10.1002/grl.50303, 2013.
Petäjä, T., Vakkari, V., Pohja, T., Nieminen, T., Laakso, H., Aalto, P. P., Keronen, P., Siivola, E., Kerminen, V.-M., Kulmala, M., and Laakso, L.: Transportable Aerosol Characterization Trailer with Trace Gas Chemistry: Design, Instruments and Verification, Aerosol Air Qual. Res., 13, 421–435, https://doi.org/10.4209/aaqr.2012.08.0207, 2013.
Roy, D., Lewis, P., and Justice, C.: Burned area mapping using multi-temporal moderate spatial resolution data: A bi-directional reflectance model-based expectation approach, Remote Sens. Environ., 83, 263–286, 2002.
Roy, D., Frost, P., Justice, C., Landmann, T., Le Roux, J., Gumbo, K., Makungwa, S., Dunham, K., Du Toit, R., and Mhwandagara, K.: The Southern Africa Fire Network (SAFNet) regional burned-area product-validation protocol, Int. J. Remote Sens., 26, 4265–4292, 2005.
Roy, D. P., Boschetti, L., Justice, C. O., and Ju, J.: The collection 5 MODIS burned area product: Global evaluation by comparison with the MODIS active fire product, Remote Sens. Environ., 112, 3690–3707, 2008.
Schultz, M. G., Schröder, S., Lyapina, O., Cooper, O., Galbally, I., Petropavlovskikh, I., von Schneidemesser, E., Tanimoto, H., Elshorbany, Y., and Naja, M.: Tropospheric Ozone Assessment Report: Database and metrics data of global surface ozone observations, Elementa, 5, p. 58, https://doi.org/10.1525/elementa.244, 2017.
Sillman, S.: The relation between ozone, NOx and hydrocarbons in urban and polluted rural environments, Atmos. Environ., 33, 1821–1845, https://doi.org/10.1016/S1352-2310(98)00345-8, 1999.
Simpson, I. J., Akagi, S. K., Barletta, B., Blake, N. J., Choi, Y., Diskin, G. S., Fried, A., Fuelberg, H. E., Meinardi, S., Rowland, F. S., Vay, S. A., Weinheimer, A. J., Wennberg, P. O., Wiebring, P., Wisthaler, A., Yang, M., Yokelson, R. J., and Blake, D. R.: Boreal forest fire emissions in fresh Canadian smoke plumes: C1–C10 volatile organic compounds (VOCs), CO2, CO, NO2, NO, HCN and CH3CN, Atmos. Chem. Phys., 11, 6445–6463, https://doi.org/10.5194/acp-11-6445-2011, 2011.
Srinivasan, N. K., Su, M.-C., Sutherland, J. W., and Michael, J. V., Reflected Shock Tube Studies of High-Temperature Rate Constants for OH and , J. Phys. Chem. A, 109, 1857–1863, https://doi.org/10.1021/jp040679j, 2005.
Stauffer, R. M., Thompson, A. M., Oltmans, S. J., and Johnson, B. J.: Tropospheric ozonesonde profiles at long-term US monitoring sites: 2. Links between Trinidad Head, CA, profile clusters and inland surface ozone measurements, J. Geophys. Res.-Atmos., 122, 1261–1280, 2017.
Stein, A. F., Draxler, R. R., Rolph, G. D., Stunder, B. J. B., Cohen, M. D., and Ngan, F.: NOAA's HYSPLIT Atmospheric Transport and Dispersion Modeling System, B. Am. Meteorol. Soc., 96, 2059–2077, https://doi.org/10.1175/bams-d-14-00110.1, 2015.
Swap, R. J., Annegarn, H. J., Suttles, J. T., King, M. D., Platnick, S., Privette, J. L., and Scholes, R. J.: Africa burning: A thematic analysis of the Southern African Regional Science Initiative (SAFARI 2000), J. Geophys. Res.-Atmos., 108, 8465, https://doi.org/10.1029/2003JD003747, 2003.
Thompson, A. M.: Biomass burning and the atmosphere: accomplishments and research opportunities, Atmos. Environ., 30, i–ii, https://doi.org/10.1016/S1352-2310(96)90021-7, 1996.
Thompson, A. M., Balashov, N. V., Witte, J. C., Coetzee, J. G. R., Thouret, V., and Posny, F.: Tropospheric ozone increases over the southern Africa region: bellwether for rapid growth in Southern Hemisphere pollution?, Atmos. Chem. Phys., 14, 9855–9869, https://doi.org/10.5194/acp-14-9855-2014, 2014.
Thompson, A. M., Stauffer, R. M., Miller, S. K., Martins, D. K., Joseph, E., Weinheimer, A. J., and Diskin, G. S.: Ozone profiles in the Baltimore-Washington region (2006–2011): satellite comparisons and DISCOVER-AQ observations, J. Atmos. Chem., 72, 393–422, 2015.
Tiitta, P., Vakkari, V., Croteau, P., Beukes, J. P., van Zyl, P. G., Josipovic, M., Venter, A. D., Jaars, K., Pienaar, J. J., Ng, N. L., Canagaratna, M. R., Jayne, J. T., Kerminen, V.-M., Kokkola, H., Kulmala, M., Laaksonen, A., Worsnop, D. R., and Laakso, L.: Chemical composition, main sources and temporal variability of PM1 aerosols in southern African grassland, Atmos. Chem. Phys., 14, 1909–1927, https://doi.org/10.5194/acp-14-1909-2014, 2014.
Tyson, P. D. and Preston-Whyte, R. A.: The weather and climate of southern Africa, 2nd edn., xii, Oxford University Press Southern Africa, Cape Town, South Africa, 396 pp., 2000.
Vakkari, V., Laakso, H., Kulmala, M., Laaksonen, A., Mabaso, D., Molefe, M., Kgabi, N., and Laakso, L.: New particle formation events in semi-clean South African savannah, Atmos. Chem. Phys., 11, 3333–3346, https://doi.org/10.5194/acp-11-3333-2011, 2011.
Vakkari, V., Beukes, J. P., Laakso, H., Mabaso, D., Pienaar, J. J., Kulmala, M., and Laakso, L.: Long-term observations of aerosol size distributions in semi-clean and polluted savannah in South Africa, Atmos. Chem. Phys., 13, 1751–1770, https://doi.org/10.5194/acp-13-1751-2013, 2013.
Vakkari, V., Kerminen, V.-M., Beukes, J. P., Tiitta, P., van Zyl, P. G., Josipovic, M., Venter, A. D., Jaars, K., Worsnop, D. R., Kulmala, M., and Laakso, L.: Rapid changes in biomass burning aerosols by atmospheric oxidation, Geophys. Res. Lett., 41, 2644–2651, https://doi.org/10.1002/2014GL059396, 2014.
Venter, A. D., Vakkari, V., Beukes, J. P., Van Zyl, P. G., Laakso, H., Mabaso, D., Tiitta, P., Josipovic, M., Kulmala, M., Pienaar, J. J., and Laakso, L.: An air quality assessment in the industrialised western Bushveld Igneous Complex, South Africa, S. Afr. J. Sci., 108, 1059, https://doi.org/10.4102/sajs.v108i9/10.1059, 2012.
Venter, A. D., van Zyl, P. G., Beukes, J. P., Josipovic, M., Hendriks, J., Vakkari, V., and Laakso, L.: Atmospheric trace metals measured at a regional background site (Welgegund) in South Africa, Atmos. Chem. Phys., 17, 4251–4263, https://doi.org/10.5194/acp-17-4251-2017, 2017.
Vingarzan, R.: A review of surface ozone background levels and trends, Atmos. Environ., 38, 3431–3442, https://doi.org/10.1016/j.atmosenv.2004.03.030, 2004.
Wells, R., Lloyd, S., and Turner, C.: National air pollution source inventory, Air pollution and its impacts on the South African Highveld, Environmental Scientific Association, Johannesburg, South Africa, 3–9, 1996.
Wilson, S. R.: Characterisation of J(O1D) at Cape Grim 2000–2005, Atmos. Chem. Phys., 15, 7337–7349, https://doi.org/10.5194/acp-15-7337-2015, 2015.
Zhang, L., Jacob, D. J., Yue, X., Downey, N. V., Wood, D. A., and Blewitt, D.: Sources contributing to background surface ozone in the US Intermountain West, Atmos. Chem. Phys., 14, 5295–5309, https://doi.org/10.5194/acp-14-5295-2014, 2014.
Zunckel, M., Venjonoka, K., Pienaar, J. J., Brunke, E. G., Pretorius, O., Koosialee, A., Raghunandan, A., and van Tienhoven, A. M.: Surface ozone over southern Africa: synthesis of monitoring results during the Cross border Air Pollution Impact Assessment project, Atmos. Environ., 38, 6139–6147, https://doi.org/10.1016/j.atmosenv.2004.07.029, 2004.
Zunckel, M., Koosailee, A., Yarwood, G., Maure, G., Venjonoka, K., van Tienhoven, A. M., and Otter, L.: Modelled surface ozone over southern Africa during the Cross Border Air Pollution Impact Assessment Project, Environ. Modell. Softw., 21, 911–924, https://doi.org/10.1016/j.envsoft.2005.04.004, 2006.