the Creative Commons Attribution 4.0 License.
the Creative Commons Attribution 4.0 License.
 | 25 Oct 2018
Observations of the microphysical evolution of convective clouds in the southwest of the United Kingdom
Robert Jackson
Jeffrey R. French
David C. Leon
David M. Plummer
Sonia Lasher-Trapp
Alan M. Blyth
Alexei Korolev
The COnvective Precipitation Experiment (COPE) was designed to investigate the origins of heavy convective precipitation over the southwestern UK, a region that experiences flash flooding due to heavy precipitation from slow-moving convective systems. In this study, the microphysical and dynamical characteristics of developing turrets during 4 days in July and August 2013 are analyzed. In situ cloud microphysical measurements from the University of Wyoming King Air and vertically pointing W-band radar measurements from Wyoming Cloud Radar are examined, together with data from the ground-based NXPol radar.
The 4 days presented here cover a range of environmental conditions in terms of wind shear and instability, resulting in a similarly wide variability in observed ice crystal concentrations, both across days as well as between clouds on individual days. The highest concentration of ice was observed on the days in which there was an active warm-rain process supplying precipitation-sized liquid drops. The high ice concentrations observed (>100 L−1) are consistent with the production of secondary ice particles through the Hallett–Mossop process. Turrets that ascended through remnant cloud layers above the 0 ∘C level had higher ice particle concentrations, suggesting that entrainment of ice particles from older clouds or previous thermals may have acted to aid in the production of secondary ice through the Hallett–Mossop process. Other mechanisms such as the shattering of frozen drops may be more important for producing ice in more isolated clouds.


Raindrop formation at temperatures greater than 0 ∘C begins with the growth of liquid cloud droplets by condensation and then their further growth to drizzle and eventually rain by collision and coalescence, commonly called the warm-rain process. Past observations of ice in warm-based cumulus clouds noted that rapid glaciation often requires the presence of liquid raindrops that can act as embryos for the production of graupel (Koenig, 1963; Hobbs and Rangno, 1990; Huang et al., 2008). These raindrops, once lofted into the updraft above the 0 ∘C level can freeze, and under the right conditions, generate ice through secondary processes.
Numerous mechanisms have been implicated in the production of ice through secondary processes, defined here as the production of ice through mechanisms not requiring the presence of an ice nucleating particle (Field et al., 2017). In this study we consider two such processes: the first is rime-splintering also known as the Hallett–Mossop process and the second is droplet freezing or shattering. The better-known and characterized of these two mechanisms is the Hallett–Mossop process (Hallett and Mossop, 1974). It is active in a narrow temperature regime, −3 to −8 ∘C, and is believed to require the presence of both actively riming ice particles (typically graupel) and cloud droplets with diameters larger than about 25 µm. Splinter production rates have been quantified based on laboratory measurements allowing this process to be implemented in numerical schemes (Chisnell and Latham, 1976; Mossop, 1978; Cotton et al., 1986; Blyth and Latham, 1993; Huang et al., 2008). Several past studies indicate the importance of rime-splintering for controlling ice number in a range of cloud conditions (e.g., Harris-Hobbs and Cooper, 1987; Blyth and Latham, 1993; Huang et al., 2008; Crosier et al., 2011).
Unlike the Hallett–Mossop process, which requires the presence of graupel and is active over a relatively narrow temperature range, drop freezing and shattering may produce secondary ice particles in regions where graupel is not already present or at temperatures colder than −10 ∘C. Here we focus on two processes, that, although are different, result from the freezing of a liquid drop. The first is the pure shattering of a liquid cloud droplet or raindrop upon freezing. Early experiments demonstrated that liquid drops with diameters ranging from 30 µm to 1 mm can produce ice fragments through the shattering of an ice shell during freezing and the number of fragments largely depends on the degree of supercooling (Bigg, 1957; Mason and Maybank, 1960). Pruppacher and Schlamp (1975) demonstrated through laboratory experiments that a drop can shatter into various distributions of fragments depending on whether the drop totally or only partially ruptures upon freezing. The process they described can produce “very small” fragments of unknown number and size. More recently, Wildeman et al. (2017) show that raindrops with diameters on the order of 1 mm or larger can explode upon freezing resulting in possibly hundreds of frozen particles. In a related process, Leisner et al. (2014) demonstrated that as drops freeze small “spicules” could be emitted. In some cases, the freezing of large cloud droplets, with diameters less than 100 µm, could also produce spicules. Both processes have recently been suggested as a potential source of secondary ice in some convective clouds, especially when ice production appears to occur at temperatures too cold for the Hallett–Mossop process to occur (Lawson et al., 2014, 2017). Sullivan et al. (2018) used a parcel model to show that, for clouds with single updrafts and bases warmer than 0 ∘C and tops as cold as −20 ∘C, both the Hallett–Mossop process and drop freezing and shattering may be important and that, in general, one does not dominate over the other.
A principal objective of the COnvective Precipitation Experiment (COPE) was to investigate how differences in the strength of the warm-rain process impact the development of ice in warm-based convective clouds (Leon et al., 2016a). COPE was motivated, in part, by a major flash flooding event that occurred on 16 August 2004, where a line of convective clouds produced peak rainfall rates of more than 300 mm h−1 over Boscastle in southwestern England (Golding et al., 2005). Ground-based radar observations of the Boscastle storm suggest tops were likely no higher than −15 to −20 ∘C, but no in situ microphysical observations were available for this case. Convective clouds that form in southwestern England typically have bases warm enough (∼10 ∘C) to provide sufficient depth for precipitation to form through collision–coalescence by the time turrets ascend to the level where significant freezing begins (e.g., Huang et al., 2008, 2017). Such conditions are conducive for warm-rain initiation and secondary ice production.
COPE was a 2-month field campaign conducted in southwestern England during July and August 2013. Multiple instrumented aircraft collected detailed measurements of cloud microphysical, thermodynamic, and dynamic parameters. A ground-based, scanning X-band radar provided ∼5 min resolution volume scans over the study area (Bennett, 2017). Experiments focused on growing cumulus with cloud tops ranging from 0 to −25 ∘C.
Five recent studies from COPE are particularly relevant to this work. Yang et al. (2016) used in situ measurements to investigate widths and strengths of the updrafts observed during COPE and compared them with similar statistics from convective clouds in other regions around the world. Their statistical analysis showed little difference between updraft widths or strengths between clouds sampled in COPE and those sampled in a maritime, near tropical environment. Plummer et al. (2018) used ground-based radar measurements to examine the microphysical characteristics of several cases during COPE. Their investigation of the occurrence and structure of ZDR columns implicates that precipitation often formed through collision–coalescence and the resulting large raindrops were then lofted above the 0 ∘C level. Lasher-Trapp et al. (2018) presented results from idealized 3-D simulations based on 2 days from COPE. In their simulations they demonstrated that a stronger warm-rain process produces graupel earlier, leading to increased production of ice through secondary processes. Their simulations showed that the Hallett–Mossop process could produce high ice number concentrations in the modeled clouds, consistent with previous results of Huang et al. (2008, 2017), but also that the effectiveness of this process could be inhibited by strong vertical wind shear leading to loss of large particles from the updrafts. Lasher-Trapp et al. (2018) also showed that, while the Hallett–Mossop process could explain the rapid conversion of rainwater to graupel, the amount of precipitation reaching the surface was only minimally affected by the extra ice created by that process. Taylor et al. (2016b) examined a single case from COPE focusing on aircraft in situ measurements and found that the first ice particles were frozen drizzle-sized drops and that high concentrations of small ice crystals were subsequently produced through secondary processes. Miltenberger et al. (2018) presented results from operational forecasting runs with a new cloud–aerosol microphysics module to demonstrate that, under higher aerosol conditions, precipitation is suppressed before the convection becomes organized, but is enhanced under higher-aerosol conditions when the convection is organized into a sea breeze convergence line.
This study focuses on analyses of the microphysical and dynamical characteristics of four cases where cloud tops were colder than −10 ∘C and cloud bases were sufficiently warm to allow production of rain through collision–coalescence. These conditions are also expected to be suitable for production of ice through secondary processes. Our examination of observations from these four cases demonstrates substantial variability in the microphysical characteristics of the clouds and allows us to explore the origins of the variability.
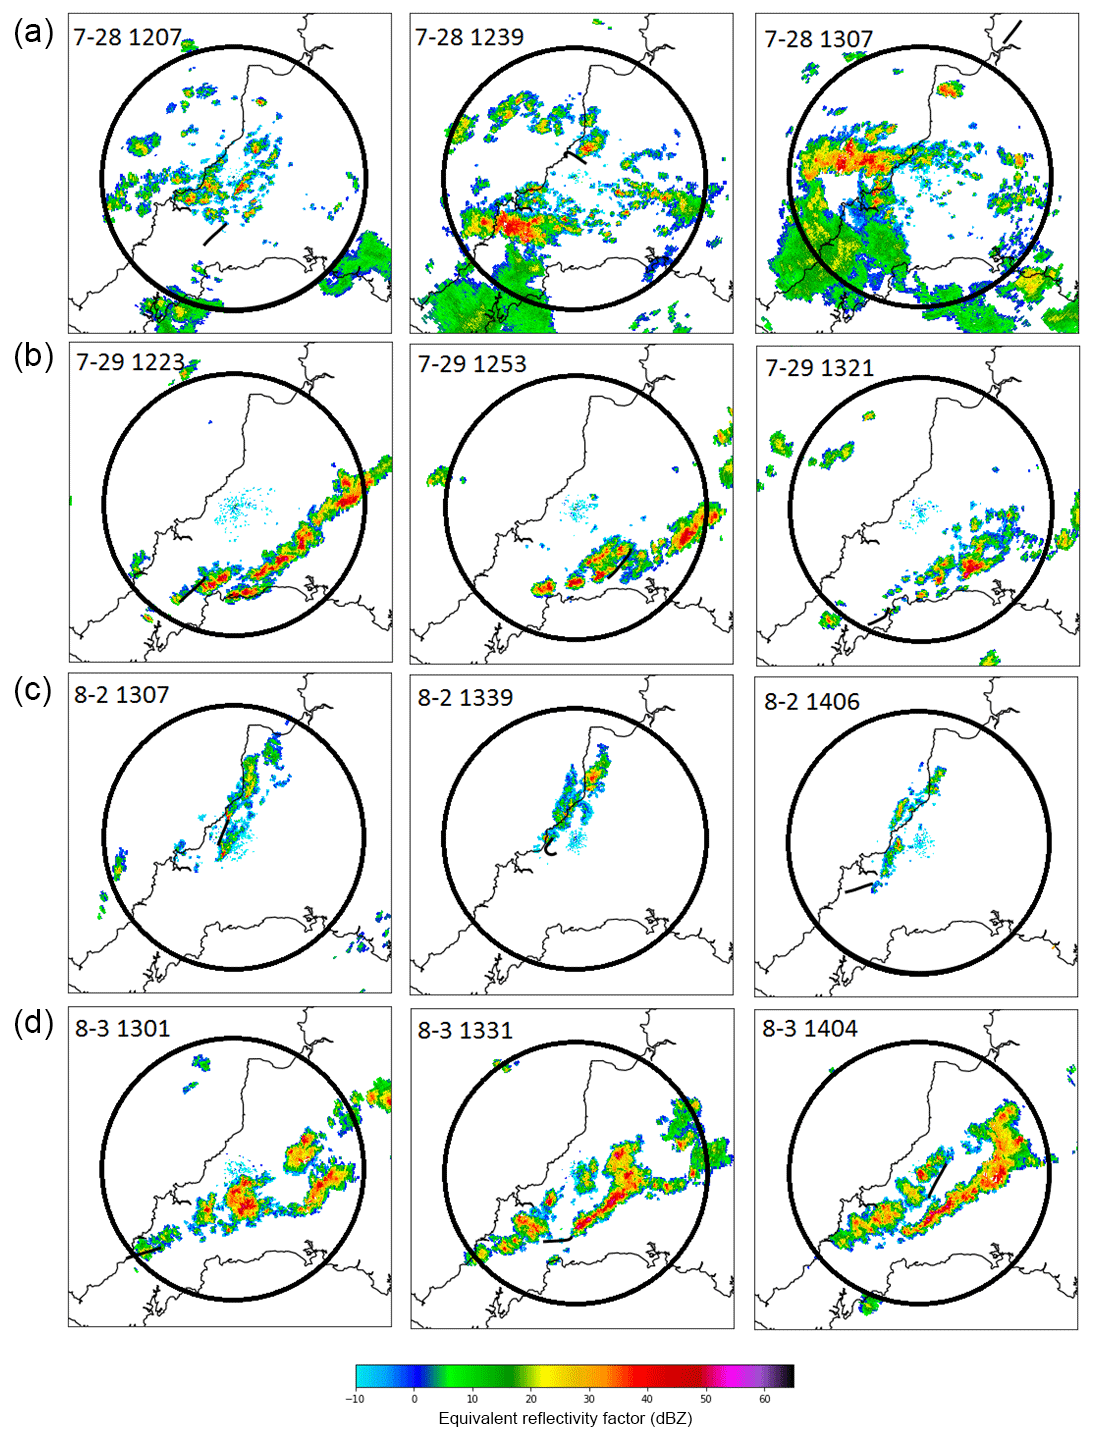
Figure 1Reflectivity factor from the 3.5∘ elevation scan from NCAS radar for three times during a 1 h period on each of the study days. Row (a) shows scans from Case A (28 July), Case B (29 July) in (b), Case C (2 August) in (c), and Case D (3 August) in row (d). The times on each day correspond roughly to the time period centered on the flight of the UWKA. Range rings are shown for 50 km centered on the radar. The thick black line indicates the flight path of the UWKA for a 15 min period centered on the time of the radar scan.
In order to describe the microphysical and dynamical properties of growing turrets and compile evidence on which processes were responsible for hydrometeor growth and development in the observed warm-based convective clouds, we analyze observations from 4 days during COPE (28 and 29 July, and 2 and 3 August 2013). In Sect. 2 the data used in this study are introduced and the collection and processing is described. Section 3 presents the main results: first, similarities and differences in bulk cloud properties for the 4 days are examined; second, using a statistical approach, ice and liquid precipitation particle number concentration and hydrometeor phase are examined to elucidate where and when significant ice production occurred in the clouds; and third, observations from two individual penetrations are examined in detail to explore how secondary ice production could relate to cloud structure and to examine relationships between the production of ice and other microphysical processes. In Sect. 4, the results presented in the previous sections are combined to explore the principal mechanisms responsible for producing ice on each of the days. Conclusions are presented in Sect. 5.
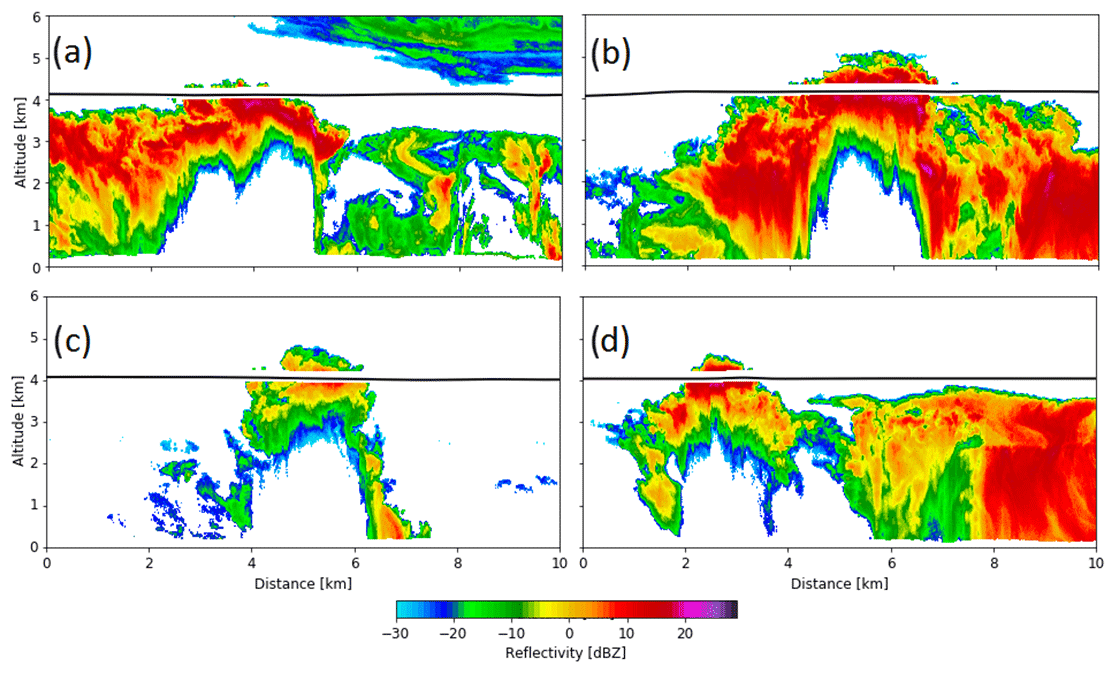
Figure 2Example images or vertical profile of radar reflectivity from the WCR during penetrations on (a) Case A, (b) Case B, (c) Case C, and (d) Case D at temperatures from −6 to −8 ∘C.
On all 4 days a trough of low pressure was located west of the study area resulting in southerly winds at the surface over the southwestern peninsula of the UK on 1 day and southwesterly winds on the other three. Within the southwesterly flow, a sea breeze that led to an environment favorable for the development of convergence lines formed on 29 July and 2 and 3 August while the southerly flow led to more widespread convective activity on 28 July (Fig. 1). The clouds on these days had similar cloud base temperatures (from 9 to 12 ∘C) and tops as cold as −25 ∘C. The data used in this study come primarily from measurements collected onboard the University of Wyoming King Air (UWKA) research aircraft as it made penetrations in clouds at and above the 0 ∘C level (University of Wyoming Research Flight Center, 2016a, b). Leon et al. (2016b) provide a comprehensive list of instrumentation carried onboard the UWKA as part of COPE. Here we discuss only those measurements directly relevant to our analysis.
2.1 Airborne and ground radar data
Data from two ground-based radars provided information on cloud structure. The National Centre for Atmospheric Science (NCAS) ground-based X-band radar (NXPol), located near Davidstow in the southwestern United Kingdom as shown in Fig. 2 of Leon et al. (2016a), was used to provide general information about cloud structure and stage of development (Bennett, 2017). During the 4 days analyzed in this study, the NCAS radar performed plan position indicator (PPI) scans at 10 elevations ranging from 0.5∘ to 9.5∘ at 1∘ intervals. The scans covered an area of approximately 100 km by 100 km at a typical spatial resolution of 200 m. Approximately 5 min was required to complete a single volume scan. The Python ARM Radar Toolkit was used to visualize the X-band radar data (Helmus and Collis, 2016).
The Wyoming Cloud Radar (WCR; Wang et al., 2012; University of Wyoming Research Flight Center, 2016b), an airborne W-band radar installed on the UWKA with two near-vertical beams (up and down), measured radar reflectivity, and the near-vertical component of Doppler velocity. Profiles were provided roughly 15 times per second, approximately every 6 m along the UWKA flight track at nominal research flight speeds (90 m s−1). Processing of data from the WCR included thresholding all data at 3 standard deviations above the noise and removal of surface returns and ground clutter. Doppler velocities were corrected for the motion of the aircraft (Haimov and Rodi, 2013).
Echo-top height was estimated from WCR measurements following the methodology of Rosenow et al. (2014) and Plummer et al. (2015) using the texture σ of the Doppler velocity of the 8 adjacent pixels surrounding each point. Reflectivity factor from W-band radars is strongly affected by attenuation from cloud and drizzle droplets (Lhermitte, 1990; Pujol et al., 2007) and even more severely from raindrops (Lhermitte, 1990). No attempt was made to correct for attenuation, as these data are used qualitatively to describe cloud structure near the aircraft.
2.2 UWKA in situ measurements
A Droplet Measurements Technologies (DMT) Cloud Droplet Probe (CDP) sampled particles with diameter, D, µm and derived their sizes from the intensity of forward scattered light assuming spherical water droplets and Mie–Lorenz theory (Lance et al., 2010). Cloud liquid water content (LWC) was derived from the third moment of the size distribution measured by the CDP. Comparisons between CDP-derived LWC and that from various bulk methods including a DMT LWC-100 hot-wire, a Nevzorov probe (Korolev et al., 1998), and a Gerber Particle Volume Monitor-100A (PVM; Gerber, 1993) show agreement generally within 10 to 15 % over the entire COPE campaign (Sulskis and French, 2016; Faber et al., 2018).
Two optical array probes (OAPs) were used to derive information about hydrometeors larger than a few tens of microns. A grayscale Cloud Imaging Probe (CIP-Gray), with tips designed to mitigate contamination by shattering of ice on the probe tips (Korolev et al., 2013), captured two-dimensional grayscale silhouettes of particles with a nominal range of µm. A 2-D Precipitation (2DP) Probe captured two dimensional images of particles with a nominal range of µm.
A reverse-flow temperature probe provided a measure of temperature. Vertical wind was derived from measures provided by a 9-hole gust probe and a coupled GPS-INS inertial reference system (Leon et al., 2016b, online supplement).
2.3 OAP processing strategy
Data acquired by the CIP and 2DP were processed using the University of Illinois OAP Processing Software (UIOPS) described in detail by Jackson et al. (2014). Although the CIP installed on the UWKA recorded shaded intensity at 3 threshold levels for each pixel, we consider only the 50 % threshold level rendering the data the same as that provided by a standard binary OAP. Due to the poorly defined depth of field of OAPs for small particles (Baumgardner and Korolev, 1997), concentrations of particles of µm from the CIP are not reported in this study. To account for regions of diameter overlap between probes, and to remove significant uncertainty associated with poorly resolved particles from OAPs, for the remainder of the paper, concentrations of particles with µm are reported from the CDP, µm from the CIP, and 800 µm < D<6400 µm from the 2DP.
Korolev et al. (2011) demonstrate the impact on OAP-measured size distributions due to particle shattering on probe tips and inlets. Korolev et al. (2013) and Jackson et al. (2014) estimated that shattering can cause particle number concentrations to be overestimated by up to an order of magnitude and recommended that mitigation approaches should include both modified probe tips coupled with processing algorithms to identify and remove shattered artifacts. The CIP was equipped with modified “anti-shatter” tips and the inter-arrival time algorithm of Field et al. (2006) was applied during processing of the OAP data. In order to determine the threshold used to identify shattered artifacts, an analysis of inter-arrival times was first applied to time periods where only ice was seen in the CIP imagery and the CDP number concentrations were <1 cm−3 in order to ensure that liquid particles were not present. Based on this analysis, all particles with inter-arrival times of less than 10−5 s were rejected as artifacts. These contributed about 7 % to the total number concentration.
To distinguish between spherical particles (assumed to be liquid) and ice particles, the habit identification algorithm of Holroyd (1987) was used and applied to CIP images. This algorithm sorts particles into nine categories: sphere, tiny, linear, oriented, graupel, aggregate, irregular, and hexagonal. However, in order to reduce the possibility of misidentification of ice due to over-categorization, in this study, particles are classified as either spheres (likely liquid) or non-spherical (ice). Images with areas of less than 100 pixels that are classified as tiny by the Holroyd algorithm are not included in the spherical ice categorization for this study. For the CIP this corresponds to hydrometeors with diameters less than roughly 250 µm. While this threshold excludes some small ice fragments, it is impossible to provide a reliable estimate of how many fragments are excluded. We further restrict this analysis to particles that are entirely imaged within the diode array, to reduce misclassification due to partially imaged particles. The spherical classification may contain some ice, especially recently frozen drops and lightly rimed graupel; however, the non-spherical (ice) classifications will rarely contain significant concentrations of liquid hydrometeors. Habit identification was not applied to 2DP data because graupel and spherical raindrops are nearly impossible to distinguish due the coarse resolution of the probe.
Here, we present analyses of measurements obtained in convective clouds sampled on 4 days during COPE (28, 29 July and 2, 3 August). For easier reference, these days will be referred to as Cases A (28 July), B (29 July), C (2 August), and D (3 August) for the remainder of the paper. These cases were chosen because the clouds grew above the 0 ∘C level, providing an environment where ice formation is possible. Despite broadly similar synoptic and thermodynamic conditions on these days, the microphysical evolution of the clouds differed significantly from 1 day to another particularly with respect to ice formation.
The observations will show that, on each day, as clouds ascended up to and above the 0 ∘C level, the initial development of precipitation resulted from the warm-rain process: condensation followed by collision–coalescence, in agreement with conclusions based on analysis of ZDR columns, corresponding to regions of millimeter-sized drops, presented by Plummer et al. (2018). However, concentrations of drops with D ∼500 µm and greater were orders of magnitude lower during Case C than on the other 3 days. Measurements at or just above the 0 ∘C level reveal the presence of mm-diameter drops during Cases A, B, and D, but not during case C until the clouds ascended to about −6 ∘C; even then drop concentrations were orders of magnitude less than on the other 3 days.
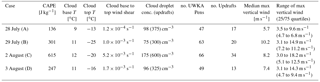
Table 1Environmental and cloud conditions from the 4 days sampled in this study. The definition of what constitutes a penetration and updraft is provided in the text.
In all cases, ice particles began to appear in measurable concentrations by the time cloud tops reached −6 to −8 ∘C. Here too, significant differences between the four cases were observed. During Case A, significant ice production occurred at higher temperatures as the precipitation (defined as particles with D>300 µm) was composed almost entirely of ice by the time cloud tops reached −10 ∘C. On the other end of the spectrum, most of the precipitation in clouds sampled during Case C remained liquid at ∘C, the coldest level sampled on that day. Observations from clouds during Cases B and D fall between these two extremes. In Case D, more than half of the clouds sampled were composed mostly of ice precipitation as clouds tops cooled to −8 to −10 ∘C. In contrast, in Case B, much less than half of the precipitation particles appeared to be ice at the −8 ∘C level, and glaciation occurred more slowly with height as roughly half of the clouds sampled at −12 ∘C were still dominated by liquid precipitation at that level.
In the following sections, we investigate environmental factors that may be responsible for the observed differences in ice and liquid precipitation development in the four cases.
3.1 Overview of cases and environmental conditions
The four cases in this study had similar aircraft-observed cloud base temperatures, ranging from 9 to 12 ∘C, with Case A being colder than the rest (Table 1). On each case, the UWKA conducted penetrations of growing cumulus clouds within 60 km of the NCAS radar between the 0 and −15 ∘C level. The tops of rising turrets were penetrated as they first began to reach the level of the UWKA. Repeated sampling through the same cloud was generally avoided. Growing turrets were targeted visually from the cockpit with the intent of penetrating clouds within 1 km of cloud top. For all of the penetrations analyzed here, 81 % of the WCR-estimated echo-top heights are within 1 km of the UWKA flight level; some examples are shown in Fig. 2.
Individual penetrations are defined by periods with LWC > 0.05 g m−3 for at least 300 m and separated by more than 100 m. Time periods with LWC > 0.05 g m−3 separated by less than 100 m are classified as one penetration. The total number of penetrations was 225, with the number of penetrations ranging from 47 during Case A to 66 during Case C (Table 1).
In order to investigate cloud microphysical conditions in ascending regions of cloud, some of the following analyses were restricted to measurements obtained in updrafts. For this, an updraft is defined as a region within a penetration where the vertical velocity exceeds 1 m s−1 over a continuous region at least 300 m wide. Further, the maximum updraft within that same region must exceed 3 m s−1. Using these criteria, a total of 84 updrafts were identified on the 4 days, ranging from 13 during Case D to 34 during Case C (Table 1)1. More restrictive criteria (larger updraft speeds) would have significantly reduced the number of updrafts identified on all of the days except Case C.
Although the median value of the maximum updraft speed was greater in Case B compared to C, the percentage of penetrations containing updrafts was significantly greater during Case C. The median maximum updraft and the percentage of clouds with updrafts were lower during Cases A and D. This corresponds to differences in CAPE (Table 1) that led to significant differences in observed cloud depths in the four cases, with cases B and C having strongest updrafts and highest (coldest) observed cloud tops. However, Table 1 also demonstrates significant variability in updraft velocities during a given case.
There was large variation in the environmental shear and CAPE through the cloud depth for the four cases. In all cases, there was little turning of the wind with height and thus the shear was aligned with the mean wind direction. The convective lines that formed during Cases B, C, and D were aligned with the wind direction. This provided an environment favorable for the formation of linear convective systems such as those shown in Fig. 1 for these 3 days.
The four cases considered here represent a spectrum of cloud strength. Clouds that formed during Case A were the weakest, growing in environments with significantly less CAPE and vertical wind shear than the other 3 days as seen in Table 1. This resulted in clouds that were both shallower with weaker updraft velocities and which tilted less with height. The nature of the convection itself was also different compared to the other 3 days, being more widespread and less organized. Weaker shear may enhance precipitation growth, as precipitation that forms within the updraft can later fall back through the updraft collecting additional cloud liquid water. Conversely, greater shear may cause precipitation to fall outside of the cloud resulting in conditions less conducive for secondary ice production and growth. Indeed, numerical modeling of Cases C and D (Lasher-Trapp et al., 2018) suggested that the strong vertical wind shear during Case C would be less favorable for secondary ice production than the much weaker shear during Case D.
At the other end of the spectrum, both CAPE and vertical wind shear were the greatest during Case C. Similar to Cases B and D, clouds formed along a line, but for Case C, the line was relatively narrow (Fig. 1), resulting in clouds that were more isolated2, and leaned much more with height. Clouds during Cases B and D reside between these two extremes. On both days, clouds grew in an environment that was only weakly sheared, and clouds grew within lines that were more filled in containing clouds more closely spaced together.
Resulting differences in the detailed microphysical structure based on in situ observations from these four cases are analyzed in the next section. In particular, we consider how the differences in the cloud dynamics between the cases described above may explain the evolution of the precipitation and the productivity of warm rain and ice processes.
3.2 Cloud microphysical characteristics
For each of the 225 cloud penetrations on the 4 days (a subset of which contained 84 updraft regions), statistics related to hydrometeor concentration and particle shape were computed and stratified by day and temperature. These results are shown in Figs. 3 and 4. While cloud liquid water droplet concentrations were lower in the observations obtained from cloud penetrations devoid of updrafts compared to those with updrafts, there does not appear to be any systematic difference in the ice microphysical characteristics between observations obtained from cloud penetrations without updrafts (closed circles) and those only from updrafts (open circles). This result seems surprising given that prior studies have linked secondary ice production to processes occurring in the updraft (i.e. Mossop, 1978; Heymsfield and Willis, 2014; Lawson et al., 2015). However, the sampling strategy of the UWKA was to target the tops of clouds as they first grew through the UWKA, identified visually from the cockpit. This precluded the sampling of anvil regions of clouds or clouds in their dissipating stages. Therefore, in the penetrations without updrafts, it is likely that either the updraft had weakened very recently before the UWKA penetrated the cloud or the updraft speeds were less than our threshold value. Sensitivity tests conducting analyses using differing thresholds for LWC and updraft width showed that this conclusion was insensitive to the thresholds used to define a penetration or updraft core (not shown). Therefore, for the following discussion we consider observations from all 225 cloud penetrations.
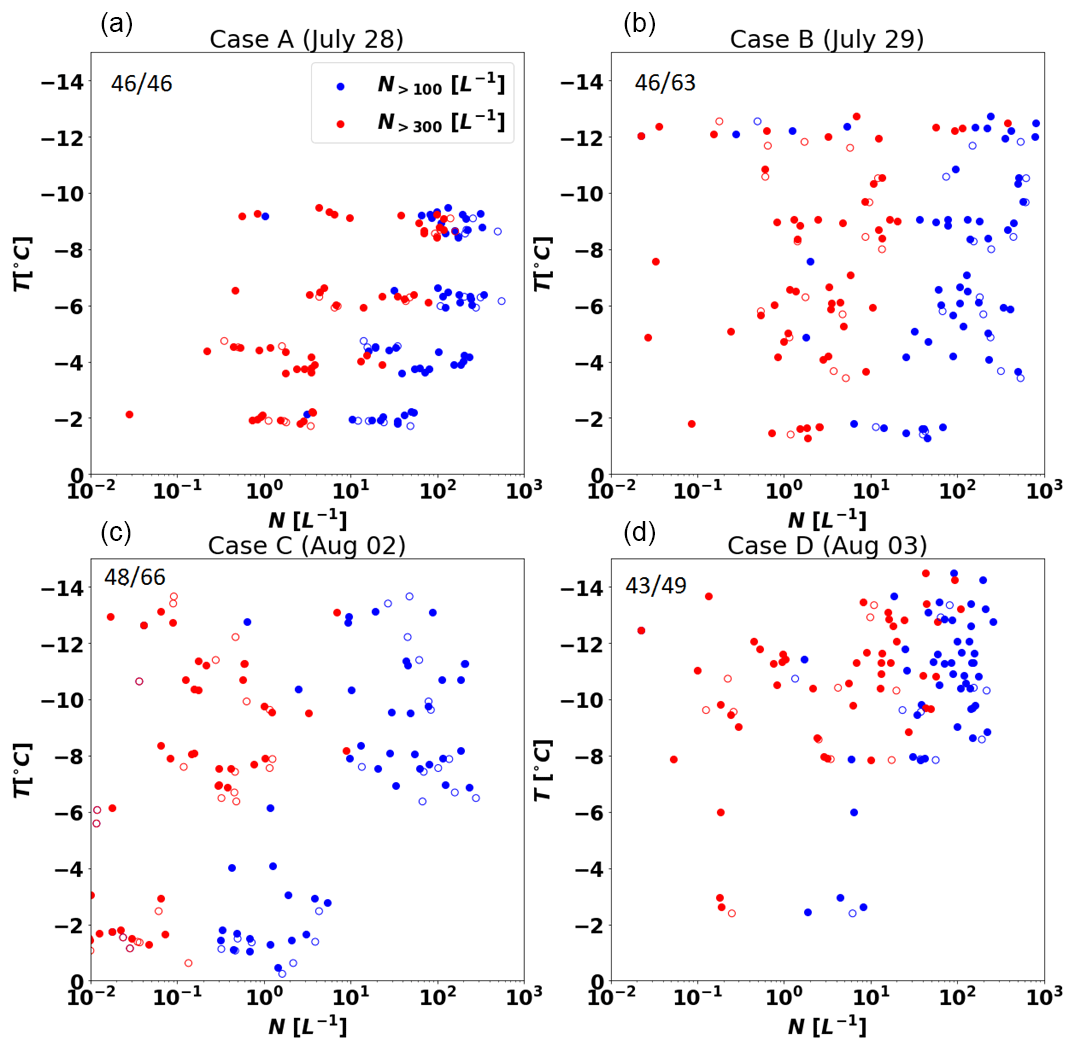
Figure 3Median hydrometeor concentrations for all particles with D>100 m (blue) and D>300 m (red) at the corresponding temperature levels for all penetrations for the four cases. Open circles represent those penetrations that meet the criteria for an updraft core (see text) and closed circles those that do not. The fractional number in panel (a) of each graph represents the number of penetrations with median L−1. The denominator indicates the total number of penetrations from that case.
For penetrations between 0 and −3 ∘C, median concentrations of hydrometeors with D>100 µm (D>300 µm) were roughly 1 to 2 orders of magnitude greater in cases A, B, and D than in Case C (Fig. 3). For Cases A and B, when there were enough identifiable particles present at this level to identify habit, less than 20 % of the particles were aspherical, indicating they were likely liquid drops (Fig. 4). CIP imagery also clearly indicates the presence of raindrops with diameters exceeding 1 mm on these 2 days. No such large raindrops were sampled at this level in Case C, suggesting that there was a less active warm-rain process in the growing turrets during Case C compared to the others. In fact, although several penetrations were made at this level during Case C, none contained sufficient numbers of particles to allow a statistical computation of particle shape (hence no data from between 0 and −3 ∘C in 2 August are shown in Fig. 4). Only a few penetrations were made by the UWKA at this level during Case D. However, Taylor et al. (2016b) reported up to 50 L−1 of spherical precipitation near 0 ∘C from the BAe-146, providing evidence that the raindrops were being produced through collision–coalescence on this day.
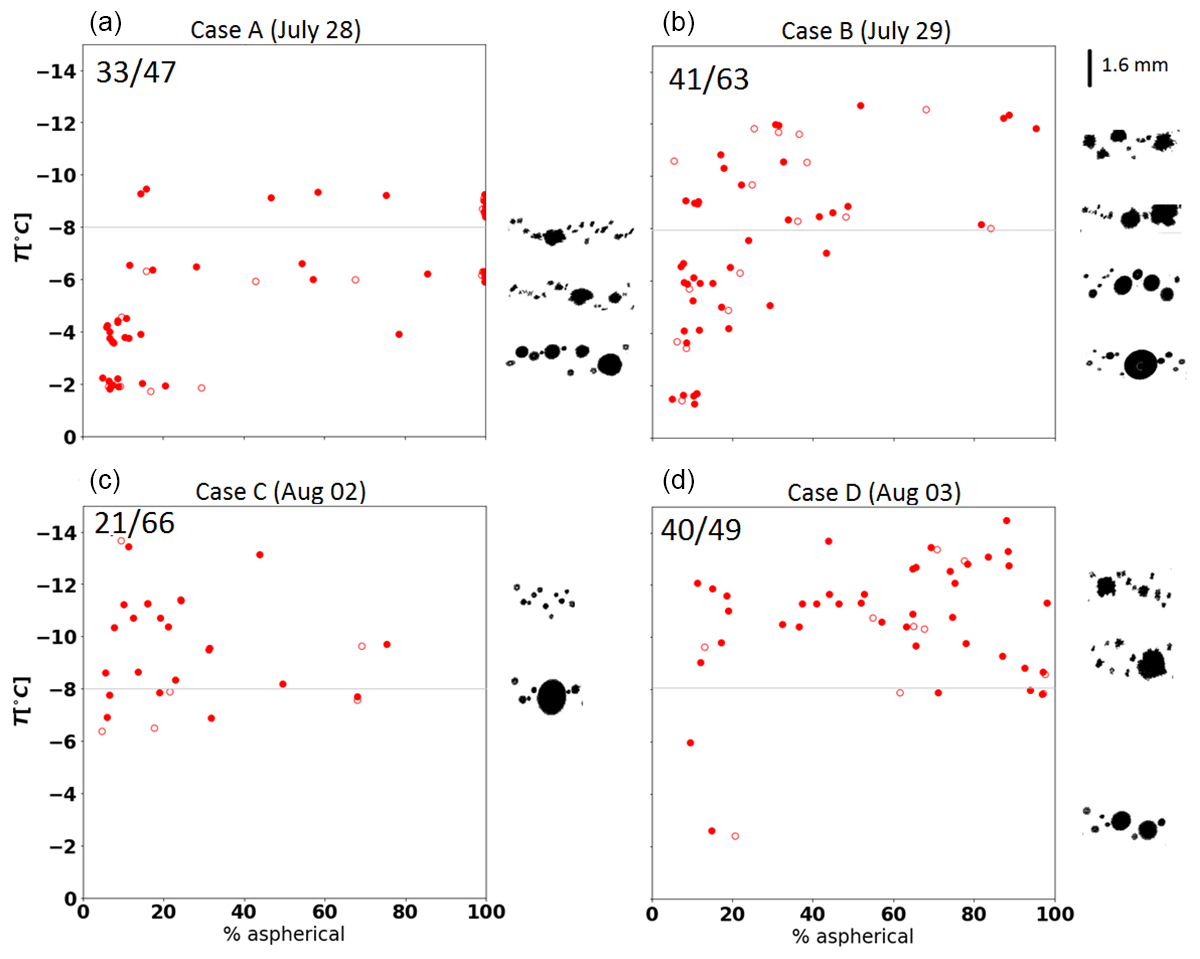
Figure 4The percent of hydrometeors (in red) that were classified as non-spherical at the corresponding temperature for updraft cores (open circles) and penetrations not meeting updraft core criteria (dots) for the 4 days in the study. Only particles with D>300 m were considered. The fractional number represents the number of penetrations that contained at least 10 such particles. Example images from the OAP CIP of hydrometeors observed during penetrations at the indicated temperature are shown on the right side of the graph for each day. A scale for the images is shown in panel (a)
In the Hallett–Mossop zone (Hallett and Mossop, 1974), between the −3 and −8 ∘C level, concentration of precipitation-sized particles increases relative to the 0 to −3 ∘C level for all of the cases. For hydrometeors with D>100 µm (Fig. 3, blue dots), concentrations were roughly the same at −8 ∘C for all of the cases. However, for larger hydrometeors, with D>300 µm (Fig. 3, red dots), concentrations during Case C remain 1 to 2 orders of magnitude less than those from the other cases.
Significant differences are also found in the percentage of particles imaged by the CIP that were identified as aspherical (Fig. 4). In most penetrations in Case A, the majority of particles sampled near −8 ∘C were aspherical (ice). In Case D, CIP observations from most of the penetrations at this level also revealed that the majority of particles were ice, although a few penetrations contained only a small percentage of ice hydrometeors. For those penetrations that did contain ice, images from the CIP suggest a mix of graupel and small columnar or linear-type crystals similar to those reported by Taylor et al. (2016b) based on measurements from 3 August only. In both Cases B and C, generally less than 20 % of the hydrometeors were aspherical, indicating that most of the precipitation remained in liquid form at this level. Images from the CIP do indicate the presence of a few small columnar-shaped crystals at −8 ∘C in Case B too small (D<300 µm) to be considered in the shape analysis, but suggesting some ice is present here.
Just above the Hallett–Mossop zone, between −8 and −10 ∘C, nearly all of the penetrations in Case A were dominated by ice precipitation. At even higher levels (−10 ∘C level and above) the majority of penetrations in Case D (approximately 75 %) had precipitation dominated by ice. Contrary to these, penetrations in Cases B and C remained largely dominated by liquid precipitation. It was not until temperatures reached −12 ∘C, well outside of the Hallett–Mossop zone, that we began to see many penetrations dominated by ice in Case B. Penetrations in Case C remained largely devoid of ice even at temperatures less than −12 ∘C, suggesting that the processes responsible for ice production in Cases A, B, and D were likely less active in Case C.
Figure 5 shows representative hydrometeor size distributions from updrafts at several temperature levels for each case. For penetrations near the −3 ∘C level (red lines), there is a larger concentration of cloud droplets with D<30 µm in Case C. This is likely due to the larger cloud droplet number concentration observed at cloud base in Case C (Table 1) and is consistent with a slower collision–coalescence process, as expected given the smaller median droplet diameter, narrower droplet spectra, and stronger updraft velocities, supported by the modeling study of Case C by Lasher-Trapp et al. (2018). Hence, a greater cloud depth was necessary to grow precipitation-sized drops in Case C compared to the other days, explaining the lower concentrations of 300 µm and larger particles seen in Case C in Fig. 3.

Figure 5Mean N(D) from the CDP, CIP, and 2DP for the specified penetrations from (a) Case A, (b) Case B, (c) Case C, and (d) Case D. The solid black line denotes 24 µm.
On all days, the concentration of particles with diameters greater than a few hundred microns increased significantly at the −6 to −8 ∘C levels (green lines) compared to their concentrations lower in the cloud. However, on the days when more ice was present at these levels (Cases A, D) the increase in concentration, by more than an order of magnitude, was significantly greater than on the days when little or no ice was present (Cases B, C). The presence of particles up to a few millimeters in diameter at −6 to −8 ∘C further supports the idea that graupel and frozen drops likely provided the rimers necessary for the Hallet–Mossop process. At the −10 ∘C level (blue lines), hydrometeor size distributions extended to a few mm in Cases B and C, with lower particle concentrations and mostly liquid precipitation in Case C. Thus, the lack of millimeter-size hydrometeors could have inhibited secondary ice production in Case C. In cases without updrafts, similar trends were noted in the concentrations of particles greater than a few hundred microns (not shown).
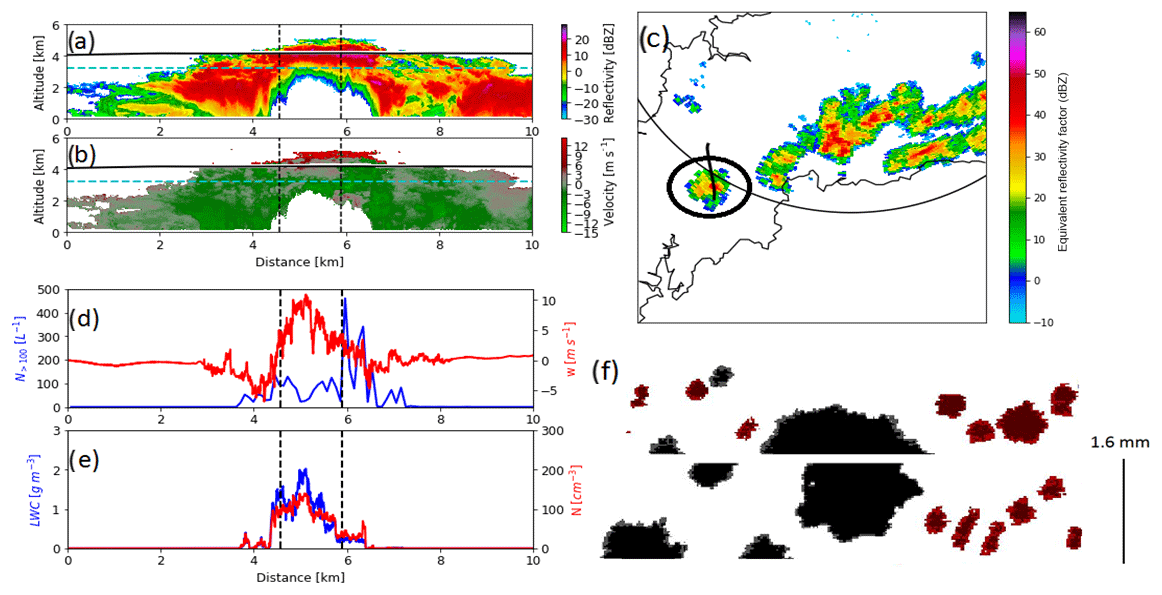
Figure 6(a) WCR radar reflectivity and (b) vertical velocity for a penetration at −8∘ during Case B (29 July) with ice phase precipitation. (c) PPI of NCAS radar reflectivity at 1.5 km MSL for the scan taken during the time of the penetration. The thick black line indicates the UWKA flight track during the scan and the circle indicates the clouds penetrated by the UWKA. (d) Time-series trace of hydrometeor concentration with D>100 m (N>100; blue) and vertical wind (w; red) through the penetration. (e) Time-series trace of cloud droplet concentration (N; blue) and cloud liquid water content (LWC; red) from the CDP. (f) Representative hydrometeor images recorded by the CIP in the updraft core, with particles identified as spherical colored blue, aspherical colored red, and particles not identified by the algorithm colored black. Vertical dotted lines in (a, b, d, e) denote the boundaries of the updraft core.
The picture that emerges from this analysis is that formation of precipitation sized drops through collision–coalescence low in the cloud appeared to be less efficient in Case C resulting in fewer drizzle and rain drops by the 0 ∘C level than in the other cases. This further retarded growth of larger hydrometeors higher in cloud and ice production through secondary processes. Precipitation sampled by the UWKA remained mostly liquid for the clouds sampled in Case C even down to temperatures near −14 ∘C. The ice concentrations are orders of magnitude higher than predicted from the boundary layer aerosol concentrations measured during COPE by Taylor et al. (2016a), indicating that primary nucleation, while possible, alone cannot explain the observed concentrations and therefore secondary ice production must be occurring. Precipitation formation proceeded rapidly to the ice phase in Cases A and D at temperatures consistent with secondary production through the Hallett–Mossop process. The production of significant ice took place at lower temperatures in Case B, outside of the Hallett–Mossop zone, suggesting a different process such as drop freezing and shattering might produce the high ice concentrations observed.
3.3 Possible ice enhancement by recirculation
The observations demonstrate a large degree of variability not only between days, but also from a single day at a given level. To further investigate the factors impacting ice formation in the COPE clouds, we closely examine observations from two individual penetrations at the −8 ∘C level. These penetrations, from Case B (29 July), were chosen because the large range of ice crystal concentrations observed in the two clouds together roughly covers the total range measured in all of the COPE clouds from all of the cases at −8 ∘C. Further, the two clouds show differences in the predominant precipitation phase. In the penetration shown in Fig. 6, precipitation is all ice with a mix of graupel and columnar-shaped crystals. For the penetration shown in Fig. 7, precipitation appears to be mostly liquid ranging in size from a ∼300 µm to 1 mm in diameter with a few graupel particles.
PPI scans from the NCAS radar indicate both clouds were relatively isolated from larger complexes located to the north and east and near-surface reflectivity values were approaching 50 dBZ during the two penetrations (Figs. 6c and 7c). Vertical cross sections from the WCR indicate for both penetrations, the UWKA passed roughly 0.5 to 1 km below cloud top. The region devoid of radar echo below the cloud (Figs. 6, 7a and b) is due to strong attenuation that is expected in the presence of precipitation-sized liquid drops at W-band (Lhermitte, 1990).
The two penetrations considered here contained similar amounts of cloud liquid water within their updraft cores, roughly 1 to 2 g m−3 (Figs. 6e, 7e). Both clouds had peak updrafts between 10 and 15 m s−1 (Figs. 6d and 7d respectively). The stronger 15 m s−1 updraft in Fig. 7d is consistent with more vigorous growth of the cloud suggested by the NCAS radar imagery. However, the concentration of hydrometeors with D>100 µm different, ranging from a low of 50–100 L−1 in the cloud composed of mostly liquid precipitation (Fig. 7d) to in excess of 300 L−1 in the cloud containing all ice-phase precipitation particles (Fig. 6d). CIP images (Fig. 6f) show the presence of graupel and columns in the latter cloud, consistent with what would be expected if secondary ice production and riming were occurring (Hallett and Mossop, 1974). In fact, 94 % of the identifiable particles in the updraft were identified as ice. However, in the cloud containing mostly liquid precipitation, only 33 % were identified as ice, and what few ice particles were detected were mostly large graupel (Fig. 7f). The WCR images also show that echoes surrounding the updrafts were present at altitudes up to 4 km in the ice phase cloud (Fig. 6a and b), but only extend up to 3 km in the cloud composed mostly of liquid precipitation (Fig. 7a and b). The 0 ∘C level is roughly 3.2 km in both clouds. In both cases, the updrafts sampled by the UWKA would have grown through the cloud layer seen by the WCR. Any particles entrained into the updraft in Fig. 7b would likely be liquid, as the surrounding cloud existed entirely below the freezing level. However, if the higher growth for the surrounding clouds in Fig. 6a contained ice, then these ice particles could be entrained into the growing updraft and immediately begin to interact with the raindrops already present (Fig. 6b).
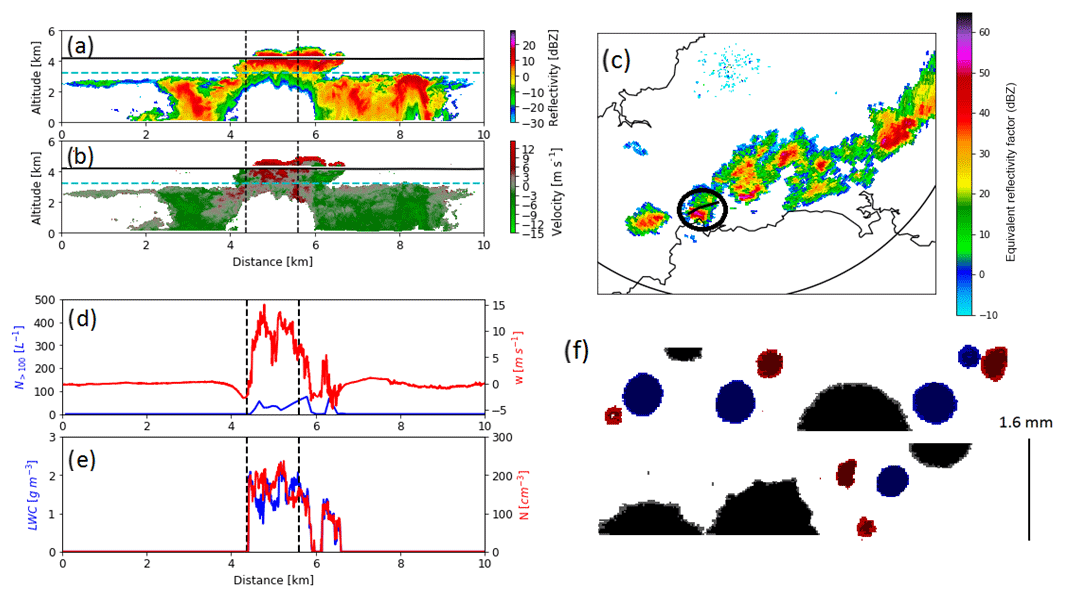
Figure 7As Fig. 6, but for the penetration at −8∘ with mixed phase precipitation during Case B.
Cross sections constructed from the NCAS radar scans (Fig. 8, left column) show that the cloud in Fig. 6 grew in the vicinity of another cloud that had echo top heights of around 5 km about 10 min before the UWKA penetration at 12:37 UTC. Meanwhile, the cloud in Fig. 7 grew in a region of radar echoes extending up to about 3–3.5 km (Fig. 8, right column) and it was not until just a few minutes before the UWKA penetrated the cloud at 12:42 UTC that any echoes higher than 4 km were detected. This type of growth was relatively common in COPE clouds where turrets, while relatively isolated at the level of the UWKA penetrations, developed in clusters such that the turrets that ascended to the UWKA flight level often passed through regions of existing cloud.
Recycling of ice into the cloud shown in Fig. 6 would increase the amount of ice available for riming and secondary ice production through the Hallett–Mossop process. On the other hand, for the case in which ice recycling was unlikely to occur (based on the WCR and NCAS images), secondary ice production could only proceed after ice was introduced through primary nucleation. In Fig. 7, we note the presence of large frozen graupel and a few smaller ice crystals, but most of the hydrometeors (regardless of size) appear to be spherical and likely remain liquid at the −8 ∘C level of the penetration within the strong updraft.
Observations of ice crystal concentrations range from hundreds per liter near cloud top at −8 to −10 ∘C in Case A (28 July) and Case D (3 August) to tens per liter in Case B (29 July). Such values are orders of magnitude greater than the 0.1 to 10 L−1 predicted from boundary layer aerosol measurements taken during COPE (Taylor et al., 2016a). Such high concentrations are consistent with observations reported in other studies in convective clouds over southwestern England (Taylor et al., 2016b; Huang et al., 2008, 2017). Ice production through secondary processes is likely controlling the amount of ice in these clouds. Variation in the spatiotemporal distribution of ice and precipitation production for these COPE cases is likely due to a variety of ice production mechanisms.
Of the four cases, glaciation proceeded most quickly in Case A. Clouds in this case were the shallowest and least vigorous of the four cases and formed in an environment of widespread, unorganized convection devoid of shear. Precipitation developed through collision–coalescence by the time cloud tops reached −3 ∘C; raindrops larger than 1 mm in diameter were found throughout the clouds at this level. Nearly all clouds sampled in this case were dominated by frozen precipitation by the time their tops reached the −8 to −10 ∘C level. The presence of millimeter-sized raindrops prior to the production of significant concentrations of ice-phase precipitation that occurred in the Hallett–Mossop zone is consistent with observations from several recent studies (Taylor et al., 2016b; Lasher-Trapp et al., 2016; Heymsfield and Willis, 2014; Huang et al., 2017) that implicate the Hallett–Mossop process as the principal cause of glaciation in some convective clouds. The other cases from COPE that show some amount of glaciation in cloud tops between −8 and −10 ∘C (Cases B, D), also produced millimeter-sized raindrops at the −3 ∘C level. However, glaciation proceeded somewhat differently on these 2 days, compared to Case A.
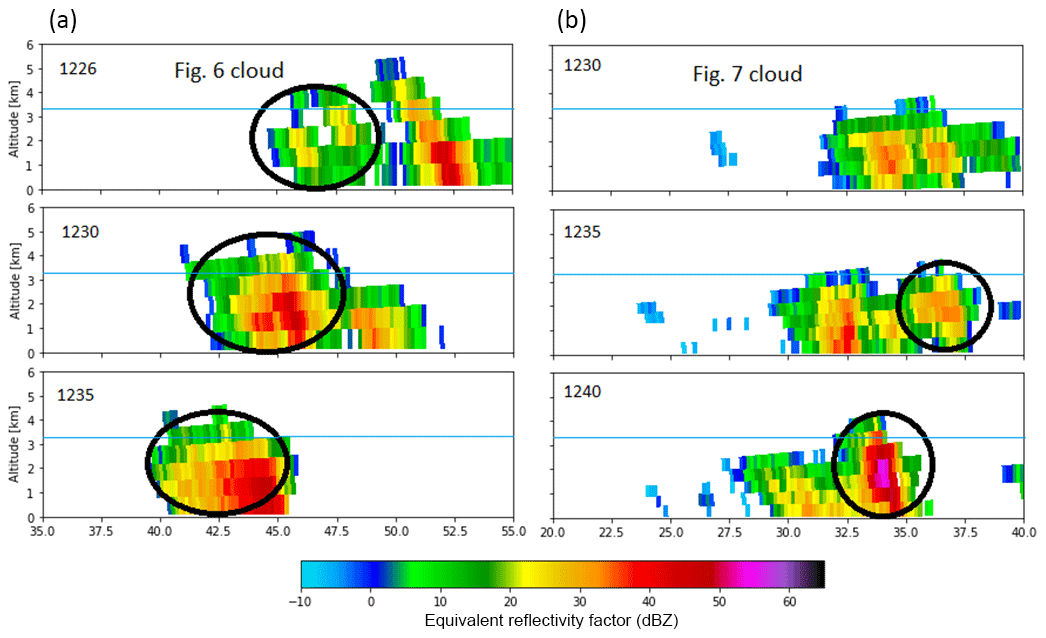
Figure 8Time series of pseudo-range height indicator (RHI) plots of NCAS radar reflectivity during Case B through the cloud in Fig. 6 (a) and in Fig. 7 (b). Circle indicates the location of the cloud penetrated by the UWKA. The blue line indicates location of 0 ∘C isotherm.
The Hallet-Mossop process requires the presence of some initial ice particles to initiate the multiplication process. The source of this initial ice is often believed to be primary nucleation of the raindrops as discussed in the previous paragraph. However, environments containing detrained ice or wide-spread cloud that extend above the environmental 0 ∘C level also provide a source for initial ice. Idealized modeling studies of Case D (3 August) by Moser and Lasher-Trapp (2017) suggest that the cloud forcing and weak vertical wind shear would allow for both possibilities. The conditions in Case A were conducive for entrainment of ice particles from outside of the sample turret (see for example Fig. 2a). On this day, ascending turrets often rose through regions in which older clouds were present. Because the turrets were ascending in a low-shear environment, these newly frozen raindrops would remain in the center of the updraft, collocated with high cloud water content. Observations from Cases B and D are also consistent with this idea. However, because the clouds on these 2 days formed along lines, some clouds sampled on these days were more isolated than others. Figures 6 and 7 provided two examples from Case B in which turrets ascended through the remnants of other clouds. In one of these examples, the older cloud remnants extended above the environmental 0 ∘C level and likely contained ice, so the precipitation sized particles were frozen by the time the top ascended to −8 ∘C. Taylor et al. (2016b) concluded that for clouds sampled along the convective line in Case D (3 August), those clouds on the downwind end of the line were more glaciated than the new growth that was forming on the upwind end of the line. All of this suggests, that at least for the clouds in this study, the presence of a source of initial ice helped jump start the Hallett–Mossop process and rapid freezing of precipitation sized particles observed in some of the clouds. Most of the clouds sampled in Case B and some in Case D did not exhibit much ice production by the −10 to −12 ∘C level. Most of the precipitation in these clouds did not freeze until cloud tops had reached between −12 and −14 ∘C, suggesting that a mechanism other than the Hallett–Mossop ice multiplication process was likely responsible for ice production. In these cases, turrets were more isolated and remnants from earlier clouds did not extend significantly above the 0 ∘C level. The observation of rapid transition to ice-phase precipitation occurring at −12 ∘C is more consistent with observations reported by Lawson et al. (2014, 2017) who interpreted their observations as the result of drop freezing and shattering. It is possible that drop freezing and shattering could also take place at lower levels in cloud, but one might expect that the large droplets freeze more easily at lower temperatures, which could explain why we do not observe a transition to the ice-phase in these cases until −12 ∘C.
Very few of the clouds sampled in Case C contained any significant concentrations of ice, even as tops approached the −14 ∘C level. A significant difference on this day was the lack of precipitation-sized liquid drops. However, the detailed in situ observations reported here are somewhat at odds with those reported by Plummer et al. (2018) who showed ZDR columns with values up to 3 dB extending up to 1 km above the 0 ∘C level in Case C. Such high values suggest raindrops were present at least in some clouds in Case C. Our analysis does not completely preclude the existence of raindrops on this day, but rather suggests that the concentration of such drops was significantly less than on the other 3 days examined in this study.
The locations of raindrops in Case C in relation to updrafts may have influenced ice production. Clouds were most isolated on this day compared to the other 3 days, thus hydrometeor recycling was not likely. Further, because of relatively strong shear that was present in Case C, any precipitation that did form would be less likely to remain within regions of updraft and cloud liquid water. The idealized simulations of Case C by Lasher-Trapp et al. (2018) suggest that precipitation that was produced in those clouds was transported downshear and fell mostly outside of the cloud. This suggests that the in situ observations discussed may under-report the amount of precipitation produced in Case C. It may also be that the strong shear present in Case C, leading to strongly tilted cloud turrets, resulted in an aircraft sampling strategy that favored “upwind”, more isolated clouds. Finally, the UWKA left the area before the convergence line in Case C produced more pronounced precipitation, which also can contribute to the differences in the occurrence of large drops observed by Plummer et al. (2018) and this study.
A rigorous attribution of the Hallet-Mossop process to the production of the observed ice requires comparison of the splinter production rates estimated from observations to those predicted by theoretical calculations of the Hallett–Mossop process. The observed and predicted splinter production rates were calculated for Cases A and D (Fig. 9), where the observational evidence suggests the Hallett–Mossop process was active, using the methodology from Harris-Hobbs and Cooper (1987). The applicability of this calculation is somewhat limited because the size distribution of graupel particles must be known and, with this data set, the size distribution was difficult to determine due to the inability to distinguish between spheres and graupel using the 2DP. Therefore, the sensitivity of the calculations to the amount of particles assumed to be graupel is also shown in Fig. 9. The observed and predicted splinter production rates are within a factor of 2 if the percentage of graupel particles is assumed to be greater than 50 %. A manual analysis of the CIP images in Figs. 6 and 7 reveal that all of the images with D>800 µm were likely graupel for the penetration in Fig. 6 and nearly 80 % of them were graupel in Fig. 7, suggesting that this assumption (that more than 50 % of the particles imaged by the 2DP are graupel) is not unreasonable. Therefore, the observed ice crystal concentrations appear consistent with what would be expected to be produced by the Hallett–Mossop process in these two cases. The comparison also shows that up to an order of magnitude difference exists between the observed and predicted splinter production rates when the percentage of particles sampled by the 2DP assumed to be graupel was less than 50 %. Therefore, while evidence is provided here that the observed ice crystal concentrations are consistent with the Hallet-Mossop process for some of the penetrations, this suggests that a more rigorous analysis could be accomplished in future field experiments using an instrument measuring precipitation particles with higher resolution that can more readily distinguish between graupel and raindrops.
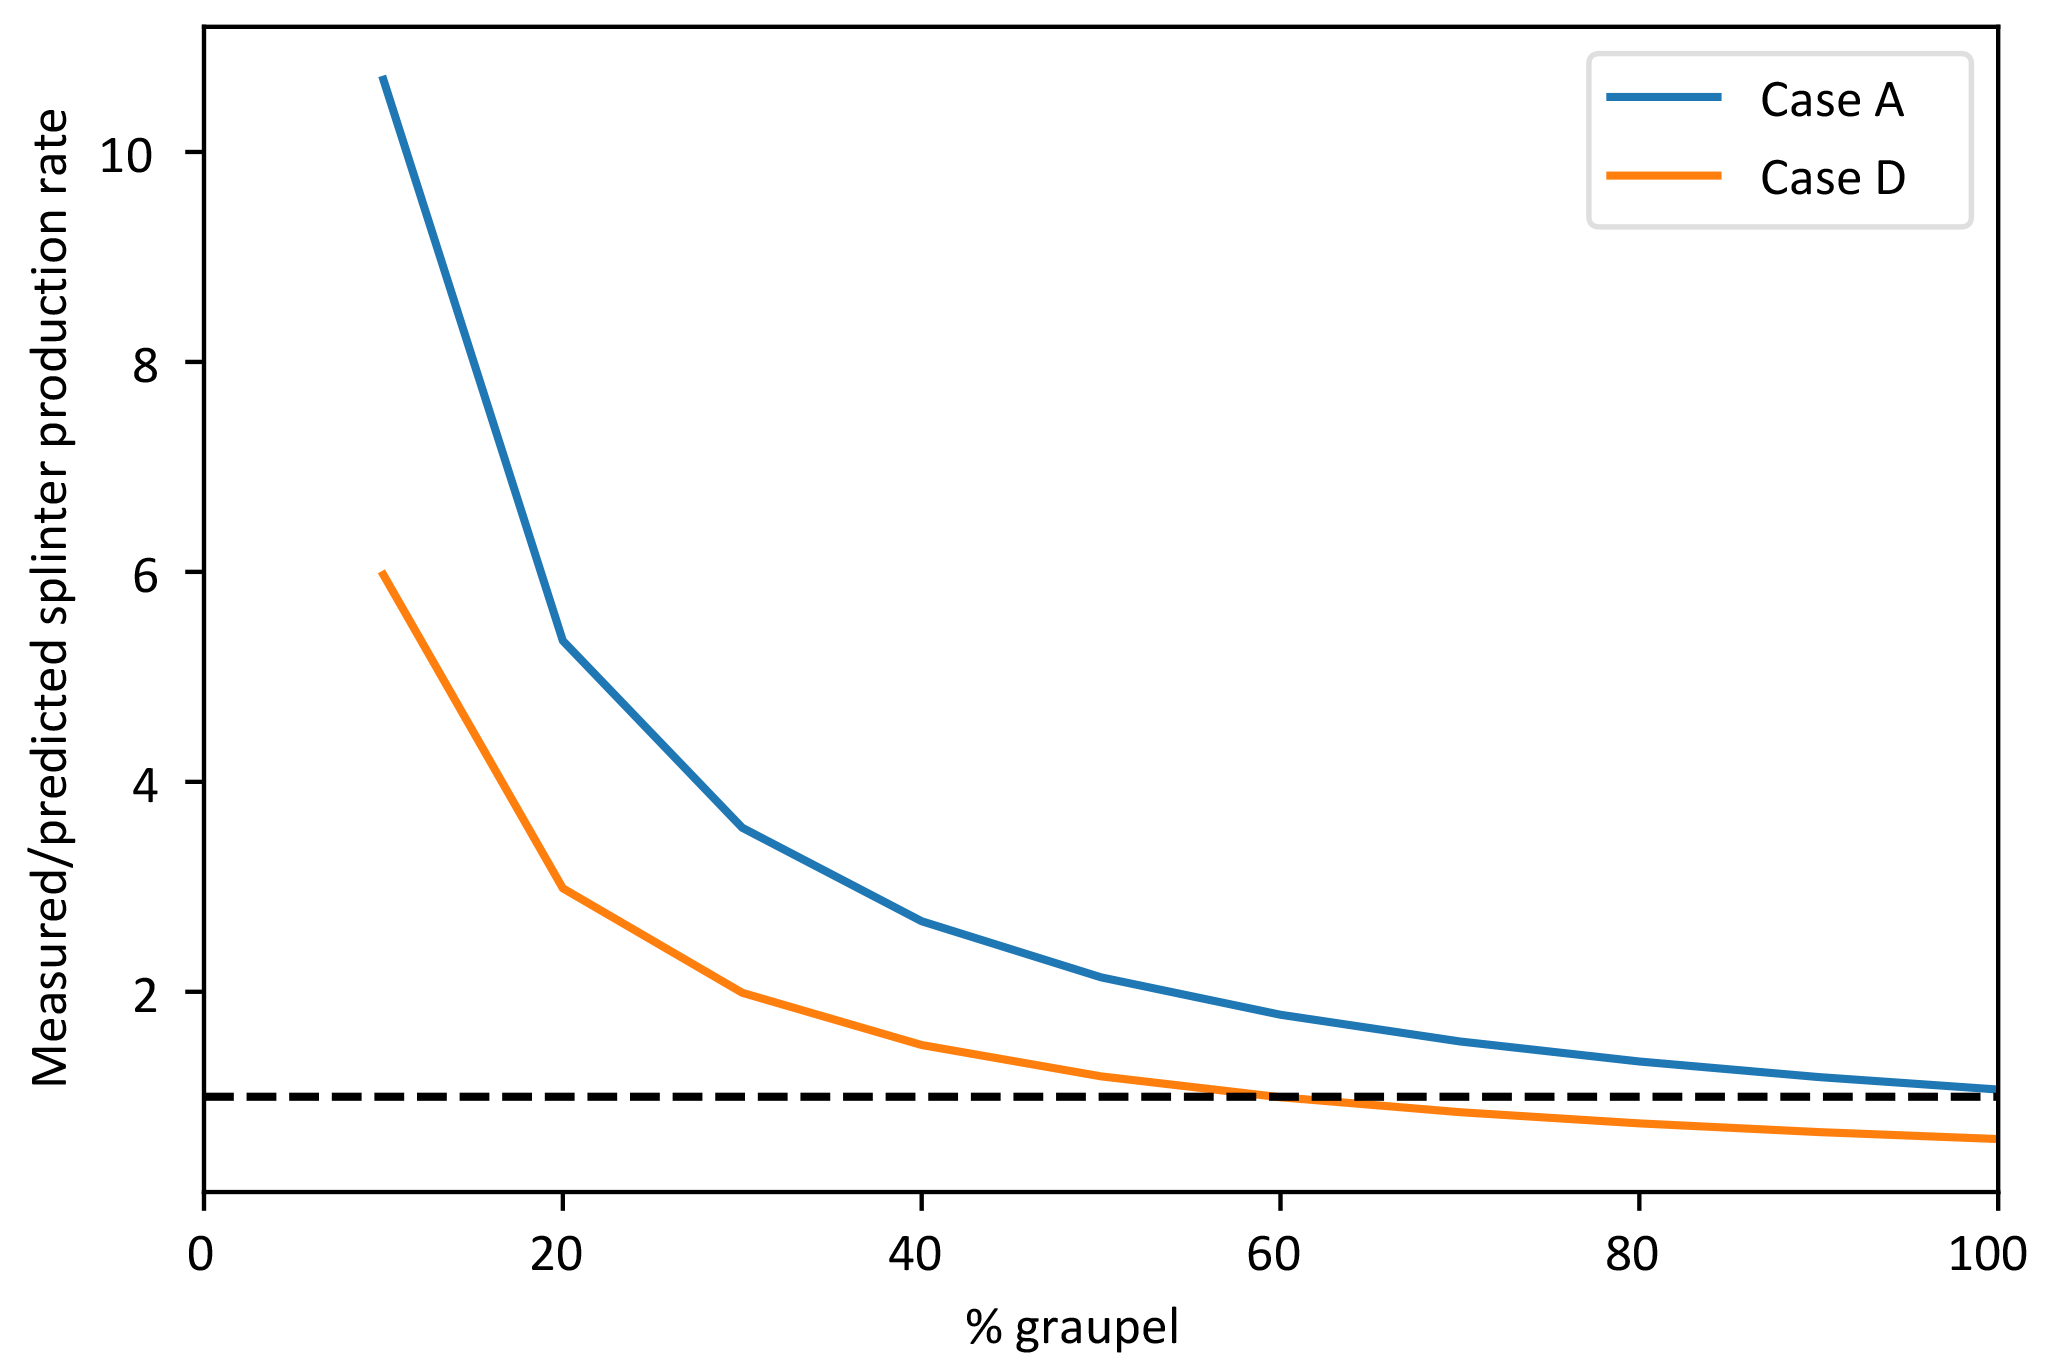
Figure 9The mean ratio of the measured to the predicted splinter production rate for Cases A and D, as a function of the percentage of particles sampled by the 2DP assumed to be graupel. Calculations were performed over all penetrations having more than 80 % of the particles identified as aspherical. The dashed line corresponds to a perfect match of measured and predicted splinter production rates.
The analyses presented focus on measurements within developing convection in southwestern England from 4 days in July and August 2013. The UWKA, equipped with in situ particle measurement probes and a profiling W-band cloud radar, penetrated turrets within a few hundred meters of their tops as they ascended through the 0 to −15 ∘C level. Measurements from individual penetrations provide snapshots in time and, taken together, provide details about the cloud microphysical properties in the developing storms. Large variability in the microphysical parameters was observed on these 4 days, indicating significant differences in processes responsible for ice production in these clouds.
The greatest amount of ice was observed on the days in which there appeared to be a vigorous warm-rain process, based on measurements made at temperatures exceeding −3 ∘C. This is consistent with past studies. suggesting that the production of rain through collision–coalesence is crucial for providing graupel embryos required for secondary ice production to occur in developing turrets.
The high (greater than 100 L−1) ice concentrations observed between the −8 and −10 ∘C level in nearly all clouds on 28 July, most clouds on 3 August, and only a few clouds on 29 July are consistent with the production of ice through the Hallett–Mossop process.
In addition to a strong warm-rain process, the Hallett–Mossop process appeared to be aided by turrets that ascended through regions of cloudy remnants extending above the 0 ∘C level. Such regions could provide, through entrainment, a necessary source of ice crystals for initiating the Hallett–Mossop process.
In cases that did contain raindrops but turrets were more isolated, the ice concentrations measured at the −8 to −10 ∘C level suggest that the Hallett–Mossop process was less effective at producing ice precipitation. In such cases, glaciation did occur, but not until turrets reached −12 to −14 ∘C. In such cases, secondary production may occur through another mechanism such as drop freezing and shattering.
Clouds on 2 August were much less efficient at producing precipitation through warm-rain, presumably due to higher droplet concentrations. This, in turn, reduced efficiency in producing ice (both through the Hallett–Mossop process and through drop freezing and shattering) due to the much lower raindrop concentrations.
The conclusions based on this work are in general agreement with others from previous studies (e.g., Blyth and Latham, 1997) and also from observation and modeling studies based on the COPE data set that showed the importance of secondary ice production (Taylor et al., 2016b; Lasher-Trapp et al., 2018), the influence of cloud spacing and potential hydrometeor recycling (Moser and Lasher-Trapp, 2017), and the role of warm-rain in precipitation production (Plummer et al., 2018; Lasher-Trapp et al., 2018). However, the greater number of cases examined in this study compared to other COPE studies highlights the great diversity exhibited by clouds not only on different days but within a single day. This, in turn, illustrates the importance of observing not only cloud structure itself, but the environment in which the clouds are growing. Further, the observations suggest that while in some clouds, one process may appear to dominate ice formation, in another cloud – its near neighbor in some cases – an entirely different process may be important. This too underscores the importance of considering multiple processes and obtaining a diverse set of observations from many clouds in order to elucidate the importance of critical processes.
The airborne observational data can be accessed at the University of Wyoming King Air Archive at https://doi.org/10.15786/M2MW2S (University of Wyoming Research Flight Center, 2016a) and https://doi.org/10.15786/M2H598 (University of Wyoming Research Flight Center, 2016b). The NXPol data are available at https://doi.org/10.5285/4bb383b7d6ca421bbedd57b8097d5664 (Bennett, 2017).
RJ conducted most of the analysis and contributed to the writing of the manuscript. JF conducted initial analyses of the COPE penetrations. DP contributed to the processing of the NXPol data and was involved in the planning of the COPE missions. AK provided inital data processing of the in situ aircraft microphysical observations. JF, SLT, DL, and AB were PIs during COPE and were therefore leaders in discussions on the sampling strategy for each case in the manuscript. All authors contributed to the writing of the manuscript.
The authors declare that they have no conflict of interest.
This work was funded by the US National Science Foundation under grants
AGS-1230292 and AGS-1230203 for the United States based investigators, with UWKA participation
funded by grant AGS-1441831. The work was also partly funded by the UK
Natural Environment Research Council under grant NE/J023507/1. We acknowledge
the Centre for Environmental Data Analysis for storing archived COPE data and
NCAS Atmospheric Measurement Facility for use of the NXPol. Finally, we would
like to thank the crew of the UWKA for their hard work and dedication.
Edited by: Athanasios
Nenes
Reviewed by: two anonymous referees
Bigg, E. K.: A new technique for counting ice-forming nuclei in aerosols, Tellus, 9, 394–400, https://doi.org/10.1111/j.2153-3490.1957.tb01895.x, 1957.
Baumgardner, D. and Korolev, A.: Airspeed Corrections for Optical Array Probe Sample Volumes, J. Atmos. Ocean. Tech., 14, 1224–1229, https://doi.org/10.1175/1520-0426(1997)014<1224:ACFOAP>2.0.CO;2, 1997.
Bennett, L.: MICROSCOPE: NCAS mobile X-band radar scan data from Davidstow Airfield, NCAS British Atmospheric Data Centre, https://doi.org/10.5072/4bb383b7d6ca421bbedd57b8097d5664, 2017.
Blyth, A. M. and Latham, J.: Development of ice and precipitation in New Mexican summertime cumulus clouds, Q. J. Roy. Meteor. Soc., 119, 91–120, https://doi.org/10.1002/qj.49711950905, 1993.
Chisnell, R. F. and Latham, J.: Ice particle multiplication in cumulus clouds, Q. J. Roy. Meteor. Soc., 102, 133–156, https://doi.org/10.1002/qj.49710243111, 1976.
Cotton, W. R., Tripoli, G. J., Rauber, R. M., and Mulvihill, E. A.: Numerical Simulation of the Effects of Varying Ice Crystal Nucleation Rates and Aggregation Processes on Orographic Snowfall, J. Clim. Appl. Meteorol., 25, 1658–1680, https://doi.org/10.1175/1520-0450(1986)025<1658:NSOTEO>2.0.CO;2, 1986.
Crosier, J., Bower, K. N., Choularton, T. W., Westbrook, C. D., Connolly, P. J., Cui, Z. Q., Crawford, I. P., Capes, G. L., Coe, H., Dorsey, J. R., Williams, P. I., Illingworth, A. J., Gallagher, M. W., and Blyth, A. M.: Observations of ice multiplication in a weakly convective cell embedded in supercooled mid-level stratus, Atmos. Chem. Phys., 11, 257–273, https://doi.org/10.5194/acp-11-257-2011, 2011.
Faber, S., French, J. R., and Jackson, R.: Laboratory and in-flight evaluation of measurement uncertainties from a commercial Cloud Droplet Probe (CDP), Atmos. Meas. Tech., 11, 3645–3659, https://doi.org/10.5194/amt-11-3645-2018, 2018.
Field, P. R., Heymsfield, A. J., and Bansemer, A.: Shattering and Particle Interarrival Times Measured by Optical Array Probes in Ice Clouds, J. Atmos. Ocean. Tech., 23, 1357–1371, https://doi.org/10.1175/JTECH1922.1, 2006.
Field, P. R., Lawson, R. P., Brown, P. R., Lloyd, G., Westbrook, C., Moisseev, D., Miltenberger, A., Nenes, A., Blyth, A., Choularton, T., Connolly, P., Buehl, J., Crosier, J., Cui, Z., Dearden, C., DeMott, P., Flossmann, A., Heymsfield, A., Huang, Y., Kalesse, H., Kanji, Z.A., Korolev, A., Kirchgaessner, A., Lasher-Trapp, S., Leisner, T., McFarquhar, G., Phillips, V., Stith, J., and Sullivan, S.: Secondary Ice Production: Current State of the Science and Recommendations for the Future, Meteor. Mon., 58, 7.1–7.20, https://doi.org/10.1175/AMSMONOGRAPHS-D-16-0014.1, 2017.
Gerber, H., Arends, B. G., and Ackerman, A. S.: New microphysics sensor for aircraft use, Atmos. Res., 31, 235–252, https://doi.org/10.1016/0169-8095(94)90001-9, 1993.
Golding, B., Clark, P., and May, B.: The Boscastle flood: Meteorological analysis of the conditions leading to flooding on 16 August 2004, Weather, 60, 230–235, https://doi.org/10.1256/wea.71.05, 2005.
Haimov, S. and Rodi, A.: Fixed-Antenna Pointing-Angle Calibration of Airborne Doppler Cloud Radar, J. Atmos. Ocean. Tech., 30, 2320–2335, https://doi.org/10.1175/JTECH-D-12-00262.1, 2013.
Harris-Hobbs, R. L. and Cooper, W. A.: Field Evidence Supporting Quantitative Predictions of Secondary Ice Production Rates, J. Atmos. Sci., 44, 1071–1082, https://doi.org/10.1175/1520-0469(1987)044<1071:FESQPO>2.0.CO;2, 1987.
Hallett, J. and Mossop, S. C.: Production of secondary ice particles during the riming process, Nature, 249, 26–28, https://doi.org/10.1038/249026a0, 1974.
Helmus, J. J. and Collis, S. M.: The Python ARM Radar Toolkit (Py-ART), a Library for Working with Weather Radar Data in the Python Programming Language, Journal of Open Research Software, 4, e25, https://doi.org/10.5334/jors.119, 2016.
Heymsfield, A. and Willis, P.: Cloud Conditions Favoring Secondary Ice Particle Production in Tropical Maritime Convection, J. Atmos. Sci., 71, 4500–4526, https://doi.org/10.1175/JAS-D-14-0093.1, 2014.
Hobbs, P. V. and Rangno, A. L.: Rapid Development of High Ice Particle Concentrations in Small Polar Maritime Cumuliform Clouds, J. Atmos. Sci., 47, 2710–2722, https://doi.org/10.1175/1520-0469(1990)047<2710:RDOHIP>2.0.CO;2, 1990.
Holroyd, E. W.: Some Techniques and Uses of 2D-C Habit Classification Software for Snow Particles, J. Atmos. Ocean. Tech., 4, 498–511, https://doi.org/10.1175/1520-0426(1987)004<0498:STAUOC>2.0.CO;2, 1987.
Huang, Y., Blyth, A. M., Brown, P. R. A., Choularton, T. W., Connolly, P., Gadian, A. M., Jones, H., Latham, J., Cui, Z., and Carslaw, K.: The development of ice in a cumulus cloud over southwest England, New J. Phys., 10, 105021, https://doi.org/10.1088/1367-2630/10/10/105021, 2008.
Huang, Y., Blyth, A. M., Brown, P. R. A., Choularton, T. W., and Cui, Z.: Factors controlling secondary ice production in cumulus clouds, Q. J. Roy. Meteor. Soc., 143, 1021–1031, https://doi.org/10.1002/qj.2987, 2017.
Jackson, R. C., McFarquhar, G. M., Stith, J., Beals, M., Shaw, R. A., Jensen, J., Fugal, J., and Korolev, A.: An Assessment of the Impact of Antishattering Tips and Artifact Removal Techniques on Cloud Ice Size Distributions Measured by the 2D Cloud Probe. J. Atmos. Ocean. Tech., 31, 2567–2590, https://doi.org/10.1175/JTECH-D-13-00239.1, 2014.
Koenig, L. R.: The Glaciating Behavior of Small Cumulonimbus Clouds, J. Atmos. Sci., 20, 29–47, https://doi.org/10.1175/1520-0469(1963)020<0029:TGBOSC>2.0.CO;2, 1963.
Korolev, A. V., Strapp, J. W., Isaac, G. A., and Nevzorov, A. N.: The Nevzorov Airborne Hot-Wire LWC–TWC Probe: Principle of Operation and Performance Characteristics, J. Atmos. Ocean. Tech., 15, 1495–1510, https://doi.org/10.1175/1520-0426(1998)015<1495:TNAHWL>2.0.CO;2, 1998.
Korolev, A. V., Emery, E. F., Strapp, J. W., Cober, S. G., Isaac, G. A., Wasey, W., and Marcotte, D.: Small Ice Particles in Tropospheric Clouds: Fact or Artifact? Airborne Icing Instrumentation Evaluation Experiment, B. Am. Meteorol. Soc., 92, 967–973, https://doi.org/10.1175/2010BAMS3141.1, 2011.
Korolev, A. V., Emery, E. F., Strapp, J. W., Cober, S. G., and Isaac, G. A.: Quantification of the Effects of Shattering on Airborne Ice Particle Measurements, J. Atmos. Ocean. Tech., 30, 2527–2553, https://doi.org/10.1175/JTECH-D-13-00115.1, 2013.
Lance, S., Brock, C. A., Rogers, D., and Gordon, J. A.: Water droplet calibration of the Cloud Droplet Probe (CDP) and in-flight performance in liquid, ice and mixed-phase clouds during ARCPAC, Atmos. Meas. Tech., 3, 1683–1706, https://doi.org/10.5194/amt-3-1683-2010, 2010.
Lasher-Trapp, S., Leon, D. C., DeMott, P. J., Villanueva-Birriel, C. M., Johnson, A. V., Moser, D. H., Tully, C. S., and Wu, W.: A Multisensor Investigation of Rime Splintering in Tropical Maritime Cumuli, J. Atmos. Sci., 73, 2547–2564, https://doi.org/10.1175/JAS-D-15-0285.1, 2016.
Lasher-Trapp, S., Kumar, S., Moser, D. H., Blyth, A. M., French, J. R., Jackson, R. C., Leon, D. C., and Plummer, D. M.: On Different Microphysical Pathways to Convective Rainfall, J. Appl. Meteor. Climatol., 57, 2399–2417, https://doi.org/10.1175/JAMC-D-18-0041.1, 2018.
Lawson, R. P., Woods, S., and Morrison, H.: The Microphysics of Ice and Precipitation Development in Tropical Cumulus Clouds, J. Atmos. Sci., 72, 2429–2445, https://doi.org/10.1175/JAS-D-14-0274.1, 2014.
Lawson, P., Gurganus, C., Woods, S., and Bruintjes, R.: Aircraft Observations of Cumulus Microphysics Ranging from the Tropics to Midlatitudes: Implications for a “New” Secondary Ice Process, J. Atmos. Sci., 74, 2899–2920, https://doi.org/10.1175/JAS-D-17-0033.1, 2017.
Leisner, T., Pander, T., Handmann, P., and Kiselev, A.: Secondary ice processes upon heterogeneous freezing of cloud droplets, 14th Conference on Cloud Physics, Boston, MA, available at: https://ams.confex.com/ams/14CLOUD14ATRAD/webprogram/Paper250221.html (last access: 15 March 2017), 2014.
Leon, D. C., French, J. R., Lasher-Trapp, S., Blyth, A. M., Abel,S. J., Ballard, S., Barrett, A., Bennett, L. J., Bower, K., Brooks, B., Brown, P., Charlton-Perez, C., Choularton, T., Clark, P., Collier, C., Crosier, J., Cui, Z., Dey, S., Dufton, D., Eagle, C., Flynn, M. J., Gallagher, M., Halliwell, C., Hanley, K., Hawkness-Smith, L., Huang, Y., Kelly, G., Kitchen, M., Korolev, A., Lean, H., Liu, Z., Marsham, J., Moser, D., Nicol, J., Norton, E. G., Plummer, D., Price, J., Ricketts, H., Roberts, N., Rosenberg, P. D., Simonin, D., Taylor, J. W., Warren, R., Williams, P. I., and Young, G.: The COnvective Precipitation Experiment (COPE): Investigating the origins of heavy precipitation in the southwestern UK, Bull. Am. Meteorol. Soc., https://doi.org/10.1175/BAMS-D-14-00157.1, 2016a.
Leon, D. C., French, J. R., Lasher-Trapp, S., Blyth, A. M., Abel,S. J., Ballard, S., Barrett, A., Bennett, L. J., Bower, K., Brooks, B., Brown, P., Charlton-Perez, C., Choularton, T., Clark, P., Collier, C., Crosier, J., Cui, Z., Dey, S., Dufton, D., Eagle, C., Flynn, M. J., Gallagher, M., Halliwell, C., Hanley, K., Hawkness-Smith, L., Huang, Y., Kelly, G., Kitchen, M., Korolev, A., Lean, H., Liu, Z., Marsham, J., Moser, D., Nicol, J., Norton, E. G., Plummer, D., Price, J., Ricketts, H., Roberts, N., Rosenberg, P. D., Simonin, D., Taylor, J. W., Warren, R., Williams, P. I., and Young, G.: Online Supplement to The COnvective Precipitation Experiment (COPE): Investigating the origins of heavy precipitation in the southwestern UK, B. Am. Meteorol. Soc., 2016, ES115–ES123, https://doi.org/10.1175/BAMS-D-14-00157.2, 2016b.
Lhermitte, R.: Attenuation and Scattering of Millimeter Wavelength Radiation by Clouds and Precipitation, J. Atmos. Ocean. Tech., 7, 464–479, https://doi.org/10.1175/1520-0426(1990)007<0464:AASOMW>2.0.CO;2, 1990.
Mason, B. J. and Maybank, J.: The fragmentation and electrification of freezing water drops, Q. J. Roy. Meteor. Soc., 86, 176–185, https://doi.org/10.1002/qj.49708636806, 1960.
Miltenberger, A. K., Field, P. R., Hill, A. A., Rosenberg, P., Shipway, B. J., Wilkinson, J. M., Scovell, R., and Blyth, A. M.: Aerosol–cloud interactions in mixed-phase convective clouds – Part 1: Aerosol perturbations, Atmos. Chem. Phys., 18, 3119–3145, https://doi.org/10.5194/acp-18-3119-2018, 2018.
Mossop, S. C.: Some Factors Governing Ice Particle Multiplication in Cumulus Clouds, J. Atmos. Sci., 35, 2033–2037, https://doi.org/10.1175/1520-0469(1978)035<2033:SFGIPM>2.0.CO;2, 1978.
Moser, D. H. and Lasher-Trapp, S.: The Influence of Successive Thermals on Entrainment and Dilution in a Simulated Cumulus Congestus, J. Atmos. Sci., 74, 375–392, https://doi.org/10.1175/JAS-D-16-0144.1, 2017.
Plummer, D. M., McFarquhar, G. M., Rauber, R. M., Jewett, B. F., and Leon, D. C: Microphysical Properties of Convectively Generated Fall Streaks within the Stratiform Comma Head Region of Continental Winter Cyclones, J. Atmos. Sci., 72, 2465–2483, https://doi.org/10.1175/JAS-D-14-0354.1, 2015.
Plummer, D. M., French, J. R., Leon, D. C., Blyth, A. M., Lasher-Trapp, S., Bennett, L. J., Dufton, D. R. L., Jackson, R. C., and Neely, R. R.: Radar-derived structural and precipitation characteristics of ZDR columns within warm-season convection over the United Kingdom, J. Appl. Meteor. Climatol., in press, https://doi.org/10.1175/JAMC-D-17-0134.1, 2018.
Pruppacher, H. R. and Schlamp, R. J.: A wind tunnel investigation on ice multiplication by freezing of water drops at terminal velocity in air, J. Geophys. Res., 80, 380–386, 1975.
Pujol, O., J. Georgis, L. Féral, and H. Sauvageot: Degradation of Radar Reflectivity by Cloud Attenuation at Microwave Frequency. J. Atmos. Ocean. Tech., 24, 640–657, https://doi.org/10.1175/JTECH1992.1, 2007.
Rosenow, A. A., Plummer, D. M., Rauber, R. M., McFarquhar, G. M., Jewett, B. F., and Leon, D.: Vertical Velocity and Physical Structure of Generating Cells and Convection in the Comma Head Region of Continental Winter Cyclones, J. Atmos. Sci., 71, 1538–1558, https://doi.org/10.1175/JAS-D-13-0249.1, 2014.
Sulskis, J. and French, J. R.: A Comparison and survey of the measured cloud liquid water content and an analysis of the bimodal droplet spectra observed during COPE-MED, MSc Thesis, University of Wyoming, 2016.
Sullivan, S. C., Hoose, C., Kiselev, A., Leisner, T., and Nenes, A.: Initiation of secondary ice production in clouds, Atmos. Chem. Phys., 18, 1593–1610, https://doi.org/10.5194/acp-18-1593-2018, 2018.
Taylor, J. W., Choularton, T. W., Blyth, A. M., Flynn, M. J., Williams, P. I., Young, G., Bower, K. N., Crosier, J., Gallagher, M. W., Dorsey, J. R., Liu, Z., and Rosenberg, P. D.: Aerosol measurements during COPE: composition, size, and sources of CCN and INPs at the interface between marine and terrestrial influences, Atmos. Chem. Phys., 16, 11687–11709, https://doi.org/10.5194/acp-16-11687-2016, 2016a.
Taylor, J. W., Choularton, T. W., Blyth, A. M., Liu, Z., Bower, K. N., Crosier, J., Gallagher, M. W., Williams, P. I., Dorsey, J. R., Flynn, M. J., Bennett, L. J., Huang, Y., French, J., Korolev, A., and Brown, P. R. A.: Observations of cloud microphysics and ice formation during COPE, Atmos. Chem. Phys., 16, 799–826, https://doi.org/10.5194/acp-16-799-2016, 2016b.
University of Wyoming Research Flight Center: Flight Level Data from the University of Wyoming King Air during the Convective Precipitation Experiment- Microphysics and Entrainment Dependencies (COPE-MED), Version 1.0, https://doi.org/10.15786/M2MW2S, 2016a.
University of Wyoming Research Flight Center: Wyoming Cloud Radar data from the University of Wyoming King Air during the Convective Precipitation Experiment- Microphysics and Entrainment Dependencies (COPE-MED), Version 1.0, https://doi.org/10.15786/M2H598, 2016b.
Wang, Z., French, J., Vali, G., Wechsler, P., Haimov, S., Rodi, A., Deng, M., Leon, D., Snider, J., Peng, L., and Pazmany, A. L.: Single Aircraft Integration of Remote Sensing and In Situ Sampling for the Study of Cloud Microphysics and Dynamics, B. Am. Meteorol. Soc., 93, 653–668, https://doi.org/10.1175/BAMS-D-11-00044.1, 2012.
Wildeman, S., Sterl, S., Sun, C., and Lohse, D.: Fast dynamics of water droplets freezing from the outside in, Phys. Rev. Lett., 118, 084101, https://doi.org/10.1103/PhysRevLett.118.084101, 2017.
Yang, J., Wang, Z., Heymsfield, A. J., and French, J. R.: Characteristics of vertical air motion in isolated convective clouds, Atmos. Chem. Phys., 16, 10159–10173, https://doi.org/10.5194/acp-16-10159-2016, 2016.
Not all penetrations contain updrafts meeting our criteria, hence “updrafts” make up only a subset of “penetrations”.
The clouds were more isolated at the time of the UWKA flight. Later in the day during Case C, after the UWKA had landed, the line filled in and this may have impacted precipitation processes as the cells became more closely packed along the line.