the Creative Commons Attribution 4.0 License.
the Creative Commons Attribution 4.0 License.
 | 19 Oct 2018
Adjoint inversion of Chinese non-methane volatile organic compound emissions using space-based observations of formaldehyde and glyoxal
Hansen Cao
Tzung-May Fu
Lin Zhang
Daven K. Henze
Christopher Chan Miller
Christophe Lerot
Gonzalo González Abad
Isabelle De Smedt
Qiang Zhang
Michel van Roozendael
François Hendrick
Kelly Chance
Jie Li
Junyu Zheng
Yuanhong Zhao
We used the GEOS-Chem model and its adjoint to quantify Chinese non-methane volatile organic compound (NMVOC) emissions for the year 2007, using the tropospheric column concentrations of formaldehyde and glyoxal observed by the Global Ozone Monitoring Experiment 2A (GOME-2A) instrument and the Ozone Monitoring Instrument (OMI) as quantitative constraints. We conducted a series of inversion experiments using different combinations of satellite observations to explore their impacts on the top-down emission estimates. Our top-down estimates for Chinese annual total NMVOC emissions were 30.7 to 49.5 (average 41.9) Tg yr−1, including 16.4 to 23.6 (average 20.2) Tg yr−1 from anthropogenic sources, 12.2 to 22.8 (average 19.2) Tg yr−1 from biogenic sources, and 2.08 to 3.13 (average 2.48) Tg yr−1 from biomass burning. In comparison, the a priori estimate for Chinese annual total NMVOC emissions was 38.3 Tg yr−1, including 18.8 Tg yr−1 from anthropogenic sources, 17.3 Tg yr−1 from biogenic sources, and 2.27 Tg yr−1 from biomass burning. The simultaneous use of glyoxal and formaldehyde observations helped distinguish the NMVOC species from different sources and was essential in constraining anthropogenic emissions. Our four inversion experiments consistently showed that the Chinese anthropogenic emissions of NMVOC precursors of glyoxal were larger than the a priori estimates. Our top-down estimates for Chinese annual emission of anthropogenic aromatics (benzene, toluene, and xylene) ranged from 5.5 to 7.9 Tg yr−1, 2 % to 46 % larger than the estimate of the a priori emission inventory (5.4 Tg yr−1). Three out of our four inversion experiments indicated that the seasonal variation in Chinese NMVOC emissions was significantly stronger than indicated in the a priori inventory. Model simulations driven by the average of our top-down NMVOC emission estimates (which had a stronger seasonal variation than the a priori) showed that surface afternoon ozone concentrations over eastern China increased by 1–8 ppb in June and decreased by 1–10 ppb in December relative to the simulations using the a priori emissions and were in better agreement with measurements. We concluded that the satellite observations of formaldehyde and glyoxal together provided quantitative constraints on the emissions and source types of NMVOCs over China and improved our understanding on regional chemistry.
- Article
(1837 KB) -
Supplement
(1015 KB) - BibTeX
- EndNote


Non-methane volatile organic compounds (NMVOCs) are emitted into the atmosphere from surface anthropogenic, biogenic, and biomass burning sources. NMVOCs are precursors to tropospheric ozone and secondary organic aerosols, both of which are climate forcers and major air pollutants. NMVOCs also affect the oxidation capacity of the atmosphere, which in turn changes the lifetimes of greenhouse gases and other pollutants. It is thus crucial to quantify NMVOC emissions in order to understand their impacts on atmospheric chemistry and climate on both global and regional scales. Here we used satellite observations and a chemical transport model to constrain NMVOC emissions from China and assessed their impacts on seasonal surface ozone.
Emissions of trace species are traditionally estimated in a “bottom-up” manner using activity data and emission factors, but these bottom-up estimates are sometimes susceptible to large uncertainties. This is especially true for NMVOC emissions in developing countries such as China because (1) a wide range of species, source activities, and technologies are involved (Q. Zhang et al., 2009; Kurokawa et al., 2013; Li et al., 2014; Qiu et al., 2014); (2) locally representative emission factors are often not measured (Wei et al., 2008; Zhao et al., 2011); and (3) reliable activity data are often incomplete, particularly for small-scale industries, residential activities, and agricultural waste burning (Q. Zhang et al., 2009). Bottom-up estimates for total annual Chinese NMVOC emissions for the years 2005 to 2012 ranged from 31 to 57 Tg yr−1 (Guenther et al., 2006; Bo et al., 2008; Q. Zhang et al., 2009; van der Werf et al., 2010, 2017; Cao et al., 2011; Huang et al., 2012; Kurokawa et al., 2013; Li et al., 2014; Stavrakou et al., 2014; Sindelarova et al., 2014; Wu et al., 2016; Huang et al., 2017; Granier et al., 2017). Such large uncertainties in the emission estimates of Chinese NMVOCs have led to great difficulty in evaluating their impacts on regional chemistry (Han et al., 2013; Wang et al., 2014).
A complementary, “top-down” approach for quantifying emissions uses observations of the targeted species or its chemical derivatives, combined with a chemical transport model acting as a transfer function, to invert for the fluxes of the targeted species. In particular, tropospheric column concentrations of formaldehyde, retrieved from satellite UV-backscatter measurements, have been used to constrain NMVOC emissions. Formaldehyde is produced at high yields during the oxidation of many NMVOC species (Millet et al., 2006) and also emitted directly from anthropogenic and biomass burning activities (Akagi et al., 2011; Li et al., 2017). Early inversions of satellite-observed formaldehyde columns mostly focused on areas where the local NMVOC fluxes were dominated by biogenic sources during the growing season and in the absence of substantial biomass burning, such as the southeast US (Palmer et al., 2003, 2006; Millet et al., 2006, 2008), Europe (Dufour et al., 2009; Curci et al., 2010), the Amazon (Barkley et al., 2008, 2009, 2013), and Africa (Marais et al., 2012, 2014a). These studies showed that the observed local enhancements of formaldehyde column concentrations can be used to quantitatively constrain local biogenic NMVOC fluxes.
In other areas, the NMVOC emissions from various sources may be comparable in magnitudes. Several studies constrained the NMVOC emissions from multiple sources over such areas by analyzing the spatiotemporal variability in the observed formaldehyde columns (Shim et al., 2005; Fu et al., 2007; Stavrakou et al., 2009b; Curci et al., 2010; Gonzi et al., 2011; Marais et al., 2014b; Zhu et al., 2014). Fu et al. (2007) analyzed the spatial and seasonal variation in the formaldehyde column observations from the Global Ozone Monitoring Experiment (GOME) over East and South Asia. They showed that, during the early 2000s, Chinese reactive NMVOC fluxes from biogenic, anthropogenic, and biomass burning sources were 3, 1.2, and 8.8 times their respective bottom-up estimates at that time. In particular, Fu et al. (2007) found a large, annually recurring NMVOC source over the North China Plain (NCP) in June, which they attributed to crop residue burning after the local harvest of winter wheat. However, these top-down studies using only formaldehyde as constraints relied exclusively on bottom-up activity statistics to differentiate between NMVOC source types.
More recently, satellite measurements of tropospheric glyoxal columns emerged as an additional constraint on NMVOC emissions (Stavrakou et al., 2009a). Like formaldehyde, glyoxal is produced during the oxidation of many NMVOCs (including most importantly isoprene), as well as emitted directly from biomass burning (Fu et al., 2008; Myriokefalitakis et al., 2008). In particular, glyoxal is produced at high yields at the initial ring-cleaving stage during the oxidation of aromatics (Volkamer, 2001; Nishino et al., 2010), which are mainly anthropogenic. In contrast, the production of formaldehyde from the oxidation of aromatics is further downstream and thus spatially diffuse (Volkamer, 2001). As such, simultaneous analyses of formaldehyde and glyoxal observations can help differentiate between biogenic and anthropogenic NMVOC emissions. Stavrakou et al. (2009a) pioneered a two-compound inversion using tropospheric glyoxal and formaldehyde column observations from the Scanning Imaging Absorption spectrometer for Atmospheric CHartographY (SCIAMACHY) satellite instrument to constrain the global sources of glyoxal. They estimated that the anthropogenic NMVOC fluxes over East Asia for the year 2005 were a factor of 2 to 3 larger than the bottom-up estimates of the Emission Database for Global Atmospheric Research (EDGAR, v3.3) inventory (Olivier et al., 2001, 2002) and the REanalysis TROpospheric (RETRO) emission inventory (Schultz et al., 2007). In addition, they inferred a large missing source of glyoxal over the global continents, which they attributed to production from an unknown biogenic precursor.
Over eastern China, Liu et al. (2012) showed that the glyoxal column concentrations observed by SCIAMACHY in August 2007 were more than twice the simulated glyoxal columns using the bottom-up emission inventory developed by Q. Zhang et al. (2009). Over the Pearl River Delta (PRD) area in southern China, the discrepancy was at least a factor of 3. They suggested that the missing glyoxal source over eastern China was anthropogenic, on the basis that the anomalous glyoxal columns observed by SCIAMACHY (relative to the glyoxal columns simulated by their model) were spatially correlated with anthropogenic NOx emissions. They estimated the Chinese anthropogenic aromatics emissions to be 13.4 Tg yr−1, which was 6 times the 2.4 Tg yr−1 anthropogenic aromatic flux estimated by Q. Zhang et al. (2009). In contrast, Chan Miller et al. (2016) simulated the formaldehyde and glyoxal column concentrations over the PRD in southern China for the years 2006 and 2007 using the same inventory developed by Q. Zhang et al. (2009). They found that their simulated formaldehyde columns were consistent with the Ozone Monitoring Instrument (OMI) formaldehyde observations, while their simulated glyoxal columns were lower than OMI observations by only 40 %. They attributed the high anthropogenic aromatics emission estimate by Liu et al. (2012) in part to a regional high-bias in the SCIAMACHY data, and in part to the lower glyoxal yields from aromatics oxidation used in Liu et al. (2012).
One limitation in the use of satellite observations of formaldehyde and glyoxal for constraining NMVOC sources is their inherent uncertainty. Several studies have compared GOME-2A and OMI formaldehyde column observations against aircraft or ground-based measurements at a few locations around the world (De Smedt et al., 2015; Lee et al., 2015; Wang et al., 2017; Zhu et al., 2016). Zhu et al. (2016) compared the GOME-2A-observed formaldehyde column concentrations over the southeast US in summer 2013 against aircraft measurements and found the satellite measurements to be too low by a factor of approximately 1.7. Chan Miller et al. (2017) found that glyoxal column concentrations observed by OMI were lower than the aircraft measurements over the southeast US in summer 2013 by a factor of 1.5. Wang et al. (2017) compared the bimonthly mean GOME-2A and OMI formaldehyde column concentrations retrieved by De Smedt et al. (2012, 2015) against ground-based multi-axis differential optical absorption spectroscopy (MAX-DOAS) measurements at a rural site in eastern China. They found that both satellite retrievals were systematically lower than the ground-based measurements by approximately 20 %. These studies highlighted the potential impacts on top-down NMVOC emission estimates due to uncertainty associated with satellite retrievals.
In this study, we used satellite retrievals of both formaldehyde and glyoxal, along with a chemical transport model and its adjoint, to constrain NMVOC emissions from China for the year 2007. We conducted sensitivity experiments to evaluate the impacts on the top-down estimates due to different satellite observations, with the goal of bracketing a probable range of top-down estimates. Finally, we examined the impacts of our top-down NMVOC emission estimates on surface air quality over China.
2.1 The GEOS-Chem model and its adjoint
We updated the GEOS-Chem global 3-D chemical transport model (version 8.2.1) to simulate the emission, transport, chemistry, and deposition of NMVOCs, as well as the resulting formaldehyde and glyoxal column concentrations for the year 2007. The use of an older version of the GEOS-Chem forward model was necessary because, at the time of our study, the GEOS-Chem adjoint (version 34) was based on this older version. However, we updated the NMVOC chemical schemes (described below) and corrected several model errors in both our forward model and its adjoint by following the progress of the forward model up to version 10.1. GEOS-Chem was driven by the assimilated meteorological data from the NASA Goddard Earth Observing System (GEOS-5) (Bey et al., 2001). To drive our simulations, the horizontal resolution of GEOS-5 data was downgraded from its native 2/3∘ longitude × 1/2∘ latitude to 5∘ longitude × 4∘ latitude. The number of vertical levels was reduced from 72 to 47 by merging layers in the stratosphere. The lower 2 km of the atmosphere was resolved by 14 levels. The temporal resolution of GEOS-5 data into GEOS-Chem is 3 h for atmospheric variables and 1 h for surface variables.
We updated the dicarbonyl chemical mechanism in GEOS-Chem developed by Fu et al. (2008), which in turn was originally adapted from the Master Chemical Mechanism (MCM) version 3.1 (Jenkin et al., 1997; Saunders et al., 2003). Table S1 in the Supplement lists the yields of formaldehyde and glyoxal from the OH oxidation of NMVOC precursors in our updated chemical mechanism. The lumped NMVOC precursors of formaldehyde in our mechanism included ethane, propane, ≥C4 alkanes, ethene, ≥C3 alkenes, benzene, toluene, xylenes, isoprene, monoterpenes, acetone, hydroxyacetone, methylgloxal, glycolaldehyde, acetaldehyde, 2-methyl-3-bute-nol, methyl ethyl ketone, methanol, and ethanol (lumped into ≥C4 alkanes). The lumped NMVOC precursors of glyoxal in our mechanism included ethene, ethyne, benzene, toluene, xylenes, isoprene, monoterpenes, glycolaldehyde, and 2-methyl-3-bute-2-nol (MBO). Hereinafter we focused our discussion on these NMVOC precursors only, as their emissions may be constrained by formaldehyde and glyoxal observations.
The OH oxidation of isoprene is a major source of both formaldehyde and glyoxal over China (Fu et al., 2007, 2008; Myriokefalitakis et al., 2008). We replaced the isoprene photochemical scheme with that used in GEOS-Chem v10.1, which included updates from Paulot et al. (2009a, b) and Mao et al. (2013). In this updated scheme, oxidation of isoprene by OH under high-NOx conditions produces formaldehyde and glyoxal at yields of 0.436 molecules per carbon and 0.0255 molecules per carbon, respectively (Table S1), mainly via the RO2 + NO pathways. Under low-NOx conditions, oxidation of isoprene by OH produces formaldehyde and glyoxal at yields of 0.38 molecules per carbon and 0.073 molecules per carbon, respectively (Table S1), via both RO2 + HO2 and RO2 isomerization reactions. Li et al. (2016) implemented this same isoprene photochemical scheme in a box model and compared the productions of formaldehyde and glyoxal from isoprene oxidation with those in the MCM version 3.3.1 (Jenkin et al., 2015). They showed that the production pathways and yields of formaldehyde and glyoxal were similar in the two schemes under the high-NOx conditions typical of eastern China.
We updated the molar yields of glyoxal from the OH oxidations of benzene (33.3 %), toluene (26.2 %), and xylenes (21.0 %) following the latest literature (Arey et al., 2009; Nishino et al., 2010). These new molar yields were higher than those used in Fu et al. (2008) (which were based on averaged yields in the literature: 25.2 % for benzene, 16.2 % for toluene, and 15.6 % for xylenes) but still lower than those used by Chan Miller et al. (2016) (75 % for benzene, 70 % for toluene, and 36 % for xylenes), which were taken from the aromatic chemical scheme in MCM version 3.2 (Jenkin et al., 2003; Bloss et al., 2005). In MCM version 3.2, more than half of the glyoxal from aromatics oxidation was produced during second- and later-generation photochemistry, but such productions are with limited experimental support and uncertain (Bloss et al., 2005).
Formaldehyde and glyoxal in the GEOS-Chem model were both removed by photolysis, as well as dry and wet deposition (Fu et al., 2008). We updated the Henry's law constant for glyoxal from (Fu et al., 2008) to (Ip et al., 2009) and added the dry deposition of formaldehyde, glyoxal, methylglyoxal, and glycolaldehyde on leaves (Mao et al., 2013). In addition, we assumed that glyoxal was reactively taken up by wet aerosols and cloud droplets with an uptake coefficient (Liggio et al., 2005; Fu et al., 2008). All other physical and chemical processes in our forward model were as described in Fu et al. (2008).
For the forward model described above, we developed the adjoint by modifying the standard GEOS-Chem adjoint (version 34) (Henze et al., 2007). We used the Kinetic PreProcessor (KPP) (Daescu et al., 2003; Sandu et al., 2003) to construct the adjoint of the updated photochemical mechanism. Adjoint algorithms were updated to include the emission and deposition processes of formaldehyde and glyoxal precursors. The aqueous uptake rate of glyoxal by wet aerosols was a function of the ambient glyoxal concentration and the total wet aerosol surface area (Fu et al., 2008). We linearized this uptake process in the backward integrations by using the archived wet aerosol surface areas from the forward simulations.
We verified the adjoint model mathematically in two ways. Firstly, we used the adjoint model to calculate the sensitivities of global glyoxal and formaldehyde burdens to biogenic isoprene and anthropogenic xylene emissions, respectively, and found that the results reproduced the calculated sensitivities from the forward model (Fig. S1 in the Supplement). Secondly, we used a set of bottom-up NMVOC emission inventories (Sect. 2.2) to drive the forward model and took the resulting global tropospheric formaldehyde and glyoxal column concentrations as pseudo observations. We then used the pseudo observations of formaldehyde and glyoxal to successfully optimize back to the bottom-up NMVOC emission estimates over high-emission areas from an initial guess that was 5 times larger (Fig. S2). These experiments demonstrated the usefulness of the adjoint model for the inversion of NMVOC emissions.
2.2 A priori emission estimates of Chinese NMVOCs
As a starting point for our inversion, we compiled the a priori Chinese NMVOC emission estimates from recent bottom-up emission inventories. Table 1 summarizes the annual total of these a priori emission estimates and their associated uncertainties.
Table 1Inversion experiments to constrain Chinese NMVOC emissions.
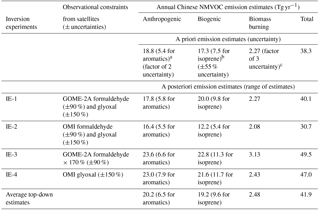
a From Li et al. (2017). b From Guenther et al. (2006). c Compiled from the emissions estimated by van der Werf et al. (2010) plus a scaling of the emissions estimated by Huang et al. (2012). See text (Sect. 2.2) for details.
The a priori biogenic NMVOC emissions from China and from the rest of the world were calculated with the MEGAN v2.0 algorithm (Guenther et al., 2006) and dependent on temperature, shortwave radiation, and monthly mean leaf area index. Previous top-down studies suggested that MEGAN overestimates global biogenic methanol by a factor of 2 to 3 (Stavrakou et al., 2011; Wells et al., 2012). We scaled our global biogenic methanol emissions to the value (100 Tg yr−1) reported by Stavrakou et al. (2011) to be the a priori in this study. The contributions of Chinese biogenic ethanol to formaldehyde are expected to be low due to its small emissions (Guenther et al., 2012); thus the Chinese biogenic ethanol emissions were neglected in this study. The resulting annual total biogenic NMVOC emissions over China for the year 2007 were 17.3 Tg yr−1, including 7.5 Tg yr−1 of isoprene, 4.6 Tg yr−1 of methanol, and 5.2 Tg yr−1 of other species (including monoterpenes, ethene, acetone, ≥C3 alkenes, and MBO). Previous estimates of Chinese biogenic isoprene emissions ranged from 5.8 to 9.9 Tg yr−1 (Guenther et al., 2006; Sindelarova et al., 2014; Stavrakou et al., 2014, 2015, 2017). Based on this range, we estimated the uncertainty of the a priori biogenic emissions over China to be ±55 %.
The a priori emissions for Chinese anthropogenic NMVOCs were from the Multi-resolution Emission Inventory for China inventory (MEIC, http://meicmodel.org, last access: December, 2014) (Li et al., 2014, 2017), which was developed at resolution for the year 2010. The MEIC inventory, including emissions from industry, transportation, power generation, and residential activities, was compiled using monthly Chinese provincial activity data and a combination of Chinese and western emission factors. The estimated Chinese annual anthropogenic emission of NMVOCs was 18.8 Tg yr−1, including 63 % from industries, 26 % from residential activities, 10 % from transportation, and 1 % from power generation. The estimated annual Chinese anthropogenic emission of aromatics was 5.4 Tg yr−1, including 73 % from industries, 15 % from residential activities, 9 % from transportation, and 3 % from power generation. Previous estimates of Chinese anthropogenic NMVOC emissions for the years 2005 to 2012 ranged from 12.7 to 35.5 Tg yr−1, with aromatics emissions ranging from 2.4 to 13.4 Tg yr−1 (Bo et al., 2008; Q. Zhang et al., 2009; Cao et al., 2011; Liu et al., 2012; Kurokawa et al., 2013; Li et al., 2014, 2017; Stavrakou et al., 2015; Wu et al., 2016; Huang et al., 2017; Granier et al., 2017). We therefore estimated the uncertainty for the a priori Chinese anthropogenic NMVOC emission estimates to be a factor of 2. As such, we did not scale the MEIC Chinese NMVOC emissions to the year 2007 because the uncertainty in the emission estimates was much larger than the differences in emissions between the years 2007 and 2010 (Chinese anthropogenic NMVOC emissions increased 14 % from 2006 to 2010 according to Li et al., 2017). The spatial distribution of Chinese anthropogenic NOx emissions was from the MEIC inventory for the year 2010 (Li et al., 2017) but scaled to the year 2007 levels using top-down constraints from the GOME-2A NO2 observations (Mijling et al., 2013). Anthropogenic NMVOC emissions for the rest of Asia were from Li et al. (2017) for the year 2010. Anthropogenic emissions for Europe, the US, and the rest of the world were from the European Monitoring and Evaluation Programme inventory (Vestreng, 2003), the U.S. EPA 2005 National Emission Inventory (https://www.epa.gov/air-emissions-inventories/national-emissions-inventory-nei, last access: December, 2012), and the EDGAR inventory (version 2.0) (Olivier et al., 1999), respectively, and scaled to the year 2007 using CO2 emissions (van Donkelaar et al., 2008).
Post-harvest, in-field burning of crop residue has been recognized as a large seasonal source of NMVOCs in China (Fu et al., 2007; Huang et al., 2012; Liu et al., 2015; Stavrakou et al., 2016). These emissions from crop residue fires have been severely underestimated in inventories based on burned area observations from satellites, such as the Global Fire Emissions Database version 3 (GFED3; van der Werf et al., 2010). The recent Global Fire Emissions Database version 4 (GFED4s; van der Werf et al., 2017) included small fires by scaling burned area with satellite fire pixel observations, but the resulting Chinese NMVOC emission estimate from biomass burning (0.91 Tg yr−1) was still much lower than the bottom-up inventory by Huang et al. (2012). Huang et al. (2012) estimated the Chinese CO emission from crop residue burning to be 4.0 Tg yr−1, based on MODIS daily thermal anomalies, Chinese provincial burned biomass data, and emission factors from Akagi et al. (2011). We scaled this CO flux using speciated NMVOC emission factors from crop residue burning from the literature (Hays et al., 2002; Akagi et al., 2011) and then multiplied the resulting NMVOC flux estimate by 2. The reason for doubling the scaled NMVOC flux was that the emission factors for many NMVOC species were not measured, such that the sum of the speciated NMVOC emission factors was only half of the total NMVOC emission factor (Akagi et al., 2011). This difference may partially explain why the formaldehyde inversion study by Stavrakou et al. (2016) found that Huang et al. (2012) underestimated the NMVOC fluxes from crop fires over the NCP in June by at least a factor of 2.
Our resulting a priori estimate for annual Chinese NMVOC emissions from biomass burning was 2.27 Tg yr−1, including 1.80 Tg yr−1 from crop residue burning (obtained by scaling Huang et al., 2012, as described above) and 0.47 Tg yr−1 from other types of biomass burning activities from GFED3 (van der Werf et al., 2010). Previous estimates of Chinese NMVOC emissions from biomass burning for the years 2000 to 2012 ranged widely from 0.47 to 5.1 Tg yr−1 (Fu et al., 2007; van der Werf et al., 2010, 2017; Wiedinmyer et al., 2011; Huang et al., 2012; Liu et al., 2015; Stavrakou et al., 2015, 2016). We therefore estimated the uncertainty of the a priori Chinese biomass burning NMVOC flux to be a factor of 3. Biomass burning emissions from the rest of the world were from GFED3 (van der Werf et al., 2010).
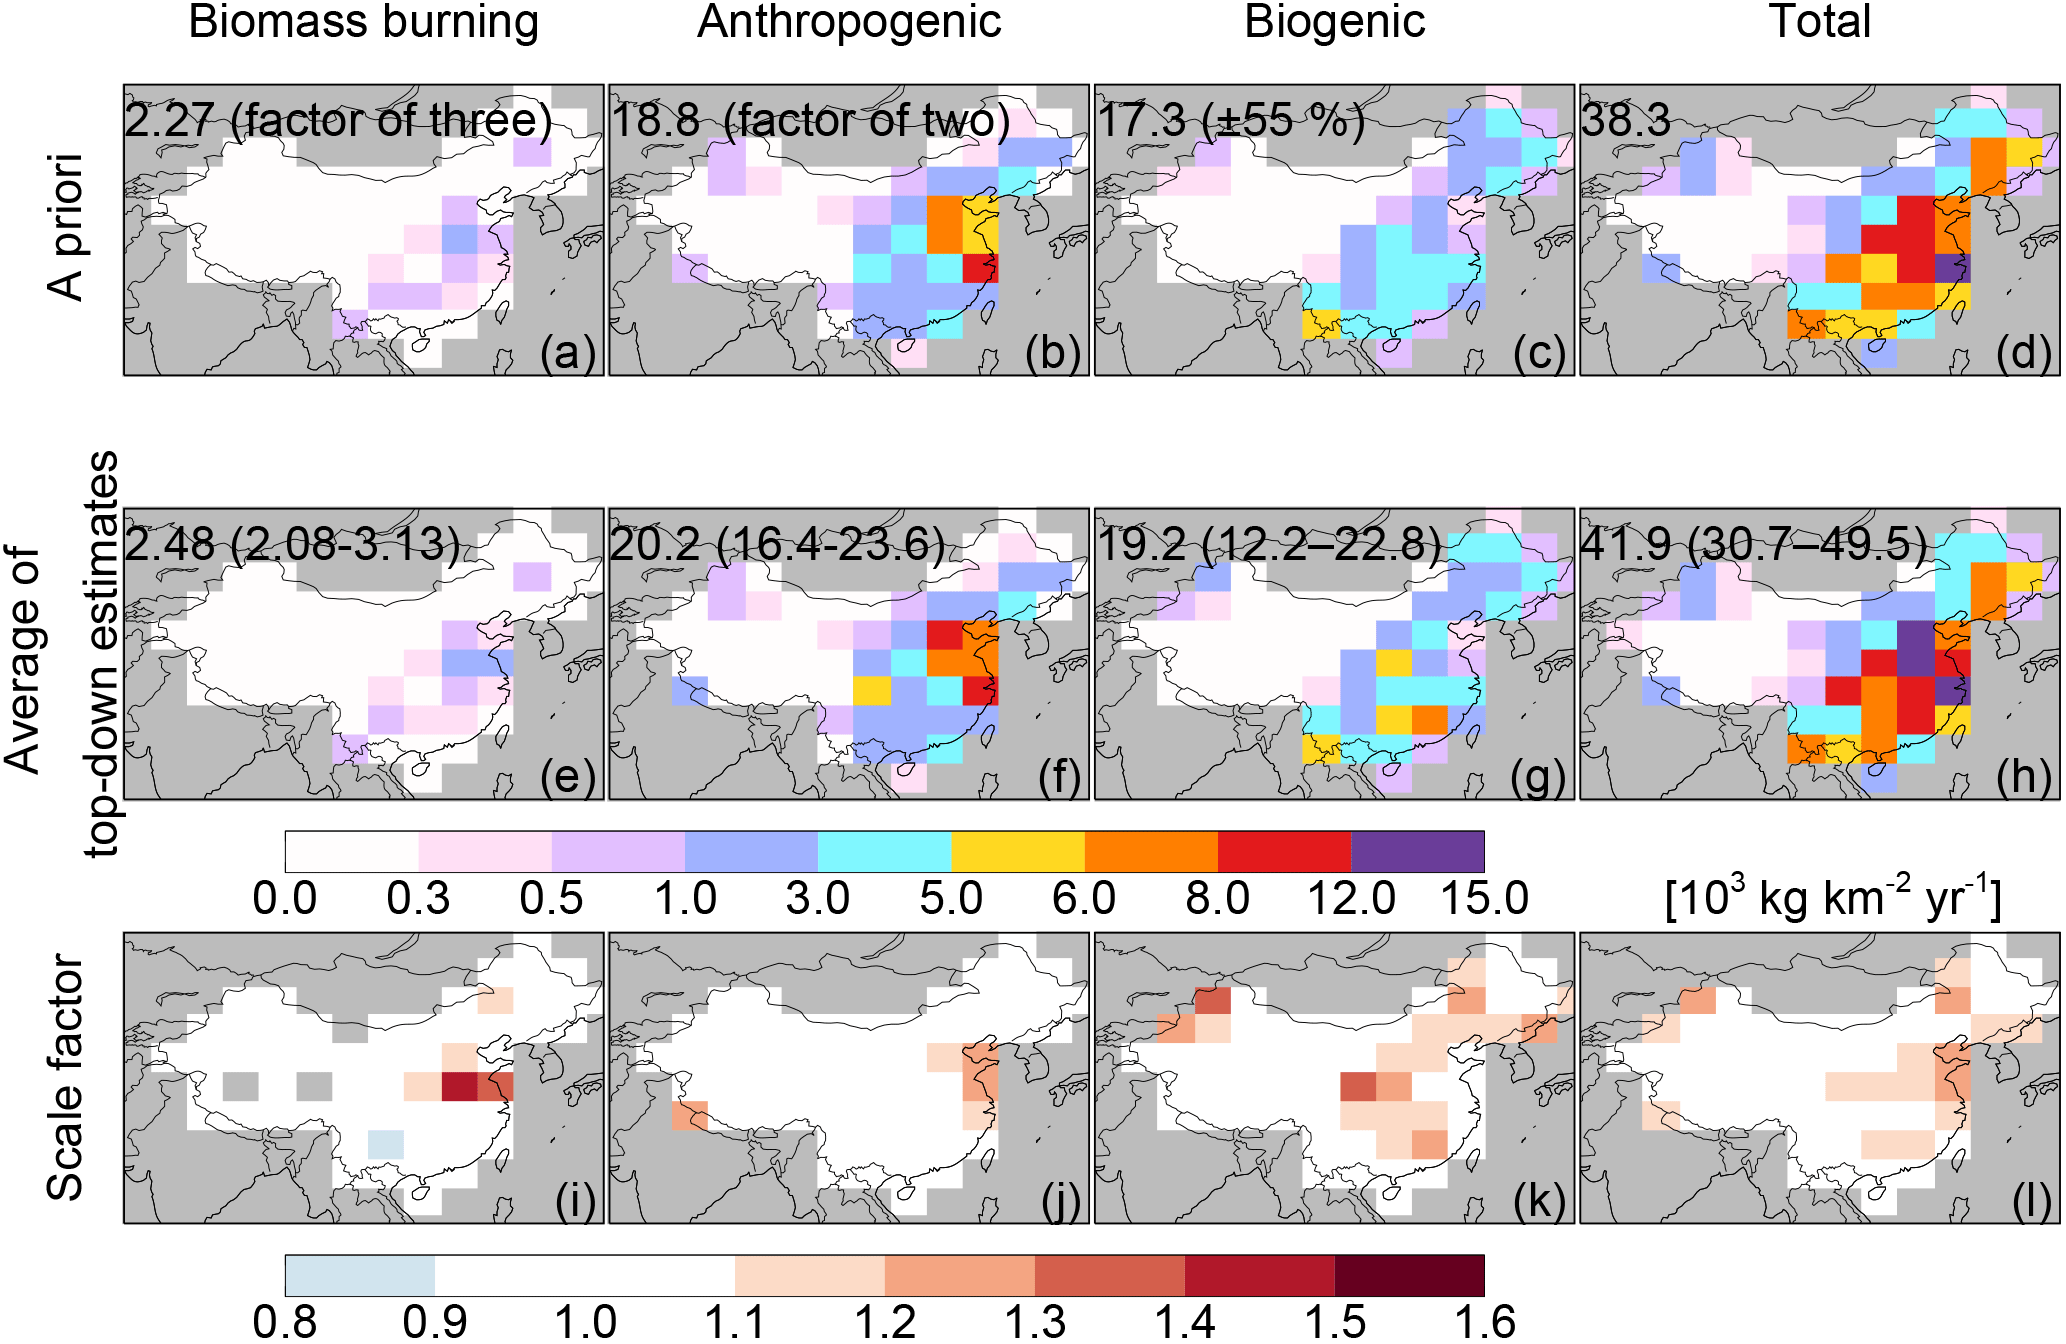
Figure 1Spatial distributions of annual NMVOC emissions from China. (a–d) The a priori annual NMVOC emission estimates from (a) biomass burning, (b) anthropogenic, (c) biogenic, and (d) total sources. (e–h) The average of our four sets of top-down estimates of annual NMVOC emissions. Annual Chinese total emission estimates are shown in the inset in units of Tg yr−1. The uncertainties of the a priori emission estimates and the range of top-down emission estimates are shown in parentheses. (i–l) Scale factors for our averaged top-down estimates relative to the a priori estimates.
Figure 1a–d show the spatial distribution of the a priori Chinese NMVOC emissions from biomass burning, anthropogenic, biogenic, and total sources, respectively. Biomass burning emissions were highest over the NCP and southwest China, reflecting the strong emissions from crop residue burning over the NCP in June and over southwest China during February to April. Chinese anthropogenic and biogenic NMVOC sources were both stronger in the east than in the west, reflecting the colocation of dense population and vegetation in the east. The highest biogenic NMVOC emissions were over southern China due to the combined modulation by vegetation densities, temperature, and sunlight. Anthropogenic NMVOC fluxes exceeded 103 kg km−2 yr−1 throughout industrialized and densely populated eastern China, with the highest fluxes over the NCP and around the Yangtze River Delta area.
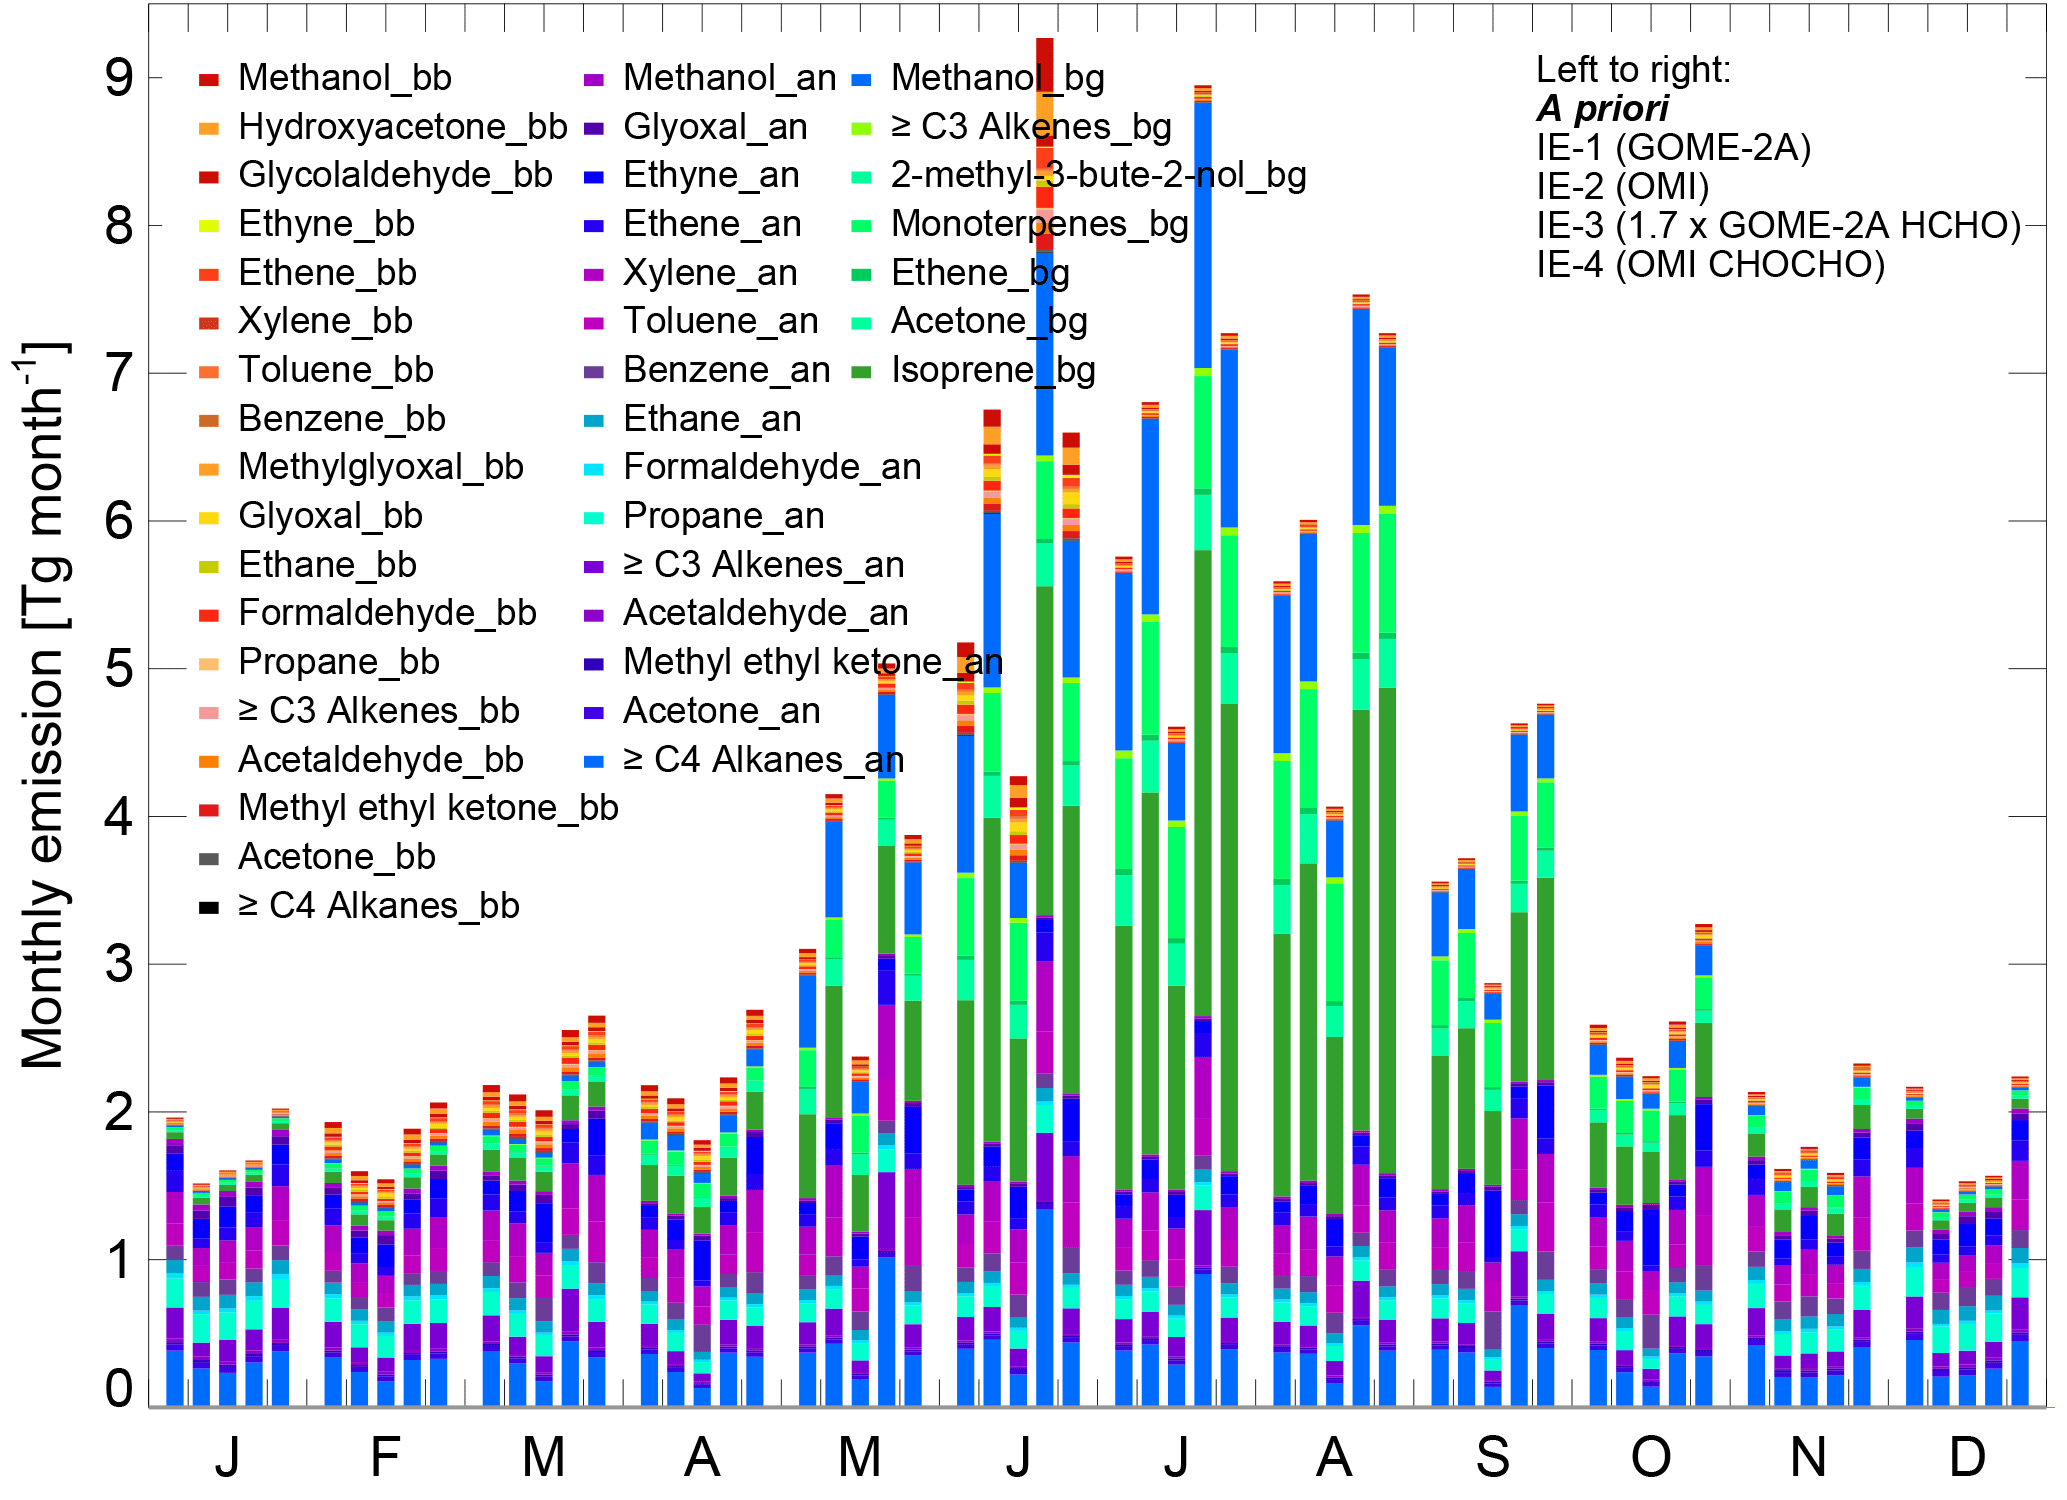
Figure 2Estimates of monthly Chinese NMVOC emissions. For each month, the bars from left to right represent the a priori emission estimates and the a posteriori emission estimates from IE-1, IE-2, IE-3, and IE-4. Color keys for NMVOC species are shown in the inset, with the suffixes of “bb”, “an”, and “bg” indicating emissions from biomass burning, anthropogenic, and biogenic activities, respectively.
Figure 2 shows the seasonal variation in the a priori Chinese NMVOC emissions. The a priori anthropogenic NMVOC fluxes were larger during the cold months and lower during the warm months, driven by the seasonal strengths of industrial and residential activities (Li et al., 2017). The a priori biogenic NMVOC fluxes showed the opposite seasonal pattern, with 65 % of the total annual flux emitted in summer (June to August). The a priori biomass burning NMVOC source was relatively small, except when it peaked due to post-harvest burning over the NCP in June and over southwest China in spring. As a result, the a priori Chinese NMVOC emissions were predominantly anthropogenic in winter but mainly biogenic in summer. During the transition seasons of spring and fall, the anthropogenic, biogenic, and biomass burning contributions were comparable.
2.3 Formaldehyde and glyoxal column concentrations observed by GOME-2A and OMI
We used the monthly mean tropospheric formaldehyde and glyoxal column concentrations retrieved from the GOME-2A instrument and the OMI for the year 2007 to constrain Chinese NMVOC sources. The four sets of satellite retrievals used in this study are briefly described below; further technical details are summarized in Table S2.
The native GOME-2A pixel vertical column densities (VCDs) of formaldehyde and glyoxal were retrieved by De Smedt et al. (2012) and Lerot et al. (2010), respectively. Pixel slant column densities (SCDs) of formaldehyde and glyoxal were retrieved in the 328.5–346 and 435–460 nm windows, respectively, using the DOAS technique (Platt et al., 1979). Previous glyoxal SCD retrievals often showed biases over remote tropical oceans due to absorption from liquid water (Wittrock et al., 2006; Vrekoussis et al., 2010). This bias was corrected in Lerot et al. (2010) by explicitly accounting for liquid water absorption during the DOAS fitting. Pixel SCDs were then converted into VCDs using air mass factors (AMFs), which were calculated using the linearized discrete ordinate radiative transfer (LIDORT) model (Spurr, 2008) and trace gas profiles simulated by the IMAGES v2 model (Stavrakou et al., 2009b). The native pixel VCDs were gridded to daily means at resolution (De Smedt et al., 2012; Lerot et al., 2010). We further averaged the daily means to monthly means at 5∘ longitude × 4∘ latitude resolution. The retrieval errors of the spatially and temporally averaged VCDs were estimated to be 30 %–40 % for formaldehyde and 40 % for glyoxal due to a combination of errors associated with the SCD retrievals, the reference sector correction, the a priori profile, and the AMFs (De Smedt et al., 2012; Lerot et al., 2010).
The OMI native pixel VCDs of formaldehyde and glyoxal were retrieved by González Abad et al. (2015) and Chan Miller et al. (2014), respectively. Pixel SCDs were retrieved by directly fitting the absorption spectra in the 328.5–356.5 nm (formaldehyde) and 435–461 nm (glyoxal) windows (Chance, 1998; Chan Miller et al., 2014). Pixel SCDs were then converted to VCDs using AMF calculated with a linearized vector discrete ordinate radiative transfer model, VLIDORT (Spurr, 2006), and trace gas profiles simulated by the GEOS-Chem model (González Abad et al., 2015). Liquid water absorption was also explicitly calculated for the glyoxal retrieval (Chan Miller et al., 2014). The typical uncertainties of OMI-observed pixel VCDs over polluted areas were estimated to be 30 % to 45 % for formaldehyde and 100 % for glyoxal (González Abad et al., 2015; Chan Miller et al., 2014). The native pixel VCDs were averaged to monthly means at 5∘ longitude × 4∘ latitude resolution. For glyoxal, we further removed VCDs with signal-to-uncertainty ratios of less than 100 %. We assumed the retrieval uncertainty of monthly mean OMI formaldehyde and glyoxal VCDs at resolution to be 40 % and 100 %, respectively.
To remove global systematic biases in the satellite observations, we aligned the observed monthly mean VCDs over remote reference areas to those simulated by the GEOS-Chem model (sampled at satellite overpass time) using the a priori NMVOC emissions. The remote Pacific (140–160∘ W, 90∘ S–90∘ N) was chosen as the reference area for formaldehyde (Palmer et al., 2003, 2006; Fu et al., 2007; González Abad et al., 2015). The Sahara desert (20–30∘ N, 10∘ W–30∘ E), where the interference from liquid water absorption was minimal, was chosen as the reference area for glyoxal (Chan Miller et al., 2014). The justification for performing the alignment was twofold. Firstly, the formaldehyde and glyoxal VCDs over these remote reference areas were small and well simulated by the model (Fu et al., 2007; Chan Miller et al., 2014). The removed biases over the remote areas were less than 20 % and 10 % of the typical formaldehyde ( molecule cm−2) and glyoxal ( molecule cm−2) monthly mean VCDs observed over eastern China, respectively. More importantly, our inversion was performed over China only, assuming that the a priori NMVOC emissions for the rest of the world were unbiased. As will be seen in Sects. 3 and 4, the optimization of NMVOC sources was predominantly driven by local formaldehyde and glyoxal enhancements produced by relatively short-lived NMVOCs.
2.4 Inversion experiments using the GEOS-Chem adjoint
We used the GEOS-Chem model to perform Bayesian inversions on Chinese NMVOC emissions, using satellite observations of formaldehyde and glyoxal over China and the a priori emission estimates as constraints. The inversion minimized a cost function, J(x), over China (Rodgers, 2000).
The first and second terms on the right-hand side of Eq. (1) represented the penalty error and the prediction error, respectively. x, which we sought to optimize, was the vector of scale factors (for each NMVOC species from each emission sector and for each grid) applied to the a priori emissions. xa was a unit vector applied to the a priori NMVOC emission estimates. y was the vector of satellite-observed monthly mean VCDs of the targeted tracer (formaldehyde and/or glyoxal). F(x) was the vector of VCDs of the targeted tracer simulated by the forward model F. So was the a priori emission error covariance matrix, which we assumed to be diagonal. The observation error covariance matrix in Eq. (1), So, was difficult to quantify, as it included contributions not only from the satellite retrieval but also from the model representation of chemistry and transport. Zhu et al. (2016) and Chan Miller et al. (2017) compared vertical profiles of GEOS-Chem-simulated formaldehyde and glyoxal over the southeast US in summer against aircraft measurements. They reported that the simulated formaldehyde mixing ratios showed only a small bias (−3 % ±2 %) in the lower troposphere but were lower than the observations by 41 % in the free troposphere, likely due to insufficient deep convection in the model (Zhu et al., 2016). The simulated glyoxal mixing ratios were within 20 % of the observations in the mixed layer, but they were too low in the upper troposphere by more than a factor of 2, also likely due to insufficient model vertical transport (Chan Miller et al., 2017). It should be noted that these errors assessed by Zhu et al. (2016) and Chan Miller et al. (2017) likely also included the errors associated with precursor emissions. Nevertheless, based on these assessments, we estimated the model errors for formaldehyde and glyoxal VCDs to be ±80 % and ±100 %, respectively. Adding these estimated model errors in quadrature to the satellite retrieval errors (Sect. 2.3), we estimated the observation error (So) of formaldehyde and glyoxal to be about ±90 % and ±150 %, respectively.
The optimization of Eq. (1) was dependent on the relative weighting of the penalty error (So) and the prediction error (So), which were often incompletely represented. In addition, we found that due to the mathematical formulation of Eq. (1), the cost function J(x) was heavily weighted by grids in which the a priori estimates were too high, such that the optimization was less effective at increasing emissions where the a priori emissions were too low. These issues were empirically addressed in inversion studies by the introduction of a regularization factor, γ, to adjust the relative weight of the penalty error. Henze et al. (2009) used the L curve method (Hansen, 1998) to find an optimal γ value, which minimized the total cost function while balancing the prediction term and the penalty term. We followed that methodology and found a γ value of 0.01 for July, which we applied to all warmer months (March to October). An optimized γ value of 0.1 was found for January and applied to colder months.
Table 1 lists our inversion experiments. Figure S3 illustrates our protocol for the inversion experiments. We experimented with four different sets of satellite retrievals as constraints, with the goal of bracketing the possible range of top-down estimates for Chinese NMVOC emissions. The first two experiments (IE-1 and IE-2) constrained emissions using the formaldehyde and glyoxal VCDs observations from GOME-2A and OMI, respectively. Several studies showed that GOME-2A formaldehyde VCDs may be low by a factor of 1.3 to 1.7 (Lee et al., 2015; Zhu et al., 2016; Wang et al., 2017). As an upper bound constraint, we conducted a third inversion experiment (IE-3) constrained by 1.7 times the GOME-2A formaldehyde VCDs. We conducted a fourth inversion experiment (IE-4) constrained by OMI glyoxal VCDs alone to explore the impacts of glyoxal observations on the inversions.
We first compared the formaldehyde and glyoxal VCDs simulated by the model (sampled at satellite overpass times) using the a priori emissions against those observed by GOME-2A and OMI, as well as against measurements at ground-based sites (Table S3). Figures 3 and 4 show the monthly mean formaldehyde VCDs observed by GOME-2A over China in 2007. Observed formaldehyde VCDs over China showed a distinct west-to-east gradient year-round, driven by the higher vegetation and population densities in eastern China. Observed formaldehyde VCDs were higher in summer than in winter due to a combination of stronger biogenic emissions and photochemistry during the warmer months. In spring, GOME-2A formaldehyde VCDs were high over southwest China and Southeast Asia, reflecting the occurrence of seasonal biomass burning. The highest formaldehyde VCDs were observed over the NCP in June, likely because of the large emissions from in-field crop residue burning.
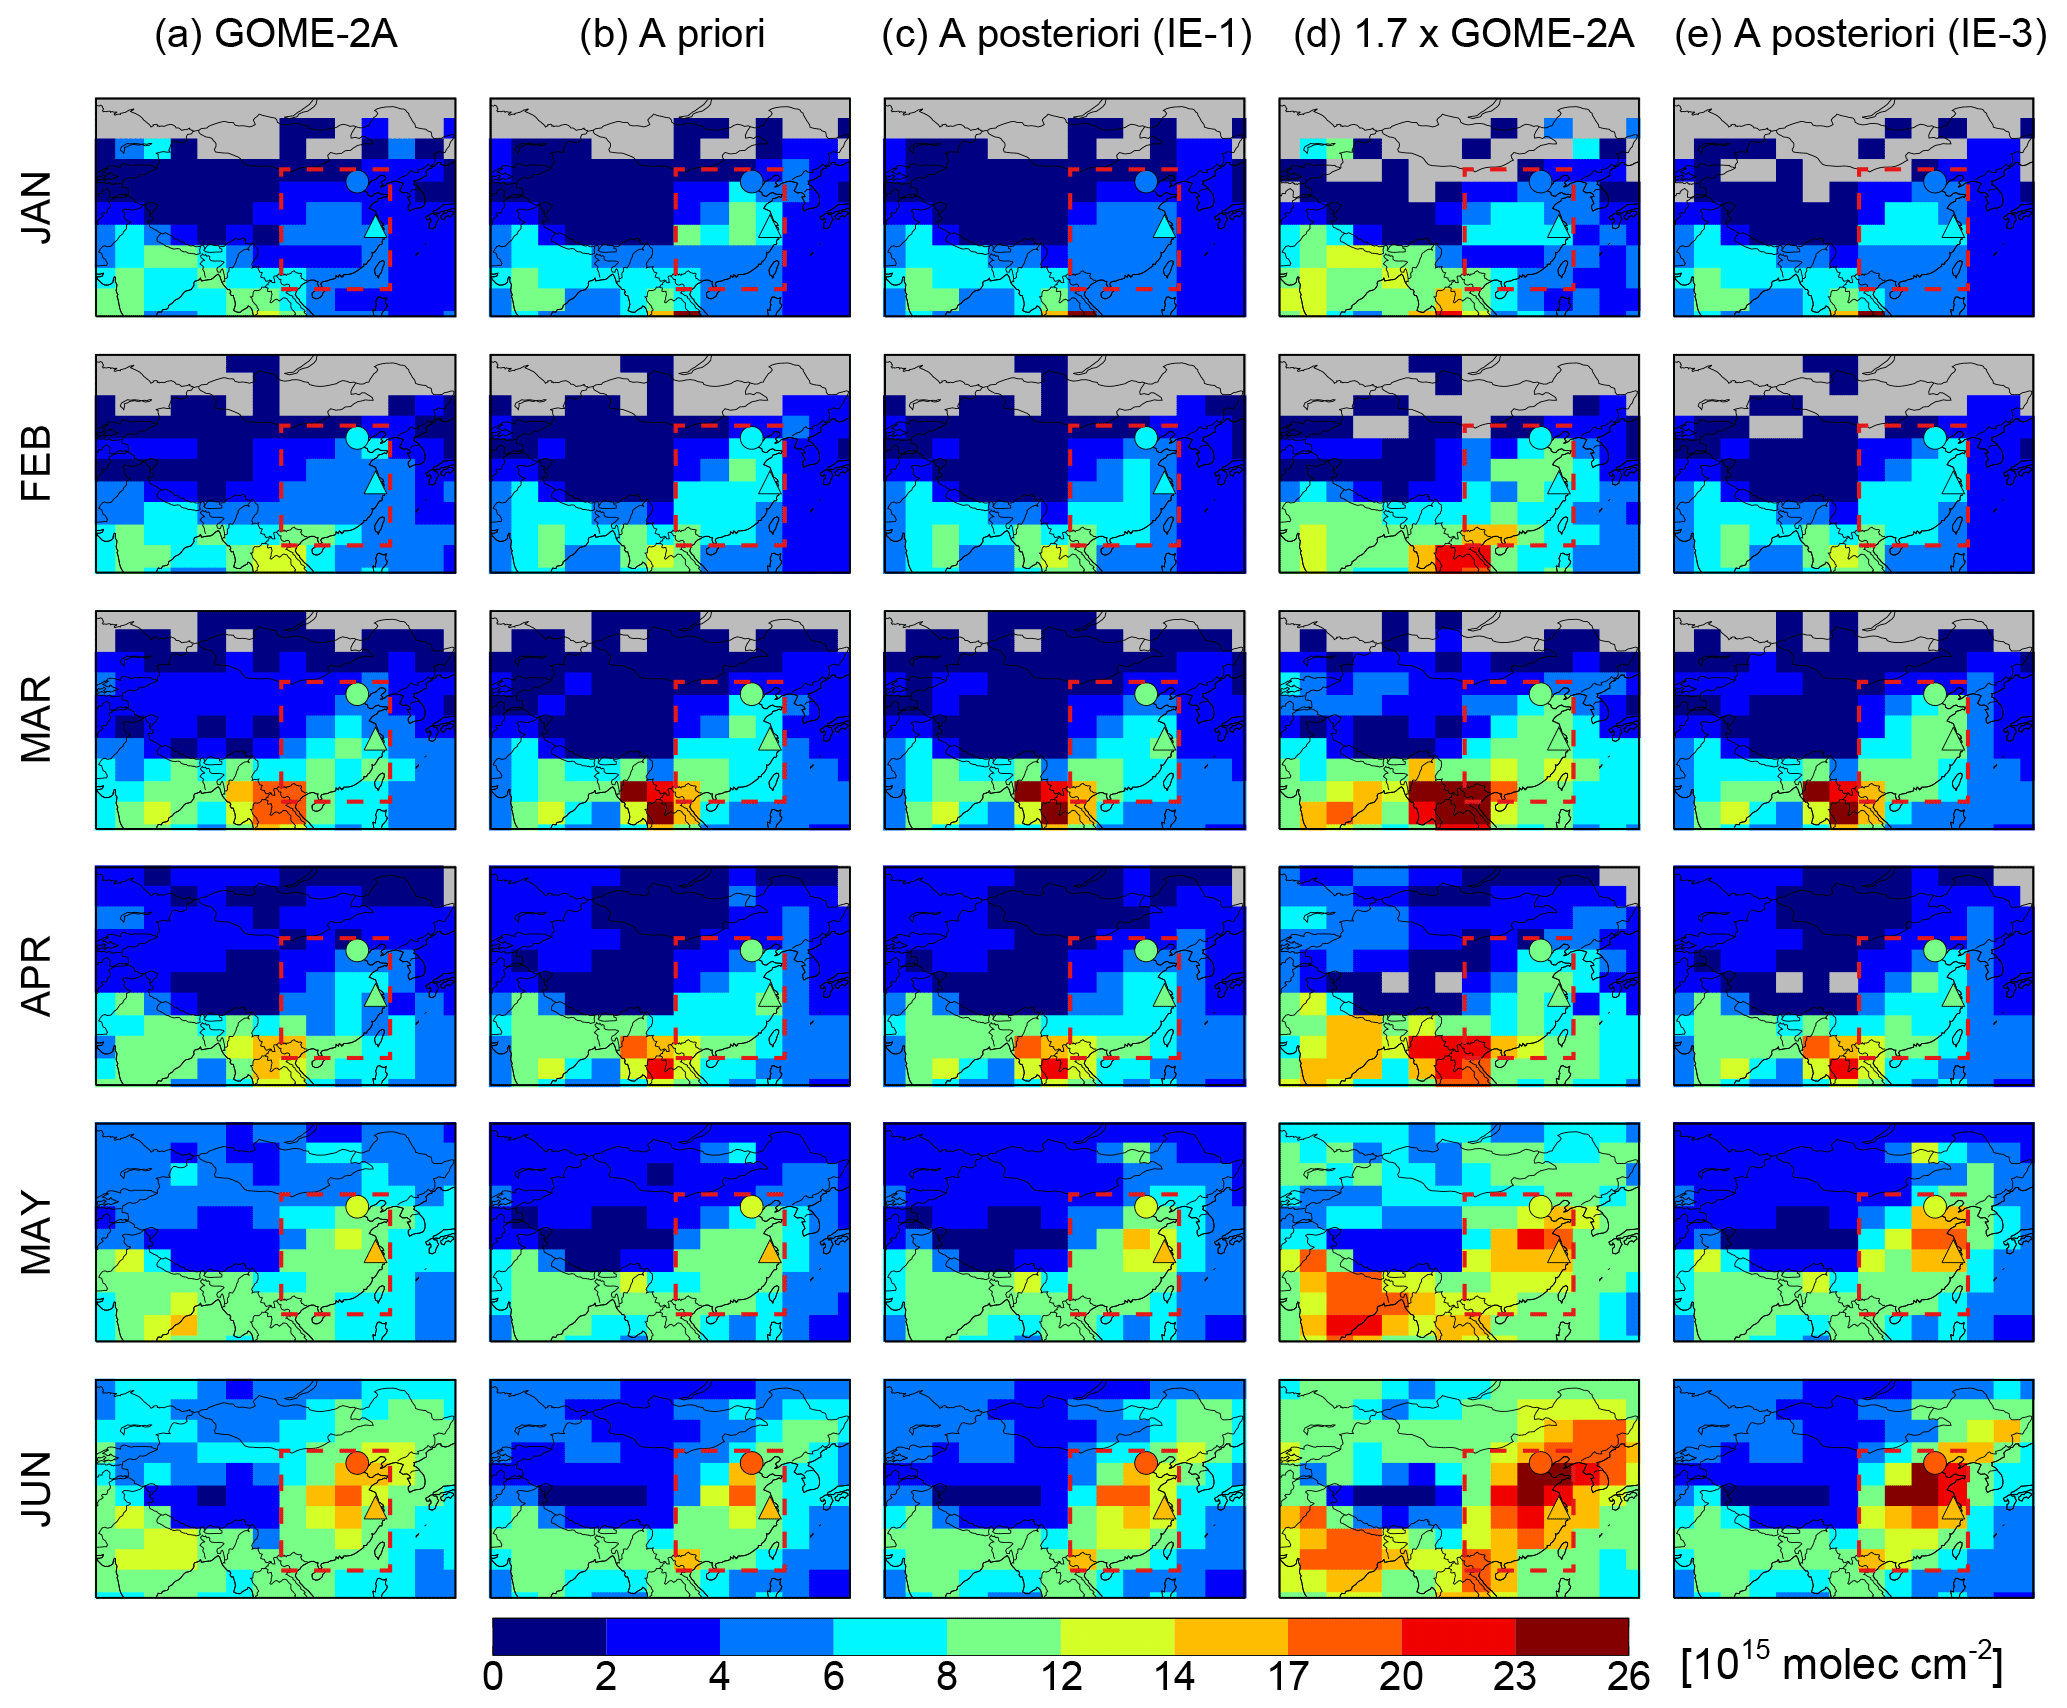
Figure 3Monthly mean formaldehyde VCDs over China from January to June. For each month, the panels from left to right show (a) formaldehyde VCDs observed by GOME-2A, (b) formaldehyde VCDs simulated by the model using a priori emission estimates, (c) the a posteriori formaldehyde VCDs from IE-1, (d) GOME-2A formaldehyde VCDs scaled by a factor of 1.7, and (e) the a posteriori formaldehyde VCDs from IE-3. All model results were sampled at GOME-2A overpass time. Also shown are ground-based MAX-DOAS measurements at 09:30 LT at Xianghe (monthly mean, circles) and Wuxi (bimonthly mean, upward triangles).
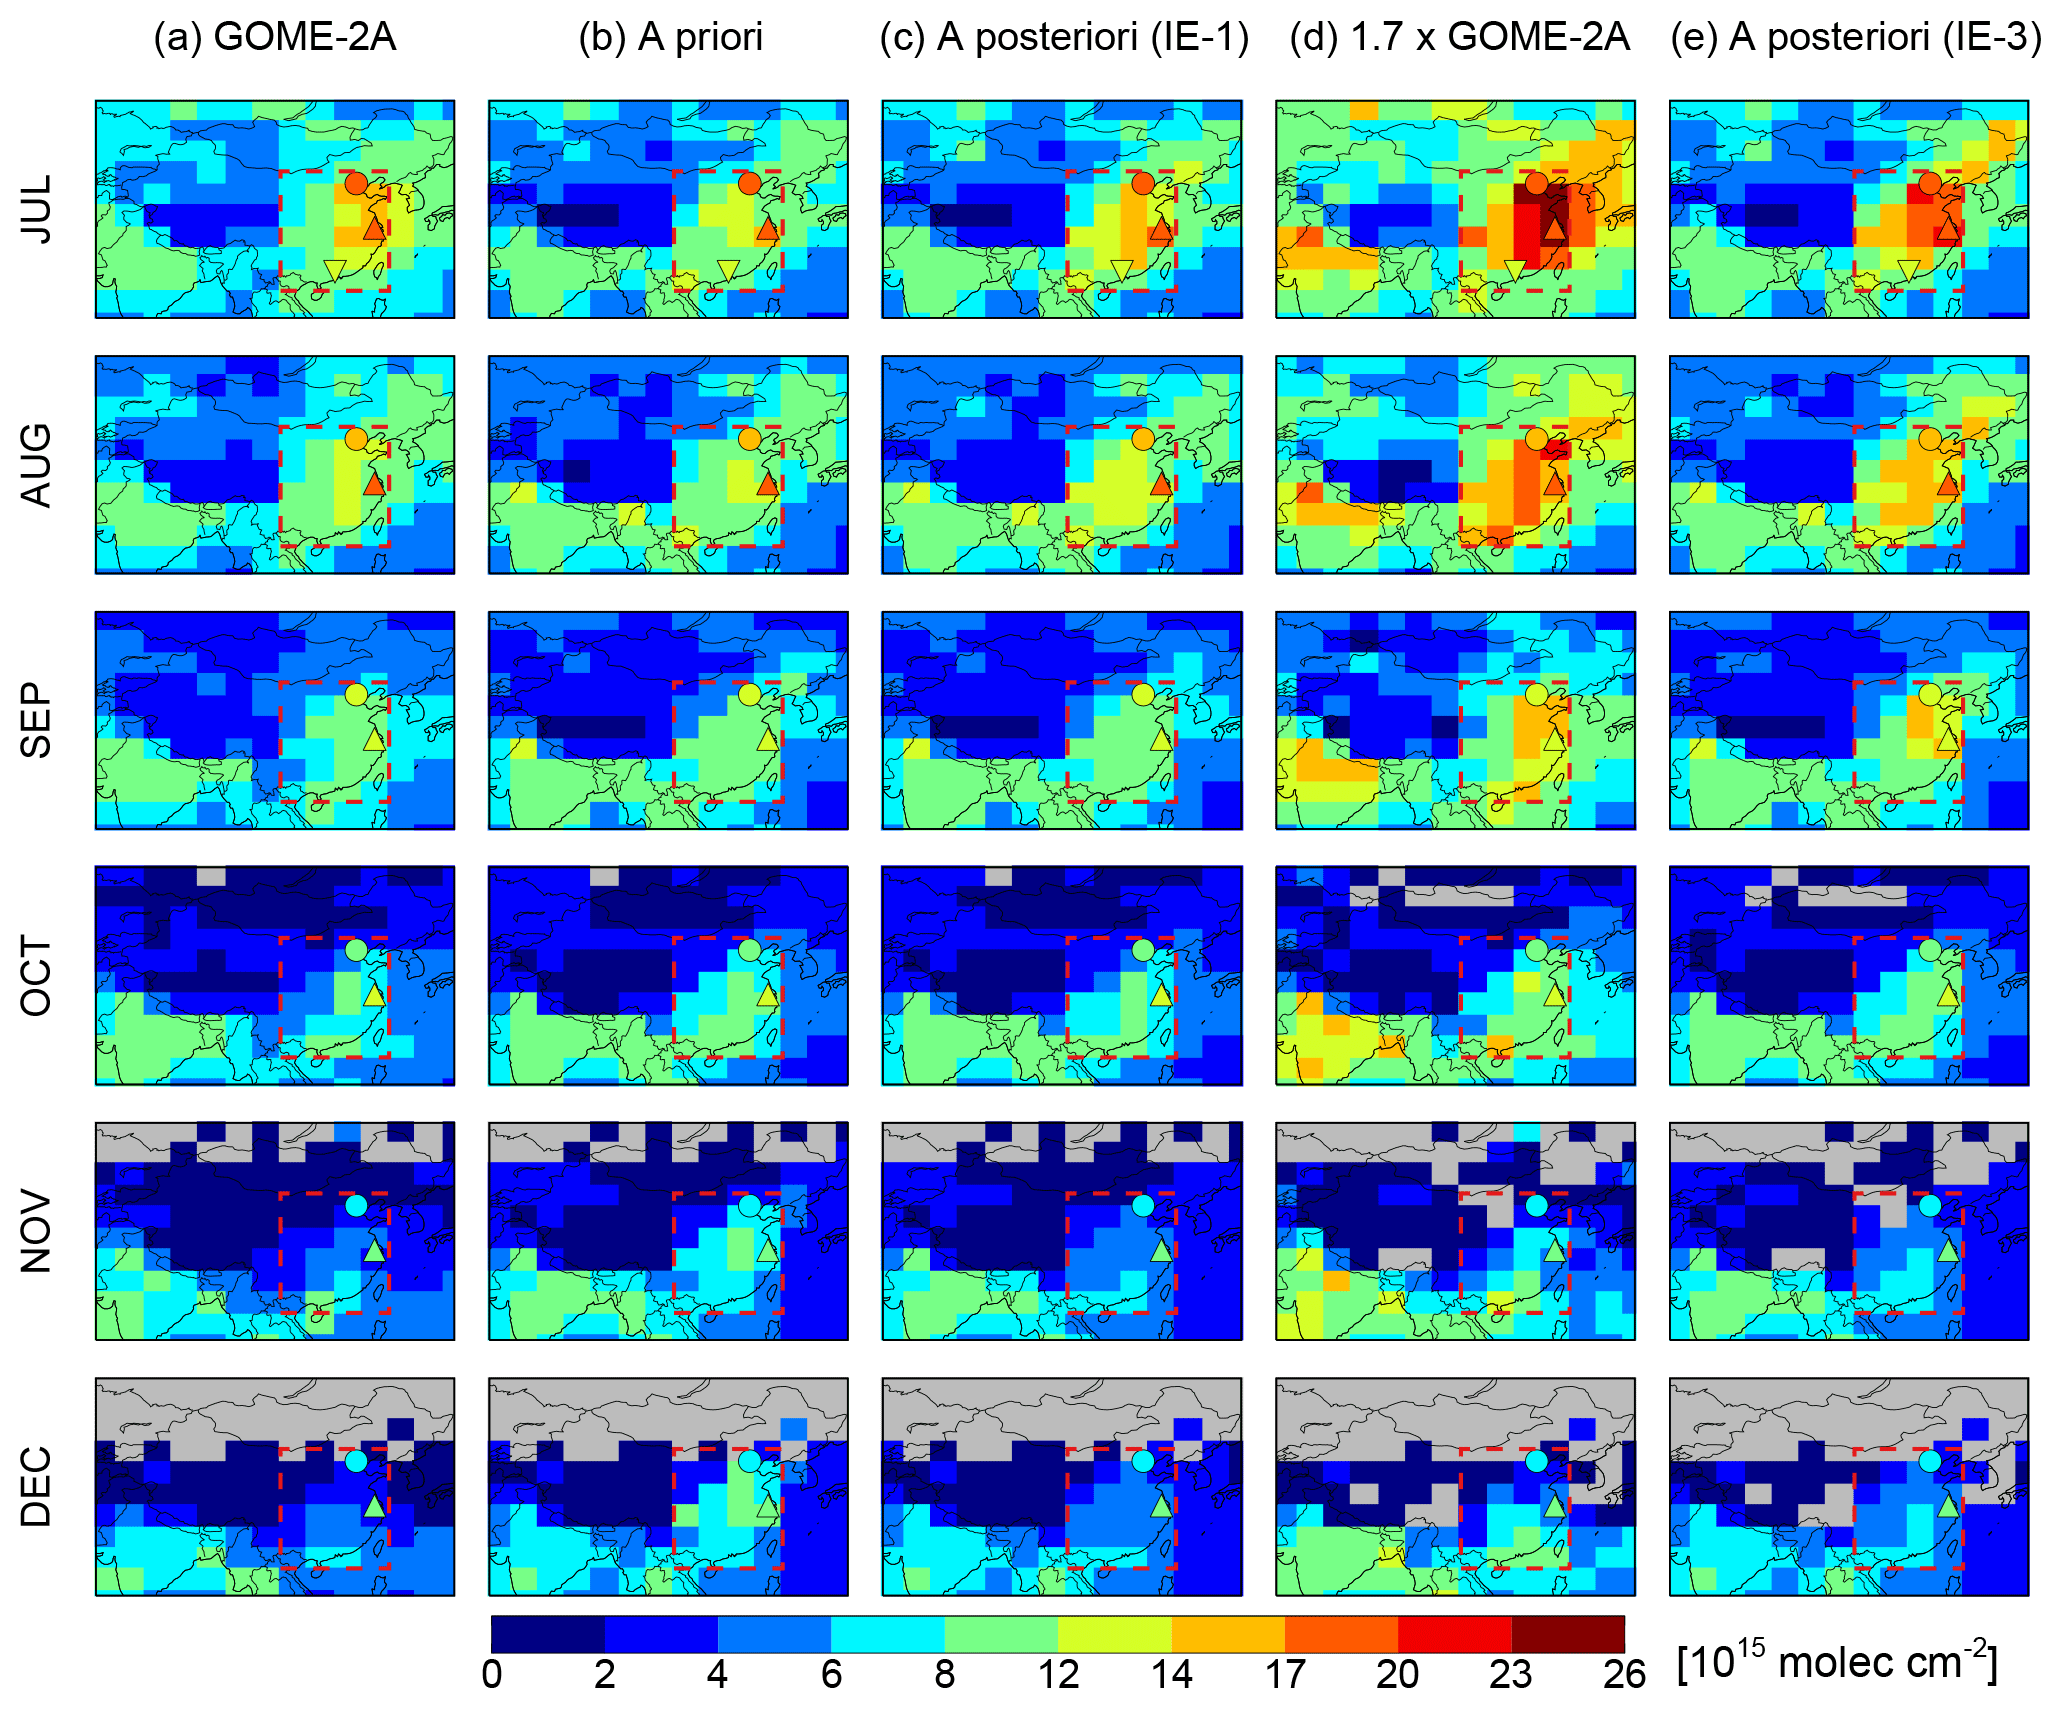
Figure 4Same as Fig. 3 but for July to December. Also shown are ground-based MAX-DOAS measurements at 09:30 LT time at Back Garden (July mean, inverted triangles).
Figures 3 and 4 compare the simulated monthly mean formaldehyde VCDs using the a priori emission against the GOME-2A formaldehyde VCDs. Table S4 summarizes the statistics of the comparison over eastern China. The a priori simulated formaldehyde VCDs generally reproduced the observed seasonal contrast and spatial patterns over eastern China, with correlation coefficients (R) between 0.74 and 0.94 year-round, except in December (R=0.51). The a priori simulated formaldehyde VCDs were significantly higher than the GOME-2A observations over eastern China between late fall and winter (November, December, January, and February), with normalized mean biases (NMBs) of 13 % to 67 %, implying an overestimate of the anthropogenic formaldehyde precursors in the a priori emission estimates. The a priori simulated formaldehyde VCDs were lower than the GOME-2A observations over eastern China during May to July (NMB between −11 % to −6.4 %), implying an underestimation of the emissions of formaldehyde precursors in the a priori during May to July.
A few ground-based measurements of tropospheric formaldehyde VCDs have been made in China using the MAX-DOAS technique (Li et al., 2013; Vlemmix et al., 2015; Wang et al., 2017); these measurements (sampled at GOME-2A overpass time) are shown in Figs. 3, 4, S4, and S5 and Table S3. In principle, these ground-based measurements are not directly comparable to the satellite-observed and model-simulated formaldehyde VCDs due to the coarse spatial resolution of our analyses. Nevertheless, the MAX-DOAS measurements showed that (1) formaldehyde VCDs were higher during the warmer months relative to the colder months, (2) formaldehyde VCDs over Wuxi (in central eastern China) were higher than those over Xianghe (in northern China) and Back Garden (in southern China) for most months, and (3) in June, the formaldehyde VCDs over Xianghe were the highest among the three MAX-DOAS sites, reflecting the strong emissions from biomass burning in the NCP. Thus, the seasonal patterns shown in the measurements were consistent with both the GOME-2A-observed and model-simulated formaldehyde VCDs.
Figure S4 compares the GOME-2A and the model a priori formaldehyde VCDs in 2007 against the multiyear (during the years 2010 to 2016) monthly mean formaldehyde VCD measured by MAX-DOAS at Xianghe (a rural site in the NCP) at GOME-2A overpass time (Vlemmix et al., 2015). The GOME-2A formaldehyde VCDs were consistent with the MAX-DOAS measurements in terms of the seasonal variation (R=0.95) but showed an annual mean bias of molecules cm−2. The interannual variability in the local formaldehyde VCDs (as represented by the standard deviation of the MAX-DOAS measurements) was relatively small and thus unlikely to be the sole driver for the differences between the GOME-2A observations in 2007 and the MAX-DOAS measurements during 2010 to 2016. The seasonal variation in the model a priori formaldehyde VCDs was less consistent with that of the MAX-DOAS measurements (R=0.81). Figure S4 also showed that, by multiplying the GOME-2A formaldehyde VCD observations by 1.7, the annual mean bias against the MAX-DOAS measurements at Xianghe was reduced to molecules cm−2. Figures 3 and 4 show that the differences between the satellite and MAX-DOAS measurements were also reduced at Wuxi when the GOME-2A formaldehyde VCDs were scaled up by 1.7. These findings offered some support for using the GOME-2A formaldehyde VCDs scaled by 1.7 as an upper-bound constraint for Chinese NMVOC emissions.
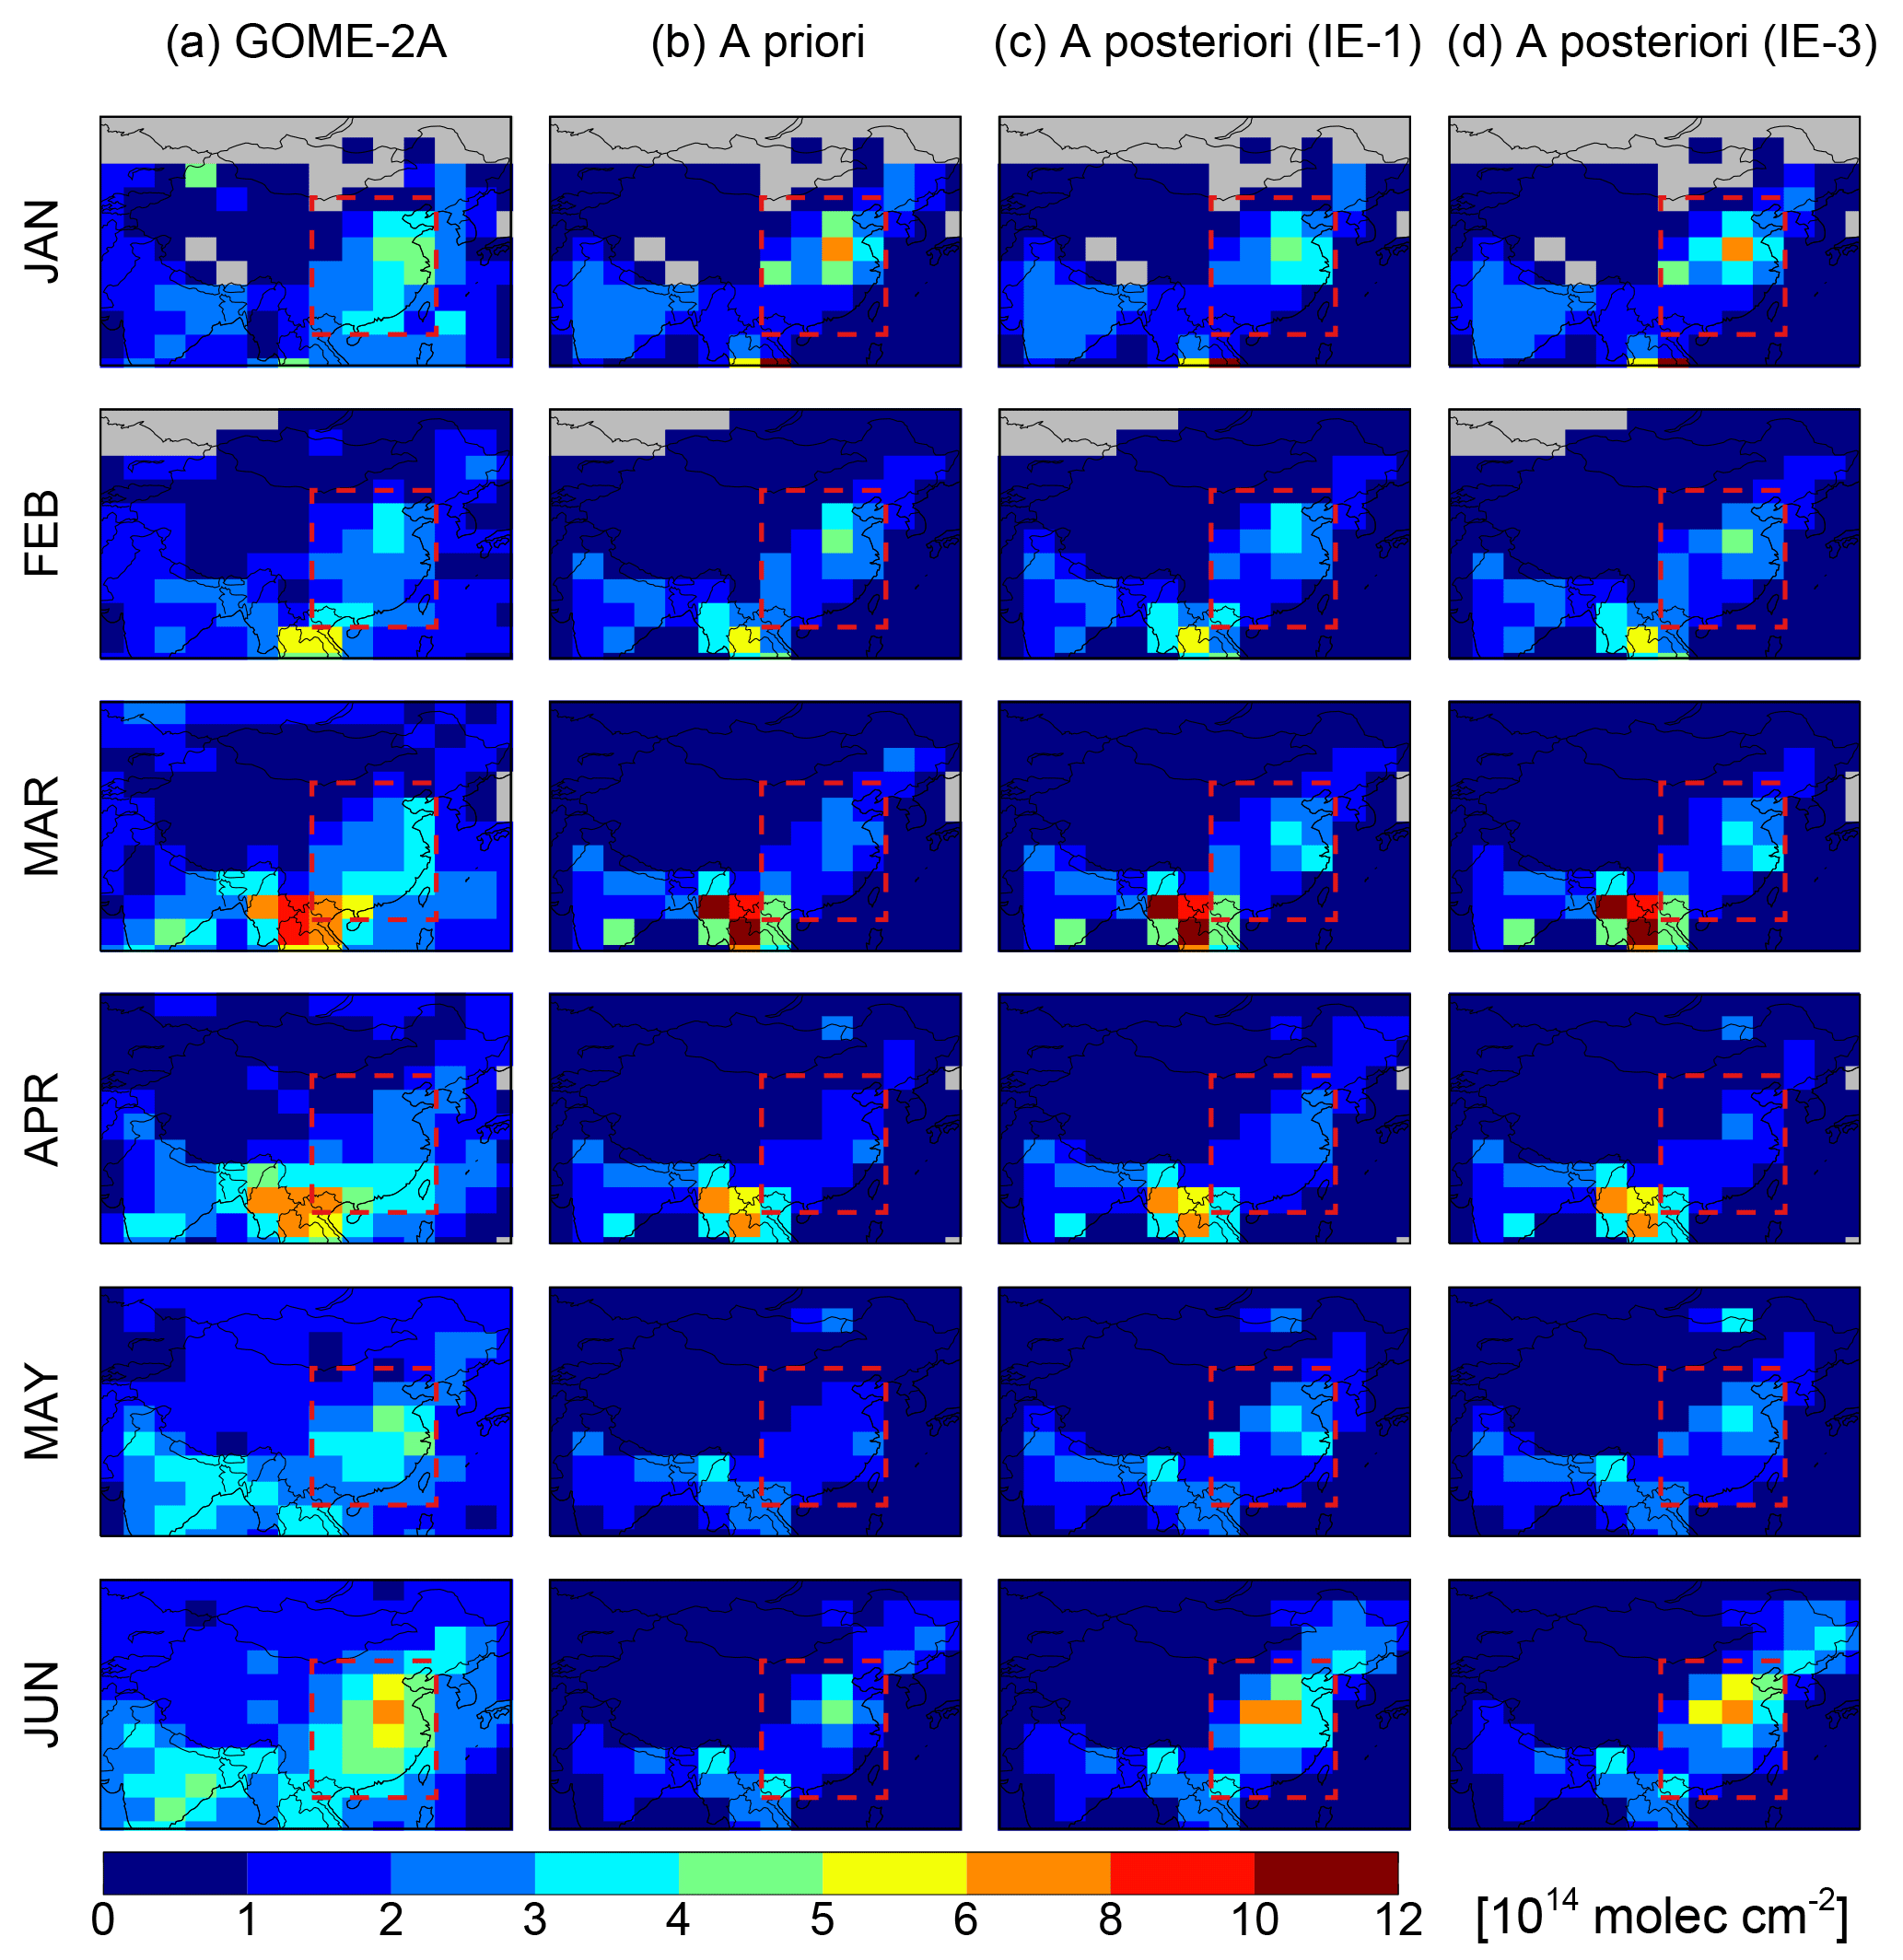
Figure 5Monthly mean glyoxal VCDs over China from January to June. For each month, the panels from left to right show (a) glyoxal VCDs observed by GOME-2A, (b) glyoxal VCDs simulated by the model using a priori emission estimates, (c) the a posteriori glyoxal VCDs from IE-1, and (d) the a posteriori glyoxal VCDs from IE-3. All model results were sampled at GOME-2A overpass time.
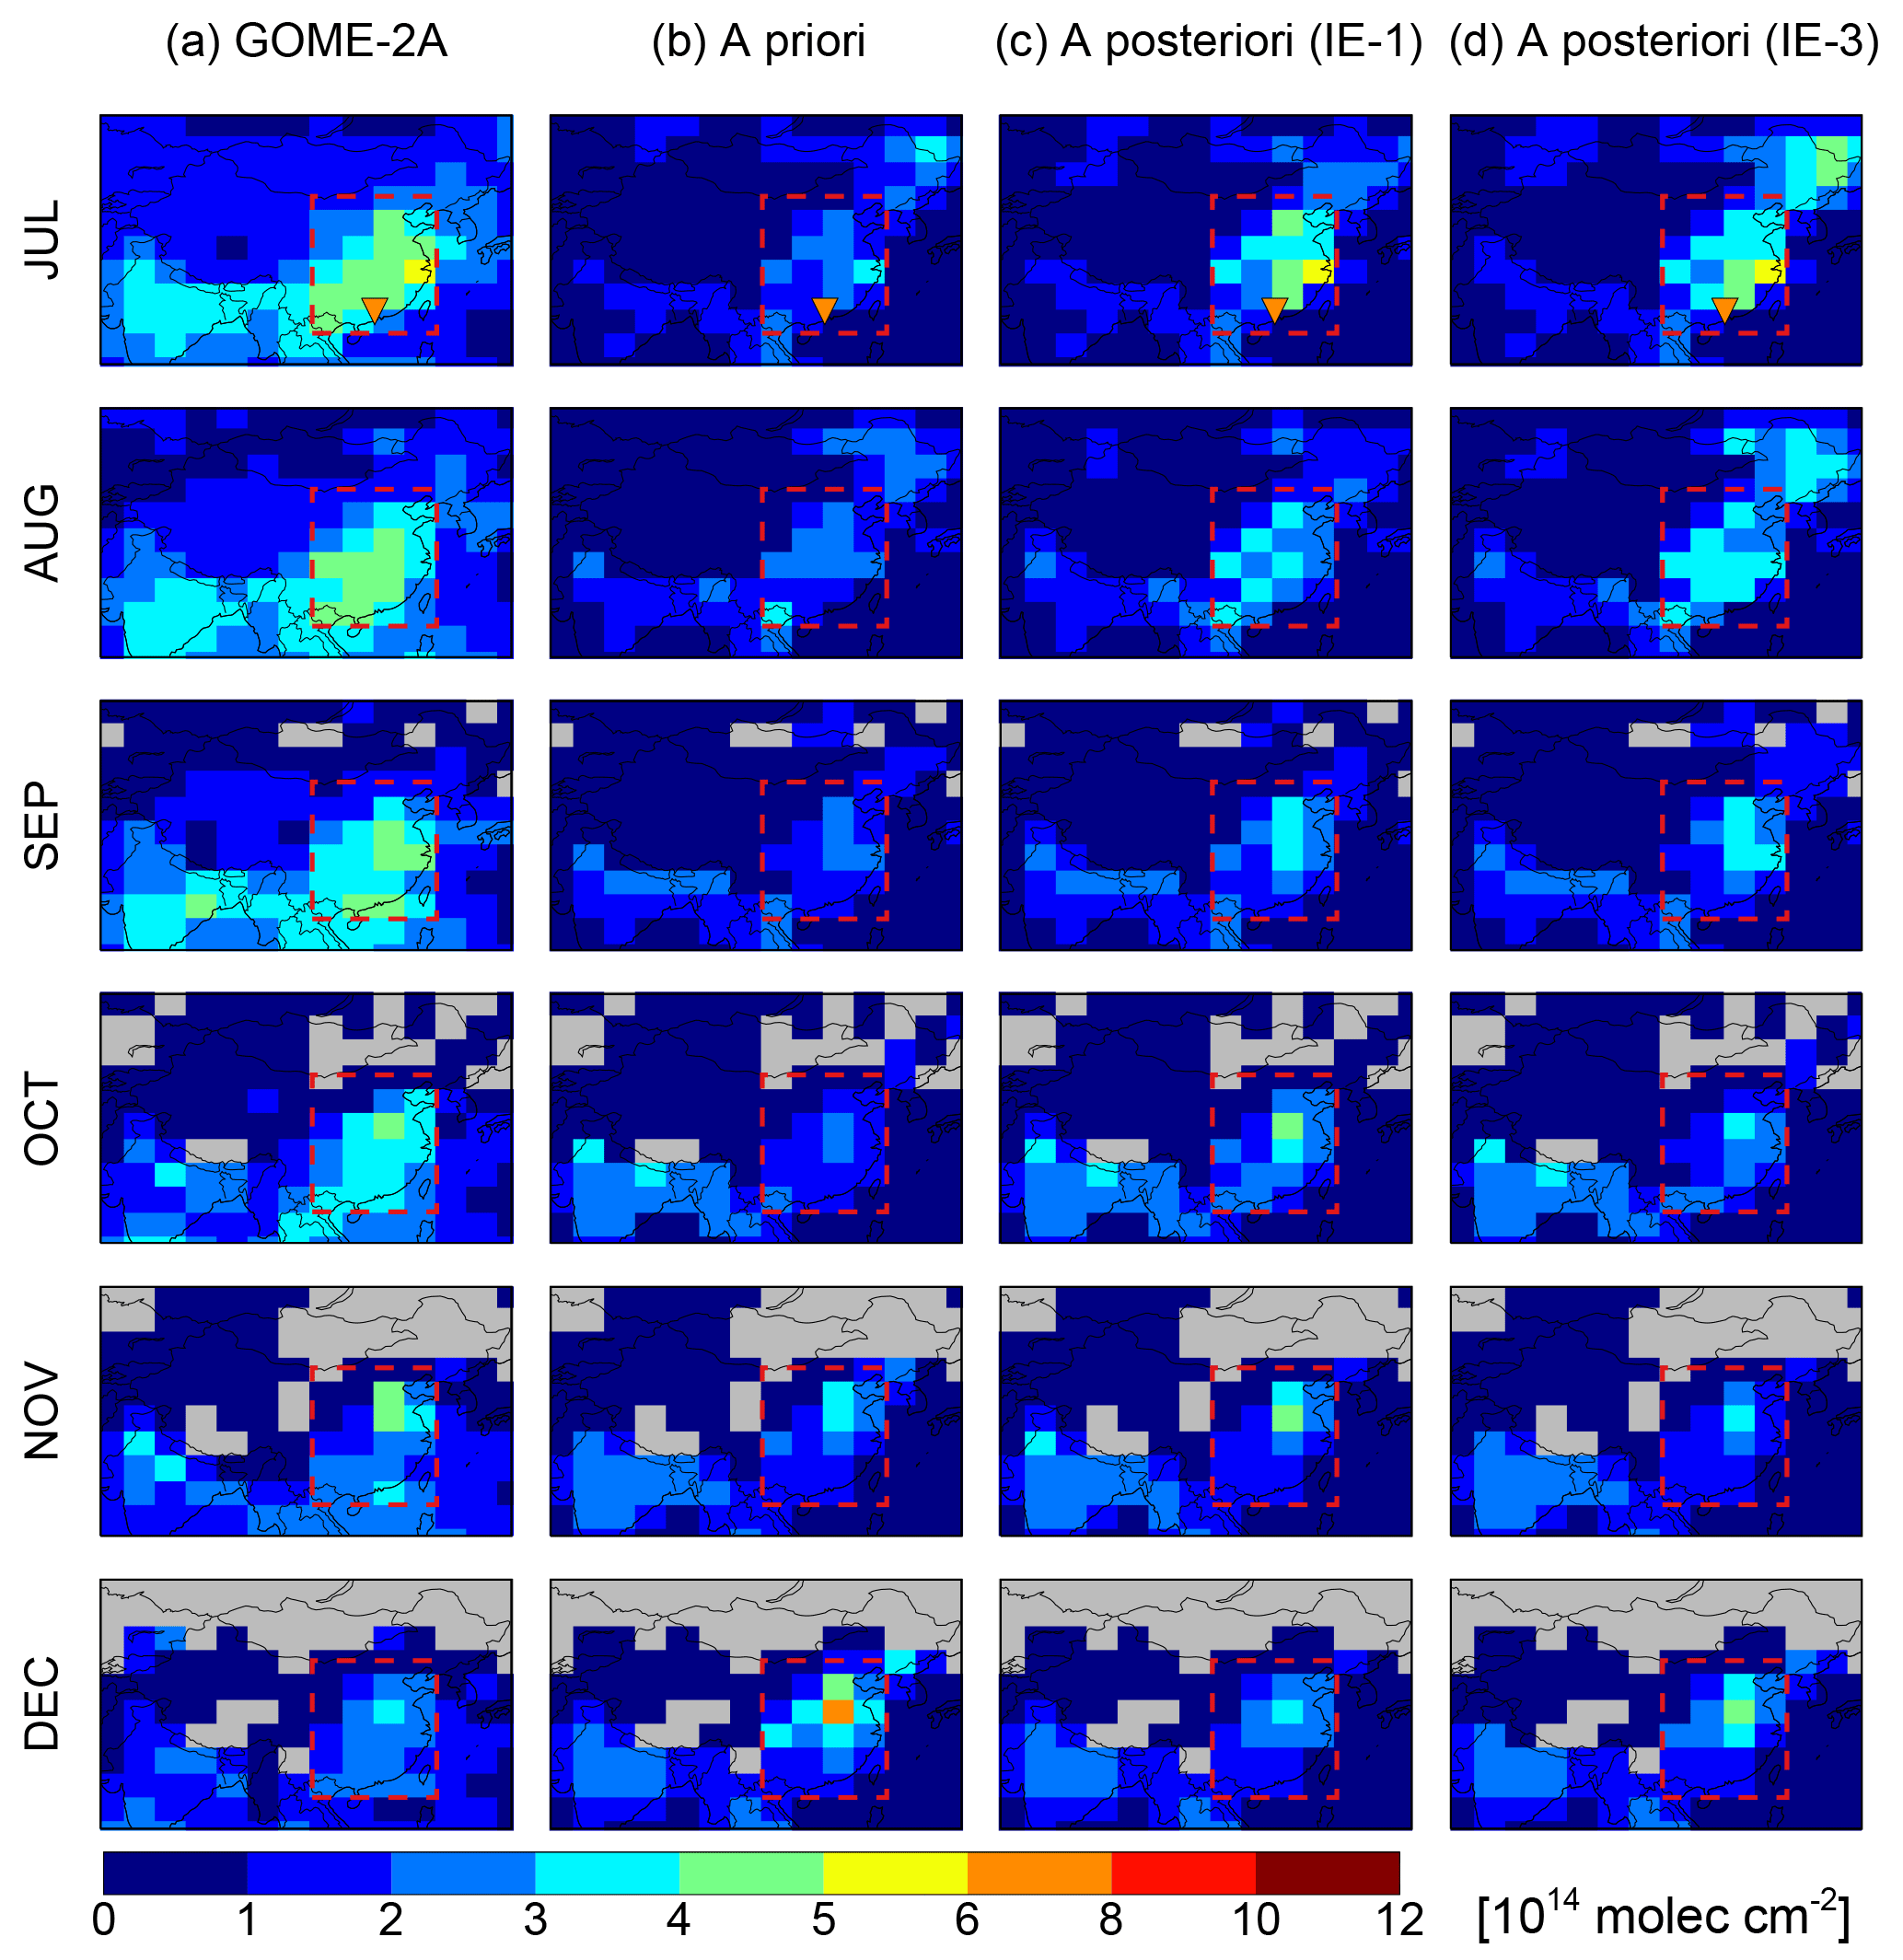
Figure 6Same as Fig. 5 but for July to December. Also shown are ground-based MAX-DOAS measurements at 09:30 LT at Back Garden (July mean, inverted triangles).
Figures 5 and 6 compare the monthly mean glyoxal VCDs observed by GOME-2A with those simulated by the model using a priori emission estimates. Similar to the case of formaldehyde, GOME-2A-observed glyoxal VCDs over China were higher in the east than in the west and higher in summer than in winter. High glyoxal VCDs were observed over the NCP in June and over southwest China in spring, reflecting the strong seasonal biomass burning emissions. During winter (particularly in January), the GOME-2A glyoxal VCDs show an enhancement over eastern China, which was not apparent in the GOME-2A formaldehyde VCDs. This indicated that the glyoxal VCDs were more reflective of anthropogenic sources than formaldehyde VCDs. The a priori simulated glyoxal VCDs were generally lower than the GOME-2A glyoxal VCDs over eastern China year-round, especially during the warmer months (NMB between −52 % and −59 % during May to September, Table S6). The only exception was over the NCP in winter, when the a priori simulated glyoxal VCDs were significantly higher than the GOME-2A observations. This suggested an overestimation of NMVOC sources over the NCP in winter and a substantial underestimation of NMVOCs sources over eastern China in summer, consistent with the constraints implied by the GOME-2A formaldehyde observations. During the transition months of April and October, when the anthropogenic and biogenic contributions to carbonyl productions were presumably more comparable, the simulated glyoxal VCDs were lower than the GOME-2A observations, while the simulated formaldehyde VCDs were higher than the GOME-2A observations (Figs. 3 and 4). This likely indicated that the a priori inventory underestimated the emissions of NMVOC species that preferentially produced glyoxal (e.g., aromatics, ethyne, ethene, and glyoxal), while overestimating the emissions of species that preferentially produced formaldehyde (e.g., ≥ C4 alkanes, ≥ C3 alkenes, and formaldehyde) during the transition months. Ground-based MAX-DOAS glyoxal measurements at Back Garden (a rural site in southern China) in July 2006 averaged molecules cm−2 (Li et al., 2013), higher than both the GOME-2A-observed and simulated glyoxal VCDs. No other ground-based measurements were available to provide spatial and seasonal information.
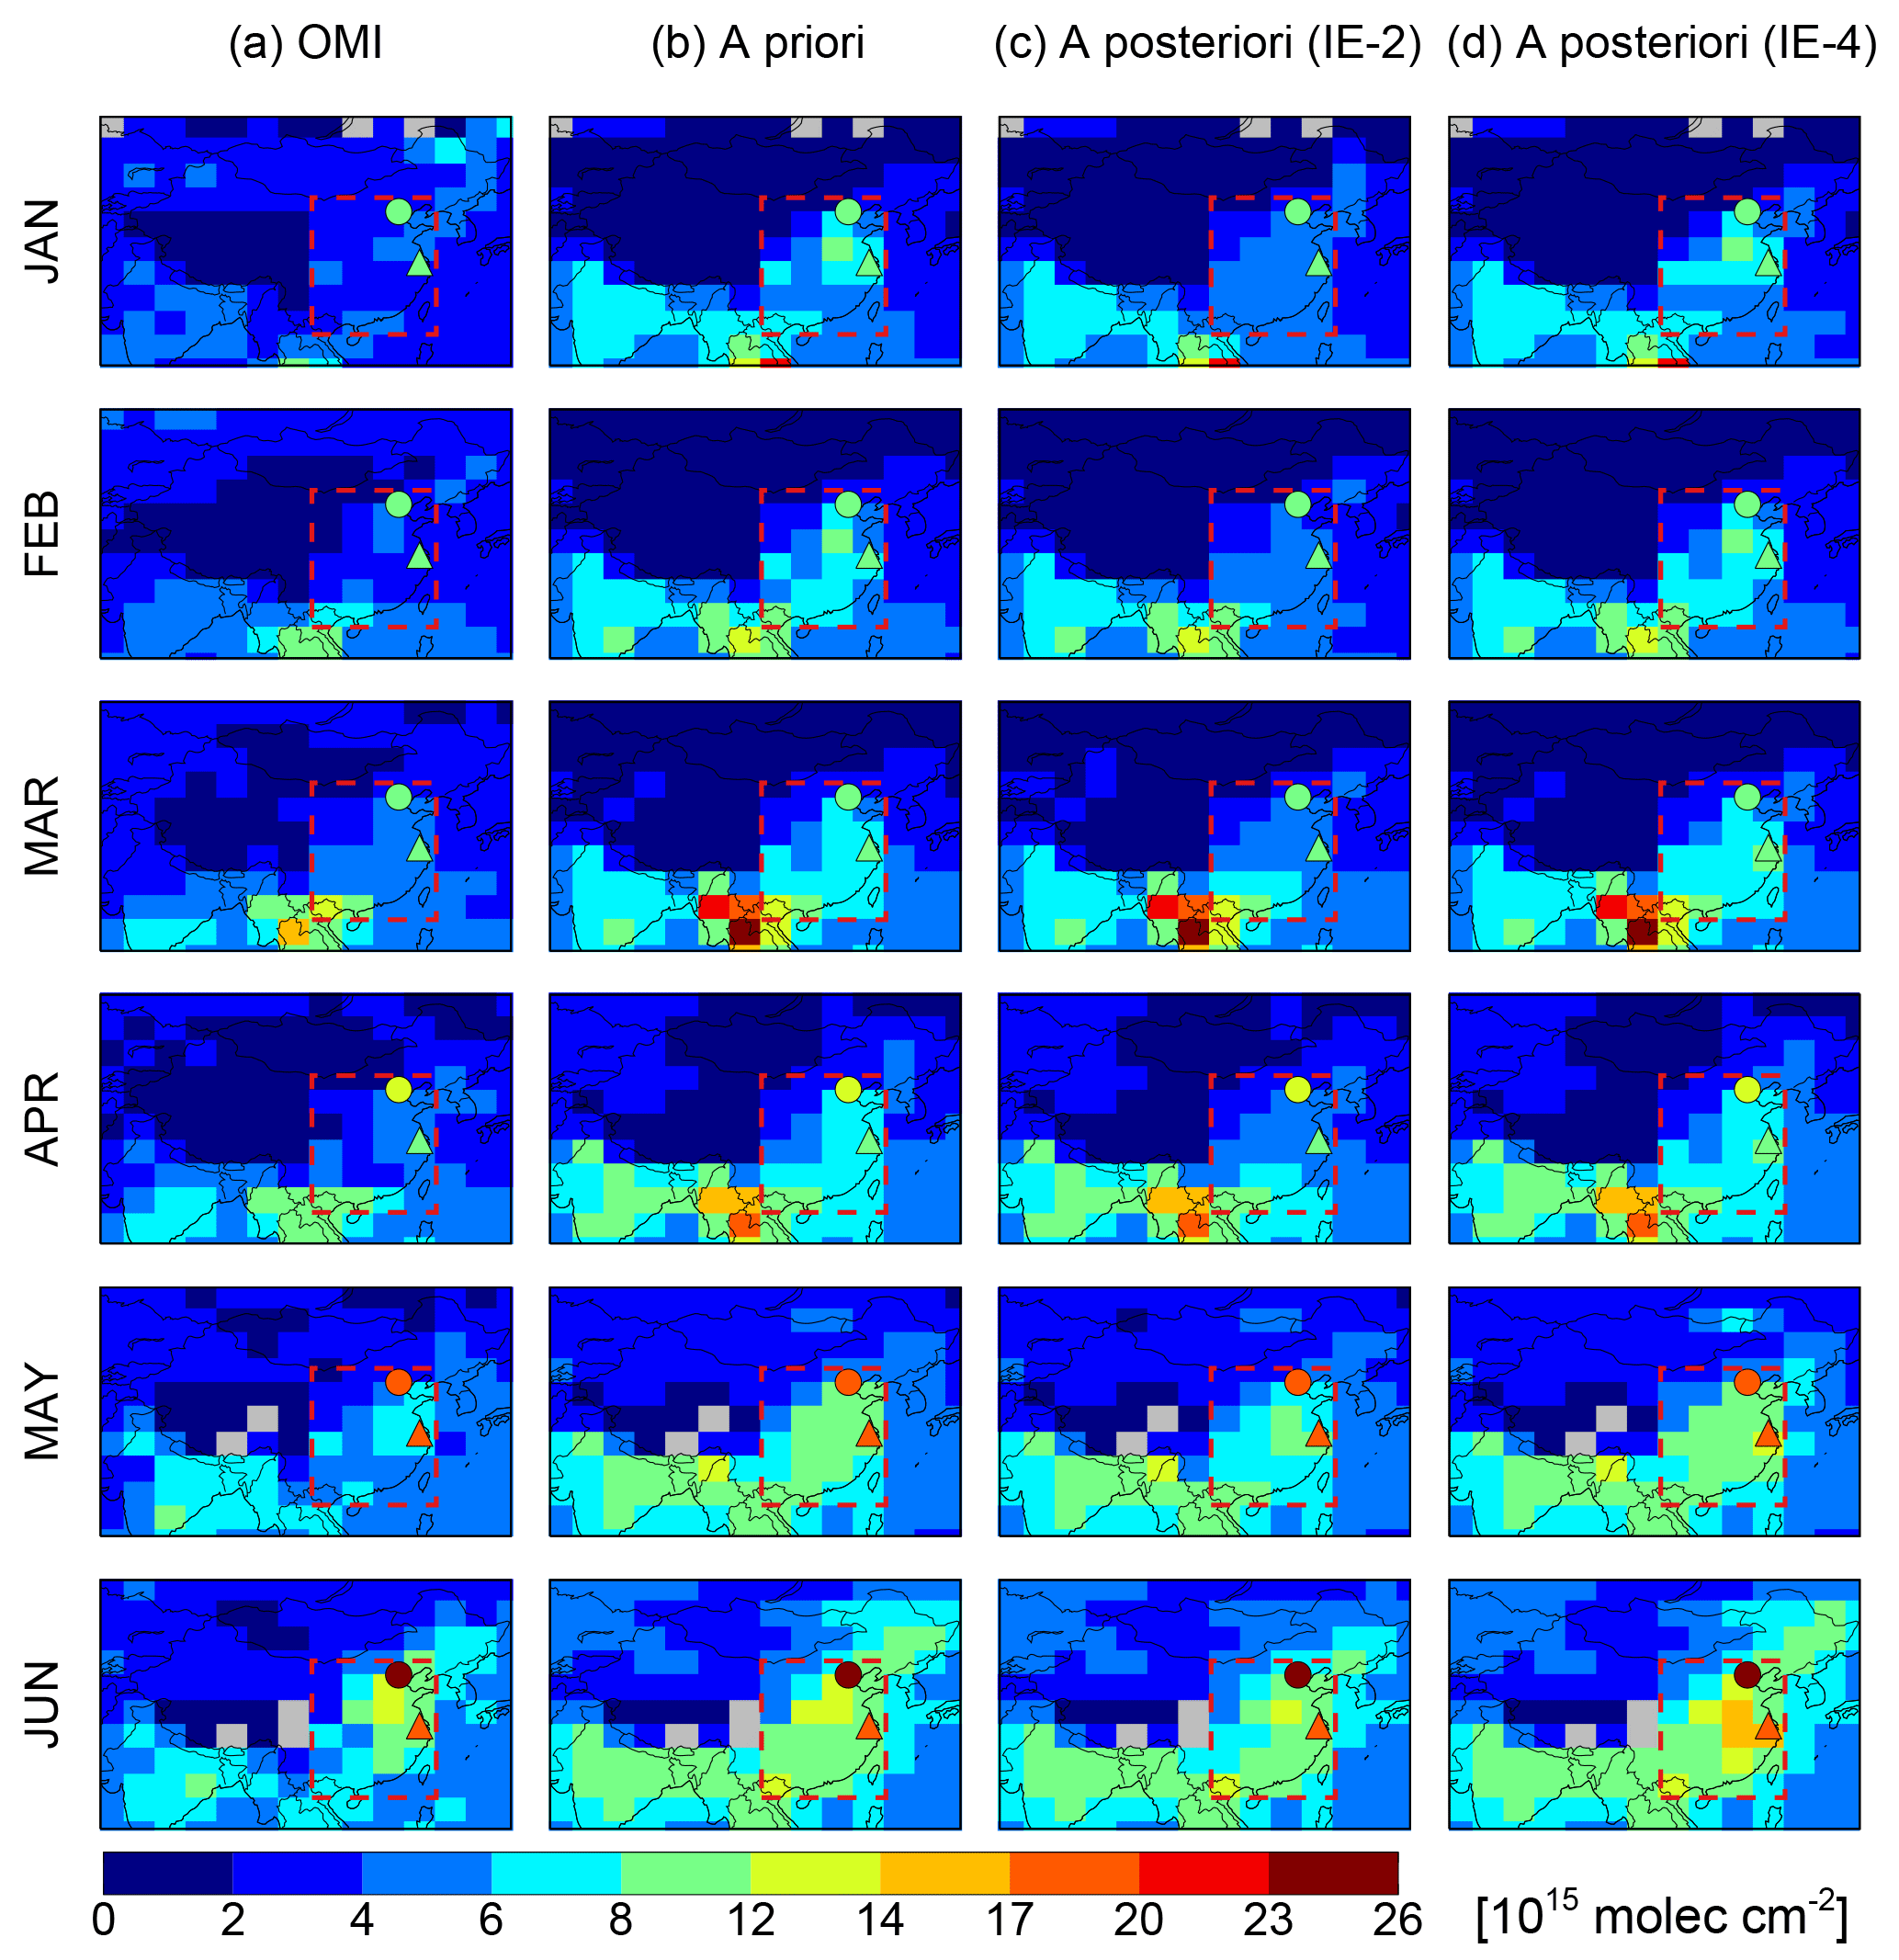
Figure 7Monthly mean formaldehyde VCDs over China from January to June. For each month, the panels from left to right show (a) formaldehyde VCDs observed by OMI, (b) formaldehyde VCDs simulated by the model using a priori emission estimates, (c) the a posteriori formaldehyde VCDs from IE-2, and (d) the a posteriori formaldehyde VCDs from IE-4. All model results were sampled at OMI overpass time. Also shown are ground-based MAX-DOAS measurements at 13:30 LT at Xianghe (monthly mean, circles) and Wuxi (bimonthly mean, upward triangles).
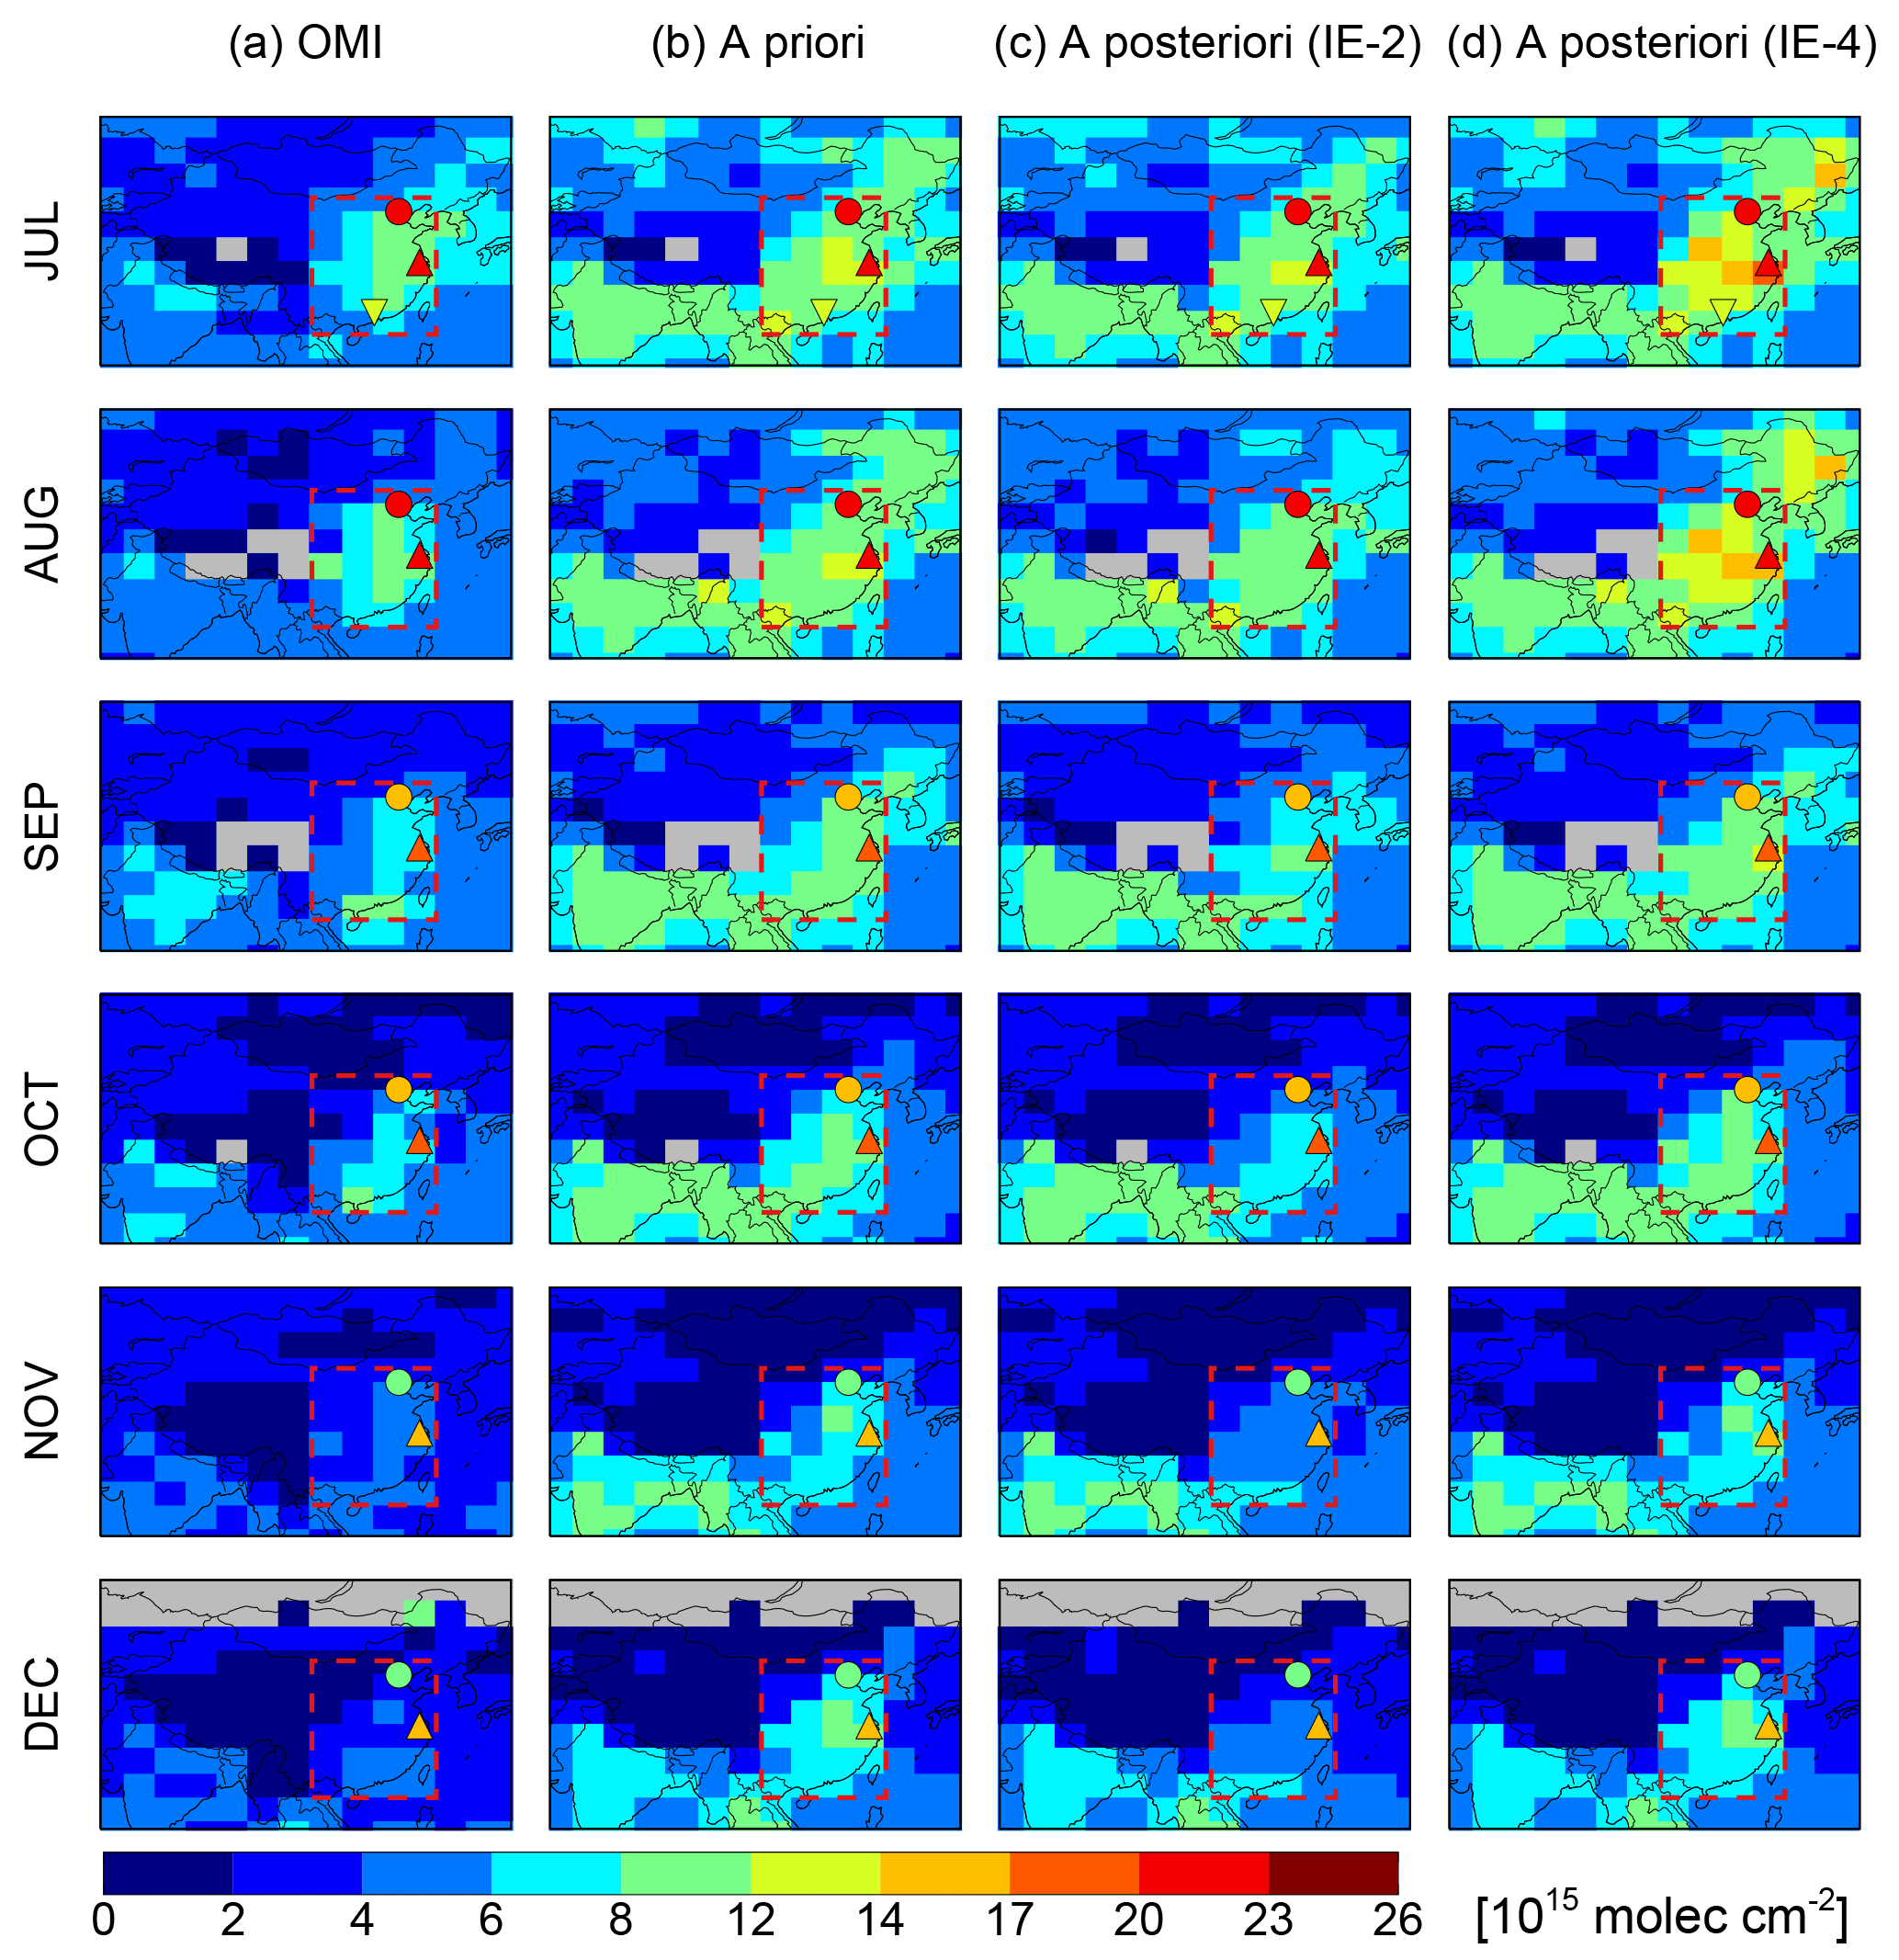
Figure 8Same as Fig. 7 but for July to December. Also shown are ground-based MAX-DOAS measurements at 13:30 LT at Back Garden (July mean, inverted triangles).
Figures 7 and 8 compare the formaldehyde VCDs observed by OMI with those simulated by the model using a priori emission estimates. The spatial patterns and seasonal variations in the formaldehyde VCDs observed by OMI were similar to those observed by GOME-2A, with high formaldehyde over eastern China and during the warmer months. However, the OMI observations were approximately 30 % lower than the GOME-2A observations over eastern China year-round. This difference may be due in part to the different satellite overpass times, or it may be due to the inherent biases between the GOME-2A and OMI formaldehyde VCD retrievals (De Smedt et al., 2012; González Abad et al., 2015). The a priori simulated formaldehyde VCDs (at OMI overpass time) were higher than the OMI observations over eastern China year-round (NMB between 22 % and 70 %, Table S7), suggesting an overestimation of NMVOC emissions year-round. The simulated formaldehyde VCDs at OMI overpass time were also lower than those at GOME-2A overpass time by approximately 20 % in all seasons due to stronger photolysis of formaldehyde in the afternoon in the model. However, the MAX-DOAS measurements at three Chinese sites all showed higher formaldehyde VCDs at the OMI overpass time than at the GOME-2A overpass time (Figs. 3, 4, 7, 8, and S5, and Table S3) (Li et al., 2013; Vlemmix et al., 2015; Wang et al., 2017). Figure S5 showed that the multiyear monthly mean formaldehyde VCDs measured by MAX-DOAS at Xianghe at OMI overpass time (Vlemmix et al., 2015) were significantly higher than both the OMI observations and the model a priori formaldehyde VCDs.
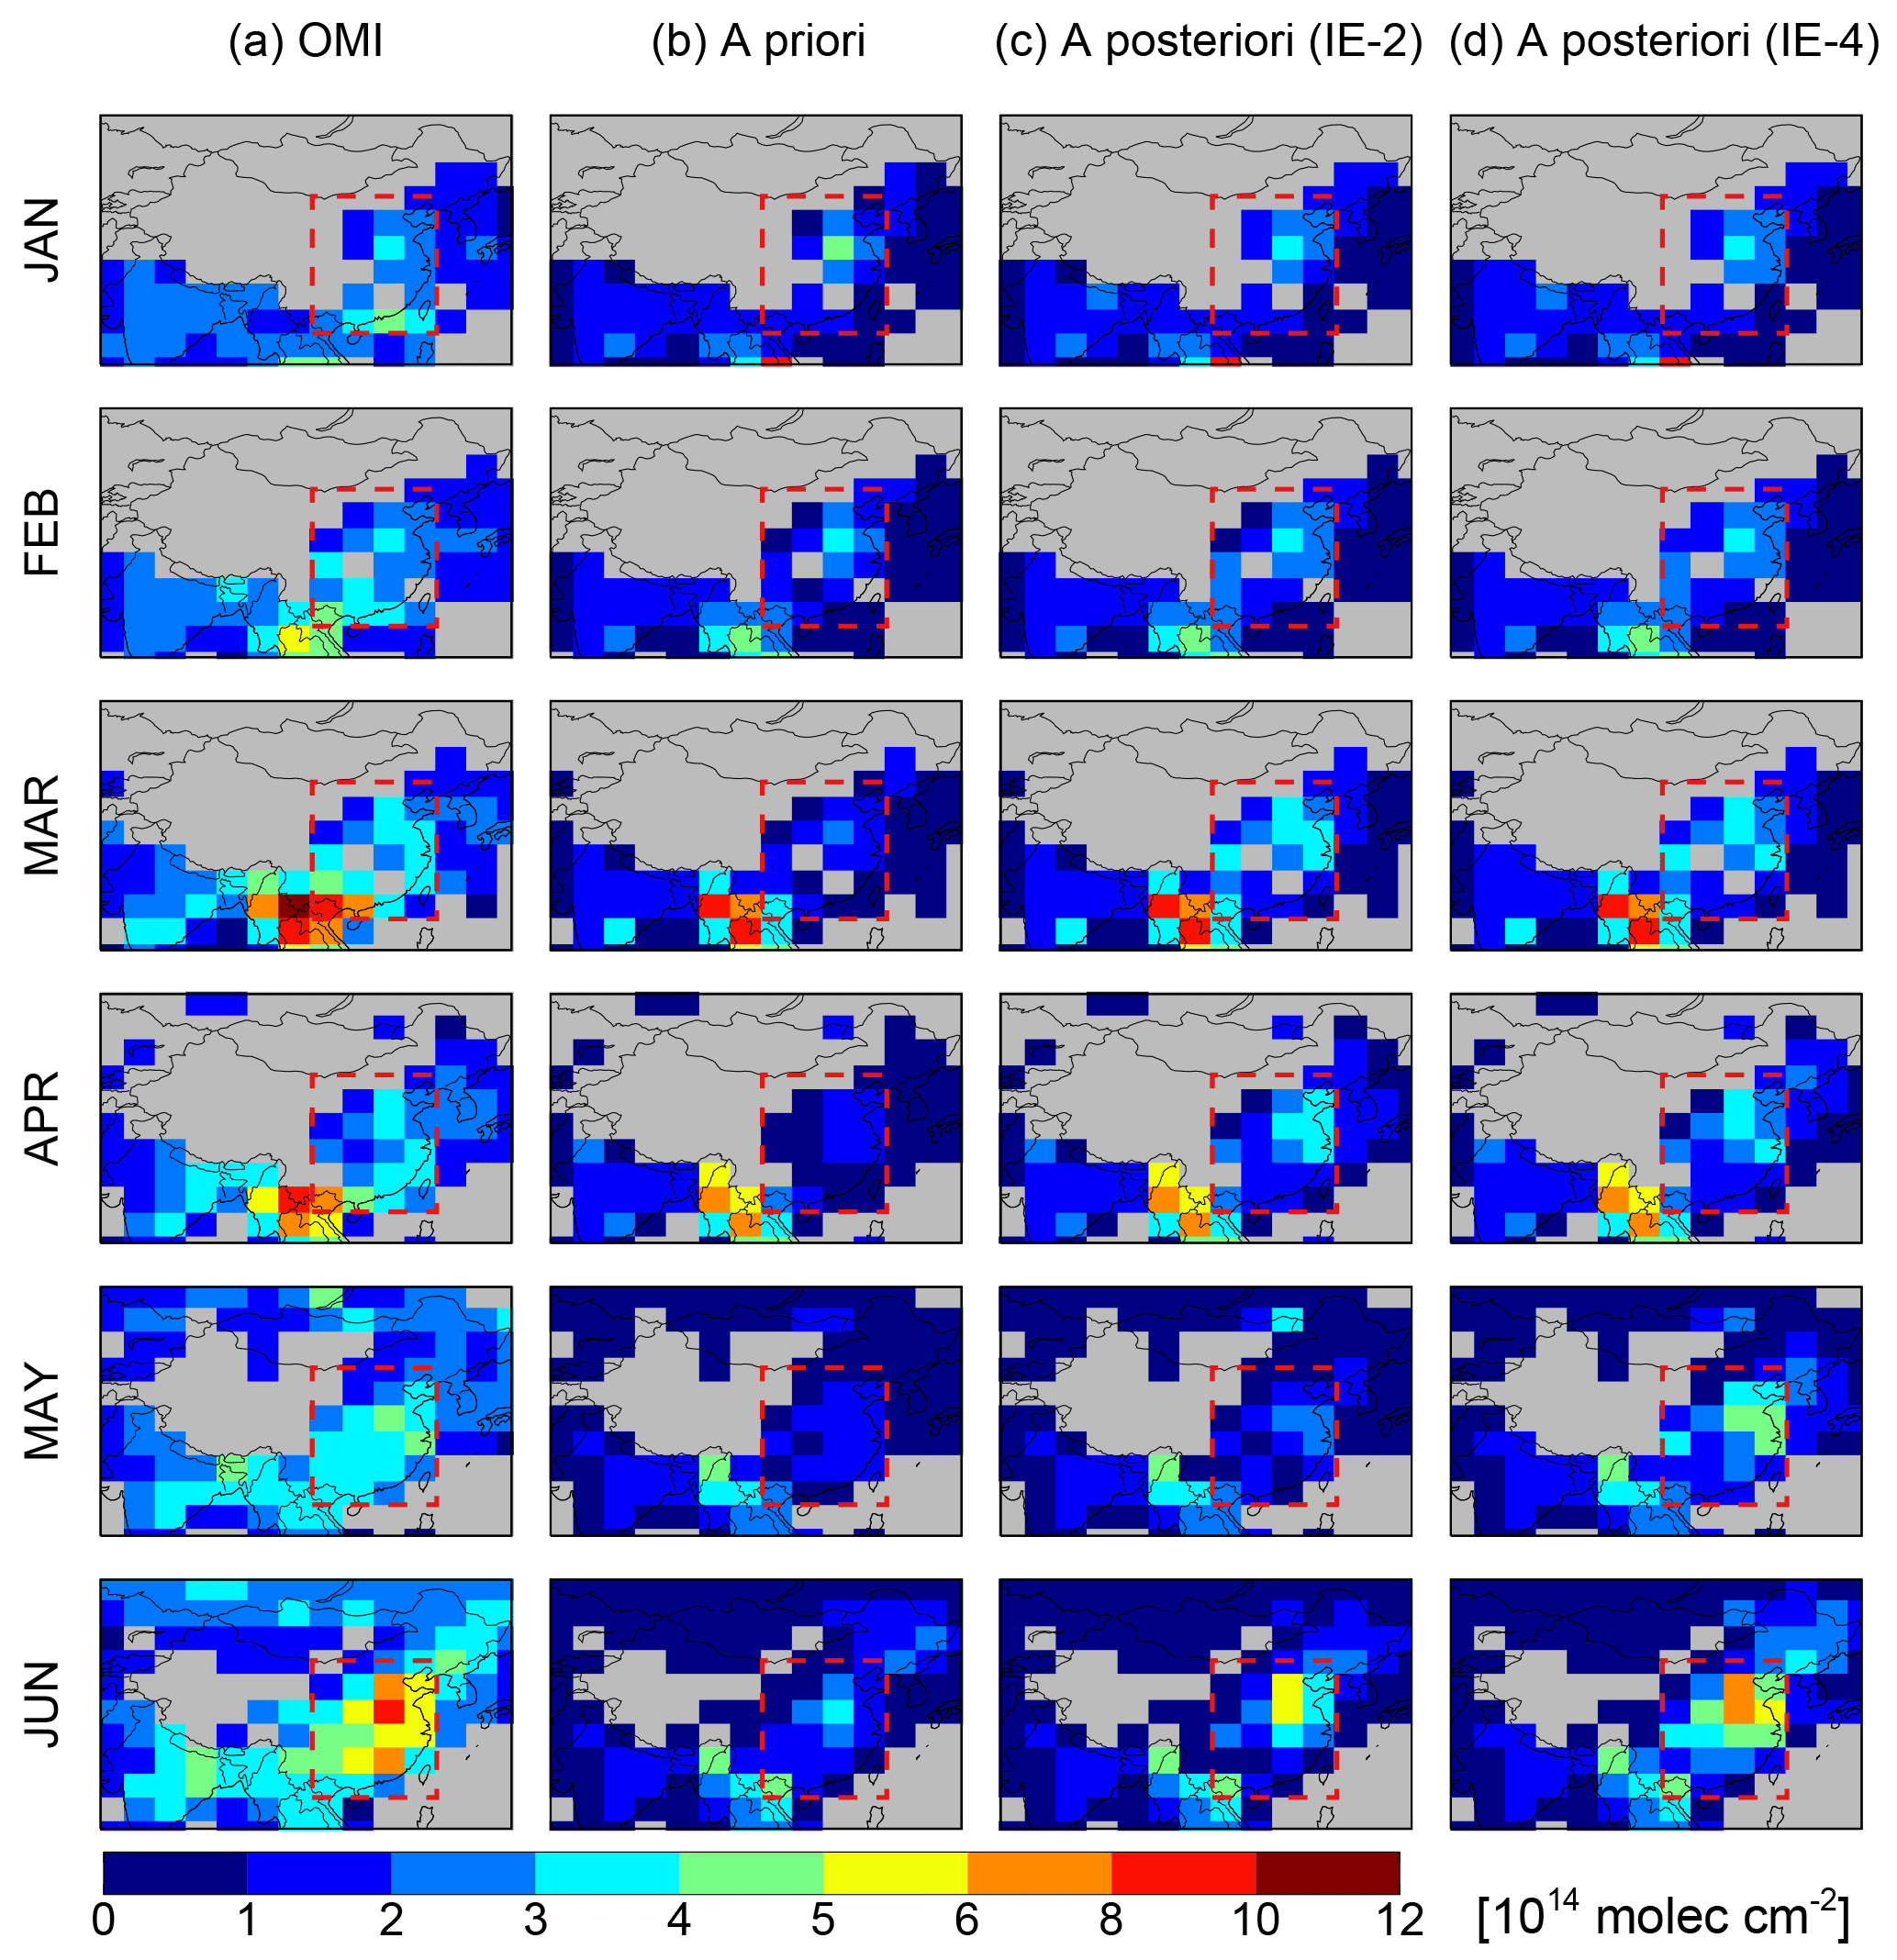
Figure 9Monthly mean glyoxal VCDs over China from January to June. For each month, the panels from left to right show (a) glyoxal VCDs observed by OMI, (b) glyoxal VCDs simulated by the model using a priori emission estimates, (c) the a posteriori glyoxal VCDs from IE-2, and (d) the a posteriori glyoxal VCDs from IE-4. All model results were sampled at OMI overpass time.
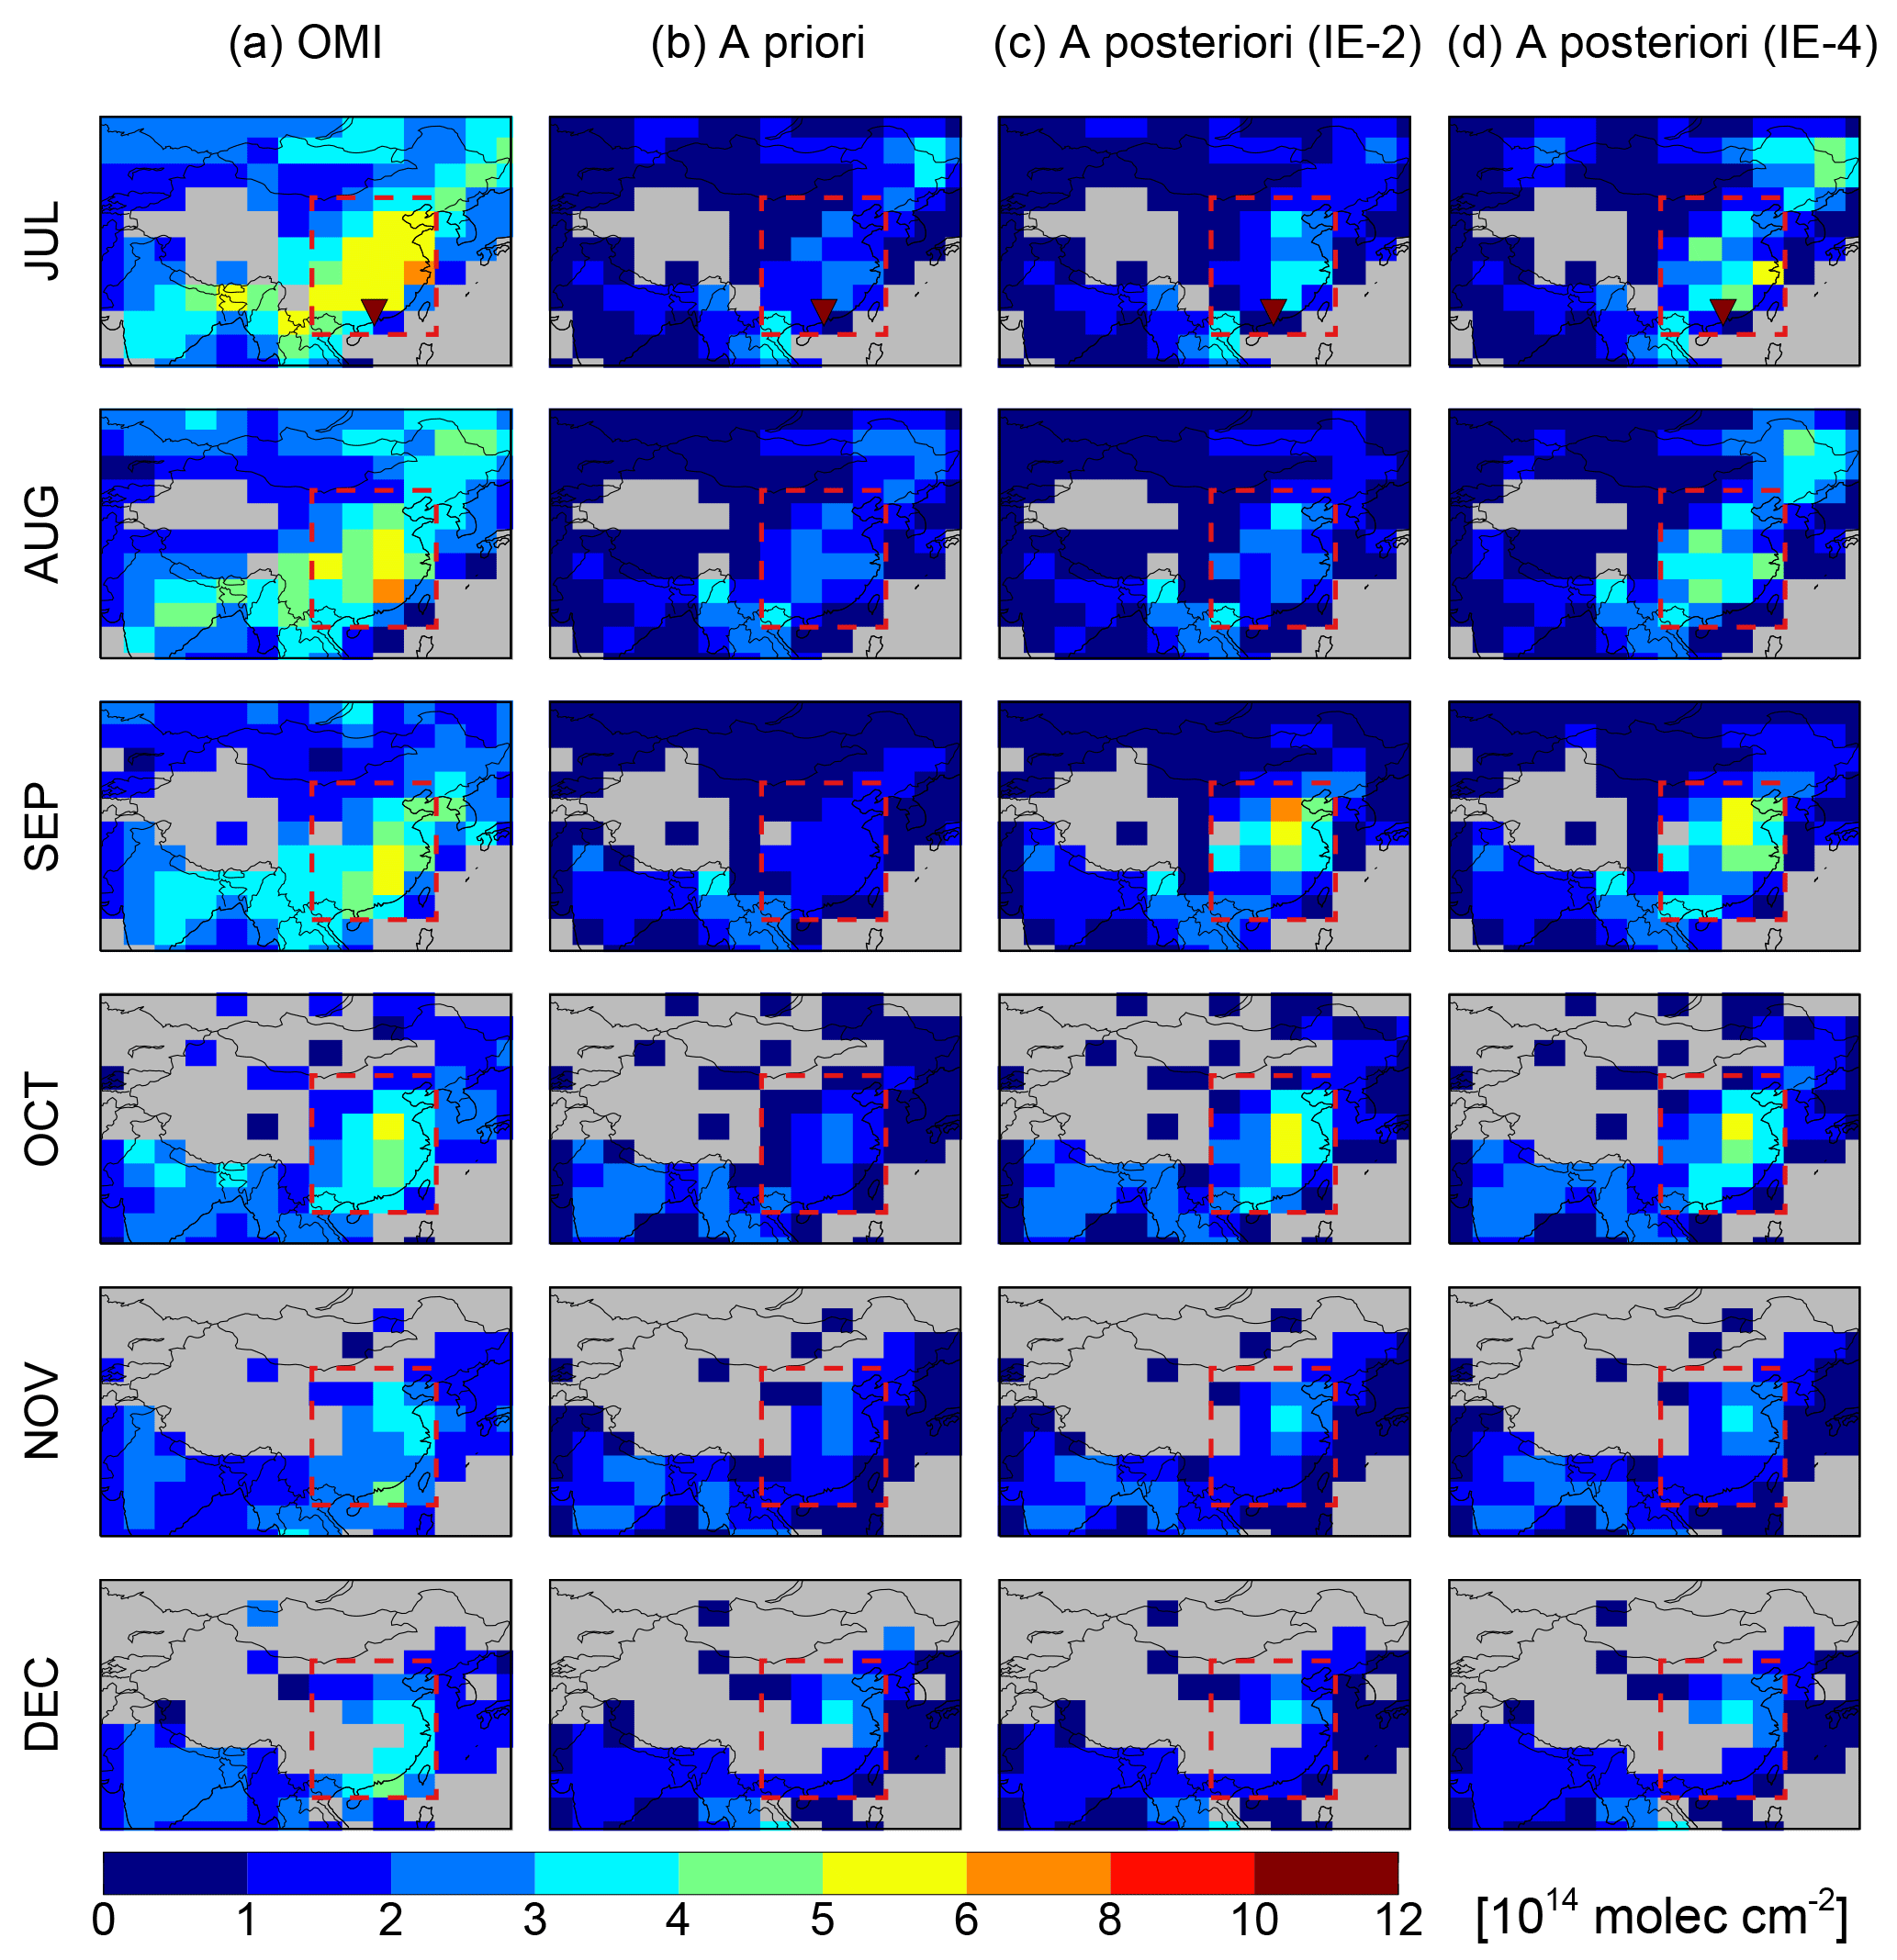
Figure 10Same as Fig. 9 but for July to December. Also shown are ground-based MAX-DOAS measurements at 13:30 LT at Back Garden (July mean, inverted triangles).
Figures 9 and 10 show the monthly mean glyoxal VCDs observed by OMI and those simulated by the model. Valid OMI glyoxal observations were relatively sparse over China, especially during the cold seasons. The seasonal and spatial patterns of the glyoxal VCDs observed by OMI were generally consistent with those observed by GOME-2A over eastern China. However, the glyoxal VCDs observed by OMI were consistently higher than those observed by GOME-2A, except in January. MAX-DOAS measurements of glyoxal at Back Garden in July 2006 were also higher in the afternoon than in midmorning (Li et al., 2013). In contrast, the a priori simulated glyoxal VCDs at OMI overpass time were lower than those at GOME-2A overpass time. This discrepancy among the glyoxal diurnal cycles represented by the MAX-DOAS measurements and the model indicated an uncertainty in the simulated local glyoxal budget. The a priori simulated glyoxal VCDs were lower than the OMI observations throughout the year (NMB between −32 % and −66 %, Table S8) and especially from March to October, indicating an underestimation of NMVOC sources in the a priori year-round.
It thus appeared that the constraints on Chinese NMVOC emissions indicated by the OMI formaldehyde and glyoxal observations were contradictory. Possible causes for this apparent contradiction could be as follows. (1) The chemical production and losses of formaldehyde and glyoxal at different times of the day were not accurately simulated by the model, which would also explain why the MAX-DOAS measurements of formaldehyde and glyoxal VCDs were both higher in the afternoon than in the morning, while the model showed an opposite diurnal contrast. (2) It is also possible that there were different inherent biases in the OMI formaldehyde and glyoxal retrievals.
4.1 A posteriori formaldehyde and glyoxal VCDs from inversion experiments
The qualitative analyses in Sect. 3 showed that the GOME-2A and OMI retrievals of formaldehyde and glyoxal VCDs provided disparate, and apparently contradictory, information on seasonal Chinese NMVOC emissions. Therefore, our four inversion experiments using different satellite observations as constraints represented the range of probable top-down estimates given current satellite observations. Here we first examined how the inversion experiments optimized the a posteriori formaldehyde and glyoxal VCDs and the resulting effects on the top-down monthly Chinese NMVOC emission estimates. Figure S7 shows the changes in the normalized cost functions over China in the four inversion experiments. Relative to their respective initial cost function values, the optimized cost function values were reduced by 8 % to 75 % for all four experiments. The unusually modest 8 % reduction occurred in the optimization in IE-3 for April. In that case, the initial cost function value was small; i.e., the a priori formaldehyde VCDs were already in good agreement with 1.7 times the GOME-2A formaldehyde VCDs (Fig. 3 and Table S5). Figure 2 shows the top-down monthly Chinese NMVOC emission estimates from the four inversion experiments and compares them against the a priori emission estimates. Figure S6 compares the a priori and a posteriori emission estimates for anthropogenic glyoxal precursors.
Figures 3 to 6 show the a posteriori simulated monthly mean formaldehyde and glyoxal VCDs from the GOME-2A formaldehyde and glyoxal inversion experiment (IE-1). Overall, IE-1 greatly improved the agreement between the a posteriori VCDs and the GOME-2A observations for both formaldehyde (Table S4) and glyoxal (Table S6) over eastern China for most months. The optimization was especially effective in optimizing the spatial pattern of the a posteriori formaldehyde VCDs, such that the a posteriori R against the GOME-2A formaldehyde VCDs exceeded 0.85 over eastern China for all 12 months (Table S4). Relative to the a priori VCDs, the a posteriori VCDs of formaldehyde and glyoxal both decreased over the NCP in winter and increased over eastern China between May and September. During the transition months of April and October, the a posteriori formaldehyde VCDs decreased relative to the a priori, while the a posteriori glyoxal VCDs increased relative to the a priori. Figures 2 and S6 illustrated how these changes in a posteriori formaldehyde and glyoxal VCDs affected the top-down monthly NMVOC emission estimates. For IE-1, the estimated emissions of all NMVOC species were reduced in winter but enhanced between May and September. In April and October, however, IE-1 decreased the total NMVOC emissions while preferentially increasing the emissions of anthropogenic glyoxal precursors.
Figures 7 to 10 show the a posteriori monthly mean formaldehyde and glyoxal VCDs from the OMI formaldehyde and glyoxal inversion experiment (IE-2). IE-2 was effective in reducing the a posteriori formaldehyde VCDs over eastern China year-round to better agree with the OMI formaldehyde observations (Table S7). However, IE-2 increased the a posteriori glyoxal VCDs only slightly and was less effective in bringing agreement with the OMI glyoxal observations (Table S8). Figure 2 shows that the a posteriori NMVOC emission estimates from IE-2 were lower than the a priori estimates for all months. This was due to a combination of factors at work in the inversion. The low formaldehyde observations from OMI in all months drove a large reduction in the emissions of NMVOCs that produced only formaldehyde (≥C4 alkanes and ≥C3 alkenes from anthropogenic activities, as well as primary formaldehyde from biomass burning). At the same time, the relatively high glyoxal observations from OMI drove an increase in the emissions of NMVOCs that produced mainly glyoxal (ethene, ethyne, and aromatics from anthropogenic activities, as well as primary glyoxal from biomass burning). For precursors that produced large amounts of both formaldehyde and glyoxal (most importantly biogenic isoprene), the inversion reduced the top-down emissions as the formaldehyde observations had more weight in the cost function than the glyoxal observations due to the lower observational errors in the formaldehyde VCDs. These findings showed the importance of well-characterized retrievals with reliable error estimates in inversion studies.
Figures 3 and 4 showed the a posteriori formaldehyde VCDs from the inversion experiment IE-3, which was constrained by the GOME-2A-observed formaldehyde VCDs scaled by a factor of 1.7. The a posteriori formaldehyde VCDs in IE-3 increased further over eastern China during the warmer months relative to IE-1, especially over the NCP and central China in summer. In December and January, the scaled-up GOME-2A observations over eastern China were still lower than the simulated formaldehyde VCDs using the a priori emissions, leading to a reduction in the a posteriori formaldehyde VCDs over eastern China (Table S5). Figure 2 shows that the top-down monthly emission estimates for all NMVOC species were lower than the a priori in November, December, January, and February and higher than the a priori for the warmer months. Consequently, although no observations of glyoxal were used as constraints in IE-3, the a posteriori glyoxal VCDs also decreased in winter and increased in summer, which was in better agreement with the GOME-2A observations (Figs. 5 and 6). This is consistent with our analyses in Sect. 3: the constraints exerted by the GOME-2A formaldehyde and glyoxal observations were consistent in winter and in summer, when the NMVOC emissions were dominated by anthropogenic and biogenic sources, respectively. However, IE-3 had almost no effects on the a posteriori glyoxal VCDs and the top-down emission estimates of anthropogenic glyoxal precursors in April and October. This demonstrated the necessity of glyoxal observations in constraining the emissions of NMVOC species that preferentially produced glyoxal, including most importantly the aromatics.
The impacts of satellite glyoxal observations on constraining Chinese glyoxal precursor emission estimates were further demonstrated in IE-4. Figures 9 and 10 show that the a posteriori glyoxal VCDs from IE-4 were in better agreement with the OMI glyoxal observations for all months (Table S8). Figures 2 and S6 show that this increase in the a posteriori glyoxal VCDs in IE-4 was achieved by substantially increasing the emission estimates of anthropogenic glyoxal precursors for all months. In summer, the emissions of biogenic isoprene (precursor to both glyoxal and formaldehyde) also increased. As a result, the a posteriori formaldehyde VCDs in IE-4 increased in summer but remained similar to the a priori simulation for the other months (Figs. 7 and 8, Table S7).
Figure S4 also compared the model a posteriori formaldehyde VCDs in 2007 against the GOME-2 observations, the model a priori formaldehyde VCDs, and the MAX-DOAS measurements (during 2010–2016) at Xianghe at GOME-2 crossing time. Compared to the a priori, our a posteriori formaldehyde VCDs were in better agreement with the seasonal variation in the MAX-DOAS measurements (R values increased from 0.81 for the a priori to 0.95 for IE-1 and 0.93 for IE-3). During the warm months (May to September), the monthly a posteriori formaldehyde VCDs from IE-1 and IE-3 bracketed the interannual variation in monthly formaldehyde VCDs measured by MAX-DOAS. For the rest of the year, both the GOME-2A observations and the a posteriori formaldehyde VCDs were systematically biased low relative to the MAX-DOAS measurements. As discussed before, these biases could not be fully accounted for by the interannual variability in the local formaldehyde VCDs and were thus likely due to sampling or retrieval difference between the MAX-DOAS and the satellite.
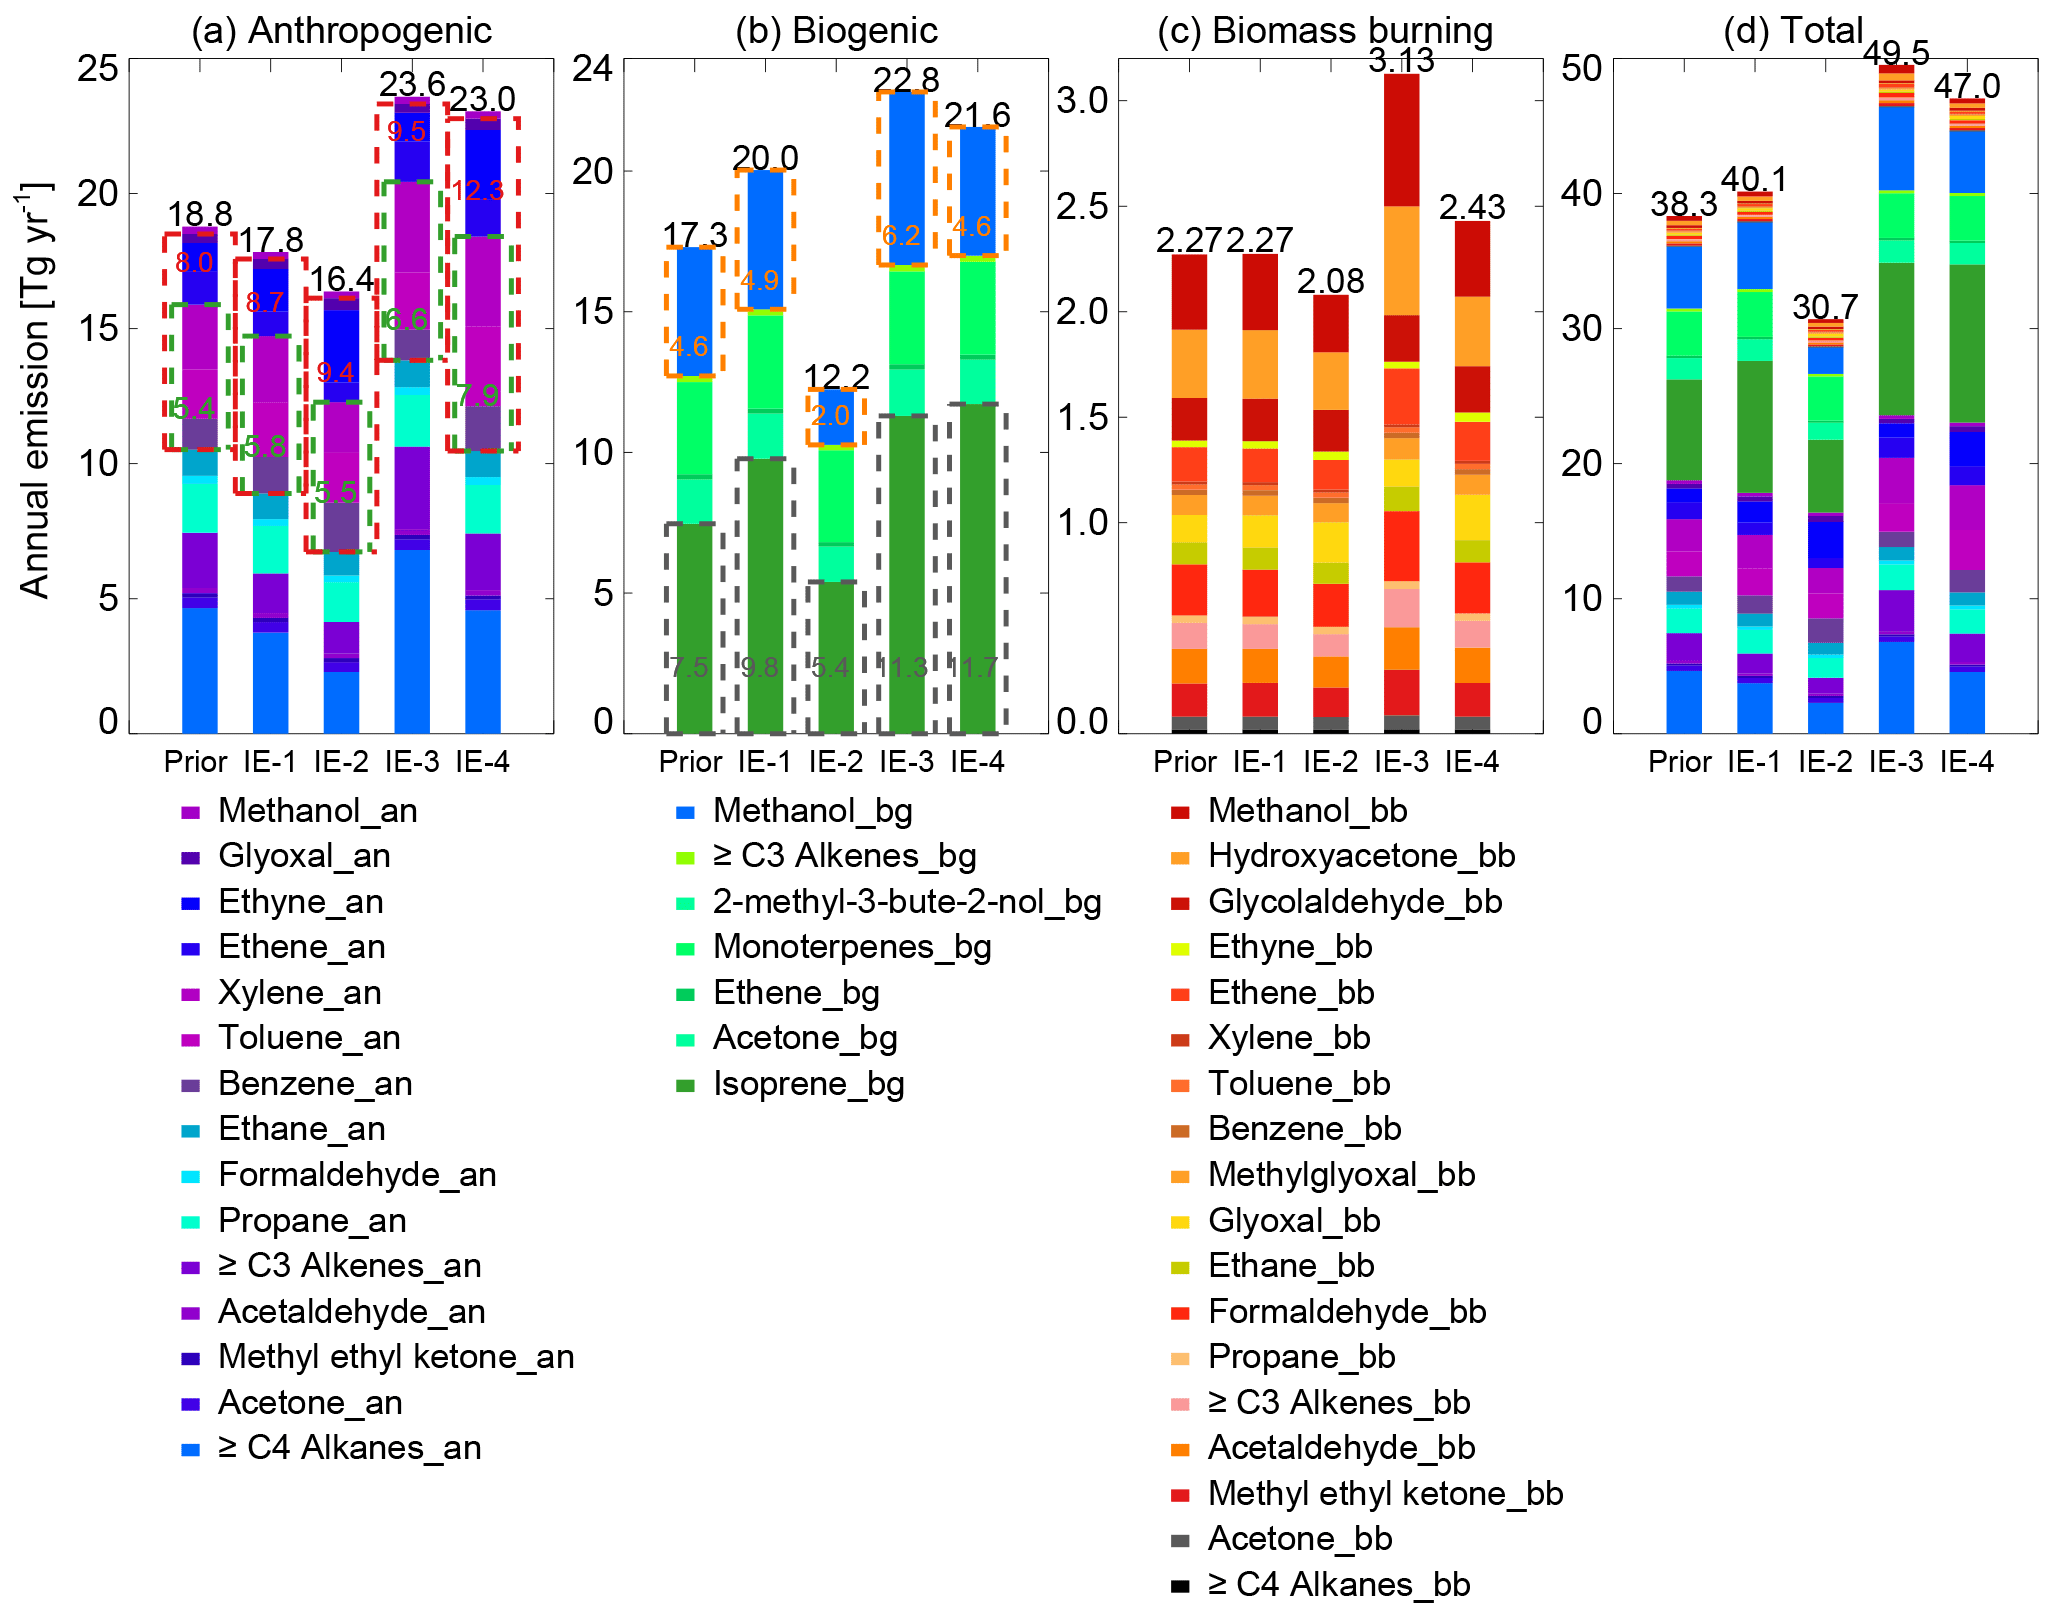
Figure 11Comparison of estimates of annual Chinese NMVOC emissions from (a) anthropogenic, (b) biogenic, (c) biomass burning, and (d) total sources. For each panel, the bars from left to right are the a priori estimates and the a posteriori estimates from IE-1, IE-2, IE-3, and IE-4. Annual total NMVOC emissions are shown in black numbers on top of each bar. The red dashed boxes and red numbers in (a) indicate annual emissions of anthropogenic glyoxal precursors. The green dashed boxes and green numbers in (a) indicate annual emissions of anthropogenic aromatics. The grey dashed boxes and grey numbers in (b) indicate annual biogenic isoprene emissions. The orange dashed boxes and orange numbers in (b) indicate annual biogenic methanol emissions. Color keys to NMVOC species are shown at the bottom, with suffixes of “an”, “bg”, and “bb” indicating anthropogenic source, biogenic source, and biomass burning source, respectively.
4.2 Top-down estimates of Chinese NMVOC emissions from inversion experiments
Table 1 and Fig. 11 show the top-down estimates for Chinese annual NMVOC emissions from the four inversion experiments and compare them against the a priori. Our annual total top-down estimates for Chinese NMVOCs ranged from 30.7 to 49.5 Tg yr−1, compared to the 38.3 Tg yr−1 of the a priori. The highest top-down estimate was from IE-3, constrained by 1.7 times the GOME-2A formaldehyde VCD observations. The lowest top-down estimate was from IE-2, mainly driven by the relatively low formaldehyde observations from OMI.
Anthropogenic sources constituted 44 %–53 % of the total top-down NMVOC emissions. The lowest total top-down anthropogenic emission estimate was from IE-2 (16.4 Tg yr−1). All four inversion experiments consistently showed larger annual emissions of anthropogenic glyoxal precursors than the a priori (Fig. 11). In particular, our top-down estimates for anthropogenic aromatics ranged from 5.5 to 7.9 Tg yr−1, consistently larger than the a priori of 5.4 Tg yr−1 (Li et al., 2017). The highest top-down anthropogenic glyoxal precursors (including aromatics, ethyne, ethane, and glyoxal) emission estimate was from IE-4 (12.3 Tg yr−1), which reflected the strong impacts of the OMI glyoxal observations on constraining anthropogenic NMVOC emissions.
The top-down estimates for biogenic NMVOC emissions from IE-1, IE-3, and IE-4 ranged between 20.0 and 22.8 Tg yr−1 (top-down biogenic isoprene emission estimates between 9.8 and 11.7 Tg yr−1), which were significantly larger than the a priori. As a result, the contrast between the NMVOC emissions in summer and those in winter was greatly enhanced in the top-down estimates in these three inversion experiments, relative to the a priori (Fig. 2). The exception was IE-2, which estimated the biogenic NMVOC emissions to be 12.2 Tg yr−1 (including 5.4 Tg yr−1 of isoprene). The top-down estimate for biomass burning NMVOC emissions from the four inversion experiments was between 2.08 and 3.13 Tg yr−1, with the largest top-down estimate driven by the scaled-up GOME-2A formaldehyde VCDs (IE-3).
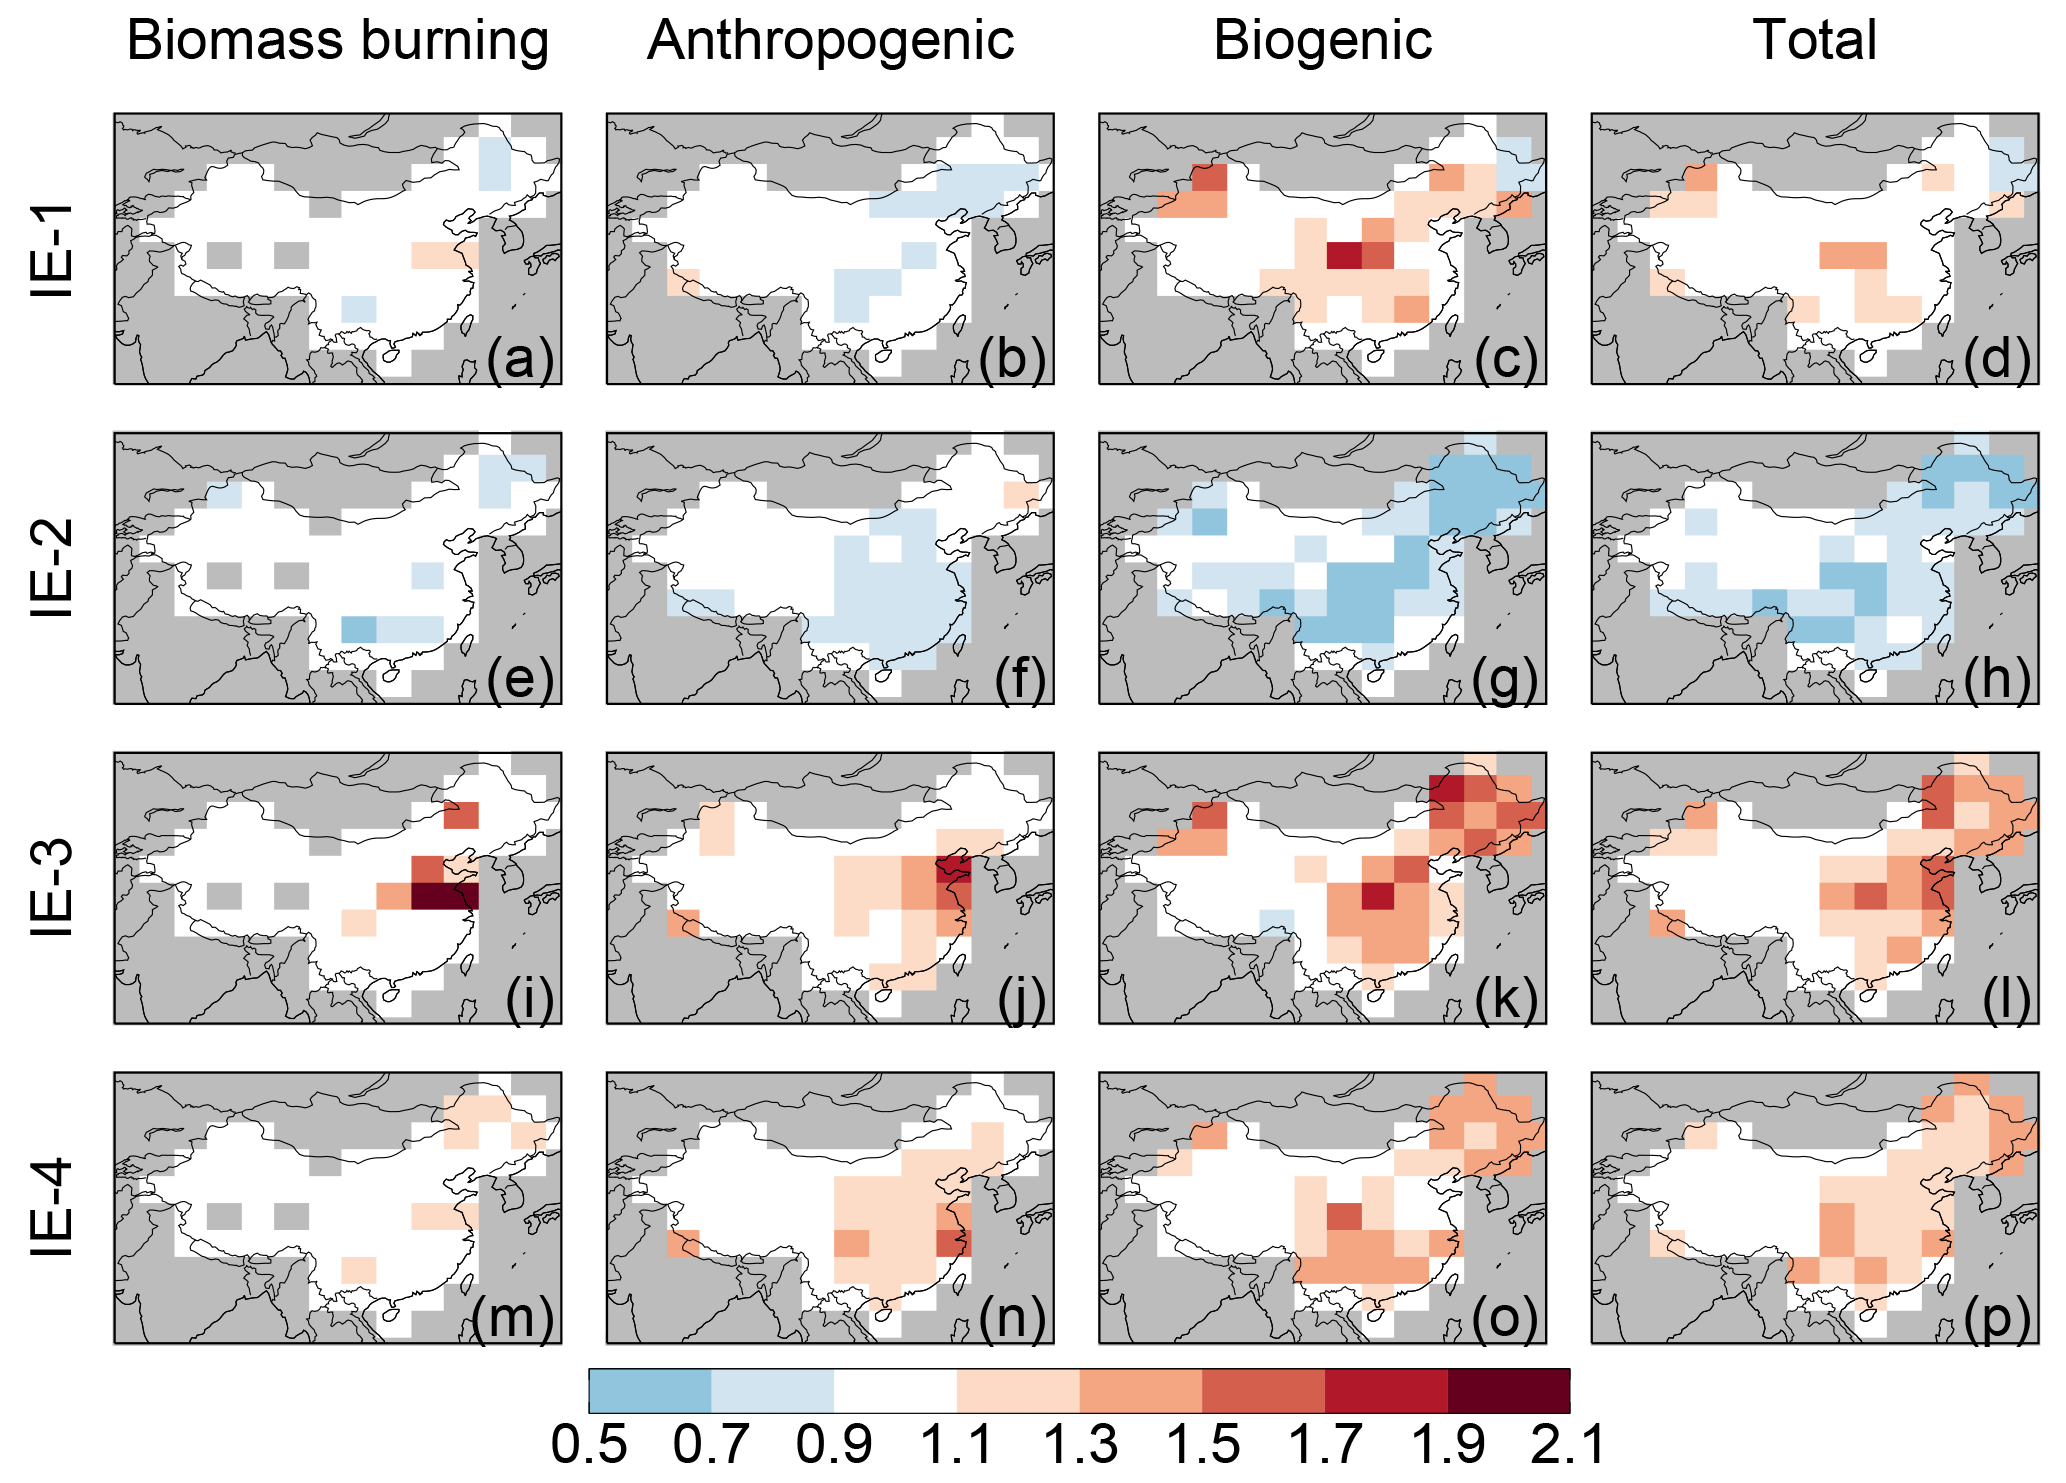
Figure 12Spatial distributions of the optimized scale factors for annual Chinese NMVOC emissions, relative to the a priori emission estimates, for the four inversion experiments.
Figure 12 shows the spatial distribution of the scale factors for the Chinese annual NMVOC emissions from each of the four inversion experiments relative to the a priori emission estimates. The use of GOME-2A formaldehyde and glyoxal observations as constraints in IE-1 led to a domain-wide increase in biogenic NMVOC emissions, except in the northeast. IE-1 also found an increase in biomass burning emissions over the NCP in June. In contrast, anthropogenic NMVOC emissions were slightly reduced over northeast, north, and southwest China. In IE-3, the annual NMVOC emissions over eastern China increased for all three sources, due to constraints exerted by the scaled-up GOME-2A formaldehyde VCDs. The optimized emission scale factors from IE-2 and IE-4 were of opposite signs. Using only OMI glyoxal observations as constraints in IE-4 led to a domain-wide increase in NMVOC emissions from all sectors. However, when constraints of the relatively low OMI formaldehyde observations were added in IE-2, the top-down NMVOC emission estimates decreased across the domain.
As discussed previously, our four inversion experiments using different satellite retrievals as constraints represented the range of probable top-down estimates given by currently available satellite observations. To represent the difference between these top-down estimates relative to the a priori, we averaged the top-down estimates from the four inversion experiments. Our averaged top-down estimate for Chinese total annual NMVOC emissions was 41.9 Tg yr−1, including 20.2 Tg yr−1, 19.2 Tg yr−1, and 2.48 Tg yr−1 from anthropogenic, biogenic, and biomass burning sources, respectively. Our average emission estimate for anthropogenic aromatic emissions was 6.5 Tg yr−1, which was 20 % larger than the a priori estimate of Li et al. (2017).
Figure 1 shows the spatial distributions of our averaged top-down Chinese NMVOC emissions and the scale factors relative to the a priori estimate. Our averaged top-down estimates for Chinese NMVOC emissions were spatially consistent with the a priori estimate, but the total fluxes were larger than the a priori estimate throughout eastern China by 10 % to 30 %. In particular, we found a 40 % increase in the biomass burning emissions over the NCP. We also found a 10 %–30 % increase in the anthropogenic NMVOC emissions in coastal eastern China. Large increases in the biogenic emissions were found near the northwestern border of China and along the northeast-to-southwest division line of vegetation density. This potentially indicated an underestimation of biogenic NMVOC emissions from semiarid ecosystems in the MEGAN inventory.
Table 2Comparison of annual Chinese NMVOC emission estimates for the years 2000 to 2014.
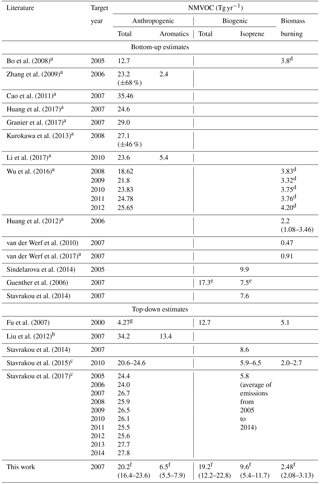
a These emission estimates included some NMVOC species that were not precursors to formaldehyde or glyoxal and therefore not included in this work. See color keys in Fig. 2 for NMVOC species whose emissions were included in this work. b Used SCIAMACHY-observed glyoxal VCDs as constraints. c Used GOME-2A-observed and OMI-observed formaldehyde VCDs as constraints. d Consisted of emissions from open burning of crop residues and from biofuel burning. e Calculated by the GEOS-Chem model using GEOS-5 meteorological data. f Average of top-down estimates from four inversion experiments. g Only anthropogenic emissions of reactive alkenes, formaldehyde, and xylenes from northeastern, northern, central, and southern China were included.
Table 2 compares our top-down estimates of Chinese NMVOC emissions for the year 2007 against estimates in the literature for the years between 2000 and 2014. It should be noted that most bottom-up anthropogenic and biomass burning emission inventories quantified total NMVOC emissions using emission factors for total NMVOCs. As a result, bottom-up estimates for anthropogenic and biomass burning sources often included additional NMVOC species not represented here in our study.
Our top-down estimate for biogenic NMVOC emissions ranges from 12.2 to 22.8 Tg yr−1, on average 11 % larger than the a priori estimate calculated by the MEGAN algorithm (Guenther et al., 2006). Our top-down estimate for isoprene emissions ranged from 5.4 to 11.7 Tg yr−1, bracketing the previous bottom-up estimates of 7.5 to 9.9 Tg yr−1 (Guenther et al., 2006; Stavrakou et al., 2014; Sindelarova et al., 2014). Stavrakou et al. (2015) used GOME-2A formaldehyde VCDs in 2010 to derive a top-down estimate of Chinese isoprene emissions of 5.9 Tg yr−1. Our top-down Chinese isoprene emission estimate constrained by GOME-2A formaldehyde and glyoxal observations (IE-1) was larger at 9.8 Tg yr−1 likely due to the use of additional glyoxal constraints. Stavrakou et al. (2015, 2017) also used the OMI formaldehyde VCDs retrieved by De Smedt et al. (2015) to estimate the mean annual Chinese isoprene emissions during the years 2005 to 2014 to be 5.8 Tg yr−1. Our Chinese annual isoprene emission estimate for 2007 as constrained by OMI formaldehyde and glyoxal VCDs was similar at 5.4 Tg yr−1 (IE-2), despite our use of OMI formaldehyde VCDs retrieved by González Abad et al. (2015), which were systematically lower than those retrieved by De Smedt et al. (2015). This was also likely due to the addition of glyoxal observations as constraints in our IE-2 experiment.
Our top-down estimates for Chinese annual biomass burning NMVOC emissions ranged from 2.08 to 3.13 Tg yr−1, in good agreement with the bottom-up estimates of Huang et al. (2012) and the top-down estimates of Stravrakou et al. (2015) (Table 2). Similar to the findings in Fu et al. (2007) and Stavrakou et al. (2015, 2016), our study also highlighted the large emissions from crop residue burning over the NCP in June, which were severely underestimated in some previous studies. Bo et al. (2008) and Wu et al. (2016) estimated the Chinese biomass burning NMVOC emissions to be 3.32 to 4.2 Tg yr−1, but only 25 % to 30 % of these emissions were from open burning of crop residues; the rest were emitted from biofuel burning, which we categorized as anthropogenic in this study. The GFED3 inventory (van der Werf et al., 2010), based on satellite burned area observations, severely underestimated biomass burning emissions over China, particularly those associated with crop residue burning. The updated GFED4s (van der Werf et al., 2017) partially accounted for emissions for small fires, but its estimate for Chinese biomass burning NMVOC emissions was still lower than our top-down estimates by at least a factor of 2.
Previous bottom-up estimates of Chinese anthropogenic NMVOC emissions ranged widely from 12.7 to 35.46 Tg yr−1 (Bo et al., 2008; Zhang et al., 2009; Cao et al., 2011; Kurokawa et al., 2013; Li et al., 2017; Wu et al., 2016; Granier et al., 2017; Huang et al., 2017) due to the use of different emission factors, activity data, and statistical models. Previous top-down estimates of Chinese anthropogenic NMVOC emissions for the years 2007 to 2014 ranged from 20.6 to 34.2 Tg yr−1 (Liu et al., 2012; Stavrakou et al., 2015, 2017). Our top-down estimates had a smaller range between 16.4 and 23.6 Tg yr−1. Our top-down estimates for anthropogenic aromatics (5.5 to 7.9 Tg yr−1) were approximately middle of the range relative to previous estimates of 2.4–13.4 Tg yr−1. The large difference between previous top-down estimates and our top-down estimates of anthropogenic NMVOCs was predominantly due to the choices of satellite observation constraints, and to a lesser extent due to the choices of chemical transport model, the NMVOC species modeled, and the a priori emission estimates. Specifically, the much higher estimate of anthropogenic aromatic emission by Liu et al. (2012) (13.4 Tg yr−1) compared to our top-down estimates (5.5–7.9 Tg yr−1) was due to (1) the higher glyoxal VCDs observed by the SCIAMACHY instrument compared to those observed by GOME-2A and OMI over China, (2) the assumption made by Liu et al. (2012) that all anomalous glyoxal was produced by aromatics, and (3) the lower yields of glyoxal from aromatics oxidation used in Liu et al. (2012) than those used in our model.
As discussed above, three out of our four inversion experiments showed a stronger summer-versus-winter contrast in the NMVOC emissions, compared to the a priori emissions (Fig. 2). We evaluated the impacts of this stronger seasonal amplitude in NMVOC emissions on surface ozone and secondary organic carbon (SOC) aerosol concentrations by driving the GEOS-Chem model with the a priori NMVOC emission estimates and with the average top-down emission estimates from our four inversion experiments, respectively.
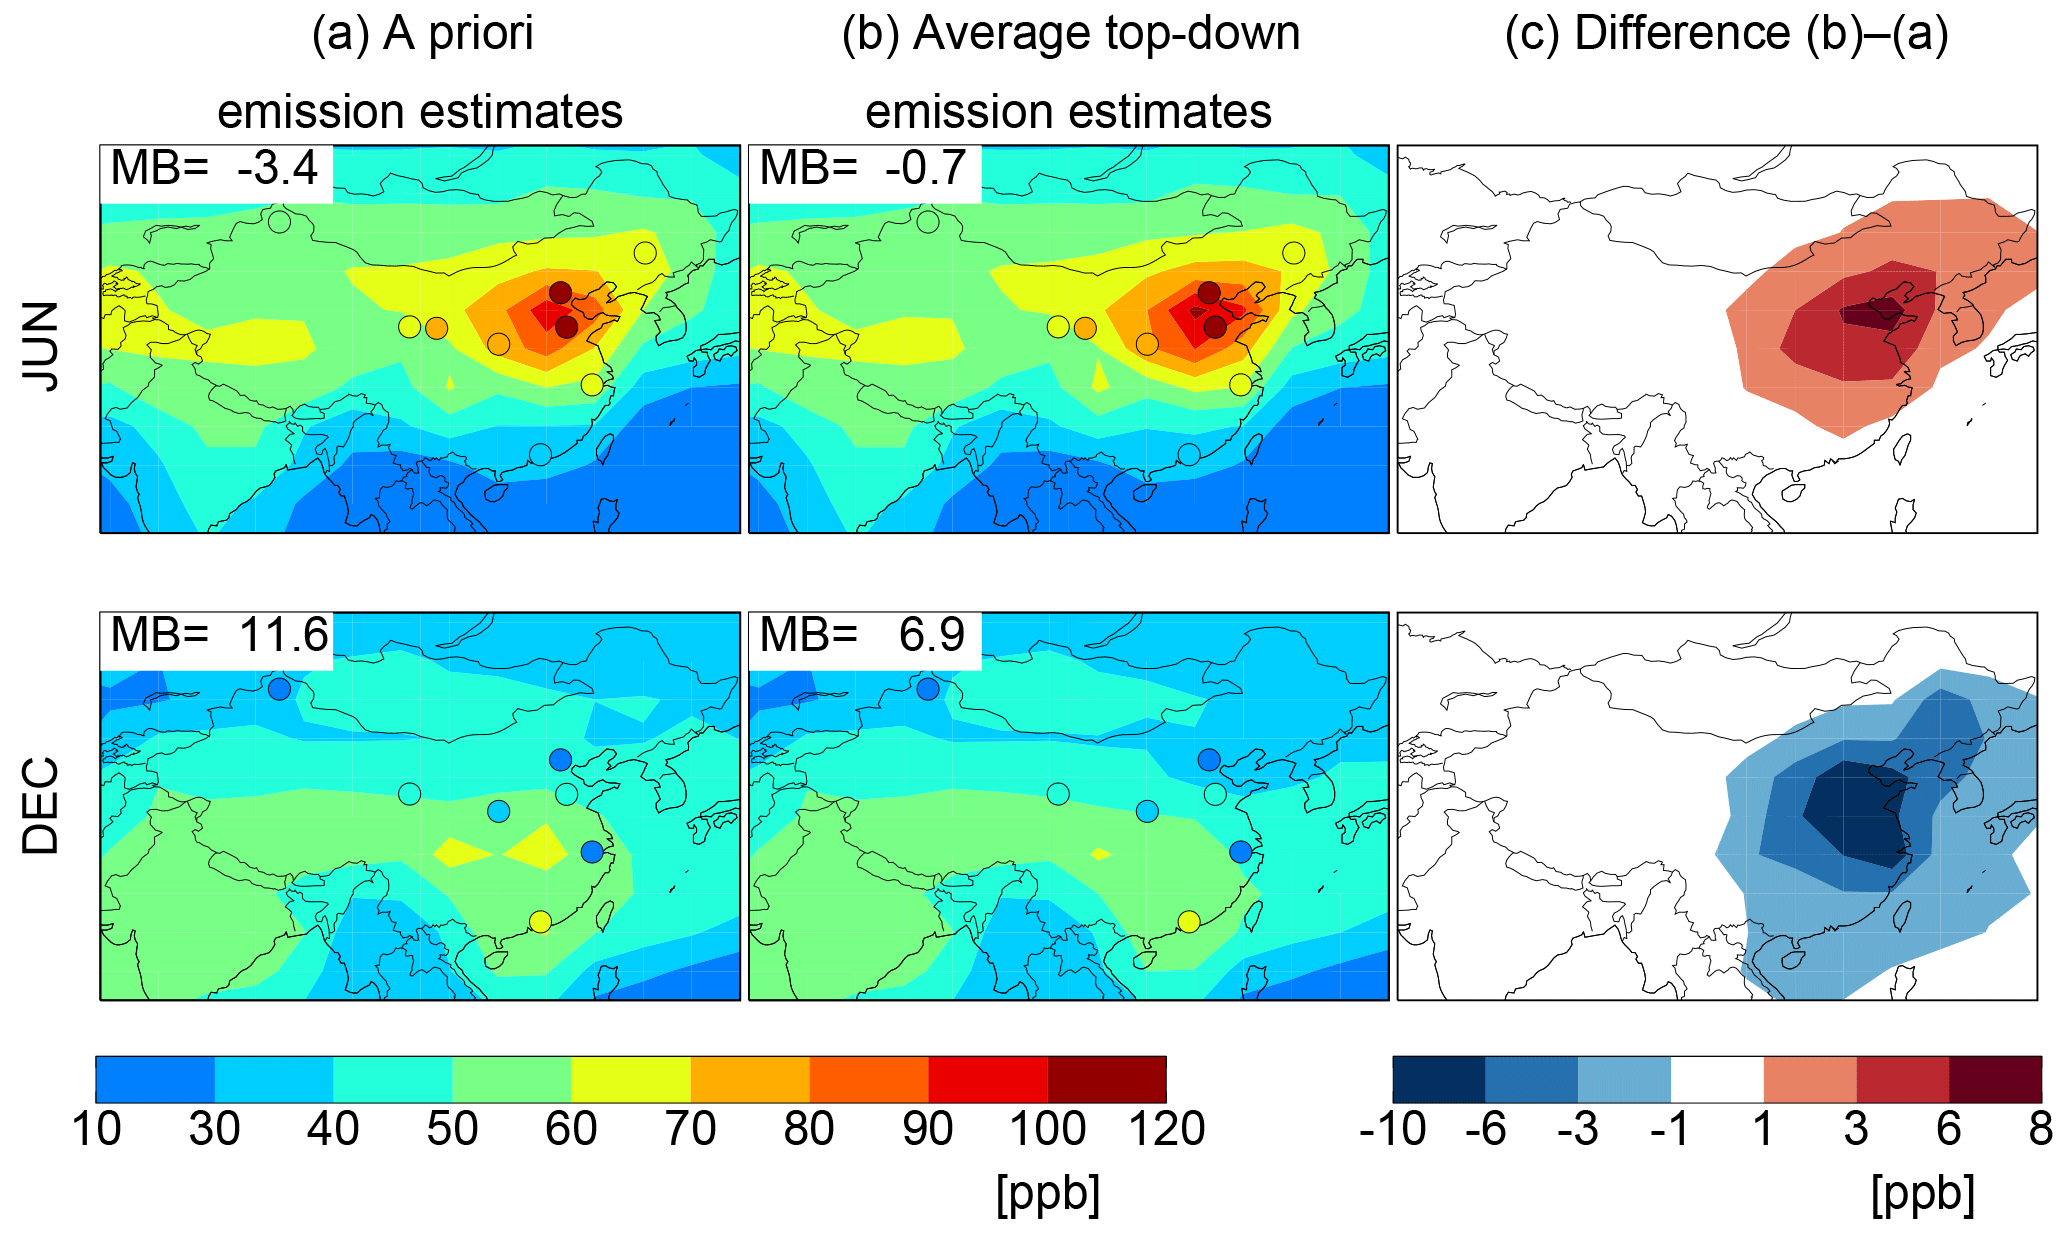
Figure 13Simulated monthly mean afternoon (13:00–17:00 LT) surface ozone concentrations in June and December 2007 driven by (a) the a priori emissions and (b) our average top-down emissions, respectively, as well as (c) the differences. Filled circles show the afternoon surface ozone observations at several sites in China (Table S9). Mean biases (MB) of the simulated concentrations relative to surface measurements are shown in the inset.
Figure 13 compares the monthly mean afternoon (13:00 to 17:00 local time) surface ozone concentrations simulated using our averaged top-down emission estimates against those simulated using the a priori emissions for June and December 2007. We focused here on surface ozone in June and December, when the differences in NMVOC emissions between our averaged top-down estimate and the a priori emission estimate were greatest. Also shown in Fig. 13 are surface observations at representative regional sites (Li et al., 2007; Xu et al., 2008; J. M. Zhang et al., 2009; Zheng et al., 2010; Wang et al., 2012, 2015; Li and Bian, 2015; Sun et al., 2016; Xu et al., 2016) (Table S9). Using the a priori emissions, the highest simulated afternoon surface ozone concentrations were between 90 and 100 ppb over the NCP in June. This was lower than the observations at two sites in the NCP, including at a rural site near Beijing (100 to 120 ppb) and at Mt. Tai (108 ppb). In comparison, by using our averaged top-down NMVOC emission estimate, the simulated afternoon surface ozone concentrations increased by 1 to 8 ppb over eastern China in June and were in better agreement with the observations (reducing the mean bias over eastern China from −3.4 to −0.7 ppb, Table S9). In December, the simulated afternoon surface ozone using the a priori emissions consistently overestimated the observed concentrations in eastern China. In comparison, by using our averaged top-down NMVOC emission estimates, the simulated afternoon surface ozone over eastern China decreased by 1 to 10 ppb, again in better agreement with the observations (mean bias over eastern China reduced from 12 to 6.9 ppb, Table S9). These comparisons for surface ozone corroborated the stronger seasonal amplitude of the top-down NMVOC emissions derived in this study.
Figure S8 compares the simulated monthly mean surface SOC concentrations using our averaged top-down NMVOC emissions against those simulated using the a priori NMVOC emissions for June and December in 2007. Also shown are the SOC measurements at 12 surface sites in June of 2006 and 2007 from Zhang et al. (2012) (Table S10). By driving the model with our average top-down NMVOC emissions, the simulated surface SOC concentrations in June increased by 0.1 to 0.8 µgC m−3 over eastern China relative to the simulation using the a priori NMVOC emissions. This brought the simulated SOC concentrations closer to the measured surface SOC concentrations, but the model still severely underestimated observed SOC concentrations. We note that our version of the GEOS-Chem model only included two pathways for secondary organic aerosol formation: (1) the reversible partitioning of semi-volatile products from the oxidation of isoprene, monoterpenes, and aromatics formation pathways (Liao et al., 2007; Henze et al., 2008) and (2) the irreversible uptake of dicarbonyl by aqueous aerosols and cloud drops (Fu et al., 2008). Other pathways, such as the atmospheric aging of semi-volatile and intermediate-volatility organic compounds, have been shown to be an important source of secondary organic aerosol (Robinson et al., 2007; Pye and Seinfeld, 2010) but they were not included in our version of the GEOS-Chem model. Regardless, the precursors and formation pathways of secondary organic aerosols in China are still poorly understood (Fu et al., 2012), such that no quantitative conclusions can be drawn regarding the impacts of our top-down NMVOC emission estimates on regional secondary organic aerosol formation.
We used the GEOS-Chem model and its adjoint, as well as satellite observations of tropospheric column concentrations of formaldehyde and glyoxal, to constrain monthly Chinese NMVOC emissions from anthropogenic, biogenic, and biomass burning sources for the year 2007. We updated the gas-phase chemistry in the GEOS-Chem model and constructed its adjoint. The a priori NMVOC emission estimates from biogenic, anthropogenic, and biomass burning sources were taken from the inventories developed by Guenther et al. (2006), Li et al. (2014, 2017), and Huang et al. (2012), respectively, as well as van der Werf et al. (2010). We conducted four inversion experiments, which were constrained by the formaldehyde and glyoxal observations from GOME-2A (IE-1), the formaldehyde and glyoxal observations from OMI (IE-2), the formaldehyde observations from GOME-2A scaled by 1.7 (IE-3), and the glyoxal observations from OMI (IE-4). The results from these experiments represented the range of probable top-down NMVOC emission estimates for China given current satellite observation constraints.
Our top-down estimates of total annual Chinese NMVOC emissions from the four inversion experiments ranged from 30.7 to 49.5 Tg yr−1. Our top-down estimates of Chinese anthropogenic NMVOC emissions were 16.4 to 23.6 Tg yr−1. In particular, our top-down estimates for Chinese anthropogenic aromatic emissions ranged from 5.5 to 7.9 Tg yr−1, much smaller than the top-down estimate of 13.4 Tg yr−1 by Liu et al. (2012). Our top-down estimates of Chinese biogenic NMVOC emission ranged from 12.2 to 22.8 Tg yr−1, with 5.4 to 11.7 Tg yr−1 attributed to isoprene. Our top-down estimates for Chinese biomass burning NMVOC emission range from 2.08 to 3.13 Tg yr−1 and were mostly associated with seasonal open burning of crop residue after local harvests, such as that over the NCP in June.
Three out of our four inversion experiments showed a stronger seasonal contrast in the top-down NMVOC emission estimates between summer and winter, relative to the a priori emission estimates. By applying this stronger seasonal contrast in monthly NMVOC emissions in the model, the simulated afternoon surface ozone concentrations over eastern China increased by 1 to 8 ppb in June and decreased by 1 to 10 ppb in December relative to the simulation using the a priori emissions, and the model was brought to better agreement with regional surface ozone measurements. Similarly, compared to the a priori simulation, the simulated monthly mean SOC concentrations driven by our top-down NMVOC emissions increased by 0.1 to 0.8 µgC m−3 over eastern China in June. This increase in simulated SOC concentrations reduced, but did not eliminate, the large low biases in the simulated SOC concentrations relative to the surface measurements in June.
We concluded that formaldehyde and glyoxal observations from GOME-2A and OMI provide quantitative constraints on the monthly emissions of Chinese NMVOCs. In particular, the simultaneous use of the observations of both species helped distinguish NMVOC precursors and thus provided better quantification of individual sources. However, better validation of these satellite data over China is urgently needed, particularly to resolve the apparent discrepancies among different retrievals for the same species. The monthly inversions presented in this work, conducted at 5∘ longitude × 4∘ latitude resolution due to limited computation resources, quantified the Chinese NMVOC emissions on regional and subregional scales. Future inversions and sensitivity studies targeting shorter periods of time may be conducted at finer resolutions to quantify Chinese NMVOC emissions and to evaluate their impacts on photochemistry at city cluster scales.
The datasets including measurements and model simulations can be accessed from websites listed in the references or by contacting the corresponding author (Tzung-May Fu; tmfu@pku.edu.cn).
The supplement related to this article is available online at: https://doi.org/10.5194/acp-18-15017-2018-supplement.
HC and TMF designed and performed the research and wrote the paper; DKH, LZ and YZ contributed towards the development of adjoint model; CM, CL, GA, IS, MR, KC provided the satellite observations; MR, FH, JL, JZ provided the MAX-DOAS measurements; QZ compiled the MEIC emissions. All authors discussed the paper.
The authors declare that they have no conflict of interest.
This work was supported by the Ministry of Science and Technology of China
(2017YFC0209802, 2014CB441303) and the National Natural Sciences Foundation
of China (41461164007). We thank the National Supercomputer Center in
Tianjin for providing computational support and the QA4ECV campaign for
providing the MAX-DOAS measurements at Xianghe. DKH was supported by the
National Strategic Project – Fine Particle of the National Research Foundation
of Korea (NRF) funded by the Ministry of Science and ICT (MSIT), the
Ministry of Environment (ME), and the Ministry of Health and Welfare (MOHW)
(2017M3-D8A1092052).
Edited by: Chul Han Song
Reviewed by: two anonymous referees
Akagi, S. K., Yokelson, R. J., Wiedinmyer, C., Alvarado, M. J., Reid, J. S., Karl, T., Crounse, J. D., and Wennberg, P. O.: Emission factors for open and domestic biomass burning for use in atmospheric models, Atmos. Chem. Phys., 11, 4039–4072, https://doi.org/10.5194/acp-11-4039-2011, 2011.
Arey, J., Obermeyer, G., Aschmann, S. M., Chattopadhyay, S., Cusick, R. D., and Atkinson, R.: Dicarbonyl Products of the OH Radical-Initiated Reaction of a Series of Aromatic Hydrocarbons, Environ. Sci. Technol., 43, 683–689, https://doi.org/10.1021/es8019098, 2009.
Barkley, M. P., Palmer, P. I., Kuhn, U., Kesselmeier, J., Chance, K., Kurosu, T. P., Martin, R. V., Helmig, D., and Guenther, A.: Net ecosystem fluxes of isoprene over tropical South America inferred from Global Ozone Monitoring Experiment (GOME) observations of HCHO columns, J. Geophys. Res., 113, https://doi.org/10.1029/2008jd009863, 2008.
Barkley, M. P., Palmer, P. I., De Smedt, I., Karl, T., Guenther, A., and Van Roozendael, M.: Regulated large-scale annual shutdown of Amazonian isoprene emissions?, Geophys. Res. Lett., 36, L04803, https://doi.org/10.1029/2008gl036843, 2009.
Barkley, M. P., Smedt, I. D., Van Roozendael, M., Kurosu, T. P., Chance, K., Arneth, A., Hagberg, D., Guenther, A., Paulot, F., Marais, E., and Mao, J.: Top-down isoprene emissions over tropical South America inferred from SCIAMACHY and OMI formaldehyde columns, J. Geophys. Res. Atmos., 118, 6849–6868, https://doi.org/10.1002/jgrd.50552, 2013.
Bey, I., Jacob, D. J., Yantosca, R. M., Logan, J. A., Field, B. D., Fiore, A. M., Li, Q., Liu, H. Y., Mickley, L. J., and Schultz, M. G.: Global modeling of tropospheric chemistry with assimilated meteorology: Model description and evaluation, J. Geophys. Res., 106, 23073–23095, https://doi.org/10.1029/2001JD000807, 2001.
Bloss, C., Wagner, V., Jenkin, M. E., Volkamer, R., Bloss, W. J., Lee, J. D., Heard, D. E., Wirtz, K., Martin-Reviejo, M., Rea, G., Wenger, J. C., and Pilling, M. J.: Development of a detailed chemical mechanism (MCMv3.1) for the atmospheric oxidation of aromatic hydrocarbons, Atmos. Chem. Phys., 5, 641–664, https://doi.org/10.5194/acp-5-641-2005, 2005.
Bo, Y., Cai, H., and Xie, S. D.: Spatial and temporal variation of historical anthropogenic NMVOCs emission inventories in China, Atmos. Chem. Phys., 8, 7297–7316, https://doi.org/10.5194/acp-8-7297-2008, 2008.
Cao, G., Zhang, X., Gong, S., An, X., and Wang, Y.: Emission inventories of primary particles and pollutant gases for China, Chin. Sci. Bull., 56, 781–788, https://doi.org/10.1007/s11434-011-4373-7, 2011.
Chan Miller, C., Gonzalez Abad, G., Wang, H., Liu, X., Kurosu, T., Jacob, D. J., and Chance, K.: Glyoxal retrieval from the Ozone Monitoring Instrument, Atmos. Meas. Tech., 7, 3891–3907, https://doi.org/10.5194/amt-7-3891-2014, 2014.
Chan Miller, C., Jacob, D. J., González Abad, G., and Chance, K.: Hotspot of glyoxal over the Pearl River delta seen from the OMI satellite instrument: implications for emissions of aromatic hydrocarbons, Atmos. Chem. Phys., 16, 4631–4639, https://doi.org/10.5194/acp-16-4631-2016, 2016.
Chan Miller, C., Jacob, D. J., Marais, E. A., Yu, K., Travis, K. R., Kim, P. S., Fisher, J. A., Zhu, L., Wolfe, G. M., Hanisco, T. F., Keutsch, F. N., Kaiser, J., Min, K.-E., Brown, S. S., Washenfelder, R. A., González Abad, G., and Chance, K.: Glyoxal yield from isoprene oxidation and relation to formaldehyde: chemical mechanism, constraints from SENEX aircraft observations, and interpretation of OMI satellite data, Atmos. Chem. Phys., 17, 8725–8738, https://doi.org/10.5194/acp-17-8725-2017, 2017.
Chance, K.: Analysis of BrO measurements from the Global Ozone Monitoring Experiment, Geophys. Res. Lett., 25, 3335–3338, https://doi.org/10.1029/98gl52359, 1998.
Curci, G., Palmer, P. I., Kurosu, T. P., Chance, K., and Visconti, G.: Estimating European volatile organic compound emissions using satellite observations of formaldehyde from the Ozone Monitoring Instrument, Atmos. Chem. Phys., 10, 11501–11517, https://doi.org/10.5194/acp-10-11501-2010, 2010.
Daescu, D. N., Sandu, A., and Carmichael, G. R.: Direct and adjoint sensitivity analysis of chemical kinetic systems with KPP: II – numerical validation and applications, Atmos. Environ., 37, 5097–5114, https://doi.org/10.1016/j.atmosenv.2003.08.020, 2003.
De Smedt, I., Van Roozendael, M., Stavrakou, T., Müller, J.-F., Lerot, C., Theys, N., Valks, P., Hao, N., and van der A, R.: Improved retrieval of global tropospheric formaldehyde columns from GOME-2/MetOp-A addressing noise reduction and instrumental degradation issues, Atmos. Meas. Tech., 5, 2933–2949, https://doi.org/10.5194/amt-5-2933-2012, 2012.
De Smedt, I., Stavrakou, T., Hendrick, F., Danckaert, T., Vlemmix, T., Pinardi, G., Theys, N., Lerot, C., Gielen, C., Vigouroux, C., Hermans, C., Fayt, C., Veefkind, P., Müller, J.-F., and Van Roozendael, M.: Diurnal, seasonal and long-term variations of global formaldehyde columns inferred from combined OMI and GOME-2 observations, Atmos. Chem. Phys., 15, 12519–12545, https://doi.org/10.5194/acp-15-12519-2015, 2015.
Dufour, G., Wittrock, F., Camredon, M., Beekmann, M., Richter, A., Aumont, B., and Burrows, J. P.: SCIAMACHY formaldehyde observations: constraint for isoprene emission estimates over Europe?, Atmos. Chem. Phys., 9, 1647–1664, https://doi.org/10.5194/acp-9-1647-2009, 2009.
Fu, T. M., Cao, J. J., Zhang, X. Y., Lee, S. C., Zhang, Q., Han, Y. M., Qu, W. J., Han, Z., Zhang, R., Wang, Y. X., Chen, D., and Henze, D. K.: Carbonaceous aerosols in China: top-down constraints on primary sources and estimation of secondary contribution, Atmos. Chem. Phys., 12, 2725-2746, https://doi.org/10.5194/acp-12-2725-2012, 2012.
Fu, T.-M., Jacob, D. J., Palmer, P. I., Chance, K., Wang, Y. X., Barletta, B., Blake, D. R., Stanton, J. C., and Pilling, M. J.: Space-based formaldehyde measurements as constraints on volatile organic compound emissions in east and south Asia and implications for ozone, J. Geophys. Res., 112, D06312, https://doi.org/10.1029/2006jd007853, 2007.
Fu, T.-M., Jacob, D. J., Wittrock, F., Burrows, J. P., Vrekoussis, M., and Henze, D. K.: Global budgets of atmospheric glyoxal and methylglyoxal, and implications for formation of secondary organic aerosols, J. Geophys. Res., 113, D15303, https://doi.org/10.1029/2007jd009505, 2008.
González Abad, G., Liu, X., Chance, K., Wang, H., Kurosu, T. P., and Suleiman, R.: Updated Smithsonian Astrophysical Observatory Ozone Monitoring Instrument (SAO OMI) formaldehyde retrieval, Atmos. Meas. Tech., 8, 19–32, https://doi.org/10.5194/amt-8-19-2015, 2015.
Gonzi, S., Palmer, P. I., Barkley, M. P., De Smedt, I., and Van Roozendael, M.: Biomass burning emission estimates inferred from satellite column measurements of HCHO: Sensitivity to co-emitted aerosol and injection height, Geophys. Res. Lett., 38, L14807, https://doi.org/10.1029/2011gl047890, 2011.
Granier, C., Doumbia, T., Granier, L., Sindelarova, K., Frost, G., Bouarar, I., Liousse, C., Darras, S., and Stavrakou, J.: Anthropogenic emissions in Asia, Air Pollution in Eastern Asia: an integrated perspective, edited by: Bouarar, I., Wang, X., and Brasseur, G., Springer international Publishing, 107–133, https://doi.org/10.1007/978-3-319-59489-7-6, 2017.
Guenther, A. B., Jiang, X., Heald, C. L., Sakulyanontvittaya, T., Duhl, T., Emmons, L. K., and Wang, X.: The Model of Emissions of Gases and Aerosols from Nature version 2.1 (MEGAN2.1): an extended and updated framework for modeling biogenic emissions, Geosci. Model Dev., 5, 1471–1492, https://doi.org/10.5194/gmd-5-1471-2012, 2012.
Guenther, A., Karl, T., Harley, P., Wiedinmyer, C., Palmer, P. I., and Geron, C.: Estimates of global terrestrial isoprene emissions using MEGAN (Model of Emissions of Gases and Aerosols from Nature), Atmos. Chem. Phys., 6, 3181–3210, https://doi.org/10.5194/acp-6-3181-2006, 2006.
Hallquist, M., Wenger, J. C., Baltensperger, U., Rudich, Y., Simpson, D., Claeys, M., Dommen, J., Donahue, N. M., George, C., Goldstein, A. H., Hamilton, J. F., Herrmann, H., Hoffmann, T., Iinuma, Y., Jang, M., Jenkin, M. E., Jimenez, J. L., Kiendler-Scharr, A., Maenhaut, W., McFiggans, G., Mentel, Th. F., Monod, A., Prévôt, A. S. H., Seinfeld, J. H., Surratt, J. D., Szmigielski, R., and Wildt, J.: The formation, properties and impact of secondary organic aerosol: current and emerging issues, Atmos. Chem. Phys., 9, 5155–5236, https://doi.org/10.5194/acp-9-5155-2009, 2009.
Han, K. M., Park, R. S., Kim, H. K., Woo, J. H., Kim, J., and Song, C. H.: Uncertainty in biogenic isoprene emissions and its impacts on tropospheric chemistry in East Asia, Sci. Total Environ., 463, 754–771, https://doi.org/10.1016/j.scitotenv.2013.06.003, 2013.
Hansen, P. C.: Rank-deficient and discrete ill-posed problems: numerical aspects of linear inversion, SIAM, Philadelphia, 1998.
Hays, M. D., Geron, C. D., Linna, K. J., Smith, N. D., and Schauer, J. J.: Speciation of gas-phase and fine particle emissions from burning of foliar fuels, Environ. Sci. Technol., 36, 2281–2295, https://doi.org/10.1021/es0111683, 2002.
Henze, D. K., Hakami, A., and Seinfeld, J. H.: Development of the adjoint of GEOS-Chem, Atmos. Chem. Phys., 7, 2413–2433, https://doi.org/10.5194/acp-7-2413-2007, 2007.
Henze, D. K., Seinfeld, J. H., and Shindell, D. T.: Inverse modeling and mapping US air quality influences of inorganic PM2.5 precursor emissions using the adjoint of GEOS-Chem, Atmos. Chem. Phys., 9, 5877–5903, https://doi.org/10.5194/acp-9-5877-2009, 2009.
Henze, D. K., Seinfeld, J. H., Ng, N. L., Kroll, J. H., Fu, T.-M., Jacob, D. J., and Heald, C. L.: Global modeling of secondary organic aerosol formation from aromatic hydrocarbons: high- vs. low-yield pathways, Atmos. Chem. Phys., 8, 2405–2420, https://doi.org/10.5194/acp-8-2405-2008, 2008.
Huang, G., Brook, R., Crippa, M., Janssens-Maenhout, G., Schieberle, C., Dore, C., Guizzardi, D., Muntean, M., Schaaf, E., and Friedrich, R.: Speciation of anthropogenic emissions of non-methane volatile organic compounds: a global gridded data set for 1970–2012, Atmos. Chem. Phys., 17, 7683–7701, https://doi.org/10.5194/acp-17-7683-2017, 2017.
Huang, X., Li, M., Li, J., and Song, Y.: A high-resolution emission inventory of crop burning in fields in China based on MODIS Thermal Anomalies/Fire products, Atmos. Environ., 50, 9–15, https://doi.org/10.1016/j.atmosenv.2012.01.017, 2012.
Ip, H. S. S., Huang, X. H. H., and Yu, J. Z.: Effective Henry's law constants of glyoxal, glyoxylic acid, and glycolic acid, Geophys. Res. Lett., 36, L01802, https://doi.org/10.1029/2008GL036212, 2009.
Jenkin, M. E., Saunders, S. M., Wagner, V., and Pilling, M. J.: The tropospheric degradation of volatile organic compounds: a protocol for mechanism development, Atmos. Environ., 31, 81–104, https://doi.org/10.1016/S1352-2310(96)00105-7, 1997.
Jenkin, M. E., Saunders, S. M., Wagner, V., and Pilling, M. J.: Protocol for the development of the Master Chemical Mechanism, MCM v3 (Part B): tropospheric degradation of aromatic volatile organic compounds, Atmos. Chem. Phys., 3, 181–193, https://doi.org/10.5194/acp-3-181-2003, 2003.
Jenkin, M. E., Young, J. C., and Rickard, A. R.: The MCM v3.3.1 degradation scheme for isoprene, Atmos. Chem. Phys., 15, 11433–11459, https://doi.org/10.5194/acp-15-11433-2015, 2015.
Kurokawa, J., Ohara, T., Morikawa, T., Hanayama, S., Janssens-Maenhout, G., Fukui, T., Kawashima, K., and Akimoto, H.: Emissions of air pollutants and greenhouse gases over Asian regions during 2000–2008: Regional Emission inventory in ASia (REAS) version 2, Atmos. Chem. Phys., 13, 11019–11058, https://doi.org/10.5194/acp-13-11019-2013, 2013.
Lee, H., Ryu, J., Irie, H., Jang, S.-H., Park, J., Choi, W., and Hong, H.: Investigations of the Diurnal Variation of Vertical HCHO Profiles Based on MAX-DOAS Measurements in Beijing: Comparisons with OMI Vertical Column Data, Atmosphere, 6, 1816–1832, https://doi.org/10.3390/atmos6111816, 2015.
Lerot, C., Stavrakou, T., De Smedt, I., Müller, J.-F., and Van Roozendael, M.: Glyoxal vertical columns from GOME-2 backscattered light measurements and comparisons with a global model, Atmos. Chem. Phys., 10, 12059–12072, https://doi.org/10.5194/acp-10-12059-2010, 2010.
Li, D. and Bian, J. C.: Observation of a Summer Tropopause Fold by Ozonesonde at Changchun, China: Comparison with Reanalysis and Model Simulation, Adv. Atmos. Sci., 32, 1354–1364, https://doi.org/10.1007/s00376-015-5022-x, 2015.
Li, J., Wang, Z. F., Akimoto, H., Gao, C., Pochanart, P., and Wang, X. Q.: Modeling study of ozone seasonal cycle in lower troposphere over east Asia, J. Geophys. Res.-Atmos., 112, https://doi.org/10.1029/2006JD008209, 2007.
Li, J. Y., Mao, J. Q., Min, K. E., Washenfelder, R. A., Brown, S. S., Kaiser, J., Keutsch, F. N., Volkamer, R., Wolfe, G. M., Hanisco, T. F., Pollack, I. B., Ryerson, T. B., Graus, M., Gilman, J. B., Lerner, B. M., Warneke, C., de Gouw, J. A., Middlebrook, A. M., Liao, J., Welti, A., Henderson, B. H., McNeill, V. F., Hall, S. R., Ullmann, K., Donner, L. J., Paulot, F., and Horowitz, L. W.: Observational constraints on glyoxal production from isoprene oxidation and its contribution to organic aerosol over the Southeast United States, J. Geophys. Res.-Atmos., 121, 9849–9861, https://doi.org/10.1002/2016JD025331, 2016.
Li, M., Zhang, Q., Streets, D. G., He, K. B., Cheng, Y. F., Emmons, L. K., Huo, H., Kang, S. C., Lu, Z., Shao, M., Su, H., Yu, X., and Zhang, Y.: Mapping Asian anthropogenic emissions of non-methane volatile organic compounds to multiple chemical mechanisms, Atmos. Chem. Phys., 14, 5617–5638, https://doi.org/10.5194/acp-14-5617-2014, 2014.
Li, M., Zhang, Q., Kurokawa, J.-I., Woo, J.-H., He, K., Lu, Z., Ohara, T., Song, Y., Streets, D. G., Carmichael, G. R., Cheng, Y., Hong, C., Huo, H., Jiang, X., Kang, S., Liu, F., Su, H., and Zheng, B.: MIX: a mosaic Asian anthropogenic emission inventory under the international collaboration framework of the MICS-Asia and HTAP, Atmos. Chem. Phys., 17, 935–963, https://doi.org/10.5194/acp-17-935-2017, 2017.
Li, X., Brauers, T., Hofzumahaus, A., Lu, K., Li, Y. P., Shao, M., Wagner, T., and Wahner, A.: MAX-DOAS measurements of NO2, HCHO and CHOCHO at a rural site in Southern China, Atmos. Chem. Phys., 13, 2133–2151, https://doi.org/10.5194/acp-13-2133-2013, 2013.
Liao, H., Henze, D. K., Seinfeld, J. H., Wu, S. L., and Mickley, L. J.: Biogenic secondary organic aerosol over the United States: Comparison of climatological simulations with observations, J. Geophys. Res., 112, D06201, https://doi.org/10.1029/2006JD007813, 2007.
Liggio, J., Li, S. M., and McLaren, R.: Reactive uptake of glyoxal by particulate matter, J. Geophys. Res.-Atmos., 110, D10304, https://doi.org/10.1029/2004JD005113, 2005.
Liu, M., Song, Y., Yao, H., Kang, Y., Li, M., Huang, X., and Hu, M.: Estimating emissions from agricultural fires in the North China Plain based on MODIS fire radiative power, Atmos. Environ., 112, 326–334, https://doi.org/10.1016/j.atmosenv.2015.04.058, 2015.
Liu, Z., Wang, Y., Vrekoussis, M., Richter, A., Wittrock, F., Burrows, J. P., Shao, M., Chang, C.-C., Liu, S.-C., Wang, H., and Chen, C.: Exploring the missing source of glyoxal (CHOCHO) over China, Geophys. Res. Lett., 39, L10812, https://doi.org/10.1029/2012gl051645, 2012.
Mao, J. Q., Paulot, F., Jacob, D. J., Cohen, R. C., Crounse, J. D., Wennberg, P. O., Keller, C. A., Hudman, R. C., Barkley, M. P., and Horowitz, L. W.: Ozone and organic nitrates over the eastern United States: Sensitivity to isoprene chemistry, J. Geophys. Res.-Atmos., 118, 11256–11268, https://doi.org/10.1002/jgrd.50817, 2013.
Marais, E. A., Jacob, D. J., Kurosu, T. P., Chance, K., Murphy, J. G., Reeves, C., Mills, G., Casadio, S., Millet, D. B., Barkley, M. P., Paulot, F., and Mao, J.: Isoprene emissions in Africa inferred from OMI observations of formaldehyde columns, Atmos. Chem. Phys., 12, 6219–6235, https://doi.org/10.5194/acp-12-6219-2012, 2012.
Marais, E. A., Jacob, D. J., Guenther, A., Chance, K., Kurosu, T. P., Murphy, J. G., Reeves, C. E., and Pye, H. O. T.: Improved model of isoprene emissions in Africa using Ozone Monitoring Instrument (OMI) satellite observations of formaldehyde: implications for oxidants and particulate matter, Atmos. Chem. Phys., 14, 7693–7703, https://doi.org/10.5194/acp-14-7693-2014, 2014a.
Marais, E. A., Jacob, D. J., Wecht, K., Lerot, C., Zhang, L., Yu, K., Kurosu, T. P., Chance, K., and Sauvage, B.: Anthropogenic emissions in Nigeria and implications for atmospheric ozone pollution: A view from space, Atmos. Environ., 99, 32–40, https://doi.org/10.1016/j.atmosenv.2014.09.055, 2014b.
Mijling, B., van der A, R. J., and Zhang, Q.: Regional nitrogen oxides emission trends in East Asia observed from space, Atmos. Chem. Phys., 13, 12003–12012, https://doi.org/10.5194/acp-13-12003-2013, 2013.
Millet, D. B., Jacob, D. J., Turquety, S., Hudman, R. C., Wu, S., Fried, A., Walega, J., Heikes, B. G., Blake, D. R., Singh, H. B., Anderson, B. E., and Clarke, A. D.: Formaldehyde distribution over North America: Implications for satellite retrievals of formaldehyde columns and isoprene emission, J. Geophys. Res., 111, D24S02, https://doi.org/10.1029/2005jd006853, 2006.
Millet, D. B., Jacob, D. J., Boersma, K. F., Fu, T.-M., Kurosu, T. P., Chance, K., Heald, C. L., and Guenther, A.: Spatial distribution of isoprene emissions from North America derived from formaldehyde column measurements by the OMI satellite sensor, J. Geophys. Res., 113, D02307, https://doi.org/10.1029/2007jd008950, 2008.
Myriokefalitakis, S., Vrekoussis, M., Tsigaridis, K., Wittrock, F., Richter, A., Brühl, C., Volkamer, R., Burrows, J. P., and Kanakidou, M.: The influence of natural and anthropogenic secondary sources on the glyoxal global distribution, Atmos. Chem. Phys., 8, 4965–4981, https://doi.org/10.5194/acp-8-4965-2008, 2008.
Nishino, N., Arey, J., and Atkinson, R.: Formation Yields of Glyoxal and Methylglyoxal from the Gas-Phase OH Radical-Initiated Reactions of Toluene, Xylenes, and Trimethylbenzenes as a Function of NO2 Concentration, J. Phys. Chem. A, 114, 10140, https://doi.org/10.1021/jp105112h, 2010.
Olivier, J. G. J., Bouwman, A. F., Berdowski, J. J. M., Veldt, C., Bloos, J. P. J., Visschedijk, A. J. H., van der Maas, C. W. M., and Zandveld, P. Y. J.: Sectoral emission inventories of greenhouse gases for 1990 on a per country basis as well as on , Environ. Sci. Policy, 2, 241–263, https://doi.org/10.1016/S1462-9011(99)00027-1, 1999.
Olivier, J. G. J., Berdowski, J. J. M., Peters, J. A. H. W., Bakker, J., Visschedijk, A. J. H., and Bloos, J.-P. J.: Applications of EDGAR, Including a description of EDGAR 3.0: reference database with trend data for 1970–1995, RIVM report no. 773301 001/NOP report no. 410200 051, RIVM, Bilthoven, 2001.
Olivier, J. G. J.: Part III: Greenhouse gas emissions. 1. Shares and trends in greenhouse gas emissions; 2. Sources and methods: greenhouse gas emissions for 1990 and 1995 in “CO2 emissions from fuel combustion 1971–2000”, International Energy Agency, Paris, ISBN 92-64-09794-5, 1–31, 1–31, 2002.
Palmer, P. I., Jacob, D. J., Fiore, A. M., Martin, R. V., Chance, K., and Kurosu, T. P.: Mapping isoprene emissions over North America using formaldehyde column observations from space, J. Geophys. Res.-Atmos., 108, 4180, https://doi.org/10.1029/2002jd002153, 2003.
Palmer, P. I., Abbot, D. S., Fu, T.-M., Jacob, D. J., Chance, K., Kurosu, T. P., Guenther, A., Wiedinmyer, C., Stanton, J. C., Pilling, M. J., Pressley, S. N., Lamb, B., and Sumner, A. L.: Quantifying the seasonal and interannual variability of North American isoprene emissions using satellite observations of the formaldehyde column, J. Geophys. Res., 111, D12315, https://doi.org/10.1029/2005jd006689, 2006.
Paulot, F., Crounse, J. D., Kjaergaard, H. G., Kroll, J. H., Seinfeld, J. H., and Wennberg, P. O.: Isoprene photooxidation: new insights into the production of acids and organic nitrates, Atmos. Chem. Phys., 9, 1479–1501, https://doi.org/10.5194/acp-9-1479-2009, 2009a.
Paulot, F., Crounse, J. D., Kjaergaard, H. G., Kurten, A., St Clair, J. M., Seinfeld, J. H., and Wennberg, P. O.: Unexpected Epoxide Formation in the Gas-Phase Photooxidation of Isoprene, Science, 325, 730–733, https://doi.org/10.1126/science.1172910, 2009b.
Platt, U., Perner, D., and Pätz, H. W.: Simultaneous measurement of atmospheric CH2O, O3, and NO2 by differential optical absorption, J. Geophys. Res. Oceans, 84, 6329–6335, https://doi.org/10.1029/JC084iC10p06329, 1979.
Pye, H. O. T. and Seinfeld, J. H.: A global perspective on aerosol from low-volatility organic compounds, Atmos. Chem. Phys., 10, 4377–4401, https://doi.org/10.5194/acp-10-4377-2010, 2010.
Qiu, K., Yang, L., Lin, J., Wang, P., Yang, Y., Ye, D., and Wang, L.: Historical industrial emissions of non-methane volatile organic compounds in China for the period of 1980–2010, Atmos. Environ., 86, 102–112, do:10.1016/j.atmosenv.2013.12.026, 2014.
Qu, Z., Henze, D. K., Capps, S. L., Wang, Y., Xu, X. G., Wang, J., and Keller, M.: Monthly top-down NOx emissions for China (2005-2012): A hybrid inversion method and trend analysis, J. Geophy. Res.-Atmos., 122, 4600–4625, https://doi.org/10.1002/2016JD025852, 2017.
Robinson, A. L., Donahue, N. M., Shrivastava, M. K., Weitkamp, E. A., Sage, A. M., Grieshop, A. P., Lane, T. E., Pierce, J. R., and Pandis, S. N.: Rethinking organic aerosols: Semivolatile emissions and photochemical aging, Science, 315, 1259–1262, https://doi.org/10.1126/science.1133061 2007.
Rodgers, C. D.: Inverse methods for atmospheric sounding: theory and practice, World Scientific, Singapore, 2000.
Sandu, A., Daescu, D. N., and Carmichael, G. R.: Direct and adjoint sensitivity analysis of chemical kinetic systems with KPP: Part I – theory and software tools, Atmos. Environ., 37, 5083–5096, https://doi.org/10.1016/j.atmosenv.2003.08.019, 2003.
Saunders, S. M., Jenkin, M. E., Derwent, R. G., and Pilling, M. J.: Protocol for the development of the Master Chemical Mechanism, MCM v3 (Part A): tropospheric degradation of non-aromatic volatile organic compounds, Atmos. Chem. Phys., 3, 161–180, https://doi.org/10.5194/acp-3-161-2003, 2003.
Schultz, M. G., Backman, L., and Balkanski, Y.: REanalysis of the TROpospheric chemical composition over the past 40 years (RETRO): A long-term global modeling study of tropospheric chemistry, Jülich/Hamburg, Germany, 48/2007 report on Earth System Science of the Max Planck Institute for Meteorology, Hamburg, http://retro.enes.org, ISSN 1614-1199, 2007.
Shim, C., Wang, Y., Choi, Y., Palmer, P. I., Abbot, D. S., and Chance, K.: Constraining global isoprene emissions with Global Ozone Monitoring Experiment (GOME) formaldehyde column measurements, J. Geophys. Res., 110, D24301, https://doi.org/10.1029/2004jd005629, 2005.
Sindelarova, K., Granier, C., Bouarar, I., Guenther, A., Tilmes, S., Stavrakou, T., Müller, J.-F., Kuhn, U., Stefani, P., and Knorr, W.: Global data set of biogenic VOC emissions calculated by the MEGAN model over the last 30 years, Atmos. Chem. Phys., 14, 9317–9341, https://doi.org/10.5194/acp-14-9317-2014, 2014.
Spurr, R.: LIDORT and VLIDORT: Linearized pseudo-spherical scalar and vector discrete ordinate radiative transfer models for use in remote sensing retrieval problems, in: Light Scattering Reviews, edited by: Kokhanovsky, A., Springer, 3, 229–275, 2008.
Spurr, R. J. D.: VLIDORT: A linearized pseudo-spherical vector discrete ordinate radiative transfer code for forward model and retrieval studies in multilayer multiple scattering media, J. Quant. Spectrosc. Radiat. Transf., 102, 316–342, https://doi.org/10.1016/j.jqsrt.2006.05.005, 2006.
Stavrakou, T., Guenther, A., Razavi, A., Clarisse, L., Clerbaux, C., Coheur, P.-F., Hurtmans, D., Karagulian, F., De Mazière, M., Vigouroux, C., Amelynck, C., Schoon, N., Laffineur, Q., Heinesch, B., Aubinet, M., Rinsland, C., and Müller, J.-F.: First space-based derivation of the global atmospheric methanol emission fluxes, Atmos. Chem. Phys., 11, 4873–4898, https://doi.org/10.5194/acp-11-4873-2011, 2011.
Stavrakou, T., Muller, J. F., Bauwens, M., De Smedt, I.: Sources and long-term trends of ozone precursors to Asian Pollution, Air Pollution in Eastern Asia : an integrated perspective, eds. Bouarar, I., Wang, X., Brasseur, G., Springer international Publishing, 167–189, https://doi.org/10.1007/978-3-319-59489-7-8, 2017.
Stavrakou, T., Muller, J. F., Bauwens, M., De Smedt, I., Lerot, C., Van Roozendael, M., Coheur, P. F., Clerbaux, C., Boersma, K. F., van der, A. R., and Song, Y.: Substantial Underestimation of Post-Harvest Burning Emissions in the North China Plain Revealed by Multi-Species Space Observations, Sci. Rep., 6, 32307, https://doi.org/10.1038/srep32307, 2016.
Stavrakou, T., Müller, J.-F., Bauwens, M., De Smedt, I., Van Roozendael, M., Guenther, A., Wild, M., and Xia, X.: Isoprene emissions over Asia 1979–2012: impact of climate and land-use changes, Atmos. Chem. Phys., 14, 4587–4605, https://doi.org/10.5194/acp-14-4587-2014, 2014.
Stavrakou, T., Müller, J.-F., Bauwens, M., De Smedt, I., Van Roozendael, M., De Mazière, M., Vigouroux, C., Hendrick, F., George, M., Clerbaux, C., Coheur, P.-F., and Guenther, A.: How consistent are top-down hydrocarbon emissions based on formaldehyde observations from GOME-2 and OMI?, Atmos. Chem. Phys., 15, 11861–11884, https://doi.org/10.5194/acp-15-11861-2015, 2015.
Stavrakou, T., Müller, J.-F., De Smedt, I., Van Roozendael, M., Kanakidou, M., Vrekoussis, M., Wittrock, F., Richter, A., and Burrows, J. P.: The continental source of glyoxal estimated by the synergistic use of spaceborne measurements and inverse modelling, Atmos. Chem. Phys., 9, 8431–8446, https://doi.org/10.5194/acp-9-8431-2009, 2009a.
Stavrakou, T., Müller, J.-F., De Smedt, I., Van Roozendael, M., van der Werf, G. R., Giglio, L., and Guenther, A.: Global emissions of non-methane hydrocarbons deduced from SCIAMACHY formaldehyde columns through 2003–2006, Atmos. Chem. Phys., 9, 3663–3679, https://doi.org/10.5194/acp-9-3663-2009, 2009b.
Sun, L., Xue, L., Wang, T., Gao, J., Ding, A., Cooper, O. R., Lin, M., Xu, P., Wang, Z., Wang, X., Wen, L., Zhu, Y., Chen, T., Yang, L., Wang, Y., Chen, J., and Wang, W.: Significant increase of summertime ozone at Mount Tai in Central Eastern China, Atmos. Chem. Phys., 16, 10637–10650, https://doi.org/10.5194/acp-16-10637-2016, 2016.
van der Werf, G. R., Randerson, J. T., Giglio, L., Collatz, G. J., Mu, M., Kasibhatla, P. S., Morton, D. C., DeFries, R. S., Jin, Y., and van Leeuwen, T. T.: Global fire emissions and the contribution of deforestation, savanna, forest, agricultural, and peat fires (1997–2009), Atmos. Chem. Phys., 10, 11707–11735, https://doi.org/10.5194/acp-10-11707-2010, 2010.
van der Werf, G. R., Randerson, J. T., Giglio, L., van Leeuwen, T. T., Chen, Y., Rogers, B. M., Mu, M., van Marle, M. J. E., Morton, D. C., Collatz, G. J., Yokelson, R. J., and Kasibhatla, P. S.: Global fire emissions estimates during 1997–2016, Earth Syst. Sci. Data, 9, 697–720, https://doi.org/10.5194/essd-9-697-2017, 2017.
van Donkelaar, A., Martin, R. V., Leaitch, W. R., Macdonald, A. M., Walker, T. W., Streets, D. G., Zhang, Q., Dunlea, E. J., Jimenez, J. L., Dibb, J. E., Huey, L. G., Weber, R., and Andreae, M. O.: Analysis of aircraft and satellite measurements from the Intercontinental Chemical Transport Experiment (INTEX-B) to quantify long-range transport of East Asian sulfur to Canada, Atmos. Chem. Phys., 8, 2999–3014, https://doi.org/10.5194/acp-8-2999-2008, 2008.
Vestreng, V.: Review and revision, Emission data reported to CLRTAP, Tech. rep., EMEP MSC-W, (available at: http://www.emep.int/mscw/mscw_publications.html#2003, last access: December, 2012) 2003.
Vlemmix, T., Hendrick, F., Pinardi, G., De Smedt, I., Fayt, C., Hermans, C., Piters, A., Wang, P., Levelt, P., and Van Roozendael, M.: MAX-DOAS observations of aerosols, formaldehyde and nitrogen dioxide in the Beijing area: comparison of two profile retrieval approaches, Atmos. Meas. Tech., 8, 941–963, https://doi.org/10.5194/amt-8-941-2015, 2015.
Volkamer, R.: Primary and Secondary Glyoxal Formation from Aromatics: Experimental Evidence for the Bicycloalkyl-Radical Pathway from Benzene, Toluene, and p-Xylene, J. Phys. Chem., 105, 7865–7874, https://doi.org/10.1021/jp010152w, 2001.
Vrekoussis, M., Wittrock, F., Richter, A., and Burrows, J. P.: GOME-2 observations of oxygenated VOCs: what can we learn from the ratio glyoxal to formaldehyde on a global scale?, Atmos. Chem. Phys., 10, 10145–10160, https://doi.org/10.5194/acp-10-10145-2010, 2010.
Wang, F., An, J., Li, Y., Tang, Y., Lin, J., Qu, Y., Chen, Y., Zhang, B., and Zhai, J.: Impacts of uncertainty in AVOC emissions on the summer ROx budget and ozone production rate in the three most rapidly-developing economic growth regions of China, Adv. Atmos. Sci., 31, 1331–1342, https://doi.org/10.1007/s00376-014-3251-z, 2014.
Wang, H. Q., Ma, J. M., Shen, Y. J., and Wang, Y. A.: Assessment of Ozone Variations and Meteorological Influences at a Rural Site in Northern Xinjiang, Bull. Environ. Contam. Toxicol., 94, 240–246, https://doi.org/10.1007/s00128-014-1451-y, 2015.
Wang, P., Stammes, P., van der A, R., Pinardi, G., and van Roozendael, M.: FRESCO+: an improved O2 A-band cloud retrieval algorithm for tropospheric trace gas retrievals, Atmos. Chem. Phys., 8, 6565–6576, https://doi.org/10.5194/acp-8-6565-2008, 2008.
Wang, Y., Konopka, P., Liu, Y., Chen, H., Müller, R., Plöger, F., Riese, M., Cai, Z., and Lü, D.: Tropospheric ozone trend over Beijing from 2002–2010: ozonesonde measurements and modeling analysis, Atmos. Chem. Phys., 12, 8389–8399, https://doi.org/10.5194/acp-12-8389-2012, 2012.
Wang, Y., Beirle, S., Lampel, J., Koukouli, M., De Smedt, I., Theys, N., Li, A., Wu, D., Xie, P., Liu, C., Van Roozendael, M., Stavrakou, T., Müller, J.-F., and Wagner, T.: Validation of OMI, GOME-2A and GOME-2B tropospheric NO2, SO2 and HCHO products using MAX-DOAS observations from 2011 to 2014 in Wuxi, China: investigation of the effects of priori profiles and aerosols on the satellite products, Atmos. Chem. Phys., 17, 5007–5033, https://doi.org/10.5194/acp-17-5007-2017, 2017.
Wei, W., Wang, S., Chatani, S., Klimont, Z., Cofala, J., and Hao, J.: Emission and speciation of non-methane volatile organic compounds from anthropogenic sources in China, Atmos. Environ., 42, 4976–4988, https://doi.org/10.1016/j.atmosenv.2008.02.044, 2008.
Wells, K. C., Millet, D. B., Hu, L., Cady-Pereira, K. E., Xiao, Y., Shephard, M. W., Clerbaux, C. L., Clarisse, L., Coheur, P.-F., Apel, E. C., de Gouw, J., Warneke, C., Singh, H. B., Goldstein, A. H., and Sive, B. C.: Tropospheric methanol observations from space: retrieval evaluation and constraints on the seasonality of biogenic emissions, Atmos. Chem. Phys., 12, 5897–5912, https://doi.org/10.5194/acp-12-5897-2012, 2012.
Wiedinmyer, C., Akagi, S. K., Yokelson, R. J., Emmons, L. K., Al-Saadi, J. A., Orlando, J. J., and Soja, A. J.: The Fire INventory from NCAR (FINN): a high resolution global model to estimate the emissions from open burning, Geosci. Model Dev., 4, 625–641, https://doi.org/10.5194/gmd-4-625-2011, 2011.
Wittrock, F., Richter, A., Oetjen, H., Burrows, J. P., Kanakidou, M., Myriokefalitakis, S., Volkamer, R., Beirle, S., Platt, U., and Wagner, T.: Simultaneous global observations of glyoxal and formaldehyde from space, Geophys. Res. Lett., 33, L16804, https://doi.org/10.1029/2006gl026310, 2006.
Wu, R., Bo, Y., Li, J., Li, L., Li, Y., and Xie, S.: Method to establish the emission inventory of anthropogenic volatile organic compounds in China and its application in the period 2008–2012, Atmos. Environ., 127, 244–254, https://doi.org/10.1016/j.atmosenv.2015.12.015, 2016.
Xu, W., Lin, W., Xu, X., Tang, J., Huang, J., Wu, H., and Zhang, X.: Long-term trends of surface ozone and its influencing factors at the Mt Waliguan GAW station, China – Part 1: Overall trends and characteristics, Atmos. Chem. Phys., 16, 6191–6205, https://doi.org/10.5194/acp-16-6191-2016, 2016.
Xu, X., Lin, W., Wang, T., Yan, P., Tang, J., Meng, Z., and Wang, Y.: Long-term trend of surface ozone at a regional background station in eastern China 1991–2006: enhanced variability, Atmos. Chem. Phys., 8, 2595–2607, https://doi.org/10.5194/acp-8-2595-2008, 2008.
Zhang, J. M., Wang, T., Ding, A. J., Zhou, X. H., Xue, L. K., Poon, C. N., Wu, W. S., Gao, J., Zuo, H. C., Chen, J. M., Zhang, X. C., and Fan, S. J.: Continuous measurement of peroxyacetyl nitrate (PAN) in suburban and remote areas of western China, Atmos. Environ., 43, 228–237, https://doi.org/10.1016/j.atmosenv.2008.09.070, 2009.
Zhang, Q., Streets, D. G., Carmichael, G. R., He, K. B., Huo, H., Kannari, A., Klimont, Z., Park, I. S., Reddy, S., Fu, J. S., Chen, D., Duan, L., Lei, Y., Wang, L. T., and Yao, Z. L.: Asian emissions in 2006 for the NASA INTEX-B mission, Atmos. Chem. Phys., 9, 5131–5153, https://doi.org/10.5194/acp-9-5131-2009, 2009.
Zhang, X. Y., Wang, Y. Q., Niu, T., Zhang, X. C., Gong, S. L., Zhang, Y. M., and Sun, J. Y.: Atmospheric aerosol compositions in China: spatial/temporal variability, chemical signature, regional haze distribution and comparisons with global aerosols, Atmos. Chem. Phys., 12, 779–799, https://doi.org/10.5194/acp-12-779-2012, 2012.
Zhao, Y., Nielsen, C. P., Lei, Y., McElroy, M. B., and Hao, J.: Quantifying the uncertainties of a bottom-up emission inventory of anthropogenic atmospheric pollutants in China, Atmos. Chem. Phys., 11, 2295–2308, https://doi.org/10.5194/acp-11-2295-2011, 2011.
Zheng, J. Y., Zhong, L. J., Wang, T., Louie, P. K. K., and Li, Z. C.: Ground-level ozone in the Pearl River Delta region: Analysis of data from a recently established regional air quality monitoring network, Atmos. Environ., 44, 814–823, https://doi.org/10.1016/j.atmosenv.2009.11.032, 2010.
Zhu, L., Jacob, D. J., Mickley, L. J., Marais, E. A., Cohan, D. S., Yoshida, Y., Duncan, B. N., González Abad, G., and Chance, K. V.: Anthropogenic emissions of highly reactive volatile organic compounds in eastern Texas inferred from oversampling of satellite (OMI) measurements of HCHO columns, Environ. Res. Lett., 9, 114004, https://doi.org/10.1088/1748-9326/9/11/114004, 2014.
Zhu, L., Jacob, D. J., Kim, P. S., Fisher, J. A., Yu, K., Travis, K. R., Mickley, L. J., Yantosca, R. M., Sulprizio, M. P., De Smedt, I., González Abad, G., Chance, K., Li, C., Ferrare, R., Fried, A., Hair, J. W., Hanisco, T. F., Richter, D., Jo Scarino, A., Walega, J., Weibring, P., and Wolfe, G. M.: Observing atmospheric formaldehyde (HCHO) from space: validation and intercomparison of six retrievals from four satellites (OMI, GOME2A, GOME2B, OMPS) with SEAC4RS aircraft observations over the southeast US, Atmos. Chem. Phys., 16, 13477–13490, https://doi.org/10.5194/acp-16-13477-2016, 2016.
- Abstract
- Introduction
- Model and data
- Comparison of simulations using the a priori emissions against satellite observations and ground-based measurements
- Inversion experiments of Chinese NMVOC emissions
- Comparison with previous estimates of Chinese NMVOC emissions
- Impacts on simulated surface ozone and secondary organic aerosol levels over China
- Conclusions
- Data availability
- Author contributions
- Competing interests
- Acknowledgements
- References
- Supplement