the Creative Commons Attribution 4.0 License.
the Creative Commons Attribution 4.0 License.
 | 19 Oct 2018
Long-term trends in the ambient PM2.5- and O3-related mortality burdens in the United States under emission reductions from 1990 to 2010
J. Jason West
Jia Xing
Christian Hogrefe
Shawn J. Roselle
Jesse O. Bash
Jonathan E. Pleim
Chuen-Meei Gan
David C. Wong
Concentrations of both fine particulate matter (PM2.5) and ozone (O3) in the United States (US) have decreased significantly since 1990, mainly because of air quality regulations. Exposure to these air pollutants is associated with premature death. Here we quantify the annual mortality burdens from PM2.5 and O3 in the US from 1990 to 2010, estimate trends and inter-annual variability, and evaluate the contributions to those trends from changes in pollutant concentrations, population, and baseline mortality rates. We use a fine-resolution (36 km) self-consistent 21-year simulation of air pollutant concentrations in the US from 1990 to 2010, a health impact function, and annual county-level population and baseline mortality rate estimates. From 1990 to 2010, the modeled population-weighted annual PM2.5 decreased by 39 %, and summertime (April to September) 1 h average daily maximum O3 decreased by 9 % from 1990 to 2010. The PM2.5-related mortality burden from ischemic heart disease, chronic obstructive pulmonary disease, lung cancer, and stroke steadily decreased by 54 % from 123 700 deaths year−1 (95 % confidence interval, 70 800–178 100) in 1990 to 58 600 deaths year−1 (24 900–98 500) in 2010. The PM2.5-related mortality burden would have decreased by only 24 % from 1990 to 2010 if the PM2.5 concentrations had stayed at the 1990 level, due to decreases in baseline mortality rates for major diseases affected by PM2.5. The mortality burden associated with O3 from chronic respiratory disease increased by 13 % from 10 900 deaths year−1 (3700–17 500) in 1990 to 12 300 deaths year−1 (4100–19 800) in 2010, mainly caused by increases in the baseline mortality rates and population, despite decreases in O3 concentration. The O3-related mortality burden would have increased by 55 % from 1990 to 2010 if the O3 concentrations had stayed at the 1990 level. The detrended annual O3 mortality burden has larger inter-annual variability (coefficient of variation of 12 %) than the PM2.5-related burden (4 %), mainly from the inter-annual variation of O3 concentration. We conclude that air quality improvements have significantly decreased the mortality burden, avoiding roughly 35 800 (38 %) PM2.5-related deaths and 4600 (27 %) O3-related deaths in 2010, compared to the case if air quality had stayed at 1990 levels (at 2010 baseline mortality rates and population).
- Article
(5220 KB) -
Supplement
(2560 KB) - BibTeX
- EndNote


The 2015 Global Burden of Disease (GBD) study lists air pollution as the fourth-highest ranking global mortality risk factor (GBD 2016). The most recent GBD estimates that exposure to ambient particulate matter (particulate size less than 2.5 µm, PM2.5) causes 4.2 million (95 % confidence interval (CI), 3.7–4.8 million) deaths globally, with an additional 254 000 (97 000–422 000) deaths globally caused by exposure to ozone (O3) (Cohen et al., 2017). For the United States (US), the same study estimated a mortality burden attributable to ambient PM2.5 of 88 400 (66 800–115 000) deaths, and 11 700 (4400–19 600) deaths attributable to O3 in 2015 (Cohen et al., 2017). Adopting similar methods, the US burden of disease study lists ambient PM2.5 and O3 pollution as the 8th and 15th leading risk factors in the US in 2010 (Murray and Collaborators US Burden of Disease, 2013).
Over recent decades, emissions of air pollutants within the US have significantly decreased and air quality has improved. For example, between 1990 and 2010, total US anthropogenic emissions are estimated to have declined by 48 %, 49 %, 67 %, 60 % and 34 %, for NOx (= NO + NO2), non-methane volatile organic compounds (NMVOCs), SO2, CO and PM2.5, respectively (Xing et al., 2013). EPA observations showed that the US average annual PM2.5 concentration declined by 42 % from 2000 to 2016, and maximum daily 8 h average (MDA8) O3 declined by 22 % from 1990 to 2016 (US EPA, 2017). These air quality improvements were likely mainly driven by ambient air quality standards, and federal and state implementation of stationary and mobile source regulations, especially the 1990 Clean Air Act (CAA) Amendments, the 2002 NOx State Implementation Plans (SIP) Call, and the Cross-State Air Pollution Rule (Chestnut and Mills, 2005; US EPA, 2011), together with other rules to reduce anthropogenic emissions from light duty, heavy duty, and nonroad vehicles (Fann et al., 2012b; US EPA, 2014). Other changes in energy and emission control technology that occurred concurrently with air quality regulations also helped to improve air quality. These decreased concentrations are expected to have brought substantial benefits for public health in the US, but assessing the health benefits requires quantification of changes in human exposure relating where air quality has improved to how population and baseline mortality are distributed.
Several recent studies have assessed the global (Anenberg et al., 2010; GBD, 2015, 2016; Lelieveld et al., 2015; Silva et al., 2013, 2016b) or national (Fann et al., 2012a; Punger and West, 2013) burdens of disease attributable to air pollution. However, less effort has been made to understand how these burdens evolve over time. Cohen et al. (2017) used estimates of air pollutant concentrations from a combination of air quality model simulations and satellite and surface observations to study the global and national temporal trends of the burdens of disease attributable to ambient PM2.5 and O3 (only model results were used for O3), at 5-year intervals from 1990 to 2015. Two other studies (Butt et al., 2017; Wang et al., 2017) used coarse-resolution model simulations to study the global/hemispheric PM2.5 mortality burdens for the past few decades. Fann et al. (2017) estimated the annual mean PM2.5 concentration in the US from monitoring data and its all-cause mortality burden in 1980, 1990, 2000 and 2010. Epidemiological studies have also inferred how health effects have changed through time in the US (Correia et al., 2013; Pope et al., 2009). However, previous studies have not estimated mortality burdens for both PM2.5 and O3 in the US for several years in succession or investigated the different drivers for mortality trends or the inter-annual variability of the mortality burdens. The inter-annual variability analysis indicates whether the mortality burden at a given year, such as the results from Cohen et al. (2017) and Fann et al. (2017), is representative of years around it. In the US, such changes in the air pollution mortality burdens can support decision making on air pollution control policies. For the public, analyzing trends can effectively illustrate the benefits of past air pollution controls, as well as the challenges for future policy efforts.
Here we aim to quantify air pollution-related mortality in the continental US in each year from 1990 to 2010, mainly to understand the trends over this time period. We also analyze the contributions of changes in air pollutant concentrations, population, and baseline mortality rates to the overall trend, and analyze the inter-annual variability in mortality burden estimates. To achieve this, we use a 21-year (1990–2010) model simulation of PM2.5 and O3 concentrations over the continental US (CONUS) from 1990 to 2010. We also use annual county-level baseline mortality rates and population archived by the US Centers for Disease Control (CDC WONDER, https://wonder.cdc.gov/mortSQL.html, last access: 5 October 2018).
2.1 Air quality simulations
We use simulations of air quality over the CONUS from 1990 to 2010 by Gan et al. (2015, 2016). These simulations used the WRF-CMAQ model which coupled the Weather Research and Forecasting (WRF, v3.4) model and the Community Multiscale Air Quality (CMAQ, v5.02) model (Wong et al., 2012), covering the CONUS at 36 km × 36 km. These simulations used an internally consistent emission inventory from 1990 to 2010 for the US developed by Xing et al. (2013), three-dimensional meteorological fields constrained by reanalysis of available surface and aloft measurements of the atmospheric state, and time-varying lateral boundary conditions provided by the hemispheric CMAQ (Mathur et al., 2017; Xing et al., 2015). The model system used the CB05 chemical mechanism with the AERO6 module for aerosols.
Gan et al. (2015, 2016) showed that the modeled trends of total PM2.5 and its components generally matched both the CASTNET (Clean Air Status and Trend Network) and IMPROVE (Interagency Monitoring of Protection Visual) observational data from 1995 to 2010, with correlation coefficients usually larger than 0.87 for total PM2.5 and its components. Moreover, the trends for PM2.5 and its species were similar in direction and magnitude (Gan et al., 2015). There was a small or nearly no trend for PM2.5 in the western US for both the model and observations, but a dramatic decreasing trend in the eastern US, with a larger decreasing trend from the model (−0.44 µg m−3 year−1) than from the IMPROVE observations (−0.30 µg m−3 year−1).
For O3, Astitha et al. (2017) used dynamical evaluation methods, and showed that the simulated O3 trends generally agreed very well with the observed downward trends, especially for the period from 2000 to 2010, albeit underestimating trends over some regions, for both the May to September average of daily maximum 8 h (MDA8) and annual 4th highest O3. From 2000 to 2010, the regional trends for the 4th highest O3 from the model (observations) were −0.80 ppbv year−1 (−0.73 ppbv year−1) for Southwest, −1.14 (−1.53) for Southcentral, −1.31 (−1.66) for Southeast, −1.46 (−1.61) for Midwest, −1.35 (−1.79) for Northeast, and −1.11 (−1.40) for CONUS.
2.2 Mortality burden attributable to ambient air pollution
The mortality burdens attributable to ambient PM2.5 and O3 (ΔMort) are estimated using the health impact function (HIF) following Eq. (1):
where y0 is the baseline mortality rate for specific diseases, AF is the attributable fraction calculated as , with RR as the relative risk of death from a specific disease, and Pop is exposed population age 25 years and greater.
For PM2.5, RR is calculated using the integrated exposure–response (IER) model (Burnett et al., 2014), which has been extensively used by recent studies, including Liu et al. (2017), Silva et al. (2016a, b), Wang et al. (2017), and the World Health Organization (2016). The RR is calculated as a function of PM2.5 concentration following Eq. (2):
where C is the annual average ambient PM2.5 concentration, C0 is the PM2.5 threshold concentration (5.8–8.0 µg m−3), below which no additional risk is assumed, and the parameter values of α, γ, and δ are given by distributions (Burnett et al., 2014). For this study, the RRs are downloaded from the GBD website (Global Health Data Exchange (GHDx), 2013).
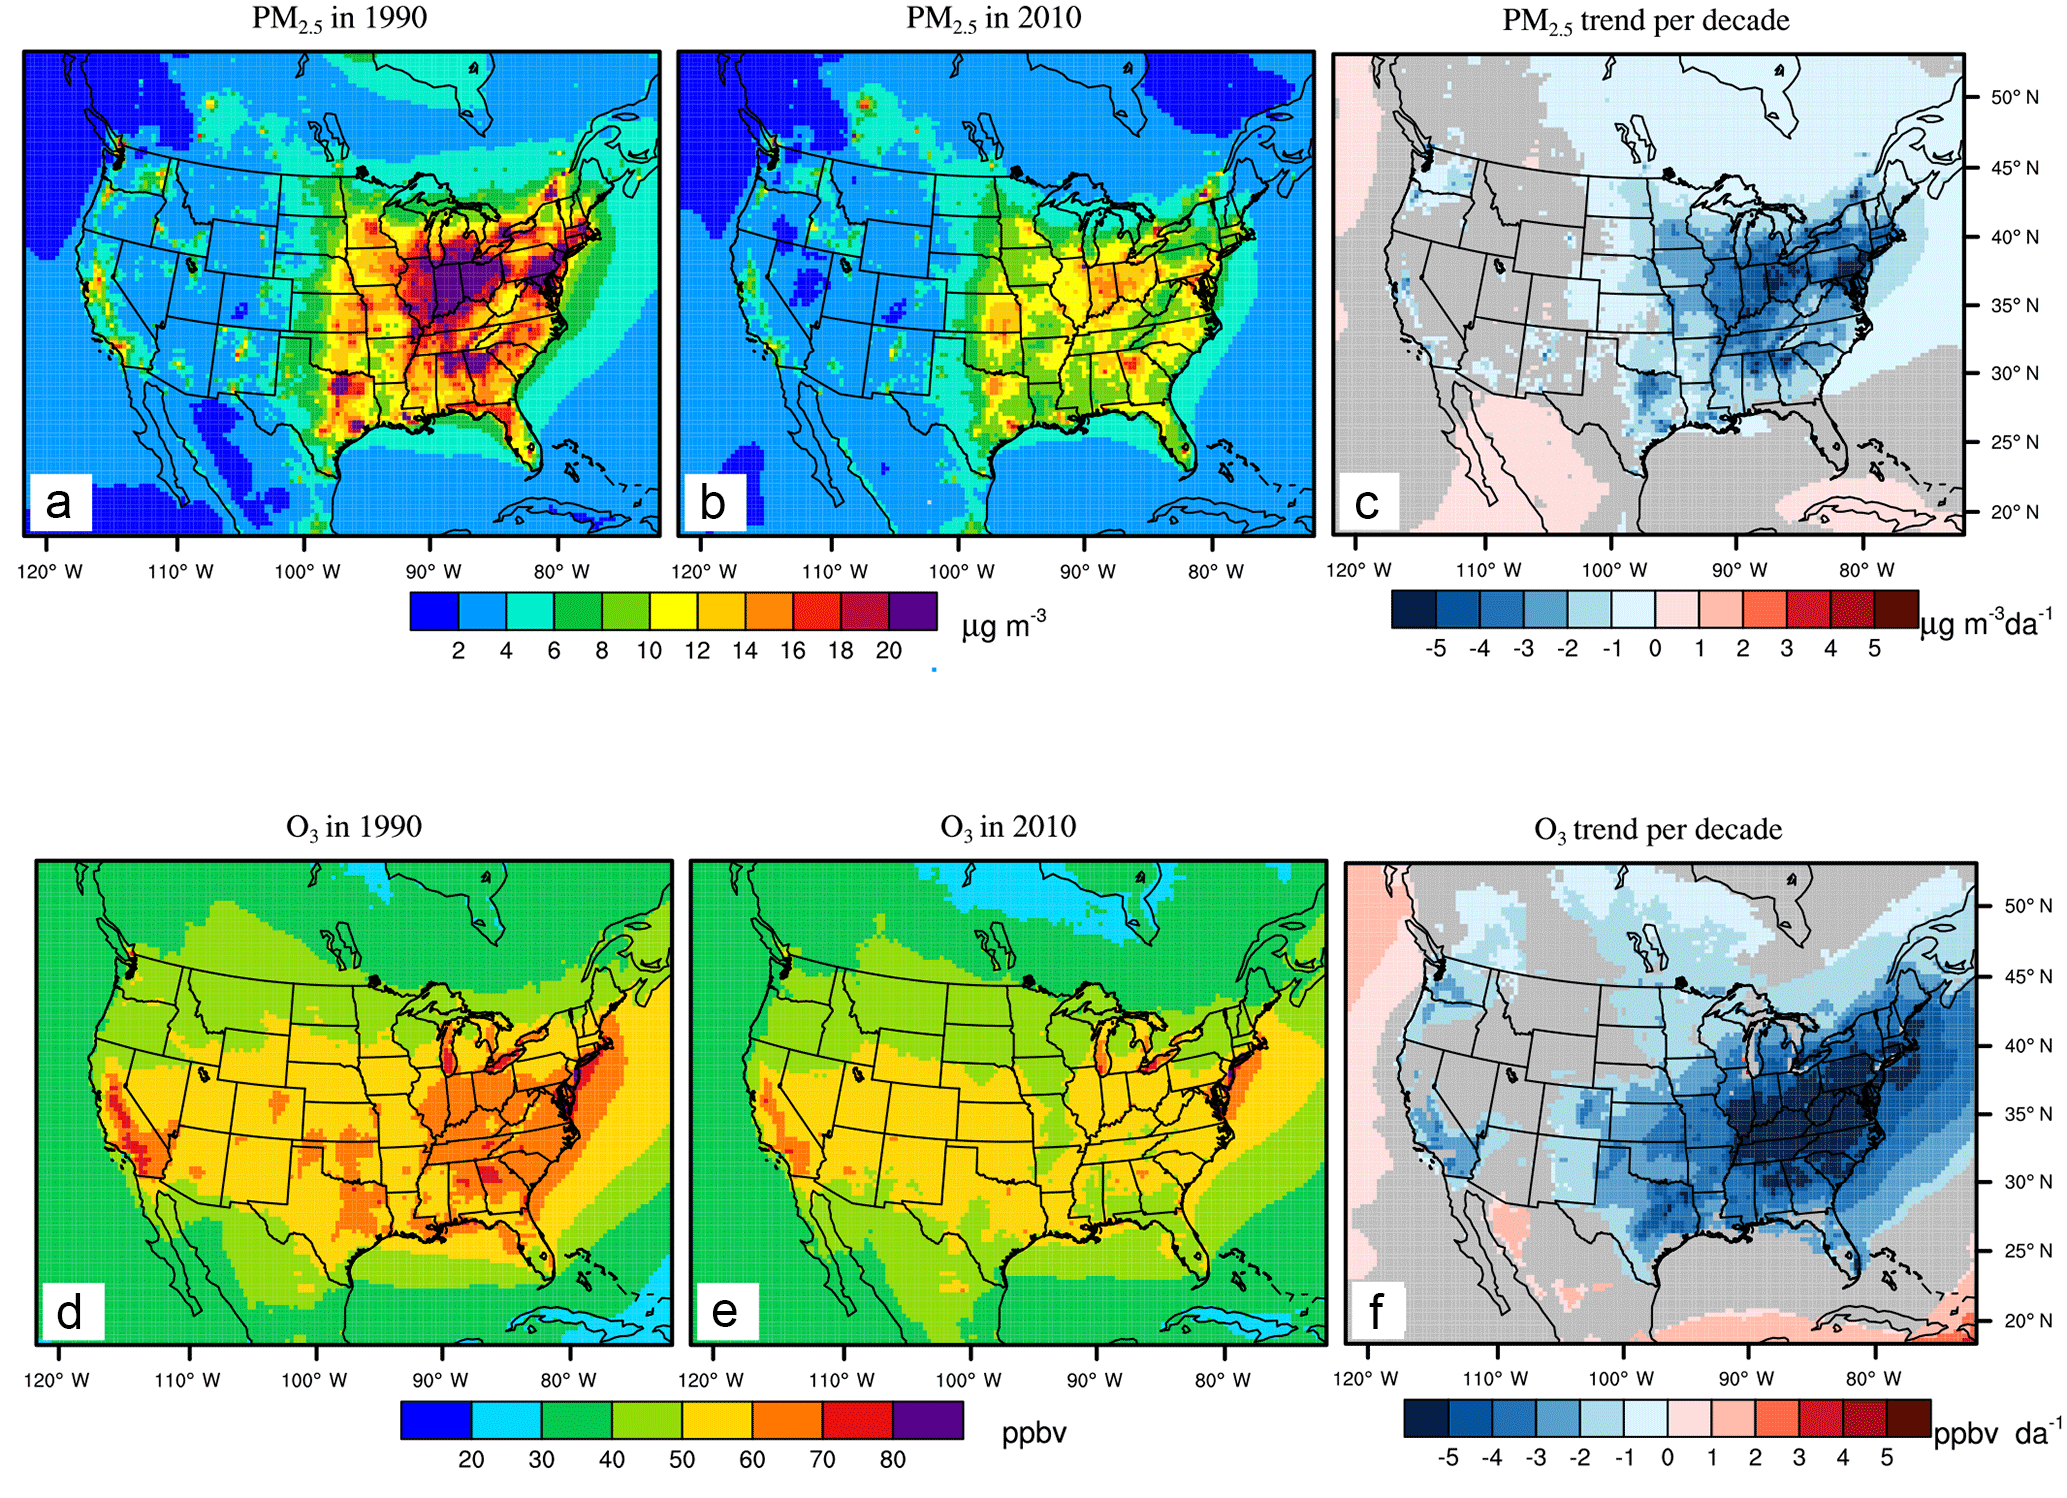
Figure 1Annual mean PM2.5(µg m−3) in 1990 (a) and 2010 (b), and the 21-year trends (c, µg m−3 decade−1 (µg m−3 decade−1)) and summertime average of 1 h daily maximum O3 in 1990 (ppbv) (d) and 2010 (e), and the trend (f, ppbv decade−1 (ppbv decade−1)). The grey shaded areas in panels c and f indicate trends that are insignificant with p-values for the standard Student's t test larger than 0.05.
For the O3-related mortality burden, RR =expβΔX, where β is the concentration response factor, and ΔX is the difference in O3 concentration (summertime 1 h daily maximum O3) between the current year (1990 to 2010) and the low-concentration threshold. For RR, we use the value of 1.040 (with 95 % CI: 1.013, 1.067) from Jerrett et al. (2009) following recent studies (e.g., Cohen et al., 2017; GBD, 2015, 2016; Lim et al., 2012). Turner et al. (2016) found a larger RR for respiratory mortality (RR, 1.12; 95 % CI, 1.08–1.16) associated with the annual average of MDA8 O3, and using these results would likely lead to a larger O3 mortality burden (Malley et al., 2017). We account for all chronic respiratory disease (RESP), to be consistent with Jerrett et al. (2009). The counterfactual concentration of 37.6 ppbv (Lim et al., 2012; Lelieveld et al., 2015) is used in our study, to be comparable with Cohen et al. (2017). We use adults above 25 years, to be comparable with other calculations of PM2.5 mortality burden following Silva et al. (2016a, b), even though the estimated RRs from Jerrett et al. (2009) were for adults above 30 years old only. Uncertainties in air pollution-related mortality burden calculations are based on the uncertainty in RRs only, ignoring those in modeled air pollutant concentrations, and population and baseline mortality rates, which may be larger than that from the RRs but are not in the scope of our study.
We use baseline mortality rates from each year to calculate deaths from air pollution in each year, as changes in baseline mortality rates from other socioeconomic determinants are likely more important than changes in deaths from air pollution. To estimate the annual baseline mortality rates (y0) for each disease associated with PM2.5 (chronic obstructive pulmonary disease, COPD; ischemic heart disease, IHD; lung cancer, LC; cerebrovascular disease and ischemic stroke, STROKE) and O3 (RESP), we acquire US county-level specific causes of mortality data for each year from the National Center for Health Statistics (NCHS) (CDC, 2017). We then aggregate the county-level mortality data to each model grid cell at 36 km × 36 km. The specific causes of mortality data for some counties are sometimes suppressed when the total deaths are lower than 10 year−1 to protect privacy (Jian et al., 2016), missing or considered “unreliable” when the total deaths are less than 20 year−1, and are corrected following established procedures (BenMAP, 2017; Fann et al., 2017; also see the Supplement).
Definitions of each disease follow the GBD study (Lim et al., 2012; Table S1 in the Supplement). Note that the CDC changed the disease codes from the International Classification of Diseases 9th Revision (ICD 9) in 1998 to ICD10 in 1999, and there were discontinuities in the death counts of specific diseases (Anderson et al., 2001; Anderson and Rosenberg, 2003). To account for the discontinuities, we group the total deaths for each of the five diseases for ICD9 and ICD10 using the results of Anderson et al. (2001) and Anderson and Rosenberg (2003), who reported deaths for 135 specific causes in 1996 for both the ICD9 and ICD10 codes, and calculate comparability ratios (Table S1). We then recalculate comparability ratios for the five diseases (RESP, COPD, IHD, LC and STROKE) as the ratios of deaths for ICD9 and ICD10 (Table S2). Finally, we apply these ratios to the ICD9 baseline mortality rates from 1990 to 1998.
Annual population in the US at county level was taken from the US Bureau of Census, which reported populations associated with the 1990, 2000, and 2010 censuses and estimated population for each year in between (CDC 2017; https://www.cdc.gov/nchs/data/nvss/bridged_race/Documentation_bridge_postcenv2017.pdf, last access: 5 September 2018). The adult population above 25 years in the US has steadily grown between 1990 and 2010, with an average 1.23 % year−1 rate of increase (Fig. S1 in the Supplement).
2.3 The contribution of different factors to mortality trends
The overall trends in PM2.5- and O3-related mortality between 1990 and 2010 are a combination of contributions from trends in population, baseline mortality rates, and concentration. Here we separate the contributions of each factor by assuming that only a single factor was changing from 1990 to 2010, with the other two constant at 1990 levels. For example, the mortality burden change associated with air pollution changes in year y (), relative to 1990, is calculated following Eq. (4):
Similarly, we also calculate the mortality burden change without accounting for ambient air pollution changes () following Eq. (5):
3.1 Air quality trends
From 1990 to 2010, annual average PM2.5 in the model decreases significantly in the eastern US (Fig. 1c), but slightly decreases or even increases in the northwest, southwest and west (Fig. S2 and Table S3; also see Fig. S3 for the US 9 regions defined by the National Oceanic and Atmospheric Administration, Zhang et al., 2016). The dramatic decreasing trends of PM2.5 in the eastern US were also reported in previous studies (Gan et al., 2015; Xing et al., 2015) due to emission reductions. The increasing trend in the western central area is due in part to frequent wildfires (Dennison et al., 2014; Hand et al., 2013, 2014; Jaffe et al., 2008; Murphy et al., 2011; Spracklen et al., 2007). In general, the decadal decreasing trends in the east are larger than 2 µg m−3 decade−1 from 1990 to 2010, especially in the central area (−3.48 µg m−3 decade−1) and northeast (−3.14 µg m−3 decade−1). The summertime average of 1 h daily maximum O3 decreases significantly in the central and eastern US, generally at a rate greater than 4 ppbv decade−1. It also decreases in the western US, but at a much smaller rate than in the east, generally less than 1 ppbv decade−1 (Fig. 1f; Table S3).
In Fig. 2, both the spatial average and population-weighted average (PWA) annual PM2.5 exhibit smooth decreasing trends (Fig. 2, top): the spatial average of annual PM2.5 has decreased by 29 %, from 9.07 µg m−3 in 1990 to 6.45 µg m−3 in 2010, with a decadal rate of decrease of 1.1 µg m−3 decade−1. The corresponding PWA PM2.5 decreases by 39 %, from 17.61 µg m−3 in 1990 to 10.73 µg m−3 in 2010, with a decadal decreasing rate of 3.2 µg m−3 decade−1. Years with high PM2.5, such as in 1994, 1996, and 2000, are mainly caused by increases in organic carbon due to large wildfires in the western US (Spracklen et al., 2007). Both the spatial average and PWA O3 also exhibit decreasing trends over the past 2 decades, with greater inter-annual variability resulting from meteorological variability (Porter et al., 2017). The spatial average O3 concentration decreases by 9 %, from 55.02 ppbv in 1990 to 49.99 ppbv in 2010, decreasing at a rate of 2.4 ppbv decade−1. The PWA O3 also decreased by 9 %, from 58.96 ppbv in 1990 to 53.57 ppbv in 2010, decreasing at a rate of 3.0 ppbv decade−1. We also calculate the air quality and mortality burden trends separately for two 11-year periods, 1990 to 2000 and 2000 to 2010, following Astitha et al. (2017). Both PM2.5 and O3 decrease more strongly in the second decade than in the first decade for both spatial average and PWA (Table S5), consistent with previous findings (Astitha et al., 2017; Gan et al., 2015; Porter et al., 2017; Xing et al., 2015).

Figure 2Population-weighted average (Popweighted avg) and spatial average over CONUS land areas of annual average PM2.5 (a) and summertime average of 1 h daily maximum O3 (b) concentration from 1990 to 2010. Population-weighted average concentrations are based on population in each year. Using the same population in each year yields estimates of population-weighted concentrations that are only slightly different (not shown).
We then calculate trends in the number of days annually that exceed the daily PM2.5 standard (35 µg m−3), and the daily MDA8 O3 standard (70 ppbv) (Fig. S4). The exceedance days decrease for both PM2.5 and O3, especially in the eastern US. In 2010, fewer than 5 days exceed the air quality standard for the majority of the US (Fig. S4b, e). We also calculate the population exposure exceedances by multiplying the population (adults > 25 years old) by the number of air quality exceedance days in each grid cell. The PM2.5 population exposure exceedances have decreased from 5340 million people-days in 1990 to 1042 million people-days in 2010, and the O3 population exposure exceedances has decreased from 4691 million people-days in 1990 to 2236 million people-days in 2010 (Fig. S1). These decreases in population exposure exceedances occur despite population growth over this period.
3.2 Mortality burden trends and contributing factors
The mortality burdens associated with exposure to ambient PM2.5 in the US steadily decreased by 54 %, from 123 700 (95 % confidence interval considering the uncertainty in relative risk only, 70 800–178 100) deaths year−1 in 1990 to 58 600 (24 900–98 500) deaths year−1 in 2010 (Fig. 3). The leading cause of PM2.5-related mortality is IHD, which decreases by 55 %, from 96 500 (62 600–132 500) deaths year−1 in 1990 to 43 600 (21 500–68 700) deaths year−1, followed by LC, which has decreased by 44 %, from 12 500 (2500–21 000) deaths year−1 in 1990 to 7000 (900–13 400) deaths year−1 in 2010 (Table S4). The PM2.5 mortality burden per 100 000 adults is much higher in the east than the west for both 1990 and 2010 (Fig. 4), due to the higher PM2.5 concentrations (Fig. 1).
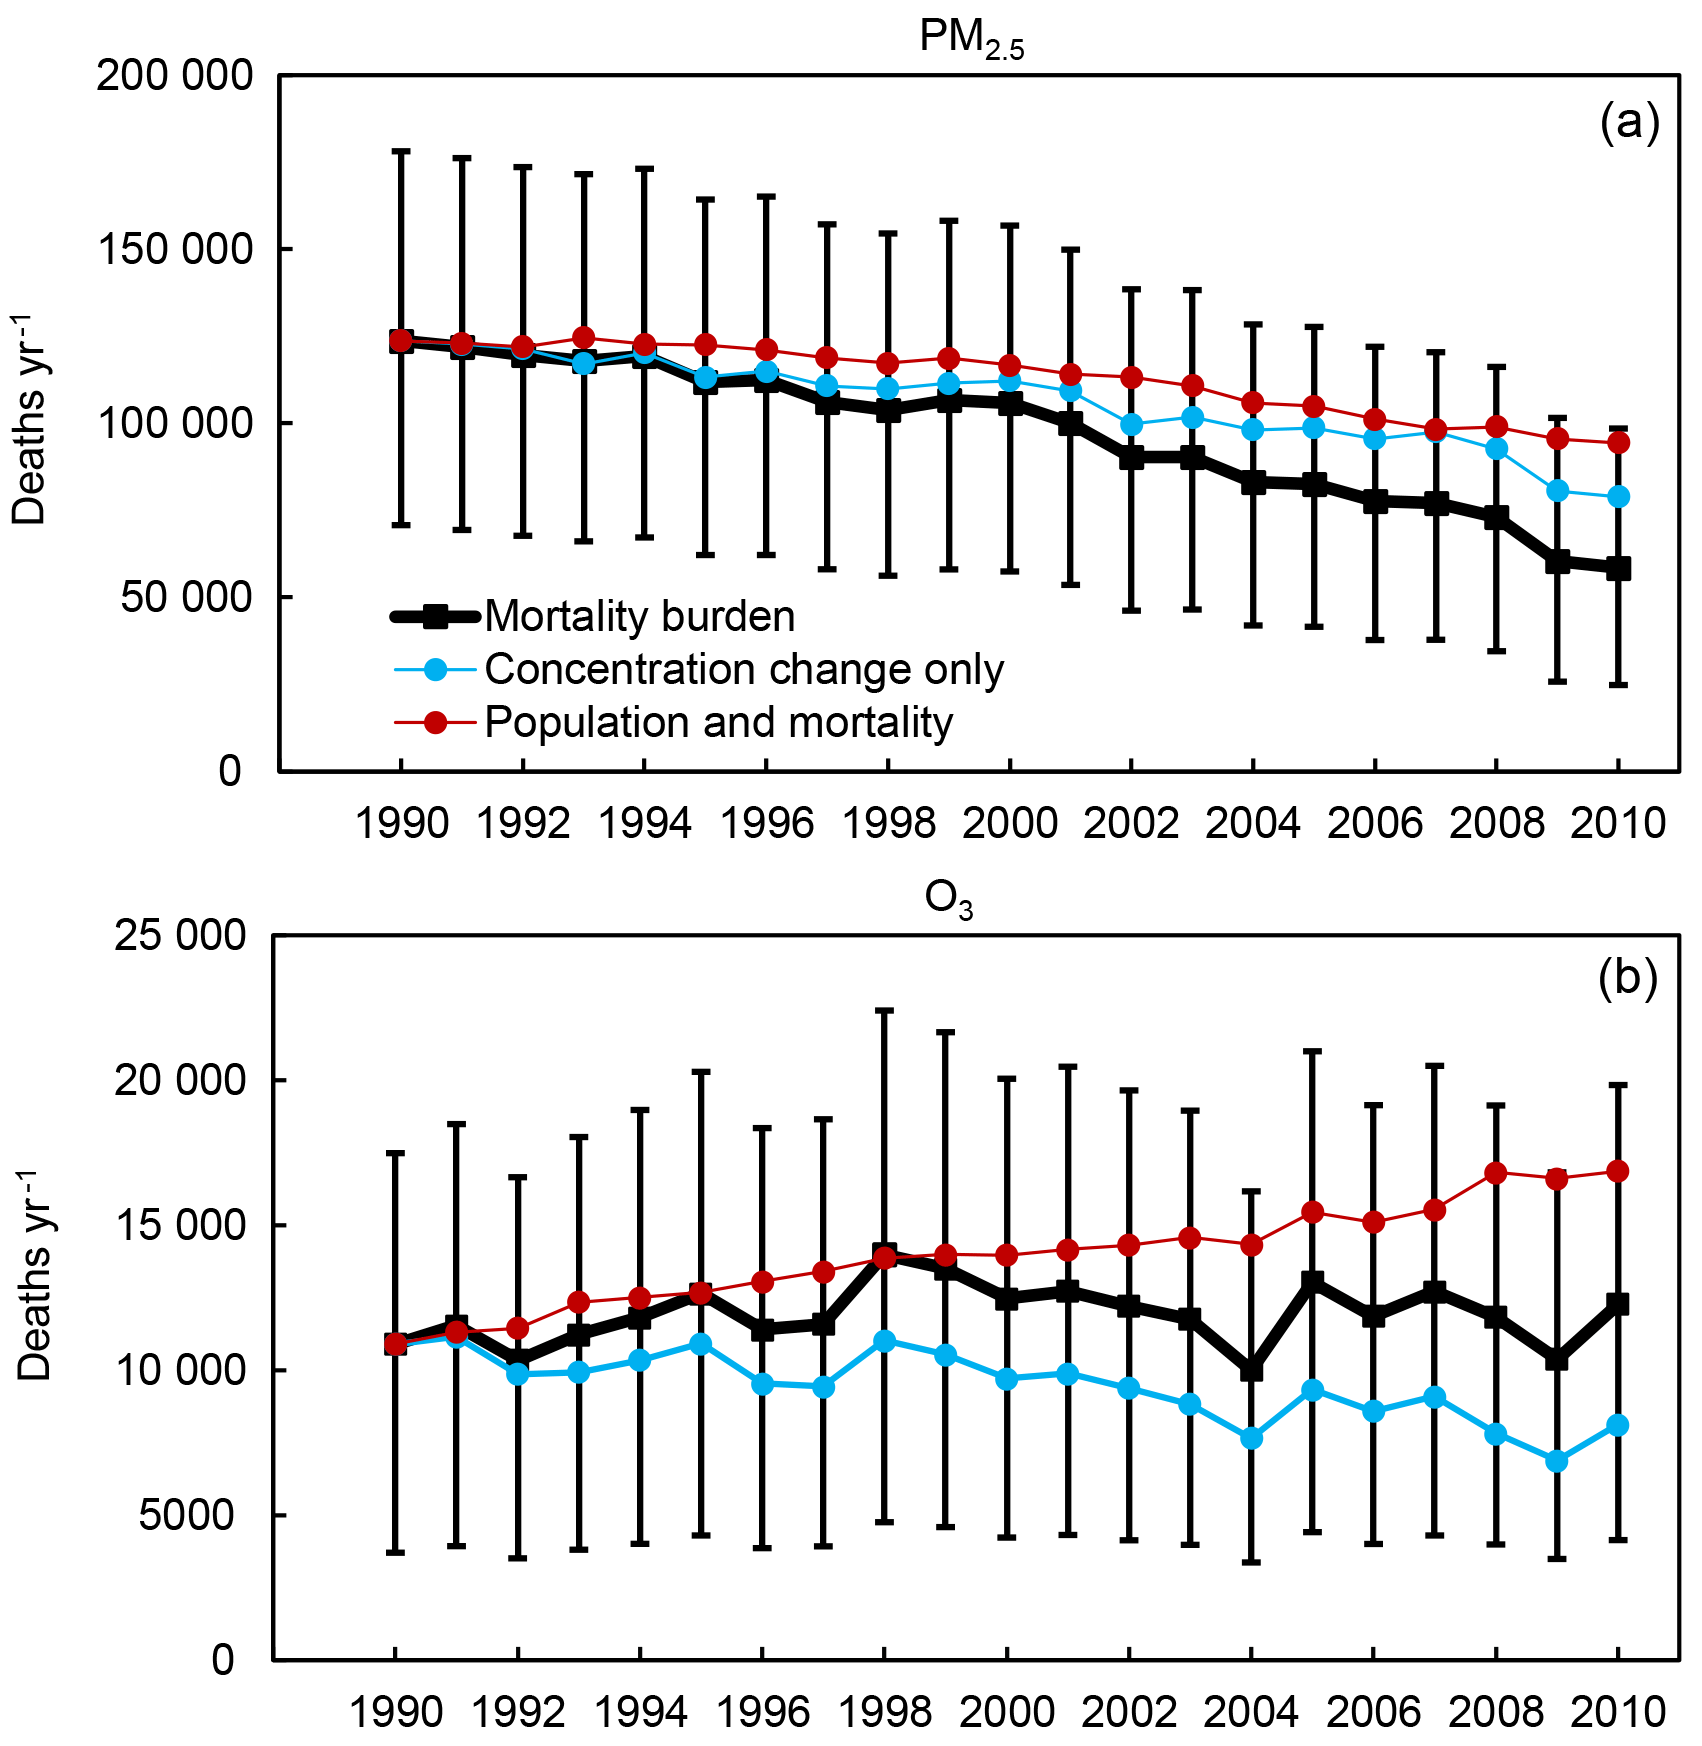
Figure 3Trends in the total mortality burden (black) for PM2.5 (a, as a total of ischemic heart disease (IHD) + stroke (STROKE) + chronic obstructive pulmonary disease (COPD) + lung cancer (LC)) and O3 (b, chronic respiratory disease (RESP)), and mortality burdens considering the air quality change only (blue), and with air quality changes excluded (red). Units are deaths year−1. The error bars are the 95 % CI for the total mortality burden (black).
Table 1The total mortality burdens in 2010 and the burdens in 2010 due to changes since 1990 in each of three factors (concentration, baseline mortality rates and population) and where the concentration change is excluded, for PM2.5 and O3, and the relative changes between 2010 and 1990. The relative changes are calculated as (2010–1990) / 1990. The mortality burdens in the US for PM2.5 and O3 in 1990 are 123 700 deaths year−1 (70 800–178 100) and 10 900 deaths year−1 (3700–17 500).
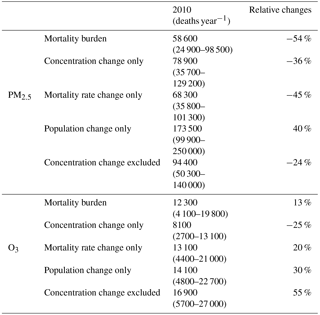
Table 1 shows the mortality burdens for PM2.5 and O3 in 2010, and also the burden changes since 1990 from different contributing factors. From the table, we see that the PM2.5-related mortality burden in 2010 would have decreased by only 24 % (94 400 deaths year−1 in 2010, 95 %CI, 50 300–139 800) compared with that in 1990, if the PM2.5 concentrations had stayed constant over the period 1990–2010, due to decreases in the baseline mortality rates for the specific causes of death that PM2.5 influences (Fig. 3), especially IHD (Fig. 5), despite the population increase. Therefore, the reduction in PM2.5 concentrations from 1990 to 2010 significantly accelerates the decrease in the mortality burden. The decreased PM2.5 concentration avoided roughly 35 800 (38 %) PM2.5-related deaths in 2010, compared to the case if current air quality stays at level in 1990 (estimated as the 2010 mortality burden minus the “concentration change excluded” case in 2010). The benefit of the decreased PM2.5 concentration could also be estimated as the “concentration change only” case in Fig. 3, yielding 78 900 (35 700–129 200) deaths year−1 in 2010, decreasing by 36 % (−44 800 deaths year−1) compared with 1990. The population increases from 1991 to 2010 would lead to increases in the PM2.5 mortality burden, but that increase is smaller than the combined reduction from decreasing PM2.5 concentrations and baseline mortality rates (Figs. S5 and S6).
When separating the two 11-year periods, the PM2.5-related mortality burden decreased by 45 % from 2000 to 2010 (decreasing trend of −4400 deaths year−1), much higher than the 15 % decrease from 1990 to 2000 (decreasing trend of −2100 deaths year−1) (Table S5). The detrended annual PM2.5-related mortality burden has a coefficient of variation (CV, standard deviation divided by the average) of 4 %, mainly caused by inter-annual variation in PM2.5 concentrations (Table S6 and Fig. S6).
We also calculate burdens and trends for each state individually (Table 2). The three states with the highest PM2.5 mortality burden in 1990 are New York (NY, 13 700 deaths year−1), California (CA, 9500 deaths year−1) and Pennsylvania (PA, 9200 deaths year−1); and in 2010, NY (5100 deaths year−1), Texas (TX, 4200 deaths year−1) and Ohio (OH, 3900 deaths year−1). NY has seen the largest benefits of mortality burden decreases (−8500 deaths year−1), followed by CA (−6100 deaths year−1) and PA (−5500 deaths year−1). For the relative mortality burden changes, generally large percent decreases in PM2.5-related mortality are seen in western, northern, and northeastern states (including Nevada, Utah, Colorado, Montana, Maine and Vermont) (Fig. 6), because the PM2.5 concentrations in 2010 are very low or even fall below the low-concentration threshold in these states (Fig. 1), as confirmed by the mortality burden changes from concentration changes alone (Table S7). For other states in the eastern US with large relative mortality burden changes, the contributing factors are different. For example, for Connecticut, the relative mortality burden changes from the decrease in PM2.5 concentration are larger than that from the decrease in the baseline mortality rates. However, for Massachusetts, NY and PA, the decreases in baseline mortality rates have a slightly larger effect than that from the decrease in PM2.5 concentration. For CA, the effects from the decrease in baseline mortality rates and PM2.5 concentration are comparable (Table S7).
Table 2The mortality burden for 48 US states and the District of Columbia in 1990 and 2010, and the absolute changes from 1990 to 2010. Units are deaths year−1.
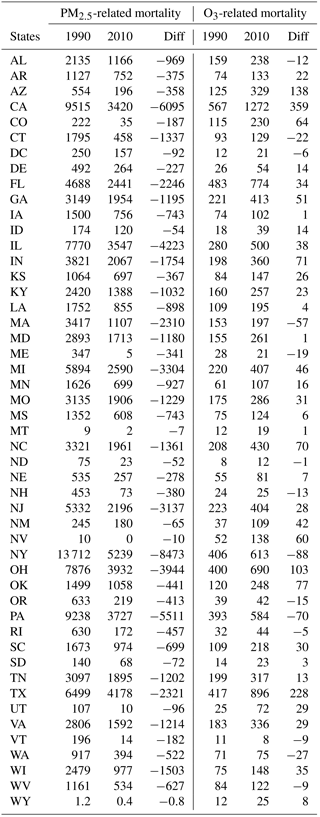
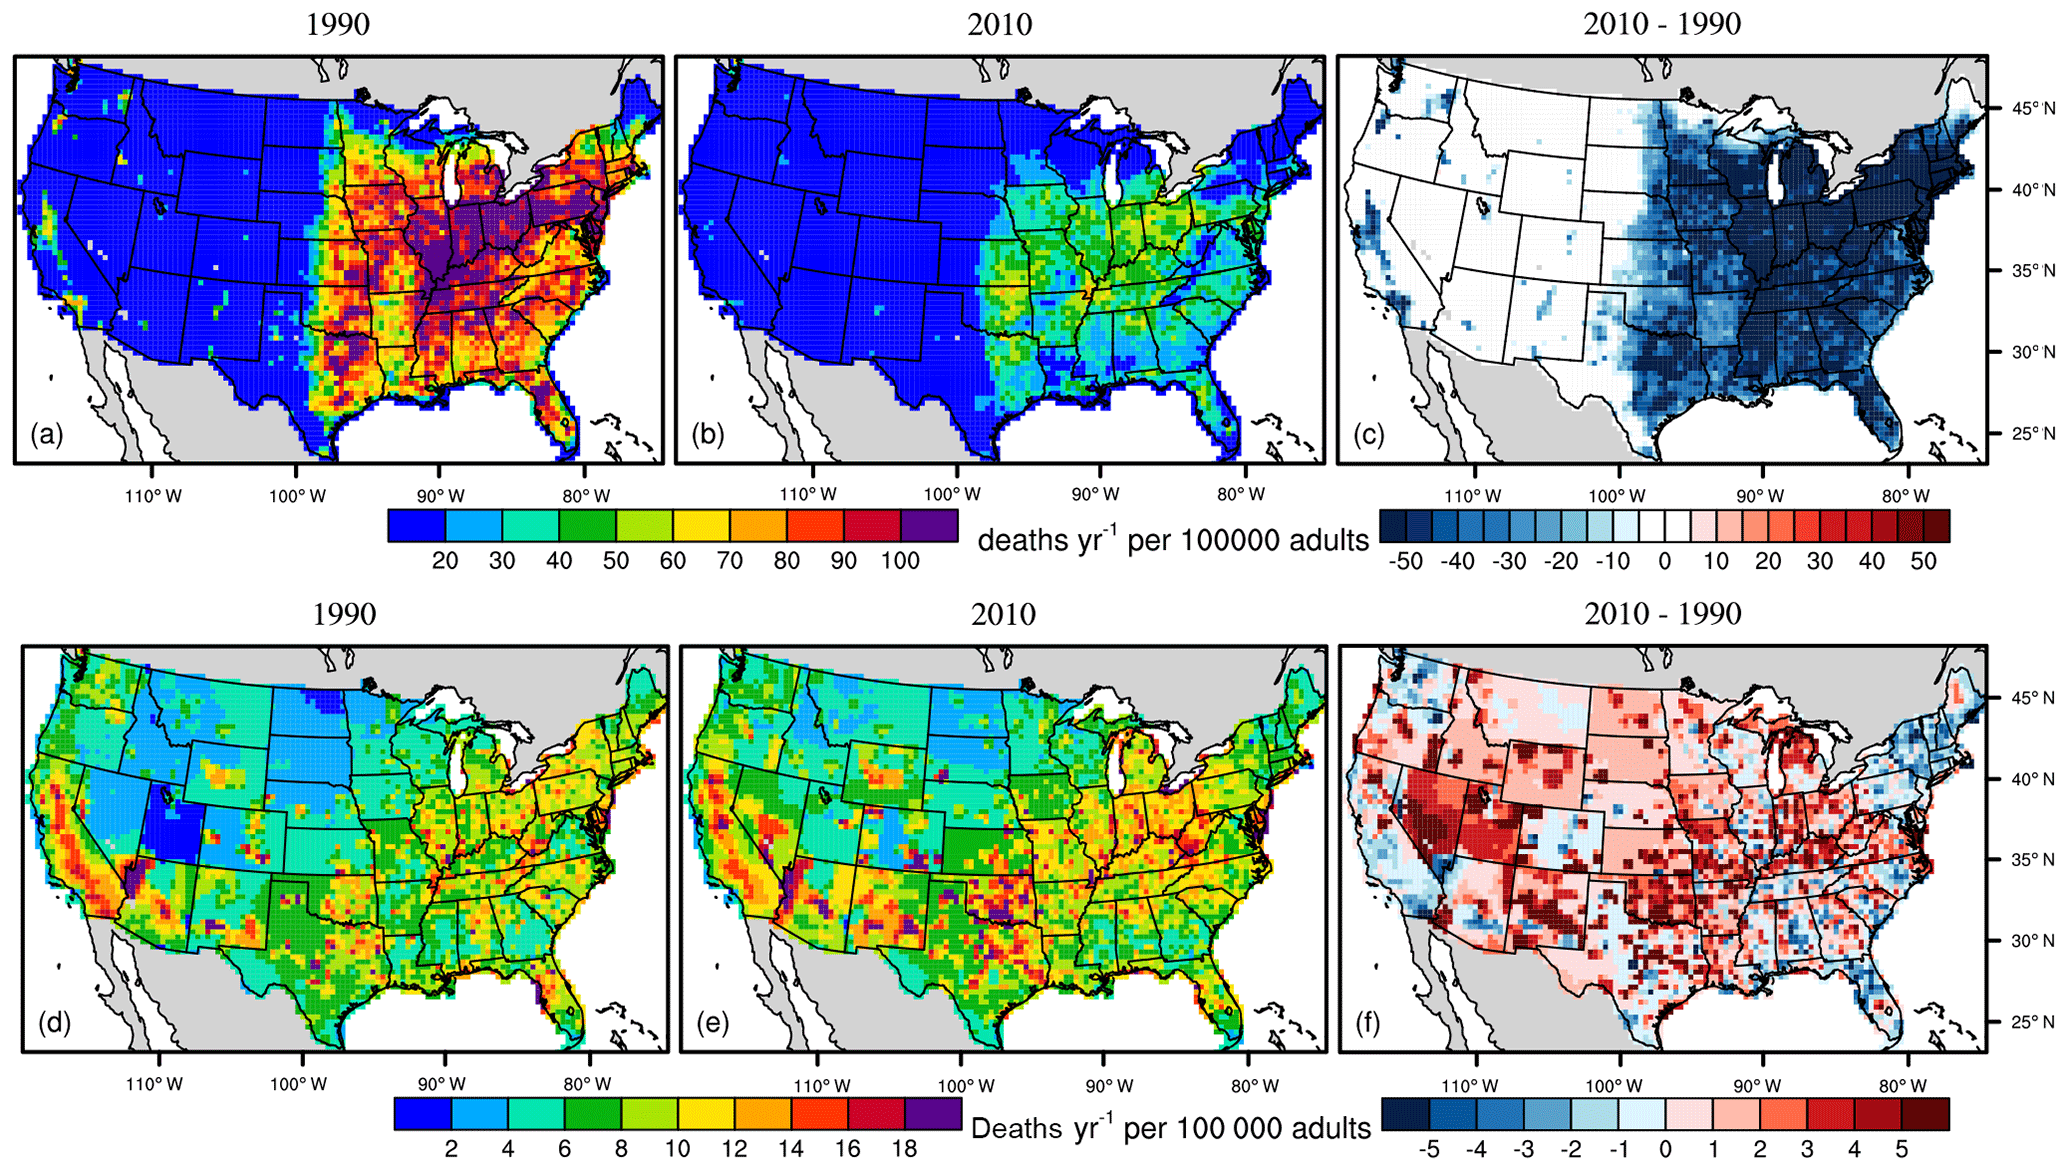
Figure 4The mortality burdens associated with PM2.5 (a, b), O3 (d, e) in 1990 (a, c) and 2010 (b, d), and the differences (2010 minus 1990) (c, f) for each 36 km × 36 km grid cell. Units are deaths year−1 per 100 000 adults (above 25 years old).
The mortality burden associated with exposure to O3 from RESP has increased by 13 %, from 10 900 (3700–17 500) deaths year−1 in 1990 to 12 300 (4100–19 800) deaths year−1 in 2010 (Fig. 3). The O3 mortality burden per 100 000 adults is highest in the midwest and southwest (Fig. 4). The O3-related mortality burden in 2010 would have increased by 55 % (10 600 deaths year−1 in 2010, 95 % CI, 3600–17 100) compared with that in 1990 if the O3 concentration had stayed constant over the period 1990–2010 (Fig. 3), due to increases in both population and baseline mortality rates (Fig. S5). The decreased O3 concentration would have avoided roughly 4600 (27 %) O3-related deaths in 2010, compared to the case if ozone concentrations stay at level in 1990 (estimated as the 2010 mortality burden minus the “concentration change excluded” case in 2010). The benefit of the decreased O3 concentration could also be estimated as the “concentration change only” case in Fig. 3, yielding 8100 (2700–13 100) deaths year−1 in 2010, decreasing by 25 % (−2800 deaths year−1) compared with 1990. The change in O3 generally reduces the mortality burden relative to 1990 with some inter-annual variation (Fig. S6) due to meteorology and wildfires (Porter et al., 2017), while the increases in population and baseline mortality rates generally increase the mortality burden, with a larger contribution from the population change (Fig. S6).
When separating the O3 mortality trends into 2 decades, we find that the burdens decrease slightly (−70 deaths year−1) from 2000 to 2010, compared with the increasing trend from 1990 to 2000 (240 deaths year−1) (Table S5). The increasing trend in the first decade is caused by the combined effect of increases in baseline mortality rates and population, while the decreasing trend in the second decade is dominated by decreases in O3 concentration (Fig. S6). The inter-annual variability for the detrended annual O3 mortality burden from 1990 to 2010 (CV of 12 %) is larger than PM2.5 (CV of 4 %), caused mainly by variations in O3 concentrations from 1990 to 2010 (Table S6).
The three states with the highest O3 mortality burden in 1990 are CA (910 deaths year−1), Florida (FL, 740 deaths year−1) and NY (700 deaths year−1); and in 2010, CA (1270 deaths year−1), TX (900 deaths year−1) and FL (770 deaths year−1) (Table 2). CA has seen the largest O3 mortality burden increases (360 deaths year−1), followed by TX (230 deaths year−1) and Arizona (AZ, 140 deaths year−1), with the greatest decrease in NY (−90 deaths year−1). For the relative mortality burden changes, large percent decreases in O3-related mortality are seen in the northwestern (Washington and Oregon) and northeastern US (Fig. 6), mainly caused by significant O3 decreases (Table S7), while the greatest percent increases occur in the southwestern US driven mainly by large population increases, and also the baseline mortality rate increases.
Previous health impact assessments have used national baseline mortality rates (Cohen et al., 2017; Silva et al., 2016a, b, etc.), but baseline mortality rates can vary strongly within individual counties (Fig. 5; Dwyer-Lindgren et al., 2016). We performed sensitivity analyses by applying the national average baseline mortality rates for each disease to every county in the mortality burden calculations. We find that the PM2.5 mortality burden calculated from the national average baseline mortality rates is lower than those calculated from the county-level baseline mortality rates, ranging among individual years from −2.2 % to −1.3 % (Table S8). For the O3 mortality burden, the differences between using the national average baseline mortality rates and our best estimates range from −1.1 % to 2.0 % (Table S8). However, using the national average baseline mortality rates fails to capture regional mortality burden hotspots for both PM2.5 and O3 (Figs. S7–S8), demonstrating the value of using county-level baseline mortality rates where possible.
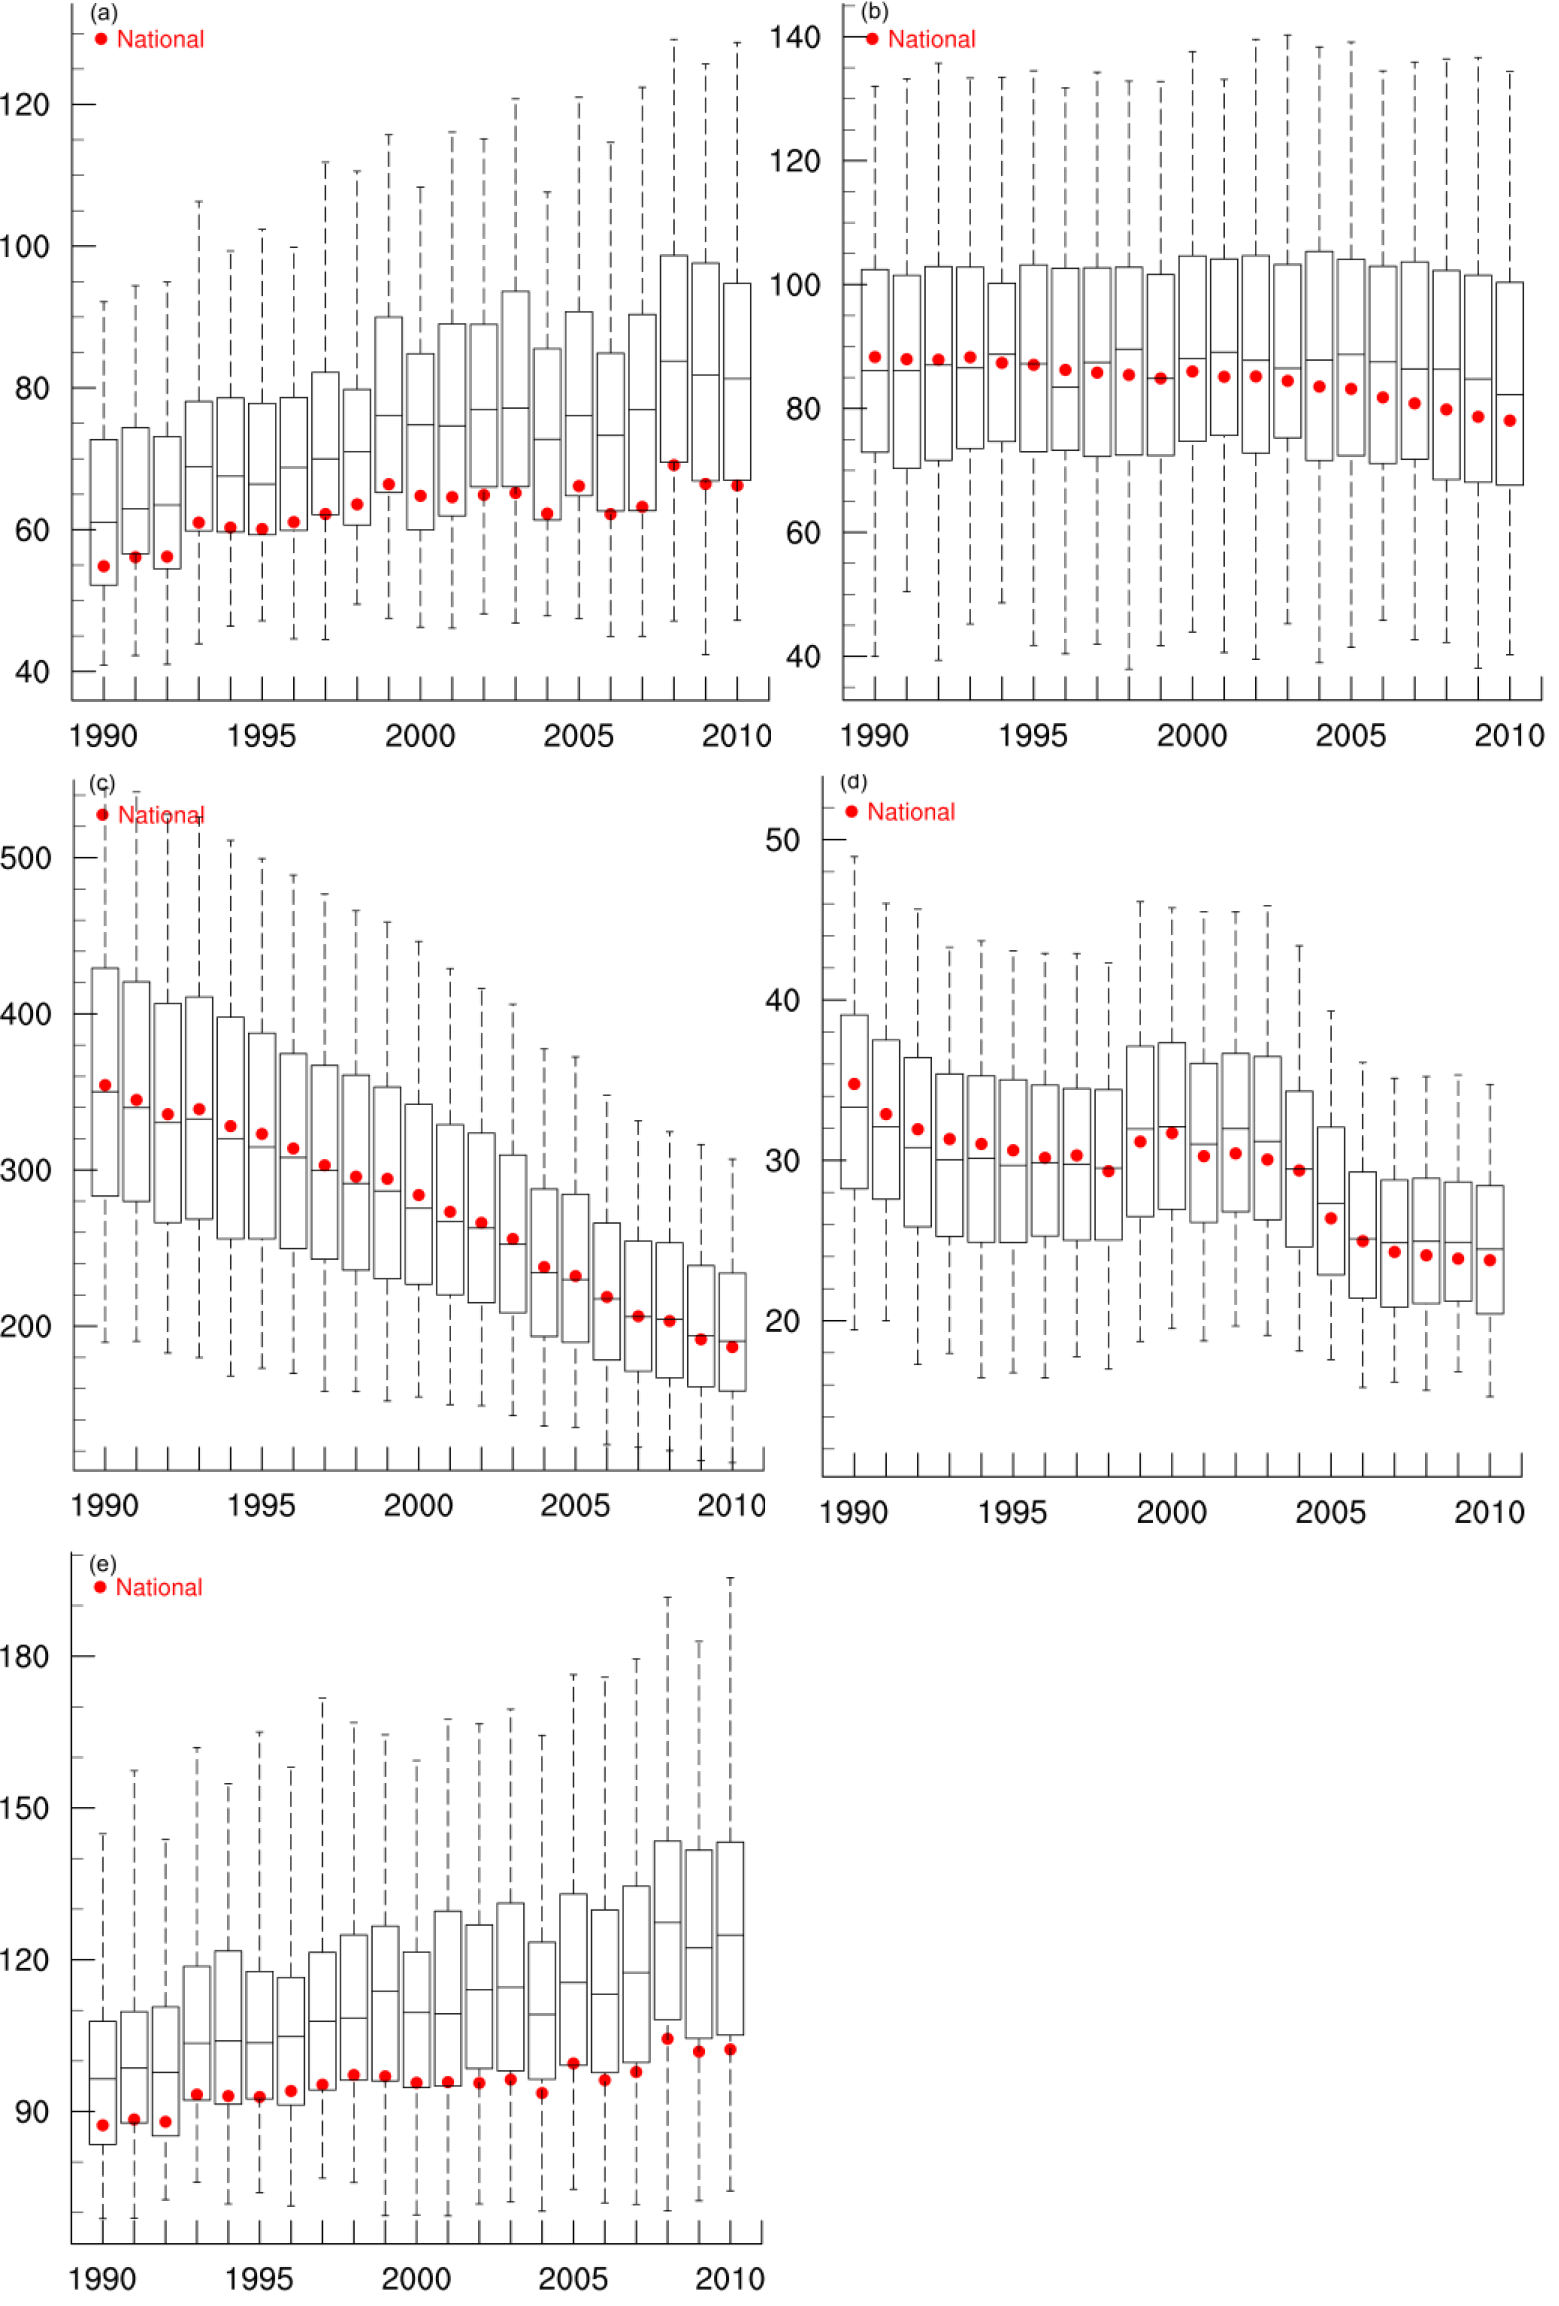
Figure 5The baseline mortality rates for specific causes of death related to PM2.5, including chronic obstructive pulmonary disease (a), lung cancer (b), ischemic heart disease (c) and stroke (d), and respiratory diseases related to O3 (e). The bottom whiskers, bottom border, middle line, top border and top whiskers of the boxes indicate the 5th, 25th, 50th, 75th, and 95th percentiles, respectively, across all counties; the red circles are the national average rate. Baseline mortality rates are shown for 1990–1998 after they are corrected to ensure comparability between ICD9 and ICD10 codes. The units on the y axis are per 100 000 people.
3.3 Comparison with previous studies
The mortality burden associated with PM2.5 calculated in our study generally aligns with several previous findings (Fig. 7; also Table S9). Our PM2.5 mortality burden is higher than that reported by Cohen et al. (2017) in 1990 (17 % higher) and 1995 (4 % higher), and lower in 2000 (−0.5 %), 2005 (−17 %) and 2010 (−30 %) (Fig. 7). The overestimation of PM2.5 mortality burdens in the early 2000s are likely due to the higher population-weighted PM2.5 concentration simulated by WRF-CMAQ (Fig. 2), compared with Cohen et al. (2017), in which they estimated the PM2.5 concentration based on data fusion of air quality model outputs, satellite retrievals and ground observations. The lower mortality burdens in the second decade (from 2000 to 2010) in our study likely reflect that Cohen et al. (2017) included hemorrhagic stroke and lower respiratory infections in the PM2.5-related mortality burden, in addition to COPD, LC, IHD and STROKE, and used an updated integrated exposure–response function. While the absolute value is similar, our results show a stronger decreasing trend (−3000 deaths year−1) than Cohen et al. (2017) (−1000 deaths year−1), which may result from the overestimation of PM2.5 decreasing trends in our model relative to ground observations (Gan et al., 2016). The PM2.5 mortality burdens estimated in our study are much lower than those from Fann et al. (2017), but the temporal patterns are similar, mainly because Fann et al. (2017) estimated the total all-cause mortality with a different HIF.

Figure 6Relative mortality burden changes from 1990 to 2010 for the 48 states and the District of Columbia for PM2.5 (a) and O3 (b). The relative changes are calculated as (2010–1990)/1990 × 100 %. Note the different color scales for the two plots. The values for the District of Columbia are −37 % for PM2.5 and −23 % for O3.
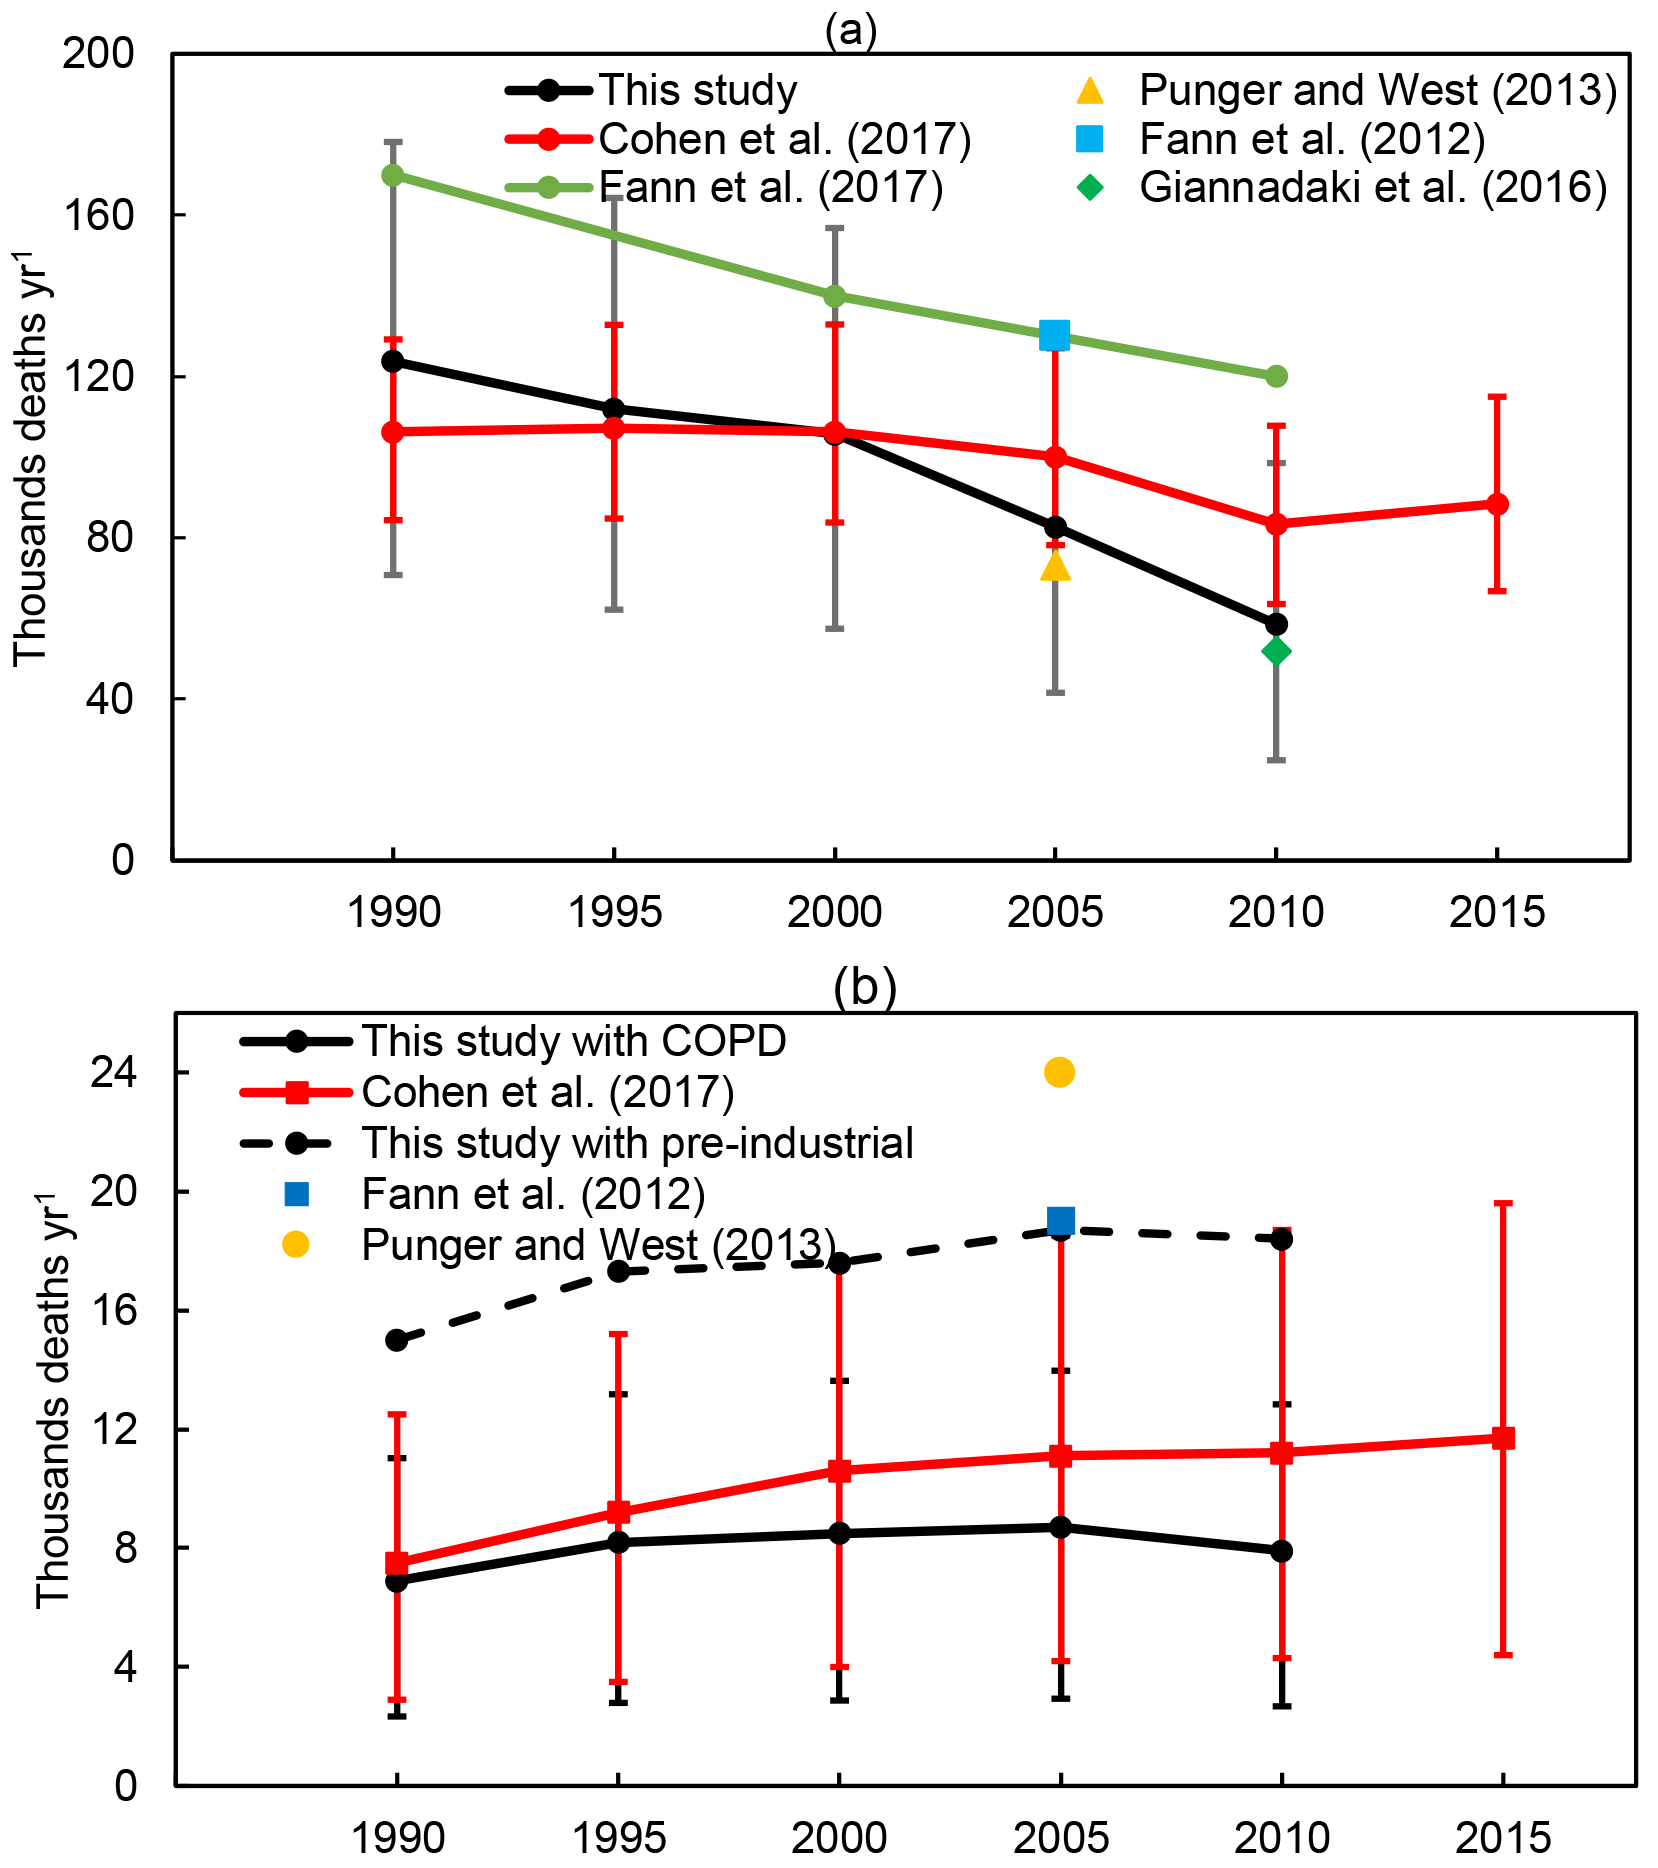
Figure 7Comparisons of the US mortality burdens attributed to PM2.5 (a) and O3 (b) in this study, with Cohen et al. (2017), Fann et al. (2012a, 2017), Punger and West (2013), and Giannadaki et al. (2016). The black line for O3 is the recalculated O3 mortality burden from the COPD, and the black dashed line is the recalculated O3 mortality burden from RESP using the pre-industrial O3 concentration as the counterfactual risk exposure factor. The error bars show the 95 % CI from the RRs, shown for this study and Cohen et al. (2017).
To compare with Cohen et al. (2017), who reported the O3 mortality burden from the COPD, which is a subset of RESP, we recalculate the O3 mortality burden from the COPD (Table S4). The newly calculated O3 mortality burden from the COPD is generally lower than the estimate of Cohen et al. (2017) by 8 %–30 % (Fig. 7). This could be caused by the fact that for the O3 changes, we use the summertime (April to September) average of the 1 h daily maximum, while Cohen et al. (2017) used the 3-month average, which will be higher. The temporal trend for the O3 mortality burdens from our study is similar to that from Cohen et al. (2017), except that the burden decreases after 2005 in our study but increases in Cohen et al. (2017). The O3 mortality burden from the RESP disease in 2005 estimated from our study is much lower than two previous studies (Fann et al., 2012a; Punger and West, 2013; Table S10). As discussed in the methods, the lower US background O3 concentration used in these two studies (22 ppb in the eastern US and 30 ppb in the western US) could lead to a higher O3 mortality burden. We then did sensitivity analysis by using the pre-industrial O3 concentration simulated by an ensemble of model outputs from the Atmospheric Chemistry and Climate Model Intercomparison Project (Lamarque et al., 2013; see Fig. S9 and Sect. 2 in the Supplement) as the counterfactual risk exposure factor, and recalculated the O3 mortality burden with RESP. The new calculated O3 mortality burdens are estimated to be 64 %–100 % higher than the current estimation from RESP using the low-concentration threshold (Table S10). In Fig. 7, we see that the new estimated O3 mortality burden from RESP in 2005 (dashed line) is now comparable with the two previous studies.
Significant improvements in air quality occurred in the US from 1990 to 2010, which we estimate to have decreased the population-weighted annual average PM2.5 by 39 %, and the summertime (April to September) 1 h daily maximum O3 by 9 %. However, both PM2.5 and O3 are still a great threat to the public health in the US, with estimated mortality burdens of 58 600 (24 900–98 500) deaths year−1 and 12 300 (4100–19 800) deaths year−1 in 2010, respectively. The mortality burdens associated with exposure to ambient PM2.5 have decreased by 54 % over the past 2 decades. However, if the annual PM2.5 concentration levels had remained constant during 1990–2010, the associated mortality burden would have only decreased by 24 %, due to decreases in the baseline mortality rates of causes of death affected by PM2.5 and despite population growth. The air quality improvements have significantly decreased the mortality burden, avoiding roughly 35 800 (38 %) PM2.5-related deaths in 2010, compared to the case if air quality had stayed at 1990 levels.
The mortality burdens attributable to O3 are estimated to have increased by 13 % during the same period. However, without the emission reductions associated with implementation of measures under the CAA and the NOx SIP Call, the O3 mortality burden would have increased by 55 % during 1990–2010. In calculating the O3 mortality burdens, we use the average of 1 h daily maximum O3 and the RR from Jerrett et al. (2009), but higher O3 mortality burdens would likely have resulted had we used RRs from Turner et al. (2016). We estimate that the air quality improvements avoided 4600 (27 %) O3-related deaths in 2010, compared to the case if air quality had stayed at 1990 levels.
We also estimate the inter-annual variability in mortality burdens considering air pollutant concentrations in individual years and annual county-level baseline mortality rates, and find that the O3 mortality burdens are more variable (CV of 12 %) than for PM2.5 (CV of 4 %), mainly because of inter-annual variability in concentrations. We found that the inter-annual variability is small for PM2.5 but larger for ozone, which has not been shown previously that we are aware of.
The uncertainties in air pollution-related mortality estimates presented in this study are based on the uncertainty in relative risks for the specific causes of death only, and do not account for uncertainties in population and baseline mortality rates (which are likely small), nor for uncertainty in the modeled air pollutant concentration. Previous studies have shown that the uncertainties from the modeled air pollutant concentrations may be greater than uncertainties in baseline mortality or relative risk, so the use of model ensembles is suggested to better quantify the uncertainty (Silva et al., 2016a; Liang et al., 2018). Uncertainties also exist due to the assumption of equal toxicity for different components of PM2.5 (Li et al., 2016). For our analysis, we use modeled air pollutant concentration without any bias correction based on either in situ observation or satellite data (Brauer et al., 2015; Hogrefe et al., 2009; van Donkelaar et al., 2015; Xu et al., 2016). In our study, the PM2.5 mortality burden trend may be overestimated, and O3 mortality burdens underestimated, based on comparing the modeled air pollution trends with the observations. Despite these uncertainties, this study illustrates the importance of past air pollutant reductions for public health in the US, and of continued air pollution controls to reduce air pollution-related mortality.
The 21-year model outputs for the coupled WRF-CMAQ model, as well as the annual county-level baseline mortality rates, can be obtained by contacting the corresponding author Yuqiang Zhang (yuqiangzhang.thu@gmail.com, yuqiang.zhang@duke.edu).
The supplement related to this article is available online at: https://doi.org/10.5194/acp-18-15003-2018-supplement.
YZ designed the study, JX, CG and DW performed the model simulations, and YZ performed the data analysis and prepared the figures and tables. YZ wrote the paper with comments from all the coauthors.
The authors declare that they have no conflicts of interest.
Although this work has been reviewed and approved for publication by the US EPA, the views expressed in this paper are those of the authors and do not necessarily represent the views or policies of the US EPA.
This research was supported in part by an appointment to the Research
Participation Program at the US EPA, Office of Research and Development
(ORD), administered by the Oak Ridge Institute for Science and Education
(ORISE) through an interagency agreement between the U.S. Department of
Energy and the US EPA, and also in part by National Aeronautics and Space
Administration Health and Air Quality Applied Science Team no. NNX16AQ80G.
This work was also supported in part by a China Ministry of Science and
Technology National Key R & D program (2016YFC0207601). We thank Raquel
Silva and Neal Fann from the US EPA for useful discussions. We greatly
acknowledge Ana Rappold and Geoffrey Peterson from the US EPA for their
comments and suggestions on the initial version of this paper. We also
appreciate the free usage of the county-level baseline mortality and
population data from the US Centers for Disease Control and Prevention
(CDC). We thank two anonymous reviewers for their helpful
comments.
Edited by: Robert Harley
Reviewed by: two anonymous referees
Anderson, R. N. and Rosenberg, H. M.: Disease classification: Measuring the effect of the Tenth Revision of the International Classification of Diseases on cause-of-death data in the United States, Stat. Med., 22, 1551–1570, https://doi.org/10.1002/sim.1511, 2003.
Anderson, R. N., Miniño, A. M., Hoyert, D. L., and Rosenberg, H. M.: Comparability of cause of death between ICD-9 and ICD-10: preliminary estimates., Natl. Vital Stat. Rep., 49, 1–32, 2001.
Anenberg, S. C., Horowitz, L. W., Tong, D. Q., and West, J. J.: An Estimate of the Global Burden of Anthropogenic Ozone and Fine Particulate Matter on Premature Human Mortality Using Atmospheric Modeling, Environ. Health Perspect., 118, 1189–1195, https://doi.org/10.1289/ehp.0901220, 2010.
Astitha, M., Luo, H., Rao, S. T., Hogrefe, C., Mathur, R., and Kumar, N.: Dynamic evaluation of two decades of WRF-CMAQ ozone simulations over the contiguous United States, Atmos. Environ., 164, 102–116, https://doi.org/10.1016/j.atmosenv.2017.05.020, 2017.
BenMAP: Environmental Benefits Mapping and Analysis Program: Community Edition, User's Manual, Appendices, 2017, available at: https://www.epa.gov/sites/production/files/2017-04/documents/benmap_ce_um_appendices_april_2017.pdf, last access: 25 April 2017.
Brauer, M., Amann, M., Burnett, R. T., Cohen, A., Dentener, F., Ezzati, M., Henderson, S. B., Krzyzanowski, M., Martin, R. V., Van Dingenen, R., van Donkelaar, A., and Thurston, G. D.: Exposure assessment for estimation of the global burden of disease attributable to outdoor air pollution., Environ. Sci. Technol., 46, 652–660, https://doi.org/10.1021/es2025752, 2012.
Burnett, R. T., Arden Pope, C., Ezzati, M., Olives, C., Lim, S. S., Mehta, S., Shin, H. H., Singh, G., Hubbell, B., Brauer, M., Ross Anderson, H., Smith, K. R., Balmes, J. R., Bruce, N. G., Kan, H., Laden, F., Prüss-Ustün, A., Turner, M. C., Gapstur, S. M., Diver, W. R., and Cohen, A.: An integrated risk function for estimating the global burden of disease attributable to ambient fine particulate matter exposure, Environ. Health Perspect., 122, 397–403, https://doi.org/10.1289/ehp.1307049, 2014.
Butt, E. W., Turnock, S. T., Rigby, R., Reddington, C. L., Yoshioka, M., Johnson, J. S., Regayre, L. A., Pringle, K. J., Mann, G. W., and Spracklen, D. V.: Global and regional trends in particulate air pollution and attributable health burden over the past 50 years, Environ. Res. Lett., 12, 104017, https://doi.org/10.1088/1748-9326/aa87be 2017.
CDC (Centers for Disease Control and Prevention) 2017: National Center for Health Statistics, available at: https://wonder.cdc.gov/mortSQL.html, last access: 28 February 2017.
Chestnut, L. G. and Mills, D. M.: A fresh look at the benefits and costs of the US acid rain program, J. Environ. Manage., 77, 252–266, https://doi.org/10.1016/j.jenvman.2005.05.014, 2005.
Cohen, A. J., Brauer, M., and Burnett, R. T.: Estimates and 25-year trends of the global burden of disease attributable to ambient air pollution: An analysis of data from the Global burden of Diseases Study 2015, Lancet, 389, 1907–1918, https://doi.org/10.1016/S0140-6736(17)30505-6, 2017.
Correia, A. W., Arden Pope, C., Dockery, D. W., Wang, Y., Ezzati, M., and Dominici, F.: Effect of air pollution control on life expectancy in the United States: An analysis of 545 U.S. Counties for the period from 2000 to 2007, Epidemiology, 24, 23–31, https://doi.org/10.1097/EDE.0b013e3182770237, 2013.
Dwyer-Lindgren, L., Bertozzi-Villa, A., Stubbs, R. W., Morozoff, C., Kutz, M. J., Huynh, C., Barber, R. M., Shackelford, K. A., Mackenbach, J. P., van Lenthe, F. J., Flaxman, A. D., Naghavi, M., Mokdad, A. H., and Murray, C. J. L.: US county-level trends in mortality rates for major causes of death, 1980–2014, JAMA, 316, 2385–2401, https://doi.org/10.1001/jama.2016.13645, 2016.
Dennison, P. E., Brewer, S. C., Arnold, J. D., and Moritz, M. A.: Large wildfire trends in the western United States, 1984–2011, Geophys. Res. Lett., 41, 2928–2933, https://doi.org/10.1002/2014GL059712, 2014.
Fann, N., Lamson, A. D., Anenberg, S. C., Wesson, K., Risley, D., and Hubbell, B. J.: Estimating the national public health burden associated with exposure to ambient PM2.5 and ozone, Risk Anal., 32, 81–95, https://doi.org/10.1111/j.1539-6924.2011.01630.x, 2012a.
Fann, N., Baker, K. R., and Fulcher, C. M.: Characterizing the PM2.5-related health benefits of emission reductions for 17 industrial, area and mobile emission sectors across the U.S., Environ. Int., 49, 141–151, https://doi.org/10.1016/j.envint.2012.08.017, 2012b.
Fann, N., Kim, S. Y., Olives, C., and Sheppard, L.: Estimated Changes in Life Expectancy and Adult Mortality Resulting from Declining PM2.5 Exposures in the Contiguous United States: 1980–2010, Environ. Health Perspect., 125, 097003, https://doi.org/10.1289/EHP507, 2017.
Gan, C.-M., Pleim, J., Mathur, R., Hogrefe, C., Long, C. N., Xing, J., Wong, D., Gilliam, R., and Wei, C.: Assessment of long-term WRF–CMAQ simulations for understanding direct aerosol effects on radiation “brightening” in the United States, Atmos. Chem. Phys., 15, 12193–12209, https://doi.org/10.5194/acp-15-12193-2015, 2015.
Gan, C. M., Hogrefe, C., Mathur, R., Pleim, J., Xing, J., Wong, D., Gilliam, R., Pouliot, G., and Wei, C.: Assessment of the effects of horizontal grid resolution on long-term air quality trends using coupled WRF-CMAQ simulations, Atmos. Environ., 132, 207–216, https://doi.org/10.1016/j.atmosenv.2016.02.036, 2016.
Hand, J. L., Schichtel, B. A., Malm, W. C., and Frank, N. H.: Spatial and temporal trends in PM2.5 organic and elemental carbon across the United States, Adv. Meteorol., 2013, 367674, https://doi.org/10.1155/2013/367674, 2013.
Hand, J. L., Schichtel, B. A., Malm, W. C., Copeland, S., Molenar, J. V., Frank, N., and Pitchford, M.: Widespread reductions in haze across the United States from the early 1990s through 2011, Atmos. Environ., 94, 671–679, https://doi.org/10.1016/j.atmosenv.2014.05.062, 2014.
GBD: 2013 Risk Factors Collaborators: Global, regional, and national comparative risk assessment of 79 behavioural, environmental and occupational, and metabolic risks or clusters of risks in 188 countries, 1990–2013: a systematic analysis for the Global Burden of Disease Study 2013, Lancet., 386, 2287–2323, https://doi.org/10.1016/s0140-6736(15)00128-2, 2015.
GBD: 2015 Risk Factors Collaborators: Global, regional, and national comparative risk assessment of 79 behavioural, environmental and occupational, and metabolic risks or clusters of risks, 1990–2015: a systematic analysis for the Global Burden of Disease Study 2015, Lancet., 388, 1659–1724, https://doi.org/10.1016/S0140-6736(16)31679-8, 2016.
GHDx (Global Health Data Exchange): Global Burden of Disease Study 2010 – Ambient Air Pollution Risk Model 1990–2010, available at: http://ghdx.healthmetricsandevaluation.org/record/global-burden-disease-study-2010-gbd-2010-ambient-air-, (last access: 8 November 2016), 2013.
Giannadaki, D., Lelieveld, J., and Pozzer, A.: Implementing the US air quality standard for PM2.5 worldwide can prevent millions of premature deaths per year, Environ. Heal., 15, 88, https://doi.org/10.1186/s12940-016-0170-8, 2016.
Hogrefe, C., Lynn, B., Goldberg, R., Rosenzweig, C., Zalewsky, E., Hao, W., Doraiswamy, P., Civerolo, K., Ku, J. Y., Sistla, G., and Kinney, P. L.: A combined model-observation approach to estimate historic gridded fields of PM2.5 mass and species concentrations, Atmos. Environ., 43, 2561–2570, https://doi.org/10.1016/j.atmosenv.2009.02.031, 2009.
Jaffe, D., Chand, D., Hafner, W., Westerling, A., and Spracklen, D.: Influence of Fires on O3 Concentrations in the Western U.S., Environ. Sci. Technol., 42, 5885–5891, https://doi.org/10.1021/es800084k, 2008.
Jerrett, M., Burnett, R. T., Pope, C. A., Ito, K., Thurston, G., Krewski, D., Shi, Y., Calle, E., and Thun, M.: Long-term ozone exposure and mortality, N. Engl. J. Med., 360, 1085–1095, https://doi.org/10.1056/NEJMoa0803894, 2009.
Jian, Y., Messer, L. C., Jagai, J. S., Rappazzo, K. M., Gray, C. L., Grabich, S. C., and Lobdell, D. T.: The Associations between Environmental Quality and Mortality in the Contiguous United States, 2000–2005, Environ. Health Perspect., 125, 355–362, https://doi.org/10.1289/EHP119, 2016.
Lamarque, J.-F., Shindell, D. T., Josse, B., Young, P. J., Cionni, I., Eyring, V., Bergmann, D., Cameron-Smith, P., Collins, W. J., Doherty, R., Dalsoren, S., Faluvegi, G., Folberth, G., Ghan, S. J., Horowitz, L. W., Lee, Y. H., MacKenzie, I. A., Nagashima, T., Naik, V., Plummer, D., Righi, M., Rumbold, S. T., Schulz, M., Skeie, R. B., Stevenson, D. S., Strode, S., Sudo, K., Szopa, S., Voulgarakis, A., and Zeng, G.: The Atmospheric Chemistry and Climate Model Intercomparison Project (ACCMIP): overview and description of models, simulations and climate diagnostics, Geosci. Model Dev., 6, 179–206, https://doi.org/10.5194/gmd-6-179-2013, 2013.
Lelieveld, J., Barlas, C., Giannadaki, D., and Pozzer, A.: Model calculated global, regional and megacity premature mortality due to air pollution, Atmos. Chem. Phys., 13, 7023–7037, https://doi.org/10.5194/acp-13-7023-2013, 2013.
Lelieveld, J., Evans, J. S., Fnais, M., Giannadaki, D., and Pozzer, A.: The contribution of outdoor air pollution sources to premature mortality on a global scale, Nature, 525, 367–371, https://doi.org/10.1038/nature15371, 2015.
Li, Y., Henze, D. K., Jack, D., Henderson, B. H., and Kinney, P. L.: Assessing public health burden associated with exposure to ambient black carbon in the United States, Sci. Total Environ., 539, 515–525, https://doi.org/10.1016/j.scitotenv.2015.08.129, 2016.
Liang, C.-K., West, J. J., Silva, R. A., Bian, H., Chin, M., Davila, Y., Dentener, F. J., Emmons, L., Flemming, J., Folberth, G., Henze, D., Im, U., Jonson, J. E., Keating, T. J., Kucsera, T., Lenzen, A., Lin, M., Lund, M. T., Pan, X., Park, R. J., Pierce, R. B., Sekiya, T., Sudo, K., and Takemura, T.: HTAP2 multi-model estimates of premature human mortality due to intercontinental transport of air pollution and emission sectors, Atmos. Chem. Phys., 18, 10497–10520, https://doi.org/10.5194/acp-18-10497-2018, 2018.
Lim, S. S., Vos, T., Flaxman, A. D., Danaei, G., Shibuya, K., Adair-Rohani, H., Amann, M., Anderson, H. R., Andrews, K. G., Aryee, M., Atkinson, C., Bacchus, L. J., Bahalim, A. N., Balakrishnan, K., Balmes, J., Barker-Collo, S., Baxter, A., Bell, M. L., Blore, J. D., Blyth, F., Bonner, C., Borges, G., Bourne, R., Boussinesq, M., Brauer, M., Brooks, P., Bruce, N. G., Brunekreef, B., Bryan-Hancock, C., Bucello, C., Buchbinder, R., Bull, F., Burnett, R. T., Byers, T. E., Calabria, B., Carapetis, J., Carnahan, E., Chafe, Z., Charlson, F., Chen, H., Chen, J. S., Cheng, A. T.-A., Child, J. C., Cohen, A., Colson, K. E., Cowie, B. C., Darby, S., Darling, S., Davis, A., Degenhardt, L., Dentener, F., Des Jarlais, D. C., Devries, K., Dherani, M., Ding, E. L., Dorsey, E. R., Driscoll, T., Edmond, K., Ali, S. E., Engell, R. E., Erwin, P. J., Fahimi, S., Falder, G., Farzadfar, F., Ferrari, A., Finucane, M. M., Flaxman, S., Fowkes, F. G. R., Freedman, G., Freeman, M. K., Gakidou, E., Ghosh, S., Giovannucci, E., Gmel, G., Graham, K., Grainger, R., Grant, B., Gunnell, D., Gutierrez, H. R., Hall, W., Hoek, H. W., Hogan, A., Hosgood, H. D., Hoy, D., Hu, H., Hubbell, B. J., Hutchings, S. J., Ibeanusi, S. E., Jacklyn, G. L., Jasrasaria, R., Jonas, J. B., Kan, H., Kanis, J. A., Kassebaum, N., Kawakami, N., Khang, Y.-H., Khatibzadeh, S., Khoo, J.-P., Kok, C., et al.: A comparative risk assessment of burden of disease and injury attributable to 67 risk factors and risk factor clusters in 21 regions, 1990–2010: a systematic analysis for the Global Burden of Disease Study 2010, Lancet, 380, 2224–2260, https://doi.org/10.1016/S0140-6736(12)61766-8, 2012.
Liu, M., Huang, Y., Ma, Z., Jin, Z., Liu, X., Wang, H., Liu, Y., Wang, J., Jantunen, M., Bi, J., and Kinney, P. L.: Spatial and temporal trends in the mortality burden of air pollution in China: 2004–2012, Environ. Int., 98, 75–81, https://doi.org/10.1016/j.envint.2016.10.003, 2017.
Malley, C. S., Henze, D. K., Kuylenstierna, J. C. I., Vallack, H. W., Davila, Y., Anenberg, S. C., Turner, M. C., and Ashmore, M. R.: Updated global estimates of respiratory mortality in adults ≥30 years of age attributable to long-term ozone exposure, Environ. Health Perspect., 125, 087021, https://doi.org/10.1289/EHP1390, 2017.
Mathur, R., Xing, J., Gilliam, R., Sarwar, G., Hogrefe, C., Pleim, J., Pouliot, G., Roselle, S., Spero, T. L., Wong, D. C., and Young, J.: Extending the Community Multiscale Air Quality (CMAQ) modeling system to hemispheric scales: overview of process considerations and initial applications, Atmos. Chem. Phys., 17, 12449–12474, https://doi.org/10.5194/acp-17-12449-2017, 2017.
Murphy, D. M., Chow, J. C., Leibensperger, E. M., Malm, W. C., Pitchford, M., Schichtel, B. A., Watson, J. G., and White, W. H.: Decreases in elemental carbon and fine particle mass in the United States, Atmos. Chem. Phys., 11, 4679–4686, https://doi.org/10.5194/acp-11-4679-2011, 2011.
Murray, C. J. L. and Collaborators US Burden of Disease: The State of US Health, 1990–2010 Burden of Diseases, Injuries, and Risk Factors, JAMA, 310, 591–606, https://doi.org/10.1001/jama.2013.13805, 2013.
Pope, C. A., Ezzati, M., and Dockery, D. W.: Fine-Particulate Air Pollution and Life Expectancy in the United States, N. Engl. J. Med., 360, 376–386, https://doi.org/10.1056/NEJMsa0805646, 2009.
Porter, P. S., Rao, S. T., Hogrefe, C., and Mathur, R.: A reduced form model for ozone based on two decades of CMAQ simulations for the continental United States, Atmos. Pollut. Res., 8, 275–284, https://doi.org/10.1016/j.apr.2016.09.005, 2017.
Punger, E. M. and West, J. J.: The effect of grid resolution on estimates of the burden of ozone and fine particulate matter on premature mortality in the USA, Air Qual. Atmos. Heal., 6, 563–573, https://doi.org/10.1007/s11869-013-0197-8, 2013.
Silva, R. A., West, J. J., Zhang, Y., Anenberg, S. C., Lamarque, J.-F., Shindell, D. T., Collins, W. J., Dalsoren, S., Faluvegi, G., Folberth, G., Horowitz, L. W., Nagashima, T., Naik, V., Rumbold, S., Skeie, R., Sudo, K., Takemura, T., Bergmann, D., Cameron-Smith, P., Cionni, I., Doherty, R. M., Eyring, V., Josse, B., MacKenzie, I. A, Plummer, D., Righi, M., Stevenson, D. S., Strode, S., Szopa, S., and Zeng, G.: Global premature mortality due to anthropogenic outdoor air pollution and the contribution of past climate change, Environ. Res. Lett., 8, 034005, https://doi.org/10.1088/1748-9326/8/3/034005, 2013.
Silva, R. A., West, J. J., Lamarque, J.-F., Shindell, D. T., Collins, W. J., Dalsoren, S., Faluvegi, G., Folberth, G., Horowitz, L. W., Nagashima, T., Naik, V., Rumbold, S. T., Sudo, K., Takemura, T., Bergmann, D., Cameron-Smith, P., Cionni, I., Doherty, R. M., Eyring, V., Josse, B., MacKenzie, I. A., Plummer, D., Righi, M., Stevenson, D. S., Strode, S., Szopa, S., and Zengast, G.: The effect of future ambient air pollution on human premature mortality to 2100 using output from the ACCMIP model ensemble, Atmos. Chem. Phys., 16, 9847–9862, https://doi.org/10.5194/acp-16-9847-2016, 2016a.
Silva, R. A., Adelman, Z., Fry, M. M., and West, J. J.: The impact of individual anthropogenic emissions sectors on the global burden of human mortality due to ambient air pollution, Environ. Health Perspect., 124, 1776–1784, https://doi.org/10.1289/EHP177, 2016b.
Spracklen, D. V., Logan, J. A., Mickley, L. J., Park, R. J., Yevich, R., Westerling, A. L., and Jaffe, D. A.: Wildfires drive interannual variability of organic carbon aerosol in the western U.S. in summer, Geophys. Res. Lett., 34, L16816, https://doi.org/10.1029/2007GL030037, 2007.
Turner, M. C., Jerrett, M., Pope, C. A., Krewski, D., Gapstur, S. M., Diver, W. R., Beckerman, B. S., Marshall, J. D., Su, J., Crouse, D. L., and Burnett, R. T.: Long-Term Ozone Exposure and Mortality in a Large Prospective Study, Am. J. Respir. Crit. Care Med., 193, 1134–1142, https://doi.org/10.1164/rccm.201508-1633OC, 2016.
US EPA: “Benefits and Costs of the Clean Air Act 1990–2020, the Second Prospective Study”, available at: https://www.epa.gov/clean-air-act-overview/benefits-and-costs-clean-air-act-1990-2020-report-documents-and-graphics (last access: 5 October 2018), 2011.
US EPA: “Control of Air Pollution from Motor Vehicles: Tier3 Motor Vehicle Emission and Fuel Standards Final Rule”, available at: https://www.epa.gov/regulations-emissions-vehicles-and-engines/final-rule-control-air-pollution-motor-vehicles-tier-3 (last access: 5 September 2018), 2014.
US EPA: Our nation's air: Status and Trends through 2016, available at: https://gispub.epa.gov/air/trendsreport/2017/, last access: 2 August 2017.
van Donkelaar, A., Martin, R., Brauer, M., and Boys, B. L.: Use of Satellite Observations for Long-Term Exposure Assessment of Global Concentrations of Fine Particulate Matter Concentrations of Fine Particulate Matter, Environ. Health Perspect., 123, 135–143, https://doi.org/10.1289/ehp.1408646, 2015.
Wang, J., Xing, J., Mathur, R., Pleim, J. E., Wang, S., Hogrefe, C., Gan, C.-M., Wong, D. C., and Hao, J.: Historical Trends in PM2.5-Related Premature Mortality during 1990–2010 across the Northern Hemisphere, Environ. Health Perspect., 125, 400–408, https://doi.org/10.1289/EHP298, 2017.
Wong, D. C., Pleim, J., Mathur, R., Binkowski, F., Otte, T., Gilliam, R., Pouliot, G., Xiu, A., Young, J. O., and Kang, D.: WRF-CMAQ two-way coupled system with aerosol feedback: software development and preliminary results, Geosci. Model Dev., 5, 299–312, https://doi.org/10.5194/gmd-5-299-2012, 2012.
World Health Organization (WHO): Ambient air pollution: A global assessment of exposure and burden of disease, ISBN: 9789241511353, 2016.
Xing, J., Pleim, J., Mathur, R., Pouliot, G., Hogrefe, C., Gan, C.-M., and Wei, C.: Historical gaseous and primary aerosol emissions in the United States from 1990 to 2010, Atmos. Chem. Phys., 13, 7531–7549, https://doi.org/10.5194/acp-13-7531-2013, 2013.
Xing, J., Mathur, R., Pleim, J., Hogrefe, C., Gan, C.-M., Wong, D. C., Wei, C., Gilliam, R., and Pouliot, G.: Observations and modeling of air quality trends over 1990–2010 across the Northern Hemisphere: China, the United States and Europe, Atmos. Chem. Phys., 15, 2723–2747, https://doi.org/10.5194/acp-15-2723-2015, 2015.
Xu, Y., Serre, M. L., Reyes, J., and Vizuete, W.: Bayesian Maximum Entropy Integration of Ozone Observations and Model Predictions: A National Application, Environ. Sci. Technol., 50, 4393–4400, https://doi.org/10.1021/acs.est.6b00096, 2016.
Zhang, Y., Bowden, J. H., Adelman, Z., Naik, V., Horowitz, L. W., Smith, S. J., and West, J. J.: Co-benefits of global and regional greenhouse gas mitigation for US air quality in 2050, Atmos. Chem. Phys., 16, 9533-9548, https://doi.org/10.5194/acp-16-9533-2016, 2016.