the Creative Commons Attribution 4.0 License.
the Creative Commons Attribution 4.0 License.
 | 02 Feb 2018
Aerosol characteristics in the entrainment interface layer in relation to the marine boundary layer and free troposphere
Hossein Dadashazar
Rachel A. Braun
Ewan Crosbie
Patrick Y. Chuang
Roy K. Woods
Haflidi H. Jonsson
This study uses airborne data from two field campaigns off the California coast to characterize aerosol size distribution characteristics in the entrainment interface layer (EIL), a thin and turbulent layer above marine stratocumulus cloud tops, which separates the stratocumulus-topped boundary layer (STBL) from the free troposphere (FT). The vertical bounds of the EIL are defined in this work based on considerations of buoyancy and turbulence using thermodynamic and dynamic data. Aerosol number concentrations are examined from three different probes with varying particle diameter (Dp) ranges: > 3 nm, > 10 nm, and 0.11–3.4 µm. Relative to the EIL and FT layers, the sub-cloud (SUB) layer exhibited lower aerosol number concentrations and higher surface area concentrations. High particle number concentrations between 3 and 10 nm in the EIL are indicative of enhanced nucleation, assisted by high actinic fluxes, cool and moist air, and much lower surface area concentrations than the STBL. Slopes of number concentration versus altitude in the EIL were correlated with the particle number concentration difference between the SUB and lower FT layers. The EIL aerosol size distribution was influenced by varying degrees from STBL aerosol versus subsiding FT aerosol depending on the case examined. These results emphasize the important role of the EIL in influencing nucleation and aerosol–cloud–climate interactions.


Stratocumulus clouds are extensively studied because they are both the dominant cloud type by global area (Warren et al., 1986), covering approximately a fifth of the planet's surface area on an annual basis (Wood, 2012), and they play an important role in the planet's energy balance due to their impact on planetary albedo. The layer separating the stratocumulus-topped boundary layer (STBL) from the free troposphere (FT) aloft is usually tens of meters in vertical extent and referred to as the entrainment interface layer (EIL) (Caughey et al., 1982; Nicholls and Turton, 1986; Wang and Albrecht, 1994; Lenschow et al., 2000). This layer exhibits strong gradients in thermodynamic and dynamic properties. Although numerous airborne and modeling studies have attempted to increase our understanding about the thermodynamic and dynamic nature of the EIL (e.g., Caughey et al., 1982; Moeng et al., 2005; Haman et al., 2007; Wang et al., 2008; Carman et al., 2012; Katzwinkel et al., 2012; Gerber et al., 2013; Malinowski et al., 2013; Jen-La Plante et al., 2016), aerosol characteristics in this thin layer have not been studied in detail.
The nature of the aerosol layer immediately above cloud top is important to understand because particles impact cloud microphysics and also because clouds vertically redistribute particles, remove them via droplet coalescence, and transform their properties through aqueous reactions (e.g., Wonaschuetz et al., 2012). A modeling study showed that aerosol entrainment from the FT can contribute between 69 and 89 % of particle number concentrations in the marine boundary layer (MBL; Katoshevski et al., 1999), and field measurements have confirmed the importance of entrainment in shaping the marine boundary layer aerosol budget (e.g., Clarke et al., 1998). The effects of above-cloud aerosol particles on clouds depend on the physicochemical properties of particles, their vertical distance from cloud top, and the dynamic and thermodynamic conditions around cloud top. Particles closest to the cloud top can entrain into the cloud and change the number concentration and size distribution of droplets (Costantino and Breón, 2010). On the other hand, an aerosol layer more detached from the cloud top and higher aloft can potentially alter the thermodynamic and dynamic structure of the layer below it, such as with absorbing smoke layers that can lead to stabilization and weaker cloud top long wave radiative cooling. This could in turn reduce cloudiness and cloud radiative forcing (Yamaguchi et al., 2015).
The goal of this study is to examine vertically resolved aircraft data in the marine atmosphere off the California coast to characterize aerosol characteristics as a function of altitude, with a focus on the EIL. The results provide insight into the degree of similarity between the aerosol size distribution in the EIL relative to the STBL and FT. The results motivate additional attention to the EIL in terms of acting as an intermediate layer between the STBL and FT, in which there is some combination of cloud-processed aerosol and FT aerosol, in addition to new particle formation.
Aircraft data from the Center for Interdisciplinary Remotely-Piloted Aircraft Studies (CIRPAS) Twin Otter are analyzed from the Nucleation in California Experiment (NiCE, 2013) and the Fog and Stratocumulus Evolution experiment (FASE, 2016), both of which took place between July and August. The flights examined here typically lasted 4 h and included vertical characterization of marine aerosol ranging from near the ocean surface (∼ 50 m a.s.l.) up to 2 km in altitude.
Navigational, dynamic, and thermodynamic data were obtained from standard instruments described in a number of previous studies (e.g., Crosbie et al., 2016; Wang et al., 2016; Dadashazar et al., 2017). Aerosol particle concentrations were measured using multiple condensation particle counters (CPCs; TSI Inc.), specifically the CPC 3010 (particle diameter, Dp > 10 nm) and ultrafine CPC (UFCPC) 3025 (Dp > 3 nm). The CPCs sampled downstream of a forward-facing sub-isokinetic inlet, which samples aerosol particles below 3.5 µm diameter with 100 % efficiency (Hegg et al., 2005). Aerosol size distributions were obtained with a passive cavity aerosol spectrometer probe (PCASP; Dp ∼ 0.11–3.4 µm; Particle Measuring Systems (PMS), Inc.; modified by Droplet Measurement Technologies, Inc.). Data from the forward scattering spectrometer probe (FSSP; Dp ∼ 1.6–45 µm; PMS, Inc.; modified by Droplet Measurement Technologies, Inc.) were additionally used to quantify aerosol surface area concentrations for particle diameters exceeding the PCASP upper size limit. Vertically resolved droplet size distributions from the Cloud Imaging Probe (CIP; Dp: 25–1550 µm) were used to estimate columnar-mean drizzle rates in clouds according to documented relationships between drop size and fall velocity (e.g., Chen et al., 2012; Feingold et al., 2013; Dadashazar et al., 2017). Gas-phase measurements were conducted during FASE with a Los Gatos Research (LGR, Inc.) CO ∕ CO2 analyzer.

Figure 1Spatial map of spiral soundings examined in this study from the NiCE (2013) and FASE (2016) field campaigns. The cases are labeled with the campaign (F = FASE, N = NiCE), research flight number, and case number (only for flights with more than one spiral) from that flight (i.e., “F12-2” is the second spiral sounding case from FASE research flight 12).
The PVM-100A probe (Gerber et al., 1994) provided measurements of liquid water content (LWC). A threshold LWC value of 0.02 g m−3 has been used extensively in the study region to identify the presence of clouds (Prabhakar et al., 2014), which was important during soundings to quantify cloud base and top heights. The presented analysis was conducted for cases when the cloud layer was coupled to the surface layer rather than also considering decoupled clouds. We follow the methods employed in Wang et al. (2016) to distinguish between the two types of clouds based on discontinuities in thermodynamic variables from vertical sounding data.
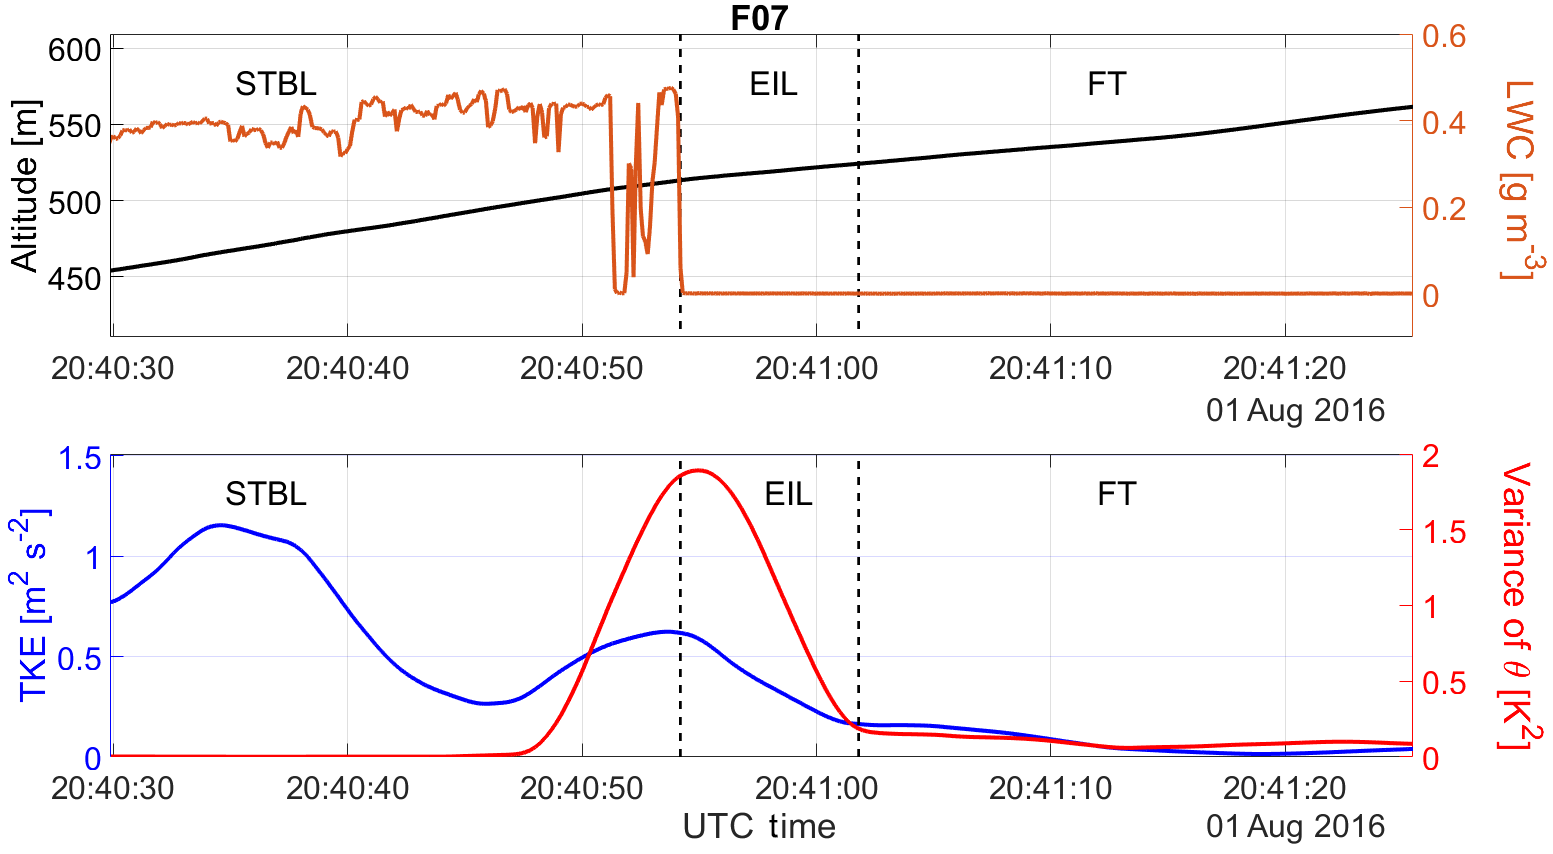
Figure 2F07 on 1 August 2016 showing how thermodynamic and dynamic criteria were applied to define the vertical bounds of the EIL, which separates the STBL from the FT. This subset of data is obtained from an upward spiral sounding.
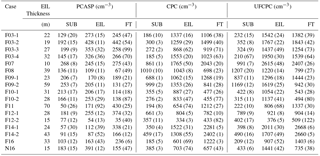
Table 1Summary of EIL thickness and particle concentrations (average (relative standard deviation as a percentage)) for the sub-cloud layer (SUB), the entrainment interface layer (EIL), and the free troposphere (FT). The cases are labeled with the campaign (F = FASE, N = NiCE), research flight number, and case number (only for flights with more than one spiral) from that flight (i.e., “F12-2” is the second spiral sounding case from FASE research flight 12).
3.1 Layer definitions
A total of 17 spiral soundings were analyzed from FASE and NiCE, with their locations shown in Fig. 1. The ranges of cloud base heights and tops were 129–403 and 375–729 m, respectively, for these soundings. Three vertical layers were defined with respect to the cloud layer including the sub-cloud (SUB) layer, EIL, and FT. The vertical bounds of the EIL are defined based on considerations of buoyancy and turbulence, similar to past studies (Carman et al., 2012). An example from FASE research flight 7 (F07) on 1 August 2016 illustrates the criteria used to determine the vertical boundaries of the EIL, STBL, and FT (Fig. 2). While some studies extend the EIL into the cloud layer (Malinowski et al., 2013; Jen-La Plante et al., 2016), this work defines the base of the EIL at cloud top (i.e., uppermost height where LWC ≥ 0.02 g m−3) for practical reasons since aerosol data from the PCASP and CPCs are not meaningful in the cloud layer. The top of the EIL is not as well defined as its base due to weaker vertical gradients of dynamic and thermodynamic properties relaxing to FT values over tens of meters at times (Wood, 2012). A method adopted and modified from that of Malinowski et al. (2013) is applied, where the top of the EIL is taken to be the highest point where turbulent kinetic energy (TKE) and the variance of potential temperature (θ) simultaneously exceed 0.1 m2 s−2 and 10 % of maximum variance, respectively. This location is identified based on the smoothed moving variance and average of 75 points of 10 Hz data used to calculate both the θ variance and TKE for spiral soundings. Considering an ascent rate of ∼ 1.5 m s−1, 75 points corresponds to a vertical distance of ∼ 10 m. Based on the aforementioned criteria, the average (± standard deviation) EIL thickness was 30 ± 15 m, with a minimum of 10 m and a maximum of 70 m (Table 1). The ranges of the EIL base and top altitudes were 375–729 and 414–777 m, respectively.
The FT base is considered to be at the EIL top, while the STBL top marks the EIL base. The FT layer extends up to 400 m above the EIL top for most cases except for five spirals that only reached ∼ 100 m above the EIL top (i.e., F10-1, F12-2, F14-1, F14-2, F16). In order to have a more detailed analysis, the FT is further stratified into 100 m thick layers for the 12 spirals that afforded such data: FT1 is the first 100 m increment above EIL top, FT2 is the 100 m increment above FT1, and so forth.
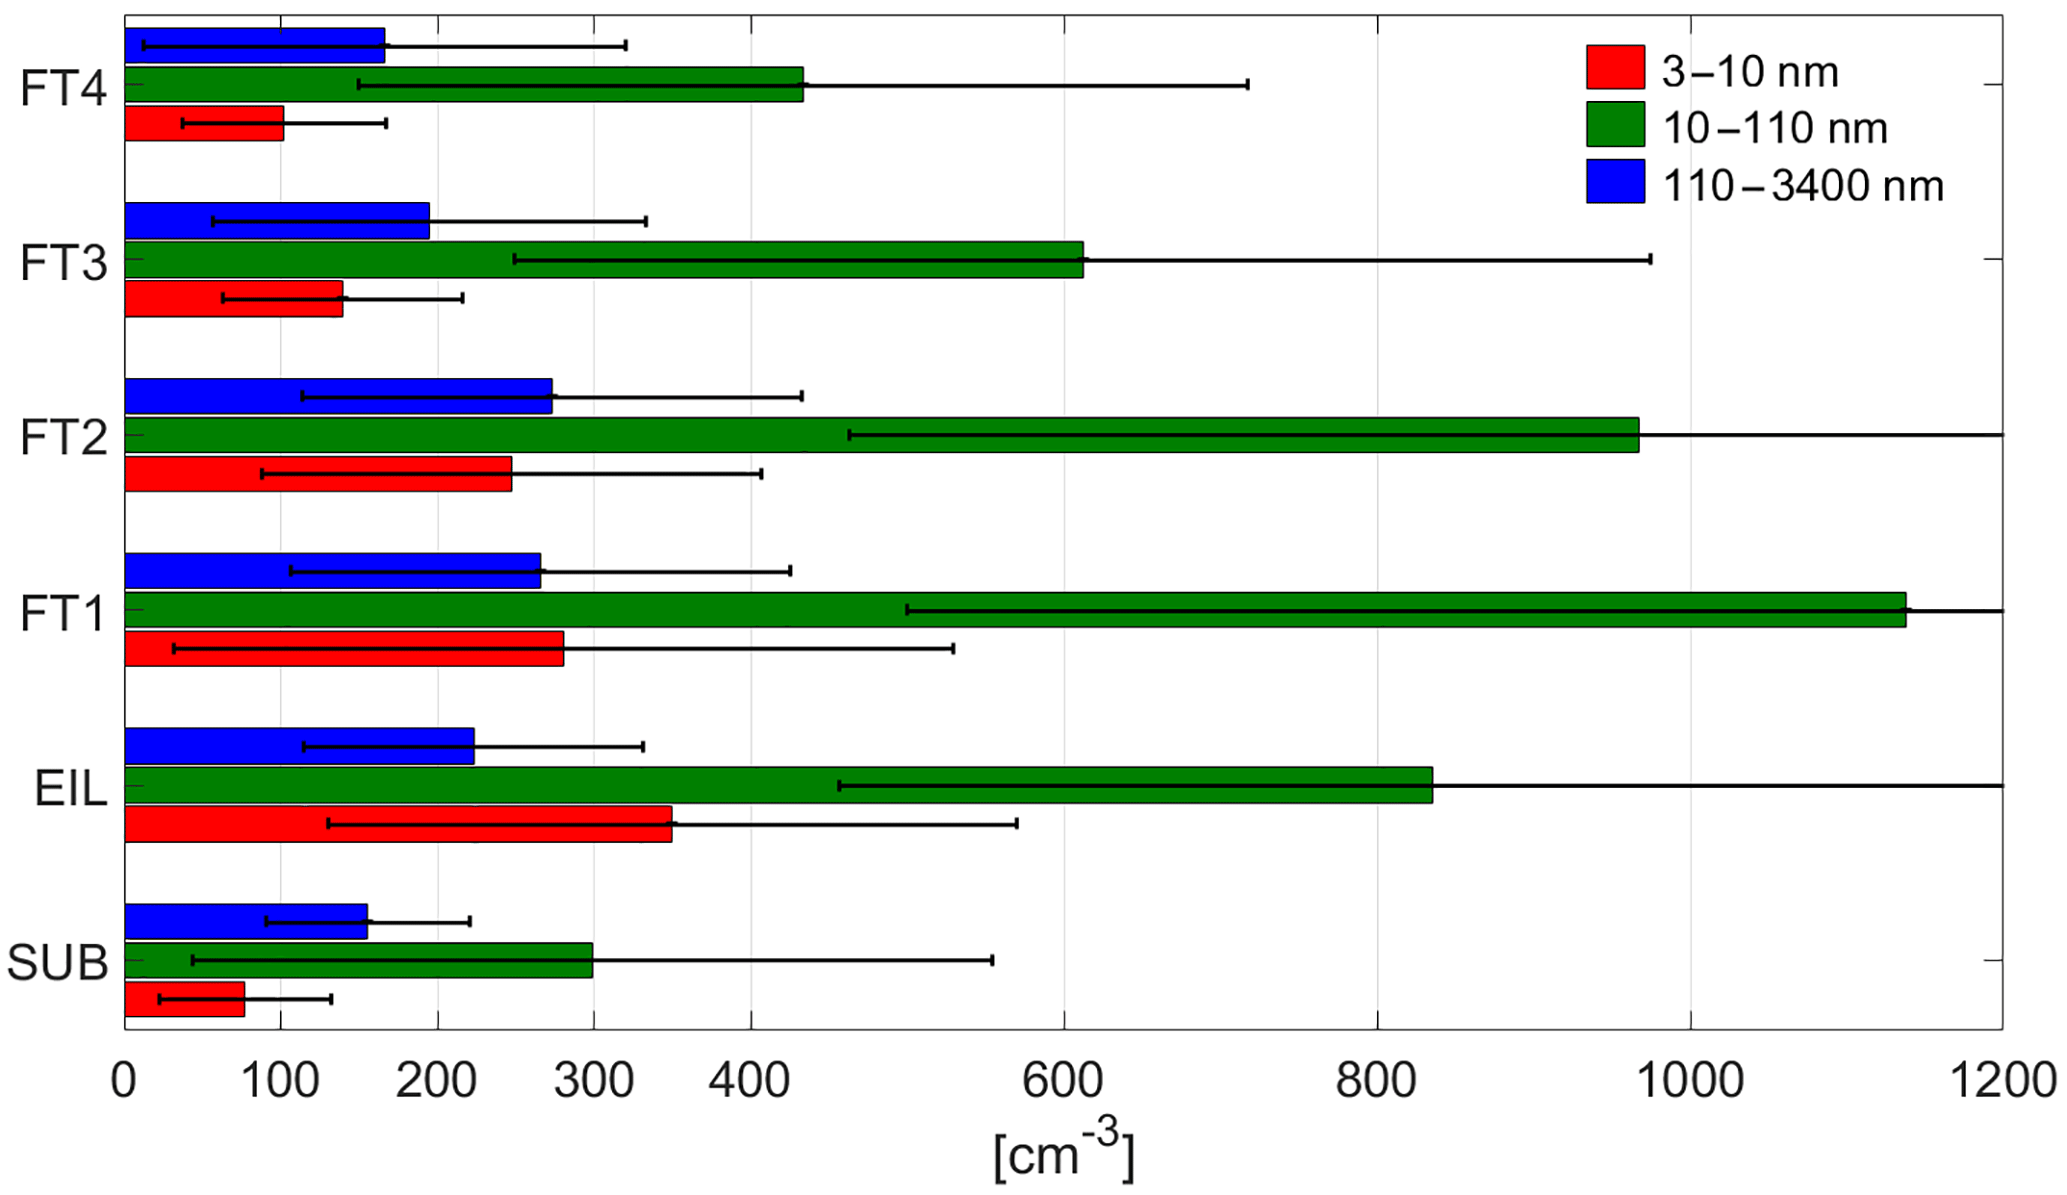
Figure 3Particle concentrations in different diameter ranges (3–10, 10–110, and 110–3400 nm) for SUB, EIL, and FT vertical layers. The FT is divided into four layers based on 100 m increments above the EIL top. Whiskers represent 1 standard deviation.
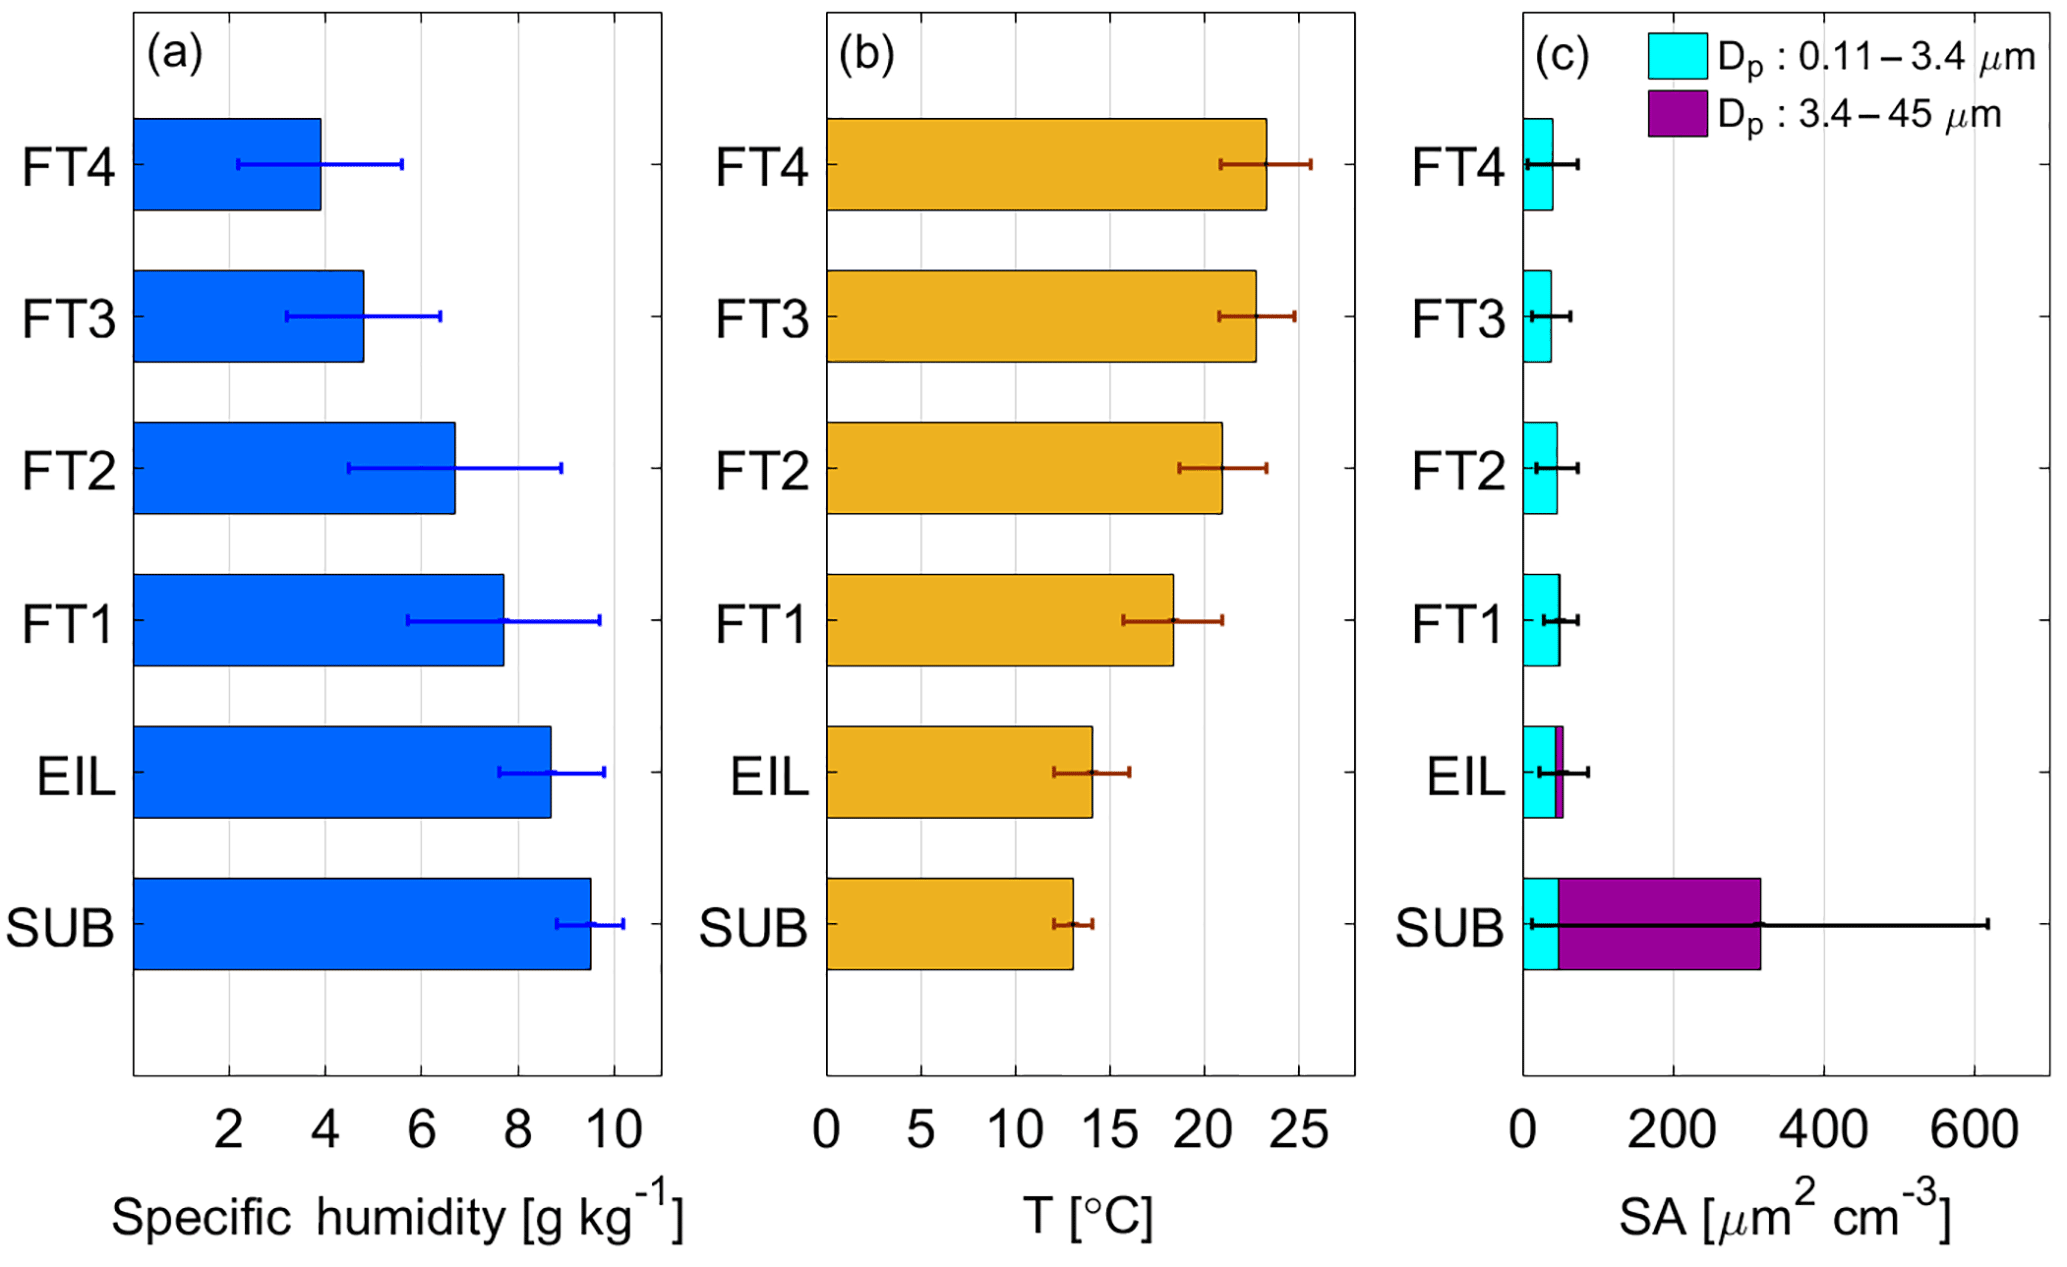
Figure 4(a) Specific humidity, (b) temperature, and (c) particle surface area (SA) concentrations for the SUB, EIL, and FT layers. The FT is divided into four layers based on 100 m increments above the EIL top. Particle SA concentrations are shown separately for the following diameter ranges: 0.11–3.4 µm, 3.4–45 µm. Whiskers represent 1 standard deviation.
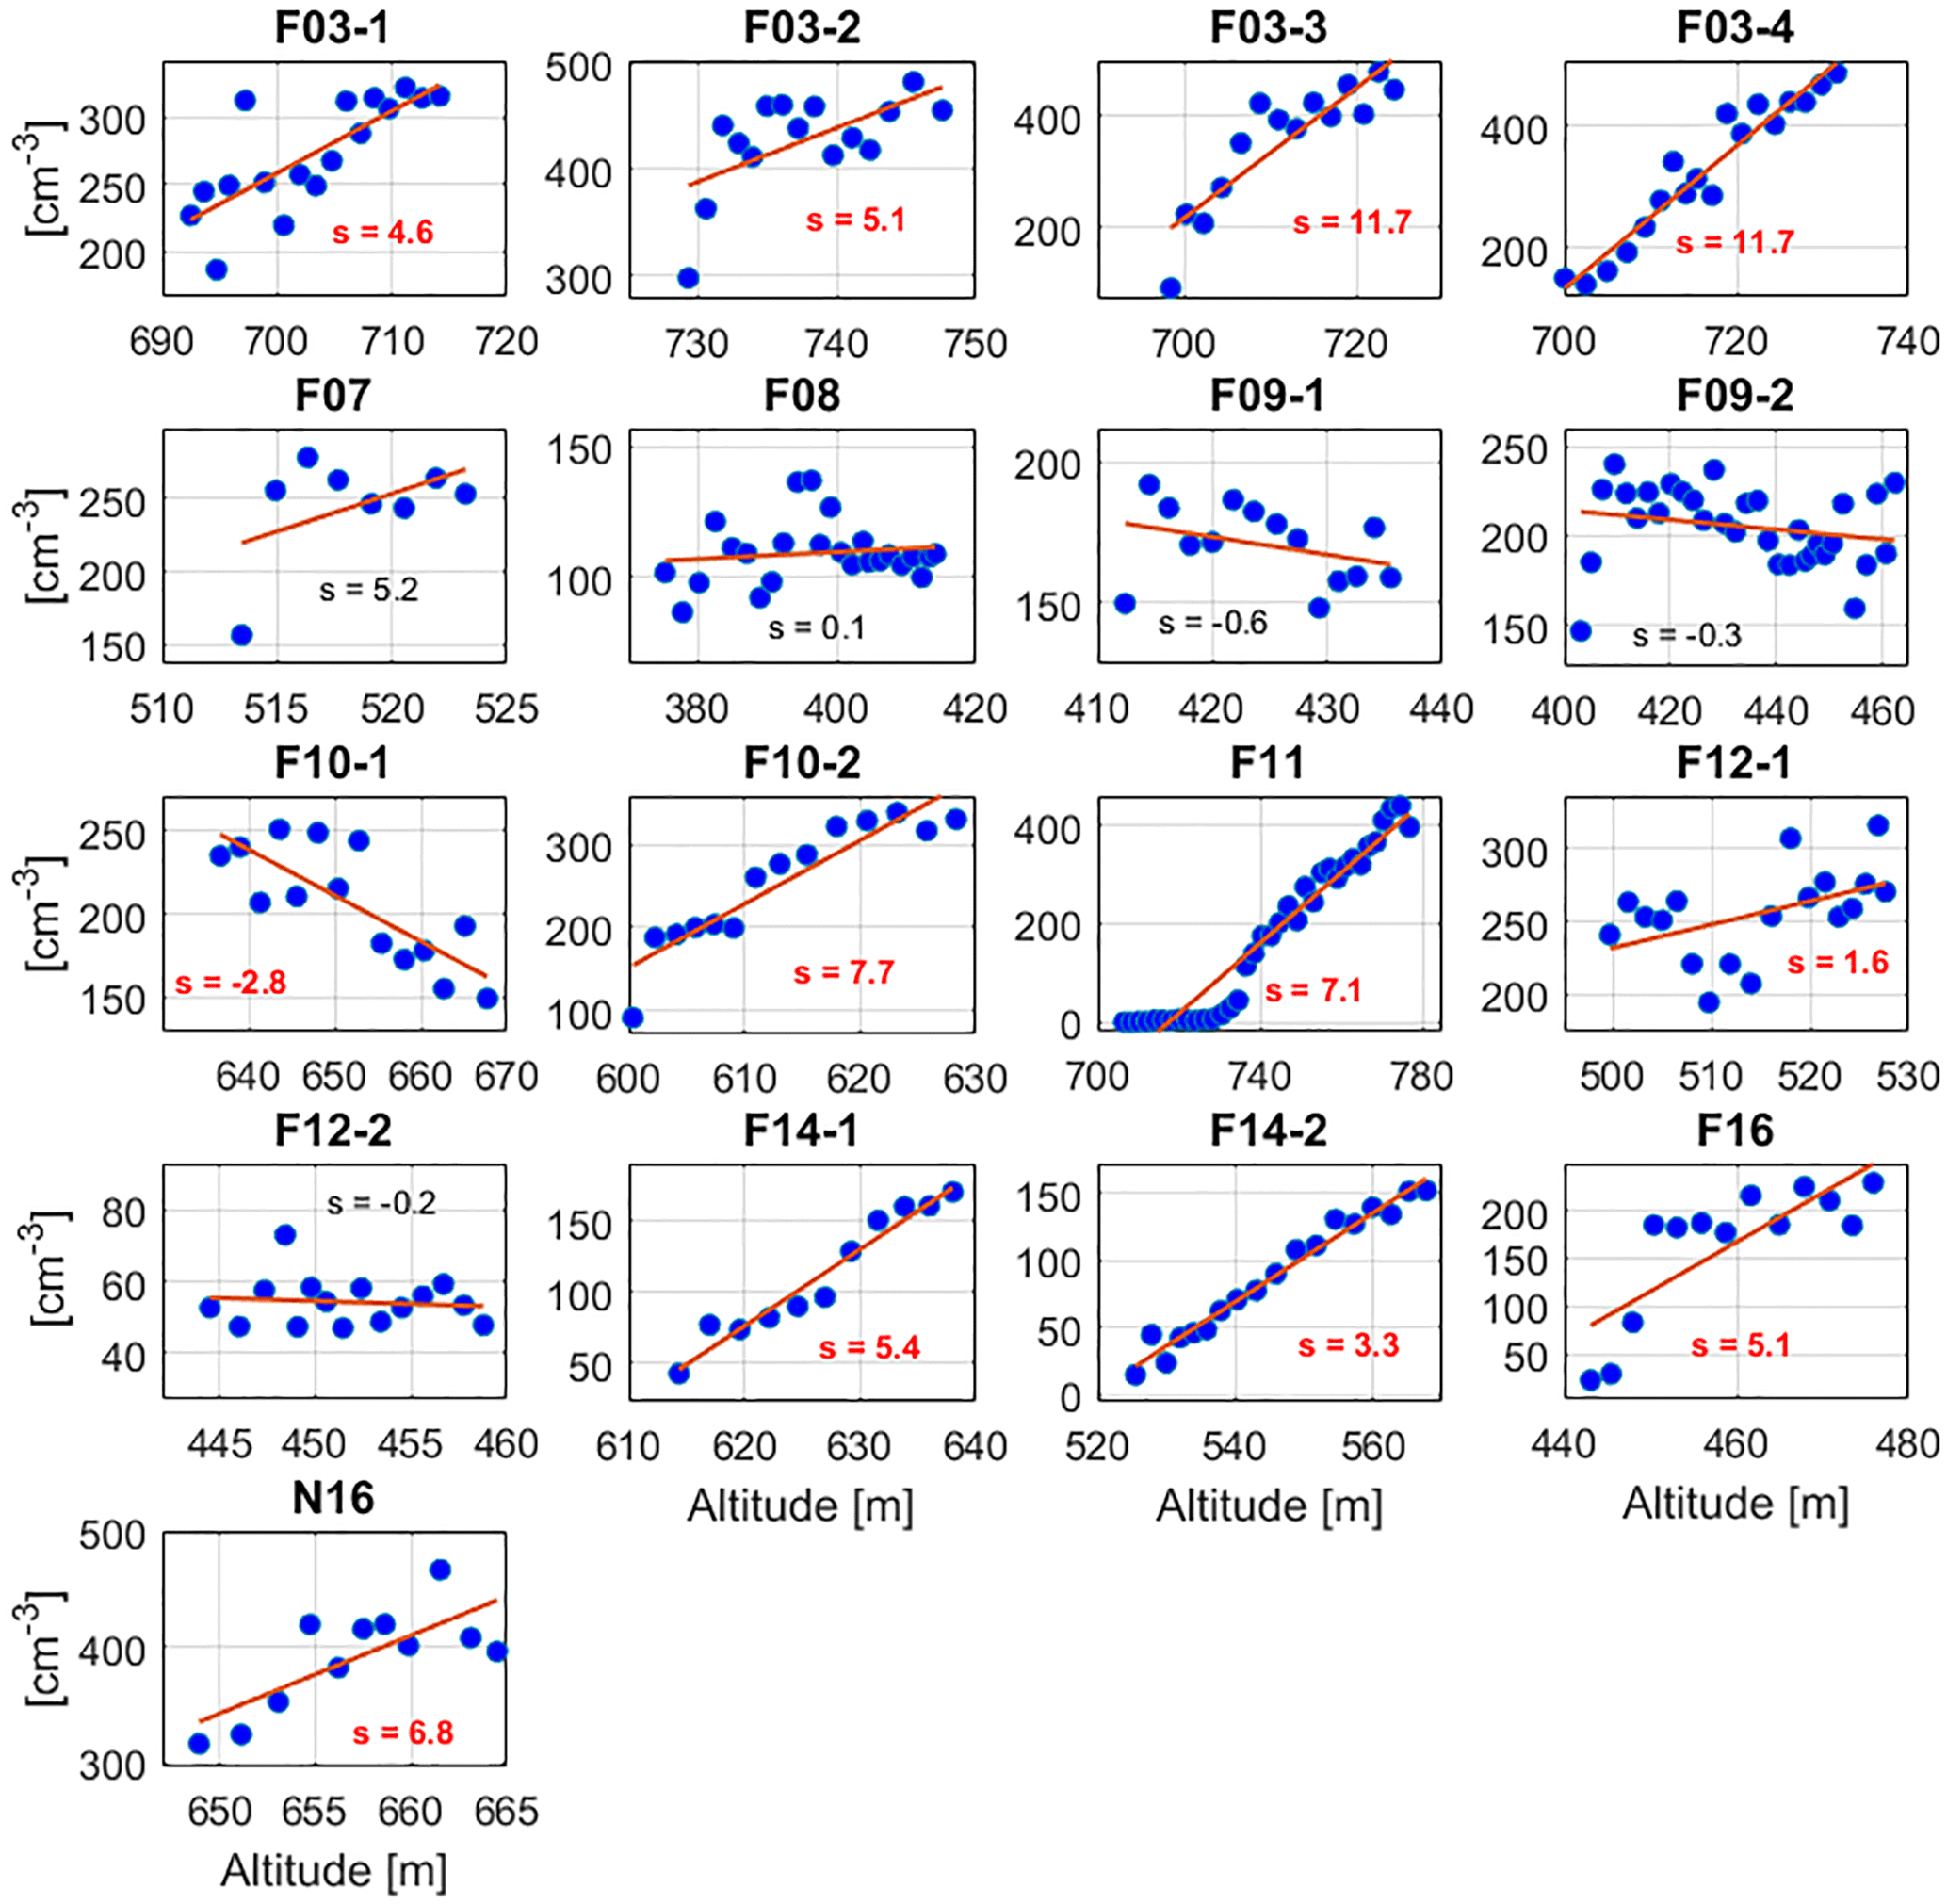
Figure 5Particle concentration in diameter range 110–3400 (PCASP) as a function of altitude in the EIL. Linear fits and slopes (s, units of cm−3 m−1) are shown in each panel. Slopes in red font correspond to statistically significant correlations at 95 % based on a two-tailed t test.
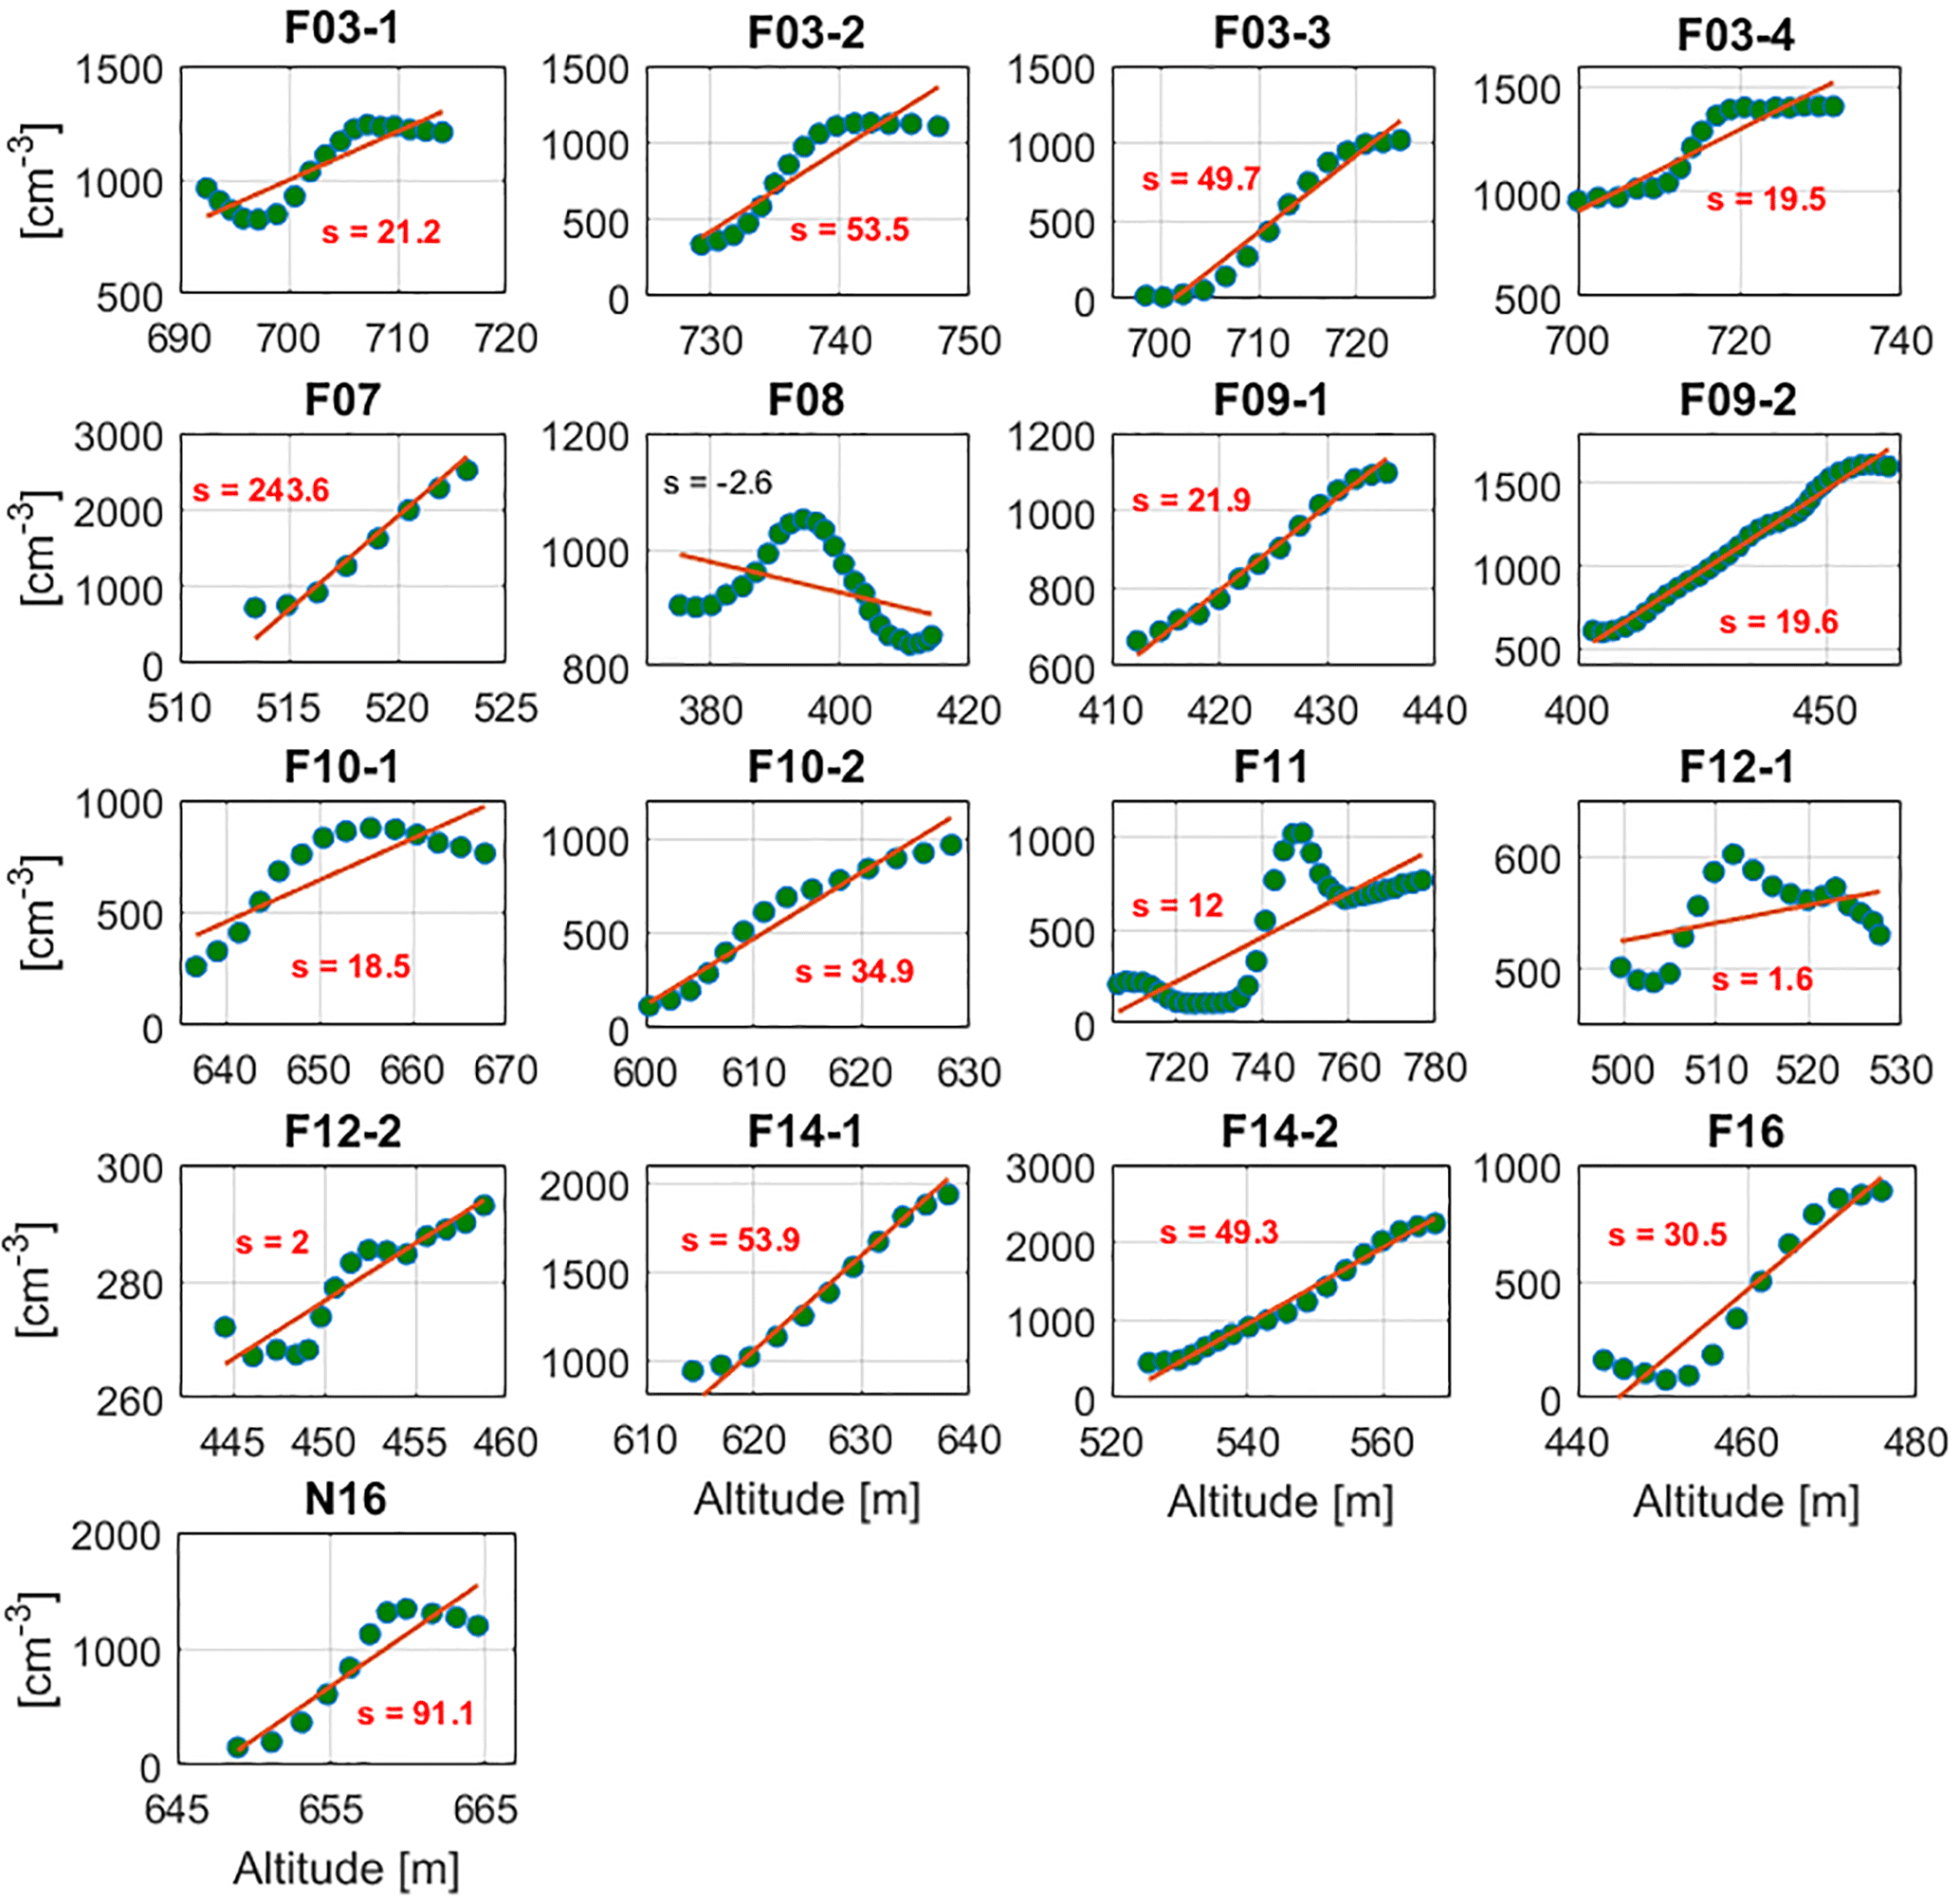
Figure 6Same as Fig. 5 but for particle concentration in diameter range 10–110 nm (i.e., CPC-PCASP).
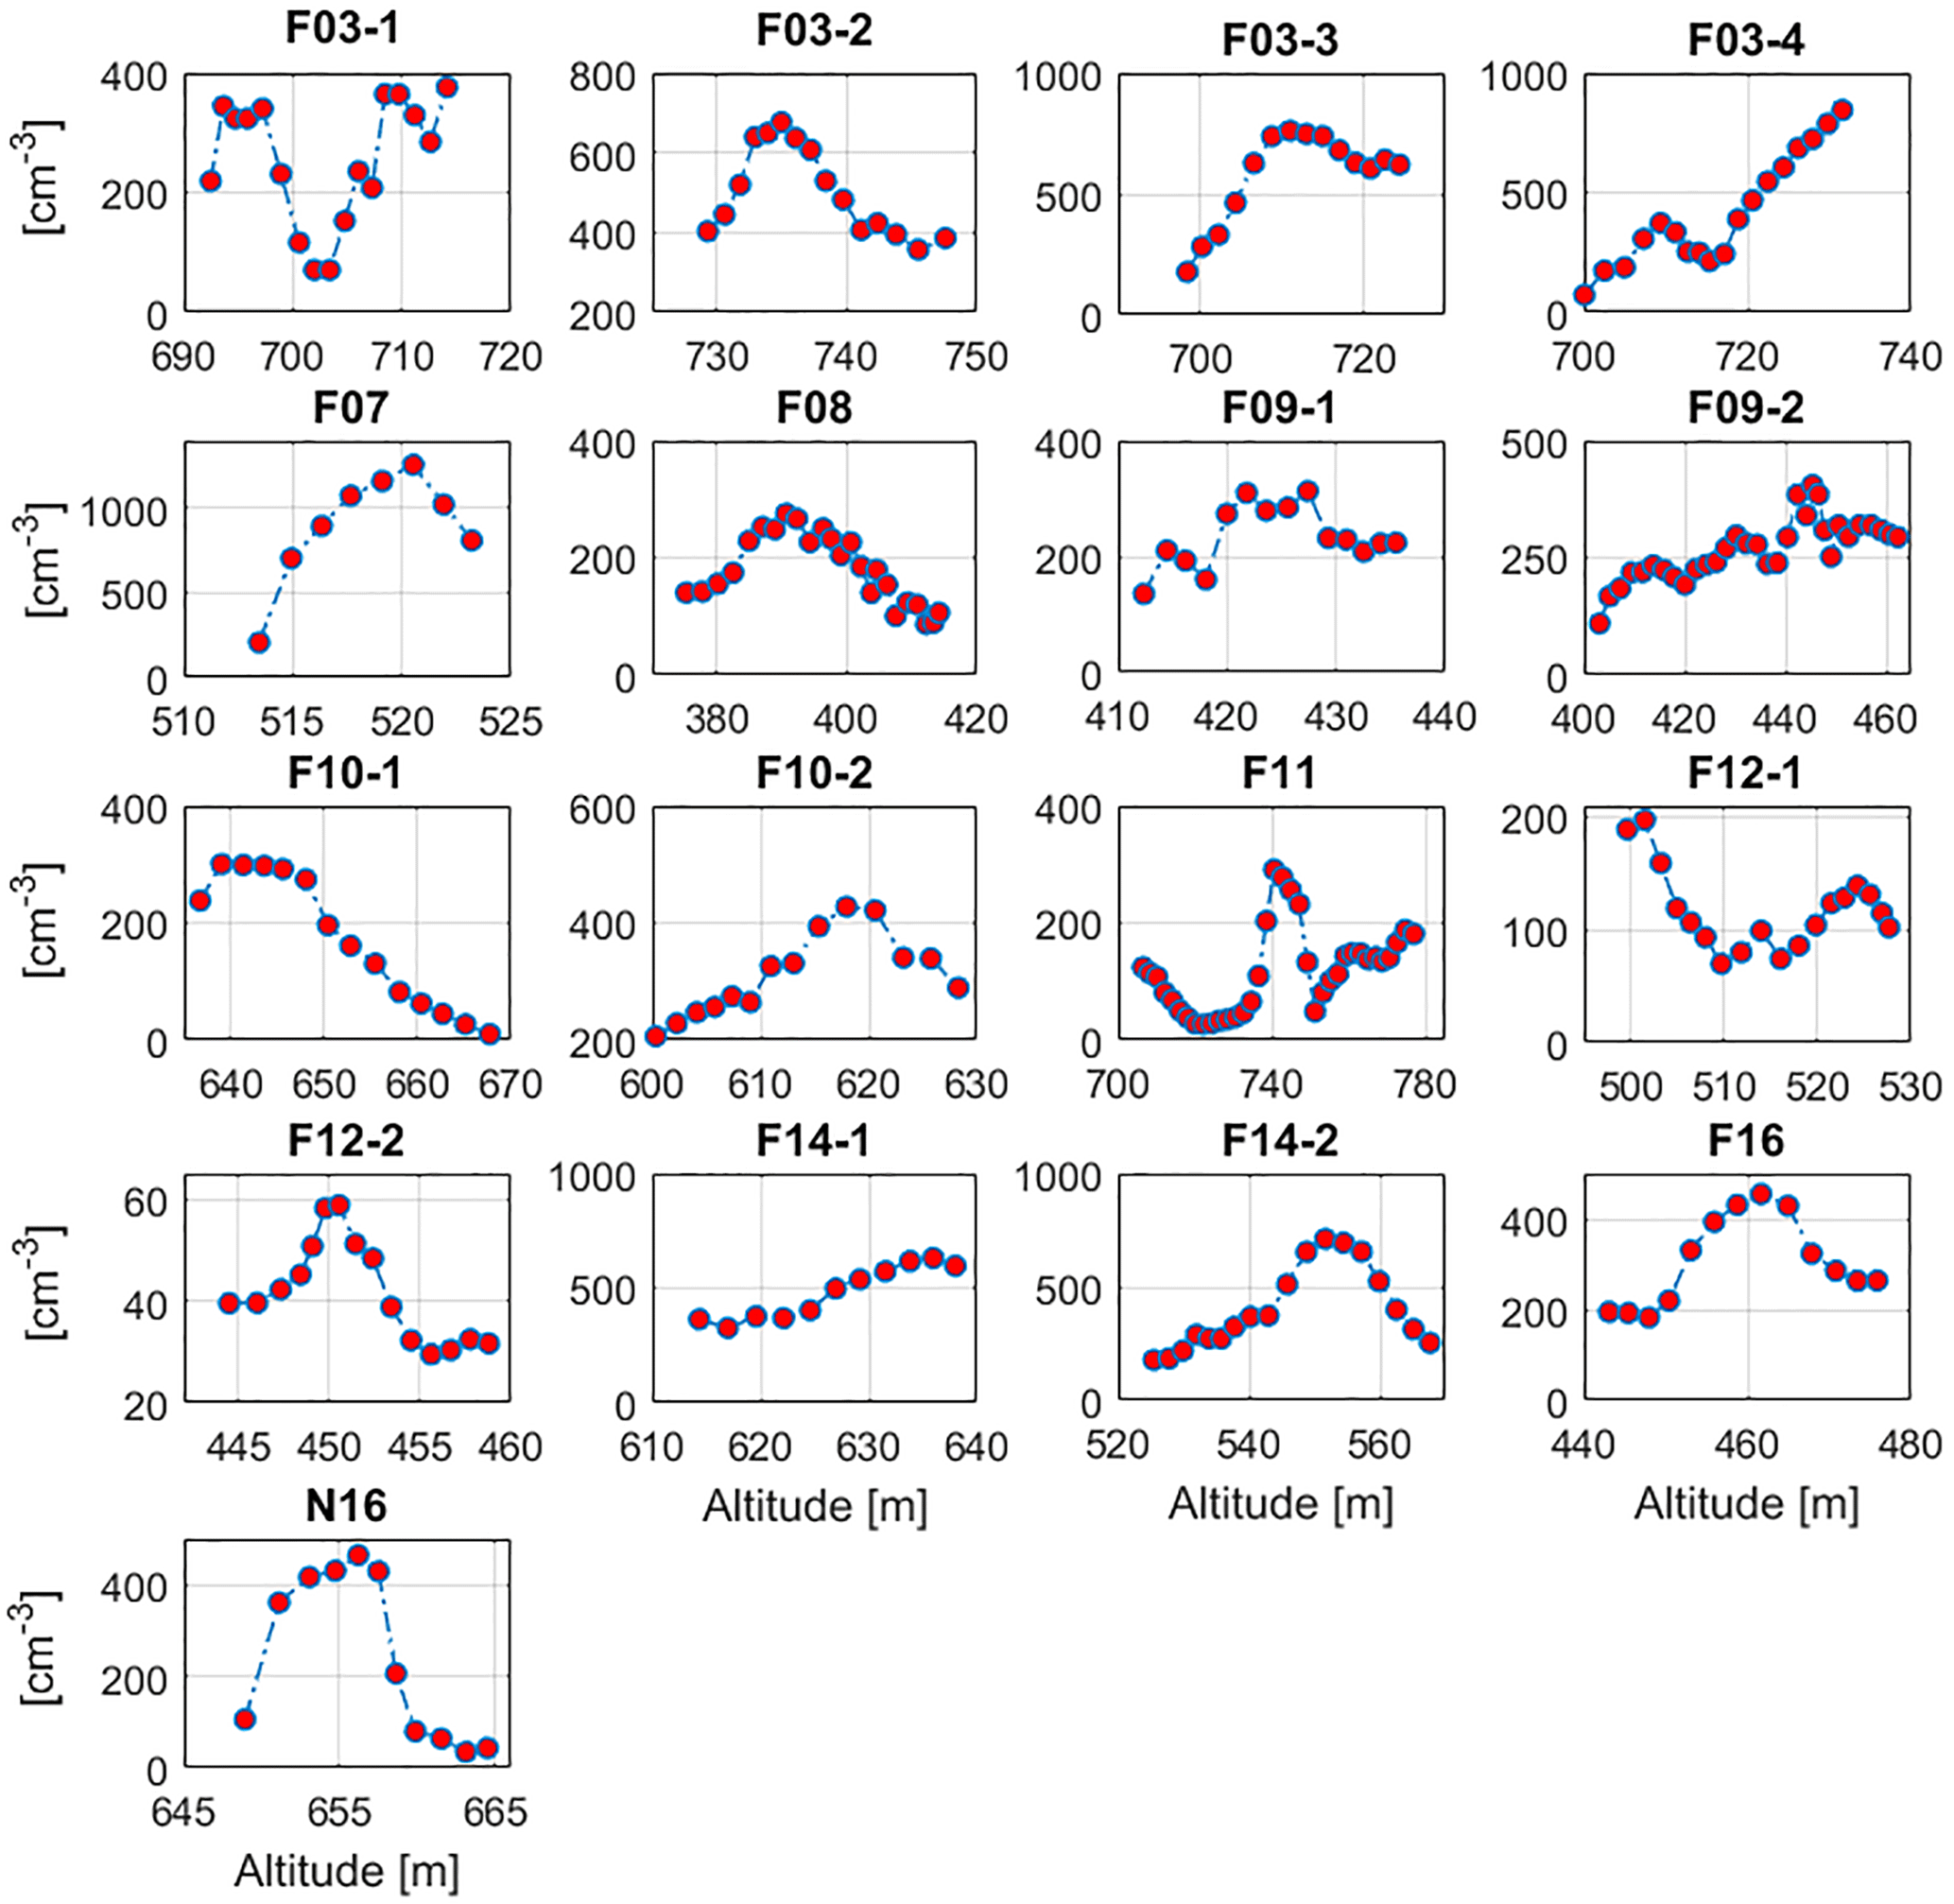
Figure 7Same as Fig. 5 but for particle concentration in diameter range 3–10 nm (UFCPC-CPC).
3.2 Cumulative vertical profiles
The sources of pollution impacting the study region vary in terms of the vertical layer being examined. More specifically, the predominant sources in the STBL are marine sea spray and biogenic emissions as well as ship exhaust (e.g., Coggon et al., 2014; Modini et al., 2015), while the major sources impacting the FT originate from the continent, including biogenic emissions, wildfires, anthropogenic emissions, and crustal emissions (e.g., Wang et al., 2014; Crosbie et al., 2016). As it is challenging with the current dataset to separate the relative importance of the pollution type affecting the EIL, instead the focus of the subsequent discussion is on aerosol size distributions. Also, as a way to rule out the presence of a different air mass in the EIL that is distinctly different than those in the STBL and FT, vertical profiles of CO (not shown here) were examined for the cases in Table 1. CO exhibited a smooth transition in concentration in the EIL progressing from lower values in the STBL to higher values in the FT. Based on that result and the shallow depth of EIL, it is concluded that the EIL in the cases examined did not have a distinct air mass affecting it that was different from either that in the STBL or the lower FT.
Table 1 compares particle concentration measurements from the PCASP and CPCs between the FT, EIL, and SUB layers. CPC concentrations were highest in the EIL for 8 of the 17 soundings, with the remaining 9 cases exhibiting peak values in the FT. With ascending altitude, average CPC concentrations were as follows: 465 ± 282 (SUB), 1052 ± 390 (EIL), and 1036 ± 612 cm−3 (FT). When considering UFCPC data (i.e., smaller minimum Dp than CPC), additional cases exhibited peak number concentrations in the EIL (10 of 17), with the remaining seven cases having peak values in the FT. UFCPC number concentrations were highest in the EIL (1400 ± 534 cm−3) and FT (1296 ± 705 cm−3), with the SUB layer again exhibiting the lowest values (530 ± 336 cm−3). PCASP data revealed a different vertical trend than the UFCPC and CPC in that several cases exhibited peak concentrations in the SUB layer (5 of 17), with the most cases exhibiting the highest values in the FT (7 of 17). Average PCASP concentrations were as follows in each layer: 156 ± 65 (SUB), 224 ± 107 (EIL), and 227 ± 120 cm−3 (FT). Relative to the SUB layer, the larger standard deviation of particle concentrations from the three instruments (i.e., PCASP, CPC, UFCPC) in the FT layer for each flight case is most likely owing to weaker vertical mixing, which promotes a non-homogeneous vertical distribution of aerosol particles in the FT.
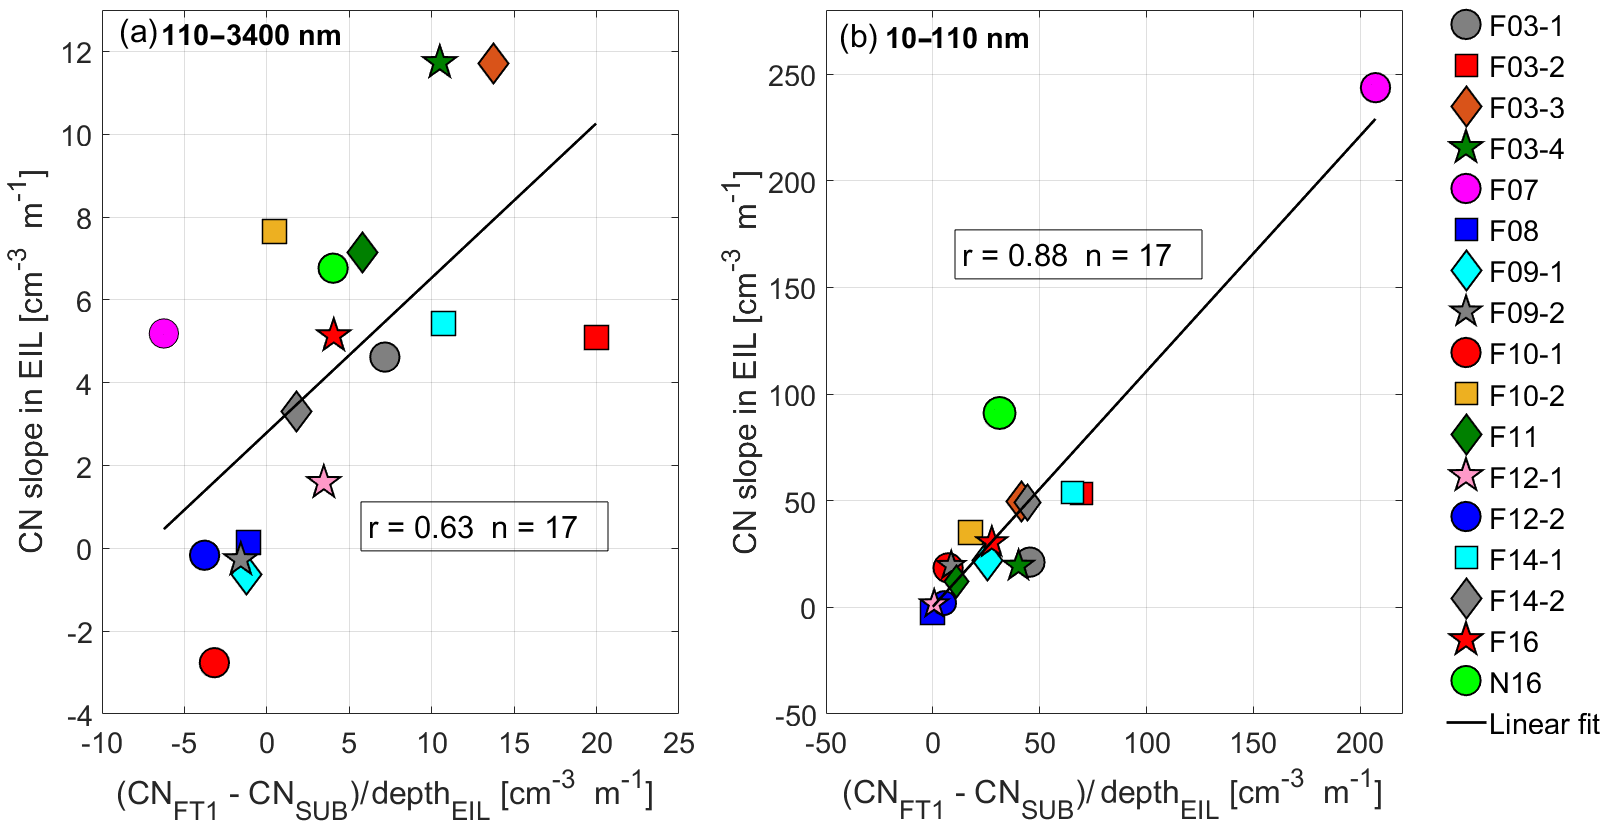
Figure 8Relationship between the slope of particle number concentration (CN) in the EIL and number concentration differences between the FT1 and SUB layers. Results are shown for two particle diameter ranges: (a) 110–3400 nm and (b) 10–110 nm. The x axis is normalized by the EIL depth to account for reduced slopes when the EIL is deeper.
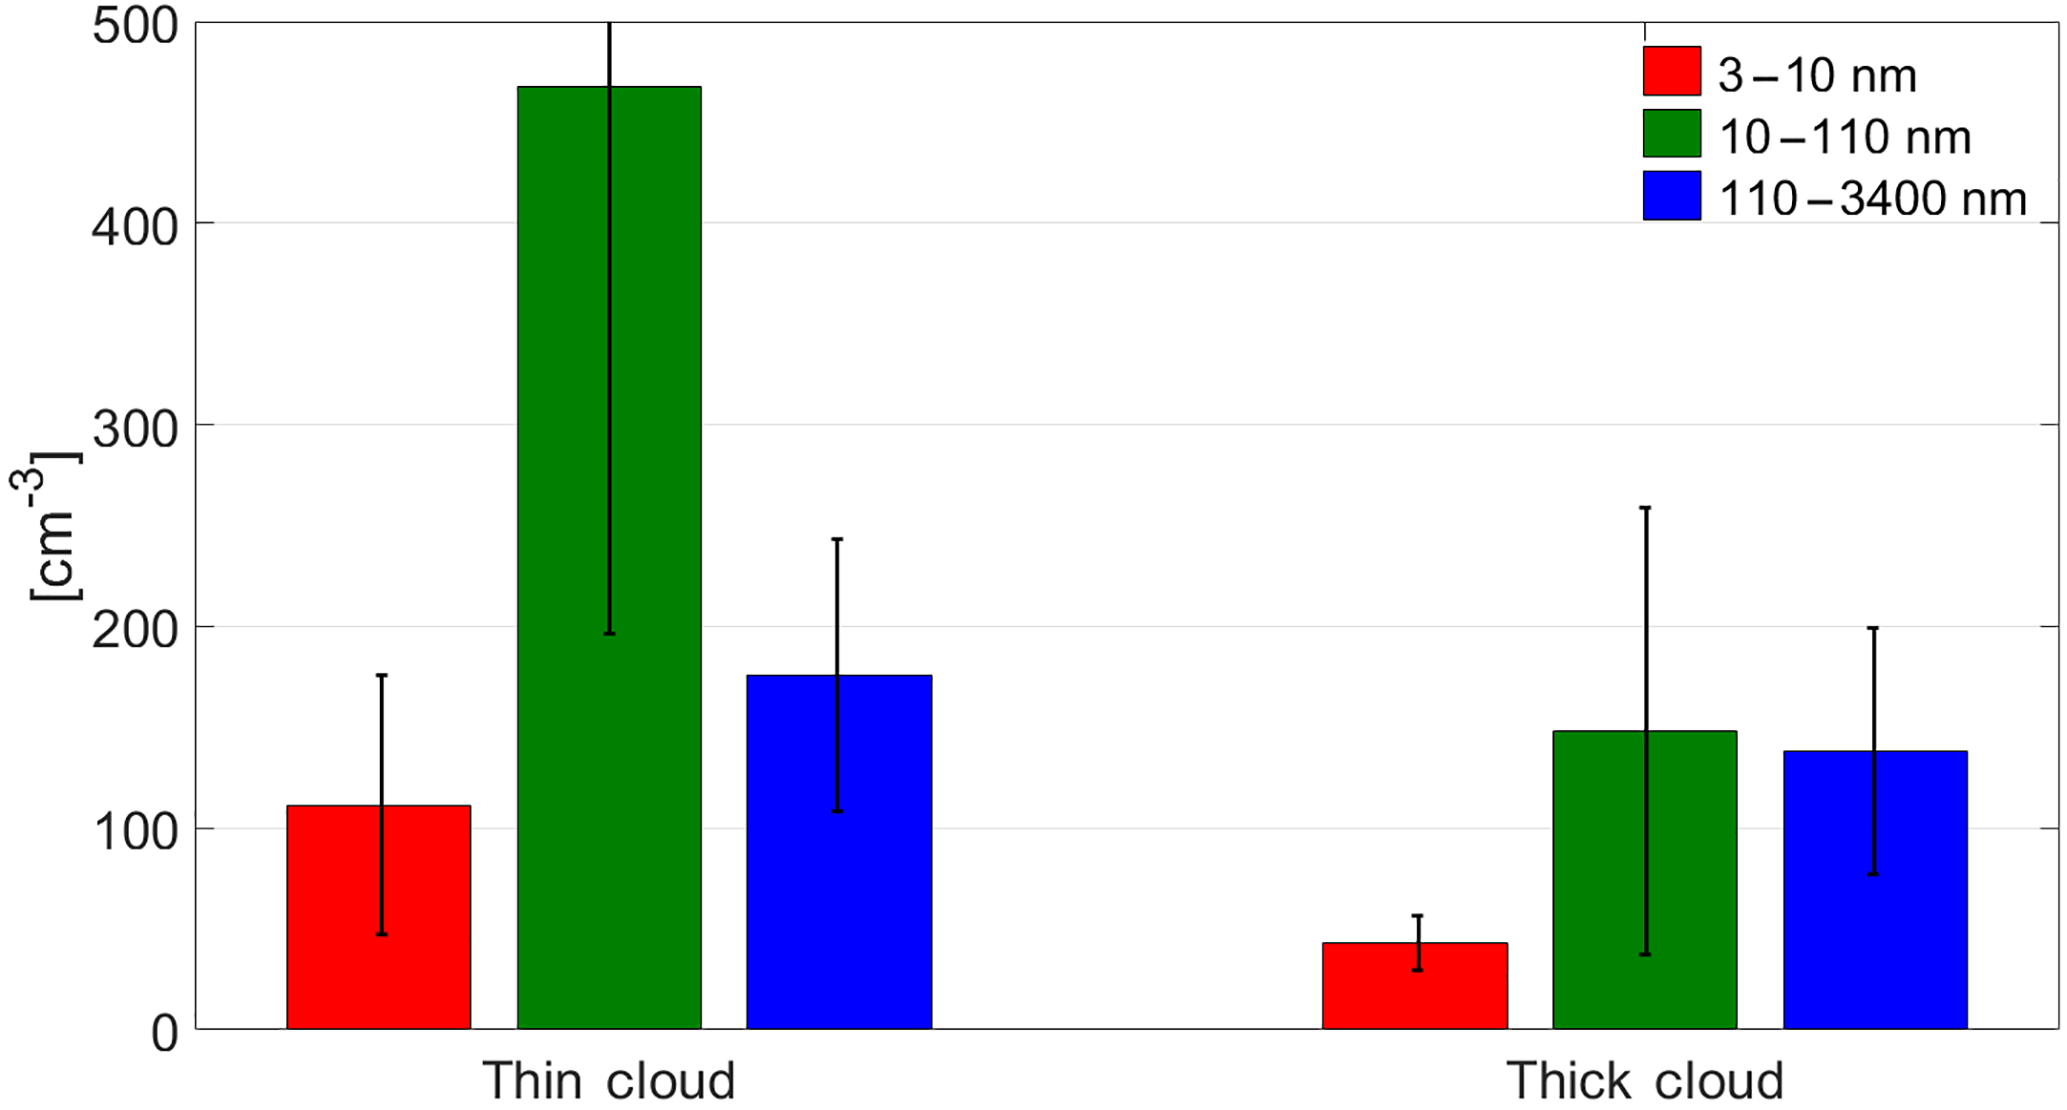
Figure 9Particle concentrations in different diameter ranges (3–10, 10–110, and 110–3400 nm) in the sub-cloud (SUB) layer for thin (thickness <333 m) and thick (thickness ≥ 333 m) clouds. Whiskers represent 1 standard deviation.
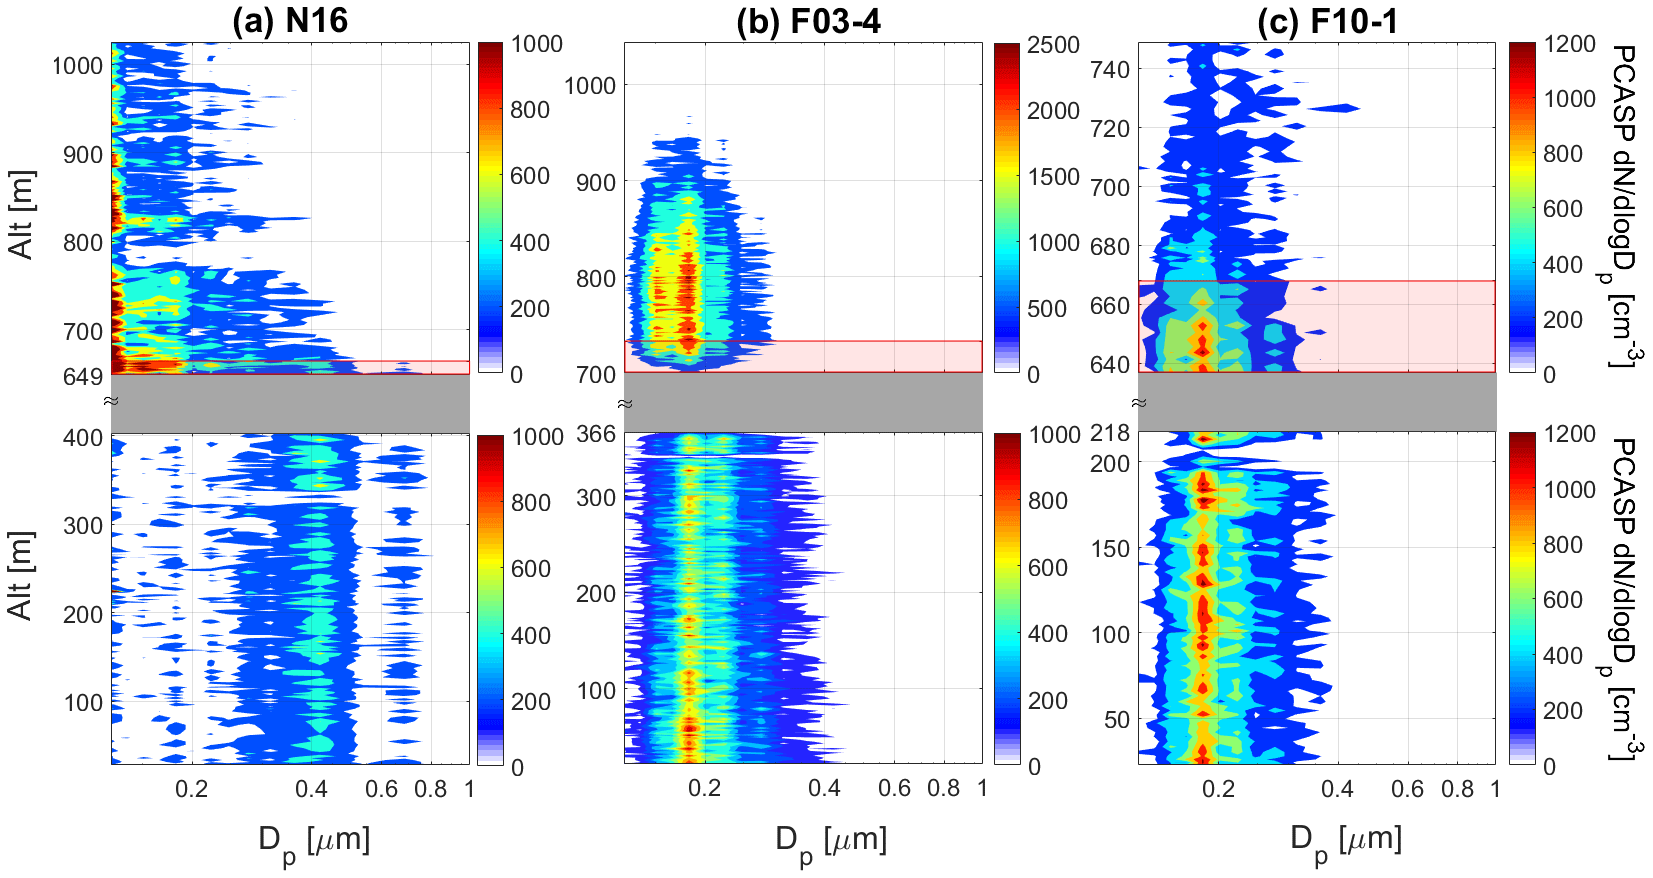
Figure 10Vertically resolved aerosol size distributions during spiral soundings on (a) N16, (b) F03-4, and (c) F10-1. The EIL and cloud layers are shaded in red and grey, respectively.
3.3 Nucleation in the EIL
Numerous past studies have discussed the occurrence of nucleation in the marine atmosphere (Hegg et al., 1991; Covert et al., 1992; Raes and Van Dingenen, 1992; Hoppel et al., 1994; Pandis et al., 1994; Clarke et al., 1998; Weber et al., 1998; Petters et al., 2006). Discussion in the previous section about differences between the UFCPC and CPC results suggests that new particle formation is a common occurrence in the EIL. Otherwise, it is difficult to explain the enhancements in particle concentrations with Dp between 3 and 10 nm (deduced from the difference between UFCPC and CPC concentrations). Eleven of the 17 cases exhibited their peak ratio of UFCPC : CPC in the EIL, with the remaining six cases split evenly between peak ratios in the SUB and FT layers. Average UFCPC : CPC concentration ratios were as follows in each layer: 1.16 ± 0.04 (SUB), 1.34 ± 0.23 (EIL), and 1.18 ± 0.10 (FT). The difference in the means between the EIL and either of the other two layers is statistically significant with 95 % confidence based on a two-tailed t test. The difference between the SUB and FT layers is insignificant.
To further examine differences in the aerosol size distribution in different vertical layers, Fig. 3 shows average number concentrations of particles in three Dp ranges: 3–10 (UFCPC-CPC), 10–110 (CPC-PCASP), and 110–3400 nm (PCASP). Regardless of the Dp range, the SUB layer exhibited the lowest average number concentration relative to the other layers. When considering each vertical layer, the Dp range exhibiting the highest number concentration was 10–110 nm. The highest number concentrations of particles with Dp < 110 nm were observed in the EIL, FT1, and FT2 layers. Number concentrations with Dp between 3 and 10 nm were highest in EIL (350 ± 220 cm−3) relative to the other vertical layers with statistically significant differences (at 95 % confidence) when compared to the SUB, FT3, and FT4 layers. The highest number concentration of particles with Dp between 10 and 110 nm was observed in the FT1 and FT2 layers, with likely influence from transported emissions of continentally derived secondarily produced aerosol (e.g., Hersey et al., 2009; Coggon et al., 2014) and growth of new particles from the EIL and lower FT.
Factors promoting nucleation include cool and moist air and low particle surface area concentrations (e.g., Kerminen and Wexler, 1996; Pirjola et al., 1999; Clarke et al., 1999; Alam et al., 2003). Figure 4 shows mean values for these parameters in each vertical layer. Surface area (SA) concentration was quantified separately for particles with Dp between 0.11 and 3.4 µm and for Dp > 3.4 µm using PCASP and FSSP probes, respectively. Although not measured, actinic fluxes immediately above cloud top in the EIL are enhanced, which contributes to the likelihood of nucleation owing to increased production of OH by more than a factor of 2 (Mauldin et al., 1999). Temperature and specific humidity expectedly increase and decrease, respectively, with altitude from the SUB layer up to the FT4 layer. Drier and warmer air in the FT is less favorable for nucleation as compared to the EIL. The highest SA concentrations were expectedly observed in the SUB layer owing to sea spray emissions. The sharp reduction of SA concentration between the SUB and EIL layers is driven by scavenging of aerosol particles within the cloud. Although average SA concentration, when integrating PCASP and FSSP data together (i.e., Dp between 0.11 and 45 µm), decreased with altitude above cloud top, the EIL value (54.7 ± 31.8 µm2 cm−3) was still much lower relative to the SUB layer (314.8 ± 301.6 µm2 cm−3) and only 42 % higher than that in FT3 (38.4 ± 24.8 µm2 cm−3), which exhibited the lowest value of any layer. The Dp range driving the changes in SA concentration between each layer was between 3.4 and 45 µm (0.2–266.8 µm2 cm−3) since Fig. 4 shows much less variability for SA concentration of particles with Dp between 0.11 and 3.4 µm (38.1–48.1 µm2 cm−3).
As it could be argued that the SA concentration in the EIL was still not very low in an absolute sense and exceeded values in layers above it, it is important to put the results in the context of other studies. Nucleation events adjacent to marine clouds have been recorded to occur for SA concentrations below 2 µm2 cm−3 in at least one study (Perry and Hobbs, 1995). Clarke et al. (1998) observed nucleation in cloud outflow regions when SA concentrations approached or dropped below ∼ 5–10 µm2 cm−3. However, recent work shows that increased aerosol loadings suppress nucleation in the boundary layer but enhance it in the lower FT owing to a chain of aerosol–radiation–photochemistry interactions (Quan et al., 2017). Nucleation events in Birmingham, United Kingdom, occurred for SA concentrations up to 300 µm2 cm−3, but with most events below 100 µm2 cm−3 (Alam et al., 2003). Field measurements in Beijing, China, suggested that 200 µm2 cm−3 served as a threshold SA concentration below which nucleation occurred (Cai et al., 2017). The total SA concentration in the EIL for Dp between 0.11 and 45 µm in the present study was far lower than that threshold and was below the upper limit of what was observed in Birmingham (Fig. 4). With regard to emissions sources that could promote nucleation in the study region, major ones include shipping (e.g., SO2; Coggon et al., 2012), marine biogenic emissions (e.g., dimethylsulfide, amines; Sorooshian et al., 2009, 2015; Youn et al., 2015), and continental emissions (e.g., NH3, volatile organic compounds; Maudlin et al., 2015; Braun et al., 2017).
The combination of cool and moist air, high actinic solar fluxes, relatively low SA concentrations as compared to other studies with nucleation events (e.g., Alam et al., 2003; Cai et al., 2017), and several precursor vapor sources builds a case for why nucleation resulted in the highest number concentration of particles with Dp between 3 and 10 nm in the EIL relative to other vertical layers. This result is consistent with previous studies showing that enhanced layers of new particles in the FT generally are near cloud top heights (e.g., Clarke et al., 1998, 1999).
The potential significance of nucleation in the EIL is that these particles impact the transfer of solar radiation owing to both directly scattering light and contributing to the marine atmosphere's cloud condensation nuclei (CCN) budget after growth to sufficiently large sizes. It is not possible with the current dataset to accurately calculate either nucleation rates in the EIL or the growth rates of nucleated particles to CCN-relevant sizes. However, a comparison of particle concentrations for Dp between 3 and 10 nm in the EIL versus the SUB layer suggests that the nucleation rate in the former layer is greater by a factor of 5. Others have reported particle growth rates in the Pacific Ocean MBL to be in the range of 3–10 nm h−1 (Hoppel et al., 1994; Weber et al., 1998; Jennings and O'Dowd, 2000). Using a global aerosol microphysics model, Merikanto et al. (2009) estimated that, in the marine boundary layer, 55 % of CCN (0.2 %) is from nucleation, with 45 % entrained from the FT and 10 % nucleated directly in the boundary layer. Therefore, nucleation in the EIL is significant for the CCN budget in the marine atmosphere.
3.4 STBL and FT influences on the EIL
The vertical profile of aerosol number concentrations in the EIL provides insight into the level of influence between adjacent vertical layers (i.e., STBL and FT). Thirteen of the 17 examined spirals exhibited an increasing trend of particle concentration in the Dp range between 110 and 3400 nm as a function of altitude in the EIL layer (Fig. 5). For particles with Dp between 10 and 110 nm, almost all of the cases (16 of 17) exhibited a positive trend between concentration and altitude (Fig. 6). In this diameter range, F08 exhibited an overall decrease in concentration with EIL altitude; however, concentrations initially exhibited an increase in the bottom half of the EIL for this case before decreasing. F07, which exhibited the thinnest EIL, was marked by the highest slope, demonstrating the sensitivity of the slopes to EIL thickness. Figure 7 demonstrates that concentrations of particles in Dp range between 3 and 10 nm exhibit a different, and nonlinear, relationship with altitude in EIL as compared with the other two size ranges. This nonlinear relationship of particle concentration with altitude is likely due to nucleation of particles within the EIL.
The slopes of the number concentrations for two Dp ranges (10–110 and 110–3400 nm) versus altitude in the EIL provide insight into the relative differences between SUB and lower FT aerosol number concentrations. A positive slope likely suggests that the lower FT is more polluted as compared to the SUB layer. Figure 8 relates the number concentration slopes in the EIL for the two Dp ranges as a function of the number concentration difference between the FT1 and the SUB layer. The x axis is normalized by the EIL depth to account for reduced slopes when EIL depth is high. There is a strong positive relationship for both size ranges, supporting the notion that the EIL acts as a layer with properties intermediate to those in the STBL and FT. In other words, the aerosol gradient in the EIL is maintained by the relative difference of aerosol characteristics between STBL and lower FT layers.
An interesting feature of the cases with lower number concentrations in the SUB layer is that they tended to be concurrent with thicker clouds. Figure 9 shows particle concentrations in the SUB layer for the 17 cases divided in two different categories (thin and thick clouds) using the median cloud thickness (333 m) as a dividing threshold value. The number concentration means for Dp between 3–10 and 10–110 nm were significantly different (and lower) for thick clouds as compared to thin clouds. This is suggestive of enhanced scavenging (both below cloud and in-cloud scavenging) of particles in comparison to thinner clouds. This is supported by columnar-mean drizzle rates for the thick clouds exceeding those for thin clouds: 3.2 ± 2.2 mm day−1 versus 0.4 ± 0.4 mm day−1. A peculiar result is that there was no statistically significant difference in the number concentration for larger particles, which are the ones most likely to activate into cloud droplets and be associated with drizzle drops. Although outside the scope of this study, a potential explanation that will be the subject of forthcoming work is that evaporation of drizzle drops in the SUB layer preserves the concentration of larger particles, while smaller particles are scavenged by drops.
3.5 Cloud-processed aerosol in the EIL
While some studies suggest that the EIL air has properties intermediate to the STBL and FT owing to detrainment of air from the STBL (Deardorff, 1980; Gerber et al., 2005, 2016), others have not found evidence for detrainment (Faloona et al., 2005; Kurowski et al., 2009). Also, the lowering of cloud top height via mechanisms such as evaporation or drop sedimentation can leave a layer of cloud-processed aerosol in the EIL (Sorooshian et al., 2007; Chen et al., 2012). As those studies were not focused on aerosol size distributions, here we address this issue using PCASP size distribution data. Three case studies (Fig. 10) are used to show the range of conditions experienced with reference made to geometric mean diameters of specific PCASP size bins where number concentration modes were observed.
The N16 case exhibited a unimodal size distribution in the SUB layer with a peak near 420 nm. In the FT, there was a clear peak at or below the minimum size limit of the PCASP (110 nm). The EIL exhibited an intermediate aerosol size distribution with the peak at the lowest size, similar to the FT, and a peak at 420 nm, similar to the SUB layer. In addition, the number concentration was most enhanced in the EIL in comparison to the SUB and FT layers. The number concentration and shape of the size distribution above 315 nm was identical between the EIL and SUB layers. However, the number concentration below that size was most enhanced in the EIL, suggestive of accumulation of subsiding FT aerosol. Earlier work showed how subsiding FT aerosol can lead to thin layers of enriched organic acid aerosol concentrations above cloud tops in the study region (Sorooshian et al., 2007).
The F03-4 case exhibited behavior characteristic of the EIL being mainly influenced by the FT and not the SUB layer. The SUB aerosol size distribution was bimodal with peaks at 182 and 223 nm. The FT aerosol exhibited a bimodal distribution but with peaks at smaller sizes, specifically 151 and 182 nm. The EIL showed the same bimodal structure as the FT, with the resemblance closest near the top of the EIL.
Finally, the F10-1 case exhibited behavior suggestive of higher influence from the SUB layer as compared to the FT. The SUB aerosol size distribution was bimodal, similar to the previous case with peaks at 182 and 223 nm. These same peaks were present in the EIL, and the resemblance to the SUB size distribution was closest at the base of the EIL. The FT aerosol size distribution was unimodal with a peak at 182 nm.
These three cases illustrate that EIL aerosol size distributions exhibit characteristics of both the STBL and FT aerosol to varying degrees depending on the case examined. An interesting feature of these three cases is that the strength of the temperature inversion at cloud top was similar (dθ∕dz within the EIL was ∼ 0.2 K m−1). The slopes from Fig. 5 are consistent with the aerosol size distribution relationships between the SUB, EIL, and FT layers. More specifically, the most significant, and highest slope, was for F03-4, which is the case where the EIL size distribution most clearly resembled that in the FT. Although still positive, the slope from N16 was weaker owing to the influence from both the STBL and FT. Finally, F10-1 exhibited a negative slope, consistent with the EIL size distribution most clearly resembling that in the SUB layer.
This work examined 17 spiral soundings from research flights off the California coast with a focus on the aerosol characteristics of the EIL relative to the FT above it and the STBL below it. The main results are as follows:
-
Regardless of particle size range, the SUB layer exhibited the lowest average number concentrations relative to the EIL and FT. Thicker clouds were coincident with the lowest number concentrations in the SUB layer, especially for Dp between 3 and 110 nm. Conversely, the SUB layer exhibits the highest total aerosol surface area concentrations owing to sea spray emissions, with significantly lower values in the EIL and FT layers.
-
The aerosol number concentration data provide evidence of nucleation in the EIL, coincident with factors that promote this mechanism including relatively low aerosol surface area, favorable meteorological conditions (cool and moist air), and high actinic fluxes.
-
Vertical aerosol number concentration gradients for diameter range 10–110 and 110–3400 nm in the EIL are a good predictor as to the relative behavior of the aerosol size distribution between the SUB and FT layers.
-
Vertically resolved aerosol size distribution data show that there can be signatures of cloud-processed air in the EIL.
The implications of this study are multi-fold with regard to research flight planning and the overall effects of aerosol on climate and clouds. More specifically, the results stress that airborne flights that attempt to characterize aerosol characteristics above stratocumulus clouds require caution in terms of how far above cloud tops flight patterns are conducted owing to differences that exist between the EIL and the FT. Careful attention to where the EIL is relative to the FT is recommended as the latter most clearly will represent aerosol conditions from sources other than those below cloud and the former will have the strongest signature of nucleation. Finally, the EIL often exhibits signatures of cloud-processed aerosol that are important to consider with regard to understanding cloud effects on aerosol.
All data used in this work can be found on the Figshare database (Sorooshian et al., 2017; https://figshare.com/articles/A_Multi-Year_Data_Set_on_Aerosol-Cloud-Precipitation-Meteorology_Interactions_for_Marine_Stratocumulus_Clouds/5099983).
The authors declare that they have no conflict of interest.
This work was funded by Office of Naval Research
grants N00014-10-1-0811, N00014-11-1-0783, N00014-10-1-0200,
N00014-04-1-0118, and N00014-16-1-2567.
Edited by: Manabu Shiraiwa
Reviewed by: two anonymous referees
Alam, A., Shi, J. P., and Harrison, R. M.: Observations of new particle formation in urban air, J. Geophys. Res.-Atmos., 108, 4093, https://doi.org/10.1029/2001jd001417, 2003.
Braun, R. A., Dadashazar, H., MacDonald, A. B., Aldhaif, A. M., Maudlin, L. C., Crosbie, E., Aghdam, M. A., Mardi, A. H., and Sorooshian, A.: Impact of wildfire emissions on chloride and bromide depletion in marine aerosol particles, Environ. Sci. Technol., 51, 9013–9021, 2017.
Cai, R., Yang, D., Fu, Y., Wang, X., Li, X., Ma, Y., Hao, J., Zheng, J., and Jiang, J.: Aerosol surface area concentration: a governing factor for new particle formation in Beijing, Atmos. Chem. Phys., 17, 12327–12340, https://doi.org/10.5194/acp-17-12327-2017, 2017.
Carman, J. K., Rossiter, D. L., Khelif, D., Jonsson, H. H., Faloona, I. C., and Chuang, P. Y.: Observational constraints on entrainment and the entrainment interface layer in stratocumulus, Atmos. Chem. Phys., 12, 11135–11152, https://doi.org/10.5194/acp-12-11135-2012, 2012.
Caughey, S. J., Crease, B. A., and Roach, W. T.: A field-study of nocturnal stratocumulus, 2. Turbulence structure and entrainment, Q. J. Roy. Meteor. Soc., 108, 125–144, https://doi.org/10.1002/qj.49710845508, 1982.
Chen, Y. C., Christensen, M. W., Xue, L., Sorooshian, A., Stephens, G. L., Rasmussen, R. M., and Seinfeld, J. H.: Occurrence of lower cloud albedo in ship tracks, Atmos. Chem. Phys., 12, 8223–8235, https://doi.org/10.5194/acp-12-8223-2012, 2012.
Clarke, A. D., Varner, J. L., Eisele, F., Mauldin, R. L., Tanner, D., and Litchy, M.: Particle production in the remote marine atmosphere: Cloud outflow and subsidence during ACE 1, J. Res.-Atmos., 103, 16397–16409, https://doi.org/10.1029/97jd02987, 1998.
Clarke, A. D., Kapustin, V. N., Eisele, F. L., Weber, R. J., and McMurry, P. H.: Particle production near marine clouds: Sulfuric acid and predictions from classical binary nucleation, Geophys. Res. Lett., 26, 2425–2428, https://doi.org/10.1029/1999gl900438, 1999.
Coggon, M. M., Sorooshian, A., Wang, Z., Metcalf, A. R., Frossard, A. A., Lin, J. J., Craven, J. S., Nenes, A., Jonsson, H. H., Russell, L. M., Flagan, R. C., and Seinfeld, J. H.: Ship impacts on the marine atmosphere: insights into the contribution of shipping emissions to the properties of marine aerosol and clouds, Atmos. Chem. Phys., 12, 8439–8458, https://doi.org/10.5194/acp-12-8439-2012, 2012.
Coggon, M. M., Sorooshian, A., Wang, Z., Craven, J. S., Metcalf, A. R., Lin, J. J., Nenes, A., Jonsson, H. H., Flagan, R. C., and Seinfeld, J. H.: Observations of continental biogenic impacts on marine aerosol and clouds off the coast of California, J. Geophys. Res.-Atmos., 119, 6724–6748, https://doi.org/10.1002/2013JD021228, 2014.
Costantino, L. and Breón, F. M.: Analysis of aerosol-cloud interaction from multi-sensor satellite observations, Geophys. Res. Lett., 37, L11801, https://doi.org/10.1029/2009gl041828, 2010.
Covert, D. S., Kapustin, V. N., Quinn, P. K., and Bates, T. S.: New particle formation in the marine boundary-layer, J. Geophys. Res.-Atmos., 97, 20581–20589, https://doi.org/10.1029/92jd02074, 1992.
Crosbie, E., Wang, Z., Sorooshian, A., Chuang, P. Y., Craven, J. S., Coggon, M. M., Brunke, M., Zeng, X. B., Jonsson, H., Woods, R. K., Flagan, R. C., and Seinfeld, J. H.: Stratocumulus cloud clearings and notable thermodynamic and aerosol contrasts across the clear-cloudy interface, J. Atmos. Sci., 73, 1083–1099, https://doi.org/10.1175/Jas-D-15-0137.1, 2016.
Dadashazar, H., Wang, Z., Crosbie, E., Brunke, M., Zeng, X. B., Jonsson, H., Woods, R. K., Flagan, R. C., Seinfeld, J. H., and Sorooshian, A.: Relationships between giant sea salt particles and clouds inferred from aircraft physicochemical data, J. Geophys. Res.-Atmos., 122, 3421–3434, https://doi.org/10.1002/2016JD026019, 2017.
Deardorff, J. W.: Stratocumulus-capped mixed layers derived from a 3-dimensional model, Bound.-Lay. Meteorol., 18, 495–527, https://doi.org/10.1007/Bf00119502, 1980.
Faloona, I., Lenschow, D. H., Campos, T., Stevens, B., van Zanten, M., Blomquist, B., Thornton, D., Bandy, A., and Gerber, H.: Observations of entrainment in eastern Pacific marine stratocumulus using three conserved scalars, J. Atmos. Sci., 62, 3268–3285, https://doi.org/10.1175/Jas3541.1, 2005.
Feingold, G., McComiskey, A., Rosenfeld, D., and Sorooshian, A.: On the relationship between cloud contact time and precipitation susceptibility to aerosol, J. Geophys. Res.-Atmos., 118, 10544–10554, https://doi.org/10.1002/jgrd.50819, 2013.
Gerber, H., Arends, B. G., and Ackerman, A. S.: New microphysics sensor for aircraft use, Atmos. Res., 31, 235–252, https://doi.org/10.1016/0169-8095(94)90001-9, 1994.
Gerber, H., Frick, G., Malinowski, S. P., Brenguier, J. L., and Burnet, F.: Holes and entrainment in stratocumulus, J. Atmos. Sci., 62, 443–459, https://doi.org/10.1175/Jas-3399.1, 2005.
Gerber, H., Frick, G., Malinowski, S. P., Jonsson, H., Khelif, D., and Krueger, S. K.: Entrainment rates and microphysics in POST stratocumulus, J. Geophys. Res.-Atmos., 118, 12094–12109, https://doi.org/10.1002/jgrd.50878, 2013.
Gerber, H., Malinowski, S. P., and Jonsson, H.: Evaporative and radiative cooling in POST stratocumulus, J. Atmos. Sci., 73, 3877–3884, https://doi.org/10.1175/Jas-D-16-0023.1, 2016.
Haman, K. E., Malinowski, S. P., Kurowski, M. J., Gerber, H., and Brenguier, J. L.: Small scale mixing processes at the top of a marine stratocumulus – a case study, Q. J. Roy. Meteor. Soc., 133, 213–226, https://doi.org/10.1002/qj.5, 2007.
Hegg, D. A., Radke, L. F., and Hobbs, P. V.: Measurements of aitken nuclei and cloud condensation nuclei in the marine atmosphere and their relation to the DMS-cloud-climate hypothesis, J. Geophys. Res.-Atmos., 96, 18727–18733, https://doi.org/10.1029/91jd01870, 1991.
Hegg, D. A., Covert, D. S., Jonsson, H., and Covert, P. A.: Determination of the transmission efficiency of an aircraft aerosol inlet, Aerosol Sci. Tech., 39, 966–971, https://doi.org/10.1080/02786820500377814, 2005.
Hersey, S. P., Sorooshian, A., Murphy, S. M., Flagan, R. C., and Seinfeld, J. H.: Aerosol hygroscopicity in the marine atmosphere: a closure study using high-time-resolution, multiple-RH DASH-SP and size-resolved C-ToF-AMS data, Atmos. Chem. Phys., 9, 2543–2554, https://doi.org/10.5194/acp-9-2543-2009, 2009.
Hoppel, W. A., Frick, G. M., Fitzgerald, J., and Larson, R. E.: Marine boundary-layer measurements of new particle formation and the effects nonprecipitating clouds have on aerosol-size distribution, J. Geophys. Res.-Atmos., 99, 14443–14459, https://doi.org/10.1029/94jd00797, 1994.
Jen-La Plante, I., Ma, Y. F., Nurowska, K., Gerber, H., Khelif, D., Karpinska, K., Kopec, M. K., Kumala, W., and Malinowski, S. P.: Physics of Stratocumulus Top (POST): turbulence characteristics, Atmos. Chem. Phys., 16, 9711–9725, https://doi.org/10.5194/acp-16-9711-2016, 2016.
Jennings, S. G. and O'Dowd, C. D.: Continuous measurements of new particle formation and the radiative effects of coastal particle production plumes, Rep. Ser. Aerosol Sci., 48, 40–47, 2000.
Katoshevski, D., Nenes, A., and Seinfeld, J. H.: A study of processes that govern the maintenance of aerosols in the marine boundary layer, J. Aerosol. Sci., 30, 503–532, https://doi.org/10.1016/S0021-8502(98)00740-X, 1999.
Katzwinkel, J., Siebert, H., and Shaw, R. A.: Observation of a self-limiting, shear-induced turbulent inversion layer above marine stratocumulus, Bound.-Lay. Meteorol., 145, 131–143, https://doi.org/10.1007/s10546-011-9683-4, 2012.
Kerminen, V. M. and Wexler, A. S.: The occurrence of sulfuric acid-water nucleation in plumes: Urban environment, Tellus B, 48, 65–82, https://doi.org/10.1034/j.1600-0889.1996.00007.x, 1996.
Kurowski, M. J., Malinowski, S. P., and Grabowski, W. W.: A numerical investigation of entrainment and transport within a stratocumulus-topped boundary layer, Q. J. Roy. Meteor. Soc., 135, 77–92, https://doi.org/10.1002/qj.354, 2009.
Lenschow, D. H., Zhou, M. Y., Zeng, X. B., Chen, L. S., and Xu, X. D.: Measurements of fine-scale structure at the top of Marine Stratocumulus, Bound.-Lay. Meteorol., 97, 331–357, https://doi.org/10.1023/A:1002780019748, 2000.
Malinowski, S. P., Gerber, H., Jen-La Plante, I., Kopec, M. K., Kumala, W., Nurowska, K., Chuang, P. Y., Khelif, D., and Haman, K. E.: Physics of Stratocumulus Top (POST): turbulent mixing across capping inversion, Atmos. Chem. Phys., 13, 12171–12186, https://doi.org/10.5194/acp-13-12171-2013, 2013.
Maudlin, L. C., Wang, Z., Jonsson, H. H., and Sorooshian, A.: Impact of wildfires on size-resolved aerosol composition at a coastal California site, Atmos. Environ., 119, 59–68, 2015.
Mauldin, R. L., Tanner, D. J., Heath, J. A., Huebert, B. J., and Eisele, F. L.: Observations of H2SO4 and MSA during PEM-Tropics-A, J. Geophys. Res.-Atmos., 104, 5801–5816, https://doi.org/10.1029/98jd02612, 1999.
Merikanto, J., Spracklen, D. V., Mann, G. W., Pickering, S. J., and Carslaw, K. S.: Impact of nucleation on global CCN, Atmos. Chem. Phys., 9, 8601–8616, https://doi.org/10.5194/acp-9-8601-2009, 2009.
Modini, R. L., Frossard, A. A., Ahlm, L., Russell, L. M., Corrigan, C. E., Roberts, G. C., Hawkins, L. N., Schroder, J. C., Bertram, A. K., Zhao, R., Lee, A. K. Y., Abbatt, J. P. D., Lin, J., Nenes, A., Wang, Z., Wonaschutz, A., Sorooshian, A., Noone, K. J., Jonsson, H., Seinfeld, J. H., Toom-Sauntry, D., Macdonald, A. M., and Leaitch, W. R.: Primary marine aerosol-cloud interactions off the coast of California, J. Geophys. Res.-Atmos., 120, 4282–4303, https://doi.org/10.1002/2014jd022963, 2015.
Moeng, C. H., Stevens, B., and Sullivan, P. P.: Where is the interface of the stratocumulus-topped PBL?, J. Atmos. Sci., 62, 2626–2631, https://doi.org/10.1175/Jas3470.1, 2005.
Nicholls, S. and Turton, J. D.: An observational study of the structure of stratiform cloud sheets. 2. Entrainment, Q. J. Roy. Meteor. Soc., 112, 461–480, https://doi.org/10.1002/qj.49711247210, 1986.
Pandis, S. N., Russell, L. M., and Seinfeld, J. H.: The relationship between DMS flux and CCN concentration in remote marine regions, J. Geophys. Res.-Atmos., 99, 16945–16957, https://doi.org/10.1029/94jd01119, 1994.
Perry, K. D. and Hobbs, P. V.: Further evidence for particle nucleation in clean-air adjacent to marine cumulus clouds, J. Geophys. Res.-Atmos., 100, 18929–18929, https://doi.org/10.1029/94JD01926, 1995.
Petters, M. D., Snider, J. R., Stevens, B., Vali, G., Faloona, I., and Russell, L. M.: Accumulation mode aerosol, pockets of open cells, and particle nucleation in the remote subtropical Pacific marine boundary layer, J. Geophys. Res.-Atmos., 111, D02206, https://doi.org/10.1029/2004jd005694, 2006.
Pirjola, L., Kulmala, M., Wilck, M., Bischoff, A., Stratmann, F., and Otto, E.: Formation of sulphuric acid aerosols and cloud condensation nuclei: An expression for significant nucleation and model comparison, J. Aerosol. Sci., 30, 1079–1094, https://doi.org/10.1016/S0021-8502(98)00776-9, 1999.
Prabhakar, G., Ervens, B., Wang, Z., Maudlin, L. C., Coggon, M. M., Jonsson, H. H., Seinfeld, J. H., and Sorooshian, A.: Sources of nitrate in stratocumulus cloud water: Airborne measurements during the 2011 E-PEACE and 2013 NiCE studies, Atmos. Environ., 97, 166–173, 2014.
Quan, J. N., Liu, Y. A., Liu, Q., Jia, X. C., Li, X., Gao, Y., Ding, D. P., Li, J., and Wang, Z. F.: Anthropogenic pollution elevates the peak height of new particle formation from planetary boundary layer to lower free troposphere, Geophys. Res. Lett., 44, 7537–7543, https://doi.org/10.1002/2017GL074553, 2017.
Raes, F. and Vandingenen, R.: Simulations of condensation and cloud condensation nuclei from biogenic SO2 in the remote marine boundary-layer, J. Geophys. Res-Atmos., 97, 12901–12912, https://doi.org/10.1029/92jd00961, 1992.
Sorooshian, A., Lu, M. L., Brechtel, F. J., Jonsson, H., Feingold, G., Flagan, R. C., and Seinfeld, J. H.: On the source of organic acid aerosol layers above clouds, Environ. Sci. Technol., 41, 4647–4654, https://doi.org/10.1021/es0630442, 2007.
Sorooshian, A., Padro, L. T., Nenes, A., Feingold, G., McComiskey, A., Hersey, S. P., Gates, H., Jonsson, H. H., Miller, S. D., Stephens, G. L., Flagan, R. C., and Seinfeld, J. H.: On the link between ocean biota emissions, aerosol, and maritime clouds: Airborne, ground, and satellite measurements off the coast of California, Global Biogeochem. Cy., 23, GB003464, https://doi.org/10.1029/2009GB003464, 2009.
Sorooshian, A., Crosbie, E., Maudlin, L. C., Youn, J. S., Wang, Z., Shingler, T., Ortega, A. M., Hersey, S., and Woods, R. K.: Surface and airborne measurements of organosulfur and methanesulfonate over the western United States and coastal areas, J. Geophys. Res.-Atmos., 120, 8535–8548, 2015.
Sorooshian, A., MacDonald, A. B., Dadashazar, H., Bates, K. H., Coggon, M. M., Craven, J. S., Crosbie, E., Hersey, S. P., Hodas, N., Lin, J. J., Marty, A. N., Maudlin, L. C., Metcalf, A. R., Murphy, S. M., Padro, L. T., Prabhakar, G., Rissman, T. A., Shingler, T., Varutbangkul, V., Wang, Z., Woods, R. K., Chuang, P. Y., Nenes, A., Jonsson, H. H., Flagan, R. C., and Seinfeld, J. H.: A multi-year data set on aerosol-cloud-precipitation-meteorology interactions for marine stratocumulus clouds, Figshare, https://doi.org/10.6084/m9.figshare.5099983.v3, 2017.
Wang, Q. and Albrecht, B. A.: Observations of cloud-top entrainment in marine stratocumulus clouds, J. Atmos. Sci., 51, 1530–1547, https://doi.org/10.1175/1520-0469(1994)051<1530:Ooctei>2.0.Co;2, 1994.
Wang, S. P., Golaz, J. C., and Wang, Q.: Effect of intense wind shear across the inversion on stratocumulus clouds, Geophys. Res. Lett., 35, L15814, https://doi.org/10.1029/2008gl033865, 2008.
Wang, Z., Sorooshian, A., Prabhakar, G., Coggon, M. M., and Jonsson, H. H.: Impact of emissions from shipping, land, and the ocean on stratocumulus cloud water elemental composition during the 2011 E-PEACE field campaign, Atmos. Environ., 89, 570–580, https://doi.org/10.1016/j.atmosenv.2014.01.020, 2014.
Wang, Z., Ramirez, M. M., Dadashazar, H., MacDonald, A. B., Crosbie, E., Bates, K. H., Coggon, M. M., Craven, J. S., Lynch, P., Campbell, J. R., Aghdam, M. A., Woods, R. K., Jonsson, H., Flagan, R. C., Seinfeld, J. H., and Sorooshian, A.: Contrasting cloud composition between coupled and decoupled marine boundary layer clouds, J. Geophys. Res.-Atmos., 121, 11679–11691, https://doi.org/10.1002/2016JD025695, 2016.
Warren, S., Hahn, C. J., London, J., Chervin, R. M., and Jenne, R. L.: Global distribution of total cloud cover and cloud types over land, NCAR Tech. Note NCAR/TN-273+STR, Natl. Cent. Atmos. Res., Boulder, Colorado, 29 pp. + 200 maps, 1986.
Weber, R. J., McMurry, P. H., Mauldin, L., Tanner, D. J., Eisele, F. L., Brechtel, F. J., Kreidenweis, S. M., Kok, G. L., Schillawski, R. D., and Baumgardner, D.: A study of new particle formation and growth involving biogenic and trace gas species measured during ACE 1, J. Geophys. Res.-Atmos., 103, 16385–16396, https://doi.org/10.1029/97jd02465, 1998.
Wonaschuetz, A., Sorooshian, A., Ervens, B., Chuang, P. Y., Feingold, G., Murphy, S. M., de Gouw, J., Warneke, C., and Jonsson, H. H.: Aerosol and gas re-distribution by shallow cumulus clouds: An investigation using airborne measurements, J. Geophys. Res.-Atmos., 117, D17202, https://doi.org/10.1029/2012jd018089, 2012.
Wood, R.: Stratocumulus Clouds, Mon. Weather Rev., 140, 2373–2423, https://doi.org/10.1175/Mwr-D-11-00121.1, 2012.
Yamaguchi, T., Feingold, G., Kazil, J., and McComiskey, A.: Stratocumulus to cumulus transition in the presence of elevated smoke layers, Geophys. Res. Lett., 42, 10478–10485, https://doi.org/10.1002/2015GL066544, 2015.
Youn, J. S., Crosbie, E., Maudlin, L. C., Wang, Z., and Sorooshian, A.: Dimethylamine as a major alkyl amine species in particles and cloud water: Observations in semi-arid and coastal regions, Atmos. Environ., 122, 250–258, https://doi.org/10.1016/j.atmosenv.2015.09.061, 2015.