the Creative Commons Attribution 4.0 License.
the Creative Commons Attribution 4.0 License.
 | 09 Oct 2018
Driving parameters of biogenic volatile organic compounds and consequences on new particle formation observed at an eastern Mediterranean background site
Cécile Debevec
Stéphane Sauvage
Valérie Gros
Karine Sellegri
Jean Sciare
Michael Pikridas
Iasonas Stavroulas
Thierry Leonardis
Vincent Gaudion
Laurence Depelchin
Isabelle Fronval
Roland Sarda-Esteve
Dominique Baisnée
Bernard Bonsang
Chrysanthos Savvides
Mihalis Vrekoussis
Nadine Locoge
As a part of the Chemistry-Aerosol Mediterranean Experiment (ChArMEx) and Cyprus Aerosols and Gas Precursors (ENVI-Med CyAr) programs, this study aims primarily to provide an improved understanding of the sources and the fate of volatile organic compounds (VOCs) in the eastern Mediterranean. More than 60 VOCs, including biogenic species (isoprene and eight monoterpenes) and oxygenated VOCs, were measured during a 1-month intensive field campaign performed in March 2015 at the Cyprus Atmospheric Observatory (CAO), a regional background site in Cyprus. VOC measurements were conducted using complementary online and offline techniques. Biogenic VOCs (BVOCs) were principally imputed to local sources and characterized by compound-specific daily cycles such as diurnal maximum for isoprene and nocturnal maximum for α- and β-pinenes, in connection with the variability of emission sources. The simultaneous study of pinene and isoprene temporal evolution and meteorological parameters has shown that BVOC emissions were mainly controlled by ambient temperature, precipitation and relative humidity. It was found that isoprene daytime emissions at CAO depended on temperature and solar radiation changes, whereas nocturnal BVOC concentrations (e.g., from oak and pine forests) were more prone to the relative humidity and temperature changes. Significant changes in monoterpene mixing ratios occurred during and after rainfall. The second part of the study focused on new particle formation (NPF) events at CAO. BVOCs are known to potentially play a role in the growth as well as in the early stages of formation of new atmospheric particles. Based on observations of the particle size distribution performed with a differential mobility particle sizer (DMPS) and the total number concentrations of particles larger than 1 nm diameter measured by particle size magnifier (PSM), NPF events were found on 14 out of 20 days of the field campaign. For all possible proxy parameters (meteorological parameters, calculated H2SO4 and measured gaseous compounds) having a role in NPF, we present daily variations of different classes during nucleation event and non-event days. NPF can occur at various condensational sink (CS) values and both under polluted and clean atmospheric conditions. High H2SO4 concentrations coupled with high BVOC concentrations seemed to be one of the most favorable conditions to observe NPF at CAO in March 2015. NPF event days were characterized by either (1) a predominant anthropogenic influence (high concentrations of anthropogenic source tracers observed), (2) a predominant biogenic influence (high BVOC concentrations coupled with low anthropogenic tracer concentrations), (3) a mixed influence (high BVOC concentrations coupled with high anthropogenic tracer concentrations) and (4) a marine influence (both low BVOC and anthropogenic tracer concentrations). More pronounced NPF events were identified during mixed anthropogenic–biogenic conditions compared to the pure anthropogenic or biogenic ones, for the same levels of precursors. Analysis of a specific NPF period of the mixed influence type highlighted that BVOC interactions with anthropogenic compounds enhanced nucleation formation and growth of newly formed particles. During this period, the nucleation-mode particles may be formed by the combination of high H2SO4 and isoprene amounts, under favorable meteorological conditions (high temperature and solar radiation and low relative humidity) along with low CS. During the daytime, growth of the newly formed particles, not only sulfate but also oxygen-like organic aerosol (OOA) mass contributions, increased in the particle phase. High BVOC concentrations were observed during the night following NPF events, accompanied by an increase in CS and in semi-volatile OOA contributions, suggesting further BVOC contribution to aerosol nighttime growth by condensing onto pre-existing aerosols.
- Article
(7994 KB) -
Supplement
(1470 KB) - BibTeX
- EndNote


The Mediterranean atmosphere is affected adversely by particulate and gaseous pollution. Consequently, aerosol and/or ozone mixing ratios are usually more elevated in the Mediterranean region than in the majority of the continental European regions, chiefly during summer (Doche et al., 2014; Menut et al., 2015; Nabat et al., 2013; Safieddine et al., 2014). The Mediterranean is also regarded as a notorious climate change “hot spot” and which is predicted to undergo significant warming and drying in the 21st century (Giorgi, 2006; Kopf, 2010; Lelieveld et al., 2014). This may have strong implications on natural and anthropogenic emissions and their fate in the atmosphere with unpredictable impacts. Indeed, air composition, concentration levels and trends in the Mediterranean region still remain arduous to evaluate mainly due to limited in situ observation datasets. Supplementary information on the air chemical composition, including the speciation and the reactivity of volatile organic compounds (VOCs), at representative regional background sites will further enhance our actual comprehension of the intricacy of the Mediterranean atmosphere. Given this background, the Chemistry-Aerosol Mediterranean Experiment (ChArMEx; http://charmex.lsce.ipsl.fr, last access: 21 March 2018) (Dulac, 2014) international project of the Mediterranean Integrated STudies at Regional And Local Scales (MISTRALS; http://mistrals-home.org, last access: 21 March 2018) multidisciplinary regional research program proposes developing and coordinating regional research actions for a scientific evaluation of the present and future state of the atmospheric environment in the Mediterranean basin, and of its incidences on the regional climate, air quality and marine biogeochemistry.
Within the framework of ChArMEx and Cyprus Aerosols and Gas Precursors (ENVI-Med CyAr) programs, an intensive field campaign was carried out during a 1-month period (March 2015) at the Cyprus Atmospheric Observatory (CAO; http://www.cyi.ac.cy/index.php/cao.html, last access: 21 March 2018) to provide insights of the origins and fates of VOCs and aerosols in the eastern Mediterranean, focusing on extensive high-time-resolution in situ measurements performed at a representative receptor site. An important database combining gaseous and particulate observations was collected, including over 60 VOCs determined by various online and offline techniques. The resulting dataset has been presented in detail in Debevec et al. (2017). In that work, a positive matrix factorization (PMF) analysis along with a concentration field (CF) analysis have been performed on a database containing 20 VOCs in order to better identify and characterize covariation factors of VOCs. This study has highlighted aged or local primary emissions together with secondary photochemical transformations taking place during the transport of air masses. As presented in the latter study, and due to the background regional pattern of the measurement site, concentration levels of anthropogenic species were low (e.g., average mixing ratio of 299 and 114 ppt for ethylene and benzene, respectively), whereas significant levels of primary biogenic compounds emitted locally were observed. Oxygenated VOCs (OVOCs) were found to largely dominate the VOC budget, and they were mainly explained by biogenic sources (64 %), according to Debevec et al. (2017). Thus, due to their significant contribution to the VOC budget in this environment, it is essential to characterize the biogenic emissions and better evaluate their impact on the eastern Mediterranean.
Isoprene, terpenes (monoterpenes, sesquiterpenes) and OVOCs (alcohols, carbonyl compounds and organic acids) are the most common biogenic VOCs (BVOCs) reported in publications (e.g., Bouvier-Brown et al., 2009; Llusia et al., 2012; Seco et al., 2011). Isoprene and monoterpenes are of major importance due to their significant emission rates in the atmosphere (Guenther et al., 2006; Helmig et al., 2013; Peñuelas and Staudt, 2010). BVOC emissions can be initiated or altered by a large number of factors such as both biotic and abiotic stress (Laothawornkitkul et al., 2009; Loreto and Schnitzler, 2010; Niinemets et al., 2004; Possell and Loreto, 2013) controlling the emissions of BVOCs to the atmosphere. In the atmosphere, (B)VOCs undergo fast reactions with hydroxyl radicals (OH), nitrate radicals (NO3) and ozone (O3) and can generate a variety of oxidized products, such as carbonyls, organic acids and alcohols, thus playing a significant role in the oxidative capacity of the atmosphere (Fuentes et al., 2000; Gelencsér et al., 2007; Helmig et al., 2006; Kanakidou et al., 2005). Undergoing multi-generational oxidation processes, reactions of BVOCs in the atmosphere lead to rising functionalized products with sufficiently low volatility (Aumont et al., 2012; Jimenez et al., 2009; Kroll and Seinfeld, 2008) to be involved in the formation of secondary organic aerosols (SOAs) (Fuzzi et al., 2006; Kanakidou et al., 2005).
New particle formation (NPF) is a process traducing the secondary formation of atmospheric particles (Dal Maso et al., 2005). Although NPF is a global phenomenon observed in many different environments (Kulmala et al., 2004; Kulmala and Kerminen, 2008), strong uncertainties on the processes governing NPF still remain. Until recently, it was considered that NPF could not occur without the involvement of sulfuric acid (H2SO4) in the nucleation step as well as for the growth of newly formed particles (Kulmala et al., 2013; Sipilä et al., 2010). However, it is now recognized that typical daytime H2SO4 concentrations are too low for sulfuric acid and water alone to account for the NPF rates observed in the lower atmosphere (Boy et al., 2003; Kirkby et al., 2011). A ternary compound is required to stabilize H2SO4 clusters, such as ammonia (NH3) and amines, although the latter are probably not sufficient for reaching the observed NPF rates (Almeida et al., 2013; Kirkby et al., 2011; Kürten et al., 2016). In the area of the eastern Mediterranean, seasonal variation of nucleation frequency has been explained by Pikridas et al. (2012) in function of the availability of gas-phase NH3 transferred to the particulate phase to neutralize the aerosol population. Additionally, it is well established that oxidation products of VOCs are important for particle growth (Riipinen et al., 2011; Sellegri et al., 2005b) and it has been recently shown that VOCs probably play a major role in the nucleation step, especially BVOCs and their oxidation products (Riccobono et al., 2014; Schobesberger et al., 2013; Zhao et al., 2013). There have been mixed reports regarding the role of VOCs in NPF. Some studies have shown that high isoprene concentrations can inhibit biogenic NPF by scavenging OH radicals (Kanawade et al., 2011; Kiendler-Scharr et al., 2009). However, Zhang et al. (2004) reported that the interaction between VOCs and H2SO4 can promote efficient formation of organic aerosols. Moreover, chamber experiments highlighted ion-induced nucleation of pure biogenic particles (mostly α-pinene) which is believed to dominate nucleation in pristine environments where the condensational sink (CS) levels are low and scavenging of these compounds on pre-existing particles is limited (Kirkby et al., 2016).
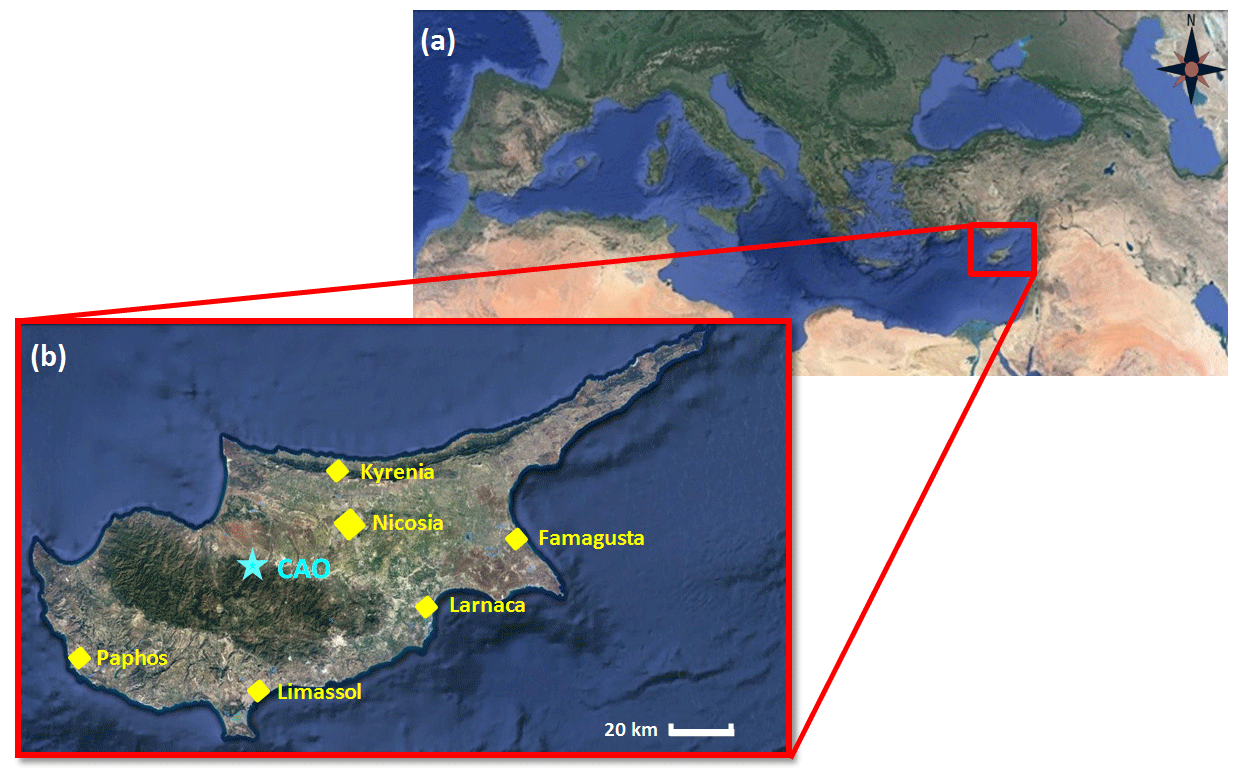
Figure 1Maps of Cyprus and Mediterranean region. (a) Position of Cyprus in the Mediterranean region. (b) The sampling site and major Cypriot agglomerations are displayed as a blue star and yellow diamonds, respectively.
Therefore, in order to understand the role of BVOCs in atmospheric chemistry, it is important to study their emission drivers and atmospheric abundance and to characterize their atmospheric oxidation. This paper will address these objectives and is organized as follows: first, Sect. 2 is dedicated to the sampling site description together with the different online/offline analytical techniques. In Sect. 3.1, we examine primary BVOC concentrations and their temporal variations. In Sect. 3.2, temporal variations of the main monoterpenes and isoprene are compared with meteorological parameters to determine the dominant factors controlling BVOC emissions. Then, OVOC concentrations and their biogenic origins are discussed in Sect. 3.3. Finally, we investigate NPF observed at CAO in Sect. 3.4 with a focus on the role of BVOCs.
Table 1Technical details of the setup for VOC measurement during the intensive field campaign from 1 to 29 March 2015.
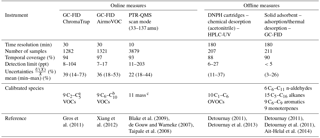
a Ethane, ethylene, propene, propane, i-butane, n-butane, acetylene, i-pentane and n-pentane. b 2-Methylpentane, benzene, toluene, ethylbenzene, m,p-xylenes, o-xylene, α-pinene and β-pinene. c m33 (methanol), m42 (acetonitrile), m45 (acetaldehyde), m59 (acetone), m69 (isoprene), m71 (methyl vinyl ketone plus methacrolein – MVK + MACR – and eventually isoprene hydroxy hydroperoxide (ISOPOOH)), m73 (methyl ethyl ketone; MEK), m79 (benzene), m93 (toluene), m107 (xylenes + C7-species) and m137 (monoterpenes).
2.1 Sampling site
Cyprus is an island located on the eastern part of the Mediterranean Sea, 110 km south of the Turkish coast, approximately 250 km west of Lebanon and Syria and 780 km east of Crete (Greece). This island covers an area of 9250 km2 and includes 648 km of coastline. The major agglomerations of the island are Nicosia, Limassol, Larnaca, Paphos, Famagusta and Kyrenia (321 816; 176 600; 84 591; 61 986; 50 265 and 33 207 inhabitants, respectively; census 2011; Fig. 1). Air masses circulating over Cyprus are restrained by two mountain ranges, the Troodos Mountains and the Kyrenia Mountains (located in the central and the northern parts of Cyprus, respectively).
As a part of two French research programs, ChArMEx and ENVI-Med CyAr, an intensive field campaign has been conducted at a regional background site of Cyprus (CAO; 35.03∘ N, 33.05∘ E; 532 m above sea level (a.s.l.); Sciare, 2016) from 1 to 29 March 2015. CAO is a regional background station from the Global Atmosphere Watch (GAW) and is operating under the European Research Infrastructure for the observation of Aerosol, Clouds, and Trace gases (ACTRIS; http://actris2.nilu.no/, last access: 21 March 2018). The station is cooperated by the Department of Labour Inspection (DLI) within the network of the European Monitoring and Evaluation Programme (EMEP). Consequently, criteria established by the EMEP, GAW and ACTRIS networks insure a high quality assurance for the atmospheric measurements performed at CAO. The station is located in the central area of the island about 20 km from the western coast and more than 35 km off the main Cypriot agglomerations, with limited influences of anthropogenic emissions from these cities. CAO is situated at the top of a hill (premises of the Cyprus Department of Forests) with no major local pollution sources (few car circulations during weekdays). The measurement site is encompassed by widespread vegetation such as “maquis”, shrubland characteristic of Mediterranean areas, and close to oak and pine forests covering the Troodos mountain range (Fall, 2012), that are known as high emitters of BVOCs (Owen et al., 2001).
2.2 Experimental setup
2.2.1 VOC measurements
Non-methane hydrocarbons (NMHCs) and OVOCs were measured employing complemental online and offline techniques described in the following. The inlets were about 3 m above ground level (a.g.l.). Table 1 resumes the characteristics of the methods carried out during the campaign and indicates a list of the monitored VOCs.
Online VOC measurements
At a time resolution of 30 min, 20 VOCs, including C2 to C10 anthropogenic VOCs and C10 BVOCs, were measured using two automated gas chromatographs (GCs, Chromatotec, Saint-Antoine, France) fitted out with a flame ionization detector (FID). A detailed description of both instruments (ChromaTrap and AirmoVOC), along with the sampling setup, technical information (pre-concentration, desorption–heating times, type of traps, column types) and the calibration procedure were given in Debevec et al. (2017). Very satisfactory detection limits (as 3σ of the baseline) were found with values below 104 and 17 ppt for ChromaTrap and for AirmoVOC, respectively. Relative uncertainties of VOCs measured with the ChromaTrap analyzer typically ranged from 14 % (ethane) to 73 % (propene) and from 18 % (benzene) to 53 % (o-xylene) for VOCs measured with the AirmoVOC (Debevec et al., 2017). Note that the two GCs were deployed at CAO from January 2015 to February 2016, allowing for direct comparisons of BVOC levels recorded in March 2015 to summertime values.
Additional VOCs were measured at a time resolution of 10 min using an online high-sensitivity proton transfer reaction – quadrupole mass spectrometer (PTR-QMS, Ionicon Analytik GmbH, Innsbruck, Austria; Lindinger et al., 1998), which allowed the detection of protonated OVOCs (alcohols, aldehydes, ketones and carboxylic acids), aromatics (sum of C8 and C9) and BVOCs (e.g., isoprene and the sum of monoterpenes). This instrument has been extensively described in recent reviews (Blake et al., 2009 and references therein) and a description of the analytical setting implemented here and calibration procedure were given in Debevec et al. (2017). The detection limit of the 16 protonated compounds typically ranged from 11 to 203 ppt, and relative uncertainty was evaluated between 18 % and 44 % (Debevec et al., 2017). Note that nighttime isoprene concentrations discussed in Sect. 3.1 and 3.2 could be due to other compound fragments such as 2-methyl-3-buten-2-ol (MBO).
Offline VOC measurements
Additionally, more than 400 offline 3 h integrated air samples were collected on sorbent cartridges – multi-sorbent and DNPH (2,4-dinitrophenylhydrazine) cartridges – using an automatic clean room sampling system (ACROSS, TERA Environment, Crolles, France). C1–C16 organic compounds were sampled for 3 h via a 0.635 cm diameter 4 m length PFA line and then trapped into one of the two types of cartridges: a multi-sorbent cartridge composed of carbopack C (200 mg) and carbopack B (200 mg) (carbotrap 202, Perkin-Elmer, Wellesley, Massachusetts, USA) and a Sep-Pak DNPH-Silica cartridge (Waters Corporation, Milford, Massachusetts, USA). These techniques are described in Detournay et al. (2011), and their setup in the field is further presented in Detournay et al. (2013) and Ait-Helal et al. (2014). Briefly, 39 C5–C16 NMHCs, including alkanes, alkenes, aromatics and nine BVOCs, along with six C6–C11 n-aldehydes, were sampled at a flow rate of 200 mL min−1 on the multi-sorbent cartridges that were preliminarily conditioned during 24 h with purified air at 350 ∘C and 10 mL min−1 flow rate, using a RTA oven (French acronym for “régénérateur d'adsorbant thermique” – TERA Environment, Crolles, France). A total of 10 additional C1–C8 carbonyl compounds were sampled in parallel with the DNPH cartridges at a flow rate of 1.5 L min−1. During the sampling, different ozone scrubbers have been used in order to avoid any possible ozonolysis of the monitored compounds: a MnO2 ozone scrubber was employed for the multi-sorbent cartridges, while a KI ozone scrubber was installed upstream of the DNPH cartridges. In addition, stainless-steel particle filters of 2 µm diameter porosity (Swagelok) were used to prevent any sampling of particles. Samples were later analyzed in the laboratory by GC-FID (with TurboMatrix 650 ATD, Perkin-Elmer, Wellesley, USA; for the multi-sorbent cartridges) or high-performance liquid chromatography coupling with ultra violet detection (HPLC-UV; for the DNPH cartridges). The reproducibility of the analysis was checked regularly by the analysis of a standard, leading to the plotting of a control chart for each compound, which allowed the reproducibility of each instrument to be checked. The detection limit of the VOCs measured with offline techniques was typically below 5 ppt for the multi-sorbent cartridges and ranged from 6 to 27 ppt for the DNPH cartridges. Relative uncertainty was evaluated between 3 % and 26 % for the multi-sorbent cartridges and between 11 % and 37 % for the DNPH cartridges (Ait-Helal et al., 2014).
VOC intercomparison
α-Pinene and β-pinene measured by both online GC-FID and offline techniques were selected to cross-check the quality of the results recorded during the campaign. Online measurements were additionally averaged on a 3 h timescale to allow direct comparison with offline measurements and reported in Fig. S1 in the Supplement. α-Pinene showed a better determination coefficient than β-pinene (r2 of 0.69 and 0.47 for α-pinene and β-pinene, respectively) and a slope closer to 1 (1.08 for α-pinene and 0.67 for β-pinene). The results from α-pinene and β-pinene investigated in this paper were taken from the GC-FID measurements due to a higher time resolution and a better analytical performance of AirmoVOC. Additionally, the sum of eight monoterpenes collected by multi-sorbent cartridges was also used in comparison to the non-speciated monoterpenes measured by PTR-MS (Fig. S1), yielding to similar variability and consistent ranges of concentrations (r2: 0.73; slope: 0.79).
Concerning OVOCs, acetaldehyde, acetone and methyl ethyl ketone (MEK) were monitored by both PTR-MS and an offline technique. According to Fig. S2, these OVOCs showed good determination coefficients (r2 of 0.81, 0.90 and 0.84 for acetaldehyde, acetone and MEK, respectively) with slopes close to 1 for each compound (1.16, 0.87 and 1.04 for acetaldehyde, acetone and MEK, respectively) and relatively low intercepts (77 ppt for acetaldehyde, 86 ppt for acetone and 9 ppt for MEK). Acetaldehyde, acetone and MEK measurements presented in the following are those which resulted from PTR-MS by reason of a finer time resolution.
As a consequence, recovery of the different techniques, frequent quality checks and an uncertainty determination approach have allowed us to assure a satisfying robustness of the dataset, and cross-check comparisons have shown comparable results for the different techniques used (within the range of uncertainties).
2.2.2 Ancillary gas measurements
A large set of real-time atmospheric measurements was performed by the DLI at the CAO, in order to characterize trace gases (NO, NO2, O3, CO and SO2). These latter are presented in more detail by Kleanthous et al. (2014). The time resolution was 5 min for each analyzer. The results examined in this study are the hourly averages.
2.2.3 Aerosol measurements
Particle size distribution measurements were performed using a setup of a custom-made differential mobility particle sizer (DMPS, TSI Inc., model 3080; Villani et al., 2008) completed by a particle size magnifier (PSM, Airmodus, model A09; Vanhanen et al., 2011). The DMPS consists of a bipolar charger to charge the aerosol particle population to the equilibrium charge distribution, a 28 cm differential mobility analyzer (DMA) in a closed sheath-air loop and a condensation particle counter (CPC, TSI Inc., model 3010). This instrument was operated to measure the aerosol size distribution over 20–200 nm diameter size range from 8 to 11 March and over the 10–250 nm size range from 12 to 27 March, with a time resolution of 460 s. NDPMS was used in this paper to refer to total number concentrations of particles obtained by integrating the DMPS measurements. Total number concentrations of particles larger than 1 nm diameter (NPSM) were measured with a PSM using diethylene glycol (DEG) as the working fluid at a fluid flow rate of 1 standard liter per minute. A PSM can grow particles as small as 1 nm to larger than 90 nm, after which a CPC is used to count the grown particles. Considering its time resolution (1 s), PSM data were filtered from local pollution spikes due to the local anthropogenic activity on the CAO site (between 07:00 and 17:00 LT during weekdays). Finally, the particle cluster and sub-10 nm particle (between 1 and 10 nm) concentrations were calculated as the difference between the total particle concentration derived from the DMPS and the PSM concentrations (NPSM–NDPMS).
The charged cluster size distributions were recorded with a neutral cluster and air ion spectrometer (NAIS). This spectrometer is a modified version of the AIS instrument (Airel Ltd, Mirme et al., 2007; Mirme and Mirme, 2013) which is an instrument capable of measuring mobility distributions of sub-3 nm charged aerosol particles and clusters. Controlled charging, together with the electrostatic filtering, enables it to additionally measure the neutral aerosol particles' distribution. The measurement principle of the NAIS is based on two independent spectrometer columns, one of each polarity, where the ions are classified by a DMA. More details are given in Manninen et al. (2011). The mobility range is 3.2–0.0013 cm2 V−1 s−1, corresponding to particle Milikan diameter between 0.5 and 50 nm.
The chemical composition of non-refractory submicron aerosol (NR-PM1) has been continuously monitored by deploying a quadrupole aerosol chemical speciation monitor (Q-ACSM, Aerodyne Research Inc., Billerica, Massachusetts, USA), which has been fully characterized by Ng et al. (2011). This instrument shares the same general structure with the aerosol mass spectrometer (AMS) except that it has been specifically intended for long-term monitoring purposes. The Q-ACSM instrument was operating continuously with 30 min time resolution during the whole duration of the campaign totaling 1292 valid data points (corresponding to a time recovery of 95 %). The ACSM dataset was validated by comparison with co-located PM1 chemical composition results obtained by integrated daily (24 h) time resolution filter-based measurements. Instrument settings, field operation, calibration and data processing are those reported in Petit et al. (2015).
Black carbon (BC) was calculated using the 880 nm channel of a seven-wavelength (370, 470, 520, 590, 660, 880 and 950 nm) aethalometer (AE31 model, Magee Scientific Corporation, Berkeley, CA, USA) with a time resolution of 5 min. Presuming difference in the absorption Ångström exponent between fossil fuel and biomass-burning-derived aerosol, the BC originating from these two sources was apportioned following the method described by Sandradewi et al. (2008).
2.2.4 Meteorological measurements and assimilated data
Meteorological parameters (temperature, pressure, relative humidity, wind speed, wind direction and radiation) were monitored every 5 min using a weather station (Campbell Scientific Europe, Antony, France) located on the rooftop of the CAO building, at approximately 5 m a.g.l. Additionally, planetary boundary layer (PBL) assimilated data were generated by the European Centre for Medium-Range Weather Forecasts (ECMWF) ERA-Interim global atmospheric reanalysis at the location corresponding to the Troodos station (34.92∘ N, 32.88∘ E; ∼ 20 km west of the CAO station). The ERA-Interim model, setup and dataset are detailed in Sect. S1 in the Supplement. Even if these assimilated PBL data were not provided for the CAO station but for the Troodos one, they were only used in this study to qualitatively investigate PBL height effect on BVOC concentration levels and variations.
Classification of air mass origins has been based on the analysis of the retroplumes computed by the FLEXible PARTicle (FLEXPART) Lagrangian model (Stohl et al., 2005) considering CAO as the receptor site. The FLEXPART model simulates trajectories of user-defined ensembles of particles released from three-dimensional boxes. The classification was based on hourly resolution model simulations going back in time to 5 days, taking into account only the lowest 100 m a.g.l. (footprint plots), even if the 3 km was modeled. These backward retroplumes were classified within eight source regions, similar to Kleanthous et al. (2014), identified by a custom-made algorithm combined with visual inspection. The source region map is depicted in Fig. 2 based on the residence time of particles over each source region. During March 2015, the CAO station was mostly under the influence of continental air masses originating from southwest Asia (cluster 7 – 31 %), northwest Asia (cluster 4 – 28 %), west of Turkey (cluster 5 – 10 %) and Europe (cluster 3 – 11 %) together with by marine air masses (cluster 2 – 14 %). Note that air masses categorized as “local” (cluster 0) occurred only on 23 and 24 March, and may rather be considered as a transitory state between periods of air masses originating from northwest Asia and west of Turkey. It is worth noting that March 2015 was characterized by an unusually high contribution of southwest Asian air masses in the detriment of European air masses compared to the period 1997–2012 investigated in Kleanthous et al. (2014).
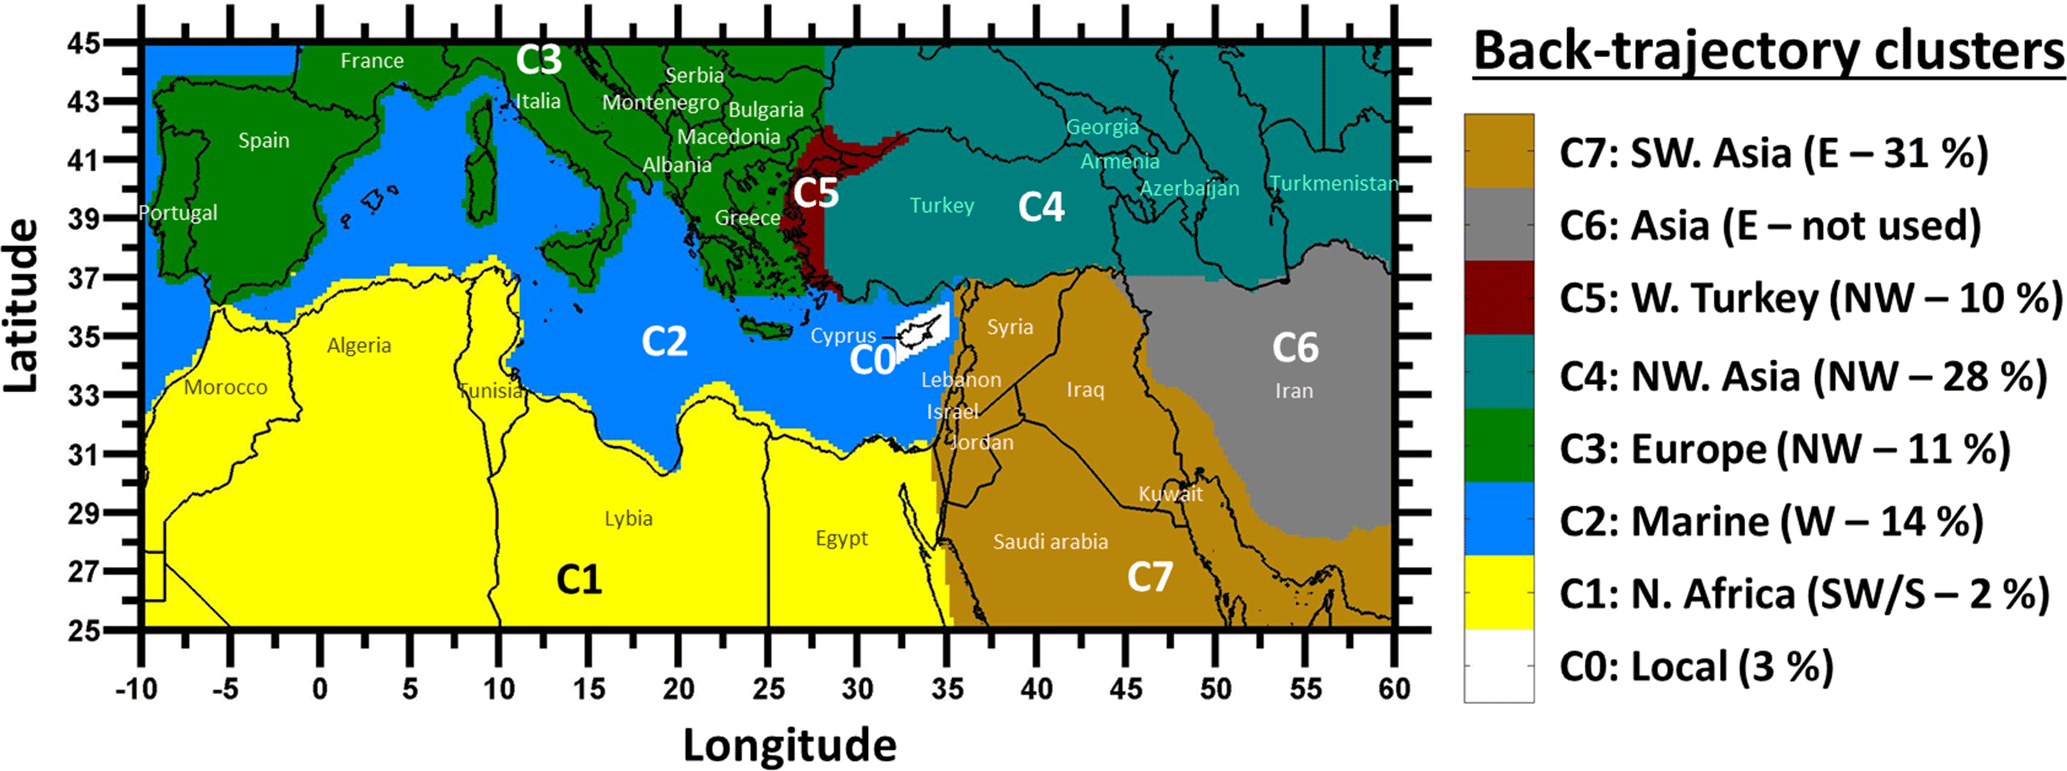
Figure 2Classification of air masses which impacted the site during the intensive field campaign of March 2015 and their relative contribution. A fraction of 2 % (not shown here) is attributed to air masses of mixed origins.
2.3 Identification and contribution of major sources of VOCs
A source apportionment using positive matrix factorization (PMF) was conducted in Debevec et al. (2017) to better determine covariance factors of VOCs representative of aged or local primary emissions as well as secondary photochemical transformations taking place during the air mass transport. The US EPA PMF v. 5.0 was applied to the 30 min time resolution March 2015 dataset composed of 20 VOCs (including OVOCs measured online) and a total of 1179 atmospheric data points. As results from this PMF study will be partly used in this study, a short description of the corresponding results is given here.
The best PMF solution allowed the deconvolution of measured VOCs into six distinct factors. Factors imputed to biogenic sources 1 and 2 (relative contribution of 43 % to the total mass of VOCs), driven by pinene and isoprene/OVOC emissions, respectively, have shown contrasted diurnal profiles (nighttime vs. daily maxima) and were assigned as originating from different types of emitting vegetation (oak and pine forests vs. garrigues). Factors imputed to anthropogenic sources (short-lived combustion source, evaporative sources, industrial and evaporative sources, 21 % altogether) were characterized by compounds of various lifetimes and were identified either of local or regional origins. The last factor (36 %) was characterized by long-lived primary anthropogenic VOCs and OVOCs and covaried with CO, supporting its identification as continental regional background. Chemical profile, variability and origin of these factors are discussed with more details in Debevec et al. (2017).
2.4 Evaluation of properties for new particle formation events
2.4.1 Particle formation and growth rates calculations
The most relevant variables for identifying NPF events are the formation rate (Ji, expressed in cm−3 s−1) at a given diameter (i, in nm) and the growth rate (GR, in nm h−1), which is defined as the diameter rate of change due to particle population growth. The growth rate between two size classes was calculated considering the method defined by Hirsikko et al. (2005) which is based on the time corresponding to the maximum concentration in each size class of the selected size range by fitting a normal distribution to the size class concentration.
Formation rates were especially evaluated for the very first steps of the formation process, i.e., between 1 and 3 nm (Kontkanen et al., 2017). As previously mentioned, the PSM was measuring in a total mode during the studied period, which did not allow any growth and nucleation rate calculation at such diameters. The total particle formation rate was thus calculated at 3 nm (J3) from the total particle concentration measured in the size range 2–4 nm by the NAIS (N2−4), by using the growth rate in the size range 1.5–3 nm (GR1.5−3, in nm h−1), and the loss of particles by coagulation scavenging of 3 nm particles on larger pre-existing particles (CoagS3, in s−1) both derived also from the NAIS measurements. The growth rate of the corresponding size range is then obtained by a linear least square fit through the time values previously found. The total particle formation rate at 3 nm was finally calculated according to Eq. (1), from Kulmala et al. (2012):
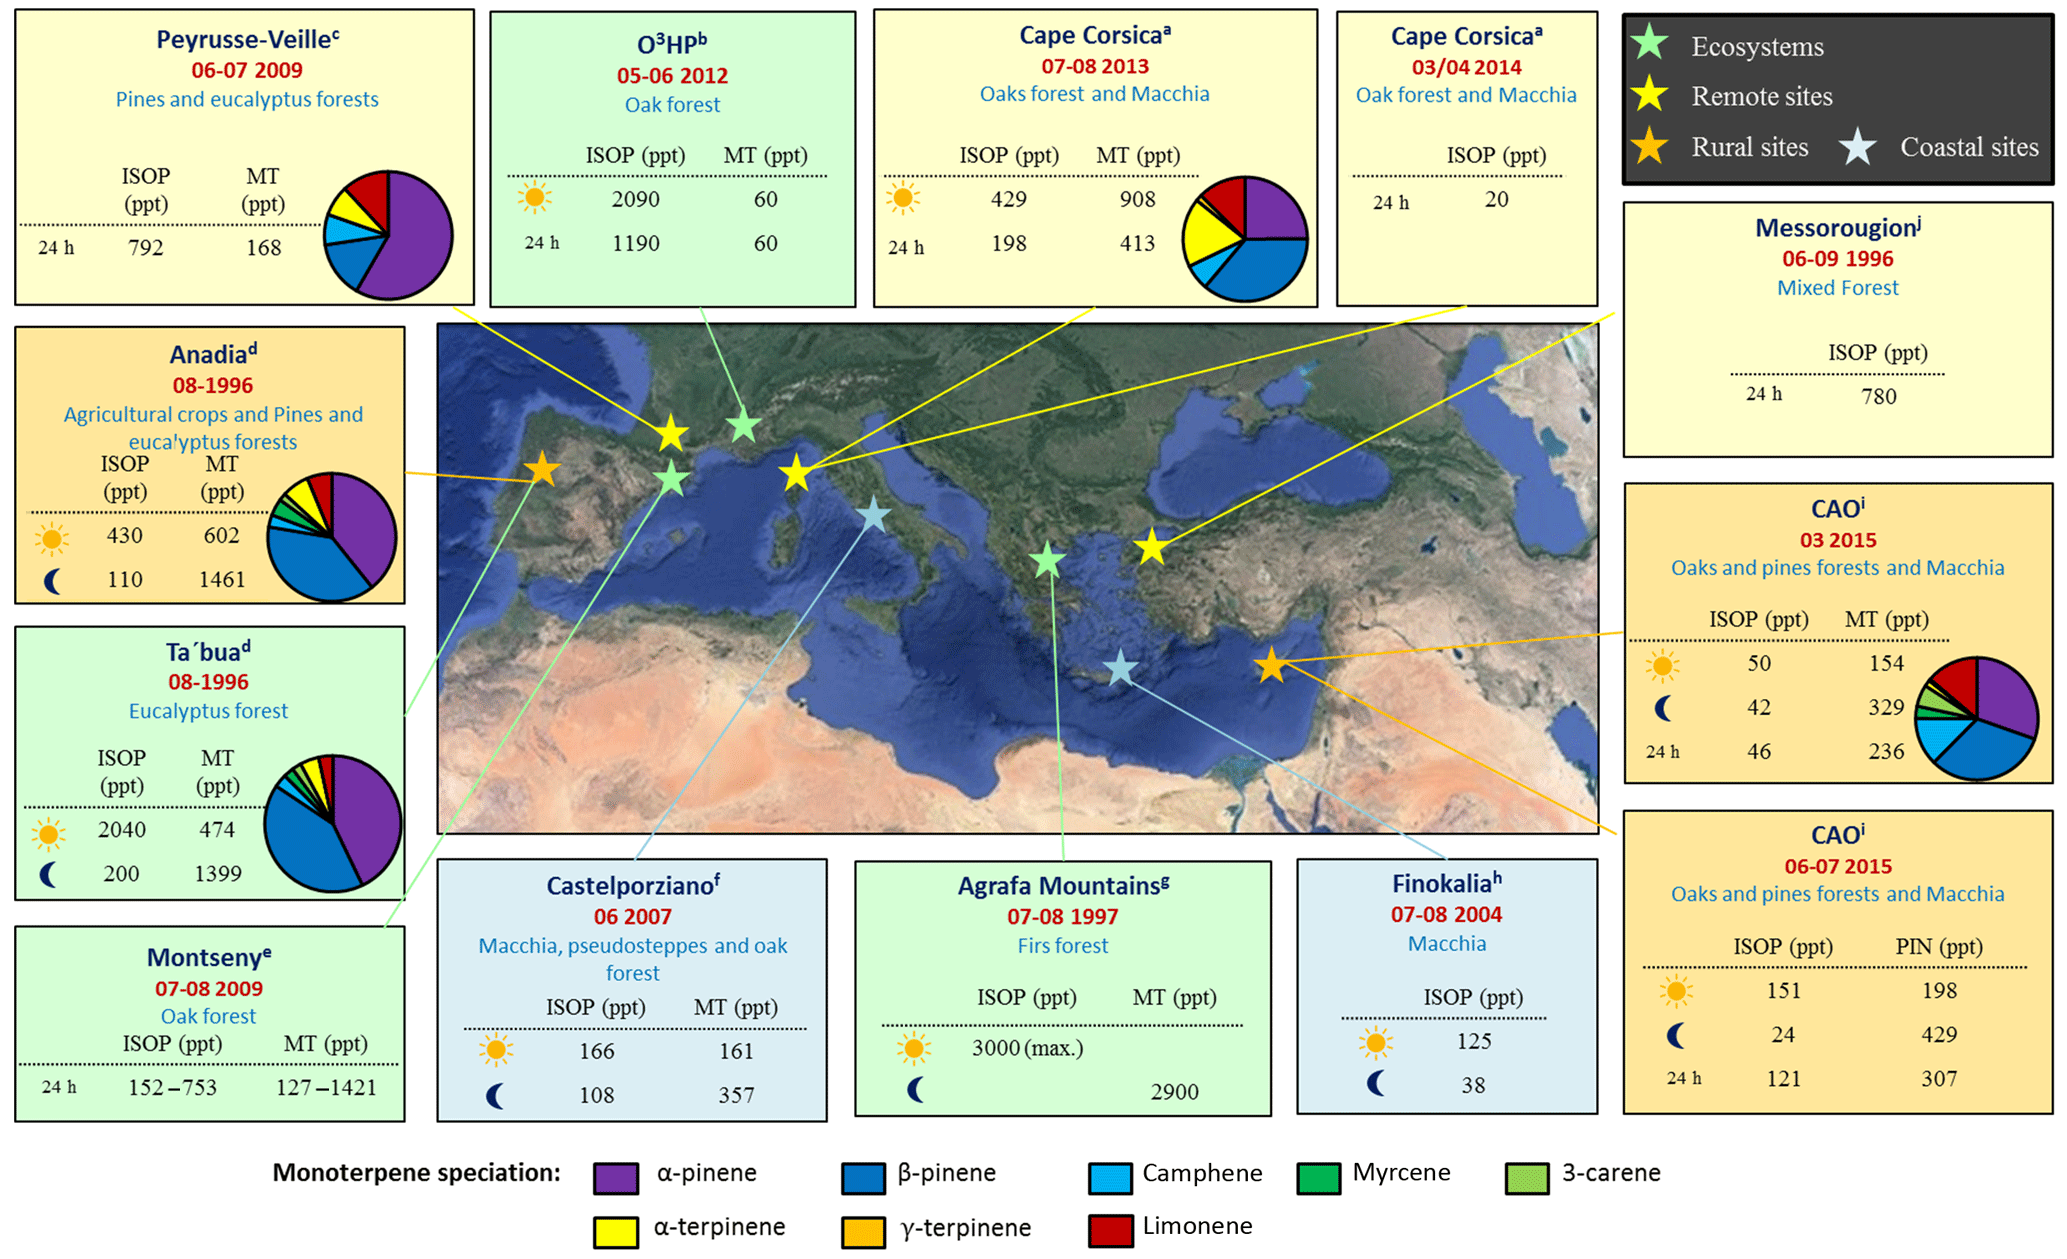
Figure 3Comparison of mean concentrations (in ppt) and speciation (in %) of primary BVOCs with the ones observed in the literature in the Mediterranean region with different vegetation types. ISOP, MT and PIN are abbreviations, respectively, referring to isoprene, monoterpenes and pinenes. a Michoud et al. (2017), Kalogridis (2014), ChArMEx database. b Kalogridis et al. (2014). c Detournay et al. (2013). d Cerqueira et al. (2003). e Seco et al. (2011). f Davison et al. (2009). g Harrison et al. (2001). h Liakakou et al. (2007). i This study. j Moschonas and Glavas (2000).
2.4.2 Condensation sink
CS denotes the ability of the particle size distribution to remove condensable vapor from the atmosphere and hence describes the loss rate of the condensable vapors onto the pre-existing particles (Pirjola et al., 1999). This variable is proportional to the surface area density of an aerosol particle and has been calculated based on size distribution measured with DMPS as proposed by Kulmala et al. (2001).
2.4.3 Sulfuric acid
SO2 produces ambient H2SO4, which is currently thought to be the most likely nucleation precursor candidate as well as contribute to the growth of newly formed particles (Kulmala et al., 2013; Sipilä et al., 2010). To study the connection between NPF and H2SO4, an empirical proxy for H2SO4 concentration was calculated from the SO2 concentration according to Eq. (2), adapted from Mikkonen et al. (2011) which is based on previous work by Petäjä et al. (2009):
where GlobRad is the global radiation in W m−2, [SO2] is the sulfur dioxide concentration in molec cm−3, CS is the condensation sink in s−1, and RH is the relative humidity. The coefficients used in Eq. (2) were calculated from sulfuric acid measured with a CIMS instrument (Sellegri et al., 2016). This proxy was constructed for radiation higher than 10 W m−2 but the predictive ability is significantly raised for radiation exceeding 50 W m−2 (Rose et al., 2015).

Figure 4Diel variation of isoprene and monoterpenes, represented by hourly box plots (in green colors) in comparison to mean diel variation of meteorological parameters (solar radiation, temperature displayed as red lines and orange boxes, respectively). This figure includes all BVOC measurement days with a PTR-MS (i.e., from 1 to 29 March 2015). The white markers represent the mean value, blue solid lines represent the median values, and the green boxes show the interquartile range (IQR). The bottom and the top of box depict the first and the third quartiles (i.e., Q1 and Q3). The ends of the whiskers correspond to the first and the ninth deciles (i.e., D1 and D9). Time is given in local time (UTC+2 h).
3.1 General overview of ambient BVOC levels
3.1.1 Ambient concentration levels
Nine BVOCs, namely α-/β-pinenes, α-/γ-terpinenes, limonene, myrcene, camphene, 3-carene and isoprene, have been detected and quantified at the CAO, and their mean levels during March 2015 are presented in Fig. 3. Statistical analysis, uncertainties and detection limits of the BVOC measurements are presented in Table S1 in the Supplement. The average concentration of the sum of terpenoids during March 2015 was 282±307 ppt. Among BVOCs monitored during the intensive field campaign, the most abundant were monoterpenes. The average concentration of monoterpenes during the intensive field campaign was 236±294 ppt with a maximum up to 4500 ppt (recorded during the night of 10 March). Monoterpenes exhibited high daily amplitude, with a mean mixing ratio of 154 ppt during the daylight hours against 329 ppt during the nighttime hours (Fig. 3). Higher concentrations of monoterpenes (estimated by the concentrations of the sum of α-pinene and β-pinene) were observed during the summertime (307 ppt on average; Fig. 3) but maximum concentrations were at the same order of magnitude (e.g., a peak up to 3600 ppt was recorded during the night of 31 July – not shown here). The dominant monoterpenes observed during the field campaign were β-pinene (61±142 ppt) and α-pinene (58±131 ppt), followed by limonene (27 ppt), camphene (25 ppt), Δ3-carene (11 ppt), myrcene (6 ppt), α-terpinene (3 ppt) and γ-terpinene (below 1 ppt). α-Pinene and β-pinene accounted together for 62 % of the total monoterpene concentration. Average concentration of isoprene was quite low (46 ppt) in March 2015 but it was higher by a factor of 3 in the summertime (Fig. 3) due to higher temperatures. As a matter of fact, isoprene, α-pinene and β-pinene are the major BVOCs emitted by the Mediterranean vegetation (Owen et al., 2001). In addition to their high emission rates by vegetation, they are the least reactive isoprenoids with OH radicals and ozone (Atkinson and Arey, 2003) and therefore tend to accumulate (for short periods) in the atmosphere. Other more reactive compounds, such as α-terpinene and limonene, are removed very quickly following their emission, thus exhibiting lower concentrations in the atmosphere.
An overview of BVOC concentrations at different background locations in the Mediterranean is depicted in Fig. 3. As for CAO, Cape Corsica and Finokalia are representative remote sites with Mediterranean shrublands, and primary BVOC concentrations recorded at these sites have similar seasonal behaviors and concentration levels. Speciated monoterpenes measured at remote/rural Mediterranean sites were predominantly composed of α-pinene and β-pinene with a higher proportion of camphene and 3-carene observed only at CAO. Contrarily, α-terpinene was observed in higher proportion during the summer field campaign performed at Cape Corsica.
3.1.2 Temporal variability and sources
As shown in Fig. 4, the diurnal variations of isoprene and monoterpenes present opposite diurnal evolution. Daily amplitude is of 317 ppt on average for monoterpenes, with a decrease during daytime hours, a significant increase after sunset (17:00–18:00 LT), high concentrations throughout the night and decrease after sunrise (06:00 LT). The monoterpene average diurnal patterns indicated that their emissions were solely dependent on temperature (Geron et al., 2000a and references therein) and lower, but still significant, emissions occurred throughout the night. A similar pattern with nighttime maxima has been observed at other locations in the Mediterranean (e.g., in Portugal by Cerqueira et al., 2003; in France by Detournay et al., 2013; in Italy by Kalabokas et al., 1997 and Davison et al., 2009; and in Greece by Harrison et al., 2001) and was assigned to nocturnal emissions of monoterpenes stored in the understory vegetation (Niinemets et al., 2004; Schurgers et al., 2009). These nighttime maxima are enhanced by the low removal processes (i.e., low oxidizing species concentrations) and the shallow nocturnal boundary layer which concentrate close to ground level the monoterpenes emitted by vegetation. Furthermore, the prevalent nocturnal winds at CAO (originating from the southwestern to southeastern sectors) may have also contributed to these nighttime maxima with air masses enriched with biogenic emissions from the forests located in the Troodos Mountains (Debevec et al., 2017; Galvin, 2014). The major vegetation types covering these mountains are pine forests, composed of Calabrian pines (Pinus brutia – from foothills to the high mountains up to 1200 m) and black pines (Pinus nigra – on the highest peaks at altitudes from 1400 to 1951 m); and oak forests, mostly composed of golden oaks (Quercus alnifolia – found with Pinus brutia or in inland maquis between an altitude of about 800 and 1500 m) and Kermes oaks (Quercus coccifera – up to 1400 m elevation) (Fall, 2012 and references therein). These coniferous species are considered as very strong emitters of monoterpenes (Aydin et al., 2014a, b). More specifically, oaks are usually classified as predominantly isoprene emitters (Helmig et al., 2013), whereas Quercus coccifera are considered as significant emitters of α-pinene and β-pinene in Owen et al. (2001). A considerable fraction of the monoterpene emission from pines originates from large storage structures (Niinemets et al., 2004) and, as such, they continue to emit at a higher relative level during the nighttime compared to oaks as long as nocturnal temperatures remain sufficiently high (Laothawornkitkul et al., 2009; Owen et al., 1997).
With daily amplitude of isoprene of 43 ppt on average, the observed isoprene pattern followed an usual diel profile controlled by temperature and solar radiation (Geron et al., 2000b; Owen et al., 1997). As depicted in Fig. 4, isoprene concentrations started to increase immediately at sunrise (06:00 LT), indicative of local biogenic emissions. However, isoprene concentrations did not decrease immediately at sunset (17:00–18:00 LT) but remained rather constant at the beginning of the night (considering the upper end of the whiskers and mean values of hourly box plots depicted in Fig. 4) and followed a slow decrease until reaching a minima (03:00 LT). Isoprene levels showed their minimum levels during the night, although levels up to 200 ppt could be noticed during the night of 10 March and coincided with the highest concentrations of monoterpenes recorded during the field campaign. This finding suggests that air masses were enriched with biogenic emissions, the main contributors of monoterpenes, which were also partially isoprene emitters as reported previously (Detournay et al., 2013). This finding is also in agreement with the source apportionment reported in Debevec et al. (2017). Two VOC biogenic sources were identified; they were both composed of different primary biogenic species (pinenes and isoprene for factor 1 and factor 2, respectively) and showed distinct temporal variabilities and geographic origins supporting the division of BVOC sources into two factors. Biogenic factor 1, driven by pinene emissions, also explained a small proportion of isoprene (15 %; Debevec et al., 2017). Nonetheless, the contribution of MBO to the isoprene signal of PTR-QMS m∕z 69 cannot be discarded (Karl et al., 2012; Kim et al., 2010). Isoprene usually dominates over most other BVOCs in many places and these interferences are often shown to be minor (Karl et al., 2004; Misztal et al., 2011; Warneke et al., 2010). However, measurements, particularly in coniferous ecosystems, can be of greater analytical challenge due to the concomitant emission of isoprene and MBO (Kim et al., 2010; Schade and Goldstein, 2001). The emissions of MBO could require light as isoprene (Harley et al., 1998) or could be mainly temperature dependent (Hellén et al., 2018; Tarvainen et al., 2005). Isoprene and/or MBO that were emitted during the late afternoon could not be fully oxidized photochemically, as OH concentrations begin to fall, and could remain in the nighttime atmosphere.
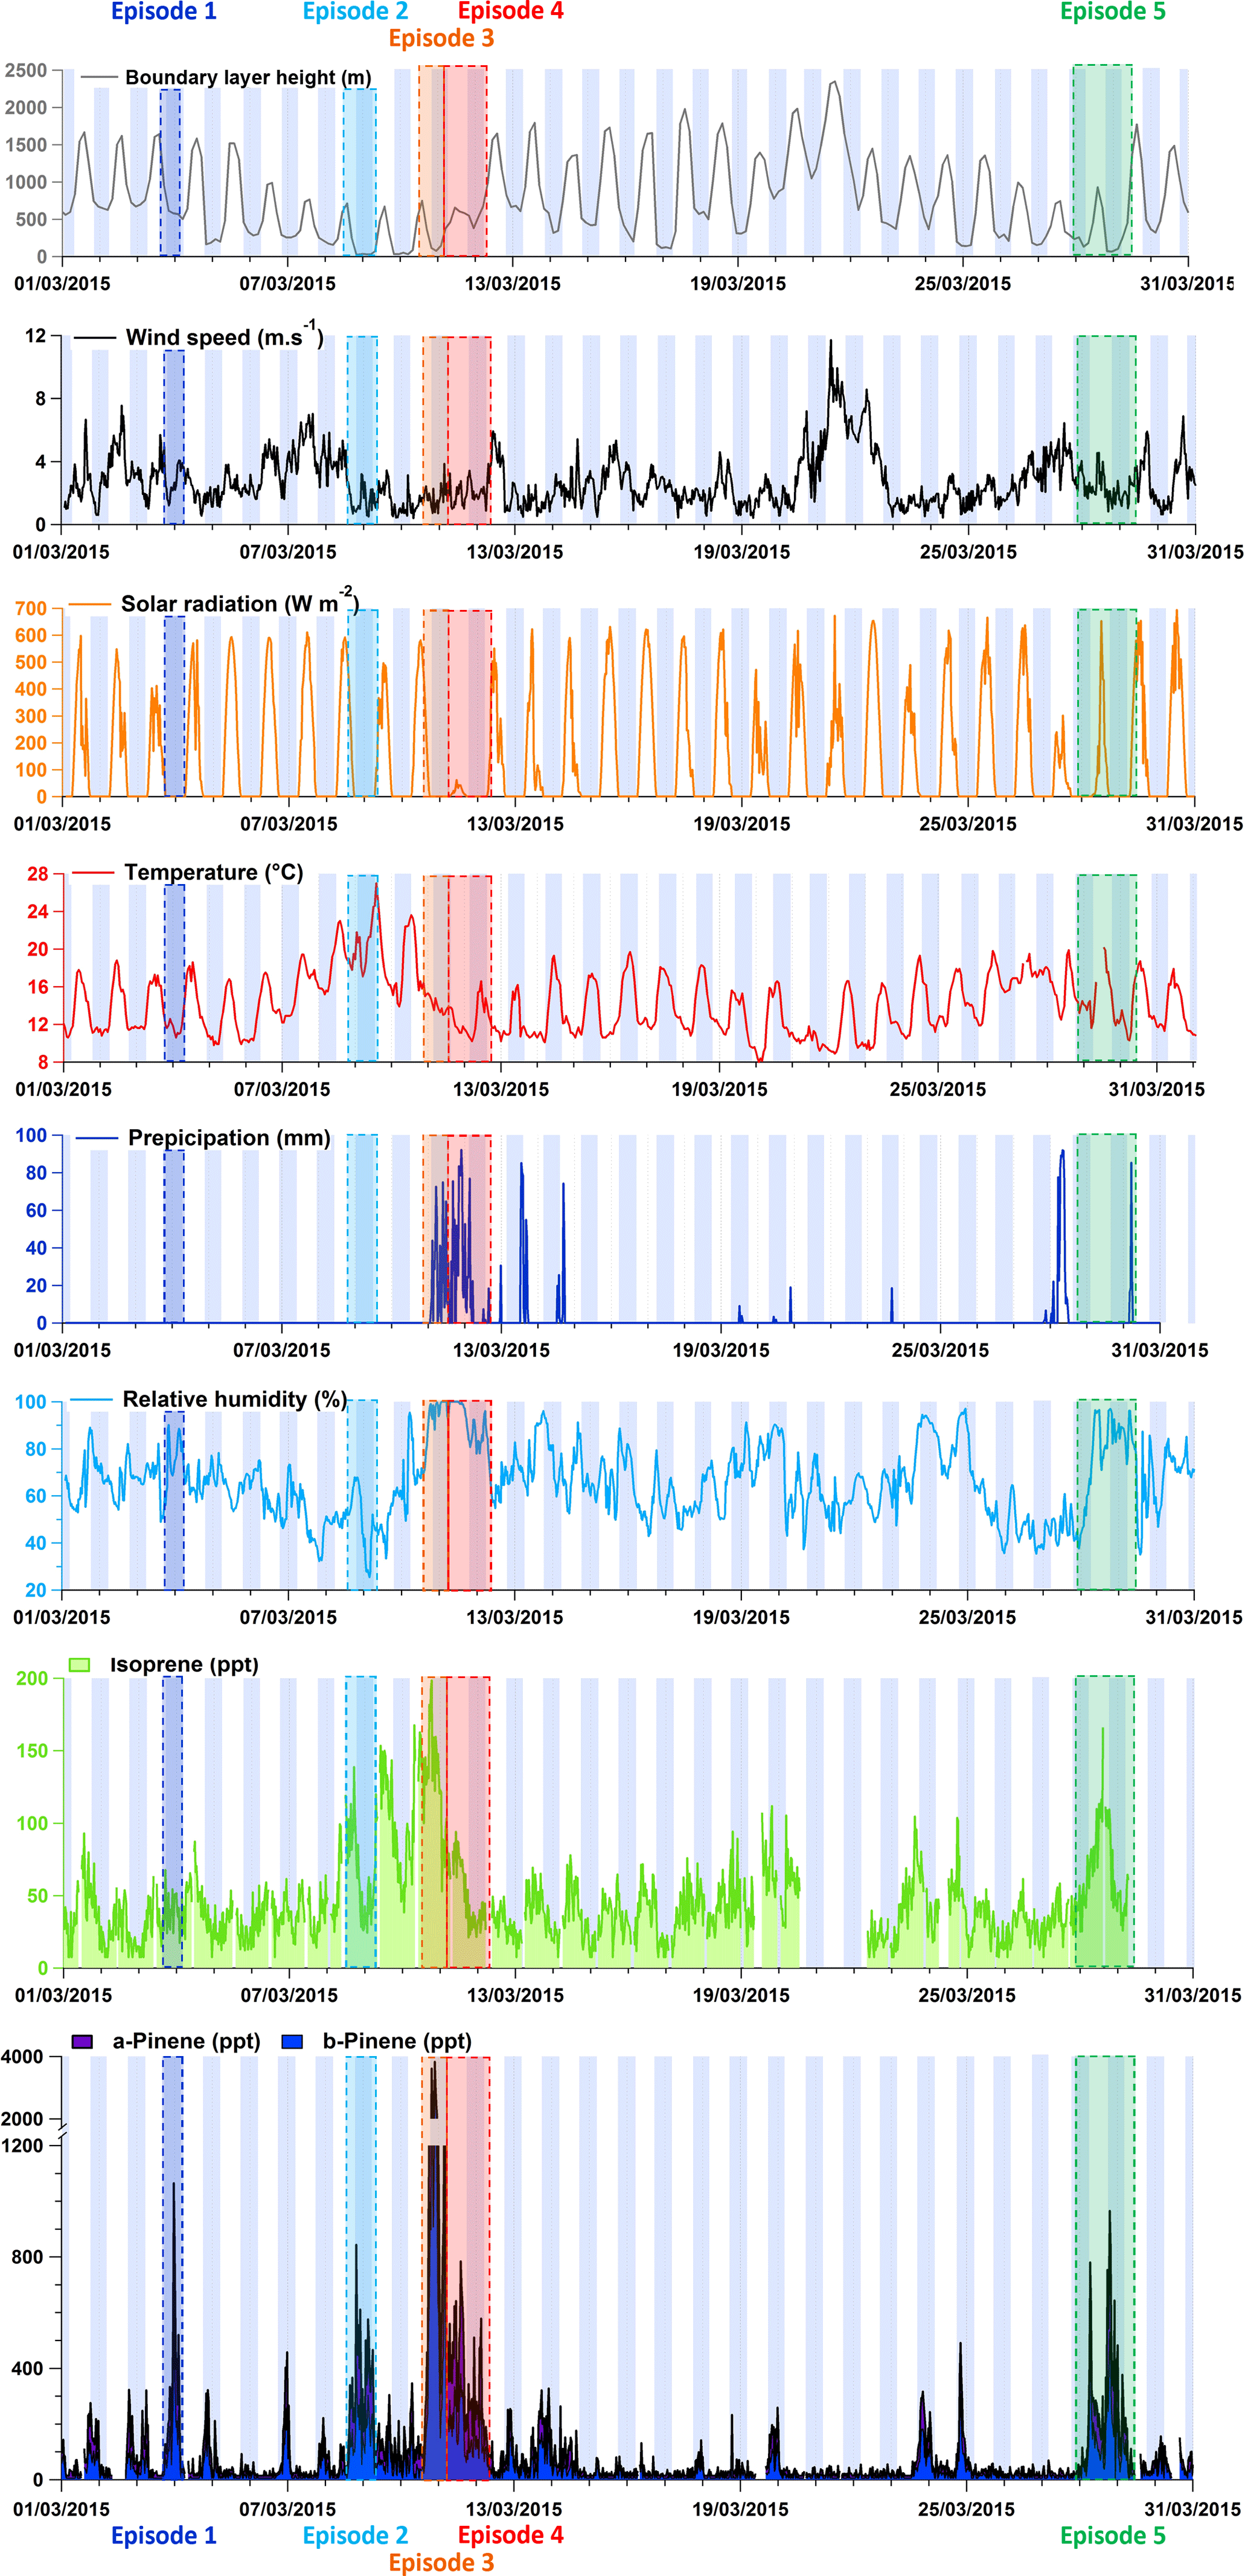
Figure 5Time series of isoprene and a selection of monoterpenes (α-pinene and β-pinene) in comparison to time series of meteorological parameters (boundary layer height, wind speed, solar radiation, temperature, precipitation and relative humidity). Blue rectangles correspond to nighttime periods. BVOC episodes 1 to 5 referred to specific BVOC variations discussed in Sect. 3.2. Note that PBL assimilated data were generated by the ECMWF ERA-Interim global atmospheric reanalysis at the location corresponding to the Troodos station (34.92∘ N, 32.88∘ E; ∼20 km west of the CAO station).
3.2 Factors controlling BVOC concentrations
In this section, time variations of main monoterpenes and isoprene are examined along with meteorological parameters in order to determine the dominant factors controlling BVOC concentrations. Five episodes are highlighted for that purpose in Fig. 5 and correspond to periods when elevated mixing ratios of pinenes (higher than 500 ppt) were observed. Pinene variations during moderate events (i.e., episodes 1, 2, 4 and 5 in Fig. 5) will be discussed in order to finally understand why such elevated mixing ratios of monoterpenes were observed during the night of 10 March (episode 3 in Fig. 5).
Firstly, diurnal variability of BVOC concentrations seems to be driven by vertical mixing. Low pinene concentrations were measured during the day when PBL heights were the highest, that could be due to efficient sink reactions with OH radicals and dilution by vertical transport. The highest pinene concentrations during the night correspond to lowest mixing. The biogenic compounds emitted during the night were probably trapped in a nocturnal inversion layer, and their concentrations built up until they were diluted in the morning by mixing. The effect of PBL height on monoterpene concentrations was observed in other studies, such as ones dedicated to SMEAR II results (measurements conducted to a boreal forest site in southern Finland; Hakola et al., 2012, 2000; Hellén et al., 2018; Sellegri et al., 2005a). Contrarily, isoprene concentrations were higher during the day compared to nocturnal ones, suggesting that the diurnal variability of its concentrations was not influenced by vertical mixing. Beside the daily variability of the PBL, its height range along the month may influence the BVOC concentration levels. Pinene episodes 2–5 occurred following days when daily maxima PBL heights were the lowest observed of the intensive field campaign, suggesting less dilution of the emitted compounds. However, PBL height effect on pinene concentrations was not systematically observed. For instance, higher pinene concentrations (up to 1100 ppt) were observed during episode 1 (i.e., 3 March) compared to pinene levels recorded on the days before and after episode 1, while daily maximal PBL heights were of the same range from 1 to 5 March. The day before episode 5 (i.e., 27 March) was characterized by a daily maximal PBL height as low as episode 2–5 ones, even if no significantly high pinene concentrations were observed. Furthermore, the highest isoprene daily concentrations of the month (i.e., 8–10 and 28 March) were observed during days characterized by low PBL heights. Again, PBL height effect on isoprene concentrations seems to be not systematic.
In addition to vertical mixing, wind transport could also influence BVOC concentrations. Wind speeds are generally higher during daylight hours compared to nighttime values in March 2015, inducing more dispersion of BVOC emissions during the day. The five episodes occurred under calm, low wind conditions, which could promote the accumulation of BVOCs in the atmosphere. Contrarily, from 21 to 23 March, wind speeds were up to 12 m s−1 and no significantly high pinene concentrations were observed during these days. Furthermore, the highest isoprene daily concentrations of the month (i.e., 8–10 and 28 March) were observed during days characterized by quite low wind speeds. However, wind speed effect on BVOC concentrations seems to be not systematic.
Isoprene and monoterpene emissions are known to be controlled by ambient temperature (Guenther et al., 2000). Consistently, high isoprene concentrations were noticed during the warmest days of the campaign (8–10 March) with a maximum temperature of 26 ∘C. A closer look at episode 2 (i.e., 8 March) shows that pinene concentrations were spiked up to 800 ppt, a value which is much higher than those observed during the previous night. As expected, pinene emissions were enhanced by an increase in ambient temperatures since maximum temperature recorded during episode 2 was 6 ∘C higher than the one of the previous day. This dependency on temperature is consistent with the previous discussion related to monoterpene daily variations.
At CAO, significant changes in monoterpene mixing ratios appeared to occur during and after periods of rainfall. This phenomenon was observed during episode 4 (i.e., 11 March) when high levels of pinenes (up to 800 ppt) were observed during daytime rainfall but also after this episode, although temperatures during episode 4 (i.e., 12–13 ∘C) were among the lowest of the month. A rainy period was also noticed on the morning of episode 5 (i.e., 28 March) and corresponded again to a pinene peak of 800 ppt. Pinene concentrations during the following night were a factor of 3 higher compared to mixing ratios at similar temperature and relative humidity (e.g., 24 March). These results suggest that rainfall has induced a stress factor onto the vegetation and therefore may have caused short-term increases in the release of monoterpenes from the vegetation. This assumption is backed by results from plant enclosure experiments (Lamb et al., 1985) as well as several field measurements (Bouvier-Brown et al., 2009; Davison et al., 2009; Helmig, 1999; Schade et al., 1999). Additionally, rainy periods are also usually characterized by low OH concentrations which could promote the accumulation of BVOCs in the atmosphere. Furthermore, the stimulation of pinene emissions by rainfall seemed to be responsible for the significant monoterpene concentrations observed during the daytime. The influence of precipitation on isoprene emissions was not clearly identified here.
Monoterpene emissions at CAO could be more strongly dependent on humidity than temperature under dry conditions. Higher pinene concentrations (up to 1100 ppt) were observed during event 1 (i.e., 3 March) compared to pinene levels recorded on the days before and after episode 1. An increase in relative humidity of 20 % seemed to be sufficient to induce higher pinene concentrations of a factor 3 compared to mixing ratios observed on 2 and 4 March at similar temperatures (maximal temperatures of 16–17 ∘C) but lower relative humidity. Additionally, pinene concentrations during episode 1 were slightly higher than those of episode 2, while temperature and relative humidity were significantly different these days. Indeed, temperatures of episode 1 were lower than temperatures of episode 2 (maximal temperature of 16 and 22 ∘C for episode 1 and episode 2, respectively) which would seem to be compensated by higher relative humidity during episode 1 compared to ones of episode 2 (up to 90 % and 65 % for episode 1 and episode 2, respectively). Humidity has also been found to increase monoterpene emission rates (Janson, 1992, 1993; Lamb et al., 1985; Schade et al., 1999). These studies pointed out that monoterpene emission rates correlated with relative humidity because wet needle surfaces emit greater absolute amounts and different relative amounts of terpenes than dry needles. Additionally, lower boundary layer heights are generally observed on non-sunny days compared to sunny days ones, this would enhancing monoterpene maxima by the shallow nocturnal boundary layer. Nocturnal concentrations of isoprene (and/or MBO and other compound fragments) would seem to usually occur at a high relative humidity.
Looking finally at episode 3, ambient mixing ratios of pinenes and isoprene were the highest ones observed during the intensive field campaign and episode 3 is among the warmest and most humid periods of the campaign. Pinene concentrations during episode 3 were a factor 4 higher compared to concentrations observed during episodes 1 and 2. Nocturnal fog could be an assumption as reported by Janson (1993), who noticed high monoterpene emission rates during the nighttime when a radiation fog developed in an experiment chamber, inducing high relative humidity (>90 %).
As a summary, BVOC concentration levels and variations could be explained by sources, sinks, vertical mixing along with horizontal transport. BVOC emissions have shown to be controlled by ambient temperature, precipitation and relative humidity. More specifically, significant increases in monoterpene mixing ratios occurred during and after rainy periods and the stimulation of pinene emissions by rainfall seemed to be responsible for additional emissions of monoterpenes during the daytime. High relative humidity seemed to promote high BVOC concentrations originating from the nocturnal biogenic source (i.e., oaks and pines forests).
3.3 OVOC sources
In addition to isoprene and monoterpenes, several OVOCs can be emitted by plants. Six OVOCs have been detected and quantified at CAO by online instrumentation. With an average concentration of 4703±2224 ppt, these six OVOCs represented a high fraction of the total concentration of VOCs measured in March 2015 (Debevec et al., 2017). Statistical analysis, uncertainties and detection limits of the OVOC measurements are presented in Table S1. The dominant OVOCs observed during the field campaign were those with the higher lifetimes, i.e., methanol (2765±1452 ppt, 12 days – Debevec et al., 2017) and acetone (1083±335 ppt, 68 days), followed by acetaldehyde (431 ppt, 19 h), MEK (210 ppt, 9 days) and methyl vinyl ketone plus methacrolein (MVK + MACR) (30 ppt – 10–14 h). Offline instrumentation also provided formaldehyde with an average concentration of 986 ppt (29 h).
OVOCs can be either emitted from primary sources (mainly biogenic) or be produced by secondary sources related to the oxidation of anthropogenic and biogenic VOCs, making it more complicated to assess their origins. From the 6 PMF factors reported in Debevec et al. (2017), the measured OVOCs by the online technique were distributed among their different sources (Fig. 6). More than 80 % of the respective total mass of methanol, acetaldehyde and MVK + MACR was explained by biogenic sources, especially by factor 2 driven by isoprene emissions. Acetone and MEK were mainly attributed to local biogenic sources and to more distant sources. However, the PMF analysis did not allow to distinctly deconvolute primary sources from secondary ones. On the other hand, even if isoprene and its first oxidation products (MVK + MACR) were both included in factor 2, a delay of about 1 h in the peak values could be observed between isoprene and its first oxidation products (Fig. S3) making it possible to separate primary from secondary contributions of factor 2.

Figure 6PMF factor contributions to the measured concentration of selected OVOCs. PMF analysis is presented in Debevec et al. (2017).
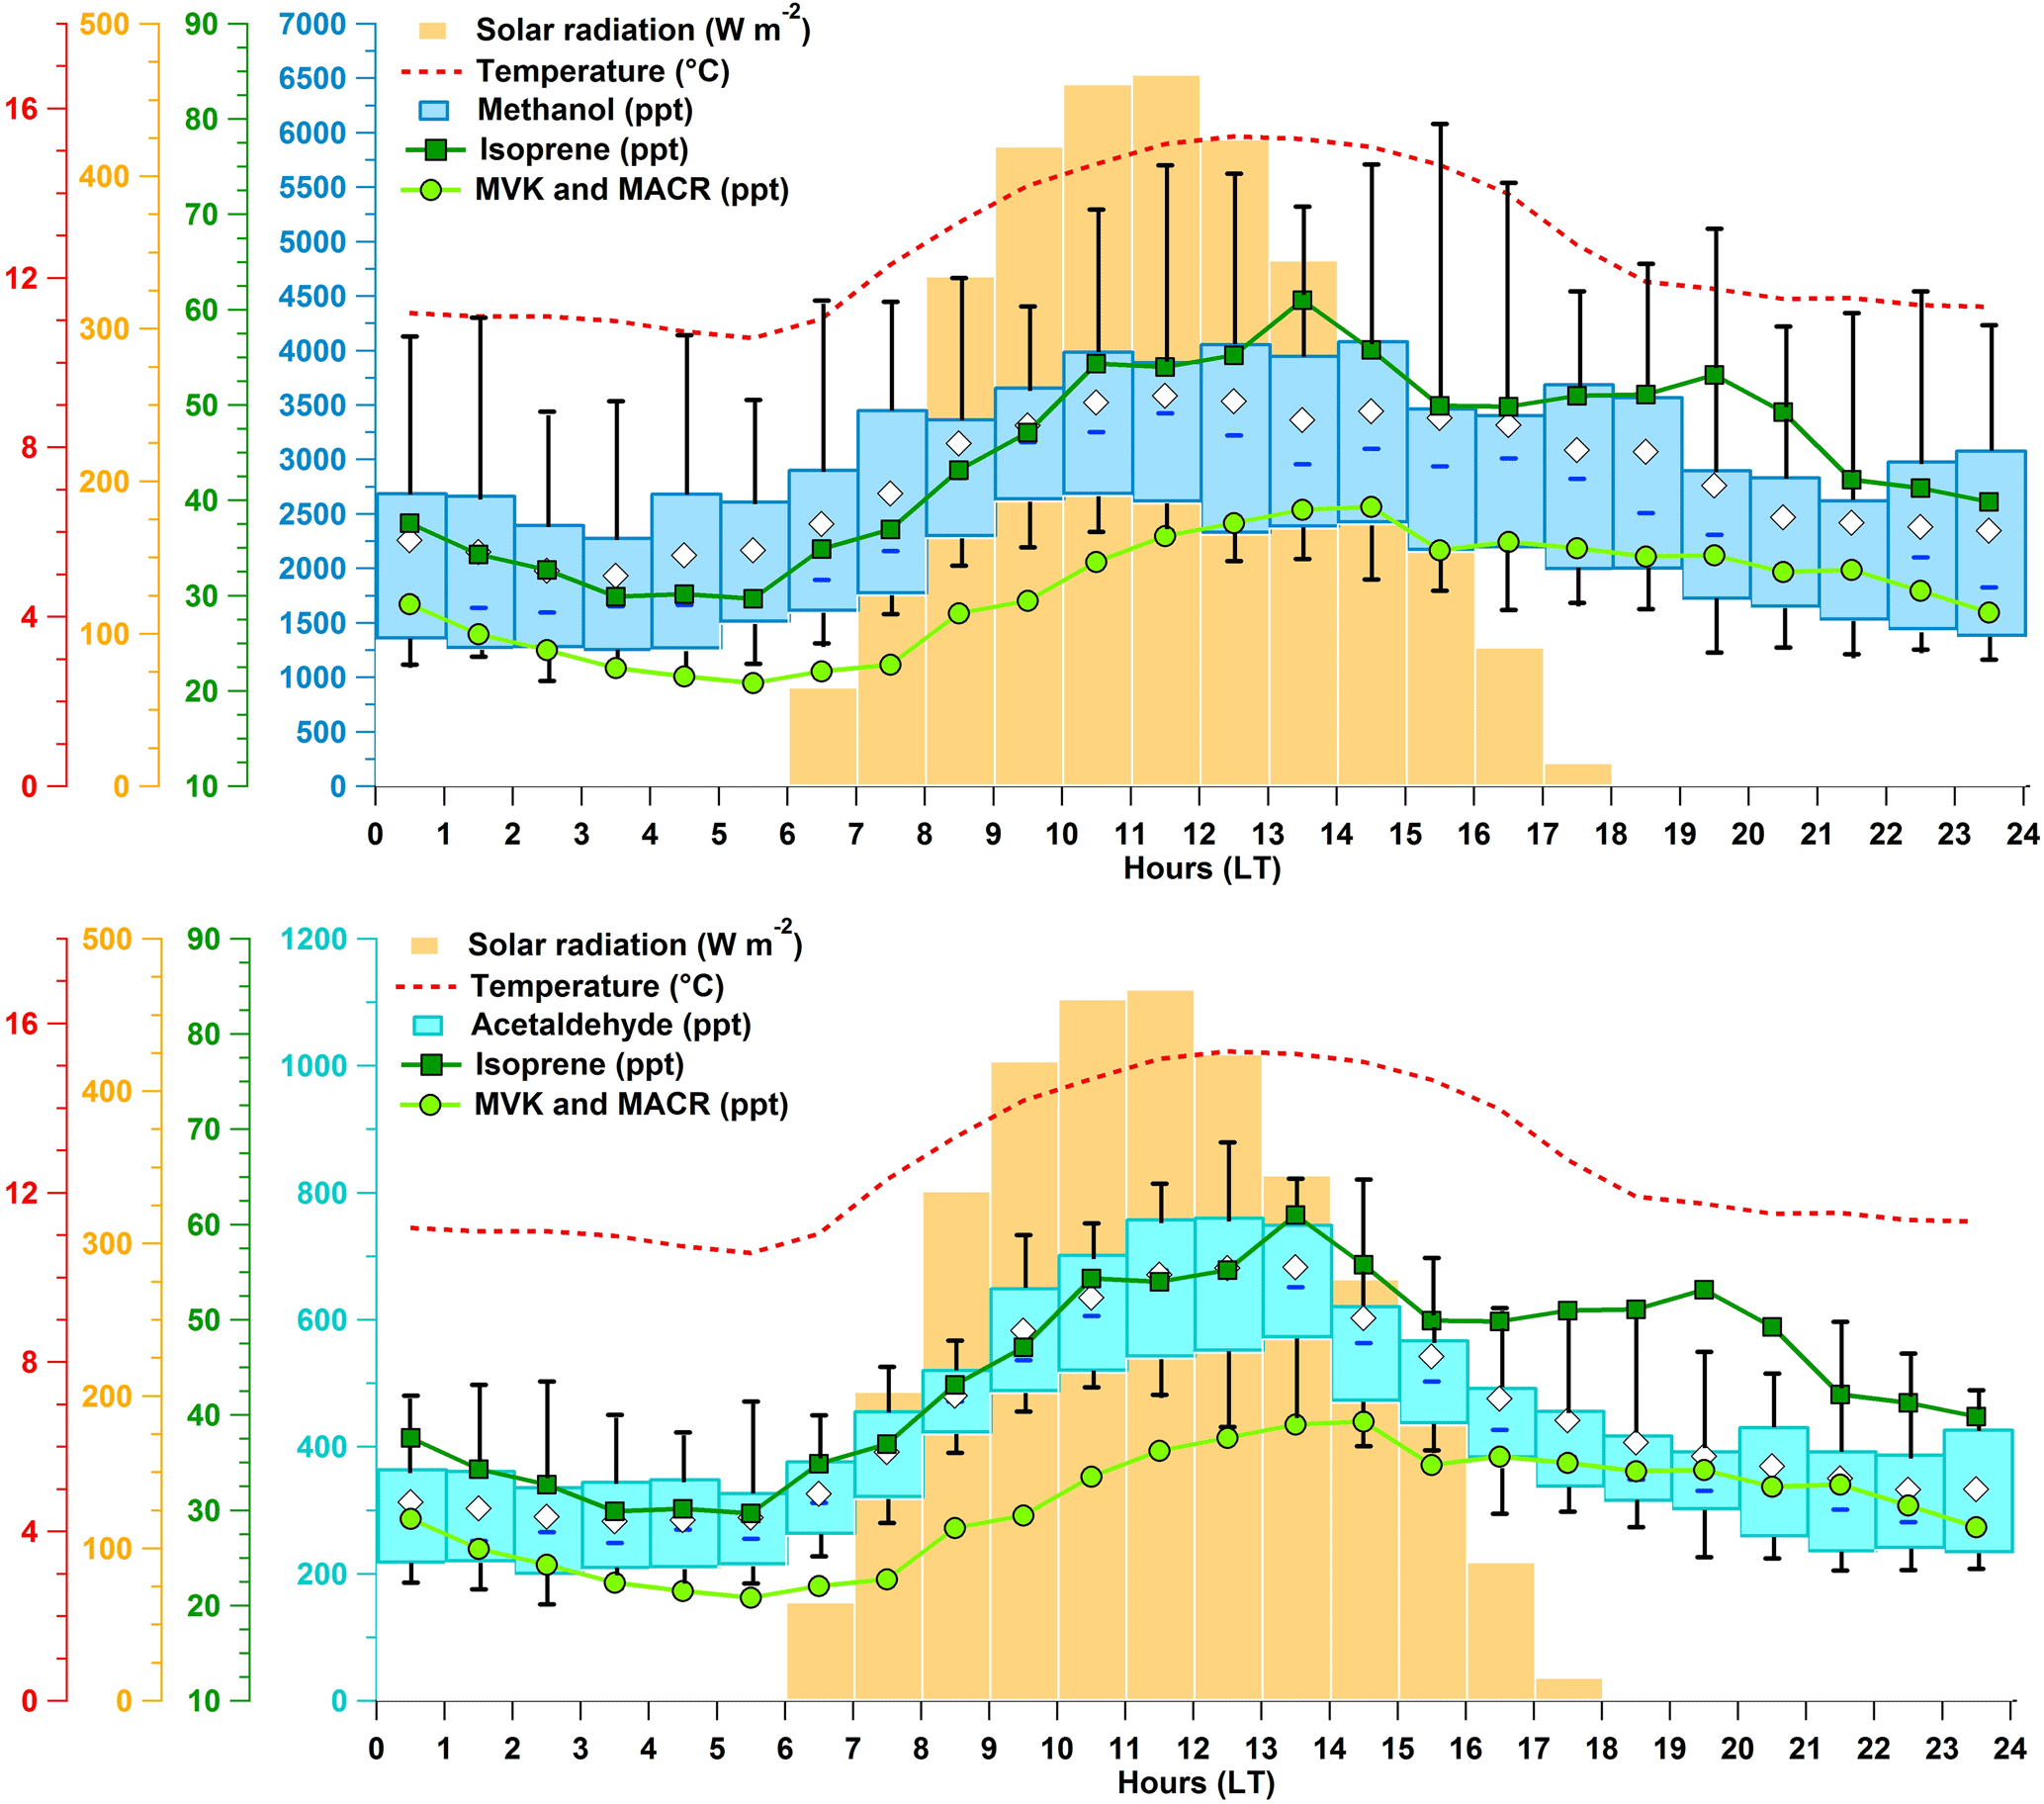
Figure 7Diel variation of methanol and acetaldehyde, represented by hourly box plots (in blue colors) in comparison to mean diel variation of meteorological parameters (solar radiation, temperature displayed as red lines and orange boxes, respectively) and isoprene and its oxidation products (in green colors). This figure includes all measurements days with a PTR-MS (i.e., from 1 to 29 March 2015). The white markers represent the mean value, blue solid lines represent the median values, and the green boxes show the interquartile range. The bottom and the top of box depict the first and the third quartiles (i.e., Q1 and Q3). The ends of the whiskers correspond to the first and the ninth deciles (i.e., D1 and D9). Time is given in local time (UTC+2 h).
Based on these results, methanol and acetaldehyde temporal patterns were further explored in the light of the variabilities of isoprene and its oxidation products in Fig. 7. Based on the budget estimation reported by Jacob et al. (2005), methanol is likely to be dominated by biogenic emission sources resulting from the demethylation of pectin during plant cell wall expansion (Galbally and Kirstine, 2002; Hüve et al., 2007). Another important source is the photochemical production from methane under very low NOx conditions (Schade and Goldstein, 2006). The methanol pattern observed at CAO followed a typical diel profile and correlated quite well with temperature variation (r2=0.49). As depicted in Fig. 7, methanol concentrations started to increase immediately at sunrise (06:00 LT). The morning increase pattern of methanol concentrations is similar to isoprene one, suggesting a primary biogenic source as reported elsewhere (e.g., Karl et al., 2001, 2003; Schade and Goldstein, 2001). Studies have shown that methanol can build up within the stomata during the night, releasing a large burst to the atmosphere when the stomata open (morning bursts), followed by emissions consistent with changes in stomatal conductance (Hüve et al., 2007) and temperature (Harley et al., 2007). This is consistent with the observed measurements of increasing concentrations in the early morning, coinciding with stomatal opening.
Hydrocarbon oxidation (mostly alkanes and alkenes but also isoprene and ethanol) provides the largest acetaldehyde source in the budget estimates of Millet et al. (2010). Nonetheless, for all reaction pathways of isoprene with atmospheric oxidants, acetaldehyde is produced as a second- or higher-generation oxidation product of isoprene (Millet et al., 2010). In addition to photochemical production, acetaldehyde is emitted by terrestrial plants, as a result of fermentation reactions leading to ethanol production in leaves and roots (Jardine et al., 2008; Rottenberger et al., 2008; Winters et al., 2009). Acetaldehyde concentrations started to increase in the morning and peaked at midday followed by a gradual decrease throughout the rest of the day. The morning increase pattern of acetaldehyde concentrations is similar to the isoprene pattern rather than isoprene oxidation product one, and isoprene and acetaldehyde correlated well (r2=0.49). These findings suggest that acetaldehyde was mostly released into the atmosphere by local vegetation rather than produced by VOC oxidation processes in March 2015.
3.4 Impact of BVOCs on nucleation and NPF events
3.4.1 NPF event identification and classification
The days during the measurement period (i.e., 8–27 March) were classified with respect to whether or not NPF was observed. The NPF event days were identified using PSM and DMPS measurements and based on the criteria and methodology reported by Dal Maso et al. (2005). Briefly, a day was classified as an NPF event if (1) a clear increase in the fine particulate mode was observed, followed by (2) a sustained growth for at least a couple of hours until it reached a relevant particle size to form cloud condensation nuclei (CCN), resulting in a well-known “banana shape” as depicted in Fig. 8. Out of 20 observation days, such events were observed on 14 days (i.e., 8–10, 14, 16–18, 20–23 and 25–27 March) during daytime. The beginning of each event corresponds to the time when a new nucleation mode appeared, and its end is defined as the stop of the subsequent growth. On most NPF event days (8–10, 14, 16, 18, 23 and 25–27 March), we observed a steep increase in particle number (i.e., NDMPS increased up to 25 000 particles cm−3) initiated during the morning. On each NPF event day, a clear increase of the nanoparticle concentration, calculated as the difference between NPSM and NDMPS, was observed prior to the NDMPS number concentration increase. This indicates that the NPF events observed at CAO are initiated in the vicinity of the measurement site at the same time as at the regional scale, as the growth of these clusters are measured continuously over several hours as they are transported a further distance from the measurement site. On the 17, 20 and 22 March, cluster concentration increases were observed, indicating that nucleation was occurring in the local environment, but they were not followed by newly formed particle growth and hence not observed at the regional scale. The remaining 6 days out of the 20 observation days were classified as non-event days (i.e., 11–13, 15, 19 and 24 March).
The event days were classified further into subclasses (Ia, Ib, II and apple) according to the classification proposed by Yli-Juuti et al. (2009) based on previous work by Hirsikko et al. (2007) and Vana et al. (2008). This classification depends on the event applicability to growth and formation rate analysis. Class I represents the days when the formation and growth rate are determined with a good confidence level. Class I is divided into Class Ia and Ib. The Class Ia event (14, 18 and 23 March) has clear and strong particle formation with little or no pre-existing particles, while a Class Ib event is any other Class I event (8–10, 20 and 25 March) where the particle formation and growth rate can still be determined. The Class II event (16–17 and 22 March) represents the events where the accuracy of formation rate calculation is questionable due to data fluctuation even though the banana shapes are still observable. Class apple event (21 and 26–27 March) refers to an increase in the fine particulate mode, but newly formed particles do not show clear growth, and hence there is a clear gap between the new mode and other modes. Note that particulate formation and growth rates discussed in this study were only calculated for Ia and Ib events.
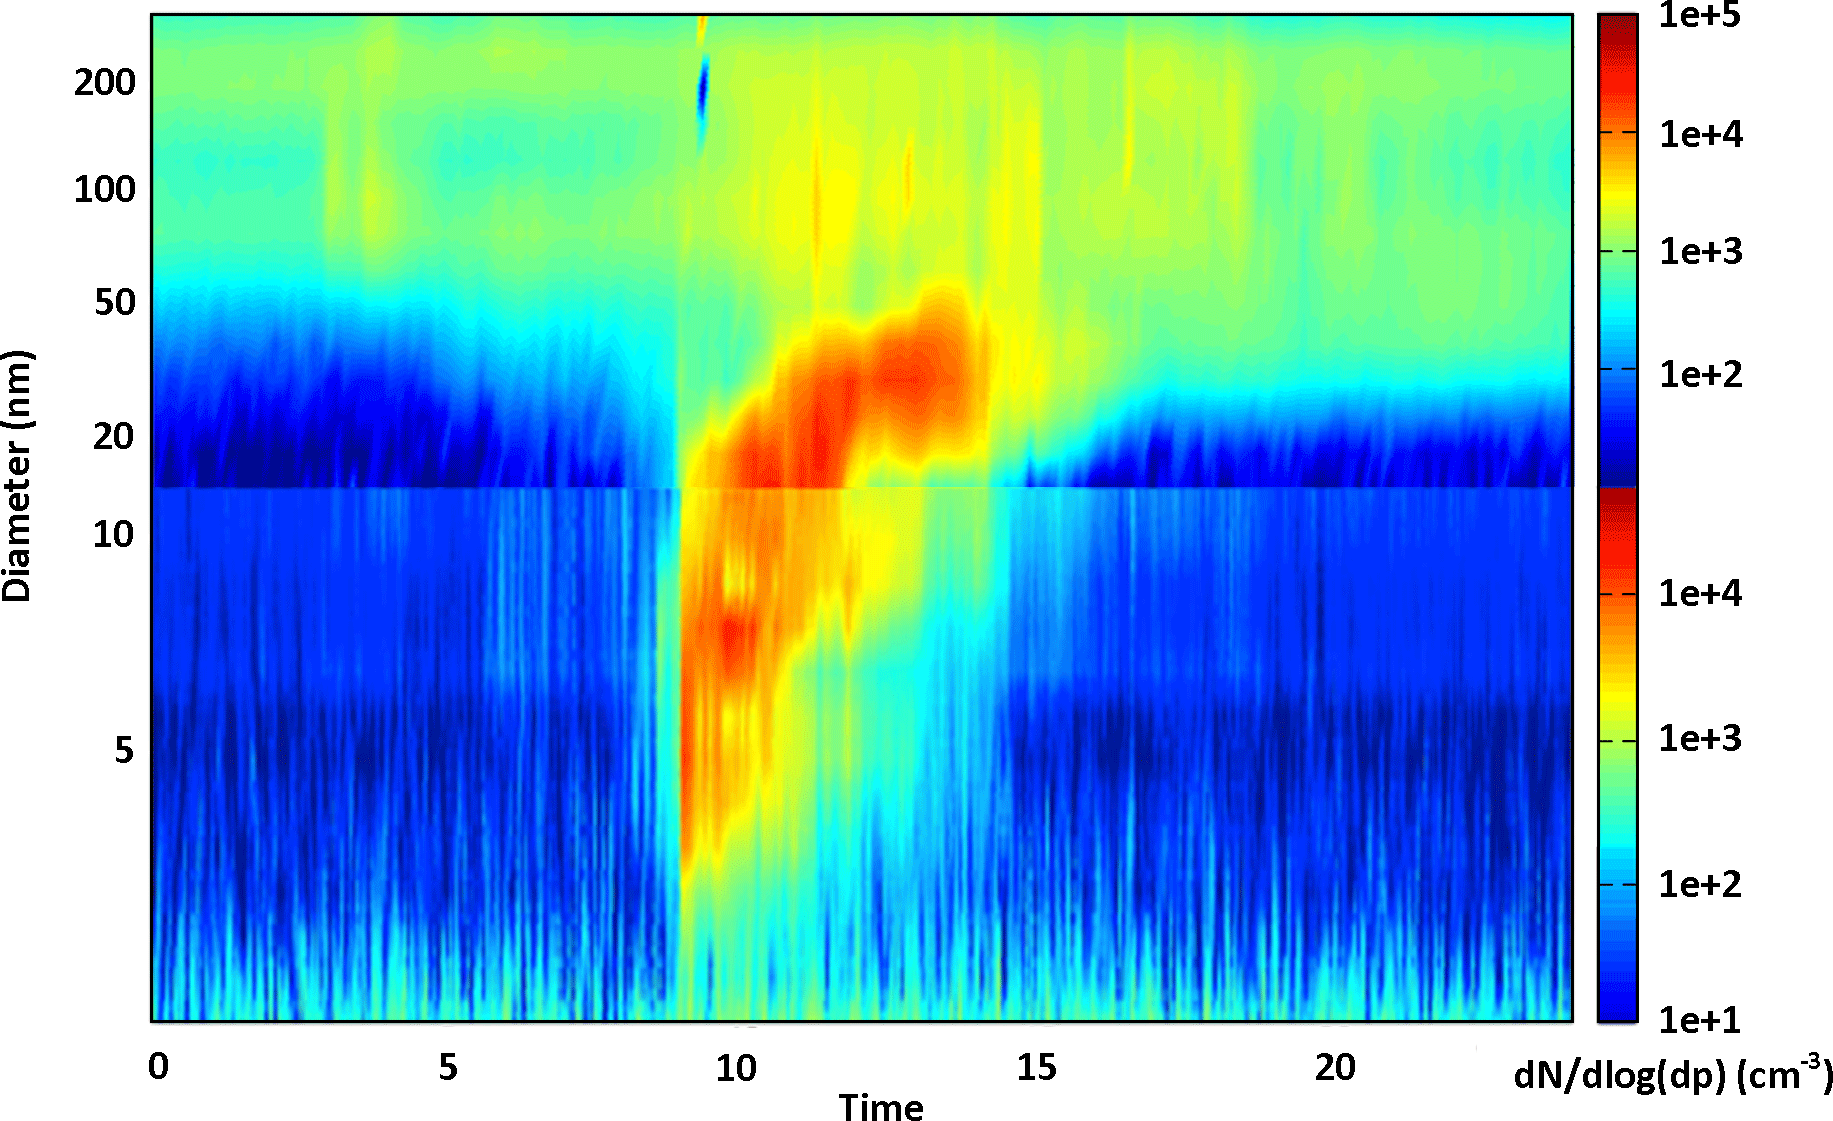
Figure 8Example of size distribution spectra, measured with DMPS and NAIS, showing an NPF event of type Ia occurring on 14 March 2015 at the CAO station.
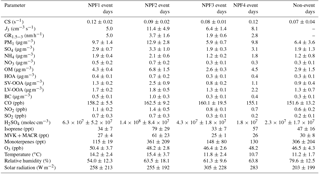
Table 2Average and standard deviation of CS, particle formation and growth rates (J1 and GR1.5−3, respectively), meteorological parameters (temperature, relative humidity and solar radiation) and atmospheric parameter daily concentrations measured at the CAO station in the case of event (NPF1–NPF4) or non-event days.
3.4.2 Overview of factors influencing nucleation events
To investigate the factors governing daytime NPF processes, it was decided to partition the NPF days into four classes (NPF1–NPF4) based on prevailing atmospheric conditions. More precisely, this classification was based on the transport pathways of the air masses arriving at the CAO site along with mean daily concentrations of atmospheric parameters presented in Table 2. This table also presents mean daily values of property indicators for NPF events (i.e., CS, particulate formation and growth rates) for event and non-event days. Figure 9 depicts diurnal cycles of particle number NPSM and NDMPS and accumulated diel variations of PM1 contributions. Figure 10 shows diurnal cycles of parameters with suspected influence on NPF, averaged over event and non-event days. Note that no clear trend was observed on 21 March. In addition to this statistical vision of the results, time series of particle number NPSM and NDMPS, CS, PM1 and suspected parameters controlling NPF events are provided in Fig. S4.
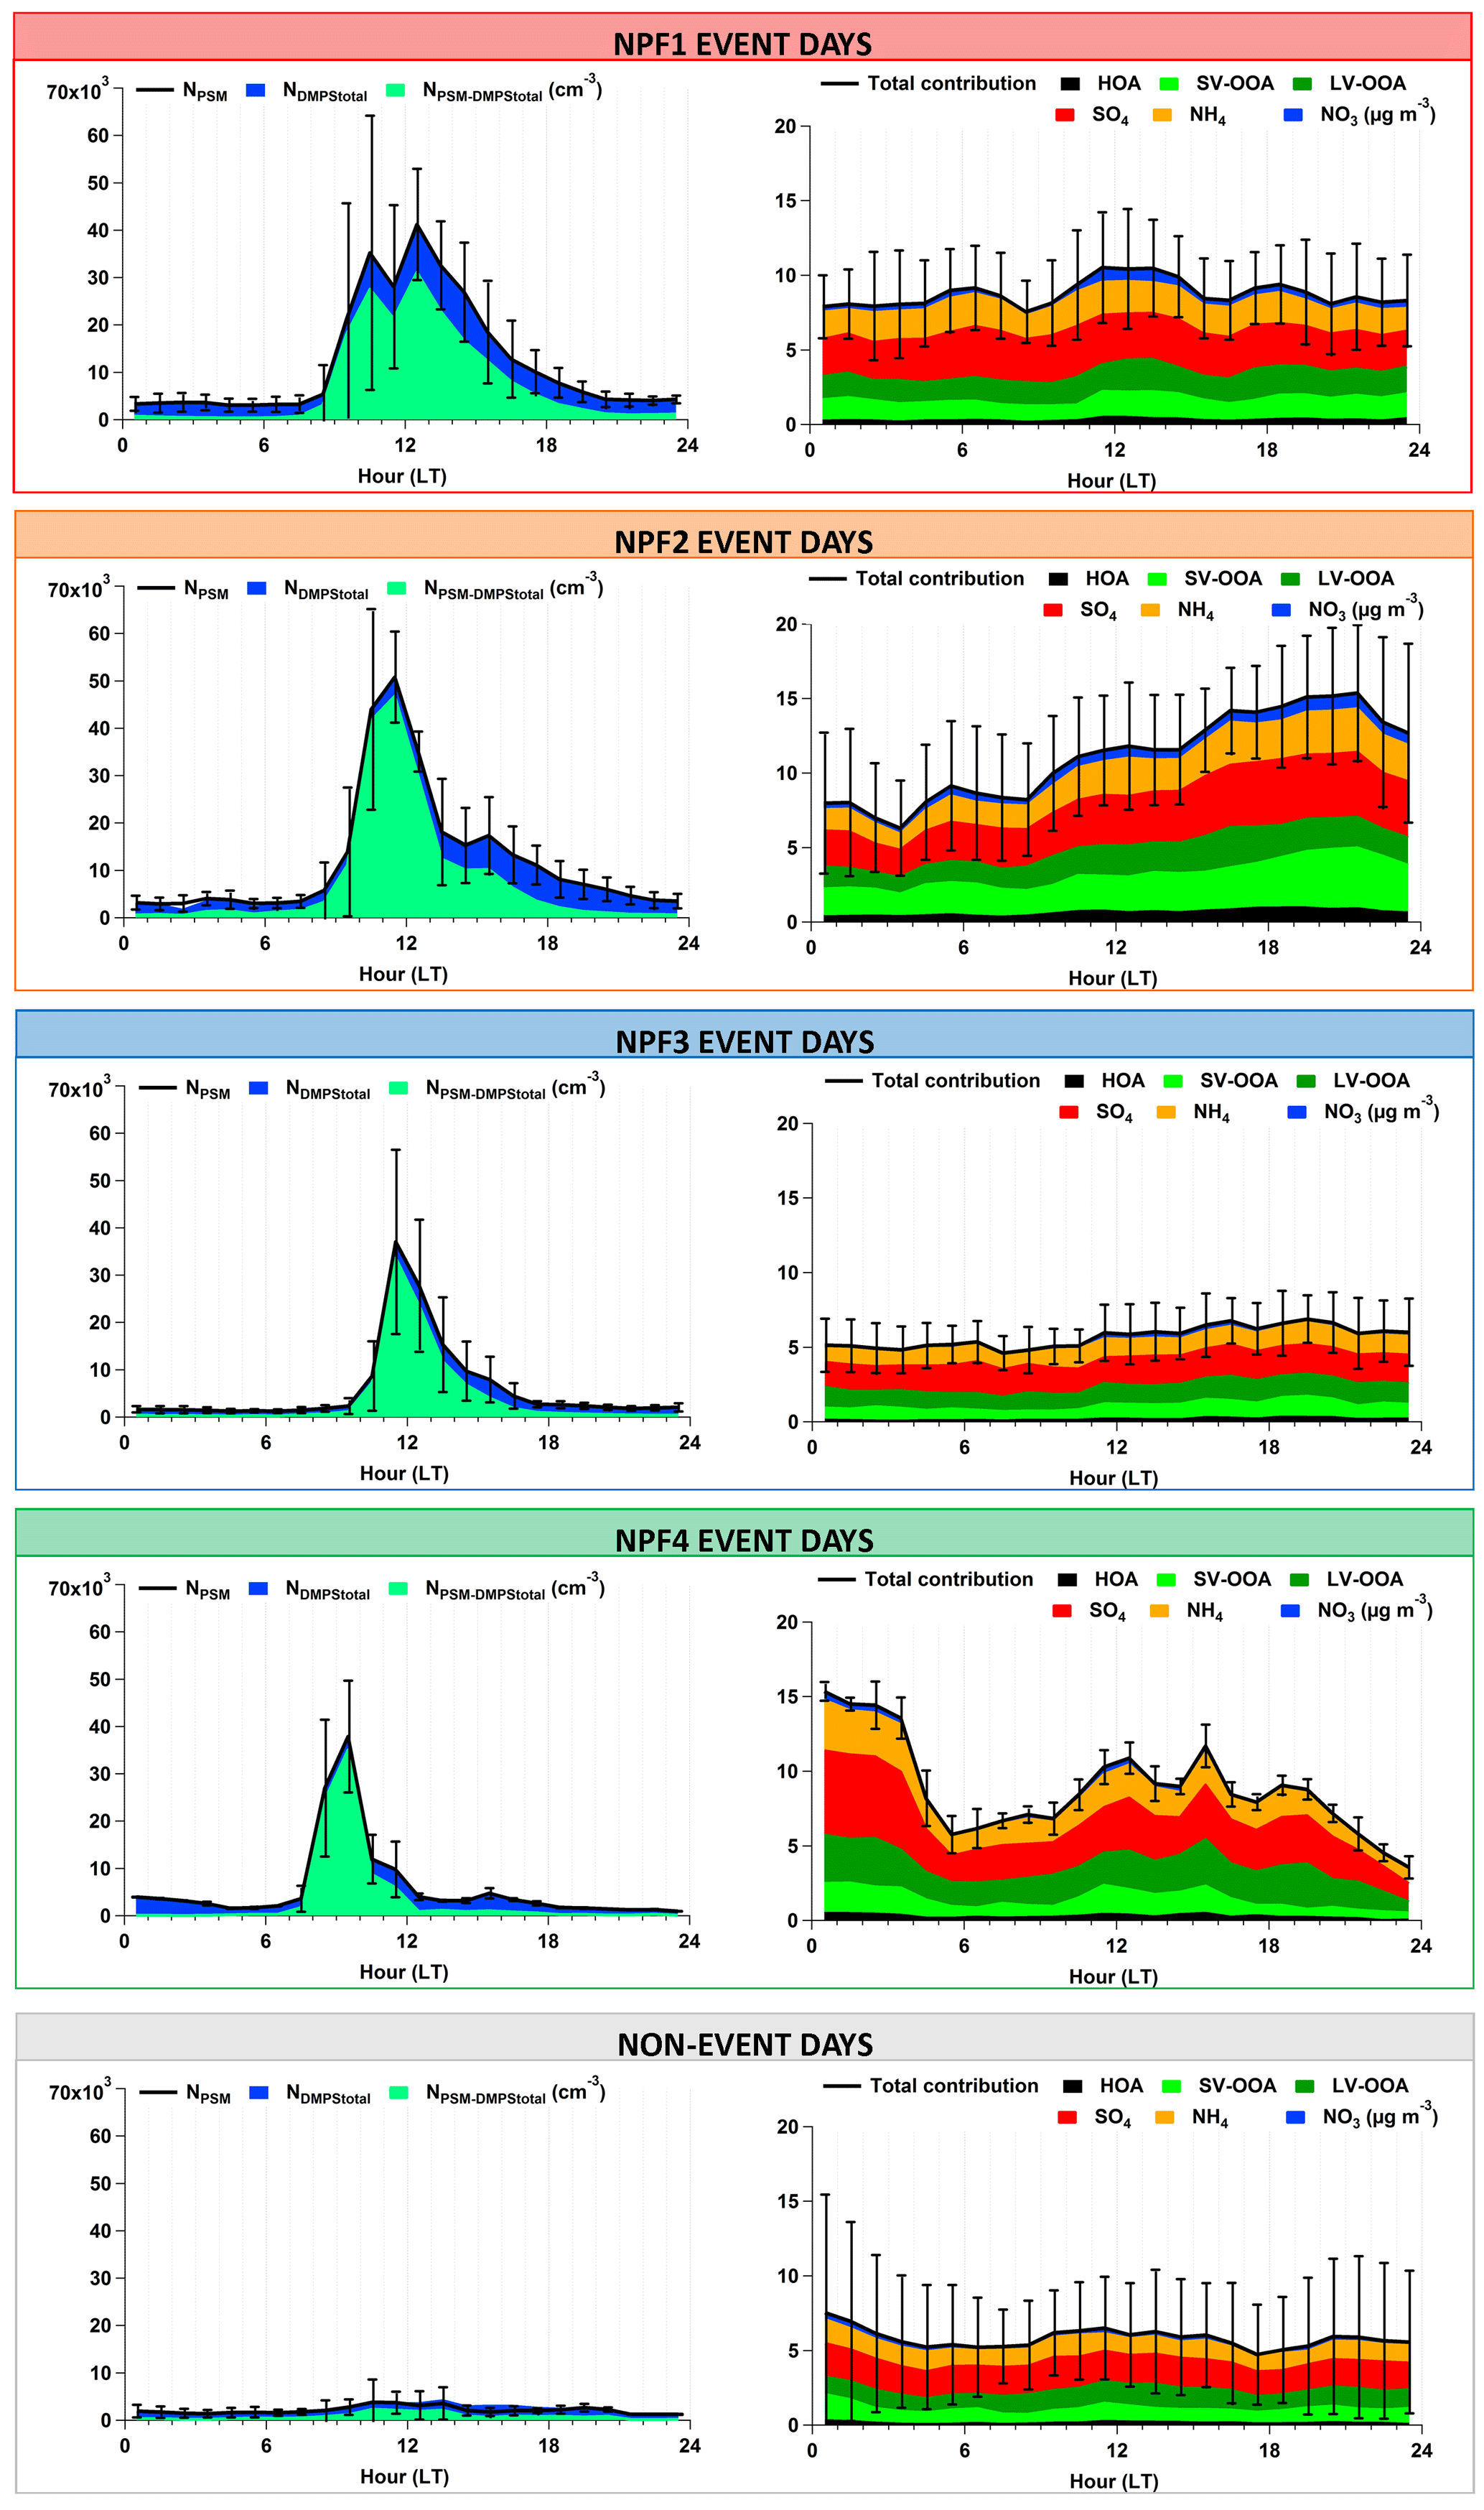
Figure 9Diel variation of particle number NPSM and NDMPS and accumulated diel variations of PM1 contribution for NPF event days (NPF1–NPF4) and non-event days. Diel variations are represented by daily mean values associated with standard deviation when several days were combined. Time is given in local time (UTC+2 h).
Classification of NPF days as a function of atmospheric conditions
NPF1 event days (i.e., 18 and 25–27 March) and NPF2 event days (i.e., 8–10 and 23 March) mainly concerned class I and apple type events. The CAO station may receive pollution of local/regional origins since winds during NPF1 and NPF2 event days were mainly from northeastern, eastern and southeastern directions, and the station received air masses originating from southwest and northwest Asia (Fig. S4). In the course of these NPF event days and especially for NPF2 ones, high concentrations of PM1, HOA, BC and NO2 (Table 2), which are recognized as tracers of anthropogenic sources, suggested that NPF events were of anthropogenic origin. High concentrations of inorganic compounds (SO4, NO3 and NH4; Table 2) were also observed, suggesting the air masses sampled during NPF1 and NPF2 events were both polluted and aged. Additionally, higher BVOC concentrations (i.e., isoprene, MVK + MACR and monoterpenes; Table 2) were observed during NPF2 event days than the ones during NPF1. Consequently, NPF1 event days were characterized mainly by anthropogenic origin, while NPF2 event days were of mixed origins (anthropogenic and biogenic).
NPF3 event days (i.e., 14, 16–17 and 22 March) and NPF4 event days (i.e., 20 March) concerned all class II events and some class I events. During these NPF event days, the CAO station received winds which were mainly from northwestern, western and southeastern directions and the station was mainly influenced by maritime air masses (Fig. S4) and continental ones which have not been newly in contact with anthropogenic sources. This finding was confirmed by the low anthropogenic tracer concentrations observed during these NPF days which were similar to the ones observed during non-event days (Table 2). Moreover, BC did not exceed 0.5 µg m−3 (Fig. S4), supporting the consideration of atmospheric conditions as clean conditions according to Cusack et al. (2013). Higher isoprene concentrations than the ones characterizing non-event days were only noticed during NPF4 events even if MVK + MACR mean concentrations of NPF4 event days were slightly lower than the ones observed on the non-event days (Table 2). As a result, NPF3 event days were characterized mainly by marine origin, while NPF4 event days were probably of biogenic origin. Note that PM1 concentrations during NPF4 event days were of the same range as the ones recorded during NPF event days of anthropogenic origin (Table 2) due to higher concentrations of inorganic compounds (i.e., SO4 and NH4) and a higher contribution of low-volatility oxygen-like organic aerosol (LV-OOA) to OM concentration. These findings suggest highly processed (aged) regional background pollution transported to the receptor site during NPF4 event days.
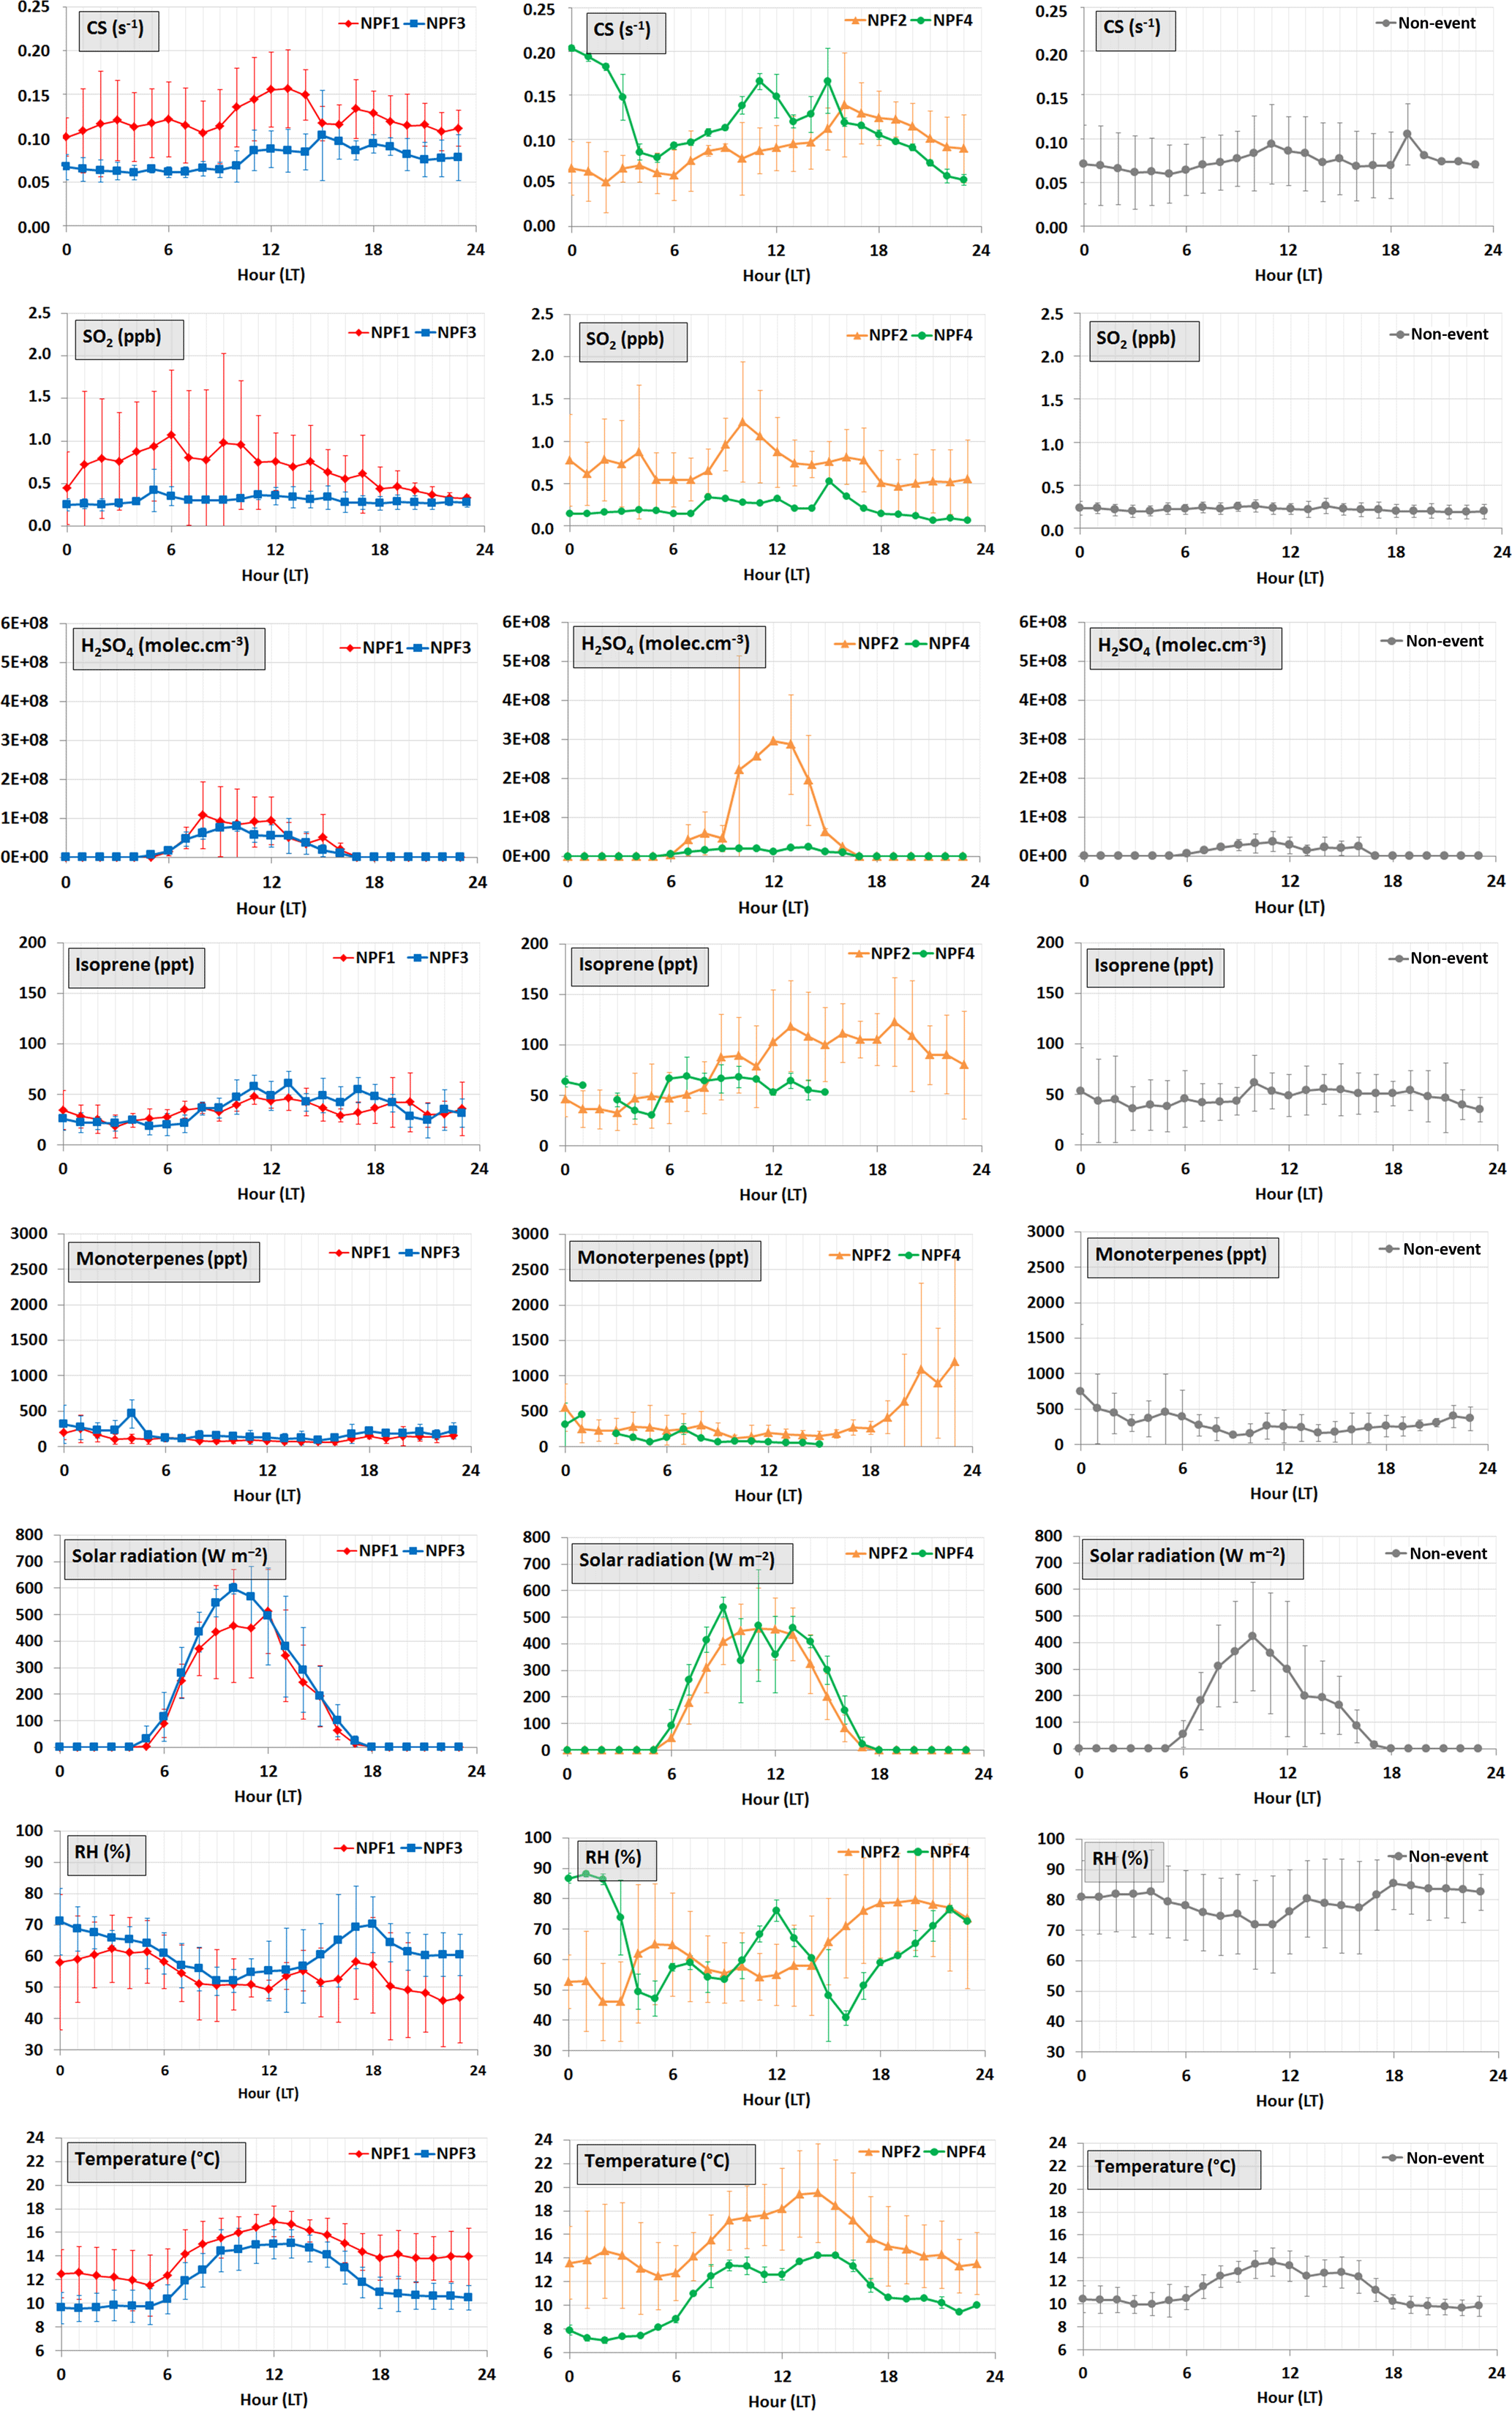
Figure 10Diel variation of CS, SO2, H2SO4, BVOCs (isoprene and monoterpenes) and meteorological parameters (global solar radiation, relative humidity and temperature) during NPF event days (NPF1–NPF4 displayed as red, yellow, blue and green lines, respectively) and non-event days (grey lines). Diel variations are represented by daily mean values associated with standard deviation when several days were combined. Time is given in local time (UTC+2 h).
Study of the effect of meteorological parameters on new particle formation
The intensity of global solar radiation was higher on event days (275 W m−2 on average; Table 2) than on non-event days (203 W m−2). This finding is consistent with the literature (Cavalli et al., 2006; Cusack et al., 2013; Guo et al., 2008; Hamed et al., 2007). Solar radiation is known as an important parameter in the initial step of atmospheric nucleation, since photochemical reactions among various chemicals were facilitated by stronger solar radiation, leading to the production of the nucleating and/or condensing species involved in NPF (Harrison et al., 2000).
The hourly average RH followed the opposite temporal pattern of that of the intensity of global radiation (Fig. 10). The RH was hence lower on event days (61 % on average; Table 2) than on non-event days (80 %) as observed elsewhere (Boy and Kulmala, 2002; Guo et al., 2012; Hamed et al., 2007). This could be partly explained by the fact that lower RH days usually have fewer clouds causing more solar radiation and subsequently producing more OH radicals to form more condensable vapors (Hamed et al., 2007). Another possible reason could result from an increase in particle hydration with increasing RH, which leads to larger pre-existing particle surface areas and thereby larger condensation sinks, resulting in a possible inhibition of the nucleation (Birmili et al., 2003; Hamed et al., 2011).
Temperatures were also higher on event days (i.e., NPF1-NPF3: 13.8 ∘C on average; Table 2) than on non-event days (11.2 ∘C) and especially during NPF1 event days (15.4 ∘C). As for RH, higher temperatures might be linked to higher solar radiation associated with higher photochemistry, and it is difficult to separate the two effects with our datasets. Higher temperatures have been associated with the nucleation events in Germany (Birmili et al., 2003), in Italy (Hamed et al., 2007) and in Atlanta (Woo et al., 2001), which may be induced by higher BVOC emissions (Guo et al., 2008). Contrarily, lower temperatures have been associated with the nucleation events in Finland (Boy and Kulmala, 2002; Vehkamäki et al., 2004) and in Hong Kong (Guo et al., 2012). These later findings could be due to lower temperatures at the start time of the NPF events which may enhance the nucleation of H2SO4 with water vapor (Guo et al., 2012).
NPF1 and NPF2 event days: nucleation under polluted atmospheric conditions
NPF1 and NPF2 event days occurred at CAO at high levels of SO2 (both at 0.7 ppb on average and up to 2.2 ppb; Table 2 and Fig. 10) compared to SO2 ones on non-event days (0.2 ppb on average and up to 0.4 ppb), suggesting its implication in nucleation formation. Conditions seem to be even more favorable for H2SO4 production during NPF2 event days since higher H2SO4 concentrations were observed on NPF2 event days (1.4×10⁸ molec cm−3 on average; Table 2) than on NPF1 event days (6.3×10⁷ molec cm−3). NPF1 and NPF2 also occurred at high CS (up to 0.4 s−1; Fig. S4) compared to non-event days (up to 0.2 s−1). A high condensation sink might suppress the particle formation and the growth of the newly formed particles as a substantial fraction of the vapors that could be condensing on the larger particles. Furthermore, the condensation sink is proportional to the coagulation sink of nucleation-mode particles on pre-existing particles. Therefore, at high CS, a high growth rate is required for the newly formed particles to survive and grow to larger sizes instead of being scavenged by coagulation (Kulmala et al., 2005). Thus, for NPF1 and NPF2, a high condensable source rate had to compensate for the high CS.
What further distinguished NPF2 from NPF1 was that isoprene concentrations were particularly high during NPF2 event days (Table 2 and Fig. 10) than its concentrations during non-event days due to more favorable temperatures (Fig. 10). Similar diurnal variations were also observed between isoprene, temperature and NDMPS−PSM during NPF2 event days (Figs. 9 and 10), suggesting that isoprene and H2SO4 can both play a role during NPF2 event days. Contrarily, isoprene concentrations during NPF1 event days were similar to those observed during non-event days which would suggest that NPF1 was mainly induced by H2SO4.
Slightly lower PM1 concentrations were measured during NPF1 event days (9.7 µg m−3; Table 2) compared to PM1 concentrations during NPF2 event days (12.9 µg m−3) since lower OM concentrations were observed on NPF1 event days (4.3 µg m−3 vs. 6.8 µg m−3 during NPF1 and NPF2 event days, respectively; Table 2), while similar concentrations of SO4 and NH4 were noticed during these NPF event days (2.9–1.9 and 3.3–2.1µg m−3 for SO4–NH4 concentrations during NPF1 and NPF2 event days, respectively). Moreover, semi-volatile oxygen-like organic aerosol (SV-OOA) contributed to OM more intensively only during NPF2 event days (up to 86 %; Debevec et al., 2017), while LV-OOA contributions were in the same range during NPF1 and NPF2 event days (1.7–1.8µg m−3; Table 2). As a conclusion, isoprene contribution during NPF2 event days coincided with higher PM1 concentrations due to a higher contribution of SV-OOA.
NPF3 and NPF4 event days: nucleation under clean atmospheric conditions
NPF3 and NPF4 event days occurred at low levels of SO2 (0.3 and 0.2 ppb for NPF3 event days and NPF4 event days, respectively) inducing low H2SO4 concentrations (Table 2; Fig. 10) that could be not sufficient to initiate nucleation formation. These NPF events started at low CS (0.05 s−1; Fig. 10), highlighting a lower uptake of species by condensation and favoring nucleation processes under clean atmospheric conditions. Note that daily CS observed during NPF4 event days was high compared to CS during NPF3 event days and non-event days (Table 2; Fig. 10) but CS was below 0.1 s−1 when an NPF4 event was initiated as depicted in Fig. 10. Additionally, the increase in CS followed the increase in NDMPS−PSM, suggesting that the CS time variation was mainly driven by the growth by condensation of newly formed particles.
A steep increase in particle number NDMPS−PSM up to 70 000 particles cm−3 was recorded between 08:00 and 10:00 LT on 20 March (i.e., NPF4 event day) when solar radiation and temperature were observed to be intense. Isoprene concentrations increased from 06:00 LT on 20 March and remained relatively high (60–110 ppt) during the morning, suggesting a role in NPF formation. Contrarily, isoprene concentrations recorded during NPF3 event days were lower than NPF4 event days and non-event days, suggesting that a marine source could be involved in NPF3 events.
NPF2 event days of mixed origins vs. NPF1/NPF4 event days of individual origin (anthropogenic/biogenic)
On 23 March (mixed NPF2 event type), the NPF event occurred at similar levels of biogenic tracer (isoprene concentrations between 60 and 110 ppt; Fig. S4) than the ones observed on 20 March (biogenic NPF4 event type), while higher mean particulate formation and growth rates were met during the selected NPF2 event (J3: 8.97 cm−3 s−1 – GR1.5−3: 3.18 nm h−1) compared to the mean rates characterizing the NPF4 event day (J3: 8.13 cm−3 s−1 – GR1.5−3: 1.93 nm h−1). These findings suggest polluted air mixed with high concentrations of biogenic compounds induced more intense particulate formation and faster growth.
Additionally, on 23 March during the NPF2 event, concentrations of H2SO4 (below 0.2×10⁸ molec cm−3) were close to the ones observed on 27 March (anthropogenic NPF1 event type). Characterized as an apple event type, the particulate formation and growth rates were not calculated for the NPF1 event on 27 March and were hence not compared with the ones associated with NPF event on 23 March. Note that higher strength (i.e., maximum particle cluster number concentration) was noticed for the selected NPF2 event day (maxima NPSM−DMPS of 63 000 cm−3 on 23 March and of 41 000 cm−3 on 27 March). Moreover, at higher H2SO4 concentrations than ones observed on 23 March, NPF1 event days have shown contrasted particulate formation rates (J3: 5.00–49.60 cm−3 s−1 on 18–25 March, respectively) and both higher mean growth rate and mean CS (GR1.5−3: 4.75 nm h−1 – CS: 0.12 s−1) than the mean ones associated with NPF2 event days (GR1.5−3: 3.70 nm h−1 – CS: 0.09 s−1). It seems that polluted air masses, observed at the receptor site during NPF1 event days, were characterized by a high amount of condensable species involved in the particle growth, permitting to overcome the increased CS and allowing also a fast growth. At higher H2SO4 and BVOC concentrations, NPF2 event days occurring on 8–10 March have shown higher particulate formation rates than the one of the NPF event on 23 March (J3: 12.23 cm−3 s−1 on average ±5.62 cm−3 s−1 on 8–10 March and J3: 8.97 cm−3 s−1 on 20 March). This finding again would confirm polluted air mixed with high concentrations of biogenic compounds can induce more intense particulate formation.
As a result of these comparisons, chemical or photochemical reactions involving biogenic and anthropogenic species form new compounds which may be involved in nucleation. Several field studies have found an enhancement of biogenic SOA under the influence of anthropogenic emissions (e.g., Carlton et al., 2010; Shilling et al., 2013). The enhancement can be a result of increased gas-to-particle partitioning, increased oxidant concentrations or a change in the reaction pathways (Hoyle et al., 2011; Kanakidou et al., 2000). Laboratory experiments have also shown higher SOA formation levels in mixtures of VOCs compared to a single VOC (Ahlberg et al., 2017; Flores et al., 2014). Ahlberg et al. (2017) even found that isoprene did not produce much SOA mass in single VOC experiments but contributed to the mass in the cases of VOC mixtures.
As a summary, NPF can occur at various condensational sinks and both under polluted and clean atmospheric conditions. Some NPF events can occur at CAO at low SO2 concentrations and low CS under clean atmospheric conditions. High calculated H2SO4 concentrations coupled with high BVOC concentrations seem to be one of the most favorable conditions to observe NPF at CAO in March 2015. Relatively high particulate formation and growth rates were associated with NPF event days of mixed origins, suggesting an intense particulate formation and a fast growth. Higher strength was noticed for an NPF2 event day under mixed influence (anthropogenic and biogenic – 23 March) than the ones observed both during NPF1 and NPF4 event days, under anthropogenic and biogenic origins, respectively, for the same levels of precursors (anthropogenic and biogenic, respectively), suggesting combination of biogenic and anthropogenic species form new compounds which may be involved in nucleation. The next part of this section is focused on 8–10 March (mixed NPF event type) to better understand how the interaction of BVOC species with anthropogenic compounds can initiate nucleation and contribute to early growth of nucleated particles.
3.4.3 Focus on BVOC contributions to particle formation and growth: 8–10 March NPF events
Firstly, we will focus our discussion on the behavior of selected parameters during NPF events observed between 8 and 10 March (represented by yellow periods in Fig. 11), corresponding to the NPF2-type events. The three successive NPF events were all initiated at 08:00 LT occurring around 2 h after sunrise when isoprene concentrations started to increase in agreement with temperature and Sun radiation. Daytime variation (06:00–17:00 LT) of NPSM−DMPS was consistent with the MVK + MACR one, which could represent the oxidized species producing new particles by nucleation. Maximal NPSM−DMPS (between 30 000 and 40 000 cm−3) were observed at 11:00–12:00 LT in agreement with daily maximal solar radiation and isoprene concentrations (between 100 and 160 ppt). However, daily maximal NPSM−DMPS decreased from day to day, while slightly higher maximal isoprene daily concentrations were noticed on 9 and 10 March compared to 8 March. This finding might be linked with higher CS recorded at the beginning of NPF events on 9 and 10 March compared to 8 March, which could reduce formation of new particles. As stated before, SO2 and H2SO4 concentrations in the 8–10 March period were among the highest ones observed during the campaign (Figs. 10–11). H2SO4 and SO2 concentrations started to increase at 09:00 LT on 8 March and at 10:00 LT on 9 March, which also correspond to the increase in NPSM−DMPS concentrations (Fig. 11), suggesting that H2SO4 also play a role in NPF. Additionally, daily maximal H2SO4 and SO2 concentrations also decreased from 8 to 10 March, as did particle cluster concentrations. Monoterpene concentrations remained low during these NPF events (below 400 ppt) but higher concentrations were observed at night, suggesting their possible contribution in the growth of newly formed particles. Contrarily, monoterpene oxidation products were shown to produce new particles by nucleation more efficiently than the isoprene oxidation products (Bonn et al., 2014; Spracklen et al., 2008). This finding could suggest that isoprene alone may not contribute to particle nucleation, while isoprene combined with anthropogenic species can be involved in nucleation. Additionally, oxidation products of monoterpenes, such as pinonaldehyde or nopinone, may nucleate and condense at an early stage of the new particle formation (Sellegri et al., 2005b).
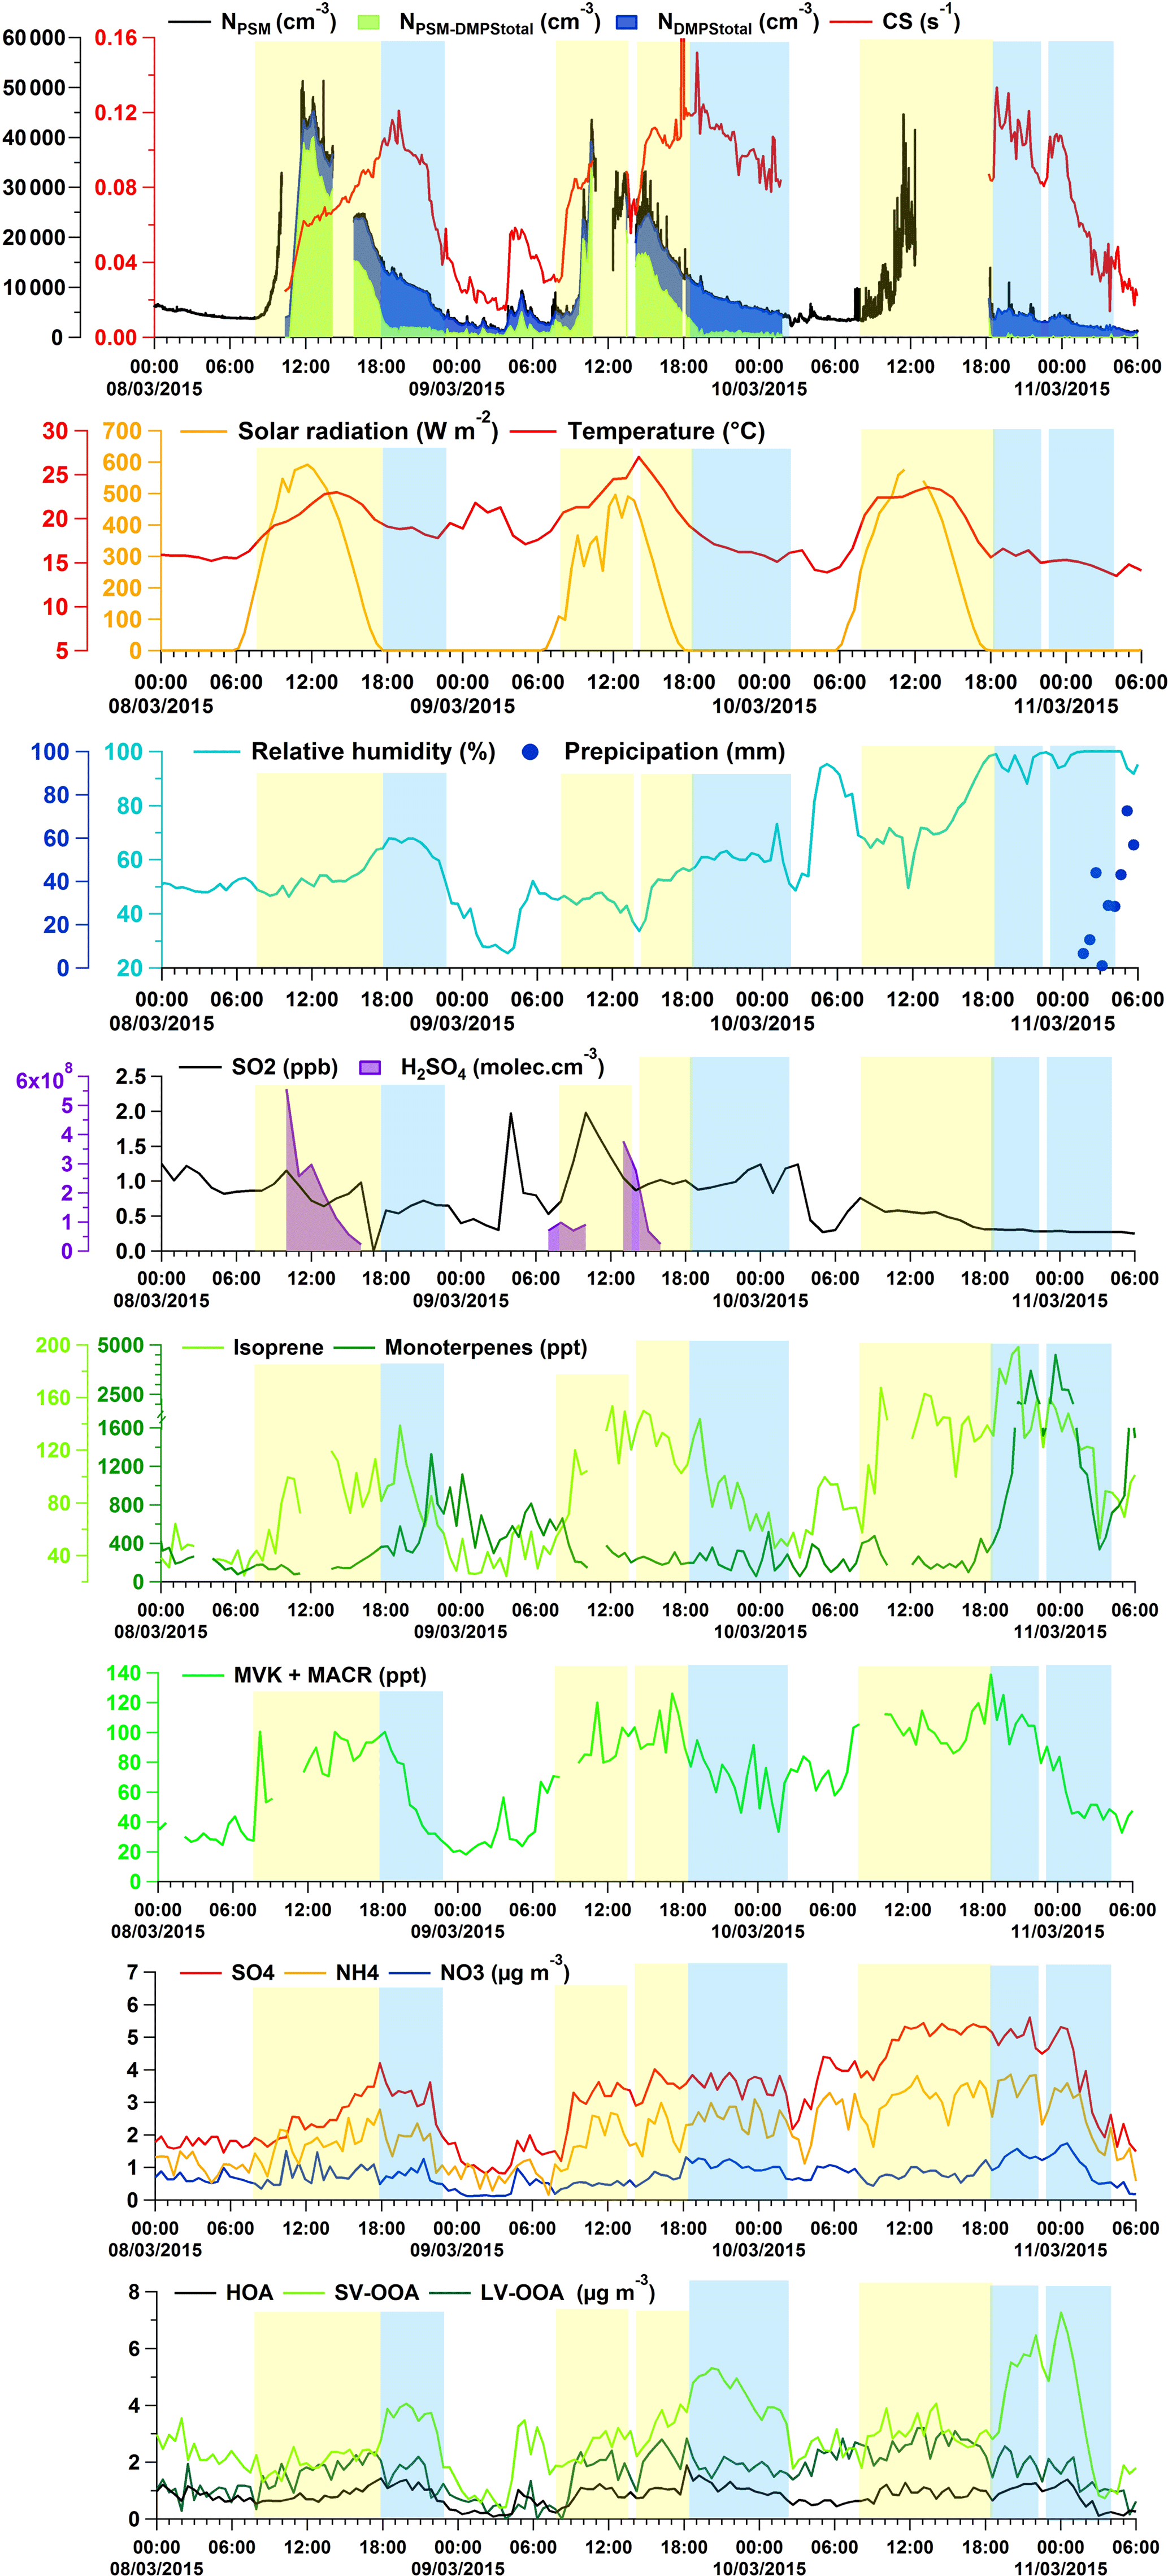
Figure 11Time series of NPSM, NDMPS, NPSM−DMPS and CS during NPF2 event days (i.e., 8–10 March) in comparison to meteorological parameters (global solar radiation, temperature, relative humidity and precipitation), SO2, H2SO4, BVOCs (isoprene, MVK + MACR and monoterpenes) and PM1 composition. Time is given in local time (UTC+2 h). NPF events are represented in yellow and nighttime succeeding NPF events are depicted in blue. These periods are discussed in Sect. 3.4.3.
As a summary, during these specific NPF event days of the campaign, nucleation-mode particles may be formed by the combination of high H2SO4 and isoprene oxidation product concentrations under favorable meteorological conditions (high temperature and solar radiation and low relative humidity; Fig. 5), resulting in an increase in SV-/LV-OOA contributions. A similar trend was observed between CS and isoprene concentrations during NPF events only, suggesting that these compounds do not only contribute to the nucleation mode for particles but also to aerosol growth directly after nucleation.
The focus is now shifted to the variability of selected parameters during nighttime succeeding these NPF events (periods represented by blue color in Fig. 11) partly to highlight the role of monoterpenes. These nighttime periods were characterized by relatively high CS (up to 0.16 s−1), nocturnal temperatures among the highest ones observed during the campaign and relative humidity between 50 % and 100 %. Note that high isoprene (and/or MBO) concentrations have still been observed even a few hours after sunset consistent with temperature variation (Sect. 3.1.2) and could also play a role during nighttime.
Blue periods in Fig. 11 highlight periods characterized by a clear increase in SV-OOA contributions, while inorganic aerosols concentrations and LV-OOA contributions remained stable. The increase in SV-OOA contributions occurred at high isoprene concentrations, sometimes at high monoterpene concentrations and at high CS, in favor of BVOC condensation onto pre-existing particles. Moreover, after 19:00 LT on 10 March, the highest monoterpene concentrations observed during the campaign (up to 4 ppb) coincided with an elevation of SV-OOA contributions up to 7.3 µg m−3, consistent with the fact that oxidation products of monoterpenes are known to contribute to particle growth (Birmili et al., 2003).
As a summary, BVOCs observed at night at CAO potentially play a role in particle growth by condensing onto pre-newly formed aerosols and significantly influence levels and variations mainly of SV-OOA. The relationship between BVOCs and OA stated in Debevec et al. (2017) was hence confirmed, highlighting the importance of the local contribution.
The eastern Mediterranean is considered as a sensitive region strongly impacted by air pollution, making this location important for investigation. This air pollution partly results from strong local anthropogenic emissions, particularly concentrated in coastal cities, natural emissions enhanced by favorable climatic conditions along with contributions of polluted air masses from three continents transported over long distances. All these combined sources of air pollutants will have impacts on human health, ecosystems and climate. However, to clearly assess the various incidences of this complex pollution impacting the Mediterranean region, supplementary observational data collected in the region are needed since they remain scarce, especially in the eastern Mediterranean. Given this background, an intensive field campaign was carried out during a 1-month period (March 2015) at a background Cypriot site within the framework of ChArMEx and ENVI-Med CyAr programs. In particular, this work focused on the study of the sources and fates of BVOCs in the eastern Mediterranean and based on the intense monitoring of isoprene, eight monoterpenes and seven OVOCs with online and offline measurements.
Primary BVOCs were mainly composed of monoterpenes with peaks up to 4500 ppt. α-Pinene and β-pinene were the major monoterpenes recorded (62 % of the total monoterpene concentration). Additionally, isoprene and monoterpenes present two distinct kinds of diurnal evolution (daily and nighttime maximum, for isoprene and α-pinene, respectively) underlining two different kinds of emission sources. The monoterpene nocturnal pattern was imputed to nocturnal emissions from monoterpene-storing plants from the understory vegetation (pine forests). The observed isoprene pattern followed the usual diel profile which depended on environmental parameters (temperature and solar radiation). To determine the dominant emission drivers for biogenic species, pinene and isoprene temporal evolution was studied simultaneously with meteorological parameters. BVOC concentration levels and variations could be explained by sources, sinks, vertical mixing along with horizontal transport. BVOC emissions were controlled by ambient temperature, precipitation and relative humidity. Significant changes in monoterpene mixing ratios occurred during and after rainy periods. Rainfall appeared to induce a stress factor onto the vegetation and therefore may have caused short-term increases in the release of monoterpenes from the vegetation that may stimulate diurnal sources of monoterpenes. High relative humidity and high temperature were favorable conditions at the station to observe high BVOC concentrations originating from the nocturnal biogenic sources.
BVOCs are known to have their importance in the growth and possibly also in the early stages of formation of atmospheric aerosol particles. Based on observations of the particle size distribution performed with a DMPS and the total number concentrations of particles larger than 1 nm diameter measured by PSM, NPF events were found to occur on 14 out of 20 days. For all suspected parameters having a role in NPF (meteorological parameters, H2SO4 and gaseous compounds), we present mean levels and daily variations during different classes of nucleation events and non-event days. NPF can occur at a various CS and both under polluted and clean atmospheric conditions. High calculated H2SO4 concentrations coupled with high BVOC concentrations seem to be one of the most favorable conditions to observe NPF at CAO in March 2015. Relatively high particulate formation and growth rates were associated with NPF event days of mixed origins, suggesting an intense particulate formation and a fast growth. Higher strength was also noticed for NPF event days of mixed origin (anthropogenic and biogenic – 23 March) compared to the ones observed both for NPF events solely of anthropogenic origin or biogenic origin, respectively, for the same levels of precursors (anthropogenic and biogenic, respectively), suggesting that the interaction of biogenic and anthropogenic species enhances the potential of nucleation. A focus on a specific NPF period (mixed event type) highlighted BVOC combination with anthropogenic compounds influenced nucleation formation and growth of newly particles. During this period, nucleation mode may be induced by the combination of high H2SO4 and isoprene concentrations and under favorable meteorological conditions (high temperature and solar radiation and low relative humidity) and low CS, resulting in an increase in SO4 concentrations but also an increase in SV-/LV-OOA contributions. BVOCs contributed as well to the aerosol growth by condensing onto pre-existing aerosols since high BVOC concentrations were observed during successive nights of NPF events consistent with CS variations, leading to a significant increase in SV-OOA contributions.
The list of BVOCs measured within this work is not exhaustive; future prospects should focus especially on the measurements of sesquiterpenes which are very reactive and of interest for NPF study.
All the data presented in this paper are available upon request. Please contact Stéphane Sauvage (stephane.sauvage@imt-lille-douai.fr) for further information.
The supplement related to this article is available online at: https://doi.org/10.5194/acp-18-14297-2018-supplement.
SS, VaG, KS, JS and NL designed the research. CD, SS, VaG, TL, ViG, LD, IF, RSS, DB, BB and NL contributed to the obtaining of VOC dataset, from the organization and the setting of instruments at CAO to the analysis of the ambient air samples at the laboratory. CD, SS, VaG and NL analyzed VOC data, conducted and interpreted the VOC PMF analysis and examined dominant factors controlling BVOC concentrations. KS conducted particle size distribution measurements and provided PSM, DMPS and NAIS measurement data. CD and KS identified, characterized and investigated NPF events observed at CAO. JS, MP, IS and MV conducted PM1 measurements and provided AE31 and ACSM measurement data and the PMF analysis of organic NR-PM1. CS provided trace gas measurement data. CD wrote the manuscript. All the co-authors were involved in data discussion and edited the paper.
The authors declare that they have no conflict of interest.
This article is part of the special issue “CHemistry and AeRosols Mediterranean EXperiments (ChArMEx) (ACP/AMT inter-journal SI)”. It is not associated with a conference.
This study was supported by ChArMEx, ENVI-MED,
EU-H2020 ACTRIS-2 (European Union's Horizon
2020 Research and Innovation Programme, grant agreement no. 654109), CEA and
CNRS. Atmospheric observations performed in Cyprus have been partly supported
by the EU-H2020 ACTRIS-2 project and the EU FP7-ENV-2013 BACCHUS project (grant
agreement no. 603445). The authors would like to thank Nikolaos Mihalopoulos
for his help in the establishment of the CAO observatory, François Dulac
and Eric Hamonou for managing the ChArMEx project with enthusiasm, along with
Jonilda Kushta and Theodoros Christoudias for their help in the investigation
on the PBL height effect on BVOC concentrations. The present work is a contribution to the Labex CaPPA
(Chemical and Physical Properties of the Atmosphere) funded by the French
National Research Agency (ANR-11-LABX-005-01) and the European Funds for
Regional Economic Development (FEDER). The “Hauts-de-France” Regional
Council, the French Ministry for Higher Education and Research and the FEDER
are also acknowledged for their financial support through the CPER research
project CLIMIBIO (changement Climatique, dynamique de l'atmosphère,
impacts sur la biodiversité et la santé humaine).
Edited by: Matthias Beekmann
Reviewed by: two anonymous referees
Ahlberg, E., Falk, J., Eriksson, A., Holst, T., Brune, W. H., Kristensson, A., Roldin, P., and Svenningsson, B.: Secondary organic aerosol from VOC mixtures in an oxidation flow reactor, Atmos. Environ., 161, 210–220, https://doi.org/10.1016/j.atmosenv.2017.05.005, 2017.
Ait-Helal, W., Borbon, A., Sauvage, S., de Gouw, J. A., Colomb, A., Gros, V., Freutel, F., Crippa, M., Afif, C., Baltensperger, U., Beekmann, M., Doussin, J.-F., Durand-Jolibois, R., Fronval, I., Grand, N., Leonardis, T., Lopez, M., Michoud, V., Miet, K., Perrier, S., Prévôt, A. S. H., Schneider, J., Siour, G., Zapf, P., and Locoge, N.: Volatile and intermediate volatility organic compounds in suburban Paris: variability, origin and importance for SOA formation, Atmos. Chem. Phys., 14, 10439–10464, https://doi.org/10.5194/acp-14-10439-2014, 2014.
Almeida, J., Schobesberger, S., Kurten, A., Ortega, I. K., Kupiainen-Maatta, O., Praplan, A. P., Adamov, A., Amorim, A., Bianchi, F., Breitenlechner, M., David, A., Dommen, J., Donahue, N. M., Downard, A., Dunne, E., Duplissy, J., Ehrhart, S., Flagan, R. C., Franchin, A., Guida, R., Hakala, J., Hansel, A., Heinritzi, M., Henschel, H., Jokinen, T., Junninen, H., Kajos, M., Kangasluoma, J., Keskinen, H., Kupc, A., Kurten, T., Kvashin, A. N., Laaksonen, A., Lehtipalo, K., Leiminger, M., Leppa, J., Loukonen, V., Makhmutov, V., Mathot, S., McGrath, M. J., Nieminen, T., Olenius, T., Onnela, A., Petaja, T., Riccobono, F., Riipinen, I., Rissanen, M., Rondo, L., Ruuskanen, T., Santos, F. D., Sarnela, N., Schallhart, S., Schnitzhofer, R., Seinfeld, J. H., Simon, M., Sipila, M., Stozhkov, Y., Stratmann, F., Tome, A., Trostl, J., Tsagkogeorgas, G., Vaattovaara, P., Viisanen, Y., Virtanen, A., Vrtala, A., Wagner, P. E., Weingartner, E., Wex, H., Williamson, C., Wimmer, D., Ye, P., Yli-Juuti, T., Carslaw, K. S., Kulmala, M., Curtius, J., Baltensperger, U., Worsnop, D. R., Vehkamaki, H., and Kirkby, J.: Molecular understanding of sulphuric acid-amine particle nucleation in the atmosphere, Nature, 502, 359–363, 2013.
Atkinson, R. and Arey, J.: Gas-phase tropospheric chemistry of biogenic volatile organic compounds: a review, Atmos. Environ., 37, Supplement 2, 197–219, https://doi.org/10.1016/S1352-2310(03)00391-1, 2003.
Aumont, B., Valorso, R., Mouchel-Vallon, C., Camredon, M., Lee-Taylor, J., and Madronich, S.: Modeling SOA formation from the oxidation of intermediate volatility n-alkanes, Atmos. Chem. Phys., 12, 7577–7589, https://doi.org/10.5194/acp-12-7577-2012, 2012.
Aydin, Y. M., Yaman, B., Koca, H., Altiok, H., Dumanoglu, Y., Kara, M., Bayram, A., Tolunay, D., Odabasi, M., and Elbir, T.: Comparison of biogenic volatile organic compound emissions from broad leaved and coniferous trees in Turkey, WIT Trans. Ecol. Envir., 181, 647–658, 2014a.
Aydin, Y. M., Yaman, B., Koca, H., Dasdemir, O., Kara, M., Altiok, H., Dumanoglu, Y., Bayram, A., Tolunay, D., Odabasi, M., and Elbir, T.: Biogenic volatile organic compound (BVOC) emissions from forested areas in Turkey: Determination of specific emission rates for thirty-one tree species, Sci. Total Environ., 490, 239–253, https://doi.org/10.1016/j.scitotenv.2014.04.132, 2014b.
Birmili, W., Berresheim, H., Plass-Dülmer, C., Elste, T., Gilge, S., Wiedensohler, A., and Uhrner, U.: The Hohenpeissenberg aerosol formation experiment (HAFEX): a long-term study including size-resolved aerosol, H2SO4, OH, and monoterpenes measurements, Atmos. Chem. Phys., 3, 361–376, https://doi.org/10.5194/acp-3-361-2003, 2003.
Blake, R. S., Monks, P. S., and Ellis, A. M.: Proton-Transfer Reaction Mass Spectrometry, Chem. Rev., 109, 861–896, https://doi.org/10.1021/cr800364q, 2009.
Bonn, B., Bourtsoukidis, E., Sun, T. S., Bingemer, H., Rondo, L., Javed, U., Li, J., Axinte, R., Li, X., Brauers, T., Sonderfeld, H., Koppmann, R., Sogachev, A., Jacobi, S., and Spracklen, D. V.: The link between atmospheric radicals and newly formed particles at a spruce forest site in Germany, Atmos. Chem. Phys., 14, 10823–10843, https://doi.org/10.5194/acp-14-10823-2014, 2014.
Bouvier-Brown, N. C., Goldstein, A. H., Gilman, J. B., Kuster, W. C., and de Gouw, J. A.: In-situ ambient quantification of monoterpenes, sesquiterpenes, and related oxygenated compounds during BEARPEX 2007: implications for gas- and particle-phase chemistry, Atmos. Chem. Phys., 9, 5505–5518, https://doi.org/10.5194/acp-9-5505-2009, 2009.
Boy, M. and Kulmala, M.: Nucleation events in the continental boundary layer: Influence of physical and meteorological parameters, Atmos. Chem. Phys., 2, 1–16, https://doi.org/10.5194/acp-2-1-2002, 2002.
Boy, M., Rannik, Ü., Lehtinen, K. E. J., Tarvainen, V., Hakola, H., and Kulmala, M.: Nucleation events in the continental boundary layer: Long-term statistical analyses of aerosol relevant characteristics, J. Geophys. Res., 108, 4667, https://doi.org/10.1029/2003JD003838, 2003.
Carlton, A. G., Pinder, R. W., Bhave, P. V., and Pouliot, G. A.: To What Extent Can Biogenic SOA be Controlled?, Environ. Sci. Technol., 44, 3376–3380, https://doi.org/10.1021/es903506b, 2010.
Cavalli, F., Facchini, M. C., Decesari, S., Emblico, L., Mircea, M., Jensen, N. R., and Fuzzi, S.: Size-segregated aerosol chemical composition at a boreal site in southern Finland, during the QUEST project, Atmos. Chem. Phys., 6, 993–1002, https://doi.org/10.5194/acp-6-993-2006, 2006.
Cerqueira, M. A., Pio, C. A., Gomes, P. A., Matos, J. S., and Nunes, T. V.: Volatile organic compounds in rural atmospheres of central Portugal, Sci. Total Environ., 313, 49–60, https://doi.org/10.1016/S0048-9697(03)00250-X, 2003.
Cusack, M., Alastuey, A., and Querol, X.: Case studies of new particle formation and evaporation processes in the western Mediterranean regional background, Atmos. Environ., 81, 651–659, https://doi.org/10.1016/j.atmosenv.2013.09.025, 2013.
Dal Maso, M., Kulmala, M., Riipinen, I., Wagner, R., Hussein, T., Aalto, P. P., and Lehtinen, K. E.: Formation and growth of fresh atmospheric aerosols: eight years of aerosol size distribution data from SMEAR II, Hyytiala, Finland, Boreal Environ. Res., 10, 323–336, 2005.
Davison, B., Taipale, R., Langford, B., Misztal, P., Fares, S., Matteucci, G., Loreto, F., Cape, J. N., Rinne, J., and Hewitt, C. N.: Concentrations and fluxes of biogenic volatile organic compounds above a Mediterranean macchia ecosystem in western Italy, Biogeosciences, 6, 1655–1670, https://doi.org/10.5194/bg-6-1655-2009, 2009.
Debevec, C., Sauvage, S., Gros, V., Sciare, J., Pikridas, M., Stavroulas, I., Salameh, T., Leonardis, T., Gaudion, V., Depelchin, L., Fronval, I., Sarda-Esteve, R., Baisnée, D., Bonsang, B., Savvides, C., Vrekoussis, M., and Locoge, N.: Origin and variability in volatile organic compounds observed at an Eastern Mediterranean background site (Cyprus), Atmos. Chem. Phys., 17, 11355–11388, https://doi.org/10.5194/acp-17-11355-2017, 2017.
de Gouw, J. and Warneke, C.: Measurements of volatile organic compounds in the earth's atmosphere using proton-transfer-reaction mass spectrometry, Mass Spectrom. Rev., 26, 223–257, https://doi.org/10.1002/mas.20119, 2007.
Detournay, A.: Etude de COV oxygénés et biogéniques en milieu rural: du développement métrologique à l'évaluation de l'impact sur la chimie atmosphérique, Thèse de doctorat, Ecole des mines de Douai et Université Lille 1, available at: http://www.theses.fr/2011LIL10139 (last access: 24 August 2016), 2011.
Detournay, A., Sauvage, S., Locoge, N., Gaudion, V., Leonardis, T., Fronval, I., Kaluzny, P., and Galloo, J.-C.: Development of a sampling method for the simultaneous monitoring of straight-chain alkanes, straight-chain saturated carbonyl compounds and monoterpenes in remote areas, J. Environ. Monitor., 13, 983–990, https://doi.org/10.1039/C0EM00354A, 2011.
Detournay, A., Sauvage, S., Riffault, V., Wroblewski, A., and Locoge, N.: Source and behavior of isoprenoid compounds at a southern France remote site, Atmos. Environ., 77, 272–282, https://doi.org/10.1016/j.atmosenv.2013.03.041, 2013.
Doche, C., Dufour, G., Foret, G., Eremenko, M., Cuesta, J., Beekmann, M., and Kalabokas, P.: Summertime tropospheric-ozone variability over the Mediterranean basin observed with IASI, Atmos. Chem. Phys., 14, 10589–10600, https://doi.org/10.5194/acp-14-10589-2014, 2014.
Dulac, F.: An overview of the Chemistry-Aerosol Mediterranean Experiment (ChArMEx), EGU General Assembly, Vienna, Austria, 27 April–2 May 2014, EGU2014-11441, 2014.
Fall, P. L.: Modern vegetation, pollen and climate relationships on the Mediterranean island of Cyprus, Rev. Palaeobot. Palyno., 185, 79–92, https://doi.org/10.1016/j.revpalbo.2012.08.002, 2012.
Flores, J. M., Zhao, D. F., Segev, L., Schlag, P., Kiendler-Scharr, A., Fuchs, H., Watne, Å. K., Bluvshtein, N., Mentel, Th. F., Hallquist, M., and Rudich, Y.: Evolution of the complex refractive index in the UV spectral region in ageing secondary organic aerosol, Atmos. Chem. Phys., 14, 5793–5806, https://doi.org/10.5194/acp-14-5793-2014, 2014.
Fuentes, J. D., Gu, L., Lerdau, M., Atkinson, R., Baldocchi, D., Bottenheim, J. W., Ciccioli, P., Lamb, B., Geron, C., Guenther, A., Sharkey, T. D., and Stockwell, W.: Biogenic Hydrocarbons in the Atmospheric Boundary Layer: A Review, B. Am. Meteorol. Soc., 81, 1537–1575, https://doi.org/10.1175/1520-0477(2000)081<1537:BHITAB>2.3.CO;2, 2000.
Fuzzi, S., Andreae, M. O., Huebert, B. J., Kulmala, M., Bond, T. C., Boy, M., Doherty, S. J., Guenther, A., Kanakidou, M., Kawamura, K., Kerminen, V.-M., Lohmann, U., Russell, L. M., and Pöschl, U.: Critical assessment of the current state of scientific knowledge, terminology, and research needs concerning the role of organic aerosols in the atmosphere, climate, and global change, Atmos. Chem. Phys., 6, 2017–2038, https://doi.org/10.5194/acp-6-2017-2006, 2006.
Galbally, I. E. and Kirstine, W.: The Production of Methanol by Flowering Plants and the Global Cycle of Methanol, J. Atmos. Chem., 43, 195–229, https://doi.org/10.1023/A:1020684815474, 2002.
Galvin, J. F. P.: Nocturnal mountain winds in Cyprus – an observational study, Meteorol. Appl., 22, 348–359, https://doi.org/10.1002/met.1460, 2014.
Gelencsér, A., May, B., Simpson, D., Sánchez-Ochoa, A., Kasper-Giebl, A., Puxbaum, H., Caseiro, A., Pio, C., and Legrand, M.: Source apportionment of PM2.5 organic aerosol over Europe: Primary/secondary, natural/anthropogenic, and fossil/biogenic origin, J. Geophys. Res., 112, D23S04, https://doi.org/10.1029/2006JD008094, 2007.
Geron, C., Rasmussen, R., Arnts, R. R., and Guenther, A.: A review and synthesis of monoterpene speciation from forests in the United States, Atmos. Environ., 34, 1761–1781, https://doi.org/10.1016/S1352-2310(99)00364-7, 2000a.
Geron, C., Guenther, A., Sharkey, T., and Arnts, R. R.: Temporal variability in basal isoprene emission factor, Tree Physiol., 20, 799–805, 2000b.
Giorgi, F.: Climate change hot-spots, Geophys. Res. Lett., 33, L08707, https://doi.org/10.1029/2006GL025734, 2006.
Gros, V., Sciare, J., and Yu, T.: Air-quality measurements in megacities: Focus on gaseous organic and particulate pollutants and comparison between two contrasted cities, Paris and Beijing, C. R. Geosci., 339, 764–774, https://doi.org/10.1016/j.crte.2007.08.007, 2011.
Guenther, A., Geron, C., Pierce, T., Lamb, B., Harley, P., and Fall, R.: Natural emissions of non-methane volatile organic compounds, carbon monoxide, and oxides of nitrogen from North America, Atmos. Environ., 34, 2205–2230, https://doi.org/10.1016/S1352-2310(99)00465-3, 2000.
Guenther, A., Karl, T., Harley, P., Wiedinmyer, C., Palmer, P. I., and Geron, C.: Estimates of global terrestrial isoprene emissions using MEGAN (Model of Emissions of Gases and Aerosols from Nature), Atmos. Chem. Phys., 6, 3181–3210, https://doi.org/10.5194/acp-6-3181-2006, 2006.
Guo, H., Ding, A., Morawska, L., He, C., Ayoko, G., Li, Y., and Hung, W.: Size distribution and new particle formation in subtropical eastern Australia, Environ. Chem., 5, 382–390, 2008.
Guo, H., Wang, D. W., Cheung, K., Ling, Z. H., Chan, C. K., and Yao, X. H.: Observation of aerosol size distribution and new particle formation at a mountain site in subtropical Hong Kong, Atmos. Chem. Phys., 12, 9923–9939, https://doi.org/10.5194/acp-12-9923-2012, 2012.
Hakola, H., Laurila, T., Rinne, J., and Puhto, K.: The ambient concentrations of biogenic hydrocarbons at a northern European, boreal site, Atmos. Environ., 34, 4971–4982, https://doi.org/10.1016/S1352-2310(00)00192-8, 2000.
Hakola, H., Hellén, H., Hemmilä, M., Rinne, J., and Kulmala, M.: In situ measurements of volatile organic compounds in a boreal forest, Atmos. Chem. Phys., 12, 11665–11678, https://doi.org/10.5194/acp-12-11665-2012, 2012.
Hamed, A., Joutsensaari, J., Mikkonen, S., Sogacheva, L., Dal Maso, M., Kulmala, M., Cavalli, F., Fuzzi, S., Facchini, M. C., Decesari, S., Mircea, M., Lehtinen, K. E. J., and Laaksonen, A.: Nucleation and growth of new particles in Po Valley, Italy, Atmos. Chem. Phys., 7, 355–376, https://doi.org/10.5194/acp-7-355-2007, 2007.
Hamed, A., Korhonen, H., Sihto, S.-L., Joutsensaari, J., Järvinen, H., Petäjä, T., Arnold, F., Nieminen, T., Kulmala, M., Smith, J. N., Lehtinen, K. E. J., and Laaksonen, A.: The role of relative humidity in continental new particle formation, J. Geophys. Res., 116, D03202, https://doi.org/10.1029/2010JD014186, 2011.
Harley, P., Fridd-Stroud, V., Guenther, A., and Vasconcellos, P.: Emission of 2-methyl-3-buten-2-ol by pines: A potentially large natural source of reactive carbon to the atmosphere, J. Geophys. Res., 103, 25479–25486, https://doi.org/10.1029/98JD00820, 1998.
Harley, P., Greenberg, J., Niinemets, Ü., and Guenther, A.: Environmental controls over methanol emission from leaves, Biogeosciences, 4, 1083–1099, https://doi.org/10.5194/bg-4-1083-2007, 2007.
Harrison, D., Hunter, M. C., Lewis, A. C., Seakins, P. W., Nunes, T. V., and Pio, C. A.: Isoprene and monoterpene emission from the coniferous species Abies Borisii-regis–implications for regional air chemistry in Greece, Atmos. Environ., 35, 4687–4698, https://doi.org/10.1016/S1352-2310(01)00092-9, 2001.
Harrison, R. M., Grenfell, J. L., Savage, N., Allen, A., Clemitshaw, K., Penkett, S., Hewitt, C. N. and Davison, B.: Observations of new particle production in the atmosphere of a moderately polluted site in eastern England, J. Geophys. Res., 105, 17819–17832, https://doi.org/10.1029/2000JD900086, 2000.
Hellén, H., Praplan, A. P., Tykkä, T., Ylivinkka, I., Vakkari, V., Bäck, J., Petäjä, T., Kulmala, M., and Hakola, H.: Sesquiterpenes identified as key species for atmospheric chemistry in boreal forest by terpenoid and OVOC measurements, Atmos. Chem. Phys. Discuss., https://doi.org/10.5194/acp-2018-399, in review, 2018.
Helmig, D.: Air analysis by gas chromatography, J. Chromatogr. A, 843, 129–146, https://doi.org/10.1016/S0021-9673(99)00173-9, 1999.
Helmig, D., Ortega, J., Guenther, A., Herrick, J. D., and Geron, C.: Sesquiterpene emissions from loblolly pine and their potential contribution to biogenic aerosol formation in the Southeastern US, Atmos. Environ., 40, 4150–4157, https://doi.org/10.1016/j.atmosenv.2006.02.035, 2006.
Helmig, D., Daly, R. W., Milford, J., and Guenther, A.: Seasonal trends of biogenic terpene emissions, Chemosphere, 93, 35–46, https://doi.org/10.1016/j.chemosphere.2013.04.058, 2013.
Hirsikko, A., Laakso, L., Hõrrak, U., Aalto, P. P., Kerminen, V., and Kulmala, M.: Annual and size dependent variation of growth rates and ion concentrations in boreal forest, Boreal Environ. Res., 10, 357–369, 2005.
Hirsikko, A., Bergman, T., Laakso, L., Dal Maso, M., Riipinen, I., Hõrrak, U., and Kulmala, M.: Identification and classification of the formation of intermediate ions measured in boreal forest, Atmos. Chem. Phys., 7, 201–210, https://doi.org/10.5194/acp-7-201-2007, 2007.
Hoyle, C. R., Boy, M., Donahue, N. M., Fry, J. L., Glasius, M., Guenther, A., Hallar, A. G., Huff Hartz, K., Petters, M. D., Petäjä, T., Rosenoern, T., and Sullivan, A. P.: A review of the anthropogenic influence on biogenic secondary organic aerosol, Atmos. Chem. Phys., 11, 321–343, https://doi.org/10.5194/acp-11-321-2011, 2011.
Hüve, K., Christ, M., Kleist, E., Uerlings, R., Niinemets, Ü., Walter, A., and Wildt, J.: Simultaneous growth and emission measurements demonstrate an interactive control of methanol release by leaf expansion and stomata, J. Exp. Bot., 58, 1783–1793, https://doi.org/10.1093/jxb/erm038, 2007.
Jacob, D. J., Field, B. D., Li, Q., Blake, D. R., de Gouw, J., Warneke, C., Hansel, A., Wisthaler, A., Singh, H. B., and Guenther, A.: Global budget of methanol: Constraints from atmospheric observations, J. Geophys. Res., 110, D08303, https://doi.org/10.1029/2004JD005172, 2005.
Janson, R.: Monoterpene concentrations in and above a forest of scots pine, J. Atmos. Chem., 14, 385–394, https://doi.org/10.1007/BF00115246, 1992.
Janson, R. W.: Monoterpene emissions from Scots pine and Norwegian spruce, J. Geophys. Res., 98, 2839–2850, https://doi.org/10.1029/92JD02394, 1993.
Jardine, K., Harley, P., Karl, T., Guenther, A., Lerdau, M., and Mak, J. E.: Plant physiological and environmental controls over the exchange of acetaldehyde between forest canopies and the atmosphere, Biogeosciences, 5, 1559–1572, https://doi.org/10.5194/bg-5-1559-2008, 2008.
Jimenez, J. L., Canagaratna, M. R., Donahue, N. M., Prevot, A. S. H., Zhang, Q., Kroll, J. H., DeCarlo, P. F., Allan, J. D., Coe, H., Ng, N. L., Aiken, A. C., Docherty, K. S., Ulbrich, I. M., Grieshop, A. P., Robinson, A. L., Duplissy, J., Smith, J. D., Wilson, K. R., Lanz, V. A., Hueglin, C., Sun, Y. L., Tian, J., Laaksonen, A., Raatikainen, T., Rautiainen, J., Vaattovaara, P., Ehn, M., Kulmala, M., Tomlinson, J. M., Collins, D. R., Cubison, M. J., Dunlea, J., Huffman, J. A., Onasch, T. B., Alfarra, M. R., Williams, P. I., Bower, K., Kondo, Y., Schneider, J., Drewnick, F., Borrmann, S., Weimer, S., Demerjian, K., Salcedo, D., Cottrell, L., Griffin, R., Takami, A., Miyoshi, T., Hatakeyama, S., Shimono, A., Sun, J. Y., Zhang, Y. M., Dzepina, K., Kimmel, J. R., Sueper, D., Jayne, J. T., Herndon, S. C., Trimborn, A. M., Williams, L. R., Wood, E. C., Middlebrook, A. M., Kolb, C. E., Baltensperger, U., and Worsnop, D. R.: Evolution of Organic Aerosols in the Atmosphere, Science, 326, 1525, https://doi.org/10.1126/science.1180353, 2009.
Kalabokas, P., Bartzis, J. G., Bomboi, T., Ciccioli, P., Cieslik, S., Dlugi, R., Foster, P., Kotzias, D., and Steinbrecher, R.: BEMA: A European Commision Project on Biogenic Emmissions in the Mediterranean AreaAmbient atmospheric trace gas concentrations and meteorological parameters during the first BEMA measuring campaign on May 1994 at Castelporziano, Italy, Atmos. Environ., 31, 67–77, https://doi.org/10.1016/S1352-2310(97)00075-7, 1997.
Kalogridis, A.-C.: Caractérisation des composées organiques volatils en région méditerranéenne, Thèse de doctorat, Université Paris Sud – Paris XI, 2014.
Kalogridis, C., Gros, V., Sarda-Esteve, R., Langford, B., Loubet, B., Bonsang, B., Bonnaire, N., Nemitz, E., Genard, A.-C., Boissard, C., Fernandez, C., Ormeño, E., Baisnée, D., Reiter, I., and Lathière, J.: Concentrations and fluxes of isoprene and oxygenated VOCs at a French Mediterranean oak forest, Atmos. Chem. Phys., 14, 10085–10102, https://doi.org/10.5194/acp-14-10085-2014, 2014.
Kanakidou, M., Tsigaridis, K., Dentener, F. J., and Crutzen, P. J.: Human-activity-enhanced formation of organic aerosols by biogenic hydrocarbon oxidation, J. Geophys. Res., 105, 9243–9354, https://doi.org/10.1029/1999JD901148, 2000.
Kanakidou, M., Seinfeld, J. H., Pandis, S. N., Barnes, I., Dentener, F. J., Facchini, M. C., Van Dingenen, R., Ervens, B., Nenes, A., Nielsen, C. J., Swietlicki, E., Putaud, J. P., Balkanski, Y., Fuzzi, S., Horth, J., Moortgat, G. K., Winterhalter, R., Myhre, C. E. L., Tsigaridis, K., Vignati, E., Stephanou, E. G., and Wilson, J.: Organic aerosol and global climate modelling: a review, Atmos. Chem. Phys., 5, 1053–1123, https://doi.org/10.5194/acp-5-1053-2005, 2005.
Kanawade, V. P., Jobson, B. T., Guenther, A. B., Erupe, M. E., Pressley, S. N., Tripathi, S. N., and Lee, S.-H.: Isoprene suppression of new particle formation in a mixed deciduous forest, Atmos. Chem. Phys., 11, 6013–6027, https://doi.org/10.5194/acp-11-6013-2011, 2011.
Karl, T., Guenther, A., Jordan, A., Fall, R., and Lindinger, W.: Eddy covariance measurement of biogenic oxygenated VOC emissions from hay harvesting, Atmos. Environ., 35, 491–495, https://doi.org/10.1016/S1352-2310(00)00405-2, 2001.
Karl, T., Jobson, T., Kuster, W. C., Williams, E., Stutz, J., Shetter, R., Hall, S. R., Goldan, P., Fehsenfeld, F., and Lindinger, W.: Use of proton-transfer-reaction mass spectrometry to characterize volatile organic compound sources at the La Porte super site during the Texas Air Quality Study 2000, J. Geophys. Res., 108, 4508, https://doi.org/10.1029/2002JD003333, 2003.
Karl, T., Potosnak, M., Guenther, A., Clark, D., Walker, J., Herrick, J. D., and Geron, C.: Exchange processes of volatile organic compounds above a tropical rain forest: Implications for modeling tropospheric chemistry above dense vegetation, J. Geophys. Res., 109, D18306, https://doi.org/10.1029/2004JD004738, 2004.
Karl, T., Hansel, A., Cappellin, L., Kaser, L., Herdlinger-Blatt, I., and Jud, W.: Selective measurements of isoprene and 2-methyl-3-buten-2-ol based on NO+ ionization mass spectrometry, Atmos. Chem. Phys., 12, 11877–11884, https://doi.org/10.5194/acp-12-11877-2012, 2012.
Kiendler-Scharr, A., Wildt, J., Maso, M. D., Hohaus, T., Kleist, E., Mentel, T. F., Tillmann, R., Uerlings, R., Schurr, U., and Wahner, A.: New particle formation in forests inhibited by isoprene emissions, Nature, 461, 381–384, https://doi.org/10.1038/nature08292, 2009.
Kim, S., Karl, T., Guenther, A., Tyndall, G., Orlando, J., Harley, P., Rasmussen, R., and Apel, E.: Emissions and ambient distributions of Biogenic Volatile Organic Compounds (BVOC) in a ponderosa pine ecosystem: interpretation of PTR-MS mass spectra, Atmos. Chem. Phys., 10, 1759–1771, https://doi.org/10.5194/acp-10-1759-2010, 2010.
Kirkby, J., Curtius, J., Almeida, J., Dunne, E., Duplissy, J., Ehrhart, S., Franchin, A., Gagne, S., Ickes, L., Kurten, A., Kupc, A., Metzger, A., Riccobono, F., Rondo, L., Schobesberger, S., Tsagkogeorgas, G., Wimmer, D., Amorim, A., Bianchi, F., Breitenlechner, M., David, A., Dommen, J., Downard, A., Ehn, M., Flagan, R. C., Haider, S., Hansel, A., Hauser, D., Jud, W., Junninen, H., Kreissl, F., Kvashin, A., Laaksonen, A., Lehtipalo, K., Lima, J., Lovejoy, E. R., Makhmutov, V., Mathot, S., Mikkila, J., Minginette, P., Mogo, S., Nieminen, T., Onnela, A., Pereira, P., Petaja, T., Schnitzhofer, R., Seinfeld, J. H., Sipila, M., Stozhkov, Y., Stratmann, F., Tome, A., Vanhanen, J., Viisanen, Y., Vrtala, A., Wagner, P. E., Walther, H., Weingartner, E., Wex, H., Winkler, P. M., Carslaw, K. S., Worsnop, D. R., Baltensperger, U., and Kulmala, M.: Role of sulphuric acid, ammonia and galactic cosmic rays in atmospheric aerosol nucleation, Nature, 476, 429–433, https://doi.org/10.1038/nature10343, 2011.
Kirkby, J., Duplissy, J., Sengupta, K., Frege, C., Gordon, H., Williamson, C., Heinritzi, M., Simon, M., Yan, C., Almeida, J., Tröstl, J., Nieminen, T., Ortega, I. K., Wagner, R., Adamov, A., Amorim, A., Bernhammer, A.-K., Bianchi, F., Breitenlechner, M., Brilke, S., Chen, X., Craven, J., Dias, A., Ehrhart, S., Flagan, R. C., Franchin, A., Fuchs, C., Guida, R., Hakala, J., Hoyle, C. R., Jokinen, T., Junninen, H., Kangasluoma, J., Kim, J., Krapf, M., Kürten, A., Laaksonen, A., Lehtipalo, K., Makhmutov, V., Mathot, S., Molteni, U., Onnela, A., Peräkylä, O., Piel, F., Petäjä, T., Praplan, A. P., Pringle, K., Rap, A., Richards, N. A. D., Riipinen, I., Rissanen, M. P., Rondo, L., Sarnela, N., Schobesberger, S., Scott, C. E., Seinfeld, J. H., Sipilä, M., Steiner, G., Stozhkov, Y., Stratmann, F., Tomé, A., Virtanen, A., Vogel, A. L., Wagner, A. C., Wagner, P. E., Weingartner, E., Wimmer, D., Winkler, P. M., Ye, P., Zhang, X., Hansel, A., Dommen, J., Donahue, N. M., Worsnop, D. R., Baltensperger, U., Kulmala, M., Carslaw, K. S., and Curtius, J.: Ion-induced nucleation of pure biogenic particles, Nature, 533, 521–526, 2016.
Kleanthous, S., Vrekoussis, M., Mihalopoulos, N., Kalabokas, P., and Lelieveld, J.: On the temporal and spatial variation of ozone in Cyprus, Sci. Total Environ., 476–477, 677–687, https://doi.org/10.1016/j.scitotenv.2013.12.101, 2014.
Kontkanen, J., Lehtipalo, K., Ahonen, L., Kangasluoma, J., Manninen, H. E., Hakala, J., Rose, C., Sellegri, K., Xiao, S., Wang, L., Qi, X., Nie, W., Ding, A., Yu, H., Lee, S., Kerminen, V.-M., Petäjä, T., and Kulmala, M.: Measurements of sub-3 nm particles using a particle size magnifier in different environments: from clean mountain top to polluted megacities, Atmos. Chem. Phys., 17, 2163–2187, https://doi.org/10.5194/acp-17-2163-2017, 2017.
Kopf, S.: Development and Climate Change - world development report 2010, The World Bank, available at: https://books.google.fr/books?id=MGOJs900Q-MC&pg=PA96&lpg=PA96&dq=Kopf+climate+mediterranean&source=bl&ots=rJy83JO8aC&sig=lHzJjdjXpsfb71vxWI-yA7DhLCY&hl=fr&sa=X&ei=S11KVYy1CYGxUoKIgPgK&ved=0CCoQ6AEwAA#v=onepage&q=Kopf climate mediterranean&f=false (last access: 12 May 2015), 2010.
Kroll, J. H. and Seinfeld, J. H.: Chemistry of secondary organic aerosol: Formation and evolution of low-volatility organics in the atmosphere, Atmos. Environ., 42, 3593–3624, https://doi.org/10.1016/j.atmosenv.2008.01.003, 2008.
Kulmala, M. and Kerminen, V.-M.: On the formation and growth of atmospheric nanoparticles, Atmos. Res., 90, 132–150, https://doi.org/10.1016/j.atmosres.2008.01.005, 2008.
Kulmala, M., Maso, M. D., Mäkelä, J. M., Pirjola, L., Väkevä, M., Aalto, P., Miikkulainen, P., Hämeri, K., and O'Dowd, C. D.: On the formation, growth and composition of nucleation mode particles, Tellus B, 53, 479–490, https://doi.org/10.1034/j.1600-0889.2001.530411.x, 2001.
Kulmala, M., Vehkamäki, H., Petäjä, T., Dal Maso, M., Lauri, A., Kerminen, V.-M., Birmili, W., and McMurry, P. H.: Formation and growth rates of ultrafine atmospheric particles: a review of observations, J. Aerosol Sci., 35, 143–176, https://doi.org/10.1016/j.jaerosci.2003.10.003, 2004.
Kulmala, M., Petäjä, T., Mönkkönen, P., Koponen, I. K., Dal Maso, M., Aalto, P. P., Lehtinen, K. E. J., and Kerminen, V.-M.: On the growth of nucleation mode particles: source rates of condensable vapor in polluted and clean environments, Atmos. Chem. Phys., 5, 409–416, https://doi.org/10.5194/acp-5-409-2005, 2005.
Kulmala, M., Petäjä, T., Nieminen, T., Sipilä, M., Manninen, H. E., Lehtipalo, K., Dal Maso, M., Aalto, P. P., Junninen, H., Paasonen, P., Riipinen, I., Lehtinen, K. E. J., Laaksonen, A., and Kerminen, V.-M.: Measurement of the nucleation of atmospheric aerosol particles, Nat. Protoc., 7, 1651–1667, https://doi.org/10.1038/nprot.2012.091, 2012.
Kulmala, M., Kontkanen, J., Junninen, H., Lehtipalo, K., Manninen, H. E., Nieminen, T., Petäjä, T., Sipilä, M., Schobesberger, S., Rantala, P., Franchin, A., Jokinen, T., Järvinen, E., Äijälä, M., Kangasluoma, J., Hakala, J., Aalto, P. P., Paasonen, P., Mikkilä, J., Vanhanen, J., Aalto, J., Hakola, H., Makkonen, U., Ruuskanen, T., Mauldin, R. L., Duplissy, J., Vehkamäki, H., Bäck, J., Kortelainen, A., Riipinen, I., Kurtén, T., Johnston, M. V., Smith, J. N., Ehn, M., Mentel, T. F., Lehtinen, K. E. J., Laaksonen, A., Kerminen, V.-M., and Worsnop, D. R.: Direct Observations of Atmospheric Aerosol Nucleation, Science, 339, 943, https://doi.org/10.1126/science.1227385, 2013.
Kürten, A., Bergen, A., Heinritzi, M., Leiminger, M., Lorenz, V., Piel, F., Simon, M., Sitals, R., Wagner, A. C., and Curtius, J.: Observation of new particle formation and measurement of sulfuric acid, ammonia, amines and highly oxidized organic molecules at a rural site in central Germany, Atmos. Chem. Phys., 16, 12793–12813, https://doi.org/10.5194/acp-16-12793-2016, 2016.
Lamb, B., Westberg, H., Allwine, G., and Quarles, T.: Biogenic hydrocarbon emissions from deciduous and coniferous trees in the United States, J. Geophys. Res., 90, 2380–2390, https://doi.org/10.1029/JD090iD01p02380, 1985.
Laothawornkitkul, J., Taylor, J. E., Paul, N. D., and Hewitt, C. N.: Biogenic volatile organic compounds in the Earth system, New Phytol., 183, 27–51, https://doi.org/10.1111/j.1469-8137.2009.02859.x, 2009.
Lelieveld, J., Hadjinicolaou, P., Kostopoulou, E., Giannakopoulos, C., Pozzer, A., Tanarhte, M., and Tyrlis, E.: Model projected heat extremes and air pollution in the eastern Mediterranean and Middle East in the twenty-first century, Reg. Environ. Change, 14, 1937–1949, https://doi.org/10.1007/s10113-013-0444-4, 2014.
Liakakou, E., Vrekoussis, M., Bonsang, B., Donousis, C., Kanakidou, M., and Mihalopoulos, N.: Isoprene above the Eastern Mediterranean: Seasonal variation and contribution to the oxidation capacity of the atmosphere, Atmos. Environ., 41, 1002–1010, https://doi.org/10.1016/j.atmosenv.2006.09.034, 2007.
Lindinger, W., Hansel, A., and Jordan, A.: On-line monitoring of volatile organic compounds at pptv levels by means of proton-transfer-reaction mass spectrometry (PTR-MS) medical applications, food control and environmental research, Int. J. Mass Spectrom., 173, 191–241, https://doi.org/10.1016/S0168-1176(97)00281-4, 1998.
Llusia, J., Peñuelas, J., Seco, R., and Filella, I.: Seasonal changes in the daily emission rates of terpenes by Quercus ilex and the atmospheric concentrations of terpenes in the natural park of Montseny, NE Spain, J. Atmos. Chem., 69, 215–230, https://doi.org/10.1007/s10874-012-9238-1, 2012.
Loreto, F. and Schnitzler, J.-P.: Abiotic stresses and induced BVOCs, Trends Plant Sci., 15, 154–166, https://doi.org/10.1016/j.tplants.2009.12.006, 2010.
Manninen, H. E., Franchin, A., Schobesberger, S., Hirsikko, A., Hakala, J., Skromulis, A., Kangasluoma, J., Ehn, M., Junninen, H., Mirme, A., Mirme, S., Sipilä, M., Petäjä, T., Worsnop, D. R., and Kulmala, M.: Characterisation of corona-generated ions used in a Neutral cluster and Air Ion Spectrometer (NAIS), Atmos. Meas. Tech., 4, 2767–2776, https://doi.org/10.5194/amt-4-2767-2011, 2011.
Menut, L., Rea, G., Mailler, S., Khvorostyanov, D., and Turquety, S.: Aerosol forecast over the Mediterranean area during July 2013 (ADRIMED/CHARMEX), Atmos. Chem. Phys., 15, 7897–7911, https://doi.org/10.5194/acp-15-7897-2015, 2015.
Michoud, V., Sciare, J., Sauvage, S., Dusanter, S., Léonardis, T., Gros, V., Kalogridis, C., Zannoni, N., Féron, A., Petit, J.-E., Crenn, V., Baisnée, D., Sarda-Estève, R., Bonnaire, N., Marchand, N., DeWitt, H. L., Pey, J., Colomb, A., Gheusi, F., Szidat, S., Stavroulas, I., Borbon, A., and Locoge, N.: Organic carbon at a remote site of the western Mediterranean Basin: sources and chemistry during the ChArMEx SOP2 field experiment, Atmos. Chem. Phys., 17, 8837–8865, https://doi.org/10.5194/acp-17-8837-2017, 2017.
Mikkonen, S., Romakkaniemi, S., Smith, J. N., Korhonen, H., Petäjä, T., Plass-Duelmer, C., Boy, M., McMurry, P. H., Lehtinen, K. E. J., Joutsensaari, J., Hamed, A., Mauldin III, R. L., Birmili, W., Spindler, G., Arnold, F., Kulmala, M., and Laaksonen, A.: A statistical proxy for sulphuric acid concentration, Atmos. Chem. Phys., 11, 11319–11334, https://doi.org/10.5194/acp-11-11319-2011, 2011.
Millet, D. B., Guenther, A., Siegel, D. A., Nelson, N. B., Singh, H. B., de Gouw, J. A., Warneke, C., Williams, J., Eerdekens, G., Sinha, V., Karl, T., Flocke, F., Apel, E., Riemer, D. D., Palmer, P. I., and Barkley, M.: Global atmospheric budget of acetaldehyde: 3-D model analysis and constraints from in-situ and satellite observations, Atmos. Chem. Phys., 10, 3405–3425, https://doi.org/10.5194/acp-10-3405-2010, 2010.
Mirme, A., Tamm, E., Mordas, G., Vana, M., Uin, J., Mirme, S., Bernotas, T., Laakso, L., Hirsikko, A., and Kulmala, M.: A wide-range multi-channel Air lon Spectrometer, Boreal Environ. Res., 12, 247–264, 2007.
Mirme, S. and Mirme, A.: The mathematical principles and design of the NAIS – a spectrometer for the measurement of cluster ion and nanometer aerosol size distributions, Atmos. Meas. Tech., 6, 1061–1071, https://doi.org/10.5194/amt-6-1061-2013, 2013.
Misztal, P. K., Nemitz, E., Langford, B., Di Marco, C. F., Phillips, G. J., Hewitt, C. N., MacKenzie, A. R., Owen, S. M., Fowler, D., Heal, M. R., and Cape, J. N.: Direct ecosystem fluxes of volatile organic compounds from oil palms in South-East Asia, Atmos. Chem. Phys., 11, 8995–9017, https://doi.org/10.5194/acp-11-8995-2011, 2011.
Moschonas, N. and Glavas, S.: Non-methane hydrocarbons at a high-altitude rural site in the Mediterranean (Greece), Atmos. Environ., 34, 973–984, https://doi.org/10.1016/S1352-2310(99)00205-8, 2000.
Nabat, P., Somot, S., Mallet, M., Chiapello, I., Morcrette, J. J., Solmon, F., Szopa, S., Dulac, F., Collins, W., Ghan, S., Horowitz, L. W., Lamarque, J. F., Lee, Y. H., Naik, V., Nagashima, T., Shindell, D., and Skeie, R.: A 4-D climatology (1979–2009) of the monthly tropospheric aerosol optical depth distribution over the Mediterranean region from a comparative evaluation and blending of remote sensing and model products, Atmos. Meas. Tech., 6, 1287–1314, https://doi.org/10.5194/amt-6-1287-2013, 2013.
Ng, N. L., Herndon, S. C., Trimborn, A., Canagaratna, M. R., Croteau, P. L., Onasch, T. B., Sueper, D., Worsnop, D. R., Zhang, Q., Sun, Y. L., and Jayne, J. T.: An Aerosol Chemical Speciation Monitor (ACSM) for Routine Monitoring of the Composition and Mass Concentrations of Ambient Aerosol, Aerosol Sci. Tech., 45, 780–794, https://doi.org/10.1080/02786826.2011.560211, 2011.
Niinemets, Ü., Loreto, F., and Reichstein, M.: Physiological and physicochemical controls on foliar volatile organic compound emissions, Trends Plant Sci., 9, 180–186, https://doi.org/10.1016/j.tplants.2004.02.006, 2004.
Owen, S., Boissard, C., Street, R. A., Duckham, S. C., Csiky, O., and Hewitt, C. N.: Screening of 18 Mediterranean plant species for volatile organic compound emissions, Atmos. Environ., 31, 101–117, https://doi.org/10.1016/S1352-2310(97)00078-2, 1997.
Owen, S. M., Boissard, C., and Hewitt, C. N.: Volatile organic compounds (VOCs) emitted from 40 Mediterranean plant species: VOC speciation and extrapolation to habitat scale, Atmos. Environ., 35, 5393–5409, https://doi.org/10.1016/S1352-2310(01)00302-8, 2001.
Peñuelas, J. and Staudt, M.: BVOCs and global change, Trends Plant Sci., 15, 133–144, https://doi.org/10.1016/j.tplants.2009.12.005, 2010.
Petäjä, T., Mauldin, III, R. L., Kosciuch, E., McGrath, J., Nieminen, T., Paasonen, P., Boy, M., Adamov, A., Kotiaho, T., and Kulmala, M.: Sulfuric acid and OH concentrations in a boreal forest site, Atmos. Chem. Phys., 9, 7435–7448, https://doi.org/10.5194/acp-9-7435-2009, 2009.
Petit, J.-E., Favez, O., Sciare, J., Crenn, V., Sarda-Estève, R., Bonnaire, N., Mocnik, G., Dupont, J.-C., Haeffelin, M., and Leoz-Garziandia, E.: Two years of near real-time chemical composition of submicron aerosols in the region of Paris using an Aerosol Chemical Speciation Monitor (ACSM) and a multi-wavelength Aethalometer, Atmos. Chem. Phys., 15, 2985–3005, https://doi.org/10.5194/acp-15-2985-2015, 2015.
Pikridas, M., Riipinen, I., Hildebrandt, L., Kostenidou, E., Manninen, H., Mihalopoulos, N., Kalivitis, N., Burkhart, J. F., Stohl, A., Kulmala, M., and Pandis, S. N.: New particle formation at a remote site in the eastern Mediterranean, J. Geophys. Res., 117, D12205, https://doi.org/10.1029/2012JD017570, 2012.
Pirjola, L., Kulmala, M., Wilck, M., Bischoff, A., Stratmann, F., and Otto, E.: Formation of sulphuric acid aerosols and cloud condensation nuclei: an expression for significant nucleation and model comparison, J. Aerosol Sci., 30, 1079–1094, https://doi.org/10.1016/S0021-8502(98)00776-9, 1999.
Possell, M. and Loreto, F.: The Role of Volatile Organic Compounds in Plant Resistance to Abiotic Stresses: Responses and Mechanisms, in: Biology, Controls and Models of Tree Volatile Organic Compound Emissions, edited by: Niinemets, Ü. and Monson, R. K., Springer Netherlands, Dordrecht, Tree Physiology, 5, 209–235, 2013.
Riccobono, F., Schobesberger, S., Scott, C. E., Dommen, J., Ortega, I. K., Rondo, L., Almeida, J., Amorim, A., Bianchi, F., Breitenlechner, M., David, A., Downard, A., Dunne, E. M., Duplissy, J., Ehrhart, S., Flagan, R. C., Franchin, A., Hansel, A., Junninen, H., Kajos, M., Keskinen, H., Kupc, A., Kürten, A., Kvashin, A. N., Laaksonen, A., Lehtipalo, K., Makhmutov, V., Mathot, S., Nieminen, T., Onnela, A., Petäjä, T., Praplan, A. P., Santos, F. D., Schallhart, S., Seinfeld, J. H., Sipilä, M., Spracklen, D. V., Stozhkov, Y., Stratmann, F., Tomé, A., Tsagkogeorgas, G., Vaattovaara, P., Viisanen, Y., Vrtala, A., Wagner, P. E., Weingartner, E., Wex, H., Wimmer, D., Carslaw, K. S., Curtius, J., Donahue, N. M., Kirkby, J., Kulmala, M., Worsnop, D. R., and Baltensperger, U.: Oxidation Products of Biogenic Emissions Contribute to Nucleation of Atmospheric Particles, Science, 344, 717, https://doi.org/10.1126/science.1243527, 2014.
Riipinen, I., Pierce, J. R., Yli-Juuti, T., Nieminen, T., Häkkinen, S., Ehn, M., Junninen, H., Lehtipalo, K., Petäjä, T., Slowik, J., Chang, R., Shantz, N. C., Abbatt, J., Leaitch, W. R., Kerminen, V.-M., Worsnop, D. R., Pandis, S. N., Donahue, N. M., and Kulmala, M.: Organic condensation: a vital link connecting aerosol formation to cloud condensation nuclei (CCN) concentrations, Atmos. Chem. Phys., 11, 3865–3878, https://doi.org/10.5194/acp-11-3865-2011, 2011.
Rose, C., Sellegri, K., Asmi, E., Hervo, M., Freney, E., Colomb, A., Junninen, H., Duplissy, J., Sipilä, M., Kontkanen, J., Lehtipalo, K., and Kulmala, M.: Major contribution of neutral clusters to new particle formation at the interface between the boundary layer and the free troposphere, Atmos. Chem. Phys., 15, 3413–3428, https://doi.org/10.5194/acp-15-3413-2015, 2015.
Rottenberger, S., Kleiss, B., Kuhn, U., Wolf, A., Piedade, M. T. F., Junk, W., and Kesselmeier, J.: The effect of flooding on the exchange of the volatile C2-compounds ethanol, acetaldehyde and acetic acid between leaves of Amazonian floodplain tree species and the atmosphere, Biogeosciences, 5, 1085–1100, https://doi.org/10.5194/bg-5-1085-2008, 2008.
Safieddine, S., Boynard, A., Coheur, P.-F., Hurtmans, D., Pfister, G., Quennehen, B., Thomas, J. L., Raut, J.-C., Law, K. S., Klimont, Z., Hadji-Lazaro, J., George, M., and Clerbaux, C.: Summertime tropospheric ozone assessment over the Mediterranean region using the thermal infrared IASI/MetOp sounder and the WRF-Chem model, Atmos. Chem. Phys., 14, 10119–10131, https://doi.org/10.5194/acp-14-10119-2014, 2014.
Sandradewi, J., Prévôt, A. S. H., Szidat, S., Perron, N., Alfarra, M. R., Lanz, V. A., Weingartner, E., and Baltensperger, U.: Using Aerosol Light Absorption Measurements for the Quantitative Determination of Wood Burning and Traffic Emission Contributions to Particulate Matter, Environ. Sci. Tech., 42, 3316–3323, https://doi.org/10.1021/es702253m, 2008.
Schade, G. W. and Goldstein, A. H.: Fluxes of oxygenated volatile organic compounds from a ponderosa pine plantation, J. Geophys. Res., 106, 3111–3123, https://doi.org/10.1029/2000JD900592, 2001.
Schade, G. W. and Goldstein, A. H.: Seasonal measurements of acetone and methanol: Abundances and implications for atmospheric budgets, Global Biogeochem. Cy., 20, GB1011, https://doi.org/10.1029/2005GB002566, 2006.
Schade, G. W., Goldstein, A. H., and Lamanna, M. S.: Are monoterpene emissions influenced by humidity?, Geophys. Res. Lett., 26, 2187–2190, https://doi.org/10.1029/1999GL900444, 1999.
Schobesberger, S., Junninen, H., Bianchi, F., Lönn, G., Ehn, M., Lehtipalo, K., Dommen, J., Ehrhart, S., Ortega, I. K., Franchin, A., Nieminen, T., Riccobono, F., Hutterli, M., Duplissy, J., Almeida, J., Amorim, A., Breitenlechner, M., Downard, A. J., Dunne, E. M., Flagan, R. C., Kajos, M., Keskinen, H., Kirkby, J., Kupc, A., Kürten, A., Kurtén, T., Laaksonen, A., Mathot, S., Onnela, A., Praplan, A. P., Rondo, L., Santos, F. D., Schallhart, S., Schnitzhofer, R., Sipilä, M., Tomé, A., Tsagkogeorgas, G., Vehkamäki, H., Wimmer, D., Baltensperger, U., Carslaw, K. S., Curtius, J., Hansel, A., Petäjä, T., Kulmala, M., Donahue, N. M., and Worsnop, D. R.: Molecular understanding of atmospheric particle formation from sulfuric acid and large oxidized organic molecules, P. Natl. Acad. Sci. USA, 110, 17223–17228, https://doi.org/10.1073/pnas.1306973110, 2013.
Schurgers, G., Arneth, A., Holzinger, R., and Goldstein, A. H.: Process-based modelling of biogenic monoterpene emissions combining production and release from storage, Atmos. Chem. Phys., 9, 3409–3423, https://doi.org/10.5194/acp-9-3409-2009, 2009.
Sciare, J.: The Agia Marina Xyliatou Observatory: A remote supersite in Cyprus to monitor changes in the atmospheric composition of the Eastern Mediterranean and the Middle East, EGU General Assembly, Vienna, Austria, 17–22 April 2016, EGU2016-11493, 2016.
Seco, R., Peñuelas, J., Filella, I., Llusià, J., Molowny-Horas, R., Schallhart, S., Metzger, A., Müller, M., and Hansel, A.: Contrasting winter and summer VOC mixing ratios at a forest site in the Western Mediterranean Basin: the effect of local biogenic emissions, Atmos. Chem. Phys., 11, 13161–13179, https://doi.org/10.5194/acp-11-13161-2011, 2011.
Sellegri, K., Umann, B., Hanke, M., and Arnold, F.: Deployment of a ground-based CIMS apparatus for the detection of organic gases in the boreal forest during the QUEST campaign, Atmos. Chem. Phys., 5, 357–372, https://doi.org/10.5194/acp-5-357-2005, 2005a.
Sellegri, K., Hanke, M., Umann, B., Arnold, F., and Kulmala, M.: Measurements of organic gases during aerosol formation events in the boreal forest atmosphere during QUEST, Atmos. Chem. Phys., 5, 373–384, https://doi.org/10.5194/acp-5-373-2005, 2005b.
Sellegri, K., Pey, J., Rose, C., Culot, A., DeWitt, H. L., Mas, S., Schwier, A. N., Temime-Roussel, B., Charriere, B., Saiz-Lopez, A., Mahajan, A. S., Parin, D., Kukui, A., Sempere, R., D'Anna, B., and Marchand, N.: Evidence of atmospheric nanoparticle formation from emissions of marine microorganisms, Geophys. Res. Lett., 43, 6596–6603, https://doi.org/10.1002/2016GL069389, 2016.
Shilling, J. E., Zaveri, R. A., Fast, J. D., Kleinman, L., Alexander, M. L., Canagaratna, M. R., Fortner, E., Hubbe, J. M., Jayne, J. T., Sedlacek, A., Setyan, A., Springston, S., Worsnop, D. R., and Zhang, Q.: Enhanced SOA formation from mixed anthropogenic and biogenic emissions during the CARES campaign, Atmos. Chem. Phys., 13, 2091–2113, https://doi.org/10.5194/acp-13-2091-2013, 2013.
Sipilä, M., Berndt, T., Petäjä, T., Brus, D., Vanhanen, J., Stratmann, F., Patokoski, J., Mauldin, R. L., Hyvärinen, A.-P., Lihavainen, H., and Kulmala, M.: The Role of Sulfuric Acid in Atmospheric Nucleation, Science, 327, 1243, https://doi.org/10.1126/science.1180315, 2010.
Spracklen, D. V., Bonn, B., and Carslaw, K. S.: Boreal forests, aerosols and the impacts on clouds and climate, Philos. T. R. Soc. A, 366, 4613, https://doi.org/10.1098/rsta.2008.0201, 2008.
Stohl, A., Forster, C., Frank, A., Seibert, P., and Wotawa, G.: Technical note: The Lagrangian particle dispersion model FLEXPART version 6.2, Atmos. Chem. Phys., 5, 2461–2474, https://doi.org/10.5194/acp-5-2461-2005, 2005.
Taipale, R., Ruuskanen, T. M., Rinne, J., Kajos, M. K., Hakola, H., Pohja, T., and Kulmala, M.: Technical Note: Quantitative long-term measurements of VOC concentrations by PTR-MS – measurement, calibration, and volume mixing ratio calculation methods, Atmos. Chem. Phys., 8, 6681–6698, https://doi.org/10.5194/acp-8-6681-2008, 2008.
Tarvainen, V., Hakola, H., Hellén, H., Bäck, J., Hari, P., and Kulmala, M.: Temperature and light dependence of the VOC emissions of Scots pine, Atmos. Chem. Phys., 5, 989–998, https://doi.org/10.5194/acp-5-989-2005, 2005.
Vana, M., Ehn, M., Petäjä, T., Vuollekoski, H., Aalto, P., de Leeuw, G., Ceburnis, D., O'Dowd, C. D., and Kulmala, M.: Characteristic features of air ions at Mace Head on the west coast of Ireland, Atmos. Res., 90, 278–286, https://doi.org/10.1016/j.atmosres.2008.04.007, 2008.
Vanhanen, J., Mikkilä, J., Lehtipalo, K., Sipilä, M., Manninen, H. E., Siivola, E., Petäjä, T., and Kulmala, M.: Particle Size Magnifier for Nano-CN Detection, Aerosol Sci. Tech., 45, 533–542, https://doi.org/10.1080/02786826.2010.547889, 2011.
Vehkamäki, H., Dal Maso, M., Hussein, T., Flanagan, R., Hyvärinen, A., Lauros, J., Merikanto, P., Mönkkönen, M., Pihlatie, K., Salminen, K., Sogacheva, L., Thum, T., Ruuskanen, T. M., Keronen, P., Aalto, P. P., Hari, P., Lehtinen, K. E. J., Rannik, Ü., and Kulmala, M.: Atmospheric particle formation events at Värriö measurement station in Finnish Lapland 1998–2002, Atmos. Chem. Phys., 4, 2015–2023, https://doi.org/10.5194/acp-4-2015-2004, 2004.
Villani, P., Picard, D., Michaud, V., Laj, P., and Wiedensohler, A.: Design and Validation of a Volatility Hygroscopic Tandem Differential Mobility Analyzer (VH-TDMA) to Characterize the Relationships Between the Thermal and Hygroscopic Properties of Atmospheric Aerosol Particles, Aerosol Sci. Tech., 42, 729–741, https://doi.org/10.1080/02786820802255668, 2008.
Warneke, C., de Gouw, J. A., Del Negro, L., Brioude, J., McKeen, S., Stark, H., Kuster, W. C., Goldan, P. D., Trainer, M., Fehsenfeld, F. C., Wiedinmyer, C., Guenther, A. B., Hansel, A., Wisthaler, A., Atlas, E., Holloway, J. S., Ryerson, T. B., Peischl, J., Huey, L. G., and Hanks, A. T. C.: Biogenic emission measurement and inventories determination of biogenic emissions in the eastern United States and Texas and comparison with biogenic emission inventories, J. Geophys. Res., 115, D00F18, https://doi.org/10.1029/2009JD012445, 2010.
Winters, A. J., Adams, M. A., Bleby, T. M., Rennenberg, H., Steigner, D., Steinbrecher, R., and Kreuzwieser, J.: Emissions of isoprene, monoterpene and short-chained carbonyl compounds from Eucalyptus spp. in southern Australia, Atmos. Environ., 43, 3035–3043, https://doi.org/10.1016/j.atmosenv.2009.03.026, 2009.
Woo, K., Chen, D., Pui, D., and McMurry, P.: Measurement of Atlanta aerosol size distributions: observations of ultrafine particle events, Aerosol Sci. Tech., 34, 75–87, 2001.
Xiang, Y., Delbarre, H., Sauvage, S., Léonardis, T., Fourmentin, M., Augustin, P., and Locoge, N.: Development of a methodology examining the behaviours of VOCs source apportionment with micro-meteorology analysis in an urban and industrial area, Environ. Pollut., 162, 15–28, https://doi.org/10.1016/j.envpol.2011.10.012, 2012.
Yli-Juuti, T., Riipinen, I., Aalto, P. P., Nieminen, T., Maenhaut, W., Janssens, I. A., Claeys, M., Salma, I., Ocskay, R., and Hoffer, A.: Characteristics of new particle formation events and cluster ions at K-puszta, Hungary, Boreal Environ. Res., 14, 683–698, 2009.
Zhang, R., Suh, I., Zhao, J., Zhang, D., Fortner, E. C., Tie, X., Molina, L. T., and Molina, M. J.: Atmospheric New Particle Formation Enhanced by Organic Acids, Science, 304, 1487, https://doi.org/10.1126/science.1095139, 2004.
Zhao, J., Ortega, J., Chen, M., McMurry, P. H., and Smith, J. N.: Dependence of particle nucleation and growth on high-molecular-weight gas-phase products during ozonolysis of α-pinene, Atmos. Chem. Phys., 13, 7631–7644, https://doi.org/10.5194/acp-13-7631-2013, 2013.