the Creative Commons Attribution 4.0 License.
the Creative Commons Attribution 4.0 License.
 | 05 Oct 2018
Observation and analysis of spatiotemporal characteristics of surface ozone and carbon monoxide at multiple sites in the Kathmandu Valley, Nepal
Khadak Singh Mahata
Maheswar Rupakheti
Arnico Kumar Panday
Piyush Bhardwaj
Manish Naja
Ashish Singh
Andrea Mues
Paolo Cristofanelli
Deepak Pudasainee
Paolo Bonasoni
Mark G. Lawrence
Residents of the Kathmandu Valley experience severe particulate and gaseous air pollution throughout most of the year, even during much of the rainy season. The knowledge base for understanding the air pollution in the Kathmandu Valley was previously very limited but is improving rapidly due to several field measurement studies conducted in the last few years. Thus far, most analyses of observations in the Kathmandu Valley have been limited to short periods of time at single locations. This study extends the past studies by examining the spatial and temporal characteristics of two important gaseous air pollutants (CO and O3) based on simultaneous observations over a longer period at five locations within the valley and on its rim, including a supersite (at Bode in the valley center, 1345 m above sea level) and four satellite sites: Paknajol (1380 m a.s.l.) in the Kathmandu city center; Bhimdhunga (1522 m a.s.l.), a mountain pass on the valley's western rim; Nagarkot (1901 m a.s.l.), another mountain pass on the eastern rim; and Naikhandi (1233 m a.s.l.), near the valley's only river outlet. CO and O3 mixing ratios were monitored from January to July 2013, along with other gases and aerosol particles by instruments deployed at the Bode supersite during the international air pollution measurement campaign SusKat-ABC (Sustainable Atmosphere for the Kathmandu Valley – endorsed by the Atmospheric Brown Clouds program of UNEP). The monitoring of O3 at Bode, Paknajol and Nagarkot as well as the CO monitoring at Bode were extended until March 2014 to investigate their variability over a complete annual cycle. Higher CO mixing ratios were found at Bode than at the outskirt sites (Bhimdhunga, Naikhandi and Nagarkot), and all sites except Nagarkot showed distinct diurnal cycles of CO mixing ratio, with morning peaks and daytime lows. Seasonally, CO was higher during premonsoon (March–May) season and winter (December–February) season than during monsoon season (June–September) and postmonsoon (October–November) season. This is primarily due to the emissions from brick industries, which are only operational during this period (January–April), as well as increased domestic heating during winter, and regional forest fires and agro-residue burning during the premonsoon season. It was lower during the monsoon due to rainfall, which reduces open burning activities within the valley and in the surrounding regions and thus reduces sources of CO. The meteorology of the valley also played a key role in determining the CO mixing ratios. The wind is calm and easterly in the shallow mixing layer, with a mixing layer height (MLH) of about 250 m, during the night and early morning. The MLH slowly increases after sunrise and decreases in the afternoon. As a result, the westerly wind becomes active and reduces the mixing ratio during the daytime. Furthermore, there was evidence of an increase in the O3 mixing ratios in the Kathmandu Valley as a result of emissions in the Indo-Gangetic Plain (IGP) region, particularly from biomass burning including agro-residue burning. A top-down estimate of the CO emission flux was made by using the CO mixing ratio and mixing layer height measured at Bode. The estimated annual CO flux at Bode was 4.9 µg m−2 s−1, which is 2–14 times higher than that in widely used emission inventory databases (EDGAR HTAP, REAS and INTEX-B). This difference in CO flux between Bode and other emission databases likely arises from large uncertainties in both the top-down and bottom-up approaches to estimating the emission flux. The O3 mixing ratio was found to be highest during the premonsoon season at all sites, while the timing of the seasonal minimum varied across the sites. The daily maximum 8 h average O3 exceeded the WHO recommended guideline of 50 ppb on more days at the hilltop station of Nagarkot (159 out of 357 days) than at the urban valley bottom sites of Paknajol (132 out of 354 days) and Bode (102 out of 353 days), presumably due to the influence of free-tropospheric air at the high-altitude site (as also indicated by Putero et al., 2015, for the Paknajol site in the Kathmandu Valley) as well as to titration of O3 by fresh NOx emissions near the urban sites. More than 78 % of the exceedance days were during the premonsoon period at all sites. The high O3 mixing ratio observed during the premonsoon period is of a concern for human health and ecosystems, including agroecosystems in the Kathmandu Valley and surrounding regions.


Air pollution is one of the major health risks globally. It was responsible for premature loss of about 7 million lives worldwide in 2012 (WHO, 2014), with about 1.7 million in South Asian countries (India, Pakistan, Nepal and Bangladesh) in 2013 (Forouzanfar et al., 2015). The latest report shows that the indoor and outdoor air pollution are each responsible for 4 million premature deaths every year (http://www.who.int/airpollution/en/, last access: 22 August 2018). South Asia is considered to be a major air pollution hotspot (Monks et al., 2009) and it is expected to be one of the most polluted regions in the world for surface ozone (O3) and other pollutants by 2030 (Dentener et al., 2006; IEA, 2016; OECD, 2016). Past studies have shown that the air pollution from this region affects not only the region itself, but is also transported to other parts of the world, including comparatively pristine regions such as the Himalayas and the Tibetan Plateau (Bonasoni et al., 2010; Ming et al., 2010; Lüthi et al., 2015), as well as to other distant locations such as northern Africa and the Mediterranean (Lawrence and Lelieveld, 2010).The pollutants are also uplifted to the tropopause by convective air masses and transported to the extratropical stratosphere during the monsoon season (Tissier and Legras, 2016; Lawrence and Lelieveld, 2010; Fueglistaler et al., 2009; Highwood and Hoskins, 1998). Air pollution is particularly alarming in many urban areas of South Asia, including in the city of Kathmandu and the broader Kathmandu Valley, Nepal (Chen et al., 2015; Putero et al., 2015; Kim et al., 2015; Sarkar et al., 2016; Shakya et al., 2017). This is due to their rapid urbanization, economic growth and the use of poor technologies in the transportation, energy and industrial sectors. In Kathmandu topography also plays a major role: the bowl-shaped Kathmandu Valley is surrounded by tall mountains and only a handful of passes. Topography is a key factor in governing local circulations, where low MLH (typically in the range of 250 to 1500 m) and calm winds have been observed, particularly during nights and mornings. This in turn results in poor ventilation (Mues et al., 2017). Overall, this is conducive to trapping air pollutants and the deterioration of air quality in the valley. Effectively mitigating air pollutants in the regions like the Kathmandu Valley requires scientific knowledge about characteristics and sources of the pollutants. To contribute to this urgently needed scientific knowledge base, in this study we focus on the analysis of measurements of two important gaseous species, carbon monoxide (CO) and O3, at multiple sites in and around the Kathmandu Valley. This study analyzes data from January 2013 to March 2014, which includes the intensive phase of an international air pollution measurement campaign (SusKat-ABC: Sustainable Atmosphere for the Kathmandu Valley – Atmospheric Brown Clouds) conducted during December 2012–June 2013 (Rupakheti et al., 2018), with measurements of O3 and CO at some sites continuing beyond the intensive campaign period (Bhardwaj et al., 2018; Mahata et al., 2017).
CO is a useful tracer of urban air pollution as it is primarily released during incomplete combustion processes that are common in urban areas. Forest fires and agro-residue burning in the IGP and foothills of the Himalayas are other important contributors of CO in the region (Mahata et al., 2017; Bhardwaj et al., 2018). CO is toxic at high concentrations indoors and outdoors, but our focus here is on ambient levels. The main anthropogenic sources of CO in the Kathmandu Valley are vehicles, cooking activities (using liquefied petroleum gas, kerosene and firewood), and industries, including brick kilns, especially biomass cofired kilns with older technologies, and until recently diesel power generator sets (Panday and Prinn, 2009; Kim et al, 2015; Sarkar et al., 2016, 2017; Mahata et al., 2017). Tropospheric O3, which is formed by photochemical reactions involving oxides of nitrogen (NOx) and volatile organic compounds (VOCs), is a strong oxidizing agent in the troposphere. Because of its oxidizing nature, it is also deleterious to human health and plants already at typically polluted ambient levels (Lim et al., 2012; Burney and Ramanathan, 2014; Feng, 2015; Monks et al., 2015). Tropospheric O3 is estimated to be responsible for about 5–20 % of premature deaths caused by air pollution globally (Brauer et al., 2012; Lim et al., 2012; Silva et al., 2013). It has also been estimated that high concentrations of O3 are responsible for a global loss of crops equivalent to USD 11–18 billion annually (Avnery et al., 2011; UNEP and WMO, 2011), a substantial fraction of which is associated with the loss in wheat in India alone (equivalent to USD 5 billion in 2010) (Burney and Ramanathan, 2014). O3 can also serve as a good indicator of the timing of the breakup of the nighttime stable boundary layer (when the ozone levels increase rapidly in the morning due to downward transport from the free troposphere; Panday and Prinn, 2009; Geiß et al., 2017).
Only a few past studies have reported measurements of ambient CO mixing ratios in the Kathmandu Valley. Davidson et al. (1986) measured CO in the city center and found mixing ratios between 1 and 2.5 ppm in the winter (December–February) of 1982–1983. Panday and Prinn (2009) measured similar levels of CO mixing ratios during September 2004–June 2005, although the main sources of CO shifted from biofuel-dominated air pollutants from cooking activities in the 1980s to vehicle-dominated pollutants in the 2000s. The growth rate in the vehicle fleet has had a substantial influence on air pollution in the valley, including CO and O3. Out of 2.33 million vehicles in Nepal, close to half of them are in the Kathmandu Valley (DoTM, 2015). Shrestha et al. (2013) estimated annual emissions of CO of 31 kt in 2010 from a fraction of today's vehicle fleet in the Kathmandu Valley by using data from a field survey as input for the International Vehicle Emission (IVE) model. The model simulation considered motorcycles, buses, taxis, vans and three-wheelers, but did not include personal cars, trucks and nonroad vehicles. The fleets studied covered ∼73 % of the total fleet (570 145) registered in the valley in 2010, with motorcycles being the most common vehicle (69 % of the total fleet).
Past studies have investigated the diurnal and seasonal variations of CO and O3 mixing ratios in the Kathmandu Valley. Panday and Prinn (2009) observed distinct diurnal variations of CO mixing ratios and particulate matter concentrations observed during September 2004–June 2005 at Bouddha (about 4 km northwest of the SusKat-ABC supersite at Bode), with morning and evening peaks. They found for the Kathmandu Valley that such peaks were created by the interplay between the ventilation, as determined by the local meteorology, and the timing of emissions, especially traffic and cooking emissions. The morning CO peak was also associated with the recirculation of the pollutants transported down from an elevated residual pollution layer (Panday and Prinn, 2009).
O3 was observed to have lower nighttime levels in the city center than at the nearby hilltop site of Nagarkot (Panday and Prinn, 2009). Pudasainee et al. (2006) studied the seasonal variations of O3 mixing ratios based on the observation for a whole year (2003–2004) in Pulchowk in the Lalitpur district, just south of central Kathmandu Metropolitan City (KMC) in the Kathmandu Valley. They reported seasonal O3 mixing ratios to be highest during the premonsoon period (March–May) and lowest in the winter (December–February). As a part of the SusKat-ABC Campaign, Putero et al. (2015) monitored O3 mixing ratios at Paknajol, an urban site in the center of the KMC, over a full-year period (February 2013–January 2014). They also observed similar seasonal variations in O3 mixing ratios in the valley to those observed by Pudasainee et al. (2006), with highest O3 during the premonsoon (1 February–12 May) season, followed by the monsoon (13 May–6 October), postmonsoon (7 October–26 October) and winter (27 October–31 January) seasons. They found that during the premonsoon season, westerly winds and regional synoptic circulation transport O3 and its precursors from regional forest fires located outside the Kathmandu Valley. In another study conducted as part of the SusKat-ABC campaign, 37 nonmethane volatile organic compounds (NMVOCs) were measured at Bode, with data recording every second, during the winter of 2012–2013; the measurements included isoprene, an important biogenic precursor of O3 (Sarkar et al., 2016). They found that concentrations vary in two distinct periods. The first period was marked by no brick kiln operations and was associated with high biogenic emissions of isoprene. During the second period nearby brick kilns, which use coal mixed with biomass, were operational; they contributed to elevated concentrations of ambient acetonitrile, benzene and isocyanic acid. Furthermore, the authors found that oxygenated NMVOCs and isoprene combined accounted for 72 % and 68 % of the total O3 production potential in the first period and second period, respectively.
Prior to the SusKat-ABC campaign there were no studies that simultaneously measured ambient CO and O3 mixing ratios at multiple sites in the Kathmandu Valley over extended periods of time. Past studies either focused on one long-term site, or on short-term observation records at various sites (Panday and Prinn, 2009), or they investigated the seasonal characteristics of single pollutants such as O3 at a single site in the valley (Pudasainee et al., 2006). The most comparable past study is by Putero et al. (2015), who described O3 mixing ratios at one SusKat-ABC site (Paknajol) in the Kathmandu city center observed during the SusKat-ABC campaign, and discussed O3 seasonal variations. There is also a companion study on regional CO and O3 pollution by Bhardwaj et al. (2018), which is based on O3 and CO mixing ratios monitored at the SusKat-ABC supersite at Bode in the Kathmandu Valley for a limited period (January–June 2013) and at two sites in India (Pantnagar in the Indo-Gangetic Plain (IGP) and Nainital in the Himalayan foothills). They reported simultaneous enhancement in O3 and CO levels at these three sites in spring, highlighting the contribution of regional emissions, such as biomass burning in the northwestern IGP, and regional transport to broader regional-scale pollution, including in the Kathmandu Valley. In this study, we document the diurnal and seasonal (where applicable) characteristics and spatial distributions of CO and O3 mixing ratios based on simultaneous observations at several locations within the valley and on the valley rim mountains over a full year, helping to characterize the pollution within the valley and the pollution plume entering and exiting the valley. We also compute the first top-down estimates of CO emission fluxes for the Kathmandu Valley and compare these to CO emissions fluxes in widely used emission datasets such as EDGAR HTAP (Janssens-Maenhout et al., 2000), REAS (Kurokawa et al., 2013) and INTEX-B (Zhang et al., 2009).
Table 1Information on the sampling sites (of the SusKat-ABC campaign) used in this study. Sampling was carried out during 2013–2014 in the Kathmandu Valley. The altitude is in meters above mean sea level (m a.s.l.).
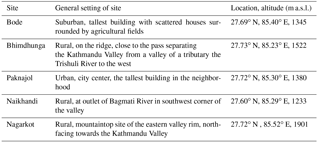
Table 2Details of the instruments deployed at different sites during the observation period during January 2013–March 2014 in the Kathmandu Valley.
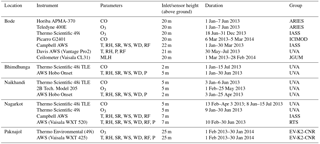
Note: T – temperature, RH – relative humidity, SR – solar radiation, WS – wind speed, WD – wind direction, RF – rainfall, P – pressure and MLH – mixing layer height; ARIES – Aryabhatta Research Institute of Observational Sciences, India; ICIMOD – International Center for Integrated Mountain Development, Nepal; IASS – Institute for Advanced Sustainability Studies, Germany; UVA – University of Virginia, USA; JGUM – Johannes Gutenberg University Mainz, Germany; RTS – Real Time Solutions, Nepal; Ev-K2-CNR – Everest-Karakorum – Italian National Research Council, Italy.
The Kathmandu Valley, situated in the foothills of the central Himalayas, is home to more than 3 million people. The valley floor has an area of about 340 km2, with an average altitude of about 1300 m above sea level (m a.s.l.). It is surrounded by peaks of about 1900–2800 m a.s.l. The valley has five major mountain passes on its rim: the Nagdhunga, Bhimdhunga and Mudku Bhanjhyang passes in the west, and the Nala and Nagarkot passes in the east, as shown in Fig. 1. The passes are situated at altitudes of 1480–1530 m a.s.l. There is also one river outlet (the Bagmati River) towards the south, which constitutes a sixth pass for air circulation in and out of the valley (Regmi et al., 2003; Panday and Prinn, 2009). We selected five measurement sites, including two on the valley floor (Bode and Paknajol), two on mountain ridges (Bhimdhunga and Nagarkot) and one near the Bagmati River outlet (Naikhandi) to characterize the spatial and temporal variabilities of CO and O3 mixing ratios in the Kathmandu Valley. A short description of the measurement sites is presented here and in Table 1, while details on instruments deployed at those sites for this study are presented in Table 2. Further details of the measurement sites are described in the SusKat-ABC campaign overview paper (Rupakheti et al., 2018).
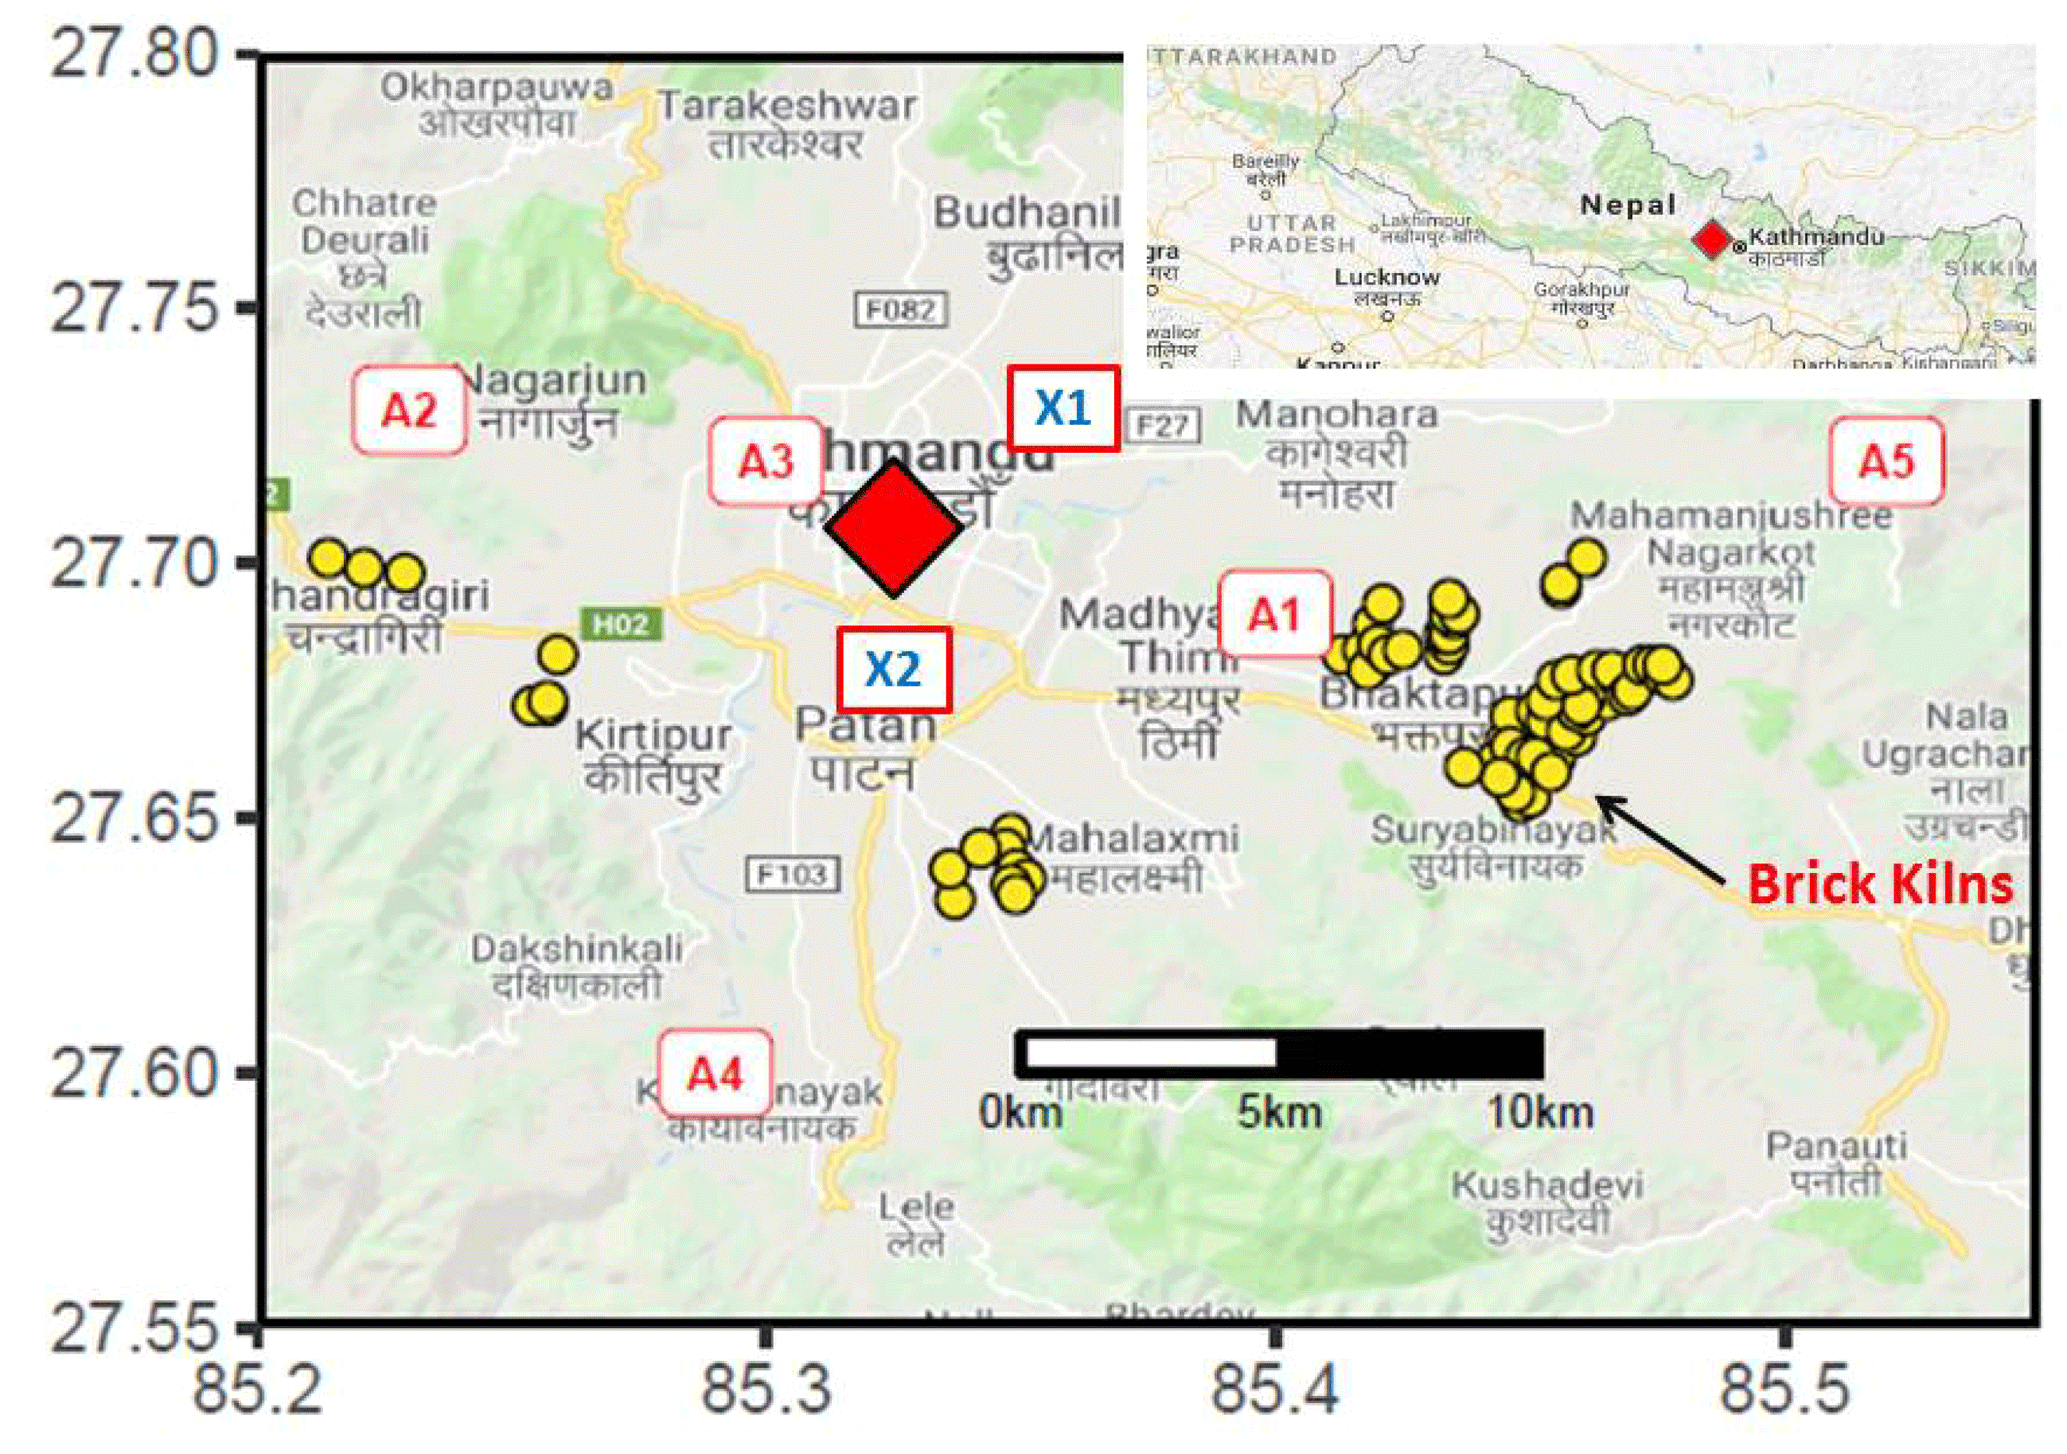
Figure 1Observation sites in the SusKat-ABC international air pollution campaign during 2013–2014 in the Kathmandu Valley. A1 = Bode, A3 = Paknajol and A4 = Naikhandi were selected within the valley floor and A2 = Bhimdhunga and A5 = Nagarkot on the mountain ridge. Naikhandi site is also near the Bagmati River outlet. Past study sites, Bouddha (X1) and Pulchowk (X2), which are referred in the paper, are also shown in the figure. Source: Google Maps.
Bode (27.69∘ N, 85.40∘ E; 1344 m a.s.l.) was the supersite of the SusKat-ABC campaign. Bode is located in the Madhyapur Thimi municipality just east of the geographic center of the valley. It is a semiurban site surrounded by urban buildings and residential houses scattered across agricultural lands. Within 4 km there are 10 brick kilns and the Bhaktapur Industrial Estate towards the southeast (refer to Sarkar et al., 2016, and Mahata et al., 2017, for details). The O3 and CO instruments at the Bode site were placed on the fifth floor of a six-story building, the tallest in the area. The inlets of the CO and O3 analyzers were mounted on the rooftop of the temporary lab, 20 m above the ground level.
Bhimdhunga (27.73∘ N, 85.23∘ E; 1522 m a.s.l.) is located on the Bhimdhunga pass on the western rim of the valley. It is one of the lowest points on the north–south-running mountain ridge between the Kathmandu Valley to the east and a valley of a tributary of the Trishuli River to the west. It is situated about 5.5 km from the western edge of the KMC, in a rural setting with very few rural houses scattered nearby. The CO instrument was placed on the ground floor of a small one-story building and its inlet was 2 m above ground. An automatic weather station (AWS) (Hobo Onset, USA) was set up on the roof of another one-story building at a distance of ca. 15 m from the first building.
Paknajol (27.72∘ N, 85.30∘ E; 1380 m a.s.l.) is located in the city center in the KMC, near the popular touristic area of Thamel. It is in the western part of the valley and about 10 km distance from the Bode supersite. The O3 and meteorological instruments relevant to this study were placed on the top floor and rooftop of a six-story building, the tallest in the area (details in Putero et al., 2015; note that CO was not measured here). The inlet of the O3 analyzer was placed 25 m above the ground.
Naikhandi (27.60∘ N, 85.29∘ E; 1233 m a.s.l.) is located within the premises of a school (Kamdhenu Madhyamik Vidhyalaya) located in the southwestern part of the valley (∼7 km south from the nearest point of the ring road). The school premises are open, surrounded by sparsely scattered rural houses in agricultural lands. The nearest village (∼75 houses) is about 500 m away in the southwest direction. There are 5 brick kilns within 2 km distance (2 to the north and 3 to the northeast) from the site. The instruments were kept in a two-story building of the school and its inlet was 5 m above the ground. The AWS (Hobo Onset, USA) was installed on the ground near the Bagmati River, ∼100 m away from the main measurement site.
Nagarkot is located on a mountain ridge (27.72∘ N, 85.52∘ E; 1901 m a.s.l.), ca. 13 km east of Bode, in the eastern part of the valley. The site faces the Kathmandu Valley to the west and small rural town, Nagarkot, to the east. The instruments were set up in a two-story building of the Nagarkot Health Post and their inlets were 5 m above the ground. The AWS (Vaisala WXT520, Finland) was set up on the roof of the building.
Bhimdhunga Pass in the west and Naikhandi near the Bagmati River outlet in the southwest are the important places for interchange of valley air with outside air. The Bhimdhunga and Naikhandi sites are approximately 5.5 and 7 km away from the nearest edge of the city, respectively. Similarly, Bode is located downwind of the city centers and thus receives pollution outflow from nearby city centers of Kathmandu and Lalitpur due to strong westerly and southwesterly winds (4–6 m s−1) during the daytime, and emissions from the Bhaktapur area to the east and southeast direction by calm easterly winds (<1 m s−1) during the night (Sarkar et al., 2016; Mahata et al., 2017).
A freshly calibrated new CO analyzer (Horiba APMA-370, Japan) was deployed for the first time at Bode. This instrument is based on the IR absorption method at 4.6 µm by CO molecules. Before field deployment at Bode, it was compared with the bench model of the Horiba (APMA-370), and the correlation (r) between them was 0.9 and slope was 1.09. The instrument was regularly maintained by running auto-zero checks (Bhardwaj et al., 2018). Similarly, another CO analyzer (Picarro G2401, USA), which is based on cavity a ring-down spectroscopy (CRDS) technique, was also a new factory-calibrated unit and was deployed in Bode along with the Horiba APMA-370. The IR-based Horiba AP-370 was run simultaneously with a colocated Picarro CO analyzer based on cavity ring-down spectrometry for nearly 3 months. The correlation coefficient and slope between the two measurements were found to be 0.99 and 0.96, respectively (Mahata et al., 2017). This indicates that there was very little drift in the IR-based CO values due to room temperature change, within an acceptable range (i.e., within the measurement uncertainties of the instruments). Therefore, we did not any apply correction in the IR-based CO data. All other CO analyzers (Thermo Scientific, 48i TLE, USA), which are also based on IR absorption by CO molecules, deployed at Bhimdhunga, Naikhandi and Nagarkot, were set up for regular automatic zero checks on a daily basis. In addition, a span check was also performed during the observations by using span gas of 1.99 ppm (Gts-Welco, PA, USA) on 8 March 2013 at Naikhandi and Nagarkot, and on 9 March at Bhimdhunga. The IR-based CO instruments' span drifts were within a 5 % range.
For the O3 monitor (Teledyne 400E, USA) at Bode, regular zero and span checks were carried out using the built-in O3 generator and scrubber (Bhardwaj et al., 2018). This unit was used in Bode from 1 January to 9 June 2013. New factory-calibrated O3 monitors (Thermo Scientific, 49i, USA) were used for the rest of the measurement period (18 June to 31 December 2013) at Bode, and for the full year of measurements at Nagarkot. A Thermo Environmental O3 analyzer (Model 49i, USA) was used at the Paknajol site (Putero et al., 2015) with the same experimental setup as described in Cristofanelli et al. (2010). The working principle of all of the O3 instruments is based on the attenuation of UV radiation by O3 molecules at ∼254 nm.
In order to characterize observations across the seasons, we considered the following seasons as defined in Shrestha et al. (1999) and used in other previous studies in the Kathmandu Valley (Sharma et al., 2012; Chen et al., 2015; Mahata et al, 2017): premonsoon (March, April, May), monsoon (June, July, August, September), postmonsoon (October, November), and winter (December, January, February).
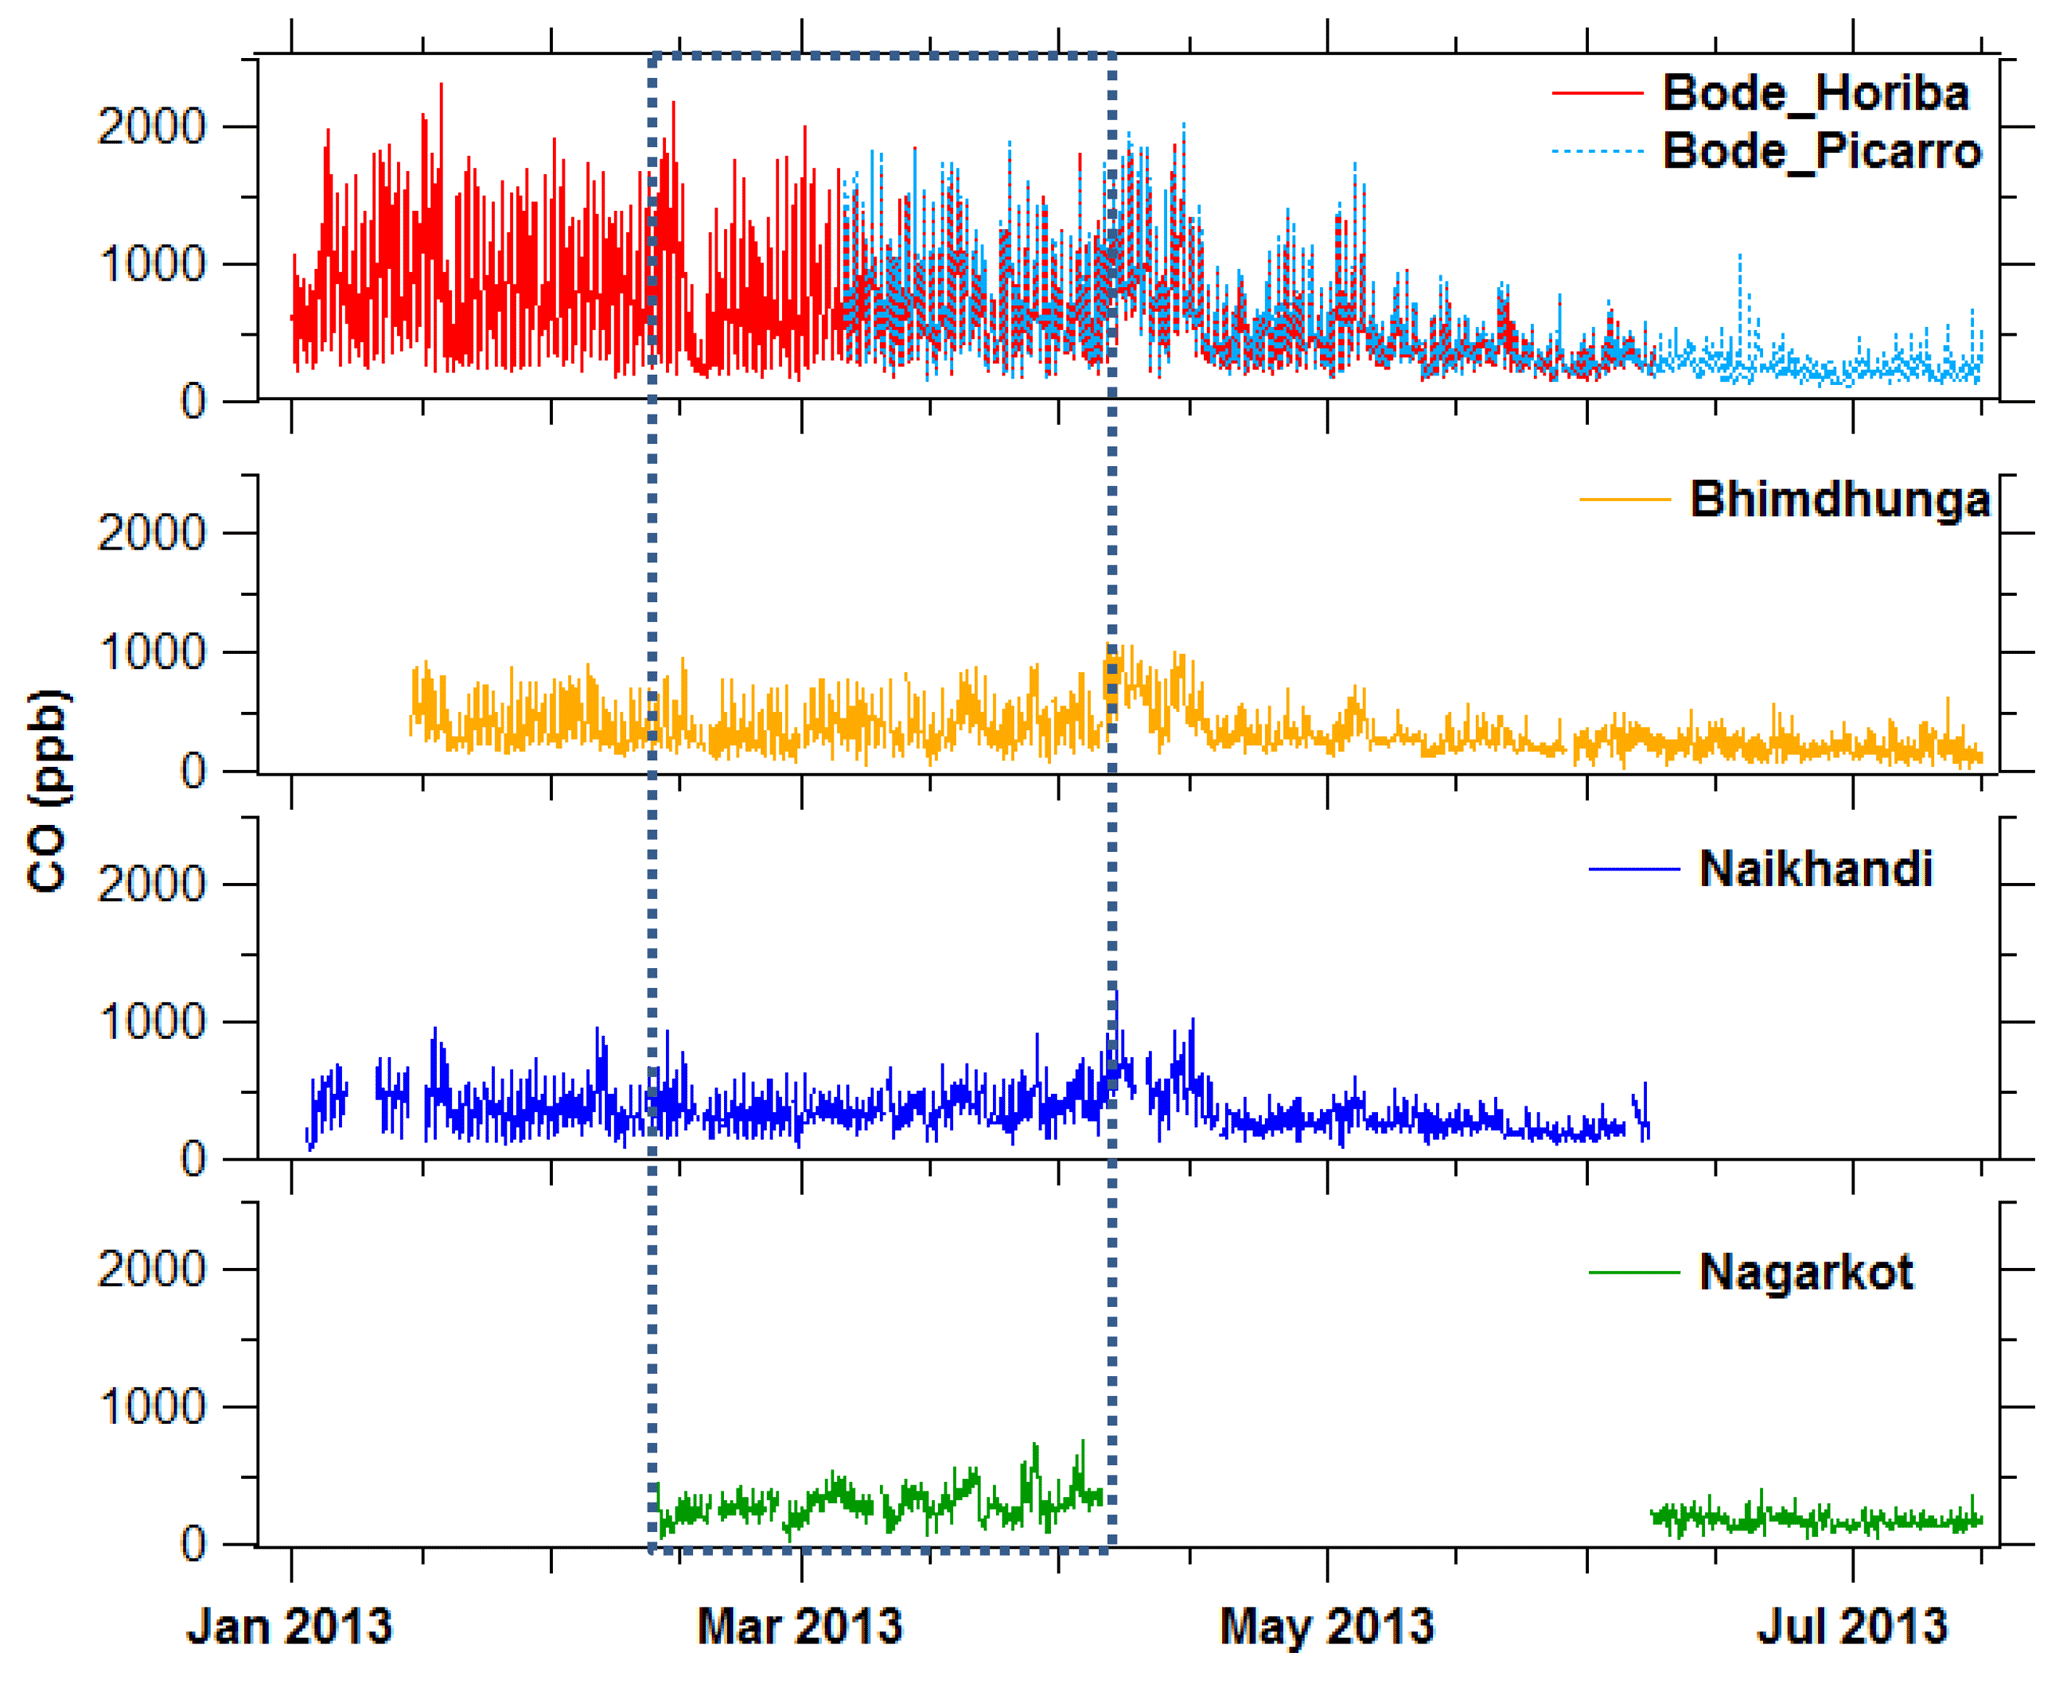
Figure 2Hourly average CO mixing ratios observed at a supersite (Bode) and three satellite sites (Bhimdhunga, Naikhandi and Nagarkot) of the SusKat-ABC international air pollution measurement campaign during January to July 2013 in the Kathmandu Valley. The dotted box represents a period (13 February–3 April 2013) during which data for all four sites were available.
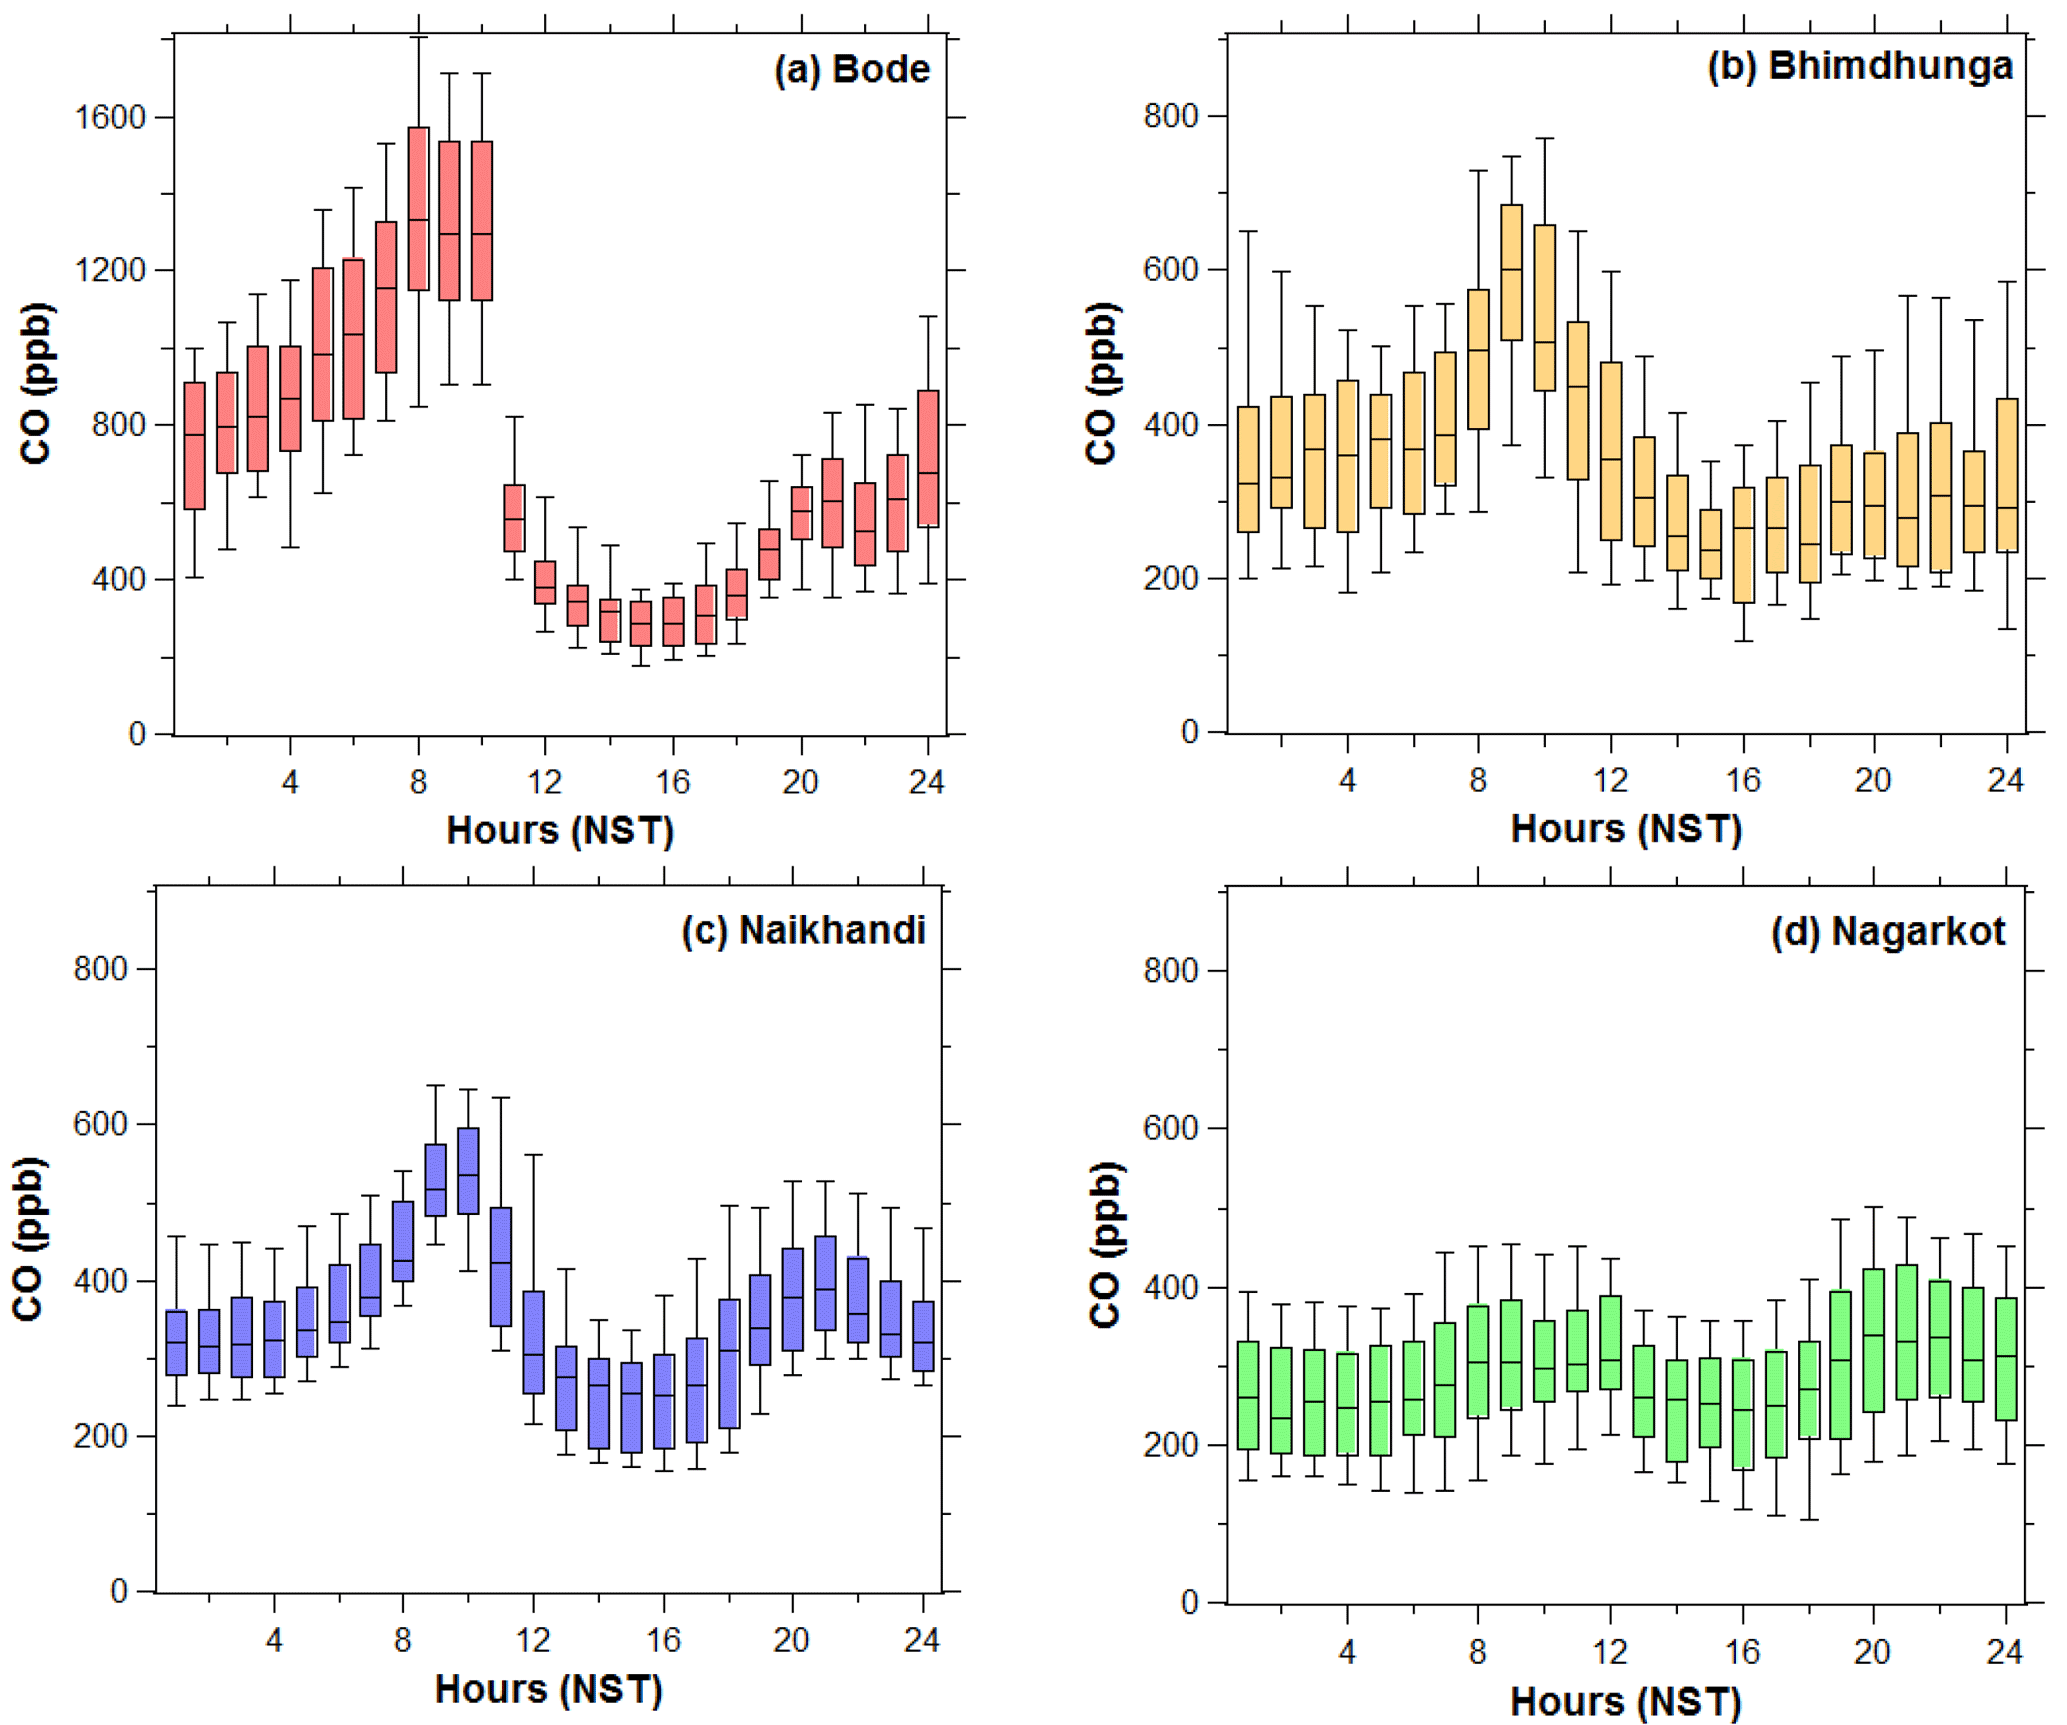
Figure 3Diurnal variations of hourly average CO mixing ratios during the common observation period (13 February–3 April 2013) at Bode, Bhimdhunga, Naikhandi and Nagarkot. The lower end and upper end of the whiskers represent the 10th and 90th percentile, respectively; the lower end and upper end of each box represent the 25th and 75th percentile, respectively, and the black horizontal line in the middle of each box is the median for each month. Note: the y-axis scale of Bode is twice that of the other three sites.
3.1 CO mixing ratio at multiple sites
Figure 2 shows the time series of the hourly average CO mixing ratios at the four sites (Bode, Bhimdhunga, Naikhandi and Nagarkot). Fluctuations in CO mixing ratios were higher during the winter and premonsoon period than during the monsoon season at all sites. The monsoon rain generally starts in Nepal around mid-June. In 2013, however, there were more frequent rain events in the month of May than in previous years. The CO mixing ratios (measured in parts per billion by volume; hereafter the unit is denoted as ppb) of hourly averaged data over the total observation periods at four sites and their standard deviation were Bode – 569.9±383.5 ppb during 1 January–15 July, Bhimdhunga – 321.5±166.2 ppb during 14 January–15 July, Naikhandi – 345.4±147.9 ppb during 3 January–6 June and Nagarkot – 235.5±106.2 ppb during 13 February–15 July (except 4 April to 7 June). Nagarkot had only about 3 months of CO data (due to a problem in zeroing of the instrument) during the observation period. For the measurement period, the CO mixing ratio at Nagarkot (∼13 km far from Bode) showed small fluctuations compared with the other sites. High CO values in the Kathmandu Valley during the dry season (November–May) were also reported by Panday and Prinn (2009) based on their measurements during September 2004–May 2005 at Bouddha (∼4 km in northwest from Bode). The simultaneous episodes of high CO observed from 1 to 15 April in Bhimdhunga, Bode and Naikhandi indicate the influence of regional sources, in addition to local sources. This is discussed further in Sect. 3.2.3.
3.2 Diurnal and seasonal variations of CO
3.2.1 Diurnal pattern of CO at multiple sites
Figure 3 shows the diurnal cycles of CO mixing ratios at four sites (plotted for the period of 13 February to 3 April 2013, when the data were available from all four sites). The variation in the mixing ratios during the day was characterized by a pronounced morning peak, a weaker evening peak and a daytime low, except at Nagarkot where peaks are less visible. Multiple sources contribute to the morning and evening peaks, especially emission from vehicles, residential burning (fossil fuel and biomass), brick kilns and trash burning (Kim et al., 2015; Sarkar et al., 2016; Mahata et al., 2017). Other studies conducted during the SusKat-ABC campaign have identified garbage (household waste and yard waste) burning as a key source of various air pollutants, such as organic carbon (OC), elemental carbon (EC) (Kim et al., 2015), polycyclic aromatic hydrocarbons (PAHs) (Chen et al., 2015), and NMVOCs (Sarkar et al., 2016, 2017). Garbage burning is often done in small fires and quite sporadically, normally taking place in the evenings and mornings (partly chosen to avoid attention from the responsible authorities). The rate of waste (and also biomass) burning in the morning is higher in winter due to the use of the fires for providing warmth on colder days.
The observed diurnal cycle of CO is similar to that reported in a previous study (Panday and Prinn, 2009) and is also similar to the diurnal pattern of black carbon (BC) in the Kathmandu Valley (Sharma et al., 2012; Mues et al., 2017). The diurnal cycles of these primary pollutants are closely coupled with the valley's boundary layer height, which is about 1200 m during daytime and falls to approximately 200 m at nighttime in Bode (Mues et al., 2017). Nagarkot and Bhimdhunga, both on mountain ridges, are generally above the valley's boundary layer, especially at night, and thus the diurnal profile especially at Nagarkot is distinct compared to other three sites, being relatively flat with a small dip during 12:00–18:00 LT (local time).
Distinct morning peaks were observed in Bode, Bhimdhunga and Naikhandi at 08:00, 09:00 and 10:00 LT, respectively, i.e., the morning peak lags by 1–2 h in Bhimdhunga and Naikhandi compared to Bode. Bhimdhunga on the mountain ridge may receive the Kathmandu Valley's pollution due to upslope winds (∼2 m s−1) from the east direction in the morning hours after the dissolution of the valley's boundary layer due to radiative heating of the mountain slopes. However, Naikhandi is in close proximity to brick kilns and could be impacted by their plumes being carried to the site by northerly winds in the early morning (ca. 07:00-10:00 LT, not shown). The evening peak values at Bode and Bhimdhunga were less pronounced compared to the morning maxima. The morning peak at Bode was influenced by nighttime accumulation of CO along with other pollutants from nearby brick kilns (Sarkar et al., 2016; Mahata et al., 2017; Mues et al., 2017) and recirculation of air from above (Panday and Prinn, 2009). Similarly, the local pollution from the nearby village and city area due to upslope winds from the valley floor is expected to contribute to the morning peak at Bhimdhunga. The evening peak at Naikhandi was at 21:00 LT and was closer to the morning values in comparison to the large difference between morning and evening peaks at Bode and Bhimdhunga. A nighttime buildup (linear increase) of various pollutants compared to the afternoon minimum was typically observed in Bode during the SusKat-ABC measurement period, including the main campaign period (Sarkar et al., 2016; Mahata et al., 2017; Mues et al., 2017). This is mainly associated with the persistent emissions such as those from brick kilns, which are in close proximity to the Bode measurement site under the stable boundary layer. The isolated peak during the morning transition phase at Bhimdhunga could be due to an elevated polluted layer because of the slope wind (Panday et al., 2009). There appears to be less influence of nighttime polluting sources at Naikhandi and Bhimdhunga than at Bode.
The MLH starts increasing after radiative heating of the surface by incoming solar radiation. The heating of the ground causes thermals to rise from the surface layer, resulting in the entrainment of cleaner air from above the boundary layer and leading to the dissolution of a nocturnal stable boundary layer. Increasing wind speeds (4–6 m s−1) during daytime also support turbulent vertical diffusion, as well as flushing of the pollution by less polluted air masses from outside the valley, with stronger horizontal winds allowing significant transport of air masses into the valley. In addition, reduced traffic and household cooking activities during daytime compared to morning and evening rush hours contribute to the reduced CO mixing ratios.
3.2.2 CO diurnal variation across seasons
Due to the lack of availability of simultaneous CO data at all sites covering the entire sampling period, a 1-month period was selected for each season to examine the diurnal variation across the seasons, and to get more insights into the mixing ratios at different times of the day, as reported in Table 4. Figure 4 shows the diurnal variation of CO mixing ratios in Bode, Bhimdhunga and Naikhandi during the selected periods for the three seasons.
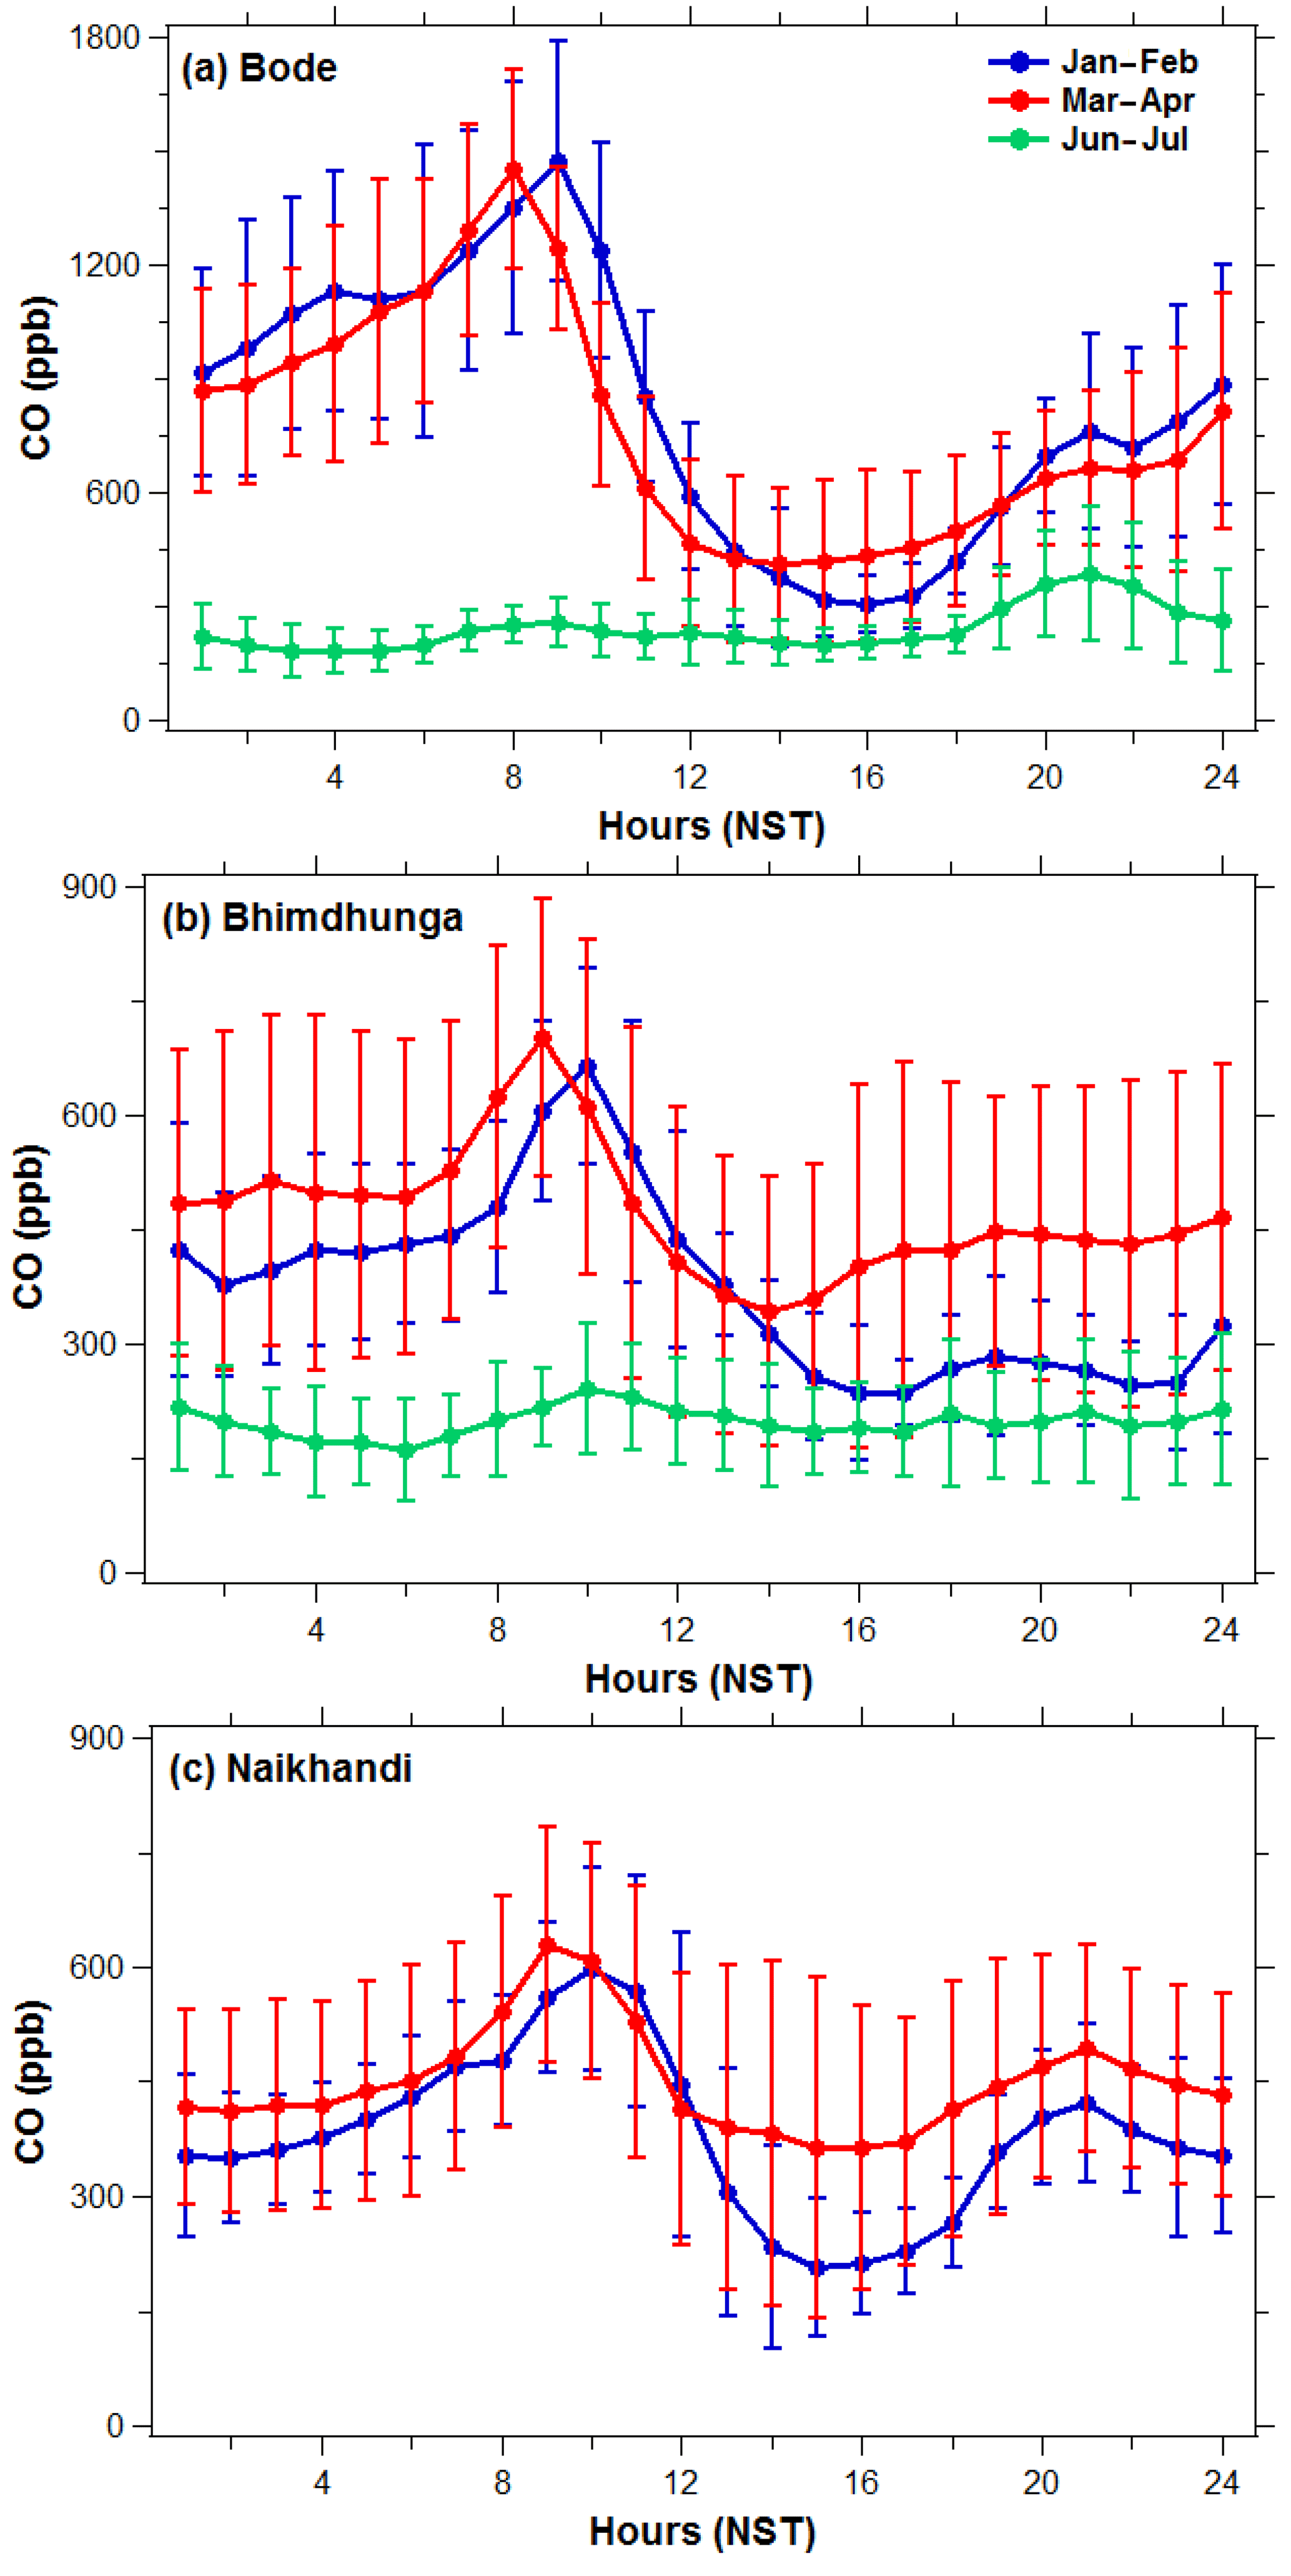
Figure 4Comparison of diurnal variation of hourly average CO mixing ratios for four seasons at Bode, Bhimdhunga and Naikhandi. Due to the lack of continuous data at some sites, data of 1 month in each season were taken for comparison as representative of the winter (16 January–15 February), premonsoon (16 March–15 April) and monsoon (16 June–15 July) season of 2013. Note: y-axis scale of the top panel (Bode) is double that of the lower two panels (Bhimdhunga and Naikhandi).
The diurnal cycles during each season had different characteristics. The most prominent distinction was that the CO mixing ratio was low during the monsoon period over all sites (Fig. 4, Table 4) as a result of summer monsoon rainfall in the valley, which is 60–90 % of the 1400 mm rainfall for a typical year (Nayava, 1980; Giri et al., 2006). Because of the rainfall, the brick production activities are stopped in the valley (usually they are operational from January-April every year). Further, the rainfall also diminishes many burning activities (forest fires, agro-residue and trash burning) within the valley and surrounding region, and thus reduces CO emissions. Afternoon CO mixing ratios were higher in the premonsoon season than in the other two seasons in Bode, Bhimdhunga and Naikhandi (also see Table 4), with the most likely sources being emissions from forest fires and agro-residue burning arriving from outside the valley during this season (this will be discussed further in Sect. 3.2.3). Nighttime accumulation was observed in Bode and Bhimdhunga, but not at Naikhandi, where the mixing ratio decreased slightly from about 20:00 until about 04:00 LT, after which the mixing ratios increased until the morning peak. The nighttime accumulation of CO in Bode during premonsoon and winter is due to the influence of nearby brick kilns (Mahata et al., 2017) because of the calm easterly wind (refer Supplement Fig. S2 in Mahata et al., 2017). Previous studies carried out at the Bode site during the SusKat-ABC campaign have attributed over a dozen brick kilns located near Bode as strong sources of BC and EC (Kim et al., 2015; Mues et al., 2017), NMVOCs (Sarkar et al, 2016, 2017), SO2 (Kiros et al., 2016), and CO (Mahata et al., 2017), and the enhanced concentrations were observed during nighttime and mornings when winds blew from the east and southeast, bringing emissions from the location of the brick kilns to the observation site.
Bhimdhunga is not near any major polluting sources such as brick kilns, and it is unclear whether the nighttime CO accumulation in Bhimdhunga is primarily due to ongoing local residential pollution emissions and/or to pollution transported from remote sources. The transition of the wind from westerlies during the day to easterlies during the night, with moderate wind speed (∼ 2–4 m s−1) at Bhimdhunga, may bring polluted air masses westwards that were initially transported to the eastern part from the Kathmandu Valley during the daytime (Regmi et al., 2003; Panday and Prinn, 2009; Panday et al., 2009).
The distinct shift in the morning peak was seen at all 3 sites by season. The 1 h shift in the morning peak from the premonsoon to winter is due to an earlier onset of the morning transition. However, the 1 h difference in the morning peak between Bode (premonsoon at 08:00 LT; winter at 09:00 LT) and Bhimdhunga and Naikhandi (premonsoon at 09:00 LT; winter at 10:00 LT) in the premonsoon and winter is associated with commencement of early local emissions under the shallow boundary layer at Bode. The 1 h lag in the morning peak at Bhimdhunga and Naikhandi may be due to transport of city pollutants to the sites.
Across the seasons, the afternoon (12:00–16:00 LT) CO mixing ratio was higher during the premonsoon period than in the winter at all three stations (p value for all sites <0.5) (Table 4), although the mixing layer was higher in the premonsoon season than in the winter in Bode (and presumably at the other sites as well). This is not likely to be explained by local emissions in the valley, since these are similar in the winter and premonsoon periods. Putero et al. (2015) suggested instead that this reflects an influx of polluted air into the valley due to large synoptic circulation patterns during the premonsoon season. Such regional influences are explored further in the next section.
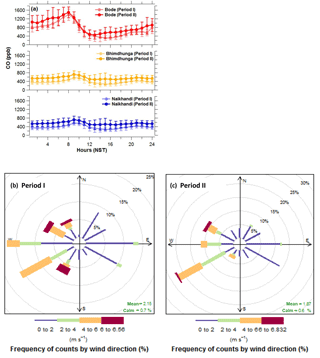
Figure 5Comparison of hourly average CO mixing ratios during normal days (16–30 March), labeled as period I (faint color), and episode days (1–15 April), labeled as period II (dark color), in 2013 at (a) Bode, Bhimdhunga and Naikhandi in the Kathmandu Valley. The wind roses at Bode corresponding to two periods are also plotted (b) period I and (c) period II respectively.
3.2.3 Regional influence on CO in the valley
Recent studies have indicated the likelihood of regional long-range transport contributing to air pollution in different parts of Nepal (Marinoni et al., 2013; Tripathee et al., 2014; Dhungel et al., 2018; Rupakheti et al., 2017; Lüthi et al., 2015; Wan et al., 2017, including the Kathmandu Valley, especially during the premonsoon period (Panday and Prinn, 2009; Putero et al., 2015; Bhardwaj et al., 2018). During the premonsoon season, frequent agro-residue burning and forest fires are reported in the IGP region, including southern Nepal and the Himalayan foothills in India and Nepal (Ram and Sarin, 2010; Vadrevu et al., 2012), as well as in the Kathmandu Valley. This season is also characterized by the strongest daytime local wind speeds (averaging 4–6 m s−1) in the Kathmandu Valley (Mahata et al., 2017). Our study also observed several episodes of days with both elevated CO mixing ratios (Fig. 2) and O3 mixing ratios (also measured in parts per billion by volume; hereafter the unit is denoted as ppb) (Fig. 5) during April and May, especially during the late-afternoon period. The influence of regional pollutants was investigated by comparing a 2-week period with normal CO levels (16–30 March (hereafter “period I”) with an adjacent 2 week period (1–15 April) with episodically high CO mixing ratios (hereafter “period II”), which nicely fit with the “burst” in regional fire activity presented by Putero et al. (2015) in their Fig. 9. The t tests of the two hourly data means of CO in period I and period II at Bode, Bhimdhunga and Naikhandi (as in Fig. 5) were performed at 95 % confidence level and the differences were found to be statistically significant (p<0.5).
Figure 5a shows the diurnal cycle of CO mixing ratios during period I (faint color) and period II (dark color) at Bode, Bhimdhunga and Naikhandi. The difference between the two periods was calculated by subtracting the average of period I from the average of period II. The average CO mixing ratios during period II were elevated with respect to period I by 157 ppb at Bode, 175 ppb at Bhimdhunga and 176 ppb at Naikhandi. The enhancements in mixing ratios at the three sites were fairly similar from hour to hour throughout the day, with the exception of the late afternoon when the enhancement was generally greatest. This consistency across the sites suggests that the episode was caused by a large-scale enhancement (regional contribution) being added onto the prevailing local pollution levels at all the sites. A large-scale source would also be consistent with the greater enhancements of CO at the outskirt sites, which would be most directly affected by regional pollution, compared to the central valley site of Bode, with strong local sources. The enhancement during the period II is substantial (statistically significant as mentioned above), representing an increase of approximately 45 % at the outskirt sites of Bhimdhunga and Naikhandi (which start with lower CO levels), and 23 % at Bode. During both period I and II, local winds from the west (the opposite direction from the brick kilns, which were mostly located to the southeast of Bode) were dominant during daytime at Bode (Fig. 5b, c). This suggests that the elevation in CO levels was caused by additional emissions in period II in the regions to the west and southwest of the Kathmandu Valley, e.g., large-scale agricultural burning and forest fires during this period, as also noted by Putero et al. (2015) (see their Fig. 9). Far away, in Lumbini in the southern part of Nepal (Rupakheti et al., 2017) and Pantnagar in northern IGP in India (Bharwdwaj et al., 2018), about 220 km (aerial distance) to the southwest and 585 km to the west of the Kathmandu Valley, respectively, CO episodes were also observed during the spring season of 2013, providing a strong indication that the episode in period II was indeed regional in nature.
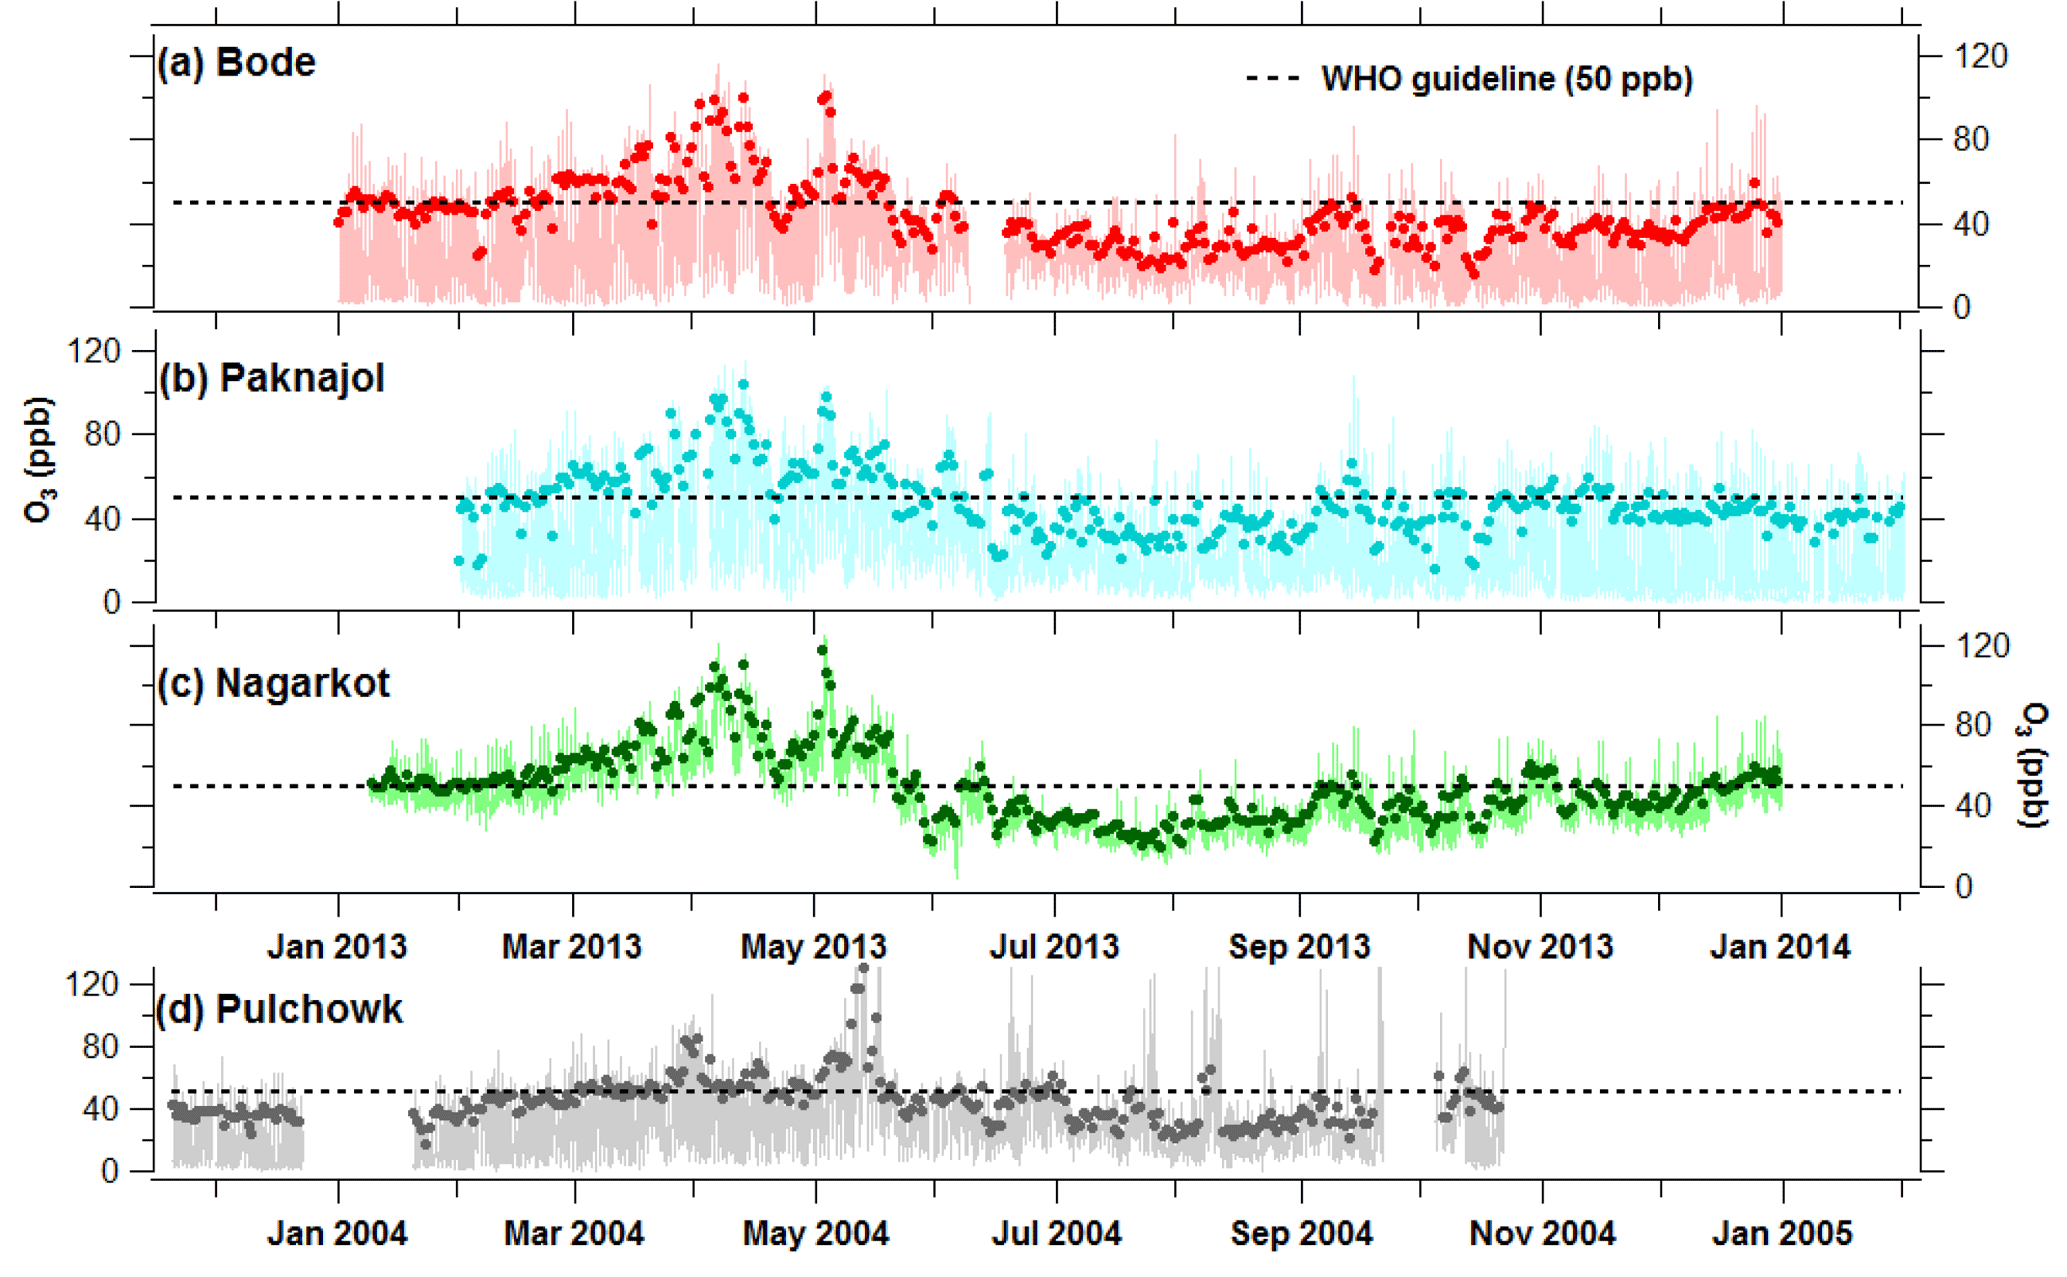
Figure 6Time series of hourly average (faint-colored line) and daily maximum 8 h average (solid-colored circle) O3 mixing ratio at (a) Bode (semiurban), (b) Paknajol (urban) and (c) Nagarkot (hilltop) observed during 2013–2014, and (d) Pulchowk (urban) observed during November 2003–October 2004 in the Kathmandu Valley. Black dotted line represents WHO guideline (50 ppb) for daily maximum 8 h average of O3.
3.3 O3 in the Kathmandu Valley and surrounding areas
Figure 6 shows the hourly average and daily maximum 8 h average of O3 mixing ratios at Bode, Paknajol and Nagarkot from measurements during the SusKat campaign and afterwards, along with O3 mixing ratios from a previous study (November 2003–October 2004; Pudasainee et al., 2006) at the Pulchowk site (4 km away from Paknajol) in the Latitpur district. The daily maximum 8 h average O3 was calculated by selecting the maximum O3 mixing ratio from 8 h running averages during each day. The nighttime mixing ratio of hourly O3 drops close to zero in Bode, Paknajol and Pulchowk in the winter season. This is a typical characteristic of many urban areas where reaction with NO at night depletes O3 from the boundary layer (e.g., Talbot et al., 2005). In the premonsoon and monsoon months, the titration is not as strong and the hourly O3 falls, but generally remains above 10 ppb. Similar patterns of ozone mixing ratios were observed at other sites in northern South Asia. For example, higher O3 mixing ratios were observed in the afternoon (84 ppb) and lower during the night and early morning hours (10 ppb) at Kullu Valley, a semiurban site located at 1154 m a.s.l., in the northwestern Himalayas in India (Sharma et al., 2013). A similar dip in O3 value in the dark hours was observed at Ahmedabad, India, by Lal et al. (2000). Nagarkot, in contrast, is above the valley's boundary layer and has lesser NO for titration at night at this hill station, as has been observed in another hill station in Himalayan foothills (Naja and Lal, 2002). Thus, the O3 level remains above 25 ppb during the entire year at Nagarkot. As also shown in Table 3, at all sites, the O3 mixing ratios were highest in the premonsoon period, but the timing of the lowest seasonal values varied across the sites: postmonsoon in Bode, winter in Paknajol and monsoon in Nagarkot. Such differences in minimum O3 across the sites can be anticipated due to the locations of the sites (e.g., urban, semiurban, rural and hilltop sites, with differing availabilities of O3 precursors from different emission sources). The seasonal variations of O3 observed at Bode in this study are consistent with Putero et al. (2015) and Pudasainee et al. (2006), who also observed O3 maxima during the premonsoon period, but O3 minima during the winter season.
Table 3Summary of the monthly average ozone mixing ratios (ppb) at four sites∗ in the Kathmandu Valley, Nepal during 2013–2014 and two sites (Manora Peak and Delhi) in India. Avg – average, SD – standard deviation, Min. – minimum, Max. – maximum.
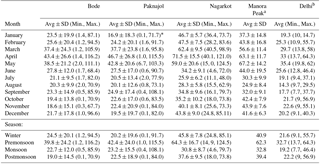
a Kumar et al. (2010). b Ghude et al. (2008). ∗ O3 data of Paknajol on January was of 2014.
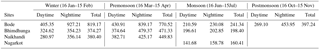
Table 4Average CO mixing ratio (ppb) at different times of the day (daytime – 12:00–16:00 LT, and nighttime – 23:00–03:00 LT) and the monthly average (total) at four sites in the Kathmandu Valley.
The daily maximum 8 h average O3 mixing ratio (solid colored circles in Fig. 6) exceeded the WHO recommended guideline of 50 ppb (WHO, 2006, black dotted line in Fig. 6) most frequently during the premonsoon period and the winter. During the observation period, the daily maximum 8 h average O3 exceeded the WHO guideline on 102 out of 353 days of observation (29 %) at Bode, 132 out of 354 days (37 %) at Paknajol and 159 out of 357 days (45 %) at Nagarkot. The higher exceedance rate at Nagarkot is because it is at higher altitude, which results in (i) greater exposure to large-scale regional pollution, especially from forest fires in the Himalayan foothills and agro-residue burning in the IGP region, outside the Kathmandu Valley (Sinha et al., 2014; Putero et al., 2015); (ii) less titration of O3 by NOx, being farther away from the main pollution sources; and (iii) exposure to O3-rich free tropospheric air, including influences from stratospheric intrusions. The diurnal profiles of O3 mixing ratios (Fig. 7) at three sites (Bode and Paknajol in the valley and Nagarkot, a hilltop site normally above the Kathmandu Valley's boundary layer) show, notably in the morning hours, that the residual layer above the Kathmandu Valley's mixing layer contains a significant amount of ozone. Based on the surface ozone data collected at Paknajol during 2013–2014, Putero et al. (2015) concluded that downward mixing of ozone from the residual layer contributes to surface ozone in the Kathmandu Valley in the afternoon hours (11:00–17:00 LT). It is likely that the same source has also contributed to higher ozone mixing ratios at Nagarkot. Such mixing has been observed at other sites as well. Wang et al. (2012) reported the increase in downward mixing of O3 from the stratosphere to the middle troposphere (56 %) and the lower troposphere (13 %) in spring and summer in Beijing. The downward flux was highest in the middle troposphere (75 %) in winter. Similarly, Kumar et al. (2010) reported more than 10 ppb of stratospheric contribution at a high-altitude site (in Nainital) during January to April. However, there were no significant stratospheric intrusions seen in spring and summer (seen only in winter) at Nepal Climate Observatory – Pyramid (Putero et al., 2016).
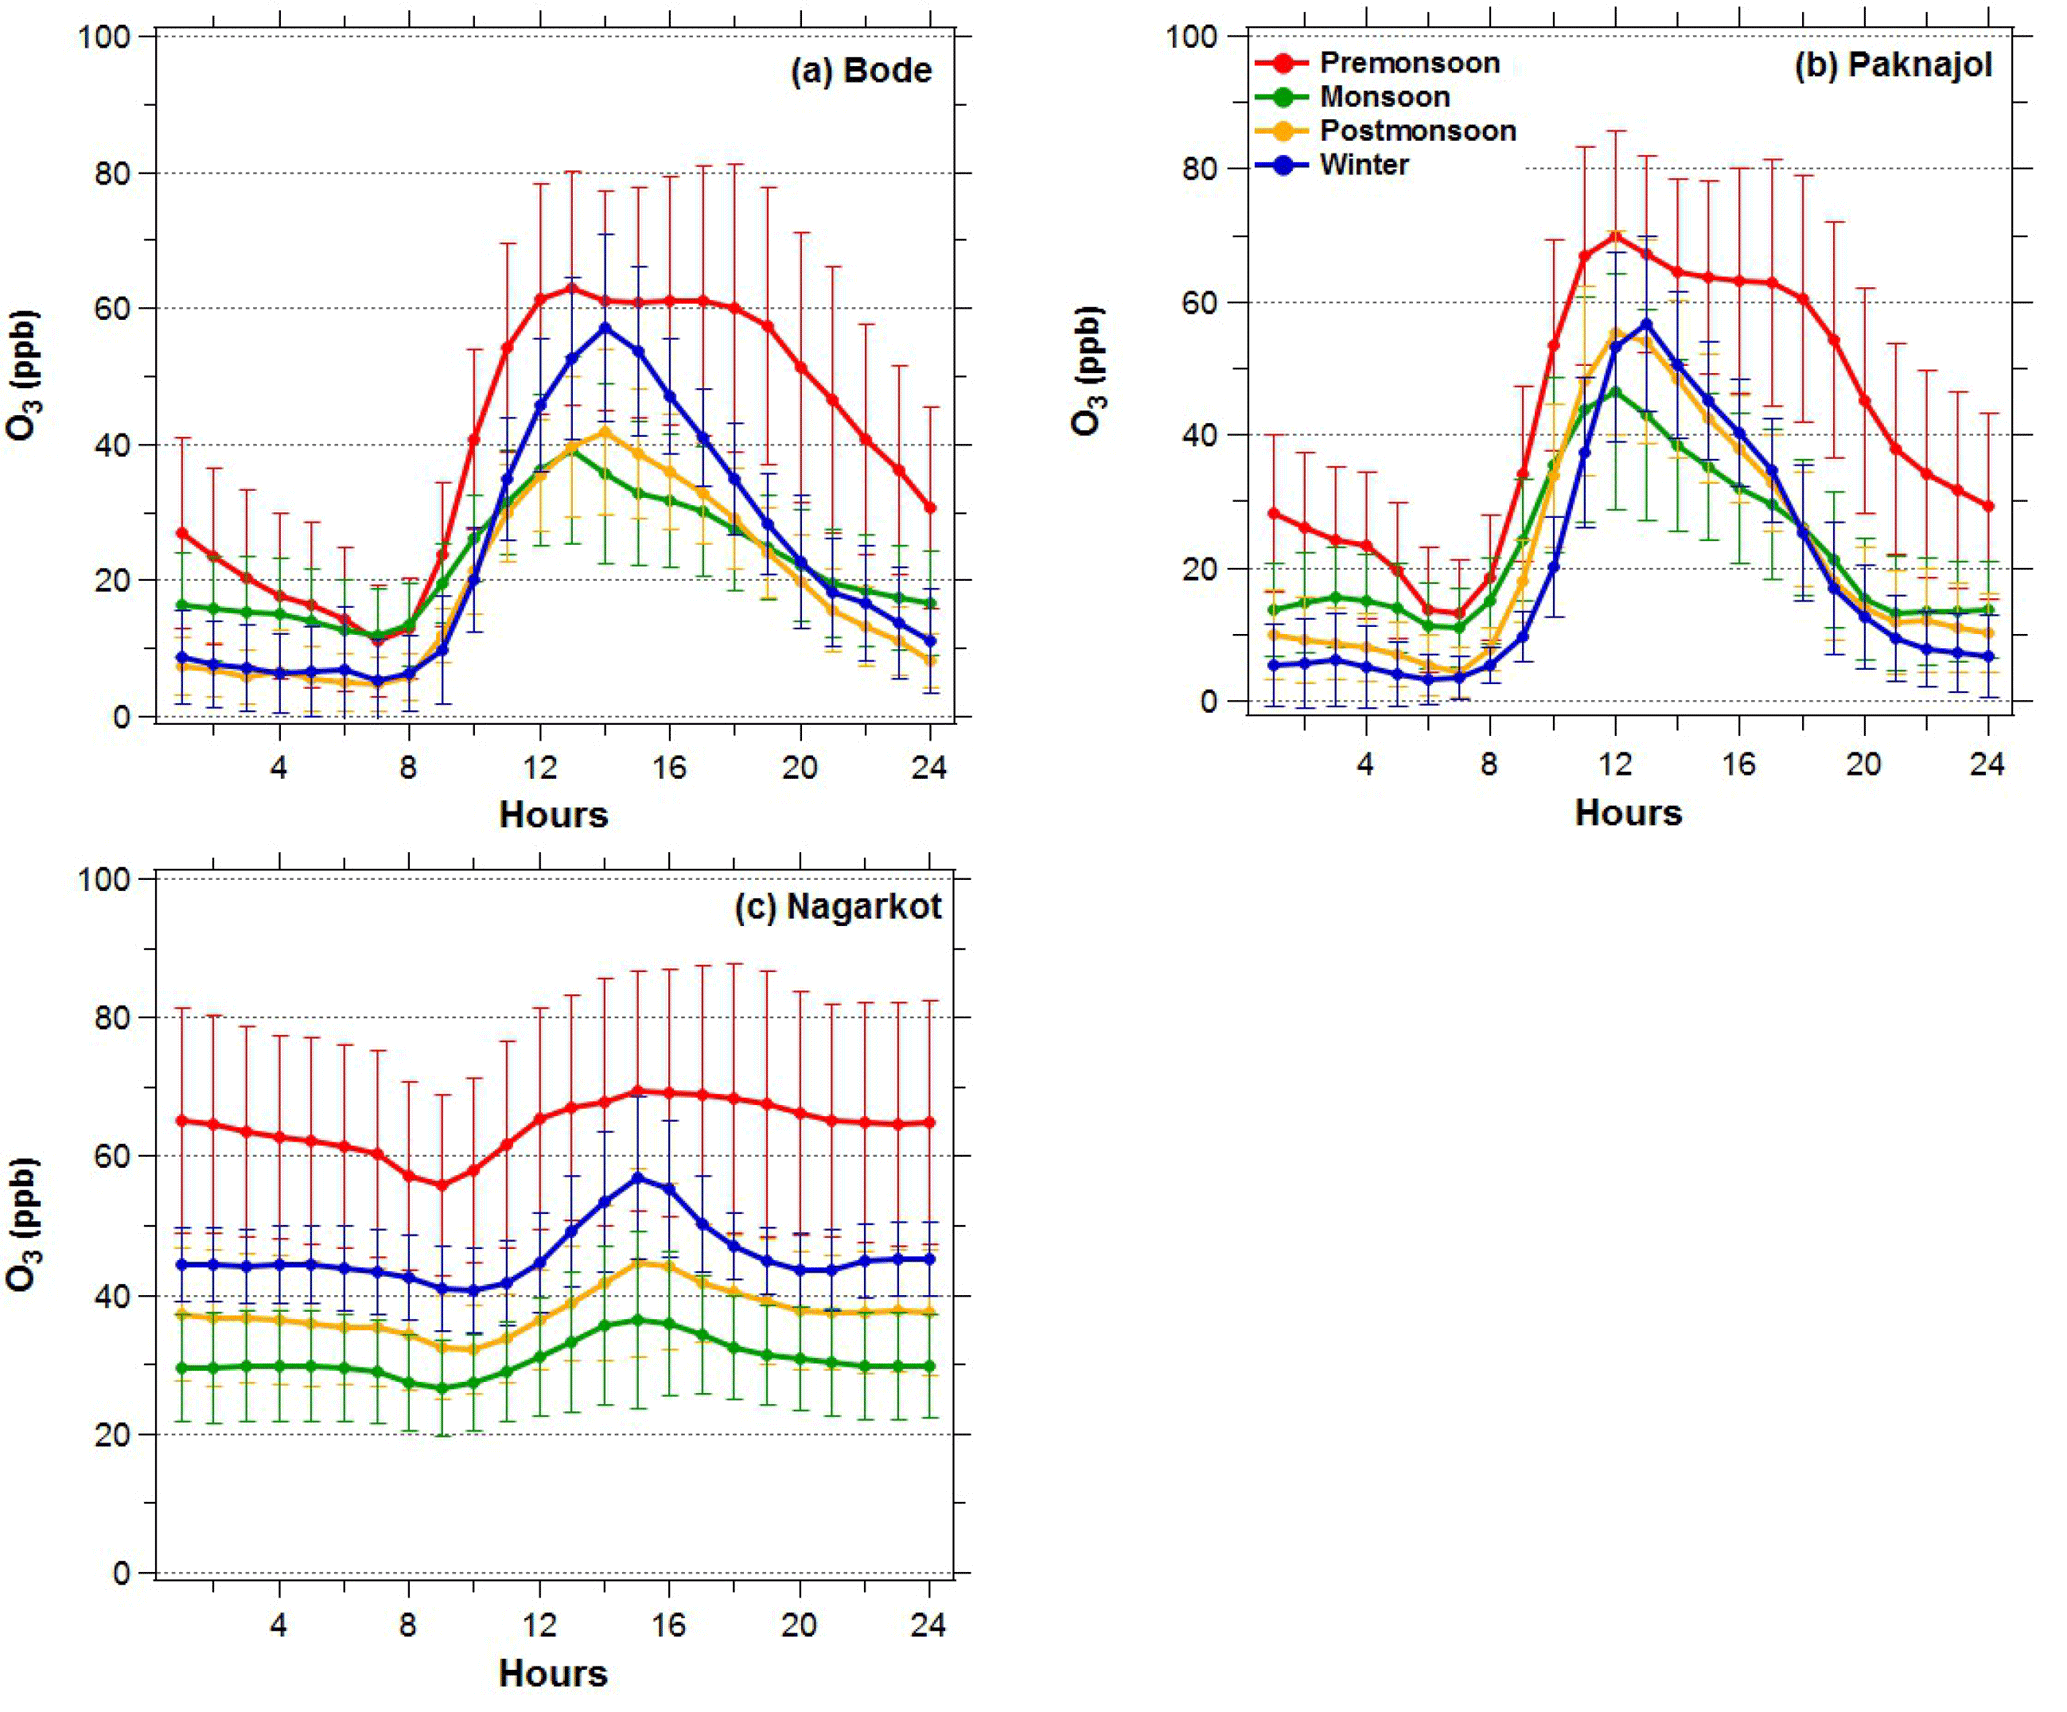
Figure 7Diurnal pattern of hourly average O3 mixing ratio for different seasons during January 2013–January 2014 at (a) Bode, (b) Paknajol and (c) Nagarkot in the Kathmandu Valley. The four seasons (described in the text) are defined as premonsoon (March–May), monsoon (June–September), postmonsoon (October–November) and winter (December–February).
During the SusKat-ABC campaign in 2013 and later in 2014, passive sampling of gaseous pollutants (SO2, NOx, NH3 and O3) was carried out at 14 sites including urban/semiurban sites (Bode, Indrachowk, Maharajganj, Mangal Bazar, Suryabinayak, Bhaisepati, Budhanilkantha, Kirtipur, and Lubhu) and rural sites (Bhimdhunga, Naikhandi, Sankhu, Tinpiple, and Nagarkot) in the Kathmandu Valley (Kiros et al., 2016). Similar to this study, they also observed higher O3 mixing ratios in rural areas than the urban/semiurban sites in the Kathmandu Valley. Exceedances of the WHO standard are most common during the premonsoon season, occurring 78 % (72 out of 92 days), 88 % (78 out of 89 days) and 92 % (85 out of 92 days) of the time at Bode, Paknajol and Nagarkot, respectively. A study by Putero et al. (2015), based on O3 mixing ratio measurements at Paknajol in the Kathmandu Valley, as a part of the SusKat-ABC campaign, has reported that the dynamics (both by horizontal and vertical winds) play a key role in increased O3 mixing ratios in the afternoon in the Kathmandu Valley. They estimated that the contribution of photochemistry varied as a function of the hour of the day, ranging from 6 to 34 %. Unfortunately, no viable NOx measurements were obtained at any site in the Kathmandu Valley and surrounding mountain ridges during the SusKat-ABC campaign. Speciated VOCs were measured at Bode only for about 2 months but NOx was not available for the same period. Therefore we were not able to discern quantitatively proportional contributions of NOx, VOCs and intrusion (chemistry vs. dynamics) from the free troposphere or lower stratosphere to observed O3 concentrations at Nagarkot, Bode and other sites in the Valley. In the context of protecting public health, crops and regional vegetation, the O3 mixing ratios in the Kathmandu Valley and surrounding areas clearly indicate the urgent need for mitigation action aimed at reducing emissions of its precursor gases NOx and VOCs. However, air quality management plans need to carefully consider the reduction strategies of NMVOCs or NOx while aiming at mitigating the O3 pollution in the Kathmandu Valley. If the correct strategy (NMVOCs vs. NOx) is not applied, then O3 mixing ratios could increase, for example as seen in Huszar et al. (2016) who reported that reducing NMVOCs in urban areas in central Europe leads to O3 reduction, whereas the focus on NOx reduction results in O3 increase.
The SusKat-ABC O3 data can be compared to observations made about a decade ago by Pudasainee et al. (2006) at the urban site of Pulchowk, not far from Paknajol, as plotted in Fig. 6d. The daily maximum 8 h average O3 had exceeded the WHO guideline at Pulchowk for 33 % (95 out of 292 days) of days during the observation from November 2003 to October 2004. The exceedance was 38 % (133 out of 354 days) of days at Paknajol during February 2013–March 2014. Due to inter-annual variability and differences in the seasonal observation time periods at Pulchowk and Paknajol, we cannot draw any conclusions about trends over the decade between the observations because of the difference in location and sampling height as well as a general difference in instrument calibration. However, a clear similarity between the observations is that most of the exceedance took place during premonsoon season, during which both studies have observations throughout the season (∼90 days). The percentage of exceedance at Pulchowk during the premonsoon season in 2003–2004 was 70 % (63 out of 90 days) and at Paknajol in 2013 it was 88 % (78 out of 89 days). However, just like for the annual fraction of exceedances, due to inter-annual variability we cannot say that the 18 % (or ca. 15 days) difference in the exceedances is significant. A longer term O3 record would be needed to really establish whether there is a trend in the ozone concentrations.
3.4 O3 seasonal and diurnal variation
The seasonal average O3 mixing ratios at Bode, Nagarkot and Paknajol are shown in Table 3. For comparison, the O3 mixing ratios measured at two sites in India, (i) Manora Peak (1958 m a.s.l.), a site in rural mountain setting ca. 9 km from Nainital city, and (ii) Delhi, a highly polluted urban setting in northwest IGP, are also listed in the Table, based on results from Kumar et al. (2010) and Ghude et al. (2008). There is a strong similarity between the urban and semiurban sites in Nepal (i.e., Bode, Paknajol) and India (i.e., Delhi), as well as between the rural and mountain sites in Nepal (i.e., Nagarkot) and India (i.e., Manora Peak), with small differences. The peak mixing ratios were in the premonsoon period: at the rural and mountain sites the peak ozone mixing ratio values were very similar (64 and 62 ppb for Nagarkot and Manora Peak, respectively) and are due to influences discussed earlier for Nagarkot; at the suburban and urban sites the premonsoon values are significantly lower (ca. 40, 42, 33 ppb for Bode, Paknajol, Delhi, respectively) due to fresh NOx emissions near the urban sites and the consequent titration of ozone with NO. The lowest O3 seasonal values at rural and mountain sites typically occur in the monsoon months, while for semiurban and urban sites the minimum was observed during postmonsoon (Bode) and winter (Paknajol).
Figure 7 shows the diurnal variation of O3 mixing ratios at Bode, Paknajol and Nagarkot in the different seasons. The typical O3 maximum mixing ratio in the early afternoon at the urban and semiurban sites is mainly due to daytime photochemical production as well as entrainment of ozone due to dynamics (both intrusion of ozone-rich free tropospheric air into the boundary layer and regional-scale horizontal transport of ozone), as explained in the case of Paknajol by Putero et al. (2015).
The ozone mixing ratios are relatively constant throughout the day at Nagarkot (∼1901 m a.s.l.), which, being a hilltop site, is largely representative of the lower free tropospheric regional pollution values; however, it is also affected by ozone production from precursors transported from the Kathmandu Valley due to westerly winds during the afternoon hours. The dip in O3 at Nagarkot (Fig. 7) in the morning transition hours indicates the upward mixing of air from the polluted (and ozone-depleted) nocturnal boundary layer as it is breaking up.
3.5 CO emission flux estimate
It is possible to determine a top-down estimate of the average CO emission flux for the morning hours for the region around the Bode site by applying an approach that was developed and used in Mues et al. (2017) to estimate the emission fluxes of BC at Bode. The analysis of Mues et al. (2017) found BC fluxes for the Kathmandu Valley that were considerably higher than the widely used EDGAR HTAP emission database (Version 2.2). Support for this top-down estimate was found by considering the BC concentrations and fluxes for the Kathmandu Valley in comparison to Delhi and Mumbai; although the observed BC concentrations were similar in all three locations, the EDGAR HTAP V2.2 emissions of BC for the Kathmandu Valley are much lower than those for Delhi and Mumbai, while the top-down emissions estimates for the Kathmandu Valley were similar to the emissions from EDGAR HTAP V2.2 for Delhi and Mumbai (Mues et al., 2017).
Here we apply the same method as developed in Mues et al. (2017) to estimate the CO fluxes based on the observed CO mixing ratio and ceilometer observations of the mixing layer height (MLH) in Bode for a period of 1 year (March 2013–February 2014). Using the approach used by Mues et al. (2017), the CO fluxes can be calculated from the increase in CO concentrations during the nighttime period when the MLH is nearly constant, using the following:
where FCO(tx,ty) is the CO emission flux (in µg m−2 s−1) between time tx and ty (in hours), ΔCO is the change in CO mixing ratio (in µg m−3) between time tx and ty, ave(MLH(tx), MLH(ty)) are averages of the mixing layer heights (in m) between time tx and ty, Δt is the time interval between tx and ty, and MLH(ty)∕MLH(tx) is mixing layer collapse factor, accounting for the small change in MLH between the night and the morning hours. The calculation of the emission flux is based on mean diurnal cycle per month of CO and MLH, and tx and ty represent the time with the minimum (tx) and the maximum (ty) CO concentration in the night and morning (see Mues et al., 2017, for details).
This method of calculating the CO emission flux is based on five main assumptions:
- i.
CO is well-mixed horizontally and vertically within the mixing layer in the region immediately surrounding the Bode site.
- ii.
The MLH remains fairly constant during the night so that the product of the CO concentration (µg m−3) and the MLH (m) represents CO mass per unit area within the column, and any change in mass per unit area represents the net flux into the column.
- iii.
The transport of air pollutants into and out of the stable nocturnal boundary layer of the valley is negligible, which is supported by the calm winds (<1 m s−1) during the night and morning hours at the site (Mahata et al., 2017).
- iv.
The vertical mixing of pollutants between the mixing layer and the free atmosphere is assumed to be negligible at night, and thus the estimated CO flux calculated with Eq. (1) is strictly only valid for the morning hours. When applied to the whole day the implicit assumption is that the emissions are similar during the rest of the 24 h period. An assumption is viable on average for some sources like brick kilns that operate day and night, but that does not apply to all sources, e.g., the technique will tend to underestimate emissions due to traffic, which are typically much stronger during the day than at night, while it will overestimate emissions due to waste burning, which is typically more prevalent during the night and early morning (presunrise) than during the daytime. This assumption is made because Eq. (1) only works well for calculating the CO flux during the period from night to morning, when there is a relatively constant MLH and limited vertical and horizontal mixing.
- v.
CO emission is assumed to be uniform throughout the valley; this may not be correct, but cannot be verified until a high-resolution emission data inventory is available, which is being developed for the Kathmandu Valley and rest of Nepal with a 1 km × 1 km spatial resolution (Sadavarte et. al., 2018).
During nighttime assumption (i) might not be entirely correct since the degree of mixing in the nocturnal stable layer and thus the vertical mixing are drastically reduced compared to daytime (and thus the term “mixing layer” is not entirely accurate, but we nevertheless apply it here due to its common use with ceilometer measurements). This adds a degree of uncertainty to the application of ceilometer observations to compute top-down emissions estimates, which will only be resolved once nocturnal vertical profile measurements are also available in order to characterize the nocturnal boundary layer characteristics and the degree to which the surface observations are representative of the mixing ratios throughout the vertical column of the nocturnal stable layer.
It is not possible to directly compute the emission flux for a full 24 h day using this top-down method, since the emissions during the day could be either greater or smaller than at night, and because the other assumptions do not hold (in particular there is considerable vertical mixing with the free troposphere and stronger horizontal transport during the daytime). Thus the top-down computation only provides a useful indicative value. However, while it is also not possible to estimate how different the daytime emissions are, it is possible to determine an absolute lower bound for the CO flux (FCOmin) by making the extreme assumption that the CO emissions are nonzero only during the hours that were used in the calculation, and that they were zero during the rest of the day (this provides a lower bound to the emissions since the daytime emissions physically cannot be negative). This lower bound of the flux (FCOmin) is thus calculated by scaling back the 24 h flux to only apply it over the calculation time interval (Δt), using the following:
Figure 8 shows the estimated monthly CO emission flux, along with its 25th and 75th percentile values as an indication of the variability of the estimated flux in each month; the lower bound of the CO flux based on Eq. (2) is also shown. The estimated annual mean CO flux at Bode is 4.9 µg m−2 s−1. Seasonally, the emissions are computed to be highest during December to April (3.6–8.4 µg m−2 s−1), coinciding with the brick kiln operation period, which resulted in elevated concentrations of most pollutants at Bode (Kim et al., 2015; Chen et al., 2015; Sarkar et al., 2016; Mahata et al., 2017; Mues et al., 2017), including CO (Bhardwaj et al., 2018; Mahata et al., 2017), while the emissions were generally lower during the remaining months (0.5–5.4 µg m−2 s−1). The uncertainty in the top-down CO emissions estimate will be largest during June to October, due to the greater diurnal and day-to-day variability with the minimum and maximum CO mixing ratio values during the night and early morning used in Eq. (1) often being less distinct than in the other months.

Figure 8The estimated monthly average CO emission flux, which is based on the mean diurnal cycle of CO mixing ratios of each month for two conditions: (i) with data of all days (CO flux; blue dot) with lower and upper ends of the bar representing 25th and 75th percentile, respectively, and (ii) with data of morning hours (CO flux minimum; green dot) in which zero emission is assumed for the other hours of the day. The fluxes for July were not estimated as there were insufficient (less than 15 days) data of concurrent CO and mixing layer height. It is expected that the FCO and for July should fall between values for June and August 2013.
Comparing the annual mean top-down estimated CO emission flux at Bode (4.9 µg m−2 s−1) with available global and regional emission inventories, the top-down estimated CO flux is twice the value, 2.4 µg m−2 s−1, for the Kathmandu Valley in the EDGAR HTAP V2.2 emission inventory database for 2010 (note that the CO emission values for the location at Bode and the value averaged for the valley, at 27.65–27.75∘ N, 85.25–85.40∘ E, were found to be the same up to two significant figures). The estimated CO flux was 6.5–8 times as high as in the REAS database (0.63–0.76 µg m−2 s−1, based on the 2008 values in Kurokawa et al., 2013), and between 3 and 14 times higher than the values in the INTEX-B database for 2006 (0.35–1.77 µg m−2 s−1; Zhang et al., 2009). The large differences between our estimated CO emission flux and these emission databases is not likely to be due to the comparison of data for different years; rather, it indicates the substantial uncertainties in both the top-down and bottom-up approaches to estimating the emission flux. Although our approximation of the emission flux relies on several assumptions, the fact that the lower bound value that we calculate is still as high as or higher than the values in some of the published emission datasets likely indicates that the bottom-up emissions are missing or underestimating some important sources, which will be important to examine carefully and improve as a basis for interpreting future modeling studies of CO pollution in the Kathmandu Valley and surrounding regions, as well as for assessing possible mitigation options.
The emission estimates computed here are subject to several further uncertainties, which are discussed in detail in Mues et al. (2017). In short, the uncertainties of CO flux estimates arise from (i) the assumption that Bode site represents the whole atmospheric column and entire valley, which is not possible to verify without having many simultaneous monitoring stations in the valley (measurements at a few sites where CO was monitored for this study show some differences in CO mixing ratios); (ii) the higher variability (unclear minima and maxima during the morning and night hours) in the diurnal cycles of CO from June to October show a much higher variability than other months, which in turn makes it difficult to choose the exact hour of CO minimum and maximum needed for the flux estimation; and (iii) the possible impact of wet deposition is not taken into account but would rather generally cause the emission rate to be underestimated.
Ambient CO and O3 mixing ratios were measured in the framework of the SusKat-ABC international air pollution measurement campaign at five sites (Bode, Paknajol, Bhimdhunga, Naikhandi and Nagarkot) in the Kathmandu Valley (Table 1) and its fringes, initially during January to July 2013 and later extended to 1 year at three sites (Bode, Paknajol and Nagarkot) to better understand their seasonal characteristics. The observed CO and O3 levels at all sites except Nagarkot were characteristic of highly polluted urban settings, with the particular feature that the bowl-shaped valley and resulting meteorology had several effects on the pollution levels.
At all sites, the CO mixing ratios were higher during the early morning and late evening, an observation that is especially connected to the interplay between the ventilation of the boundary layer and the diurnal cycles of the emission sources. Under calm wind conditions that limited mixing within, into and out of the Kathmandu Valley, the morning CO peak tended to be more pronounced due to the buildup of pollution at night in the shallow planetary boundary layer. This nocturnal buildup was especially strong during January to April at Bode, with the mean CO mixing ratio increasing by about a factor of 4 in the 12 h period from 20:00 to 08:00 LT, especially due to operation of nearby brick kilns continuing through night. During the daytime, the wind becomes stronger and the horizontal and vertical circulation dilutes and transports pollution around and out of the valley. Although normally the pollution levels are presumed to be higher in the heavily populated valley than in the immediate surrounding region, occasionally the synoptic circulation will transport in CO and O3-rich air, especially that influenced by forest fires and agro-residue burning in the IGP region and Himalayan foothills, as was observed during a few episodes in the premonsoon season.
The observed O3 mixing ratio was highest in the premonsoon season at all sites, and the daily maximum 8 h average O3 exceeded the WHO guideline of 50 ppb on about 80 % of the days during this season at the semiurban/urban sites of Bode and Paknajol, while at Nagarkot (which is in the free troposphere, i.e., above the valley's boundary layer most of the time, especially during nighttime) it exceeded the WHO guideline on 92 % of the days in premonsoon season. During the whole observation period, the 8 h maximum average O3 exceeded the WHO recommended value on 29 %, 37 % and 45 % of the days at Bode, Paknajol and Nagarkot, respectively. The diurnal cycle showed evidence of photochemical production, larger scale advection of polluted air masses and possible down-mixing of O3 during the daytime, as also observed by Putero et al. (2015) at Paknajol, with the hourly mixing ratio at the polluted site increasing from typically 5–20 ppb in the morning to an early afternoon peak of 60–120 ppb (Putero et al., 2015; Bhardwaj et al., 2018).
These high O3 levels have deleterious effects on human health and ecosystems, including agro-ecosystems in the Kathmandu Valley and surrounding regions, thus justifying mitigation measures to help reduce the levels of O3, its precursors VOCs and NOx, CO, and other pollutants. Determining the most effective mitigation measures will be challenging due to the complicated interplay of pollution and meteorology as well as local and regional pollution sources. This study has provided information on current ambient levels and the diurnal and seasonal variations. This will be helpful in the design of future policies, both as a baseline for evaluating the effectiveness of mitigation measures, as well as giving insight into the connections between various pollutant sources (e.g., brick kilns) and their impacts on seasonally elevated CO levels, especially at nighttime. One particular contribution has been the development of a top-down estimate of the total emission flux of CO at Bode, which was found to be 4.9 µg m−2 s−1. This is several times higher (by a factor of 2–14) than the CO emission fluxes for the Kathmandu Valley in state-of-the-art inventories such as EDGAR-HTAP, REAS and INTEX-B. This points out the need for the development of updated comprehensive emission inventory databases for this region. The improved emission inventory is necessary to provide more accurate input to model simulations to assess air pollution processes and mitigation options for the Kathmandu Valley and the broader surrounding region.
While the high levels of particulate pollution in the Kathmandu Valley have caught the main attention of the public and policymakers, due to their immediately visible nature, our paper points out that ozone is also a serious problem here. In fact, its higher levels on the nearby mountaintop location of Nagarkot, which is much more representative of regional air pollution, point to an ozone problem in the wider foothills of the Himalayas. In fact the extent of ozone pollution in the large surrounding Himalayan foothills has been insufficiently recognized until our study. This needs monitoring and research to identify feasible mitigation options.
The observational data collected for this study will be made public through the SusKat website of IASS. They are also available upon direct request sent to maheswar.rupakheti@iass-potsdam.de and khadak.mahata@iass-potsdam.de.
MR, AKP and MGL designed the SusKat-ABC international air pollution measurement campaign. KSM, MR and MGL designed this study. KSM, PB, MR, MN and PC carried out measurements at various sites. DP provided ozone data from Pulchowk site. KSM and AS analyzed the data. AM calculated CO flux. KSM prepared the paper with inputs from all co-authors.
The authors declare that they have no conflict of interest.
This article is part of the special issue “Atmospheric pollution in the Himalayan foothills: The SusKat-ABC international air pollution measurement campaign”. It is not associated with a conference.
We are thankful to the funders of the IASS – the German Ministry of
Education and Research (BMBF) and the Brandenburg State Ministry of Science,
Research and Culture (MWFK) – for their generous support in making these
measurements and their analysis possible. This study was partially supported
by core funds of ICIMOD contributed by the governments of Afghanistan,
Australia, Austria, Bangladesh, Bhutan, China, India, Myanmar, Nepal, Norway,
Pakistan, Switzerland and the United Kingdom, as well as by funds from the
Government of Sweden to ICIMOD's Atmosphere Initiative. The authors would
like to thank Bhupesh Adhikary, Bhogendra Kathayat, Shyam Newar, Dipesh
Rupakheti, Nirjala Koirala, Ashish Bhatta, Begam Roka, Sunil Babu Khatry,
Giampietro Verza and several staff members at the Kamdhenu Madhyamik
Vidhyalaya; Naikhandi who assisted in the field measurements; Siva Praveen
Puppala for initial data processing; and Pankaj Sadavarte for helping with
the emission databases. We are grateful to the Department of Environmental
Sciences, University of Virginia, USA, for making CO and O3
instruments available for the measurements. We also thank the staff at Real
Time Solutions (RTS), Lalitpur, Nepal, for providing an automatic weather
station.
Edited by: Ernest
Weingartner
Reviewed by: two anonymous referees
Avnery, S., Mauzerall, D. L., Liu, J., and Horowitz, L. W.: Global crop yield reductions due to surface ozone exposure: 1. Year 2000 crop production losses and economic damage, Atmos. Environ., 45, 2284–2296, https://doi.org/10.1016/j.atmosenv.2010.11.045, 2011.
Bhardwaj, P., Naja, M., Rupakheti, M., Lupascu, A., Mues, A., Panday, A. K., Kumar, R., Mahata, K. S., Lal, S., Chandola, H. C., and Lawrence, M. G.: Variations in surface ozone and carbon monoxide in the Kathmandu Valley and surrounding broader regions during SusKat-ABC field campaign: role of local and regional sources, Atmos. Chem. Phys., 18, 11949–11971, https://doi.org/10.5194/acp-18-11949-2018, 2018.
Bonasoni, P., Laj, P., Marinoni, A., Sprenger, M., Angelini, F., Arduini, J., Bonafè, U., Calzolari, F., Colombo, T., Decesari, S., Di Biagio, C., di Sarra, A. G., Evangelisti, F., Duchi, R., Facchini, MC., Fuzzi, S., Gobbi, G. P., Maione, M., Panday, A., Roccato, F., Sellegri, K., Venzac, H., Verza, GP., Villani, P., Vuillermoz, E., and Cristofanelli, P.: Atmospheric Brown Clouds in the Himalayas: first two years of continuous observations at the Nepal Climate Observatory-Pyramid (5079 m), Atmos. Chem. Phys., 10, 7515–7531, https://doi.org/10.5194/acp-10-7515-2010, 2010.
Brauer, M., Amman, M., Burnett, R. T., Cohen, A., Dentener, F., Zenati, M., Henderson, S. B., Krzyzanowski, M., Martin, R. V., Van Dingenen, R., van Donkelaar, A., and Thurston, G. D.: Exposure assessment for estimation of the global burden of disease attributable to outdoor air pollution, Environ. Sci. Technol., 46, 652–660, https://doi.org/10.1021/es2025752, 2012.
Burney, J. and Ramanathan, V.: Recent climate and air pollution impacts on Indian agriculture, P. Natl. Acad. Sci. USA, 111, 16319–16324, https://doi.org/10.1073/pnas.1317275111, 2014.
Chen, P., Kang, S., Li, C., Rupakheti, M., Yan, F., Li, Q., Ji, Z., Zhang, Q., Luo, W., and Sillanpää, M.: Characteristics and sources of polycyclic aromatic hydrocarbons in atmospheric aerosols in the Kathmandu Valley, Nepal, Sci. Total Environ., 538, 86–92, https://doi.org/10.1016/j.scitotenv.2015.08.006, 2015.
Cristofanelli, P., Bracci, A., Sprenger, M., Marinoni, A., Bonafè, U., Calzolari, F., Duchi, R., Laj, P., Pichon, J. M., Roccato, F., Venzac, H., Vuillermoz, E., and Bonasoni, P.: Tropospheric ozone variations at the Nepal Climate Observatory-Pyramid (Himalayas, 5079 m a.s.l.) and influence of deep stratospheric intrusion events, Atmos. Chem. Phys., 10, 6537–6549, https://doi.org/10.5194/acp-10-6537-2010, 2010.
Davidson, C. I., Lin, S.-F., and Osborn, J. F.: Indoor and outdoor air pollution in the Himalayas, Environ. Sci. Technol., 20, 561–566, https://doi.org/10.1021/es00148a003, 1986.
Dentener, F., Stevenson, D., Ellingsen, K., Van Noije, T., Schultz, M., Amann, M., Atherton, C., Bell, N., Bergmann, D., and Bey, I.: The global atmospheric environment for the next generation, Environ. Sci. Technol., 40, 3586–3594, 2006.
Dhungel, S., Kathayat, B., Mahata, K., and Panday, A.: Transport of regional pollutants through a remote trans-Himalayan valley in Nepal, Atmos. Chem. Phys., 18, 1203–1216, https://doi.org/10.5194/acp-18-1203-2018, 2018.
DoTM (Department of Transport Management): Annual report of Ministry of Labor and Transport Management, Government of Nepal, 2015.
Feng, Z., Hu, E., Wang, X., Jiang, L., and Liu, X.: Ground-level O3 pollution and its impacts on food crops in China: A review, Environ. Pollut., 199, 42–24, https://doi.org/10.1016/j.envpol.2015.01.016, 2015.
Forouzanfar, M. H., Alexander, L., Anderson, H. R., Bachman, V. F., Biryukov, S., Brauer, M., Burnett, R., Casey, D., Coates, M. M., and Cohen, A.: Global, regional, and national comparative risk assessment of 79 behavioural, environmental and occupational, and metabolic risks or clusters of risks in 188 countries, 1990–2013: a systematic analysis for the global burden of disease study 2013, Lancet, 386, 2287–2323, https://doi.org/10.1016/S0140-6736(15)00128-2, 2015.
Fueglistaler, S., Dessler, A. E., Dunkerton, T. J., Folkins, I., Fu, Q., and Mote, P. W.: Tropical tropopause layer, Rev. Geophys., 47, RG1004, https://doi.org/10.1029/2008RG000267, 2009.
Geiß, A., Wiegner, M., Bonn, B., Schäfer, K., Forkel, R., von Schneidemesser, E., Münkel, C., Chan, K. L., and Nothard, R.: Mixing layer height as an indicator for urban air quality?, Atmos. Meas. Tech., 10, 2969–2988, https://doi.org/10.5194/amt-10-2969-2017, 2017.
Giri, D., Murthy, K., Adhikary, P., and Khanal, S.: Ambient air quality of Kathmandu Valley as reflected by atmospheric particulate matter concentrations (PM10), Int. J. Environ. Sci. Technol. 3, 403–410, 2006.
Ghude, S. D., Jain, S. L., Arya, B. C., Beig, G., Ahammed, Y. N., Kumar, A., and Tyagi, B.: Ozone in ambient air at a tropical megacity, Delhi: characteristics, trends and cumulative ozone exposure indices, J. Atmos. Chem., 60, 237, https://doi.org/10.1007/s10874-009-9119-4, 2008.
Highwood, E. J. and Hoskins, B. J.: The tropical tropopause, Q. J. Roy. Meteorol. Soc., 124, 1579–1604, https://doi.org/10.1002/qj.49712454911, 1998.
Huszar, P., Belda, M., and Halenka, T.: On the long-term impact of emissions from central European cities on regional air quality, Atmos. Chem. Phys., 16, 1331–1352, https://doi.org/10.5194/acp-16-1331-2016, 2016.
IEA (International Energy Agency): Energy and air pollution, World Energy Outlook Special Report 2016, International Energy Agency, 2016.
Janssens-Maenhout, G., Dentener, F., van Aardenne, J., Monni, S., Pagliari, V., Orlandini, L., Klimont, Z., Kurokawa, J., Akimoto, H., Ohara, T., Wankmüller, R., Battye, B., Grano, D., Zuber, A., and Keating, T.: EDGAR-HTAP: a harmonized gridded air pollution emission dataset based on national inventories, Tech. Rep. JRC68434, Publications Office of the European Union, https://doi.org/10.2788/14102, 2000.
Kim, B. M., Park, J. S., Kim, S. W., Kim, H. J., Jeon, H. U., Cho, C. Y., Kim, J. H., Hong, S. K., Rupakheti, M., Panday, A. K., Park, R. J., Hong, J. Y., and Yoon, S. C.: Source apportionment of PM10 mass and particulate carbon in the Kathmandu Valley, Nepal. Atmos. Environ., 123, 190–199, 2015.
Kiros, F., Shakya, K. M., Rupakheti, M., Regmi, R. P., Maharjan, R., Byanju, R. M., Naja, M., Mahata, K., Kathayat, B., and Peltier, R. E.: Variability of Anthropogenic Gases: Nitrogen oxides, sulfur dioxide, ozone and ammonia in Kathmandu Valley, Nepal, Aerosol Air Qual. Res., 16, 3088–3101, 2016.
Kumar, R., Naja, M., Venkataramani, S., and Wild, O.: Variation in surface ozone at Nainital: A high-altitude site in the central Himalayas, J. Geophys. Res., 115, D16302, https://doi.org/10.1029/2009JD013715, 2010.
Kurokawa, J., Ohara, T., Morikawa, T., Hanayama, S., Janssens-Maenhout, G., Fukui, T., Kawashima, K., and Akimoto, H.: Emissions of air pollutants and greenhouse gases over Asian regions during 2000–2008: Regional Emission inventory in ASia (REAS) version 2, Atmos. Chem. Phys., 13, 11019–11058, https://doi.org/10.5194/acp-13-11019-2013, 2013.
Lal, S., Naja, M., and Subbaraya B. H.: Seasonal variations in surface ozone and its precursors over an urban site in India, Atmos. Environ., 34, 2713–2724, https://doi.org/10.1016/S1352-2310(99)00510-5, 2000.
Lawrence, M. G. and Lelieveld, J.: Atmospheric pollutant outflow from southern Asia: a review, Atmos. Chem. Phys., 10, 11017–11096, https://doi.org/10.5194/acp-10-11017-2010, 2010.
Lim, S. S., Vos, T., Flaxman, A. D., Danaei, G., Shibuya, K., Adair-Rohani, H., Amann, M., Anderson, H. R., Andrews, K. G., Aryee, M., Atkinson, C., Bacchus, L. J., Bahalim, A. N., Balakrishnan, K., Balmes, J., Barker-Collo, S., Baxter, A., Bell, M. L., Blore, J. D., Blyth, F., Bonner, C., Borges, G., Bourne, R., and Ezzati, M.: A comparative risk assessment of burden of disease and injury attributable to 67 risk factors and risk factor clusters in 21 regions, 1990–2010: a systematic analysis for the global burden of disease study 2010, Lancet, 380, 2224–2260, 2012.
Lüthi, Z. L., Škerlak, B., Kim, S.-W., Lauer, A., Mues, A., Rupakheti, M., and Kang, S.: Atmospheric brown clouds reach the Tibetan Plateau by crossing the Himalayas, Atmos. Chem. Phys., 15, 6007–6021, https://doi.org/10.5194/acp-15-6007-2015, 2015.
Mahata, K. S., Panday, A. K., Rupakheti, M., Singh, A., Naja, M., and Lawrence, M. G.: Seasonal and diurnal variations in methane and carbon dioxide in the Kathmandu Valley in the foothills of the central Himalayas, Atmos. Chem. Phys., 17, 12573–12596, https://doi.org/10.5194/acp-17-12573-2017, 2017.
Marinoni, A., Cristofanelli, P., Laj, P., Duchi., R., Putero, D., Calzolari, F., Landi., T. C., Vuillermoz, E., Maione, M., and Bonasoni, P.: High black carbon and ozone concentrations during pollution transport in the Himalayas: Five years of continuous observations at NCO-P global GAW station, J. Environ. Sci., 25, 1618–1625, 2013.
Ming, J., Xiao, C., Sun, J., Kang, S.-C, and Bonasoni, P.: Carbonaceous particles in the atmosphere and precipitation of the Nam Co region, central Tibet, J. Environ. Sci.-CHINA, 22, 1748–1756, 2010.
Monks, P. S., Granier, C., Fuzzi, S., Stohl, A., Williams, M. L., Akimoto, H., Amann, M., Baklanov, A., Baltensperger, U., Bey, I., Blake, N., Blake, R. S., Carslaw, K., Cooper, O. R., Dentener, F., Fowler, D., Fragkou, E., Frost, G. J., Generoso, S., Ginoux, P., Grewe, V., Guenther, A., Hansson, H. C., Henne, S., Hjorth, J., Hofzumahaus, A., Huntrieser, H., Isaksen, I. S. A., Jenkin, M. E., Kaiser, J., Kanakidou, M., Klimont, Z., Kulmala, M., Laj, P., Lawrence, M. G., Lee, J. D., Liousse, C., Maione, M., McFiggans, G., Metzger, A., Mieville, A., Moussiopoulos, N., Orlando, J. J., O'Dowd, C. D., Palmer, P. I., Parrish, D. D., Petzold, A., Platt, U., Poeschl, U., Prevot, A. S. H., Reeves, C. E., Reimann, S., Rudich, Y., Sellegri, K., Steinbrecher, R., Simpson, D., ten Brink, H., Theloke, J., van derWerf, G. R., Vautard, R., Vestreng, V., Vlachokostas, C., and von Glasow, R.: Atmospheric composition change – global and regional air quality, Atmos. Environ., 43, 5268–5350, https://doi.org/10.1016/j.atmosenv.2009.08.021, 2009.
Monks, P. S., Archibald, A. T., Colette, A., Cooper, O., Coyle, M., Derwent, R., Fowler, D., Granier, C., Law, K. S., Mills, G. E., Stevenson, D. S., Tarasova, O., Thouret, V., von Schneidemesser, E., Sommariva, R., Wild, O., and Williams, M. L.: Tropospheric ozone and its precursors from the urban to the global scale from air quality to short-lived climate forcer, Atmos. Chem. Phys., 15, 8889–8973, https://doi.org/10.5194/acp-15-8889-2015, 2015.
Mues, A., Rupakheti, M., Münkel, C., Lauer, A., Bozem, H., Hoor, P., Butler, T., and Lawrence, M. G.: Investigation of the mixing layer height derived from ceilometer measurements in the Kathmandu Valley and implications for local air quality, Atmos. Chem. Phys., 17, 8157–8176, https://doi.org/10.5194/acp-17-8157-2017, 2017.
Naja, M. and Lal, S.: Surface ozone and precursor gases at Gadanki (13.5∘ N, 79.2∘ E), a tropical rural site in India, J. Geophys. Res., 107, ACH 8-1–ACH 8–13, https://doi.org/10.1029/2001jd000357, 2002.
Nayava, J. L.: Rainfall in Nepal, the Himalayan Rev. Nepal, Geographical Society, 12, 1–18, 1980.
Organisation for Economic Co-operation and Development (OECD): The economic consequences of outdoor air pollution, OECD Publishing, https://doi.org/10.1787/9789264257474-en, 2016.
Panday, A. K. and Prinn, R. G..: Diurnal cycle of air pollution in the Kathmandu Valley, Nepal: Observations, J. Geophys. Res., 114, D09305, https://doi.org/10.1029/2008JD009777, 2009.
Panday, A. K., Prinn, R. G., and Schär, C.: Diurnal cycle of air pollution in the Kathmandu Valley, Nepal: 2. Modeling results, J. Geophys. Res., 114, D21, https://doi.org/10.1029/2008JD009808, 2009.
Pudasainee, D., Sapkota, B., Shrestha, M. L., Kaga, A., Kondo, A., and Inoue, Y.: Ground level ozone concentrations and its association with NOx and meteorological parameters in Kathmandu Valley, Nepal, Atmos. Environ., 40, 8081–8087, https://doi.org/10.1016/j.atmosenv.2006.07.011, 2006.
Putero, D., Cristofanelli, P., Marinoni, A., Adhikary, B., Duchi, R., Shrestha, S. D., Verza, G. P., Landi, T. C., Calzolari, F., Busetto, M., Agrillo, G., Biancofiore, F., Di Carlo, P., Panday, A. K., Rupakheti, M., and Bonasoni, P.: Seasonal variation of ozone and black carbon observed at Paknajol, an urban site in the Kathmandu Valley, Nepal, Atmos. Chem. Phys., 15, 13957–13971, https://doi.org/10.5194/acp-15-13957-2015, 2015.
Putero, D., Cristofanelli, P., Sprenger, M., Škerlak, B., Tositti, L., and Bonasoni, P.: STEFLUX, a tool for investigating stratospheric intrusions: application to two WMO/GAW global stations, Atmos. Chem. Phys., 16, 14203–14217, https://doi.org/10.5194/acp-16-14203-2016, 2016.
Ram, K. and Sarin, M.: Spatio-temporal variability in atmospheric abundances of EC, OC and WSOC over Northern India, J. Aerosol Sci., 41, 88–98, 2010.
Regmi, R. P., Kitada, T., and Kurata, G.: Numerical simulation of late wintertime local flows in Kathmandu Valley, Nepal: Implication for air pollution transport, J. Appl. Meteorol., 42, 389–403, 2003.
Rupakheti, D., Adhikary, B., Praveen, P. S., Rupakheti, M., Kang, S., Mahata, K. S., Naja, M., Zhang, Q., Panday, A. K., and Lawrence, M. G.: Pre-monsoon air quality over Lumbini, a world heritage site along the Himalayan foothills, Atmos. Chem. Phys., 17, 11041–11063, https://doi.org/10.5194/acp-17-11041-2017, 2017.
Rupakheti, M., Panday, A. K., Lawrence, M. G., Kim, S. W., Sinha, V., Kang, S. C., Naja, M., Park, J. S., Hoor, P., Holben, B., Sharma, R. K., Mues, A., Mahata, K. S., Bhardwaj, P., Sarkar, C., Rupakheti, D., Regmi, R. P., and Gustafsson, Ö.: Air pollution in the Himalayan foothills: overview of the SusKat-ABC international air pollution measurement campaign in Nepal, Atmos. Chem. Phys. Discuss., in preparation, 2018.
Sadavarte, P., Rupakheti, M., Shakya, K., Bhave, P. V., and Lawrence, M. G.: Nepal emission inventory (NEEMI): A high resolution technology – based bottom-up emissions inventory for Nepal, Atmos. Chem. Phys. Discuss., in preparation, 2018.
Sarkar, C., Sinha, V., Kumar, V., Rupakheti, M., Panday, A., Mahata, K. S., Rupakheti, D., Kathayat, B., and Lawrence, M. G.: Overview of VOC emissions and chemistry from PTR-TOF-MS measurements during the SusKat-ABC campaign: high acetaldehyde, isoprene and isocyanic acid in wintertime air of the Kathmandu Valley, Atmos. Chem. Phys., 16, 3979–4003, https://doi.org/10.5194/acp-16-3979-2016, 2016.
Sarkar, C., Sinha, V., Sinha, B., Panday, A. K., Rupakheti, M., and Lawrence, M. G.: Source apportionment of NMVOCs in the Kathmandu Valley during the SusKat-ABC international field campaign using positive matrix factorization, Atmos. Chem. Phys., 17, 8129–8156, https://doi.org/10.5194/acp-17-8129-2017, 2017.
Shakya, K. M., Rupakheti, M., Shahi, A., Maskey, R., Pradhan, B., Panday, A., Puppala, S. P., Lawrence, M., and Peltier, R. E.: Near-road sampling of PM2.5, BC, and fine-particle chemical components in Kathmandu Valley, Nepal, Atmos. Chem. Phys., 17, 6503–6516, https://doi.org/10.5194/acp-17-6503-2017, 2017.
Sharma, R. K., Bhattarai, B. K., Sapkota, B. K., Gewali, M. B., and Kjeldstad, B.: Black carbon aerosols variation in Kathmandu valley, Nepal, Atmos. Environ., 63, 282–288, https://doi.org/10.1016/j.atmosenv.2012.09.023, 2012.
Sharma, P., Kuniyal, J. C., Chand, K., Guleria, R. P., Dhyani, P. P., and Chauhan, C.: Surface ozone concentration and its behavior with aerosols in the northwestern Himalaya, India, Atmos. Environ. 71, 44–53, http://dx.doi.org/10.1016/j.atmosenv.2012.12.042, 2013.
Shrestha, A. B., Wake, C. P., Mayewski, P. A., and Dibb, J. E.: Maximum Temperature Trends in the Himalaya and Its Vicinity: An Analysis Based on Temperature Records from Nepal for the Period 1971–94, J. Climate, 12, 2775–2786, 1999.
Shrestha, S. R., Kim Oanh, N. T., Xu, Q., Rupakheti, M., and Lawrence, M. G.: Analysis of the vehicle fleet in the Kathmandu Valley for estimation of environment and climate co-benefits of technology intrusions, Atmos. Environ., 81, 579–590, 2013.
Silva, R. A., West, J. J., Zhang, Y., Anenberg, S. C., Lamarque, J.-F., Shindell, D. T., Collins, W. J., Dalsoren, S., Faluvegi, G., Folberth, G., Horowitz, L. W., Nagashima, T., Naik, V., Rumbold, S., Skeie, R., Sudo, K., Takemura, T., Bergmann, D., Cameron-Smith, P., Cionni, I., Doherty, R. M., Eyring, V., Josse, B., MacKenzie, I. A., Plummer, D., Righi, M., Stevenson, D. S., Strode, S., Szopa, S., and Zeng, G.: Global premature mortality due to anthropogenic outdoor air pollution and the contribution of past climate change, Environ. Res. Lett., 8, 034005, https://doi.org/10.1088/1748-9326/8/3/034005, 2013.
Sinha, V., Kumar, V., and Sarkar, C.: Chemical composition of pre-monsoon air in the Indo-Gangetic Plain measured using a new air quality facility and PTR-MS: high surface ozone and strong influence of biomass burning, Atmos. Chem. Phys., 14, 5921–5941, https://doi.org/10.5194/acp-14-5921-2014, 2014.
Talbot, R., Mao, H., and Sive, B.: Diurnal characteristics of surface level O3 and other important trace gases in New England, J. Geophys. Res., 110, D09307, https://doi.org/10.1029/2004JD005449, 2005.
Tissier, A.-S. and Legras, B.: Convective sources of trajectories traversing the tropical tropopause layer, Atmos. Chem. Phys., 16, 3383–3398, https://doi.org/10.5194/acp-16-3383-2016, 2016.
Tripathee, L., Kang, S.-C., Huang, J., Sharma, C., Sillanpaa, M., Guo, J., and Paudyal, R.: Concentrations of trace elements in wet deposition over the central Himalayas, Nepal, Atmos. Environ., 95, 231–238, 2014.
United Nations Environment Programme and World Meteorological Organization (UNEP and WMO), Integrated Assessment of Black Carbon and Tropospheric Ozone, United Nations Environment Programme (UNEP), Nairobi, 2011.
Vadrevu, K., Ellicott, E., Giglio, L., Badarinath, K., Vermote, E., Justice, C., and Lau, W.: Vegetation fires in the Himalayan region – aerosol load, black carbon emissions and smoke plume heights, Atmos. Environ., 47, 241–251, 2012.
Wang, Y., Konopka, P., Liu, Y., Chen, H., Müller, R., Plöger, F., Riese, M., Cai, Z., and Lü, D.: Tropospheric ozone trend over Beijing from 2002–2010: ozonesonde measurements and modeling analysis, Atmos. Chem. Phys., 12, 8389–8399, https://doi.org/10.5194/acp-12-8389-2012, 2012.
Wan, X., Kang, S., Li, Q., Rupakheti, D., Zhang, Q., Guo, J., Chen, P., Tripathee, L., Rupakheti, M., Panday, A. K., Wang, W., Kawamura, K., Gao, S., Wu, G., and Cong, Z.: Organic molecular tracers in the atmospheric aerosols from Lumbini, Nepal, in the northern Indo-Gangetic Plain: influence of biomass burning, Atmos. Chem. Phys., 17, 8867–8885, https://doi.org/10.5194/acp-17-8867-2017, 2017.
WHO (World Health Organization): WHO Air quality guidelines for particulate matter, ozone, nitrogen dioxide and sulfur dioxide, Global update 2005, Summary of risk assessment, WHO Press, Geneva, Switzerland, 2006.
WHO (World Health Organization): 7 million premature deaths annually linked to air pollution, available at: http://www.who.int/mediacentre/news/releases/2014/air-pollution/en/ (last access: 12 December 2017), 2014.
Zhang, Q., Streets, D. G., Carmichael, G. R., He, K. B., Huo, H., Kannari, A., Klimont, Z., Park, I. S., Reddy, S., Fu, J. S., Chen, D., Duan, L., Lei, Y., Wang, L. T., and Yao, Z. L.: Asian emissions in 2006 for the NASA INTEX-B mission, Atmos. Chem. Phys., 9, 5131–5153, https://doi.org/10.5194/acp-9-5131-2009, 2009.