the Creative Commons Attribution 4.0 License.
the Creative Commons Attribution 4.0 License.
 | 01 Oct 2018
Enhancements of airborne particulate arsenic over the subtropical free troposphere: impact of southern Asian biomass burning
Yu-Chi Lin
Shih-Chieh Hsu
Chuan-Yao Lin
Shuen-Hsin Lin
Yi-Tang Huang
Yunhua Chang
Arsenic (As) has long been recognized as a toxic element of mainly anthropogenic origins, having adverse effects on human health. However, there is insufficient understanding regarding As released into atmosphere from biomass burning (BB). To this end, daily airborne As concentrations in total particulate matter (TSP) were determined at Mount Hehuan (24.16∘ N, 121.29∘ E, 3001 m a.s.l.), Taiwan from September 2011 to September 2012. During the sampling period, As concentrations varied from 0.02 to 5.9 ng m−3, with a mean value of 0.5±1.0 ng m−3. Significantly seasonal variations of As were found over the subtropical free troposphere, and higher As concentrations were observed in the southern (S) and southeastern (SE) Asian BB seasons (from January to May). Principal component analysis (PCA) results showed that BB activities seemed to be a major source of As during the S and SE Asian BB periods, which were very distinct from the major source of coal-fired power plant during the periods between July and December. Based on backward trajectory analyses and WRF-Chem model simulations, we found that the high As concentrations during the BB periods were attributed to the biomass burning activities over S Asia where groundwater, soil and crops are severely contaminated by arsenic. A strong correlation (r=0.73 p<0.05) between As and potassium ion (K+, a chemical tracer of BB activities) in S Asian BB events also supported this hypothesis. During the S Asian BB events, the high As ∕ Pb ratios (>0.2) were also observed, indicating that burning crops contaminated by lead arsenate might be a crucial candidate for high As concentrations at Mount Hehuan. Nevertheless, the net influence of S Asian BB activities on airborne As concentrations has been estimated by comparing the differences of As concentrations on BB and non-BB days. On average, the difference in As concentrations was 1.0 ng m−3, which accounted for 63 % of the average As concentration on BB days. Moreover, a ratio of ΔAs∕ΔCO (∼0.00001) in the S Asian BB events was obtained. Using this value, arsenic emissions from S Asian BB activities were estimated to be 0.17 tons yr−1, resulting in high airborne As concentrations over the subtropical free troposphere and impacting As cycles on a regional scale in the S and SE Asian BB seasons.
- Article
(12134 KB) -
Supplement
(620 KB) - BibTeX
- EndNote


Arsenic (As), categorized as a carcinogenic species by the International Agency for Research on Cancer, is a toxic element and may be hazardous to human health, even in trace concentrations. It is also the most highly accumulated trace metal in the human food chain. Consequently, As has been an environmental concern in terms of its emissions, cycling, and health effects (Nriagu, 1989; Bissen and Frimmel, 2003; Wai et al., 2016). Atmospheric arsenic is released from both natural and anthropogenic sources with a total annual global emission of nearly 31 Gg (Nriagu, 1989; Wai et al., 2016; Walsh et al., 1979). The quantity of As emissions derived from anthropogenic sources is about 1.6 times higher than that of natural origins (Nriagu, 1989). Arsenic released from volcanos is the predominant source of natural emissions, followed by wind-erosion soil particles as well as biogenic emissions (Nriagu, 1989). From anthropogenic sources, metal smelting and coal combustion release quantities of arsenic into atmosphere (Brimblecombe, 1979; Mandal and Suzuki, 2002) and are thereby considered to be major origins for airborne arsenic. Besides, biomass burning (BB) for waste timber treated by insecticides that contain As and crops contaminated by As-pesticides might enhance the emissions of airborne particulate arsenic (Huang et al., 2012; Niyobuhungiro and Blottnitz, 2013). However, the influence of BB activities on As concentrations over the free troposphere is not well-understood.
Biomass burning activities emit large amounts of air pollutants into atmosphere, e.g., carbon monoxide (CO), carbon dioxide (CO2), nitrogen oxides (NOx), volatile organic compounds (VOCs), and particulate matter (PM) (Streets et al., 2003; Tang et al., 2003). It impacts not only local but also regional air quality, atmospheric chemistry, biogeochemical processes, and the hydrological cycle along with the climate (Crutzen and Andreae, 1990; Ramanathan et al., 2001; Pochanart et al., 2003; Tang et al., 2003; Kondo et al., 2004). Southeastern (SE) and southern (S) Asia are active biomass burning regions in the world, and BB activities in these continents are mostly caused by deforestation and agricultural activities. Indonesia, India, Myanmar, and Cambodia are major source countries of BB activities (Chang and Song, 2010; van der Werf et al., 2017). Among these burned areas, BB activities in India are mainly caused by the burning of crop residues (∼61 % of total burning) and frequently occur from January to May, usually maximizing in springtime (Nriagu, 1989; Pochanart et al., 2003). Most BB smoke is emitted within a boundary layer. After burning, some BB plumes are uplifted from the ground level to the free troposphere (2–6 km), being transported to the Pacific region by the prevailing westerly wind and impacting atmospheric chemistry in the downwind regions (Kondo et al., 2004; Lin et al., 2009; Val Martin et al., 2010).
Over the past decade, numerous studies have shown that West Bengal in India and Bangladesh are extremely As-contaminated areas in southern Asia (Robert et al., 2010; Neumann et al., 2010; Burgess et al., 2010). The extremely As-contaminated groundwater in these areas is used for both drinking and irrigation. Thus, the accumulation of As is found in rice roots and rice plants along with crop soils (Norra et al., 2005). While burning As-contaminated plants, As is expected to attach within BB-originated aerosols, probably condensing on the existing aerosols and being transported to the downwind site, enhancing the atmospheric As concentrations in the aerosol phase (Huang et al., 2012).
Mountaintop sites, which are generally situated far away from the direct influence of local anthropogenic emissions, are very sparse in the Northern Hemisphere. Due to the high elevations, mountaintop sites are useful in monitoring long-range transported air pollution (Weiss-Penizas et al., 2007; Lin et al., 2013). From September 2011 to September 2012, the continuous measurements of the total suspended particulate (TSP, dynamic diameter less than 100 µm), ozone and carbon monoxide were carried out at Mount Hehuan in Taiwan, with the aim of better understanding the behaviors of air pollutants transported horizontally from the Asian continent and intruded vertically from high-troposphere and low-stratosphere over the subtropical region (Y. C. Lin et al., 2014). Chemical compositions of TSP samples, including water-soluble ions and elements, were analyzed. In this paper, we present the As concentrations and their seasonality at Mount Hehuan. The potentially regional sources of high As concentrations are also examined with backward trajectory analyses and WRF-Chem model simulations. Finally, the net influence of SE and S Asian BB activities on airborne As over the subtropical free troposphere is assessed. To our best knowledge, this is the first paper to report regionally transported arsenic accompanied by BB plumes and enhancements in airborne As concentrations over the subtropical free troposphere.
2.1 Aerosol sampling
Daily TSP samples were collected at Mount Hehuan site, Taiwan (24.16∘ N, 121.29∘ E, 3001 m a.s.l.; see Fig. 1) from September 2011 to September 2012. The sampling station is located in a pristine environment and its vicinity is generally higher than 2900 m, thereby the monitoring site can be considered representative of the free troposphere over the subtropical Pacific region (Y. C. Lin et al., 2014). A high-volume TSP sampler (TISCH, Model TE-5170D), operated at a flow rate of approximately 1.13 m3 min−1, was used to collect aerosol samples. Whatman® 41 cellulose filters () were used as filtration substrates. After sampling, each filter was folded and stored in a separate plastic bag that was then stored in a polypropylene container, frozen immediately, and returned to the laboratory for further chemical analysis. Carbon monoxide, a tracer for tracking anthropogenic plumes, was monitored by a nondispersive infrared spectrometer (Horiba model APMA-370). The details of the instrument and QA/QC procedure for CO monitoring are described elsewhere (Lin et al., 2013).
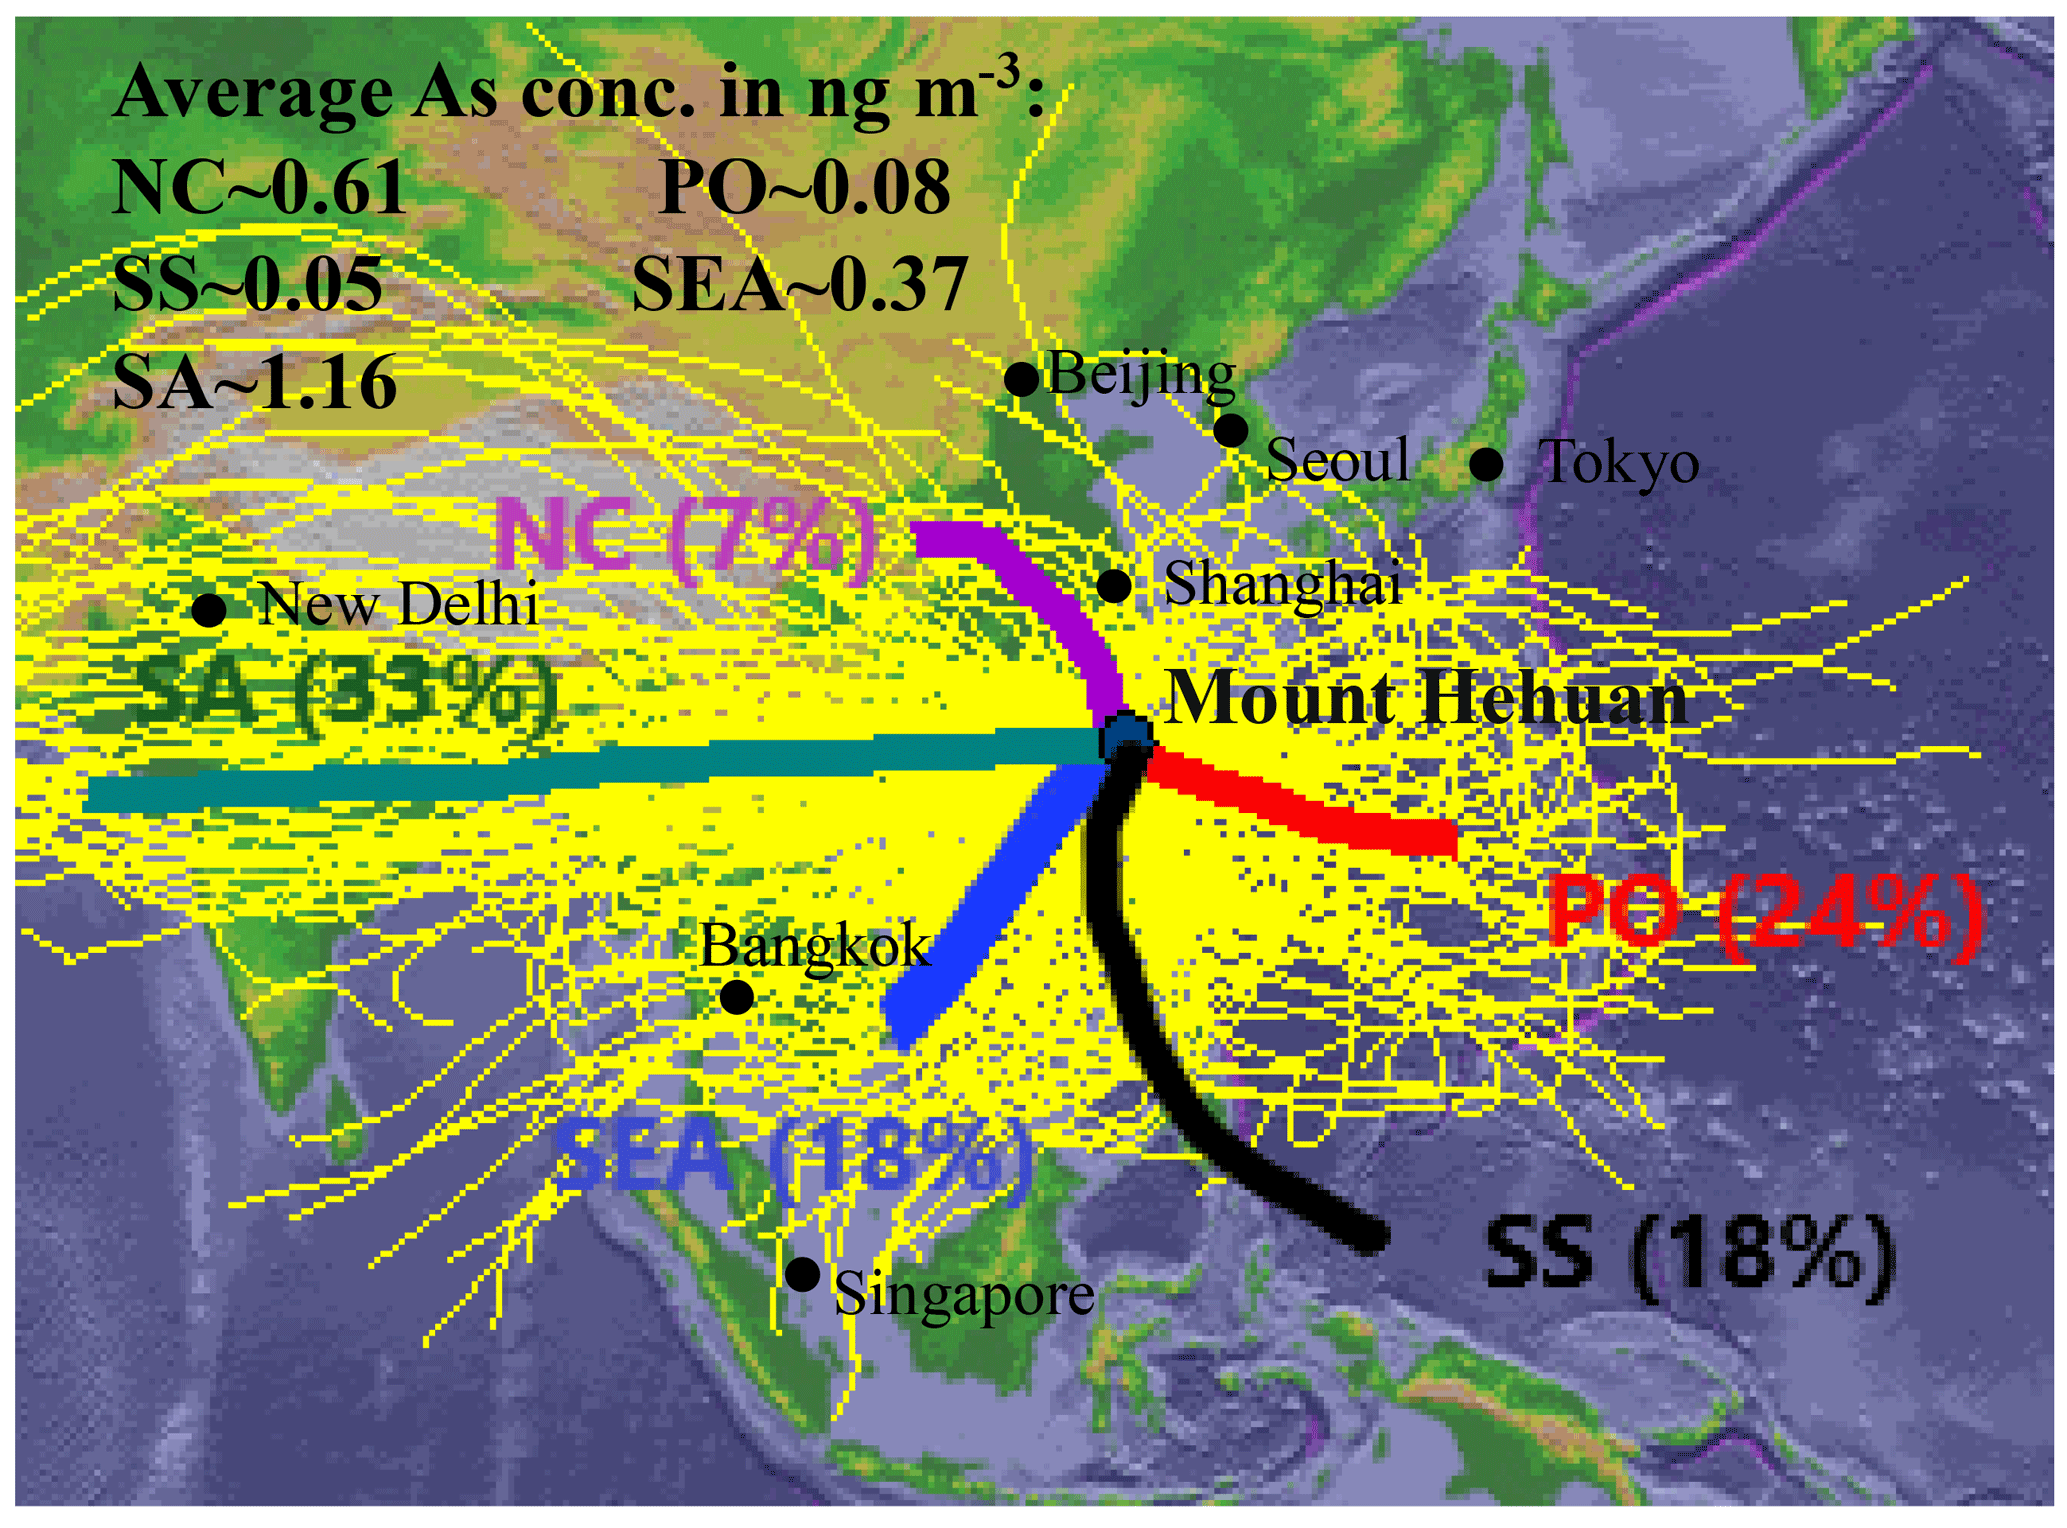
Figure 1Clusters of backward trajectories at Mount Hehuan from September 2011 to September 2012.
2.2 Chemical analysis
For the purpose of chemical analysis, the sampled filter was subdivided into eight equal pieces after sampling. One piece was subjected to acidic digestion for elemental determination and another was extracted by Milli-Q water for analyzing water-soluble ions. For acidic digestion, each filter sample was put into an acid-cleaned vessel and digested in a mixed acidic solution (4 mL 60 % HNO3 + 2 mL 48 % HF) by an ultrahigh throughput microwave digestion system (MARSXpress, CEM Corporation, Matthews, NC, USA). The digestion process was performed in three steps; the sample was (1) heated to 170 ∘C for 8 min and maintained at this temperature for 7 min at 1440 W, (2) heated to 200 ∘C for 7 min and maintained at this temperature for 15 min at 1600 W, and (3) cooled for 60 min. Subsequently, the vessel was transferred to XpressVap™ accessory sets (CEM Corporation) for the evaporation of the remaining acids until nearly dry. Approximately 2 mL of concentrated HNO3 was added into the vessel and reheated. The resulting solution was then diluted with Milli-Q water to a final volume of 50 mL. After acidic digestion, 31 target elements in TSP samples were analyzed through inductively coupled plasma mass spectrometry (ICP-MS; Elan 6100; Perkin ElmerTM, USA). A multi-element standard prepared from stock (Merk) and composed of 2 % HNO3 solution was used for calibration. An internal standard containing indium (10 ng mL−1) was used to correct instrumental drift. To minimize the isobaric interference, the nebulizer gas flow rate was adjusted to 0.7–0.9 L min−1. To reduce the formation of doubly charged ions and oxides, and CeO / Ce must be lower than the recommended values of 0.01 and 0.02, respectively. Accuracy and precision were assessed by replicate measurements (N=7) of the standard reference material NIST SRM 1648, following the total digestion process. The results showed that the recoveries for most elements fell within 90 %–110 %, and the precisions were less than 5 %. Arsenic, a target element, exhibited a recovery of 106 % and a precision of 2 %. For each run, a blank regent and three filter membrane blanks were subjected to the same procedure as that of the aerosol samples. The method detection limits (MDLs) were 0.01 ng m−3 for both As and Pb.
Another half of the filter sample was extracted with 20 mL Milli-Q water (18.2 Ω) by using ultra-sonic apparatus for 1h. The extracted solution was subsequently analyzed for water-soluble ions, including Na+, , K+, Mg2+, Ca2+, Cl−, , and by ion chromatography (Dionex ICS-90 for cations and ICS-1500 for anions), equipped with a conductivity detector (ASRS-ULTRA). A QA/QC program including calibration, recovery, and precision tests along with MDLs for all ions was conducted during the analyzed processes. A multi-ion solution (Merck) was used for the calibration of the Ion Chromatography (IC) instrument and seven-point calibration curves were made for each batch of samples. One laboratory blank was taken for each batch analysis and the MDL was calculated as 3 times the standard deviation of the values of seven blanks. The average recoveries for all species were in the range of 91 %–105 %; the precisions for all species were less than 5 %.
2.3 Principal component analysis
Principal component analysis (PCA), a technique which attempts to explain the statistical variance in a given dataset in terms of a minimum number of significant components, has been widely employed to identify potential sources for airborne particulate matter observed at a receptor site (Viana et al., 2006; Venter et al., 2017). To compute the PCA model, the first step was to transform the chemical data into normalized form, represented as the following;
where Zij is the normalized value of the species j in i sample. Cij is the concentration of species j in sample i and μj, and σj are the mean concentration and standard deviation for species j. The PCA model was then expressed as the following;
where represents the different sources, and gik and hkj are the factor loadings and factor scores, respectively. Associated with each component is an eigenvalue; only principal components with eigenvalue greater than 1.0 were selected to identify aerosol sources. The software of SPSS (IBM statistics 19) was performed for the PCA analysis.
2.4 Backward trajectory analysis
To identify potential sources of airborne arsenic at Mount Hehuan, 5-day backward trajectories were computed by the Hybrid Single-Particle Lagrangian Integrated Trajectory (HYSPLIT) model developed by the US NOAA Air Resources Laboratory (Draxler and Hess, 1998). The meteorological data for the trajectory model were from the GDAS (Global Data Assimilation System), which were processed by the National Centers for Environmental Prediction (NCEP) with a 6 h time resolution, an approximate 190 km horizontal resolution, and 23 vertical levels. In this work, 5-day backward trajectories arriving at 3000 m a.s.l. were computed at 12:00 LT (local time) once every day, with a time step of 6 hours. Four additional trajectories were generated, of which starting locations were changed ±0.5∘ from the actual sampling site to reduce the uncertainty of the trajectory analysis. During the sampling period, a total of 1865 backward trajectories were computed. According the originated regions of air parcels, we divided the trajectories into five groups, namely, northern China (NC), the Pacific Ocean (PO), the South China Sea (SS), southeastern Asia (SEA), and southern Asia (SA).
Figure 1 shows the pathways of five different air clusters at Mount Hehuan. The frequency of SA was 33 %, which was the most predominant air clusters, followed by PO (24 %), SS (18 %), SEA (18 %), and NC (7 %). In the NC group, the air mass originated mainly from northern China, where heavily polluted air is contaminated by industrial emissions, moved to the southern areas slowly, and arrived at the receptor site. The NC air cluster was predominately found in March, August, and September with a frequency of >16 % (shown in Fig. 2). In the case of PO, the air parcel generally came from the western Pacific Ocean, spending much time in the marine atmosphere before arriving in Taiwan. This air cluster was most predominately found from July to September with a frequency of >48 %. High frequencies (>20 %) in the PO cluster were also surprisingly found in October and November. For SS air clusters, the air parcel was regularly from South China Sea, crossing the marine areas or the Luzon Islands and then arriving at Mount Hehuan. This air group accounted for 18 % with a high frequency in June, July, and November. For the SEA group, the air mass typically came from the mainland Southeast Asian peninsula, occasionally passing across parts of polluted southern China like the Sichuan Basin and the Pearl River Delta (PRD) region before reaching Taiwan. The SEA air group profoundly occurred from March to June, with the frequency exceeding 30 %. Finally, the air parcel of the SA cluster was mainly from Middle East and the Indian subcontinent, passing over the northern parts of Myanmar, Thailand, Laos, and Vietnam along with the PRD region and then descending to Mount Hehuan. The SA group was frequently found during the sampling periods, except for July to September. The air masses of NC, SEA, and SA groups were associated with continental origins, as they spent much time on the Asian continent before arriving at Mount Hehuan. The continental air masses mostly prevailed from mid-autumn to late spring (see Fig. 2). On the contrary, PO and SS air clusters were grouped into marine air parcels and were profoundly found from June to September. Nevertheless, the air parcels from NC, SEA and SA groups are anticipated to pick up polluted air and transport it to Mount Hehuan, compared with the PO and SS air clusters that spent much time in the marine atmosphere.

Figure 2Monthly distributions of the fractions for various air clusters at Mount Hehuan during the sampling period.
2.5 WRF-Chem model
To simulate the long-range BB plumes transported to Mount Hehuan, the coupled with chemistry module of the WRF model (WRF-Chem; Ver. 3.2.1) was employed. Previously, this model has successfully simulated and identified the BB- plume transportation from SE and S Asia (Chi et al., 2010; C. Y. Lin et al., 2009, 2014). In this study, a tracer module in WRF-Chem developed by Lin et al. (2009) was employed to identify the transport. The tracers were assigned to the fire locations derived from MODIS satellite data over the study domain. They were placed at the first level above the surface at each fire location with a concentration of 1 unit per day. The dry and wet deposition functions are also considered in the model. The meteorological initial and boundary conditions for WRF-Chem were acquired from the NCEP-FNL Global Forecast System (GFS) analysis datasets (35 vertical levels). The Mellor–Yamada–Janijc (MYJ) planetary boundary-layer scheme was selected in this study. The horizontal resolution for our BB simulations was 27 km. To assure the meteorological fields were well simulated, the four-dimensional data assimilation (FDDA) scheme was activated based on the NCEP-GFS analysis data.
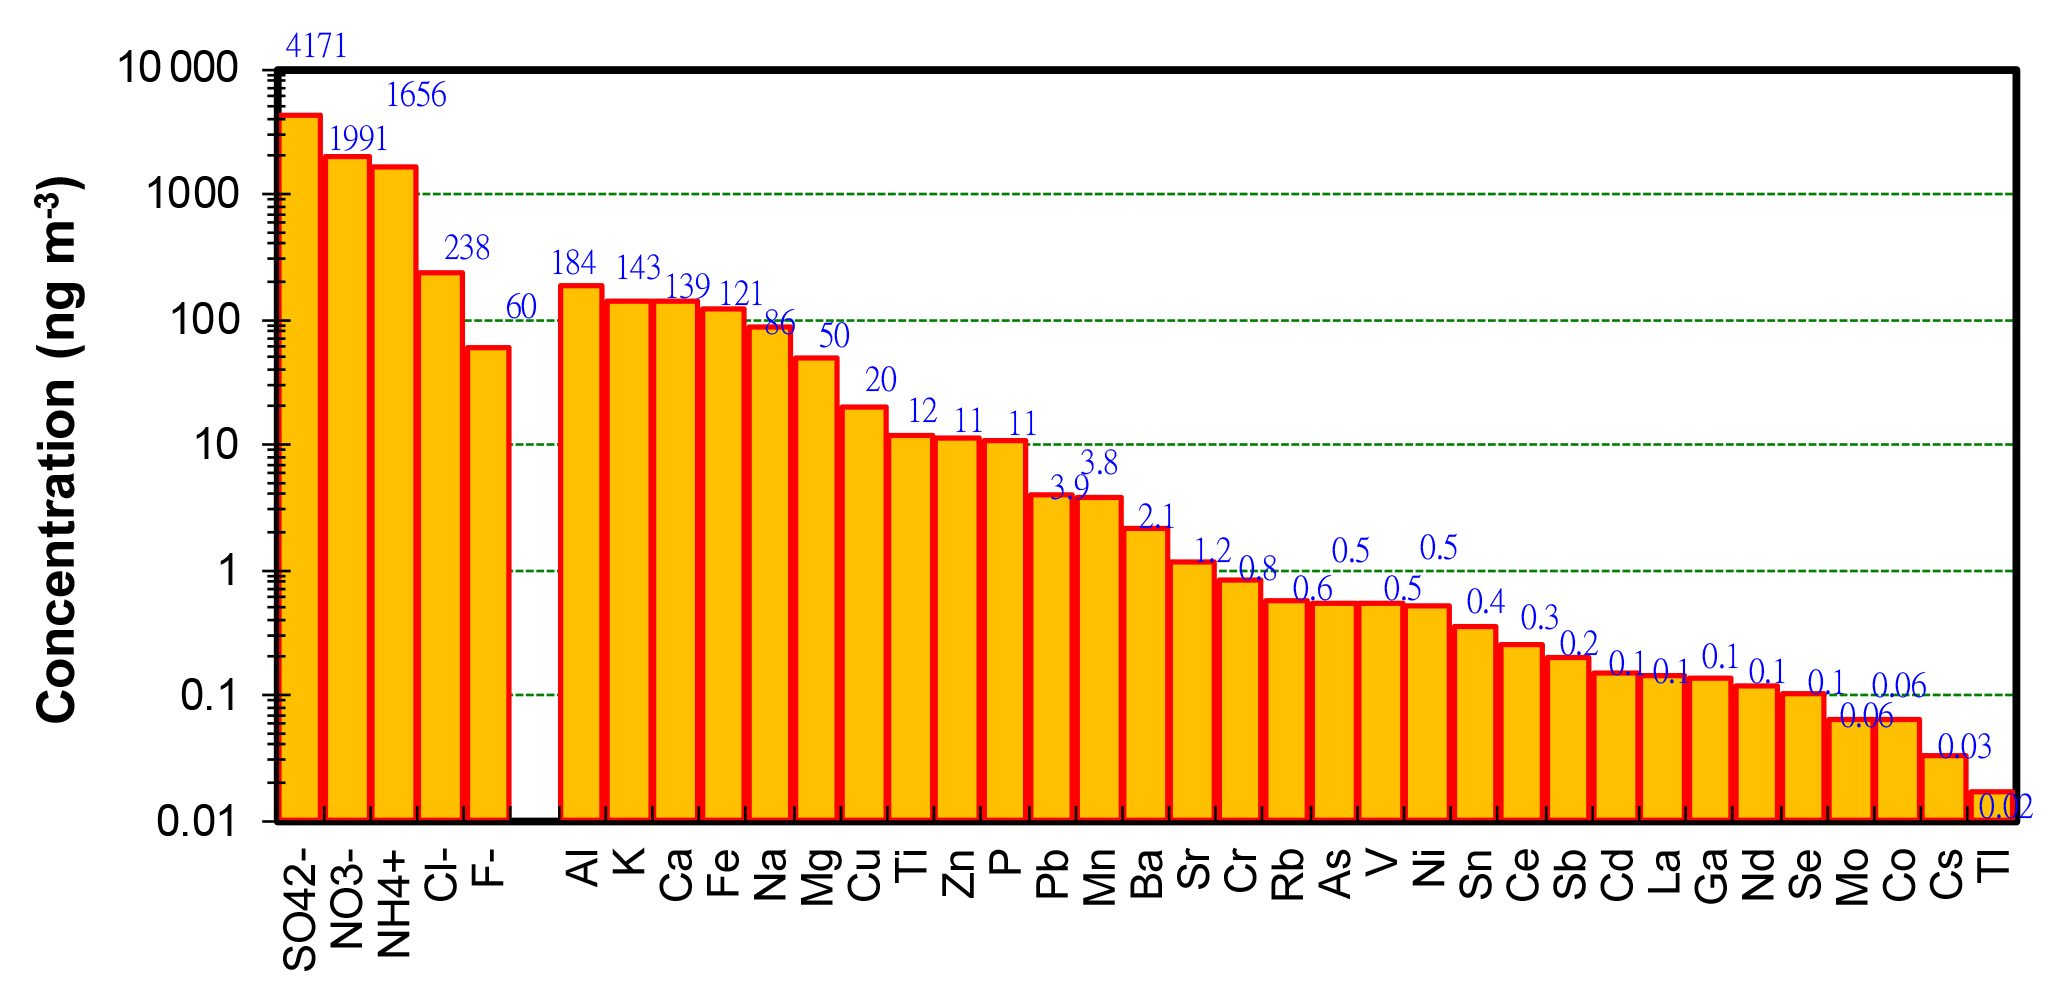
Figure 3Average concentrations (ng m−3) of chemical compositions in TSP samples collected at Mount Hehuan site from September 2011 to September 2012.
2.6 MODIS fire spots
The fire spots from BB activities were extracted by the Moderate Resolution Image Spectroradiometers (MODIS) on board NASA's polar-orbit Aqua and Terra satellites. The MODIS fire detection algorithm employs infrared spectrum channels of 4 and 11 µm (Kaufman et al., 1998). The 1 km Level-2 active fire products, abbreviated as MOD14 and MYD14, provide the detection time, coordinates, confidence, and bright temperature for each fire pixel (Giglio, 2013). Details of the fire detection algorithm was discussed by Giglio et al. (2003). In this work, the MODIS Level-2 fire spots observed within a domain (65–135∘ E and 5–40∘ N) from September 2011 to September 2012 were obtained. We used the datasets to analyze the monthly distributions of BB activities over the SE and S Asian continent.
3.1 Overview of airborne particulate As
A total of 302 daily TSP samples were collected at Mount Hehuan during the sampling period. Each TSP sample has been determined as the concentration of water-soluble ions and elements by IC and ICP-MS, respectively. Because the net mass of each collected aerosol sample was not measured, the abundance of each species relevant to the TSP mass can not be obtained. Figure 3 displays the average concentrations of ionic species together with metallic elements in TSP samples. All the concentrations are presented under prevailing conditions. Without the determination of carbon contents, sulfate was the most predominant species in airborne TSP samples with a mean concentration of 4.1 µg m−3, followed by nitrate (2.0 µg m−3), ammonium (1.7 µg m−3), and chloride (0.24 µg m−3). Aluminum (Al), a typical geological material, exhibited a mean concentration of 184 ng m−3 and was the predominant element. In addition to K, Ca, and Fe (higher than 100 ng m−3) were also major metals, followed by Na, Mg, Cu, Ti, Zn, and P (10 to 100 ng m−3), and then followed by Pb, Mn, Ba, and Sr (1 to 10 ng m−3). The rest metals had concentrations of <1 ng m−3 over the free troposphere. As expected, high concentrations for all species were found for the continental air clusters, including NC, SEA and SA air groups (see in Table S1 in the Supplement). In particular, the SA air parcel picked up heavily polluted air to the receptor site since the concentrations of secondary inorganic aerosols (SIA, including , and ) and crustal materials (Al, Fe, Ca, K, Mg, and Sr) were significantly higher than those of other continental air clusters. Although the reason was not well-understood, it might be attributed to the different emission sources passed through the air and the atmospheric processes during their long-range transport.
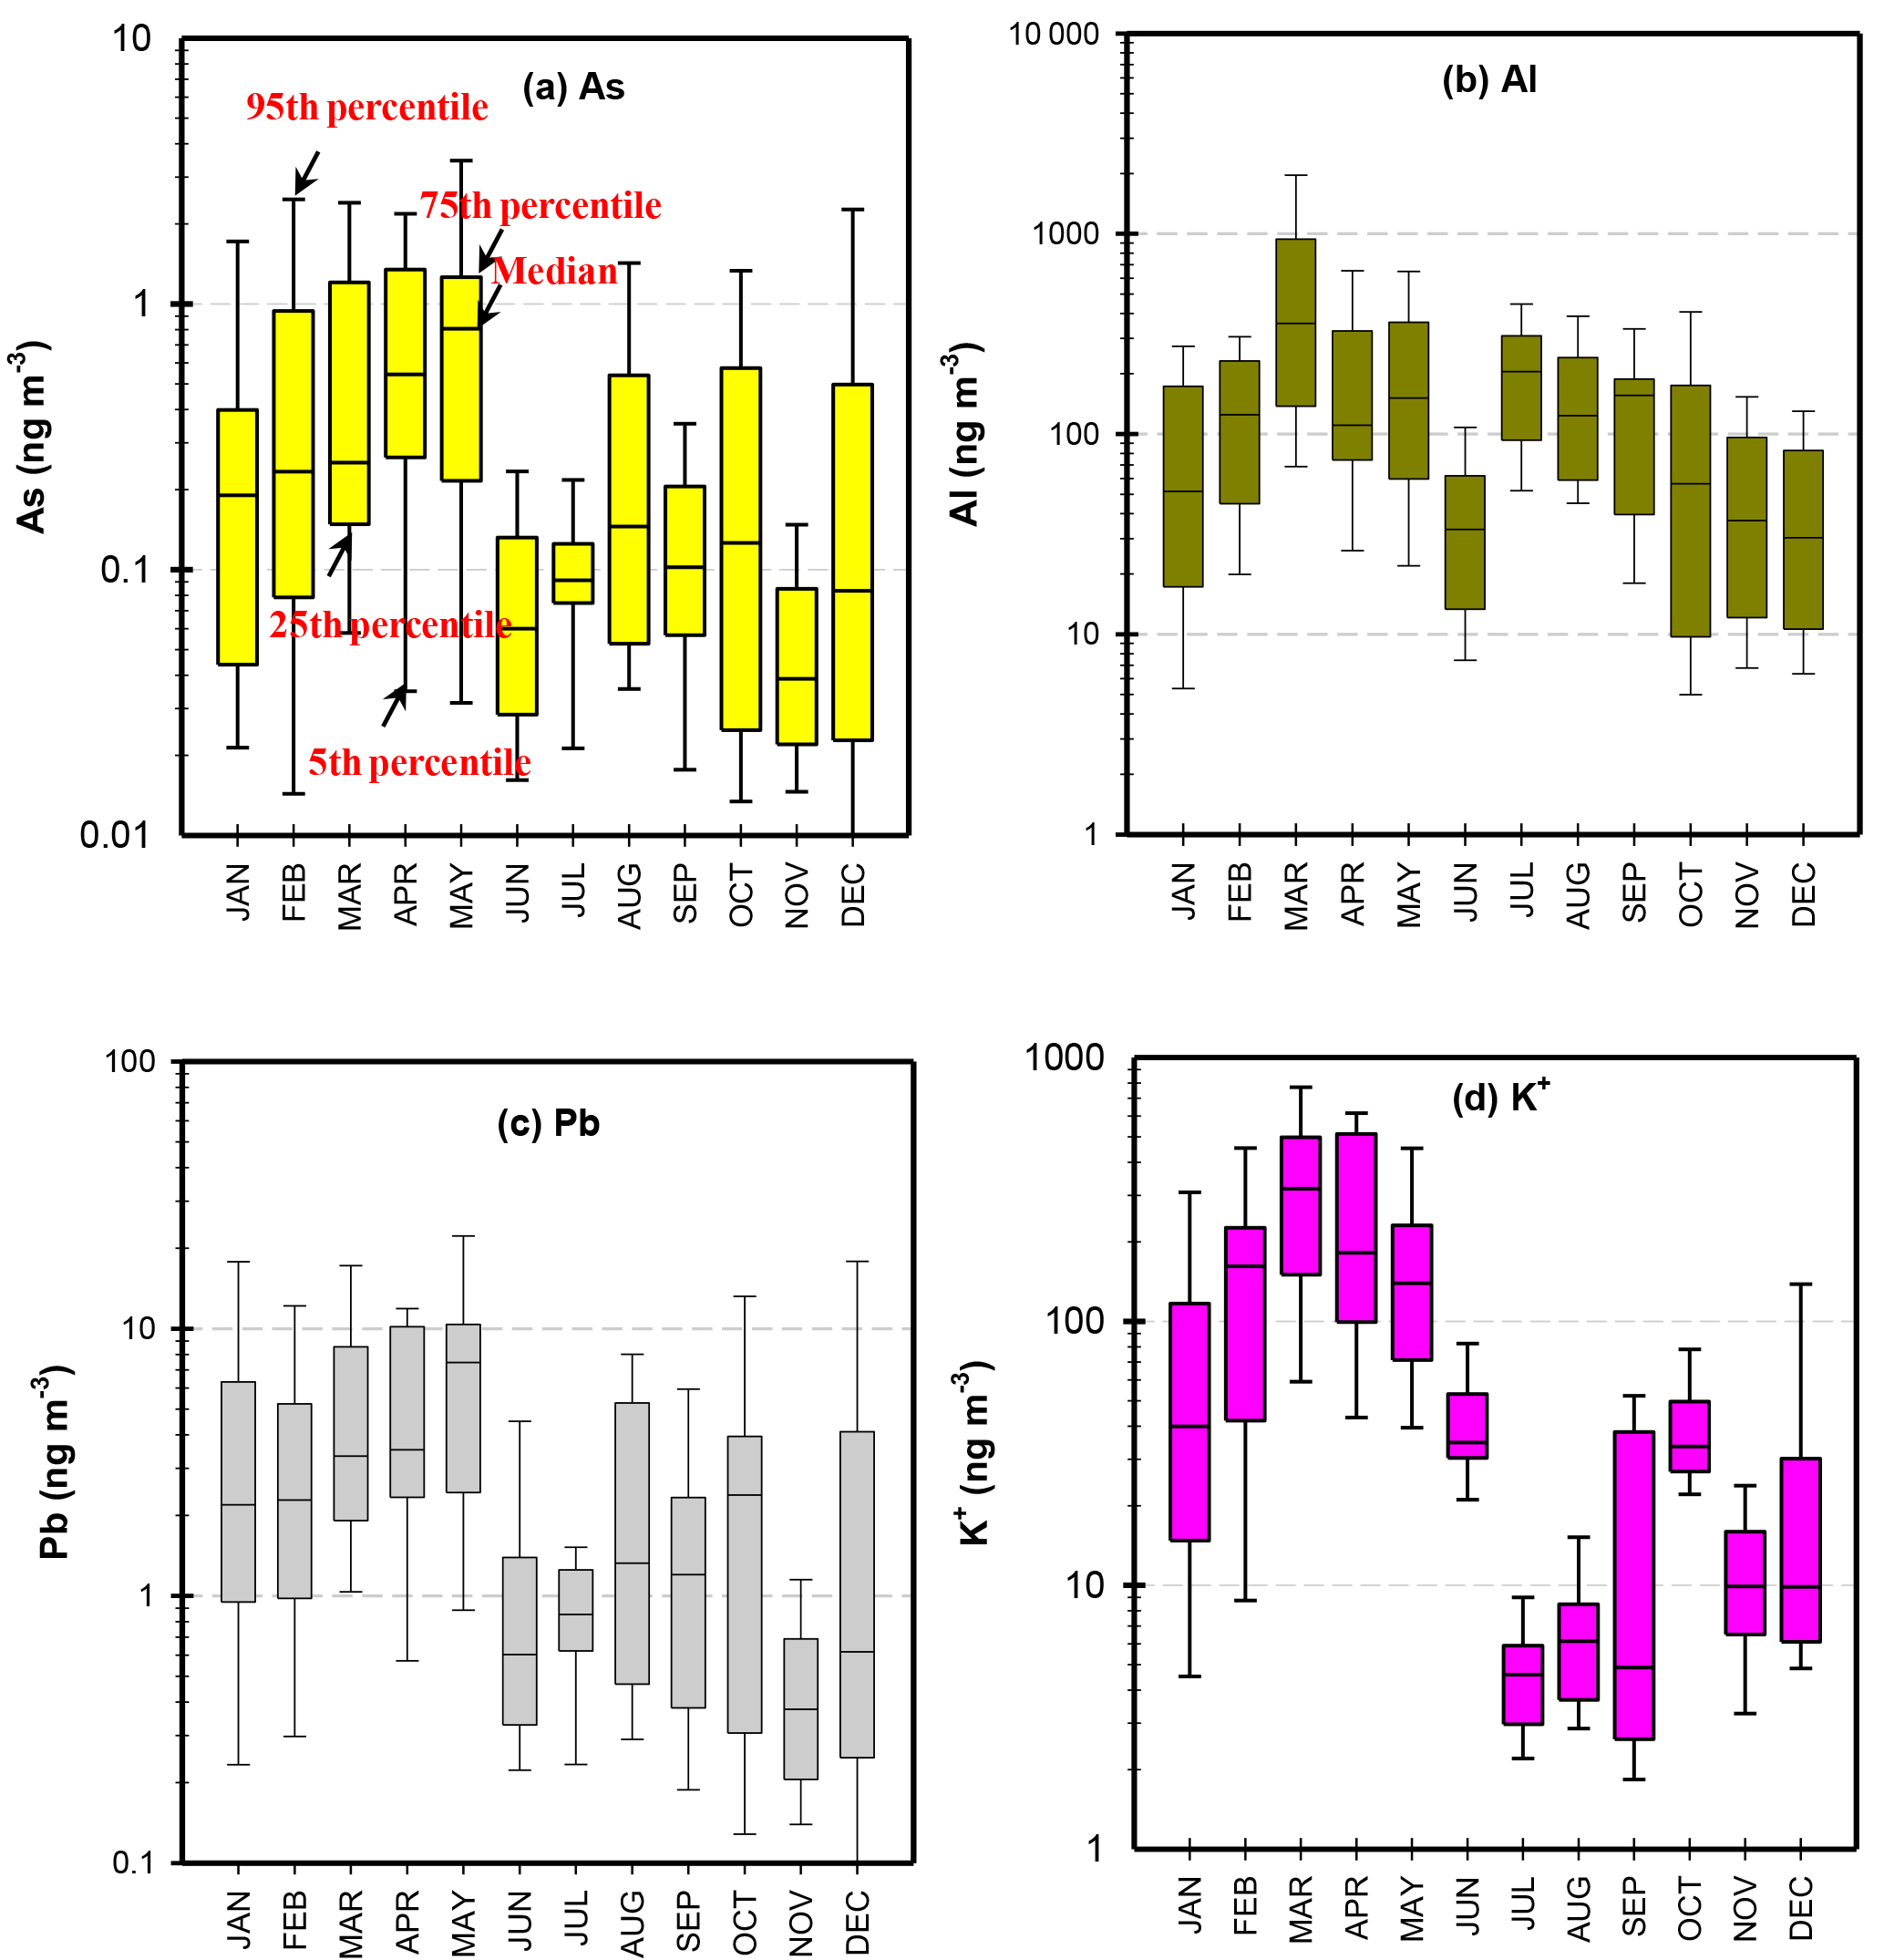
Figure 4Monthly distributions of 95th, 75th, 50th, 25th, and 5th percentile values of (a) As, (b) Al, (c) Pb, and (d) K+ concentrations observed at Mount Hehuan from 2011 September to 2012 September.
Arsenic, a target element in this study, exhibited a daily concentration ranging from 0.02 to 5.9 ng m−3, with a mean value of 0.5±1.0 ng m−3 (see Supplement Fig. S1). As expected, arsenic concentrations in the continental air groups, such as SA, NC, and SEA, were much higher than those in the marine air categories (Fig. 1 and Table S1). The As concentrations (∼0.1 ng m−3) in PO and SS air groups were in agreement with those of Mauna Loa, Hawaii (Zieman et al., 1995), indicating that the low As value can be considered a background concentration in the subtropical free troposphere (Zieman et al., 1995). A large standard deviation suggested that the As concentration at this mountainous site had a large day-to-day variation. Some As peaks were found with enhancements of both CO and potassium ion (K+) especially between January and May, indicating BB origins.
Figure 4a shows monthly variations of 95th, 75th, 50th, 25th, and 5th percentile values of arsenic concentrations observed at Mount Hehuan. As can be seen, the median concentration of arsenic increased from January (0.18 ng m−3), maximizing in May (0.81 ng m−3) and then decreasing abruptly from June to December (from 0.03 ng m−3 in November to 0.11 ng m−3 in August). The seasonality of As was different from that of Al (a tracer of dust) and K+ (a marker of BB) as shown in Fig. 4b and d, but it was very similar to that of Pb (Fig. 4c), suggesting that As and Pb might originate from similar sources. The seasonal distributions of As at this mountainous site were associated with emission sources, regional circulations, and local meteorological conditions. Marine air prevailed from July to November, except in October, resulting in lower As concentrations over the subtropical free troposphere. On the contrary, continental air prevailed in the wintertime and springtime, picking up polluted air and transporting it to the receptor site; as a result, an increase of As concentrations was expected. Besides this, favorable local meteorological conditions for the dispersion of air pollution might be another reason for the lower As concentrations in the summertime (Lin et al., 2011, 2013).
Table 1Summary of principal component analysis for aerosol species and carbon monoxide observed at Mount Hehuan. Factor loadings lower than ±0.4 are not given. Factor loadings lower than ±0.7 are marked in bold.

The 95th percentile value for As concentrations is better for understanding the distributions of high As events over the free troposphere. Higher 95th percentile values of arsenic were found between February and May compared to those of other seasons, reflecting that more high-As plumes crossed over Mount Hehuan from late winter to late spring. Over the subtropical free troposphere, two distinct haze plumes were usually observed from late winter to spring: one is dust storm that originated from eastern Asian and non-eastern Asian continents (Lin et al., 2001; Hsu et al., 2012), while another one is the BB plume that mainly comes from SE and S Asia (Lin et al., 2009, 2010). As shown in Fig. 4b and 4d, substantially elevated Al and K+ concentrations were observed in the springtime, especially for 75th percentile values, suggesting that Mount Hehuan was influenced by both dust and BB aerosols. Both specific plumes would impact the atmospheric compositions, of course, including airborne As in the Pacific region.

Figure 5Scattered plots of As against (a) K+, (b) Al, and (c) Pb in different As concentration bins observed at Mount Hehuan.
3.2 Potential source of As in the BB seasons
Table 1 lists the PCA results of the TSP observed at Mount Hehuan during the S and SE Asian BB seasons (from January to May) and non-BB seasons (from June to December). The results showed that there were three factors of TSP during the BB seasons. PC1 was associated with a mixed source of crustal materials (high loadings of Al, Fe, Mg, Ca, Sr, Ti, Mn, and Rb along with La, Ce, and Nd), SIA (high loadings of , , and ) and industrial emissions (high loadings of Ni, Mo, Tl, V, and Se). In PC2, a high loading was found for K+ and a moderate loading for CO, indicating BB sources. Interestingly, moderate loadings were also found for As and Pb, suggesting that both species might originate from BB activities. The PC3 was regarded as sea-salt aerosols, since the high loadings were found for Na+ and Cl−. During the non-BB periods, three factors were also assessed. The PC1 was assigned as a source related to crustal materials, with high loadings of Al, Fe, Mg, Ca, Sr, Ti, Mn, Rb, La, Ce, and Nd. In terms of PC2, high loadings of Tl, As, and Se were found, suggesting industrial emissions. In particular, highly positive loadings were found for As and Se, indicating that the As at Mount Hehuan during the non-BB seasons was mainly attributed to coal-fired power plants, which was very different from the results between January and May. The PC3 exhibited high loadings of , , and together with Na+ and Cl−, reflecting SIA and sea-salt aerosols.
Figure 5 shows the scattered plots of As against K+, Al, and Pb in different arsenic concentration bins. We found that As correlated well with K+ (r=0.78, p<0.05 for the 95th percentile value of As) when severely high As events occurred, suggesting BB origins. Oppositely, arsenic correlated weakly with Al (r ranged from 0.05 to 0.42) in all As concentration bins, indicating that wind-erosion soil was not a major source of airborne As at the sampling site. However, significantly positive correlations were observed between As and Pb within the 75th percentile of As values, reflecting that airborne As and Pb were from similar sources in the high arsenic events.
As discussed above, BB activities may be an important regional source of high As concentrations over the subtropical free troposphere, especially during the S and SE Asian BB seasons. Consequently, we tried to prove the hypothesis using backward trajectory analyses and MODIS fires observations along with the WRF-Chem-model simulated results. Figure S2 shows the seasonality of fire spots over SE and S Asia observed by MODIS from 2011 September to 2012 September. In SE Asia, the BB activities showed strong seasonal variations with a gradual increase from January to March, a time when they reached a peak. They then decreased substantially from late spring to a minimum in summer. In southern Asia, the total annual counts of fire spots were approximately 20 % of those in SE Asia. A similar seasonality was found in intensive fire spots in the springtime, with a maximum in May. The fire spots then decreased between summer and mid-winter, with a minimum in July. However, the total fire spots (SE Asia plus S Asia) reached a maximum in March. This might explain why particulate K+ and CO concentrations at Mount Hehuan were highest in March.
For convenience, prior to further analysis, we arbitrarily chose a K+ concentration of >109 ng m−3 (the 75th percentile value of potassium ion) as a criterion value for identifying the suspected BB events. A second criterion (CO concentration higher than 160 ppb) was also added for selection of the BB plume. Ultimately, a total of 49 suspected BB TSP samples were identified during the entire sampling period. Figure 6 shows time series of daily concentrations of As, K+, and CO observed at Mount Hehuan from January to May 2012, when intensive BB activities occurred over SE and S Asia. The air clusters are also shown in this figure for helping to identify the air origins. As can be seen, several As spikes coincided with increasing CO and K+ (e.g., 19 February, 30 and 31 March, 3 April, 5 and 7 May, etc.), implying BB origins. Backward trajectory showed that the air parcels for the high arsenic events originated mainly from S Asia (see in Fig. S3). A high arsenic plume passed over Mount Hehuan with As concentration increasing from 1.2 ng m−3 on 25 March to 5.3 ng m−3 on 3 April though low As concentration was found on 2 April. Figure S4a illustrates the 5-day backward trajectories starting at Mount Hehuan during this period. The results showed that the air parcels mainly passed over northern India, Nepal, Bangladesh and southeastern China before arriving in Taiwan. Figure 7a plots the distributions of MODIS fires from 25 March to 3 April and the WRF-Chem model results at an altitude of 700 hPa on 3 April, when the high daily As concentration (5.3 ng m−3) was observed. As seen in the figure, extensive fire spots were observed over the Indian subcontinent from 25 March to 2 April. In this case, the tracers were assigned to the fire locations derived from MODIS satellite data over the Indian subcontinent, ranging from 5 to 38∘ N and 65 to 90∘ E. They were placed at the first level above the surface at each fire location with a concentration of 1 unit per day. The WRF-Chem model results showed that significant BB plumes originated over the burned areas, were transported to the east, and passed over Mount Hehuan, resulting in increased concentrations not only of K+ and CO, but also of arsenic. As shown in Fig. 8a, during the BB events over the S Asian continent, arsenic correlated well with K+ (r=0.73, p<0.05). On the contrary, the correlation coefficient between As and K+ in the non-BB events was 0.53 (p>0.05). This supported our argument that airborne arsenic at Mount Hehuan is attributed to BB activities over S Asia.
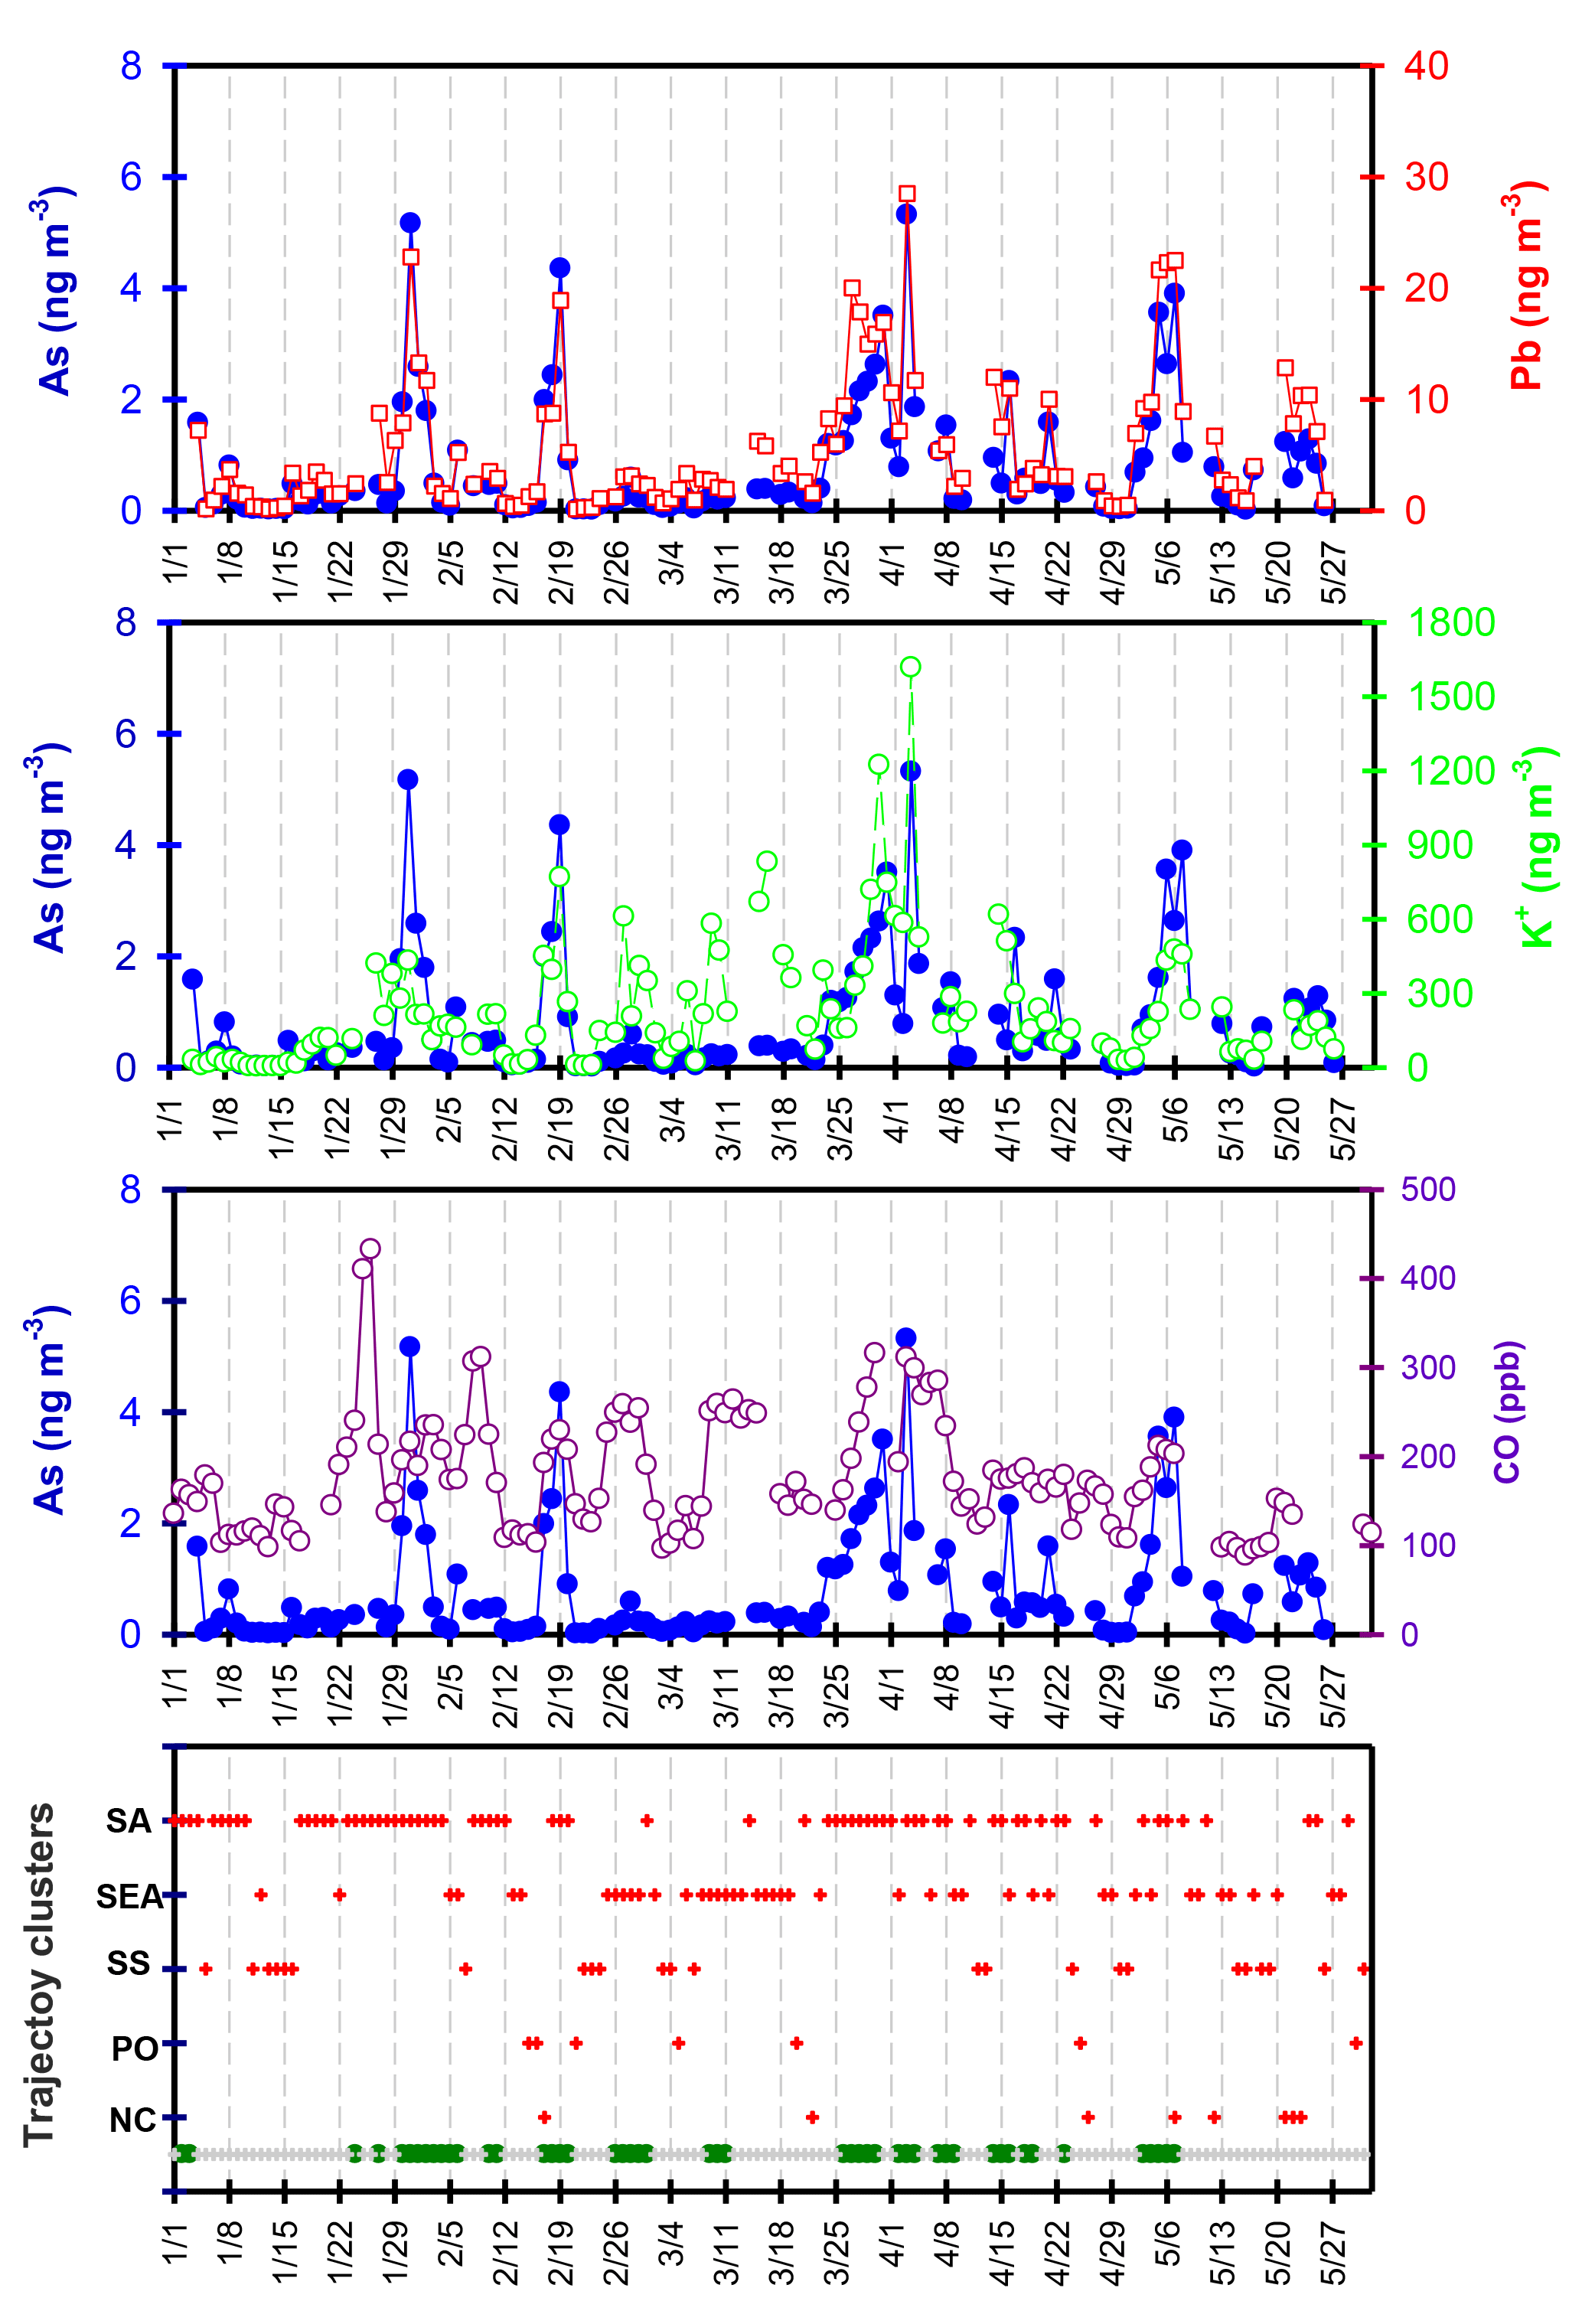
Figure 6Time series of daily airborne particulate As, Pb, K+, and CO concentrations and clusters of backward trajectories observed from January to May in 2012. In the bottom panel, the green and grey crosses denote the BB and non-BB samples identified in the text.
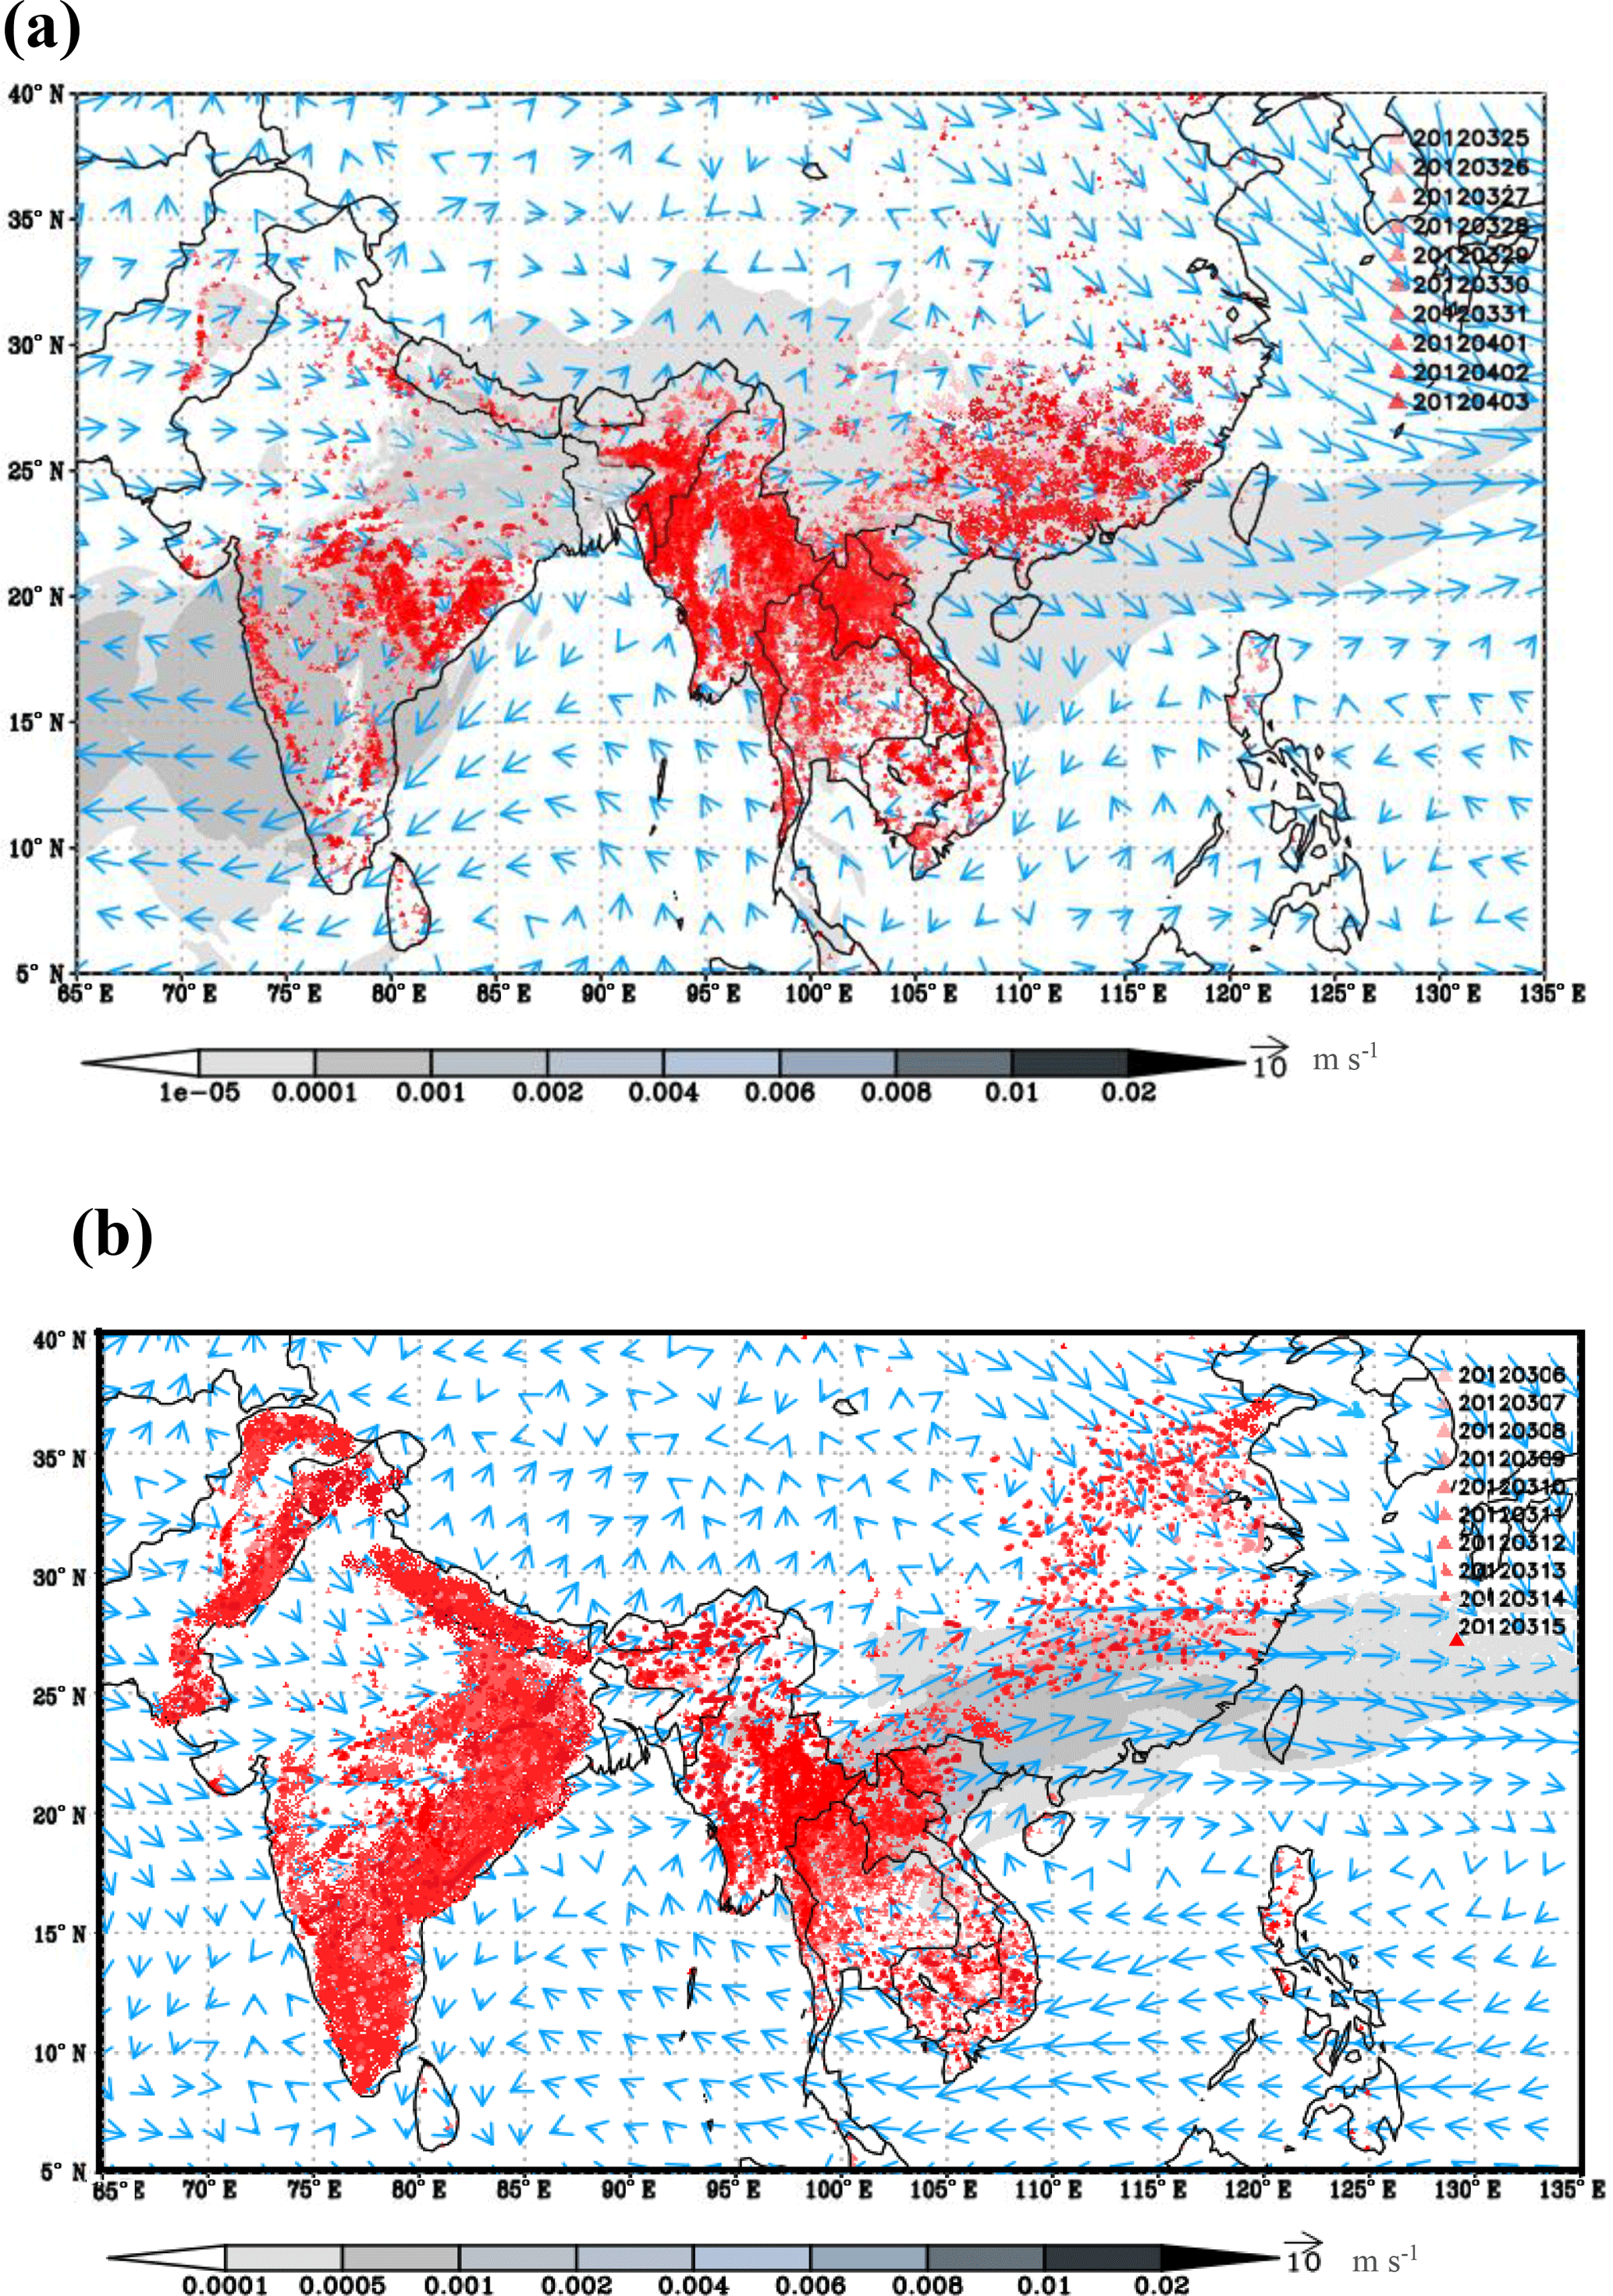
Figure 7MODIS fires on surface of ground and WRF-Chem modeled results of BB plumes at the altitude of 700 hPa on (a) 3 April and (b) 15 March. The blue arrows and lines denote the wind directions and wind speeds, respectively. The grey shadows represent tracer concentrations.
Some BB plumes were observed at Mount Hehuan, but the As concentrations did not increase. For example, a suspected BB plume was found from 8 to 15 March, since K+ and CO concentrations increased concurrently. Based on backward trajectory analysis, the air parcels during this BB event were mainly from SE Asia, passing over southeast China and then arriving at Mount Hehuan (Fig. S4b). Because backward trajectories were mainly from the mainland Southeast Asian peninsula, the tracers were then placed at the first level above the surface at each fire location in the mainland Southeast Asian peninsula ranging from 5 to 30∘ N and 90 to 110∘ E. The WRF-Chem model showed that the significant tracer concentration which was located in the northeast–southwest belt and covered Taiwan on 15 March (as shown in Fig. 7b). Nonetheless, the As concentration did not rise but maintained a low level of 0.2 ng m−3. Another similar case was also found in the end of February (25 to 28 February). The backward trajectories also showed that the air masses were mainly from the mainland Southeast Asian peninsula (see in Fig. S3). Unlike BB events over S Asia, arsenic correlated weakly with K+ (r=0.4, p>0.05, Fig. 8b) in the BB events from SE Asia as well as those in the marine air groups (Fig. 8c). These findings suggested that some specific sources might release numerous arsenic into atmosphere during BB activities over S Asia but not over the mainland Southeast Asian peninsula.
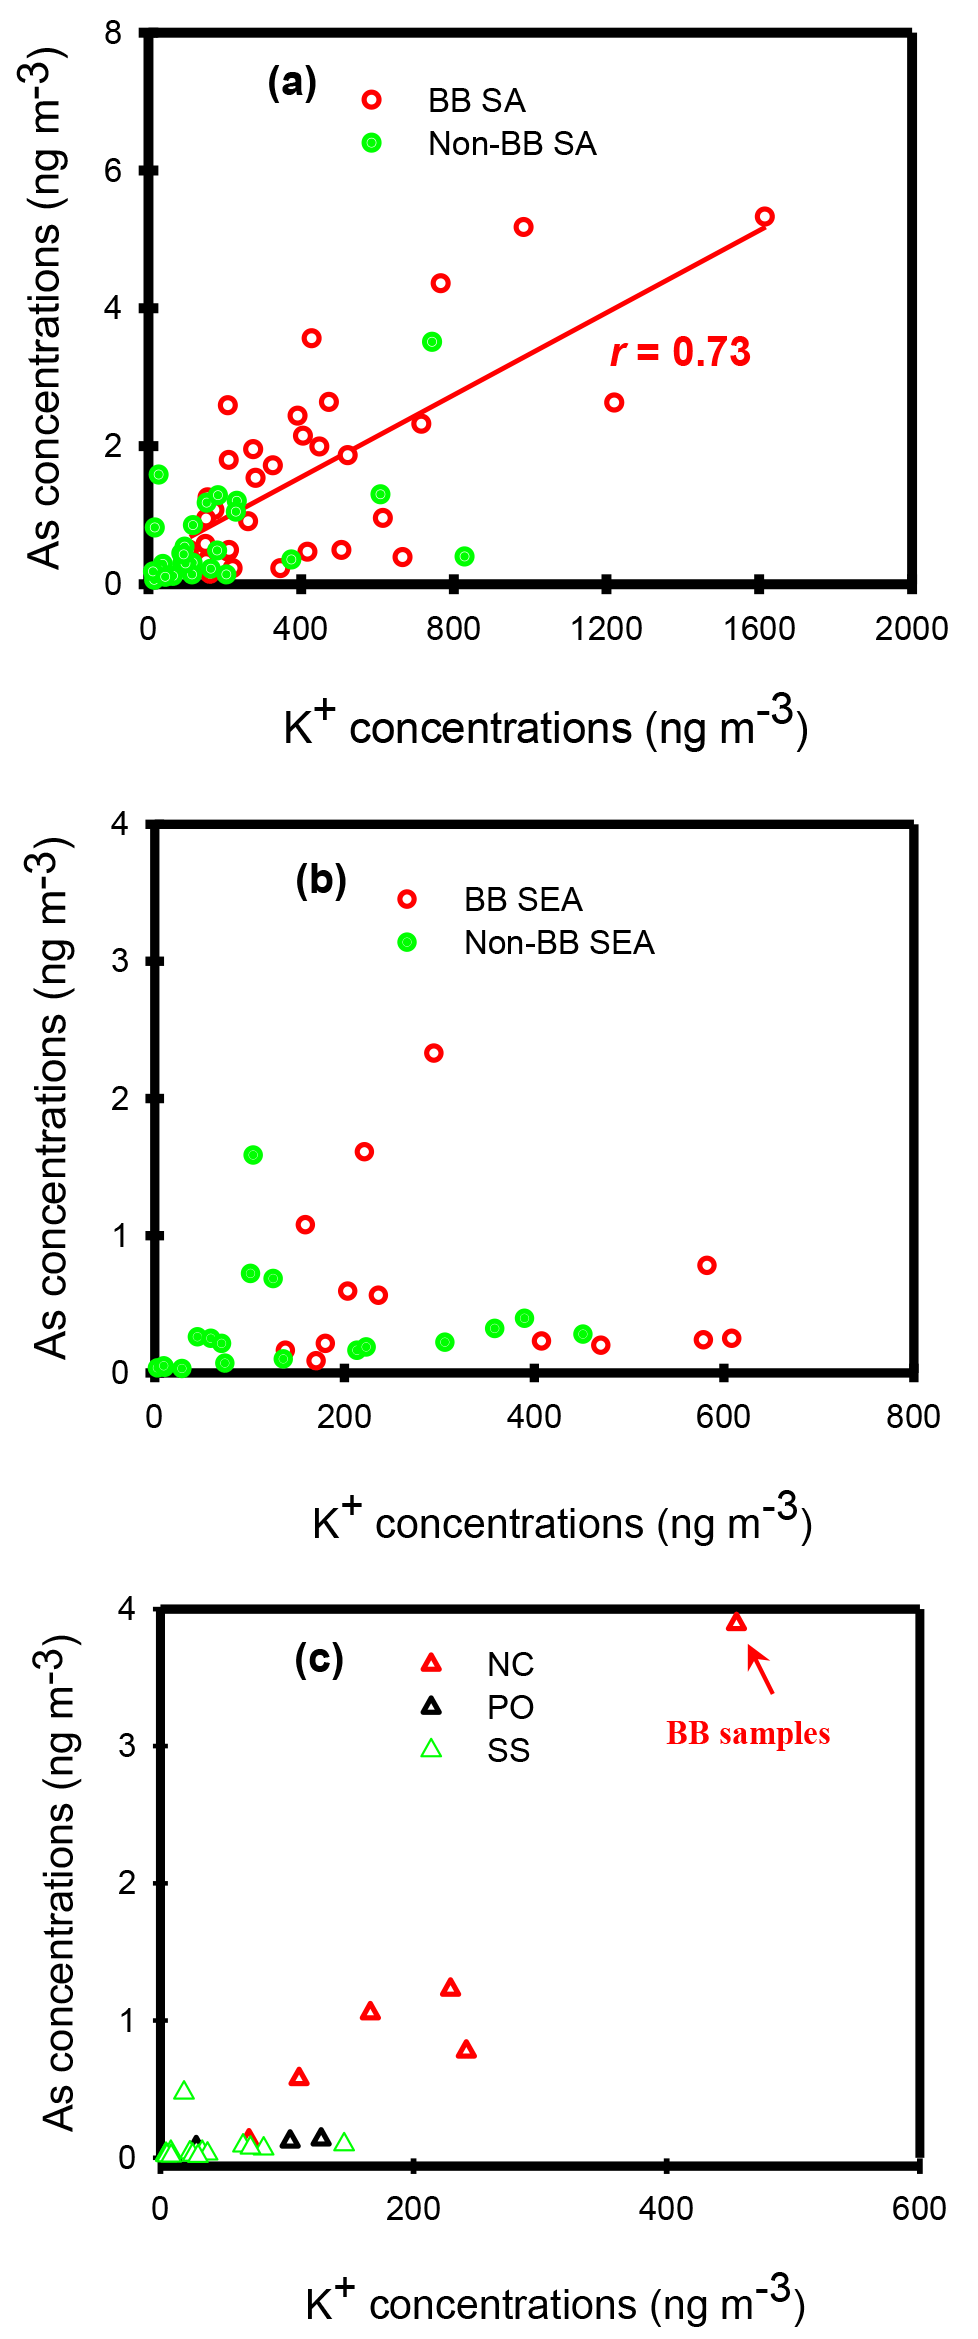
Figure 8Scattered plots of As against K+ observed at Mount Hehuan in (a) SA, (b) SEA, and (c) other air groups during the S and SE Asian biomass burning seasons.
Wind-erosion soil particles are an important source for airborne arsenic. According to the investigation by Nriagu (1989), arsenic derived from wind-erosion dust was 2.1 Gg yr−1, accounting for 18 % of natural As emissions. Figure S5a–c show the scattered plots of As against Al in all air groups during the S and SE Asian BB periods. Weak correlations were found between As and Al in the various air groups, except for the SS air category (r=0.88, p<0.05), indicating that wind-erosion soil was not a major source of As over the free troposphere. Interestingly, a strong correlation of As and Al was found in the SS air group. The marine air parcels, which spent a long time in the clean marine atmosphere, are subjected to dilution, which can affect the air pollution (Lin et al., 2011), probably resulting in similar behaviors of As and Al.
Recently, numerous studies pointed out that S Asia, especially in West Bengal in India and Bangladesh, is an area extremely contaminated with As (Burgess et al., 2010; Neumann et al., 2010; Roberts et al., 2010). In these regions, highly As-contaminated groundwater, typically caused by geological process, is not only used for drinking water but is also used for the irrigation of crops. The accumulation of arsenic has been found in rice roots and rice plants along with crop soils (Norra et al., 2005). After burning, the As might be released from these crops into the atmosphere and transported easterly to Pacific regions with BB plumes. On the other hand, uses of the pesticide as an insecticide for cotton, paddy, and wheat in India and Bangladesh might be another reason for As contamination in crops (Aktar et al., 2009). Lead arsenate (LA, [Pb5OH(AsO4)3]; As ∕ Pb ∼ 0.22) was the most extensively used arsenical insecticide in the world. It was used as an insecticide for gypsy moths invading hardwood forests in 1892. LA can be adhered to the surfaces of plants. Although LA was officially banned as insecticide in the 1990s in many developed countries, it has not been banned completely in India. Figure 9a and b show the scattered plots of As against Pb in TSP samples for various air groups during the S and SE Asian BB season. The higher As concentrations were generally found in the SA air category. In case of SA air group, the average As concentration in the BB events were 1.6±1.4 ng m−3, exceeding that (0.6±0.7 ng m−3) of non-BB events by a factor of 2.7 (p<0.05) and suggesting a special arsenic emission source over S Asian continent during the BB season. In some cases, low As concentrations were also found when the BB plumes were transported from S Asia. The reason has not been clearly understood but might be explained by a mixed source of the BB plume with other emissions during the air transportation. In terms of the SEA group, no substantial discrepancy of As concentrations was found during BB and non-BB periods, indicating that the BB activities over the mainland Southeast Asian peninsula were unable to enhance As concentrations over the subtropical free troposphere.
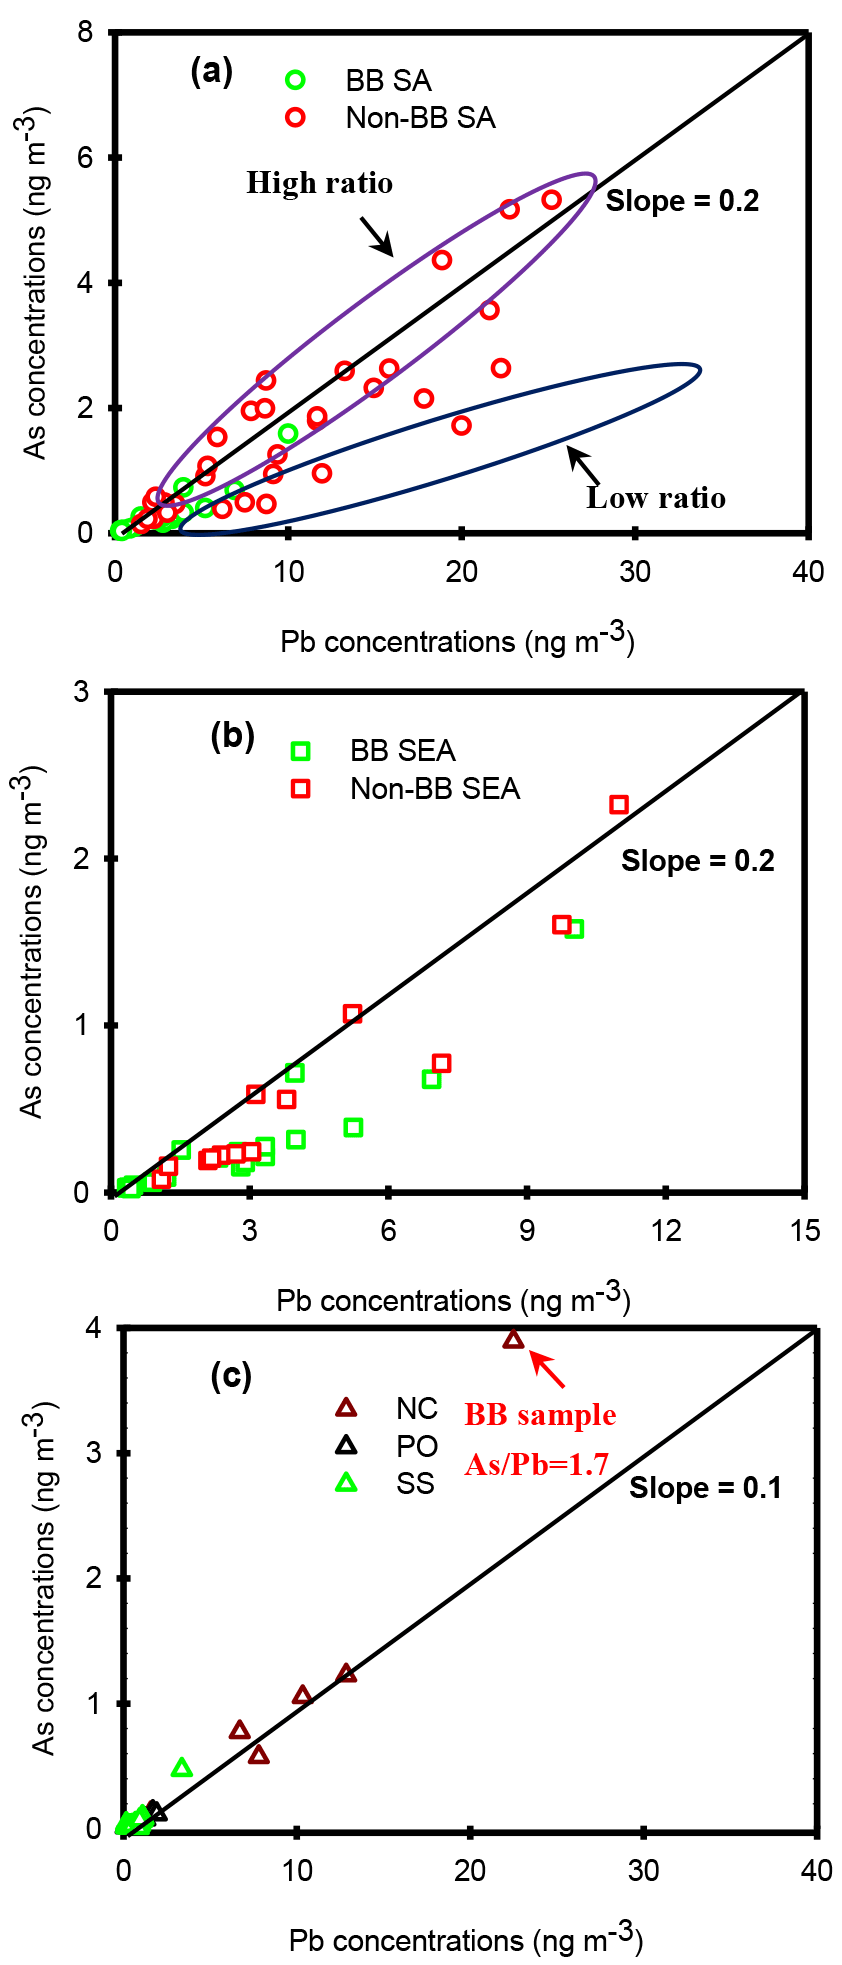
Figure 9Scattered plots of As against Pb observed at Mount Hehuan in (a) SA, (b) SEA, and (c) other air groups during the S and SE Asian biomass burning seasons.
During the S and SE Asian BB period, strong correlations between As and Pb (ranging from 0.84 for SA-BB to 0.96 for NC, see in Fig. 9) were found in various air groups; hence, a ratio of As ∕ Pb might give us an insight in how to trace the specifically regional arsenic sources in the SA air group when a BB activity occurred. During the SA-BB plumes, the average As ∕ Pb ratio was 0.18 (see in Fig. 9a), which was much higher than the average value (0.11) of non-BB (SA-non-BB) events along with those (ranging from 0.08 to 0.1) of other air categories (see in Fig. 9b and c), implying a special source of As during the BB events over S Asia. Some datasets of SA-BB groups showed low As ∕ Pb ratios, probably reflecting the air mixing of BB plumes and other emission sources transported to the subtropical free troposphere. Wind-erosion soil particles and metal smelting (lead smelting) along with coal combustion industries are major natural and anthropogenic sources of airborne As, respectively. In northern India, the As ∕ Pb ratio in natural soil, paved road and unpaved road dust varied from 0.02 to 0.13, while low As ∕ Pb ratios were found in lead smelting (0.002), coal combustion in stoves (0.0016), and coal fire power plants (0.0026) (Patil et al., 2013). Our As ∕ Pb ratios in the SA-BB events were much higher, suggesting that wind-erosion dust, lead smelting and coal combustion seemed not to be major As sources. In particular, the As ∕ Pb ratio was normally higher than 0.20 when severely high As concentrations were observed. This ratio was in line with that of LA (∼0.22), suggesting that burning crops contaminated by LA in S Asia could be a crucial candidate for extremely high As concentrations at Mount Hehuan during the BB periods.
3.3 Impact of Biomass Burning
The differences in As concentrations between the BB and non-BB days could be considered as the net influence of BB activities on the airborne As concentrations over the subtropical free troposphere (Lin et al., 2010, 2013). Table 2 lists the differences of As, Pb, K+, and CO concentrations of BB and non-BB samples for SA and SEA air groups in the S and SE Asian BB seasons. For the SA air cluster, all species apparently increased in the BB events. On average, the As concentrations in the BB and non-BB events were 1.6 and 0.6 ng m−3, respectively. The difference (1.0 ng m−3) accounted 63 % for the average As concentration on the BB days. This indicated that S Asian BB activities played an important source of high As concentrations at Mount Hehuan. On the contrary, the differences of concentrations in K+ and CO were observed in the BB and non-BB events for SEA air clusters but were not found for As and Pb. Again, this suggested that BB activities from SE Asia does not release enormous amounts of arsenic into atmosphere and transport it to the subtropical free troposphere by the westerly belt.
Table 2The max, min, mean, and standard deviation values of As, Pb, K+, and CO concentrations on the BB and Non-BB days in SA and SEA air clusters during the S and SE Asian BB periods (from January to May).
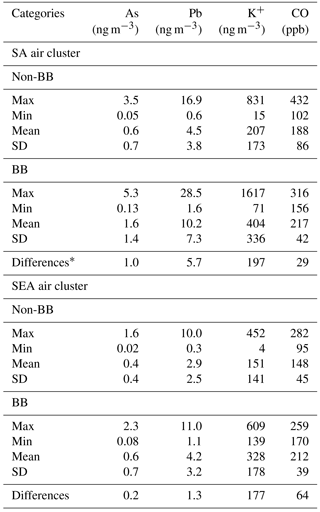
∗ Difference for each species are calculated by the mean values in BB and non-BB events.
From Table 2, we identified ΔK+, ΔCO, and ΔAs as the differences of concentrations in K+, As, and CO between the BB and non-BB days in SA and SEA air clusters during the BB seasons. Here, we also converted the units of daily K+ and As concentrations from ng m−3 to ppb based on the ambient temperature and molecular weight of K+ and As. Then, we can obtain the ratios of CO and ΔAs ∕ ΔCO without units. The parameters are useful in estimating the K+ or As emissions from BB activities over S and SE Asia. The BB air masses emitted from the S and SE Asian continents contained CO ratios of 0.0043 and 0.0018, respectively. Each value was within the same order of magnitude of that estimated by Tang et al. (2003), who claimed that the BB events emitted from SE Asia had a CO ratio of 0.0038. Besides, a ratio of ΔAs ∕ ΔCO in the S Asian BB events was estimated to be 0.00001, which was one order of magnitude higher than that (ΔAs ∕ ΔCO ∼0.000001) in SE Asian BB events, indicating that much more As released into atmosphere from the S Asian continent. According to the emission inventory, the annual CO emission rate from biomass burning over S Asia was nearly 17 Gg yr−1 (Stress et al., 2003), we then estimated that approximately 0.17 tons yr−1 of arsenic was released into atmosphere due to S Asian BB activities, resulting in enhancements of As concentrations over the subtropical free troposphere.
Daily TSP samples were collected at Mount Hehuan from September 2011 to September 2012 in order to investigate the behaviors of long-range transported particulate matter and its impact on atmospheric chemistry over the subtropical free troposphere. The concentrations of As, a target metal in this work, were determined by ICP-MS. The results showed that the daily As concentrations varied from 0.02 to 5.9 ng m−3, with a mean value of 0.5±1.0 ng m−3. Some high As concentrations coincided with concurrent enhancements of K+ and CO. PCA results indicated that high As concentrations were contributed to by BB emissions during the S and SE Asian BB seasons. The backward trajectory and WRF-Chem model results suggested that the high As plumes originated mainly from S Asia. The ratio of As ∕ Pb (>0.2) in high As events explained that the burning crops contaminated by lead arsenate might be an important source of high As concentrations at Mount Hehuan. Furthermore, biomass burning over S Asia produced an ΔAs∕ΔCO ratio of 0.00001 and released approximately 0.17 tons of As into atmosphere every year, causing an increase in As concentrations over the subtropical free troposphere.
The Asian continent is well known as a big source of airborne As in North Pacific region. Previously, high As concentrations over the free troposphere in the northern Pacific region have been considered contributions of industrial emissions (Perry et al., 1999; Wai et al., 2016). From our study, we proposed a new concept for a potential source of high As over the subtropical free troposphere, namely that BB activities over S Asia might be an important source of airborne arsenic. In this study, arsenic emissions from S Asian BB activities were estimated to be 0.17 ton yr−1. Compared to the globally anthropogenic arsenic emissions (∼18.8 Gg yr−1, Nriagu and Pacyna, 1988), arsenic released from the S Asian BB activities seemed to be neglected. Indeed, As concentrations at the receptor site did increase significantly when the BB plumes were transported from S Asia to Mount Hehuan. Consequently, we concluded that BB activities over S Asia could certainly impact arsenic cycles on a regional scale that has never been considered in previous studies.
The data used in this study are available from the corresponding author upon request (dryanlinzhang@outlook.com or zhangyanlin@nuist.edu.cn).
The supplement related to this article is available online at: https://doi.org/10.5194/acp-18-13865-2018-supplement.
YLZ and SCH conceived and designed the study. YCL analyzed the data and wrote the manuscript with YLZ. YC joined the discussion and assisted in analyzing some data. CYL helped with running the WRF-Chem model and analyzing fire spots from MODIS. SHL and YTH assisted with the field experiment and laboratory work.
The authors declare that they have no conflict of interest.
This study was financially supported by the National Key R&D Program of
China (Grant No. 2017YFC0212704), the Natural Scientific Foundation of China
(No. 41761144056 and 91643109), the Provincial Natural Science Foundation of
Jiangsu (Grant No. BK20180040), and the Ministry of Science and Technology of
R.O.C. (No. MOST 104-2111-M-001-009-MY2).
Edited by: Annele Virtanen
Reviewed by: two anonymous referees
Aktar, M. W., Sengupta, D., and Chowdhury, A.: Impact of pesticides use in agriculture: their benefits and hazards, Interdiscip. Toxicol., 2, 1–12, https://doi.org/10.2478/v10102-009-0001-7, 2009.
Bissen, M. and Frimmel, F.H.: A review. Part I: occurrence, toxicity, speciation, mobility, Acta Hydroch. Hydrob., 31, 9–18, https://doi.org/10.1002/aheh.200390025, 2003.
Brimblecombe, P.: Atmospheric arsenic, Nature, 280, 104–105, https://doi.org/10.1038/280104a0, 1979.
Burgess, W. G., Hoque, M. A., Michael, H. A., Voss, C. I., Breit, G. N., and Ahmed, K. M.: Vulnerability of deep groundwater in the Bengal Aquifer System to contamination by arsenic, Nat. Geosci., 3, 83–87, https://doi.org/10.1038/NGEO750, 2010.
Chang, D. and Song, Y.: Estimates of biomass burning emissions in tropical Asia based on satellite-derived data, Atmos. Chem. Phys., 10, 2335–2351, https://doi.org/10.5194/acp-10-2335-2010, 2010.
Chi, K. H., Lin, C.-Y., Ou-Yang, C.-F., Wang, J.-L., Lin, N.-H., Sheu, G.-R., and Lee, C.-T.: PCDD/F measurement at a high-altitude station in central Taiwan: evaluation of long-range transport of PCCD/Fs during the Southeast Asia biomass burning event, Environ. Sci. Technol., 44, 2954–2960, https://doi.org/10.1021/es1000984, 2010.
Crutzen, P. J. and Andreae, M. O.: Biomass burning in the Tropics-impact on atmospheric chemistry and biogeochemical cycles, Science, 250, 1667–1678, https://doi.org/10.1126/science.250.4988.1669, 1990.
Draxler, R. R. and Hess, G. D.: An overview of the HYSPLIT_4 modeling system for trajectories, dispersion and deposition, Aust. Meteorol. Mag., 47, 295–308, 1998.
Giglio, L., Descloitres, J., Justice, C. O., and Kaufman, Y. J.: An enhanced contextual fir detection algorithm for MODIS, Remote Sens. Environ., 87, 273–282, https://doi.org/10.1016/S0034-4257(03)00184-6, 2003.
Hsu, S.-C., Hus, C.-A., Lin, C.-Y., Chen, W.-N., Mahowald, N. M., Liu, S.-C., Chou, C. C. K., Liang, M.-C., Tsai, C.-J., Lin, F.-J., Chen, J.-P., and Huang, Y.-T.: Dust transport from non-East Asian sources to the North Pacific, Geophys. Res. Lett., 39, L12804, https://doi.org/10.1029/2012GL051962, 2012.
Huang, K., Zhuang, G., Lin, Y., Fu, J. S., Wang, Q., Liu, T., Zhang, R., Jiang, Y., Deng, C., Fu, Q., Hsu, N. C., and Cao, B.: Typical types and formation mechanisms of haze in an Eastern Asia megacity, Shanghai, Atmos. Chem. Phys., 12, 105–124, https://doi.org/10.5194/acp-12-105-2012, 2012.
Kaufman, Y. J., Justice, C. O., Flynn, L. P., Kendall, J. P., Prins, E. M., Giglio, L., Ward, D. E., Menzel, W. P., and Setzer, A. W.: Potential global fire monitoring from EOS-MODIS, J. Geophys. Res.-Atmos., 103, 32215–32238, https://doi.org/10.1029/98JD01644, 1998.
Kondo, Y., Morino, Y., Takegawa, N., Koike, M., Kita, K., Miyazaki, Y., Sachse, G. W., Vay, S. A., Avery, M. A., Flocke, F., Weinheimer, A. J., Eisele, F. L., Eondlo, M. A., Weber, R. J., Singh, H. B., Chen, G., Crafword, J., Blake, D. R., Fuelberg, H. E., Clarke, A. D., Talbot, R. W., Sandholm, S. T., Browell, E. V., Streets, D. G., and Liely, B.: Impacts of biomass burning in Southeast Asia on ozone and reactive nitrogen over the western Pacific in spring. J. Geophys. Res.-Atmos., 109, D15S12, https://doi.org/10.1029/2003JD004203, 2004.
Lin, C.-Y., Hsu, H.-m., Lee, Y. H., Kuo, C. H., Sheng, Y.-F., and Chu, D. A.: A new transport mechanism of biomass burning from Indochina as identified by modeling studies, Atmos. Chem. Phys., 9, 7901–7911, https://doi.org/10.5194/acp-9-7901-2009, 2009.
Lin, C.-Y., Zhao, C., Liu, X., Lin, N.-H., and Chen, W.-N.: Modelling of long-range transported of Southeast Asia biomass-burning aerosols to Taiwan an their radiative forcings over East Asia, Tellus B, 66, 23733, https://doi.org/10.3402/tellusb.v66.23733, 2014.
Lin, T.-H.: Long-range transport of yellow sand to Taiwan in spring 2000: observed evidence and simulation, Atmos. Environ., 35, 5873–5882, https://doi.org/10.1016/S1352-2310(01)00392-2, 2001.
Lin, Y. C., Lin, C. Y., and Hsu, W. T.: Observations of carbon monoxide mixing ratios at a mountain site in central Taiwan during the Asian biomass burning season, Atmos. Res., 95, 270–278, https://doi.org/10.1016/j.atmosres.2009.10.006, 2010.
Lin, Y. C., Lin, C. Y., Lin, P. H., Engling, G., Lan, Y.-Y., Kuo, T.-H., Hsu, W. T., and Ting, C.-J.: Observations of ozone and carbon monoxide at Mei-Feng mountain site (2269 m a.s.l.) in central Taiwan: seasonal variations and influence of Asian continental outflow, Sci. Total Environ., 15, 3033–3042, https://doi.org/10.1016/j.scitotenv.2011.04.023, 2011.
Lin, Y. C., Lin, C. Y., Lin, P. H., Engling, G., Lin, Y. C., Lan, Y. Y., Chang, C. W. J., Kuo, T. H., Hsu, W. T., and Ting, C. C.: Influence of Southeast Asian biomass burning on ozone and carbon monoxide over subtropical Taiwan, Atmos. Environ., 64, 358–365, https://doi.org/10.1016/j.atmosenv.2012.09.050, 2013.
Lin, Y.-C., Huh, C.-A., Hsu, S.-C., Lin, C.-Y., Liang, M.-C., and Lin, P.-H.: Stratospheric influence on the concentration and seasonal cycle of lower tropospheric ozone: observation at Mount Hehuan, Taiwan, J. Geophys. Res.-Atmos., 119, 3527–3536, https://doi.org/10.1002/2013JD020736, 2014.
Mandal, B. K. and Suzuki, K. T.: Arsenic round the world: a review, Talanta, 58, 201–235, https://doi.org/10.1016/S0039-9140(02)00268-0, 2002.
Neumann, R. B., Ashfague, N., Badruzzaman, A. B. M., Ali, M. A., Shoemaker, J. K., and Harvey, C. F.: Anthropogenic influences on groundwater arsenic concentrations in Bangladesh, Nat. Geosci., 3, 46–52, https://doi.org/10.1038/NGEO685, 2010.
Niyobuhungiro, R.V. and Blottnitz, H.v.: Investigation of arsenic airborne in particulate matter around caterers' wood fires in Cape Town region, Aerosol Air Qual. Res., 13, 219–224, https://doi.org/10.4029/aaqr.2012.06.0148, 2013.
Norra, S., Berner, E. A., Agarwala, P., Wagner, E., Chandrasekharam, D., and Stüben, D.: Impact of irrigation with As rich groundwater on soil and crops: a geochemical study in West Bengal Delta Plain, India, Appl. Geochem., 20, 1890–1906, https://doi.org/10.1016/j.apgeochem.2005.04.019, 2005.
Nriagu, J. O.: A global assessment of natural sources of atmospheric trace metals, Nature, 338, 47–49, https://doi.org/10.1038/338047a0, 1989.
Nriagu, J. O. and Pacyna, J. M.: Quantitative assessment of worldwide contamination of air, water and soils by trace metals, Nature, 333, 134–139, https://doi.org/10.1038/333134a0, 1988.
Patil, R. S., Kumar, R., Menon, R., Shah, M. K., and Sethi, V.: Development of particulate matter speciation profiles for major sources in six cities in India, Atmos. Res., 132–133, 1–11, https://doi.org/10.1016/j.atmosres.2013.04.012, 2013.
Perry, K. D., Chahill, T. A., Schnell, R. C., and Harris, J. M.: Long-range transport of anthropogenic aerosols to the National Oceanic and Atmospheric Administration baseline station at Mauna Loa Observatory, Hawaii. J. Geophys. Res.-Atmos., 104 18521–18533, https://doi.org/10.1029/1998JD100083, 1999.
Pochanart, P., Akimoto, H., Kajii, Y., and Sukasem, P.: Carbon monoxide, regional-scale, and biomass burning in tropical continental Southeast Asia: Observations in rural Thailand. J. Geophys. Res.-Atmos., 108, 4552, https://doi.org/10.1029/2002JD003360, 2003.
Ramanathan, V., Crutzen, R. J., Kiehl, J. T., and Rosenfeld, D.: Aerosols, climate and the hydrological cycle, Science, 294, 2119–2124, https://doi.org/10.1126/science.1064034, 2001.
Roberts, L. C., Hug, S. J., Dittmar, J., Voegelin, A., Kretzschmar, R., Wehrli, B., Cirpka, O. A., Saha, G. C., Ali, M. A., and Badruzzaman, A. B. M.: Arsenic release from paddy soils during monsoon flooding, Nat. Geosci. 3, 53–59, https://doi.org/10.1038/ngeo723, 2010.
Streets, D. G., Bond, T. C., Carmichael, G. R., Fernandes, S. D., Fu, Q., He, D., Klimont, Z., Nelson, S. M., Tsai, N. Y., Wang, M. Q., Woo, J.-H., and Yarber, K. F.: An inventory of gaseous and primary aerosol emissions in Asia in the year 2000, J. Geophys. Res.-Atmos., 108, 8809–8831, https://doi.org/10.1029/2002JD003093, 2003.
Tang, Y., Carmichael, R. G., Woo, J.-H., Thongboonchoo, N., Kurata, G., Uno, I., Streets, D. G., Blake, D. R., Weber, R. J., Talbot, R. W., Kondo, Y., Singh, H. B., and Wang, T.: Influence of biomass burning during the Transport and Chemical Evolution Over the Pacific (TRACE-P) experiment identified by the regional chemical transport model, J. Geophys. Res.-Atmos., 108, 8824, https://doi.org/10.1029/2002JD003110, 2003.
Val Martin, M., Logan, J. A., Kahn, R. A., Leung, F.-Y., Nelson, D. L., and Diner, D. J.: Smoke injection heights from fires in North America: analysis of 5 years of satellite observations, Atmos. Chem. Phys., 10, 1491–1510, https://doi.org/10.5194/acp-10-1491-2010, 2010.
van der Werf, G. R., Randerson, J. T., Giglio, L., van Leeuwen, T. T., Chen, Y., Rogers, B. M., Mu, M., van Marle, M. J. E., Morton, D. C., Collatz, G. J., Yokelson, R. J., and Kasibhatla, P. S.: Global fire emissions estimates during 1997–2016, Earth Syst. Sci. Data, 9, 697–720, https://doi.org/10.5194/essd-9-697-2017, 2017.
Venter, A. D., van Zyl, P. G., Beukes, J. P., Josipovic, M., Hendriks, J., Vakkari, V., and Laakso, L.: Atmospheric trace metals measured at a regional background site (Welgegund) in South Africa, Atmos. Chem. Phys., 17, 4251–4263, https://doi.org/10.5194/acp-17-4251-2017, 2017.
Viana, M., Querol, X., Alastuey, A., Gil, J. J., and Menéndez, M.: Identification of PM sources by principal component analysis (PCA) coupled with wind direction data, Chemosphere, 65, 2411–2418, https://doi.org/10.1016/j.chemosphere.2006.04.060, 2006.
Wai, K.-H., Wu, S., Li, X., Jaffe, D. J., and Perry, K. D.: Global atmospheric transport and source-receptor relationships for arsenic, Environ. Sci. Technol., 50, 3714–3720, https://doi.org/10.1021/acs.est.5b05549, 2016.
Walsh, P. R., Duce, R. A., and Fasching, J. L.: Considerations of the enrichment, sources and flux of arsenic in the troposphere, J. Geophys. Res.-Oceans, 84, 1719–1726, https://doi.org/10.1029/JC084iC04p01719, 1979.
Weiss-Penizas, P, Jaffe, D., Swartzendruber, P., Hafner, W., Chand, D., and Prestbo, E.: Quantifying Asian and biomass burning sources of mercury using the Hg ∕ CO ratio in pollution plumes observed at the Mount Bachelor observatory, Atmos. Environ., 41, 4366–4379, https://doi.org/10.1016/j.atmosenv.2007.07.058, 2007.
Zieman, J. J., Holmes, J. L., Connor, D., Jensen, C. R., and Zoller, W. H.: Atmospheric aerosol trace element chemistry at Mauna Loa Observatory: 1. 1979–1985, J. Geophys. Res.-Atmos., 100, 25979–25994, https://doi.org/10.1029/93JD03316, 1995.