the Creative Commons Attribution 4.0 License.
the Creative Commons Attribution 4.0 License.
 | 25 Sep 2018
Impact of low-pressure systems on winter heavy air pollution in the northwest Sichuan Basin, China
Guicai Ning
Shigong Wang
Steve Hung Lam Yim
Jixiang Li
Yuling Hu
Ziwei Shang
Jinyan Wang
Jiaxin Wang
The cities of Chengdu, Deyang, and Mianyang in the northwest Sichuan Basin are part of a rapidly developing urban agglomeration adjoining the eastern slopes of the Tibetan Plateau. Heavy air pollution events have frequently occurred over these cities in recent decades, but the effects of meteorological conditions on these pollution events are unclear. We explored the effects of weather systems on winter heavy air pollution from 1 January 2006 to 31 December 2012 and from 1 January 2014 to 28 February 2017. A total of 10 heavy air pollution events occurred during the research period and 8 of these took place while the region was affected by a dry low-pressure system at 700 hPa. When the urban agglomeration was in front of the low-pressure system and the weather conditions were controlled by a warm southerly air flow, a strong temperature inversion appeared above the atmospheric boundary layer acting as a lid. Forced by this strong inversion layer, the local secondary circulation was confined to the atmospheric boundary layer, and the horizontal wind speed in the lower troposphere was low. As a result, vertical mixing and horizontal dispersion in the atmosphere were poor, favoring the formation of heavy air pollution events. After the low-pressure system had transited over the region, the weather conditions in the urban agglomeration were controlled by a dry and cold air flow from the northwest at 700 hPa. The strong inversion layer gradually dissipated, the secondary circulation enhanced and uplifted, and the horizontal wind speed in the lower troposphere also increased, resulting in a sharp decrease in the concentration of air pollutants. The strong inversion layer above the atmospheric boundary layer induced by the low-pressure system at 700 hPa thus played a key role in the formation of heavy air pollution during the winter months in this urban agglomeration. This study provides scientific insights for forecasting heavy air pollution in this region of China.
- Article
(4137 KB) -
Supplement
(501 KB) - BibTeX
- EndNote


Air quality, especially the occurrence of heavy air pollution events, is not only strongly affected by excessive emission of air pollutants, but is also closely associated with meteorological conditions, including atmospheric circulations, weather systems, structures of the atmospheric boundary layer, and the corresponding meteorological parameters (Deng et al., 2014; Gu and Yim, 2016; Li et al., 2015; Wei et al., 2011; Ye et al., 2016; Zhang et al., 2012). The total amount of pollutants emitted in a particular period of time is usually stable in China (Wu et al., 2017), but there are large differences in the concentrations of air pollutants, indicating that the meteorological conditions have an important role in modulating concentrations of ambient air pollutants (Gao et al., 2011; Hu et al., 2014; Ji et al., 2012, 2014; Wang et al., 2010; Wang et al., 2009; Yang et al., 2011).
Weather systems control the ability of the atmosphere to disperse pollutants and thus provide the primary driving force for variations in regional air pollution (Chen et al., 2008; Ye et al., 2016). Leśniok et al. (2010) reported that the atmosphere was stagnant and that the concentrations of near-ground air pollutants increased significantly in Upper Silesia, Poland, during periods with an anticyclonic circulation. By contrast, when a cyclonic circulation prevailed, causing an inflow of fresh air masses from regions with lower levels of pollution, the concentrations of air pollutants decreased. As synoptic-scale high-pressure ridges at 500 hPa transit across Utah, accompanied by warm advection above valleys, the stability of the atmosphere is increased and favors the formation of persistent pools of cold air, resulting in deterioration in air quality (Whiteman et al., 2014).
Many studies have been carried out on the impact of weather systems on air quality in China. Bei et al. (2016) classified typical synoptic situations and evaluated their contributions to air quality in the Guanzhong Basin, China. They found that an inland high-pressure system at 850 hPa resulted in temperature inversion, low horizontal wind speed, and a shallow atmospheric boundary layer, which favor the formation of heavy air pollution. Weather systems have significant impacts on the transport of air pollutants. Luo et al. (2018) reported that the trans-boundary air pollution and the pollutant concentration in Hong Kong increased when a tropical cyclone was approaching. During winter, floating dust particles over northwestern China can be carried downstream to northern China by the prevailing northwesterly winds at 700 hPa, where they mix with anthropogenic pollution to form a regional haze (Tao et al., 2012, 2014). Changes in weather systems also significantly influence air quality. Shallowing of the East Asian trough and weakening of the Siberian high pressure in winter can induce weak horizontal advection and vertical convection in the lower troposphere, reducing the height of the boundary layer in the Beijing–Tianjin–Hebei region and favoring the formation of haze (Zhang et al., 2016).
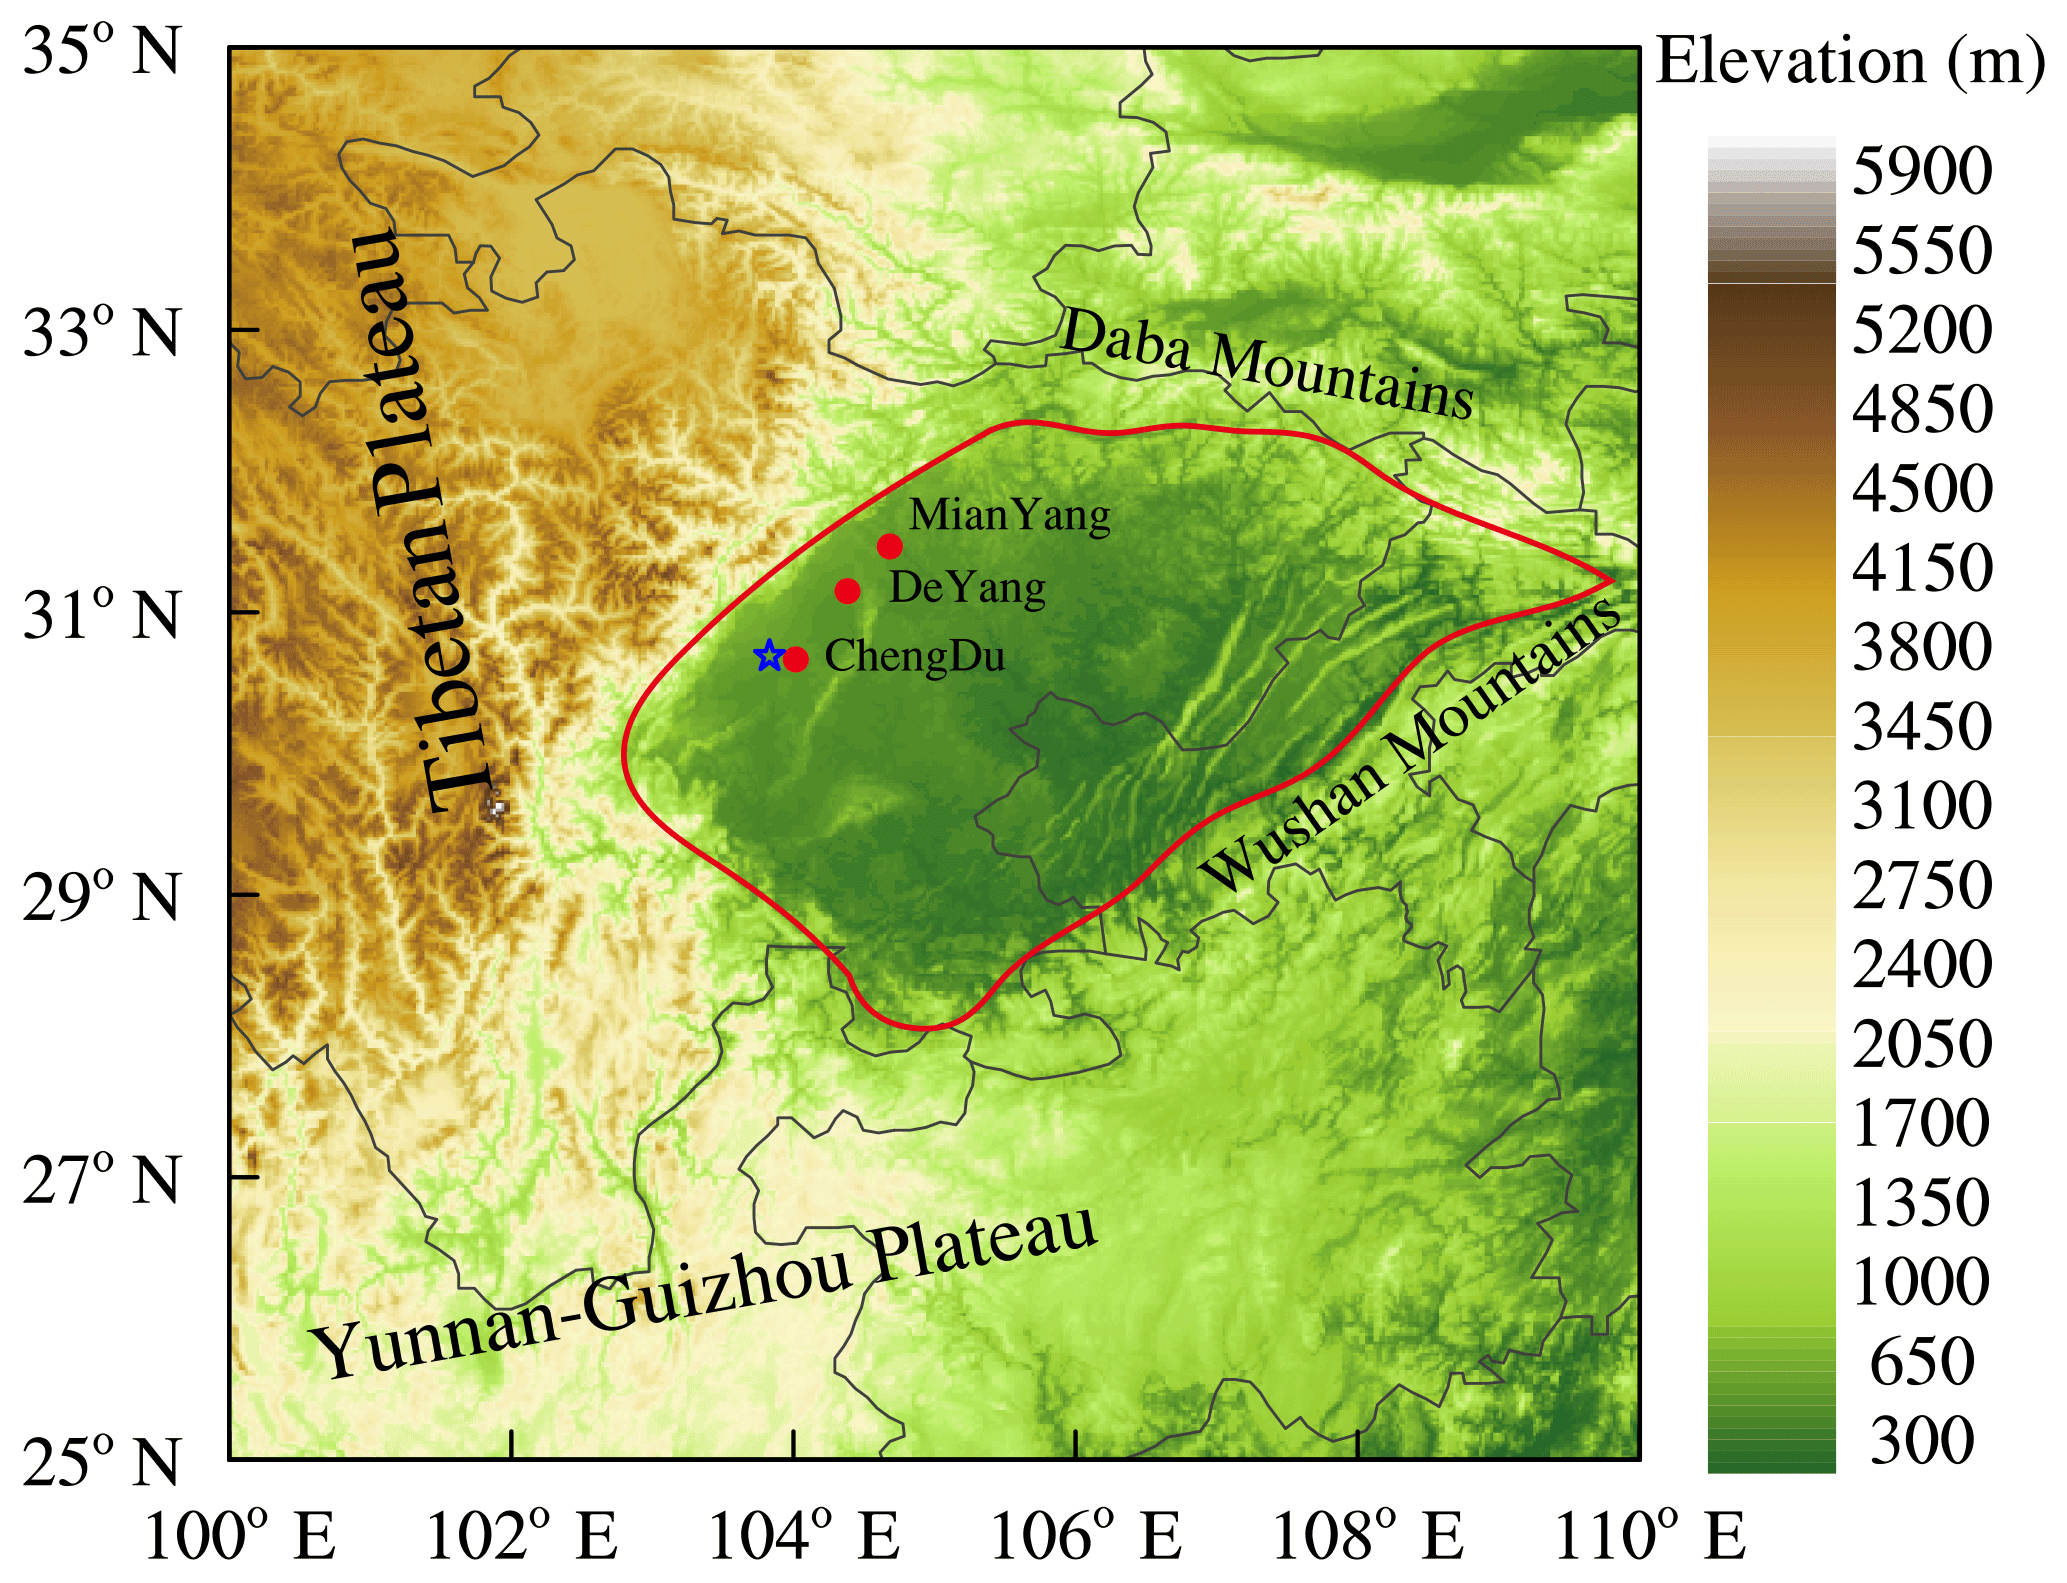
Figure 1Topographic map (shading, units: m) of the Sichuan Basin (delineated in red) and surrounding areas showing the location of the cities of Chengdu, Deyang, and Mianyang (red dots). The Wenjiang station is marked with blue five-pointed stars.
The deep Sichuan Basin to the east of the Tibetan Plateau has a maximum elevation difference > 2000 m, and is ranked fourth in China for heavy air pollution after the Beijing–Tianjin–Hebei region, the Yangtze River Delta, and the Pearl River Delta (Tian et al., 2017; Zhang et al., 2012). The complex terrain leads to unique weather systems that affect air quality in this region (Chen et al., 2014; Huang et al., 2017). Low-pressure systems, such as a southwest vortex and low trough, are often formed at 700 hPa due to the dynamic and thermodynamic effects of the Tibetan Plateau (Wang and Tan, 2014; Yu et al., 2016) and have different characteristics in different seasons. They are warm and moist low-pressure systems in summer and autumn and have crucial effects on local precipitation (Feng et al., 2016; Peng and Cheng, 1992); much work has been carried out in an attempt to understand the impacts of these low-pressure systems on precipitation (Chen et al., 2015; Fu et al., 2011; Kuo et al., 1986, 1988; Ni et al., 2017). In winter and spring, however, these low-pressure systems are both dry and cold (Feng et al., 2016). No attempt has previously been made to investigate the association between air quality and these dry and cold low-pressure systems.
Chengdu, Deyang, and Mianyang have undergone rapid development to form an urban agglomeration in the northwest Sichuan Basin. This urban agglomeration lies close to the eastern slopes of Tibetan Plateau, and is affected by low-pressure systems moving east from the plateau (Feng et al., 2016). Heavy air pollution events have frequently occurred over it in recent decades. The number of days with exceedance of Grade II standards (MEP, 2012) is more than 150 days each year in Chengdu (Ning et al., 2018). Most previous studies have investigated the basic characteristics of air pollution (Chen and Xie, 2012; Chen et al., 2014; Luo et al., 2001; Ning et al., 2018; Tao et al., 2013a,b; Zhang et al., 2017) and the related meteorological parameters (He et al., 2017; Li et al., 2015; Liao et al., 2017; Zeng and Zhang, 2017). However, the influencing mechanisms of a dry low-pressure system on heavy air pollution events have yet to be comprehensively explored. The main purpose of this study was to statistically analyze the relationships between low-pressure systems and winter heavy air pollution events in this urban agglomeration, and to explore the physical mechanisms involved in the formation of winter heavy air pollution. This study can deepen our understanding of the meteorological causes of heavy air pollution events in winter, and provide scientific insights that can be used by local governments to take effective measures to mitigate air pollution.
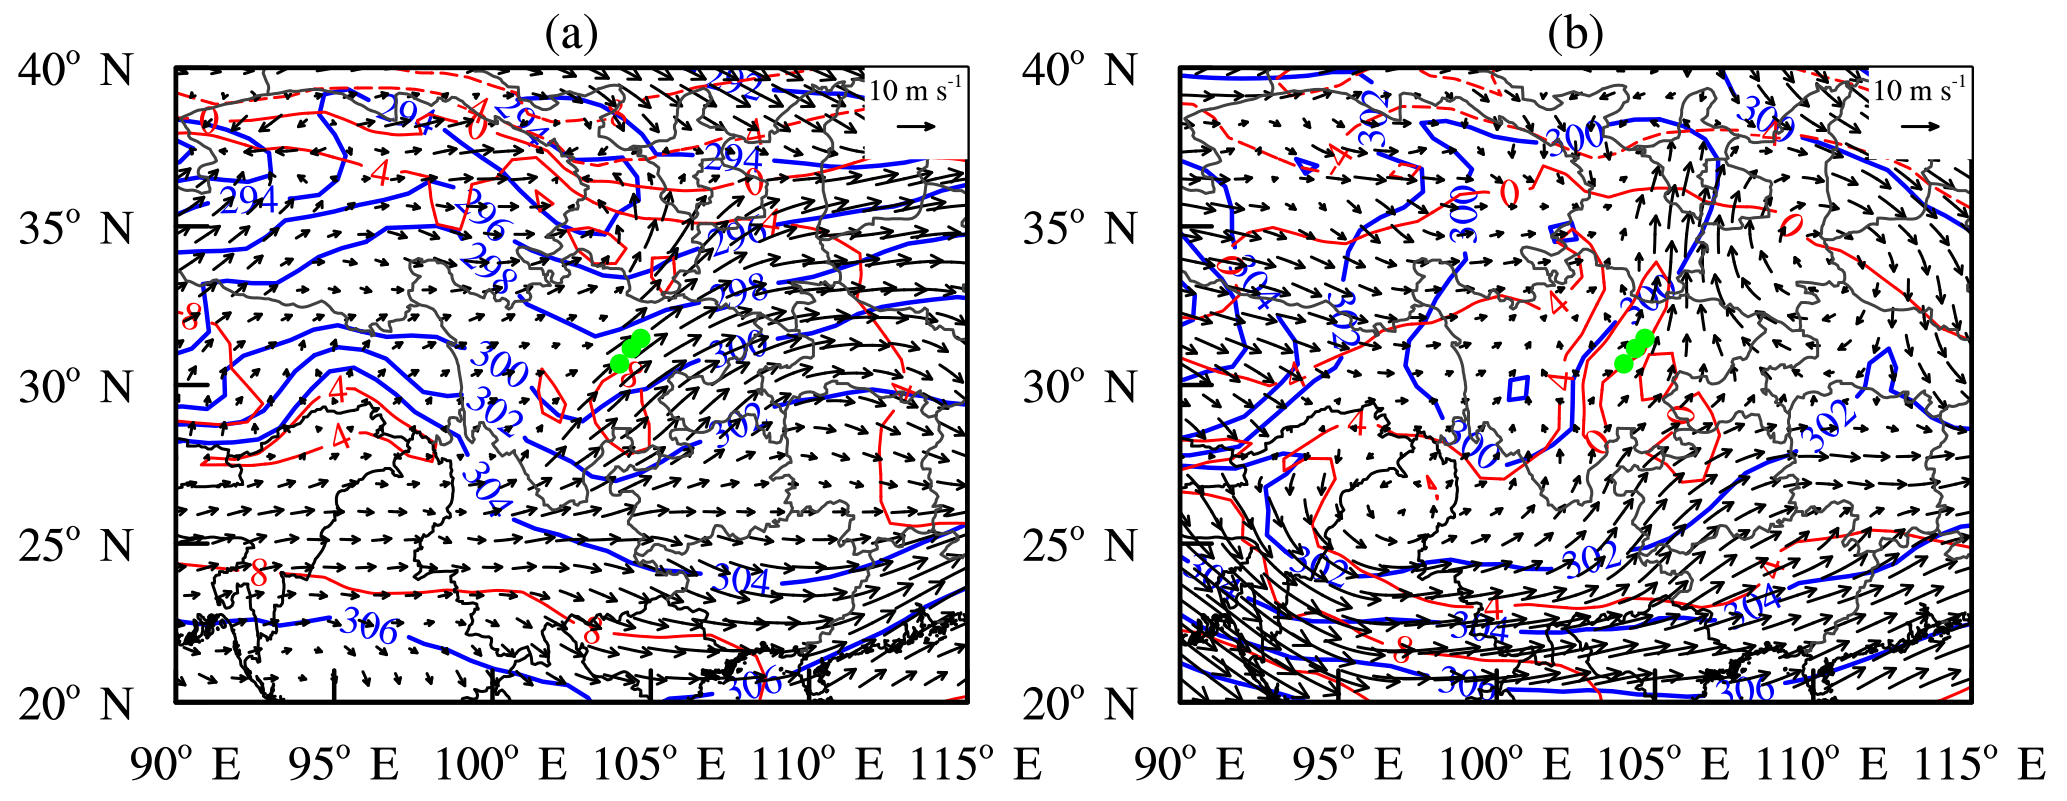
Figure 2Weather maps at 700 hPa based on ERA-Interim daily data showing (a) a trough from event 2 at 20:00 BST on 28 January 2006 and (b) a low vortex from event 4 at 14:00 BST on 22 December 2007. The blue lines are isopleths of geopotential height, the red lines are isotherms, and the black arrows are wind vectors. The green dots show the location of the urban agglomeration.
This paper is organized as follows. The data and methods are described in Sect. 2. Section 3 provides a statistical analysis of the relationships between the low-pressure systems and winter heavy air pollution. Section 4 illustrates the physical mechanisms of the effect of weather systems on air pollution and our conclusions are summarized in Sect. 5.
2.1 Air quality data
Air pollution in the Sichuan Basin during the winter months is mainly caused by particulate matter (Ning et al., 2018). The Chinese Ministry of Environmental Protection (MEP) currently monitors particles with diameters ≤2.5 µm (PM2.5) and particles with diameters ≤10 µm (PM10). We studied heavy air pollution events occurring during the winter months in Chengdu, Deyang, and Mianyang in the northwest Sichuan Basin (Fig. 1). We selected pollution events with a daily PM10 mean concentration from 1 January 2006 to 31 December 2012 and from 1 January 2014 to 28 February 2017. The third revision of the “Ambient Air Quality Standard” (AAQS) (GB3095-2012) was released on 29 February 2012, replacing the old AAQS (GB3095-1996), and PM2.5 was adopted into the AAQS in China from 2013 onwards. The air quality monitoring stations needed to be updated and there were missing measurements during 2013 within the data of air pollutants monitored in the three cities. Thus, the winter heavy pollution events during 2013 have not been analyzed in this paper. Moreover, the PM10 daily mean concentration from 1 January 2014 to 28 February 2017 refers to the 24 h average concentration of PM10 from 00:00 BST (Beijing standard time, i.e., coordinate universal time (UTC) +8 h) to 24:00 BST on the current day based on the new AAQS (GB3095-2012). However, based on the old AAQS (GB3095-1996), the PM10 daily mean concentration from 1 January 2006 to 31 December 2012 refers to the 24 h average concentration of PM10 from 12:00 BST on the previous day to 12:00 BST on the current day. Hourly concentrations of PM2.5, sulfur dioxide (SO2), nitrogen dioxide (NO2), carbon monoxide (CO), and ozone (O3) were also measured in the three cities from 1 January 2014 to 28 February 2017. The above air quality data were collected from the MEP website (http://datacenter.mep.gov.cn/index, last access: 22 January 2018).
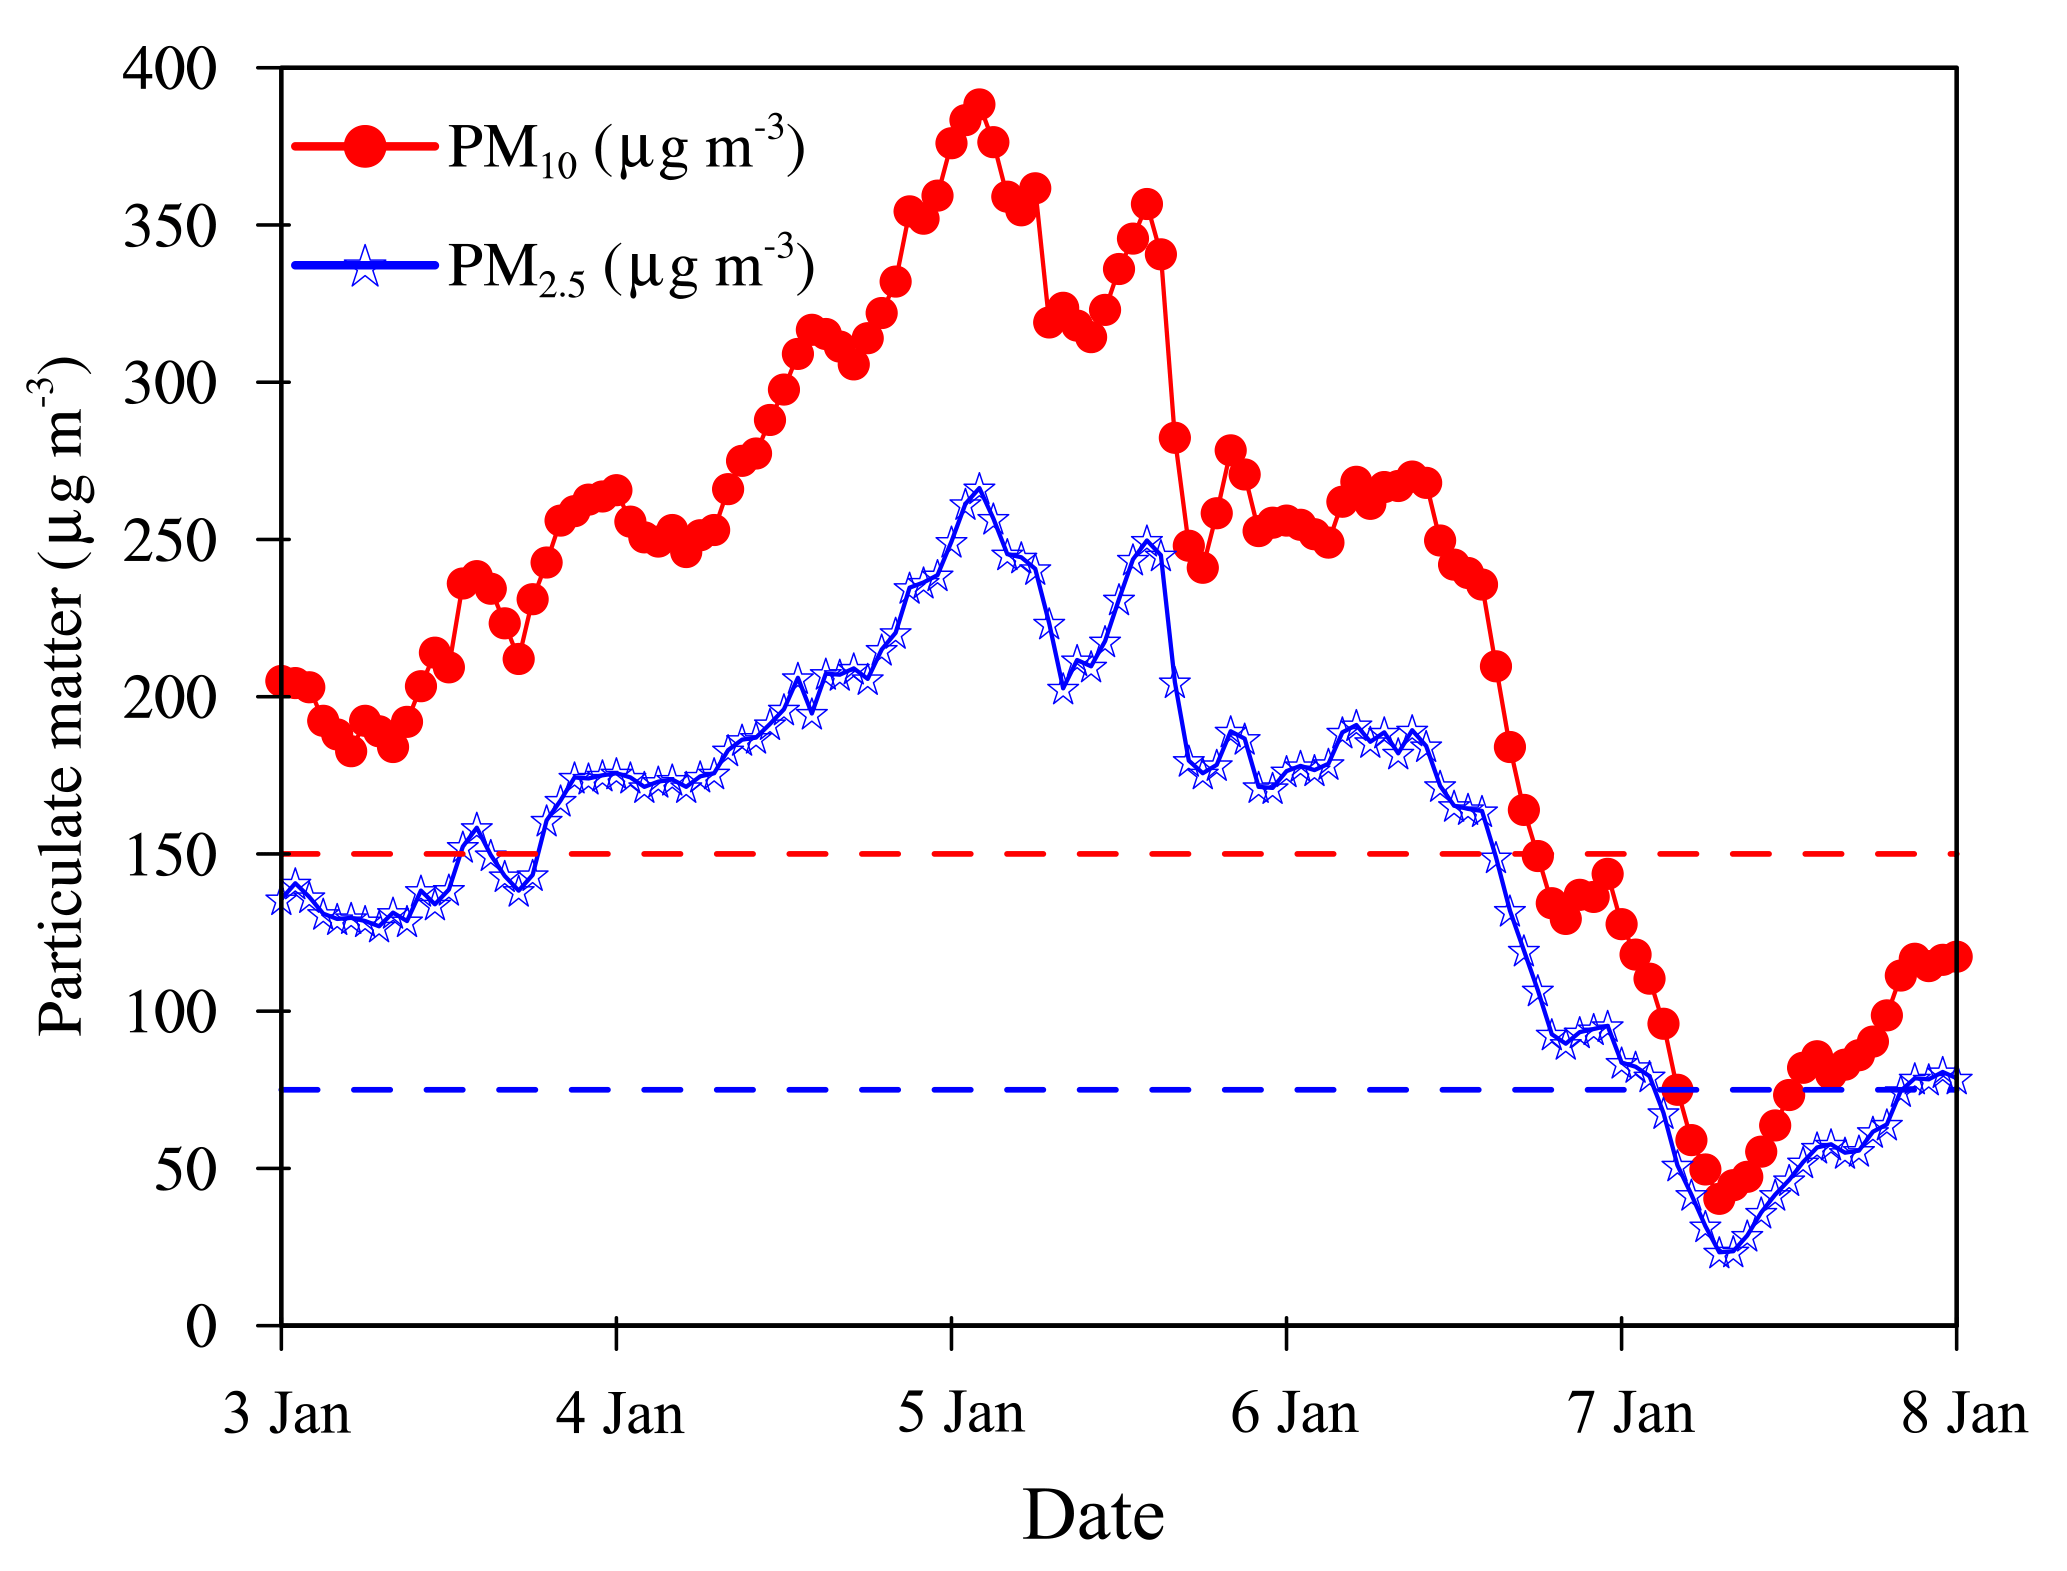
Figure 3Average hourly concentrations of surface PM10 (red solid line) and PM2.5 (blue solid line) in the urban agglomeration from 00:00 BST on 3 January 2017 to 00:00 BST on 8 January 2017 during event 8. The dashed red line represents the Grade II standard of PM10 daily concentration (150 µg m−3), and the dashed blue line represents the Grade II standard of PM2.5 daily concentration (75 µg m−3).
2.2 Meteorological data
(1) ERA-Interim daily data
To analyze the weather systems at 700 hPa, and the dynamic and thermodynamic conditions in the lower troposphere, the temperature, the geopotential, the vertical velocity, and the u and v components of wind during the study period were obtained from the ERA-Interim daily dataset ( grids) from 950 to 500 hPa for a total of 14 vertical layers (with a vertical separation of 25 hPa from 950 to 775 hPa and a vertical separation of 50 hPa from 750 to 500 hPa). These meteorological data are available for 00:00, 06:00, 12:00, and 18:00 UTC and were collected from the website (http://apps.ecmwf.int/datasets/data/interim-full-daily/levtype=pl/, last access: 20 August 2018). The height of the atmospheric boundary layer was obtained from the ERA-Interim daily dataset at the surface with a 3 h temporal resolution (00:00, 03:00, 06:00, 09:00, 12:00, 15:00, 18:00, and 21:00 UTC) (http://apps.ecmwf.int/datasets/data/interim-full-daily/levtype=sfc/, last access: 20 August 2018) to explore the structure of the atmospheric boundary layer. This boundary layer height was defined as the level where the bulk Richardson number, based on the difference between quantities at that level and the lowest model level, reaches the critical value Ricr=0.25 (Beljaars, 2006).
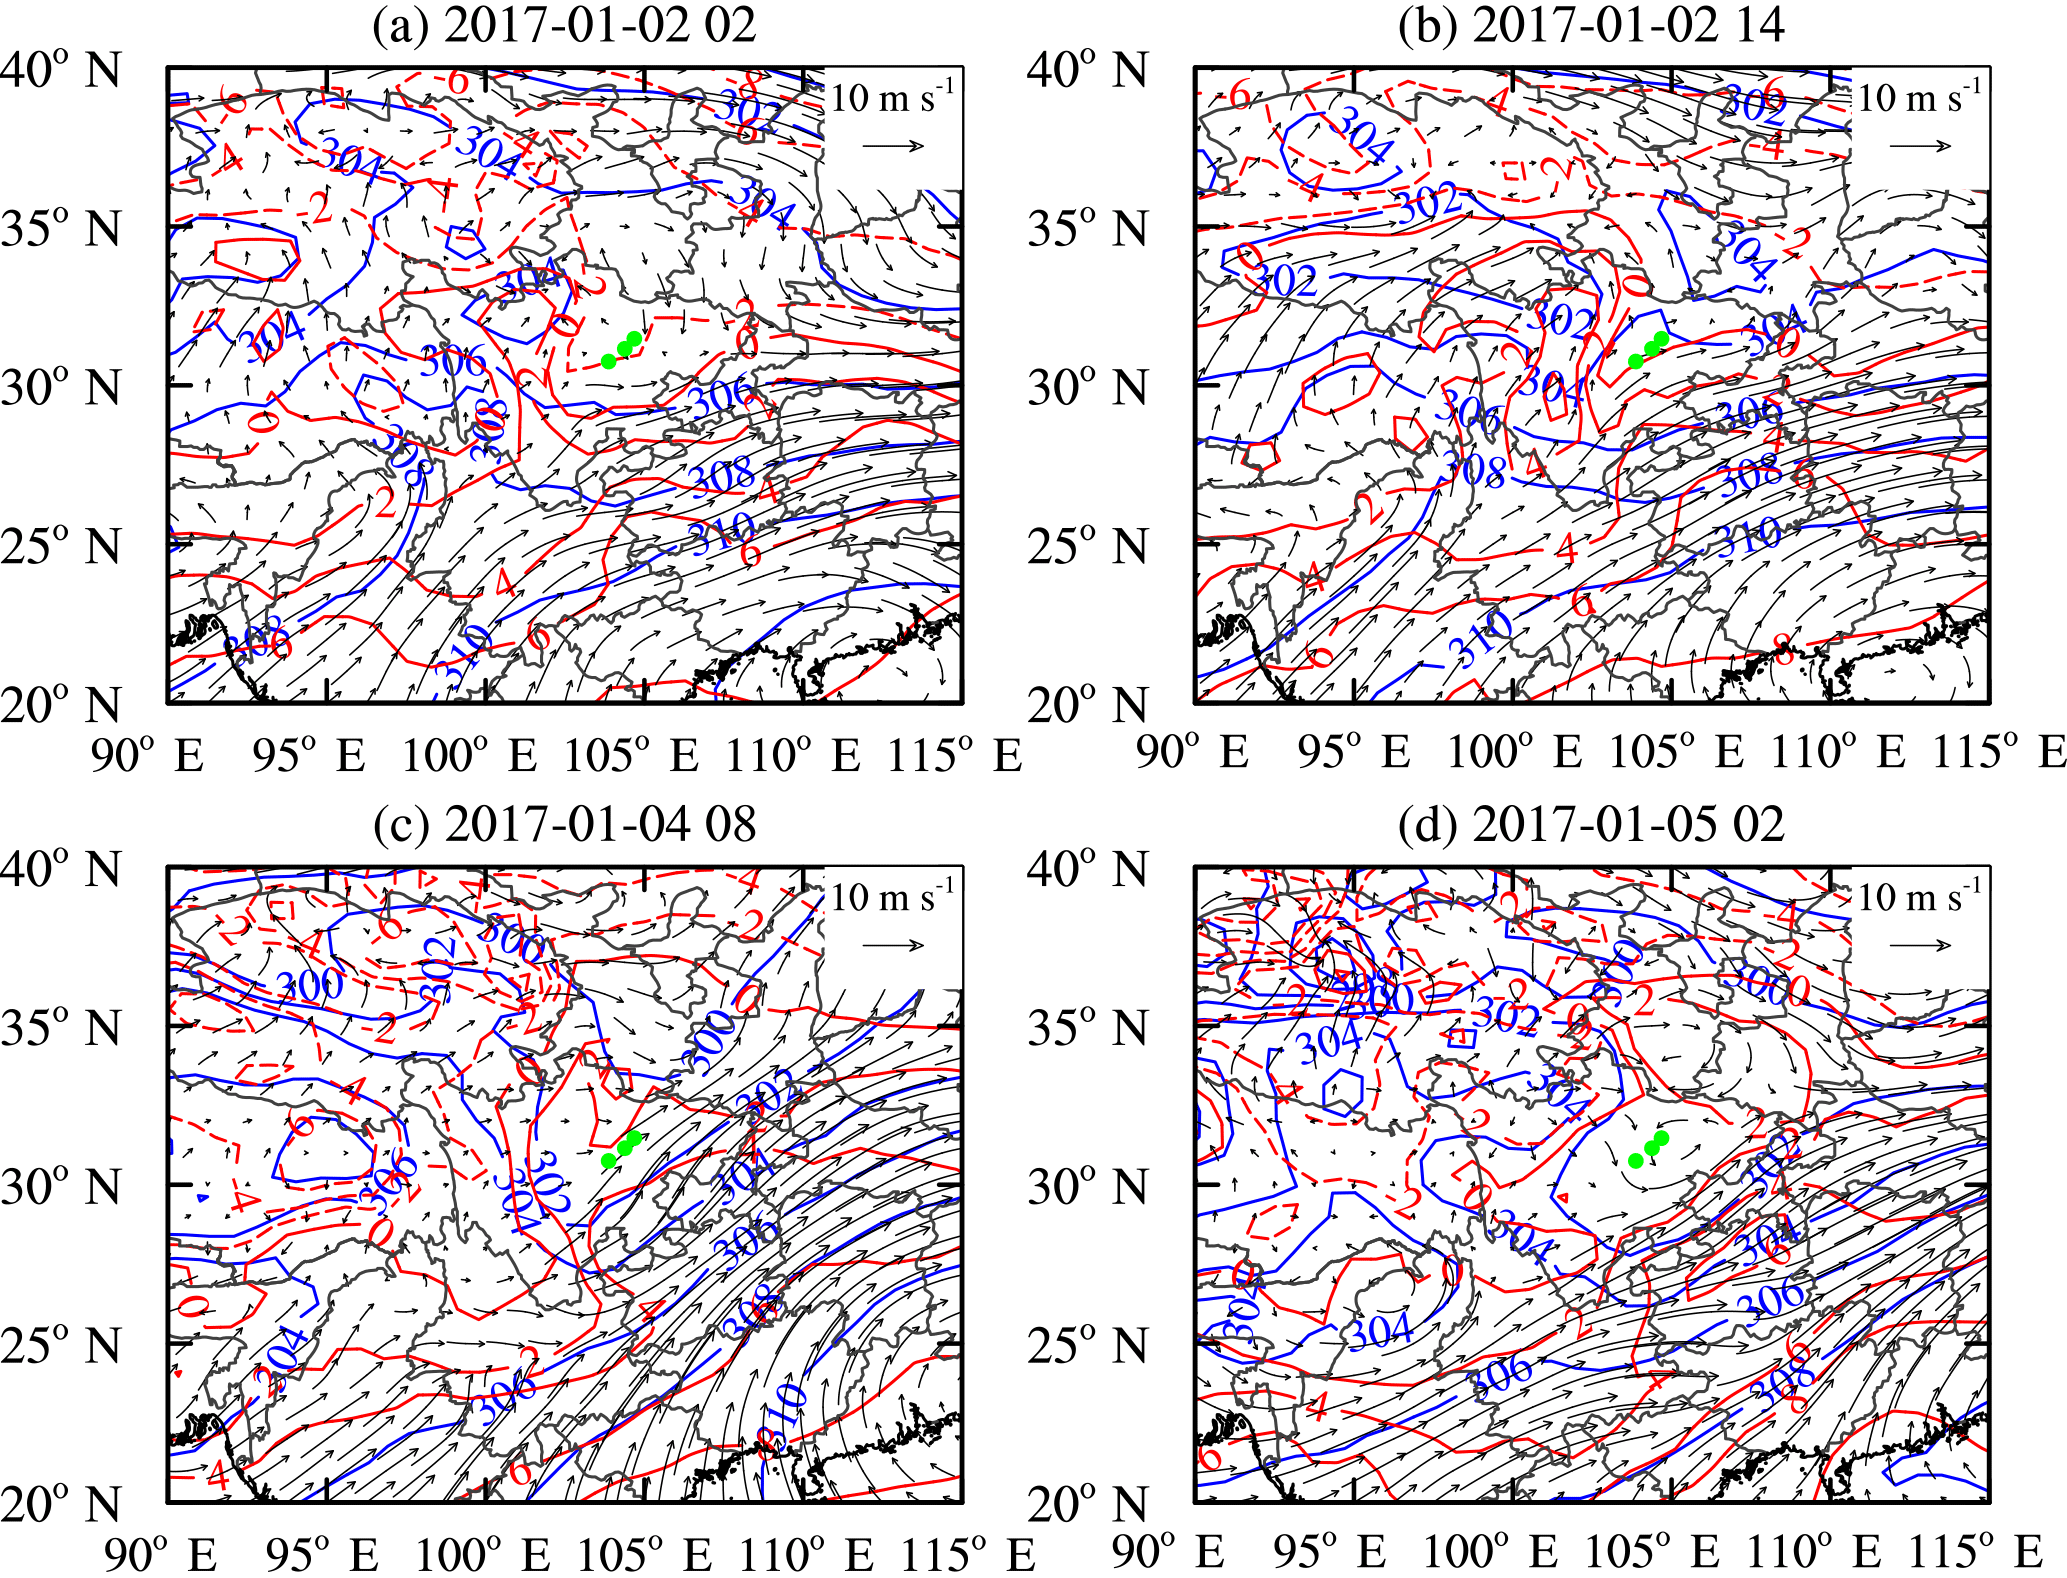
Figure 4Weather maps at 700 hPa for event 8 at (a) 02:00 BST on 2 January 2017, (b) 14:00 BST on 2 January 2017, (c) 08:00 BST on 4 January 2017, and (d) 02:00 BST on 5 January 2017. The blue lines are isopleths of geopotential height, the red lines are isotherms, and the black arrows are wind vectors. The green dots show the location of the urban agglomeration.
(2) Sounding data
Radiosonde measurements from launches at Wenjiang station (see Fig. 1) in Chengdu (30.70∘ N, 103.83∘ E; elevation 541.0 m) at 08:00 and 20:00 BST were obtained from the University of Wyoming website (http://weather.uwyo.edu/upperair/sounding.html, last access: 20 August 2018) and included the temperature, potential temperature, and horizontal wind. These data were used to investigate the dynamic and thermodynamic structure of the lower troposphere.
2.3 Quantitative measures of meteorological conditions
2.3.1 Lower tropospheric stability

Figure 5West–east vertical cross-sections of 24 h temperature change (shading, units: ∘C) and wind vectors (synthesized by u and w) through the most polluted area (30.75∘ N) during event 8 at (a) 14:00 BST on 3 January 2017, (b) 08:00 BST on 4 January 2017, (c) 14:00 BST on 4 January 2017 and (d) 14:00 BST on 5 January 2017 during event 8. Note that the vertical velocity is multiplied by 100 when plotting the wind vectors. The most polluted area is marked by red solid dots. The gray shading represents the terrain.
The lower tropospheric stability (LTS) is defined as the difference in the potential temperature between 700 hPa and the surface (Slingo, 1987), and can be used to describe the thermodynamic state of the lower troposphere (Guo et al., 2016a,b). The LTS can be used to quantitatively evaluate the vertical mixing of air pollutants in the lower troposphere:
A large LTS represents a high degree of stability in the lower troposphere and indicates the potential for the weak vertical mixing of air pollutants.
2.3.2 Mean wind speed (MWS) in the lower troposphere
Sichuan Basin belongs to a low wind speed zone in China due to its deep mountain-basin topography, and the wind speed in the mixing layer is often low, with low variability (Chen and Xie, 2012; Huang et al., 2017; Wang et al., 2018). For analyzing air quality in Sichuan Basin, the meteorological conditions contributing to the atmospheric ventilation should be taken into consideration. To quantitatively evaluate the horizontal dispersion of air pollutants in Sichuan Basin, the MWS in the lower troposphere was constructed based on the concept of the ventilation coefficient (VC is a product of the mixing layer height multiplied by average wind speed through the mixing height). In the eastern plains of China, the ventilation coefficient has been widely used to measure the capability of air pollutants' dispersion (Deng et al., 2014; Lu et al., 2012; Tang et al., 2015). The MWS in the lower troposphere was defined as
where h is the height above the ground at 700 hPa and V(z) is the wind speed in the lower troposphere. This can be simplified as follows:
where n is the number of vertical layers from the ground surface to the 700 hPa isobaric layer (including the 700 hPa isobaric layer, and n is greater than 6 in general), Vi(zi) is the wind speed in a vertical layer (when i=0 represents the wind speed at the ground surface and i=n represents the wind speed at 700 hPa), and Δzi is the difference in height between the two adjacent vertical layers. A large value of MWS suggests strong horizontal dispersion of air pollutants.
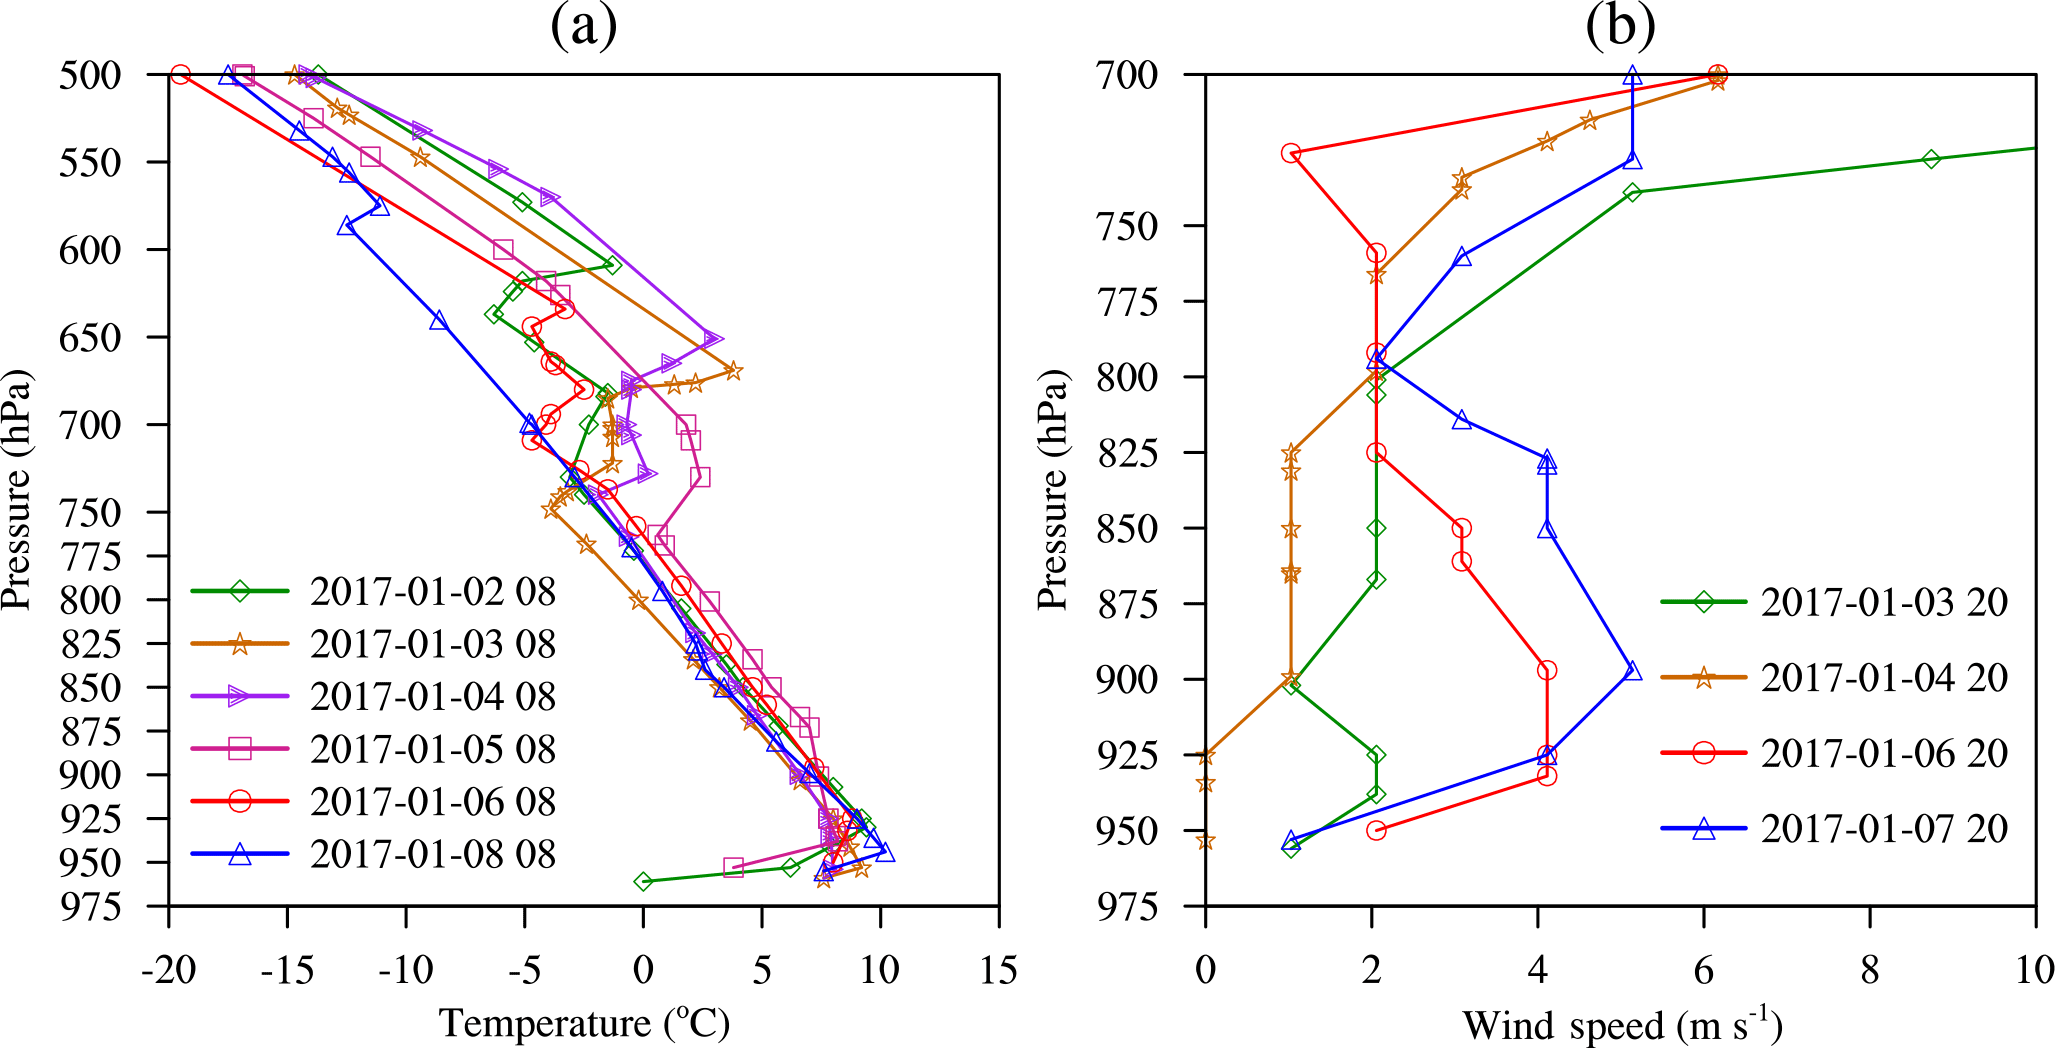
Figure 6Vertical profiles of (a) temperature and (b) horizontal wind speed at Wenjiang station (30.75∘ N, 103.875∘ E; see Fig. 1) measured by a radiosonde during event 8.
3.1 Overview of the heavy air pollution events
A total of 10 heavy winter air pollution events occurred from 1 January 2006 to 31 December 2012 and from 1 January 2014 to 28 February 2017 in the urban agglomeration of Chengdu, Deyang, and Mianyang. Nine events were accompanied by a low-pressure system at 700 hPa, and the low-pressure systems in eight events were dry and did not induce precipitation. This paper explores the impacts of dry low-pressure systems on the eight winter heavy air pollution events (see Table 1 for a summary of these eight events).
Table 1Overview of the eight heavy air pollution events affected by dry low-pressure systems.
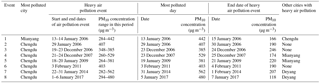
Table 1 shows that particulate matter was the primary pollutant during these eight heavy air pollution events. Six of the eight events were classified as persistent air pollution events. A persistent pollution event was defined by 2 or more consecutive days with daily PM10 mean concentration , which is reported to be harmful to the health of local residents (Chow et al., 2006; Guo et al., 2016; Langrish et al., 2012; Lim et al., 2012), and the longest duration was 10 days. Most of the heavy air pollution events had the characteristics of regional pollution, with five pollution events occurring in multiple cities. Two heavy air pollution events (events 6 and 7) occurred during the Spring Festival, with maximum daily mean PM10 concentrations up to 403 and 562 µg m3 on Chinese New Year's Day. This suggests that the centralized letting off of fireworks during the traditional Chinese Spring Festival, accompanied by poor conditions for the dispersion of air pollution, may lead to a sharp increase in the concentration of particulate pollutants near ground level within a short period of time (Huang et al., 2012; Liao et al., 2017; Shi et al., 2011; Wang et al., 2007).
3.2 Weather systems and meteorological conditions during heavy air pollution events
An analysis of the synoptic conditions showed that the urban agglomeration was affected by low-pressure systems (low vortex or low trough) at 700 hPa during periods of deteriorating air quality in the eight heavy air pollution events (Fig. 2). These studied areas were all located in front of low-pressure systems (east of low-pressure systems) and were controlled by a southerly warm air flow (Fig. 2). To explore the differences between these low-pressure systems and the background of winter atmospheric circulation, composite anomalies of wind vectors and geopotential heights at 700 hPa were calculated (Fig. S1 in the Supplement). The calculation method is as follows: the averaged wind vectors and geopotential heights at 700 hPa during periods of deteriorating air quality in the above eight events were subtracted from their winter mean values from 1 January 2006 to 31 December 2012 and from 1 January 2014 to 28 February 2017. As illustrated in Fig. S1, the anomalies of geopotential heights were negative in the northwest of the urban agglomeration during periods of deteriorating air quality in these heavy air pollution events. As a result, this urban agglomeration was located in front of an anomalous cyclone and was controlled by a strong southerly anomaly wind (Fig. S1).

Figure 7Vertical profiles of (a) temperature and (c) horizontal wind speed in the urban agglomeration during periods controlled by the low-pressure system. Vertical profiles of (b) temperature and (d) horizontal wind speed after the low-pressure system had transited across the urban agglomeration for seven heavy air pollution events (events 1–7).
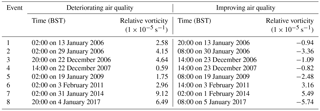
Weather systems can be characterized by their relative vorticity. A positive relative vorticity usually corresponds to a low-pressure system, whereas a negative relative vorticity usually represents a high-pressure system. Thus the relative vorticity at 700 hPa was analyzed during periods of both deteriorating and improving air quality (Table 2). As shown in Table 2, the relative vorticities at 700 hPa during periods of deteriorating air quality were all positive. This indicated that the study areas were located in front of low-pressure systems at 700 hPa. As a result, a southerly warm air flow dominated at 700 hPa and led to an increase in temperature above the atmospheric boundary layer, which increased atmospheric stability and favored the formation of an air pollution event. During periods of improving air quality, the relative vorticities at 700 hPa of six heavy air pollution events (except for events 6 and 7) were negative, showing that the low-pressure systems had transited across the study areas. These areas were thus controlled by a northerly, dry, cold air flow at 700 hPa. As a consequence, the temperature above the atmospheric boundary layer decreased and the stability of the atmosphere weakened, which favored the vertical mixing of air pollutants.
To explore the impacts of low-pressure systems on the structure of the atmospheric boundary layer, the boundary layer height during periods of deteriorating and improving air quality were analyzed for each heavy air pollution event (Table 3). In most of the heavy air pollution events, the height of the boundary layer increased after the low-pressure system had passed across the study area. However, the increase in the height of the boundary layer was not as significant as that seen in eastern China (He et al., 2015; Ji et al., 2012; Leng et al., 2016; Qu et al., 2017; Quan et al., 2013) and the boundary layer heights in air pollution events 3 and 4 decreased after transit of the low-pressure system. These results show that the effects of the transit of low-pressure systems at 700 hPa on the height of the boundary layer were weak, and the causes for the formation of these features will be discussed later. It is therefore difficult to explain the variations in the concentrations of air pollutants in the study areas by only considering the meteorological conditions within the boundary layer.
Table 2Relative vorticity at 700 hPa during the periods of deteriorating and improving air quality in each of the eight heavy air pollution events.
Previous studies have shown that the meteorological conditions above the boundary layer should also be considered (Guo et al., 2016a,b; Slingo, 1987). Therefore an index of the MWS in the lower troposphere was proposed and this index, together with the LTS of the eight heavy air pollution events, was investigated further (Table 3). The differences in the potential temperature between 700 hPa and the surface during periods of deteriorating air quality in the eight events were all ≥18.54 K and the maximum value was 29.45 K, indicating that the lower troposphere was very stable. The MWS was ≤4.22 m s−1 for all eight events, with a minimum of 1.91 m s−1. These results show that the low-pressure systems resulted in the stagnation of air in the lower troposphere. After the low-pressure systems had transited the study area, the lower tropospheric stability significantly decreased, with a maximum decrease in the LTS of up to −11.23 K, and the MWS increased. This showed that the arrival of a dry, cold air flow induced by the transit of the low-pressure system significantly weakened the stability of the lower troposphere and increased the wind speed, improving air quality.
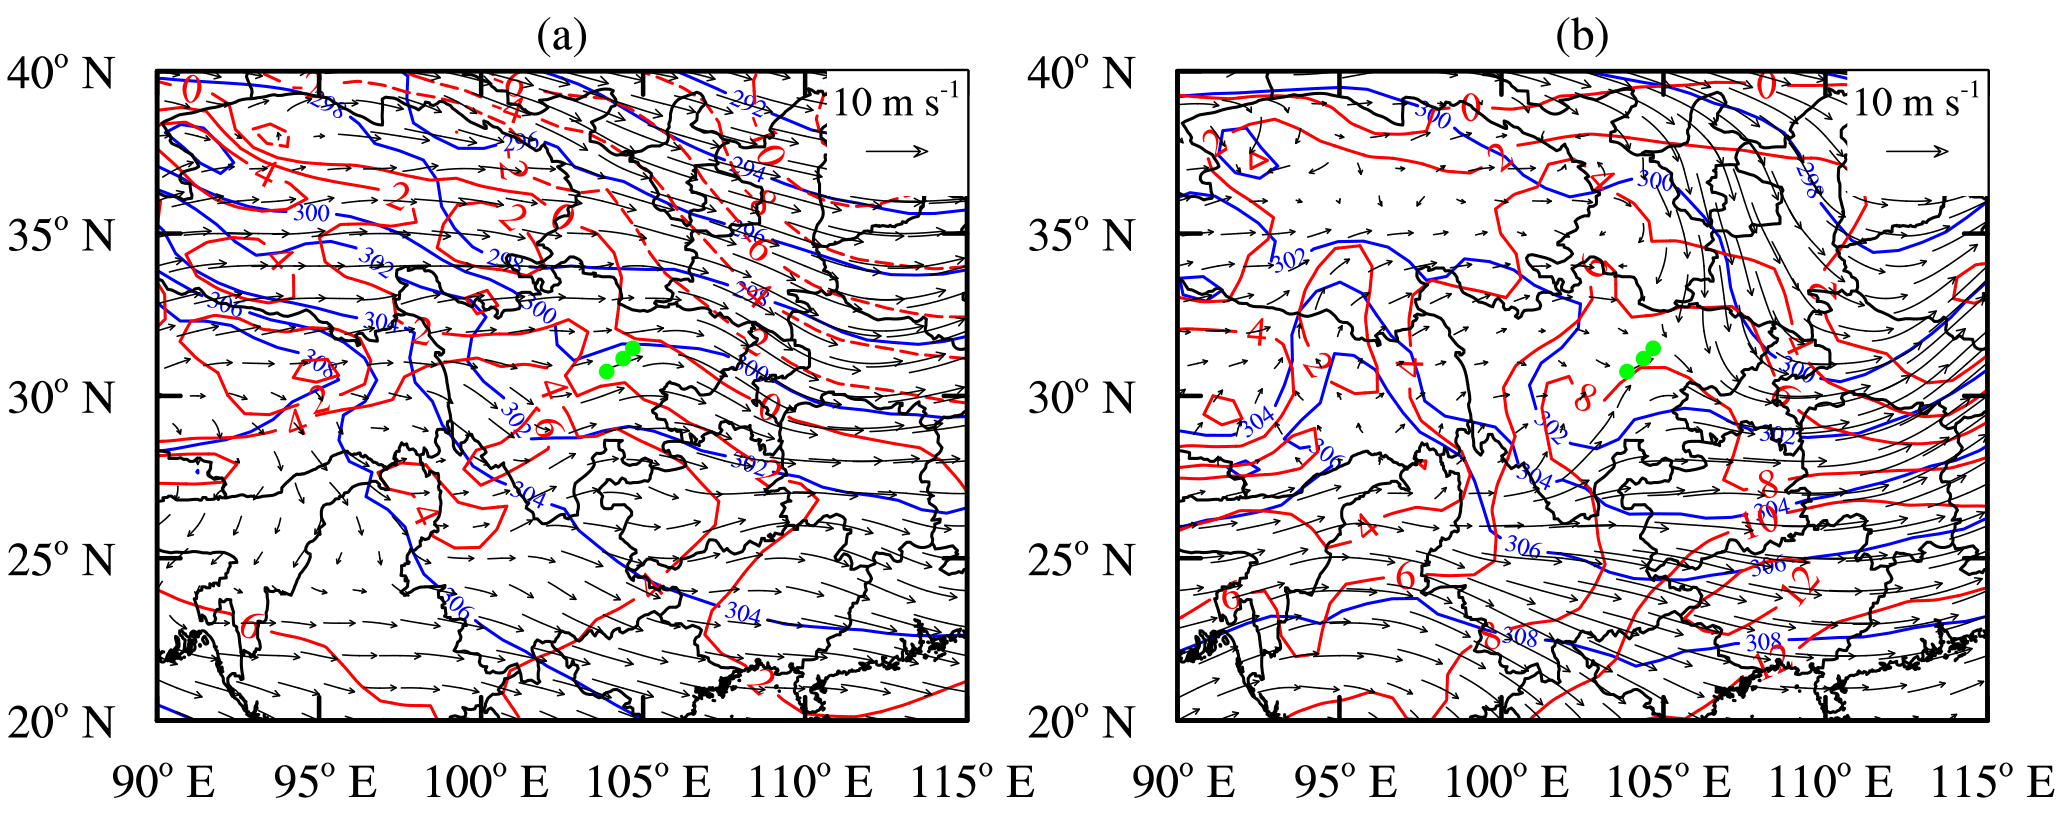
Figure 8Weather maps at 700 hPa during periods of improving air quality (a) for event 6 and (b) for event 7. The blue lines are isopleths of geopotential height, the red lines are isotherms, and the black arrows are wind vectors. The green dots show the location of the urban agglomeration.
In events 6 and 7, however, although the study areas were still located in front of the low-pressure system and the capacity for dispersion had not yet improved, the concentrations of particulate matter began to sharply decrease before the transit of the low-pressure system. Both of these events occurred during the Chinese Spring Festival. After Chinese New Year's Day, the letting off of fireworks stopped and the emission of air pollutants was significantly reduced, resulting in a sharp decrease in the concentration of particulate matter (Liao et al., 2017; Shi et al., 2011; Wang et al., 2007). The decrease in the magnitude of the daily mean concentration of PM10 in event 7 was up to 350 µg m−3. These eight heavy air pollution events in the northwest Sichuan Basin can therefore be categorized into two types based on their date of occurrence. The two heavy air pollution events (6 and 7) occurring during the Chinese Spring Festival were categorized as Spring Festival excessive emission heavy air pollution events. The other six events (events 1–5 and 8) were categorized as normal heavy air pollution events.
To further explore the mechanism involved in the formation of heavy air pollution events, with a particular emphasis on the effect of low-pressure systems on air quality, a typical event was selected from the eight events described in the preceding section. The variations in air quality and the dynamic and thermodynamic conditions in the lower troposphere of the selected event were analyzed. Additionally, the impacts of Spring Festival excessive emission on heavy air pollution events were also investigated.
4.1 The influencing mechanism of low-pressure systems on heavy air pollution events
Heavy air pollution event 8 occurred from 1 January 2017 to 6 January 2017 (Table 3) and the most polluted area was Chengdu. The maximum daily mean concentrations of PM2.5 and PM10 occurred on 5 January 2017. The maximum PM10 daily mean concentration in Chengdu was up to 480 µg m−3. The concentrations of particulate matter increased sharply (Fig. 3) from 00:00 BST on 3 January 2017 to 00:00 BST on 5 January 2017 and the concentrations of nitrogen dioxide and carbon monoxide also showed an increasing trend. Since 12:00 BST on 5 January 2017, the concentrations of particulate matter have decreased significantly (Fig. 3).
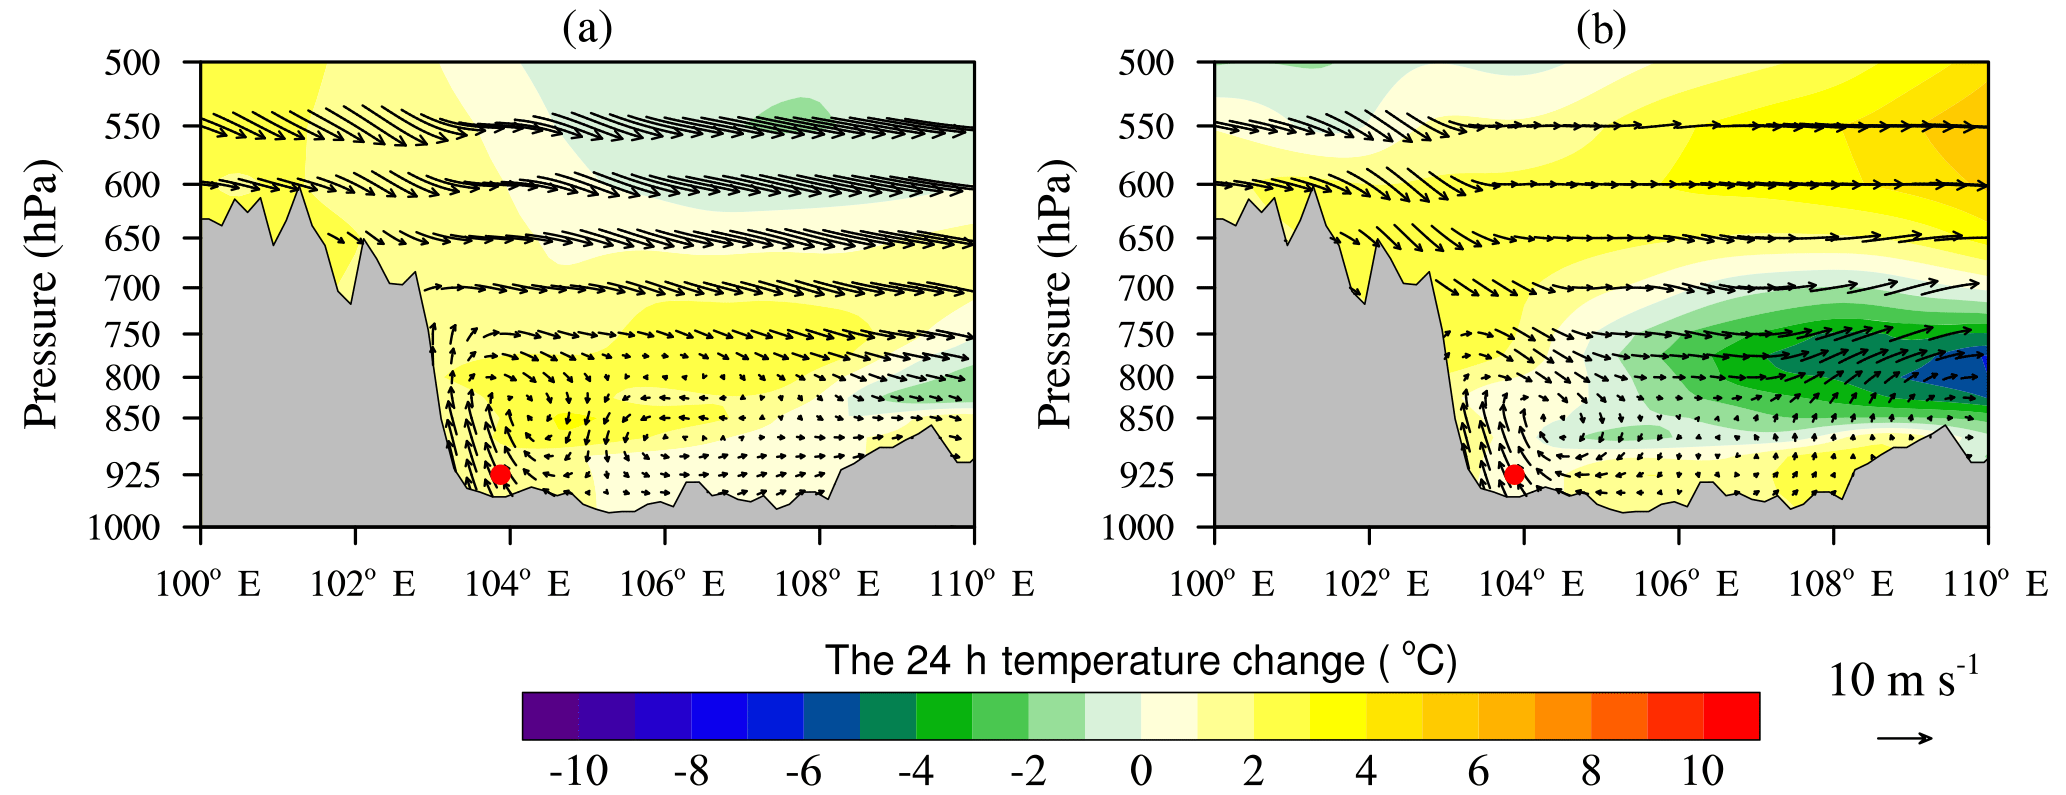
Figure 9West–east vertical cross-sections of 24 h temperature change (shading, units: ∘C) and wind vectors (synthesized by u and w) through the most polluted area (30.75∘ N) during the periods of improving air quality (a) for event 6 and (b) for event 7. Note that the vertical velocity is multiplied by 100 when plotting the wind vectors. The most polluted area is marked by red solid dots. The gray shading represents the terrain.
Figure 4 shows the weather maps at 700 hPa during event 8. Figure 4a shows that there was no low-pressure system at 700 hPa over the urban agglomeration at 02:00 BST on 2 January and there was a dry, cold air flow from the northwest. As shown in Fig. 4b, a low trough was subsequently generated at 700 hPa on the west side of the urban agglomeration at 14:00 BST on 2 January 2017, which showed the beginning of a low-pressure system causing air pollution. This trough later developed and was enhanced, and the lifespan of this low-pressure system was about 3 days. The urban agglomeration was still located at the front of the trough and was controlled by a warm, moist air flow from the southwest until 02:00 BST on 5 January 2017 (Fig. 4b and c). The concentrations of particulate matter in the urban agglomeration increased sharply and the air quality deteriorated. The trough developed further and a low vortex was formed, which transited across over the study area at 02:00 BST on 5 January 2017 (Fig. 4d). The urban agglomeration was then located behind the low vortex and was controlled by a northerly, dry, cold air flow (Fig. 4d), which illustrated the meteorological conditions towards the end of air pollution event. As a result, the air pollutants were rapidly dispersed.
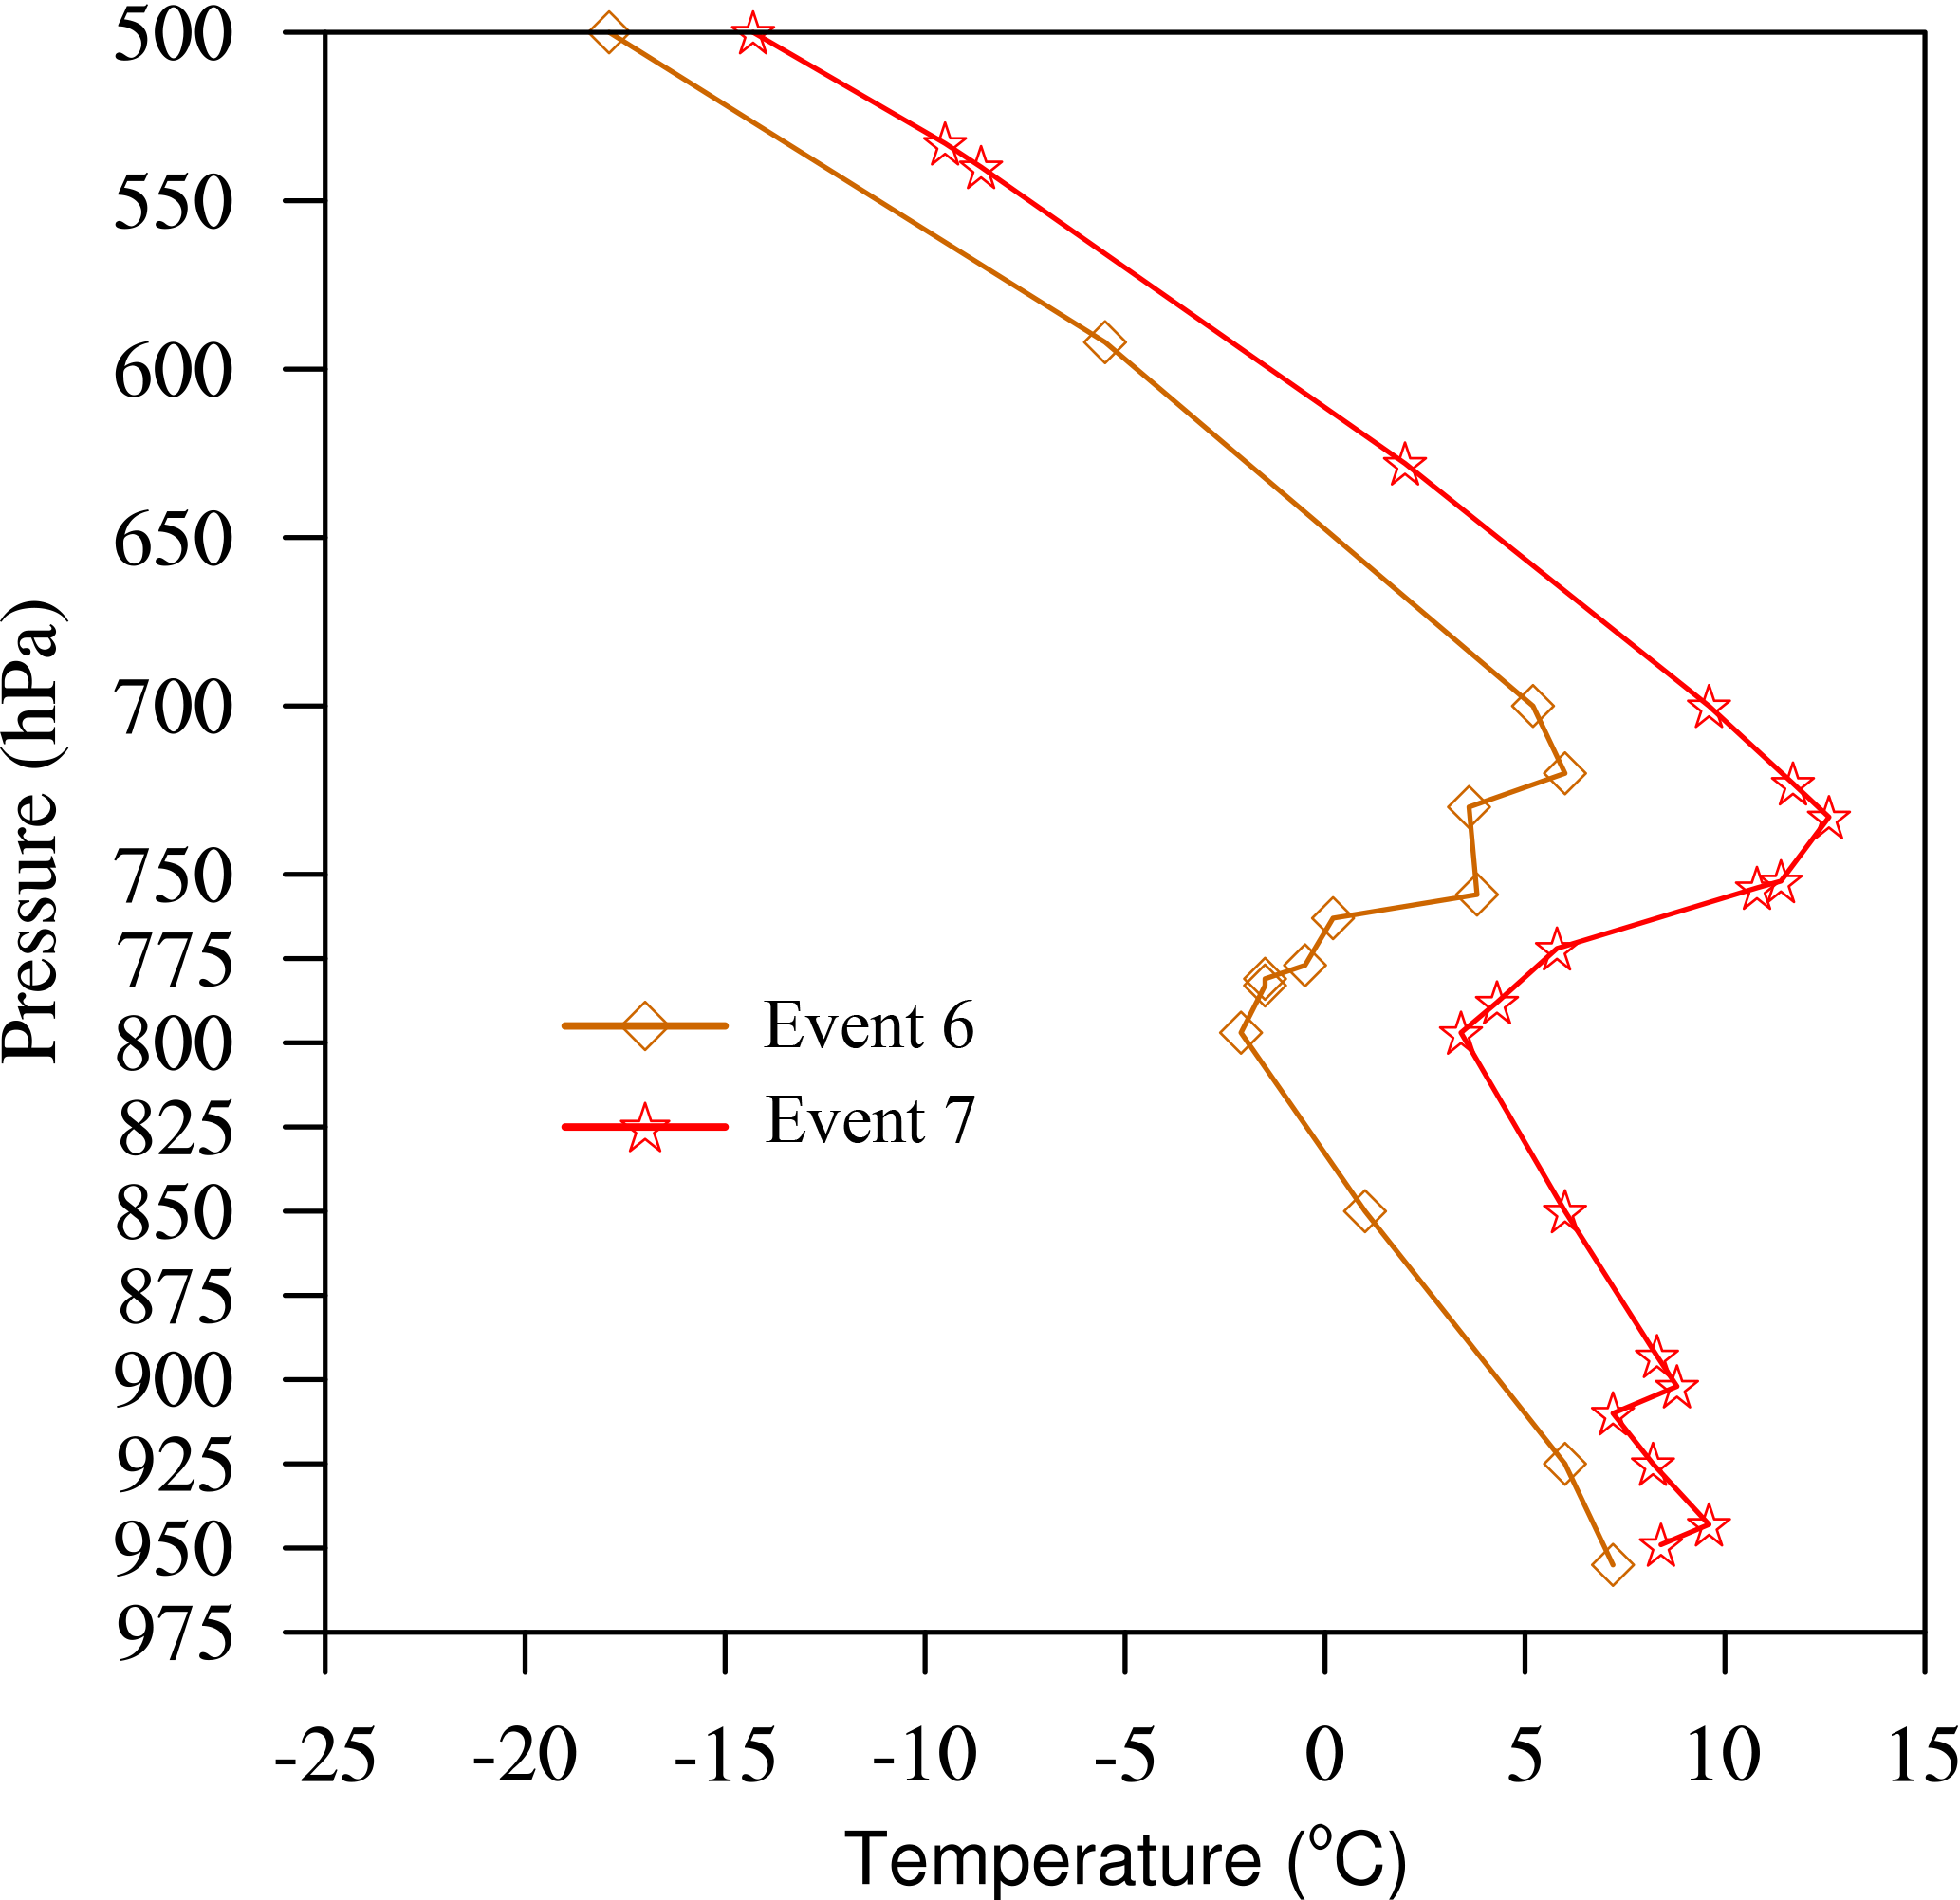
Figure 10Vertical profiles of temperature at Wenjiang station (30.75∘ N, 103.875∘ E) measured by a radiosonde during periods of improving air quality for events 6 and 7.
The west–east vertical cross-sections of the 24 h change in temperature and wind vectors (u and w) in the most polluted area (30.75∘ N) (Fig. 5) and the vertical profiles of temperature and horizontal wind speed (Fig. 6) were analyzed to investigate the effects of the low-pressure system on the dynamic and thermodynamic dispersion of air pollutants in the lower troposphere.
Table 3Height of the atmospheric boundary layer (BLH), lower tropospheric stability (LTS), and mean wind speed (MWS) in the lower troposphere during periods of deteriorating air quality in each of the eight heavy air pollution events, and the differences of them between periods of improving and deteriorating air quality in each event.
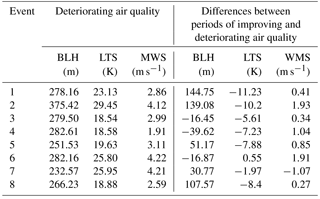
Figure 4b and c show that the urban agglomeration was located in front of the low-pressure system and was controlled by a southerly warm air flow. There was a descending motion between the top of the boundary layer and 500 hPa (Fig. 5a and b). Under the effects of warm advection and descending motion, a warming center appeared between 800 and 650 hPa (Fig. 5a–c) and the maximum increase in the 24 h temperature was up to 10 ∘C (Fig. 6a). Weak cooling occurred below 800 hPa, a strong temperature inversion appeared between 775 and 650 hPa (Fig. 6a), and the stability of the lower troposphere increased. The urban agglomeration was dominated by the low-pressure system for a long time and a long-lasting strong temperature inversion was therefore induced and maintained above the boundary layer. This was different from the temperature inversion that is often seen within the boundary layer in eastern China (Ji et al., 2012; Li and Chan, 2016; Li et al., 2012; Wang et al., 2014; Zhang and Niu, 2016). The temperature inversion acted as a lid over the boundary layer, suppressing the dispersion of air pollutants. This lid effect restrained vertical mixing in the atmosphere and the local secondary circulation was therefore confined to the boundary layer, with its center located at about 850 hPa (Fig. 5a–c). The horizontal wind speed below 800 hPa was ≤2 m s−1 (Fig. 6b). These results indicate that vertical mixing and horizontal dispersion were weak, causing accumulation of air pollutants at the ground level. The concentrations of particulate matter then sharply increased to their peak value (Fig. 3), generating a heavy air pollution event.
A low vortex and trough at 700 hPa transited across the urban agglomeration and a northwesterly dry, cold air flow prevailed (Fig. 4d). Under the influence of the cold air flow, a cooling center appeared between 800 and 650 hPa (Fig. 5d), whereas the air temperature increased below 800 hPa (Fig. 5d). As a result, the stability in the lower troposphere was weakened and the strong inversion layer gradually disappeared (Fig. 6a). The lid effect above the boundary layer also disappeared, resulting in an increase in the local secondary circulation, the center of which was uplifted to 700 hPa (Fig. 5d). The horizontal wind speed below 800 hPa also increased (Fig. 6b). The air pollutants were able to disperse over a larger space and the vertical mixing and horizontal dispersion were significantly improved. The air quality improved and the heavy air pollution event ended.
To verify whether the mechanism involved in the formation of event 8 is used for the other heavy air pollution events, the vertical profiles of temperature and horizontal wind speed in events 1–7 (Fig. 7) were explored during the periods of both the low-pressure system controlling and transiting over this urban agglomeration. Similar to event 8, a strong temperature inversion appeared over the study area between 800 and 650 hPa (Fig. 7a) when the urban agglomeration was located in front of the low-pressure system and was controlled by a southerly warm air flow at 700 hPa. Meanwhile, the horizontal wind speed was low below 800 hPa; the wind speed at all levels below 850 hPa was ≤2 m s−1 (Fig. 7c). After the low-pressure system had transited across the urban agglomeration, the strong inversion layer above the boundary layer gradually disappeared (Fig. 7b), and the horizontal wind speed in the lower troposphere increased (Fig. 7d). Therefore, the influencing mechanism of low-pressure system on heavy air pollution events is common in this urban agglomeration.
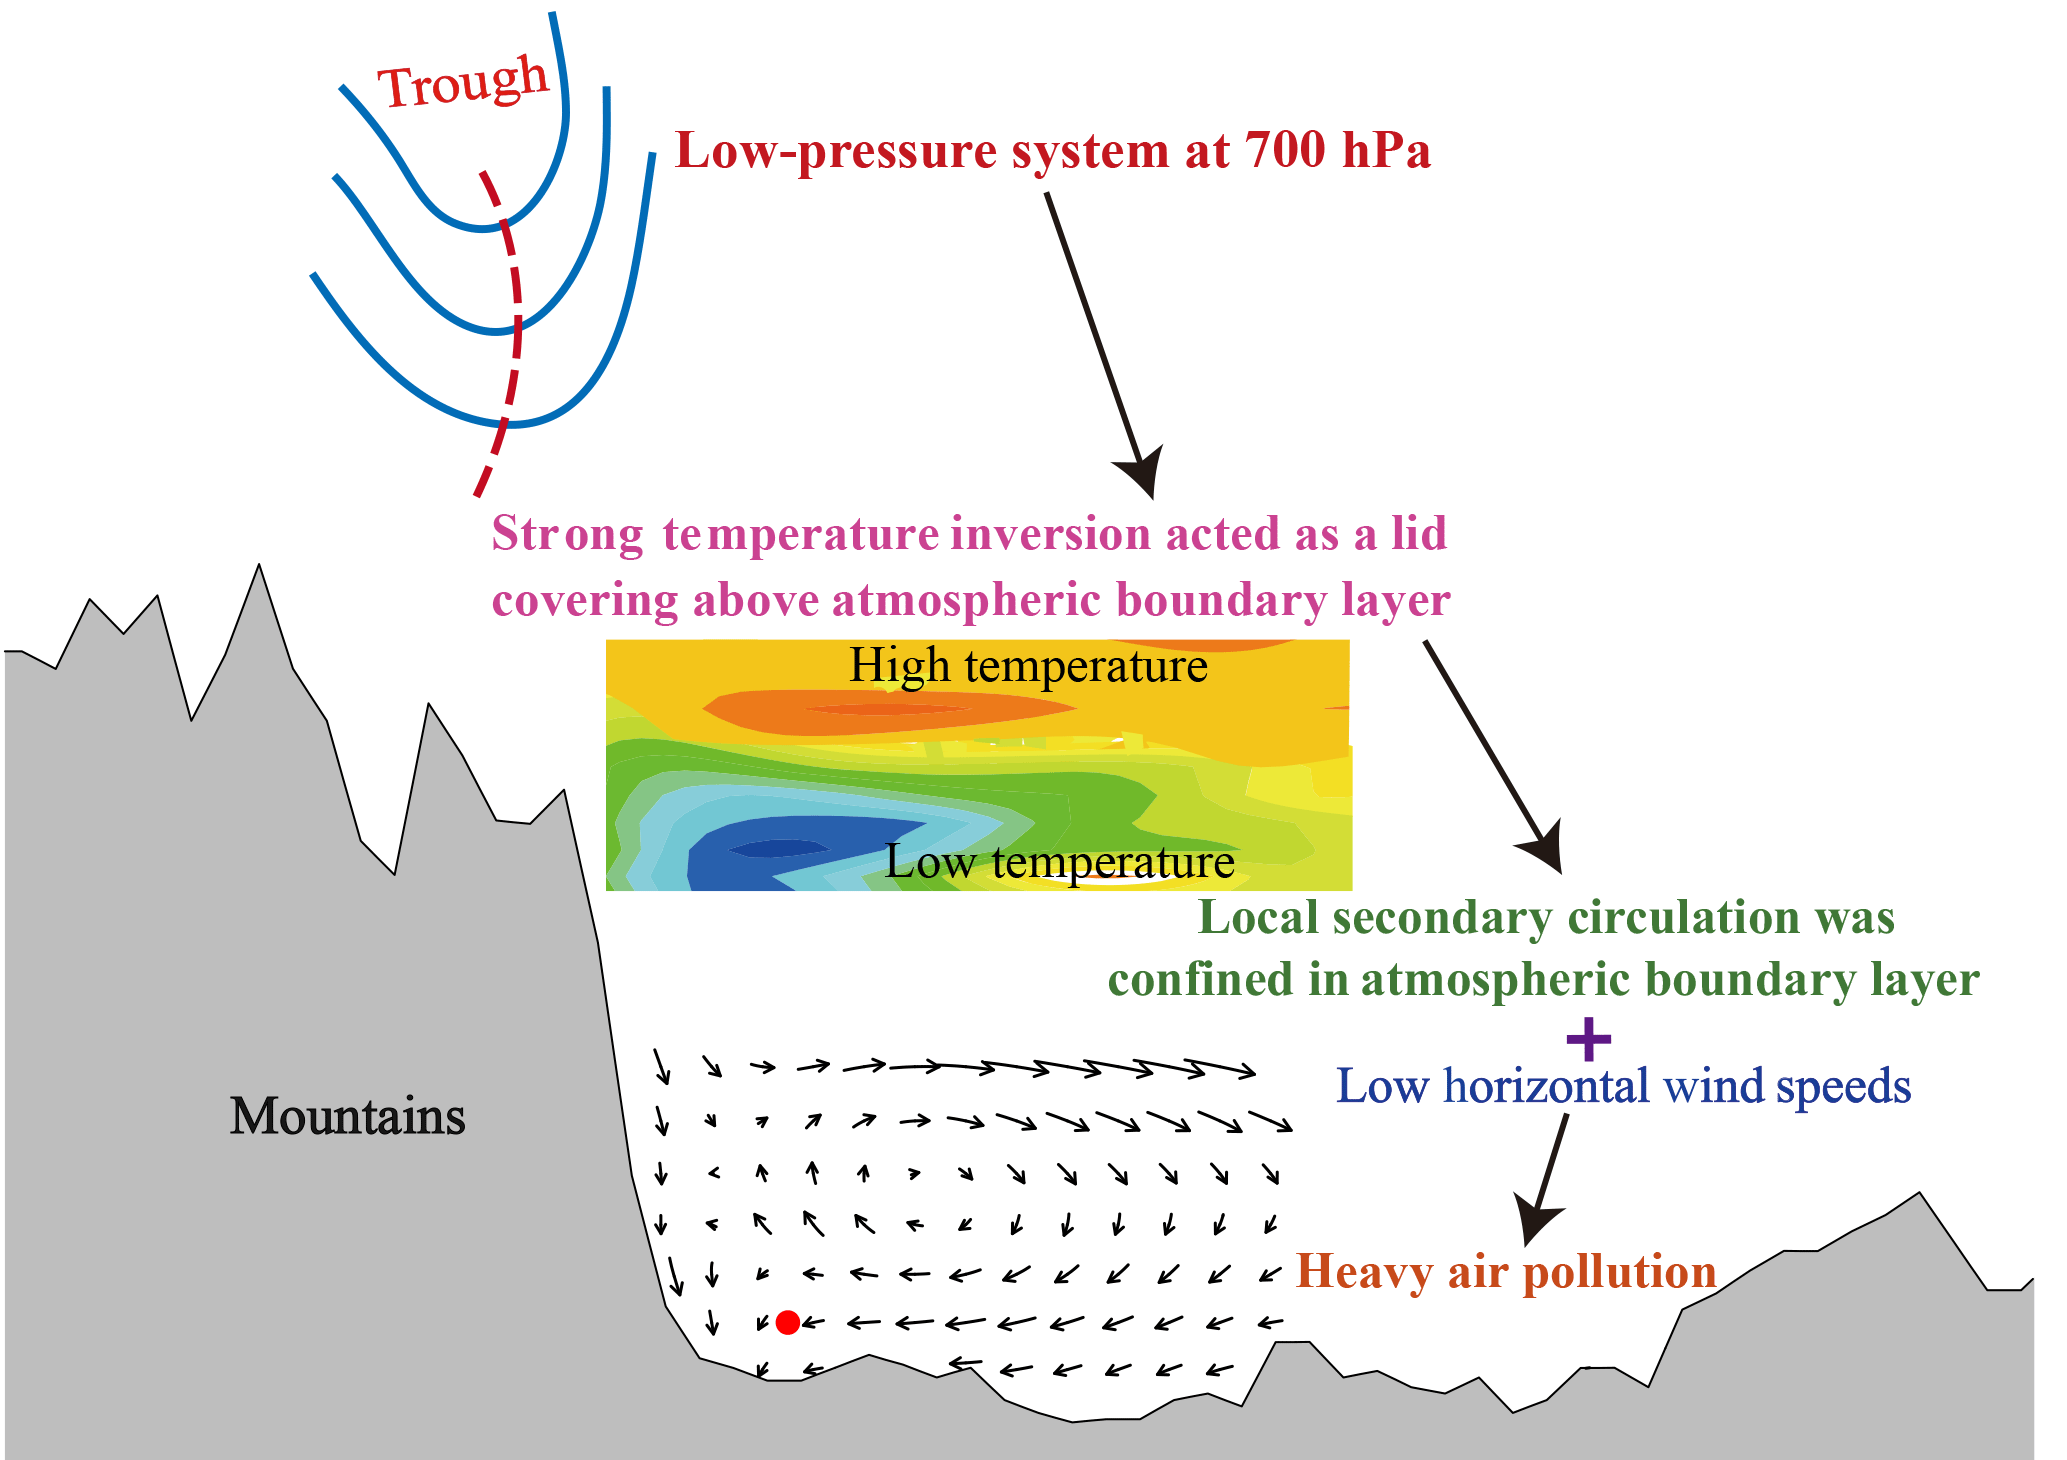
Figure 11Schematic diagram of the mechanism of influence of a dry low-pressure system on winter heavy air pollution events in the urban agglomeration.
Additionally, composite anomalies of west–east vertical cross-section of 24-hour temperature change and wind vectors (synthesized by u and w) (Fig. S2) as well as the anomalies of temperature vertical profiles (Fig. S3) were also analyzed to further investigate the influencing mechanism of low-pressure system on heavy air pollution events. Figure S2 shows that anomalous warming appeared above the atmospheric boundary layer, while anomalous cooling was observed within the boundary layer when the urban agglomeration was located in front of a low-pressure system and was controlled by a southerly warm air flow at 700 hPa. This vertical structure of the anomalies of 24 h temperature change (Fig. S2) led to an increase in the stability of the lower troposphere. As illustrated in Fig. S3, the positive anomalies of temperature between 1500 and 3000 m above ground level increased significantly with height. The maximum value of positive anomalies appeared at about 3000 m and was up to 9 ∘C. These features revealed that a strong temperature inversion existed above the boundary layer and suppressed the vertical exchange of the atmosphere. As a result, the anomalous secondary circulation was also confined to the boundary layer, with its center located at about 925 hPa (Fig. S2). These results of anomalies' analysis were consistent with the above analysis for real-time data, and further proved that the influencing mechanism of a low-pressure system on heavy air pollution events is credible.
From Figs. 6 and 7, we also found some interesting features characterized by the weak effects of the transit of low-pressure systems at 700 hPa on the meteorological factors within the boundary layer. These features may be related to its deep mountain-basin topography (Fig. 1). Under the effects of the deep mountain-basin topography, wind speed in the boundary layer is often low, with low variability (Chen and Xie, 2012; Huang et al., 2017; Wang et al., 2018), and cold air induced by the transit of low-pressure systems is usually difficult to reach in the ground layer faster (Fig. 5). As a result, the increase in wind speed (Figs. 6b, 7c and d) and the degree of change in temperature (Figs. 6a, 7a and b) were very small in the boundary layer after the low-pressure system at 700 hPa passed. Especially for events 3 and 4, the wind speed decreased and a temperature inversion formed in the boundary layer. These characteristics of the wind and temperature profiles in the boundary layer were the key factors leading to the evolution of the boundary layer height as shown in Table 3.
4.2 Impacts of Spring Festival excessive emission on heavy air pollution events
Table 1 shows that events 6 and 7 occurred during the Chinese Spring Festival when the concentration of particulate matter increased sharply. Low concentrations of gaseous pollutants were found throughout these two events, however, which may be related to a reduction in production or the shutdown of factories, as well as lower numbers of vehicles during the week-long Spring Festival (Liao et al., 2017). The centralized letting off of fireworks during the Chinese Spring Festival played an important part in the sharp increase in the concentrations of particulate matter (Huang et al., 2012; Liao et al., 2017; Shi et al., 2011; Wang et al., 2007). We investigated the impacts of Spring Festival excessive emission on events 6 and 7.
It is noteworthy that the emission of air pollutants increased sharply during this period of deteriorating air quality for events 6 and 7 due to the centralized letting off of fireworks during the Chinese Spring Festival. Moreover, under the effects of a low-pressure system, the strong temperature inversion appeared above the atmospheric boundary layer (Fig. 7a) and the horizontal wind speed was low below 800 hPa (Fig. 7c). The combination of excessive emissions with poor dispersion conditions resulted in the maximum daily concentrations of PM10 occurring on Chinese New Year's Day (Table 1). The maximum daily mean PM10 concentration of eight heavy air pollution events occurred in event 7 and was up to 562 µg m−3 (Table 1). This shows that the excessive emissions during the short Chinese Spring Festival were able to increase the peak concentrations of particulate matter. Thus, the centralized letting off of fireworks in the Chinese Spring Festival combined with the impacts of a low-pressure system were the main causes of these two events in this region of China.
Unlike the normal heavy air pollution events, the concentrations of particulate matter began to decrease sharply in events 6 and 7 before the low-pressure system transited over the urban agglomeration (Fig. 8a and b), when the strong temperature inversion was still present above the atmospheric boundary layer (Fig. 10), the local secondary circulation was still confined to the atmospheric boundary layer (Fig. 9a and b), and the capacity for dispersion had not yet improved significantly (Table 3). To explore the causes of the sharp decrease in PM10 concentration for these two events, the effects of fireworks on air quality in Chengdu during Chinese New Year (CNY) from 2013 to 2017 have been investigated. As illustrated in Fig. S4, it is a common phenomenon that PM10 concentrations decreased sharply after the letting off of fireworks stopped during CNY. During the 5 days after the letting off of fireworks stopped, production was reduced, factories were shut down, and the number of vehicles was lower due to the week-long holiday of CNY (Liao et al., 2017). As a result, the maximum decrease in the magnitude of PM10 concentration was more than 220 µg m−3 and occurred at night from 00:00 to 06:00 BST (Fig. S5), which corresponded to the period of the centralized letting off of fireworks on the eve of CNY. Based on the above analysis results, we concluded that the sharp decreases in PM10 concentration for events 6 and 7 were mainly attributable to the significant reduction in emissions induced by stopping the letting off of fireworks and the week-long holiday of CNY.
We investigated the relationships between low-pressure systems and winter heavy air pollution events in the urban agglomeration of Chengdu, Deyang, and Mianyang in the northwest Sichuan Basin and explored the influence of dry and cold low-pressure systems on winter air quality.
A total of 10 heavy winter air pollution events occurred in the urban agglomeration from 1 January 2006 to 31 December 2012 and from 1 January 2014 to 28 February 2017. The meteorological causes of eight of these air pollution events were attributed to dry low-pressure systems (trough and low vortex) at 700 hPa. The schematic diagram in Fig. 11 shows that a strong temperature inversion appeared above the atmospheric boundary layer because the urban agglomeration was located in front of a low-pressure system at 700 hPa and was controlled by a warm southerly air flow. This strong inversion layer acted as a lid over the boundary layer and suppressed the dispersion of air pollutants, confining the local secondary circulation to the atmospheric boundary layer. The horizontal wind speed in the lower troposphere was low. As a result, the space available for the vertical and horizontal dispersion of air pollutants was small. The concentrations of air pollutants increased to their peak values, resulting in heavy air pollution events.
After the low-pressure system had transited across the urban agglomeration, the strong inversion layer above the boundary layer gradually disappeared, resulting in an increase and uplift of the secondary circulation and an increase in the horizontal wind speed in the lower troposphere. The space available for the vertical and horizontal dispersion of air pollutants increased and the concentrations of air pollutants decreased sharply, ending the heavy air pollution event. The centralized letting off of fireworks during the Chinese Spring Festival was one of the main causes of the heavy air pollution events in this region of China.
The urban agglomeration studied here, which is flanked by the eastern slopes of the Tibetan Plateau, is sensitive to low-pressure systems moving east from the plateau (Feng et al., 2016). The complex terrain forms local secondary circulations, which have a significant impact on air quality (Chen et al., 2009; Liu et al., 2009; Miao et al., 2015). We found that the intensity and altitude of the local secondary circulations were markedly affected by the low-pressure system and changes in circulation affected the local air quality. The mechanisms of influence of the low-pressure system on the local secondary circulation require further elaboration using numerical simulation. The centralized letting off of fireworks during the Chinese Spring Festival significantly affected air quality (Huang et al., 2012; Liao et al., 2017; Shi et al., 2011; Wang et al., 2007), especially during some of the heavy air pollution events in the urban agglomeration, although the impact of fireworks on air quality was remarkably different depending on the dispersion conditions (Li et al., 2006). Sensitivity research should therefore be carried out using models coupled with detailed meteorological and chemical processes to quantitatively examine the impacts of the centralized emission of air pollutants from the Chinese Spring Festival on local air quality.
Air quality data used in this study are available from the website of the Ministry of Ecology and Environment of the People's Republic of China (http://datacenter.mep.gov.cn/index, last access: 22 January 2018). ERA-Interim daily data and sounding data are available on the following websites: http://apps.ecmwf.int/datasets/data/interim-full-daily/ (last access: 20 August 2018) and http://weather.uwyo.edu/upperair/sounding.html (last access: 20 August 2018).
The supplement related to this article is available online at: https://doi.org/10.5194/acp-18-13601-2018-supplement.
GN and SW designed the research. GN and SHLY developed and wrote the manuscript. GN, JL, YH and ZS collected and analyzed the data. SHLY and JW provided useful comments. All the authors contributed to the revision of the manuscript.
The authors declare that they have no conflict of interest.
This article is part of the special issue “Regional transport and transformation of air pollution in eastern China”. It is not associated with a conference.
This work was supported by the National Natural Science Foundation of China
(91644226, 41775147, 41575138), the
National Key Research Project of China Strategy on Black Carbon Reduction and
Evaluation of the Health Effects of Climate Change (2016YFA0602004), the
Improvement on Competitiveness in Hiring New Facilities Fund (2013/14) of The
Chinese University of Hong Kong, and the Vice Chancellor's Discretionary Fund
of The Chinese University of Hong Kong (4930744). We would like to thank the
following departments for the data provided: the Ministry of Environmental
Protection of the People's Republic of China, the European Centre for
Medium-Range Weather Forecasts, the University of Wyoming, and the China
Meteorological Administration. Anonymous reviewers who provided comments and
suggestions are gratefully acknowledged.
Edited by: Tong Zhu
Reviewed by: two anonymous referees
Bei, N., Li, G., Huang, R.-J., Cao, J., Meng, N., Feng, T., Liu, S., Zhang, T., Zhang, Q., and Molina, L. T.: Typical synoptic situations and their impacts on the wintertime air pollution in the Guanzhong basin, China, Atmos. Chem. Phys., 16, 7373–7387, https://doi.org/10.5194/acp-16-7373-2016, 2016.
Beljaars, A.: Chapter 3: Turbulent transport and interactions with the surface, Part IV: Physical Processes, IFS Documentation, Operational implementation 12 September 2006 Cy31r1 31, ECMWF, Shinfield Park, Reading, RG2 9AX, England, 2006.
Chen, Y. and Xie, S.: Temporal and spatial visibility trends in the Sichuan Basin, China, 1973 to 2010, Atmos. Res., 112, 25–34, https://doi.org/10.1016/j.atmosres.2012.04.009, 2012.
Chen, Y., Xie, S., Luo, B., and Zhai, C.: Characteristics and origins of carbonaceous aerosol in the Sichuan Basin, China, Atmos. Environ., 94, 215–223, https://doi.org/10.1016/j.atmosenv.2014.05.037, 2014.
Chen, Y., Zhao, C., Zhang, Q., Deng, Z., Huang, M., and Ma, X.: Aircraft study of mountain chimney effect of Beijing, China, J. Geophys. Res., 114, D08306, https://doi.org/10.1029/2008JD010610, 2009.
Chen, Y., Li, Y., and Zhao, T.: Cause analysis on eastward movement of Southwest China vortex and its induced heavy rainfall in South China, Adv. Meteorol., 2015, 1–22, https://doi.org/10.1155/2015/481735, 2015.
Chen, Z. H., Cheng, S. Y., Li, J. B., Guo, X. R., Wang, W. H., and Chen, D. S.: Relationship between atmospheric pollution processes and synoptic pressure patterns in northern China, Atmos. Environ., 42, 6078–6087, https://doi.org/10.1016/j.atmosenv.2008.03.043, 2008.
Chow, J. C., Watson, J. G., Mauderly, J. L., Costa, D. L., Wyzga, R. E., Vedal, S., Hidy, G. M., Altshuler, S. L., Marrack, D., Heuss, J. M., Wolff, G. T., Arden Pope Iii, C., and Dockery, D. W.: Health effects of fine particulate air pollution: Lines that connect, J. Air Waste Manage. Assoc., 56, 1368–1380, https://doi.org/10.1080/10473289.2006.10464545, 2006.
Deng, T., Wu, D., Deng, X., Tan, H., Li, F., and Liao, B.: A vertical sounding of severe haze process in Guangzhou area, Sci. China Earth Sci., 57, 2650–2656, https://doi.org/10.1007/s11430-014-4928-y, 2014.
Feng, X., Liu, C., Fan, G., Liu, X., and Feng, C.: Climatology and structures of southwest vortices in the NCEP Climate Forecast System Reanalysis, J. Climate., 29, 7675–7701, https://doi.org/10.1175/jcli-d-15-0813.1, 2016.
Fu, S., Sun, J., Zhao, S., and Li, W.: The energy budget of a southwest vortex with heavy rainfall over south China, Adv. Atmos. Sci., 28, 709–724, https://doi.org/10.1007/s00376-010-0026-z, 2011.
Gu, Y. and Yim, S. H. L.: The air quality and health impacts of domestic trans-boundary pollution in various regions of China, Environ. Int., 97, 117–124, https://doi.org/10.1016/j.envint.2016.08.004, 2016.
Gao, Y., Liu, X., Zhao, C., and Zhang, M.: Emission controls versus meteorological conditions in determining aerosol concentrations in Beijing during the 2008 Olympic Games, Atmos. Chem. Phys., 11, 12437–12451, https://doi.org/10.5194/acp-11-12437-2011, 2011.
Guo, J., Deng, M., Lee, S. S., Wang, F., Li, Z., Zhai, P., Liu, H., Lv, W., Yao, W., and Li, X.: Delaying precipitation and lightning by air pollution over the Pearl River Delta, Part I: Observational analyses, J. Geophys. Res.-Atmos., 121, 6472–6488, https://doi.org/10.1002/2015JD023257, 2016a.
Guo, J., Miao, Y., Zhang, Y., Liu, H., Li, Z., Zhang, W., He, J., Lou, M., Yan, Y., Bian, L., and Zhai, P.: The climatology of planetary boundary layer height in China derived from radiosonde and reanalysis data, Atmos. Chem. Phys., 16, 13309–13319, https://doi.org/10.5194/acp-16-13309-2016, 2016b.
Guo, Y., Zeng, H., Zheng, R., Li, S., Barnett, A. G., Zhang, S., Zou, X., Huxley, R., Chen, W., and Williams, G.: The association between lung cancer incidence and ambient air pollution in China: A spatiotemporal analysis, Environ. Res., 144, 60–65, https://doi.org/10.1016/j.envres.2015.11.004, 2016.
He, H., Tie, X., Zhang, Q., Liu, X., Gao, Q., Li, X., and Gao, Y.: Analysis of the causes of heavy aerosol pollution in Beijing, China: A case study with the WRF-Chem model, Particuology, 20, 32–40, https://doi.org/10.1016/j.partic.2014.06.004, 2015.
He, J., Gong, S., Yu, Y., Yu, L., Wu, L., Mao, H., Song, C., Zhao, S., Liu, H., Li, X., and Li, R.: Air pollution characteristics and their relation to meteorological conditions during 2014–2015 in major Chinese cities, Environ. Pollut., 223, 484–496, https://doi.org/10.1016/j.envpol.2017.01.050, 2017.
Hu, X.-M., Ma, Z., Lin, W., Zhang, H., Hu, J., Wang, Y., Xu, X., Fuentes, J. D., and Xue, M.: Impact of the Loess Plateau on the atmospheric boundary layer structure and air quality in the North China Plain: A case study, Sci. Total Environ., 499, 228–237, https://doi.org/10.1016/j.scitotenv.2014.08.053, 2014.
Huang, K., Zhuang, G., Lin, Y., Wang, Q., Fu, J. S., Zhang, R., Li, J., Deng, C., and Fu, Q.: Impact of anthropogenic emission on air quality over a megacity – revealed from an intensive atmospheric campaign during the Chinese Spring Festival, Atmos. Chem. Phys., 12, 11631–11645, https://doi.org/10.5194/acp-12-11631-2012, 2012.
Huang, Q., Cai, X., Song, Y., and Zhu, T.: Air stagnation in China (1985–2014): climatological mean features and trends, Atmos. Chem. Phys., 17, 7793–7805, https://doi.org/10.5194/acp-17-7793-2017, 2017.
Ji, D., Wang, Y., Wang, L., Chen, L., Hu, B., Tang, G., Xin, J., Song, T., Wen, T., Sun, Y., Pan, Y., and Liu, Z.: Analysis of heavy pollution episodes in selected cities of northern China, Atmos. Environ., 50, 338–348, https://doi.org/10.1016/j.atmosenv.2011.11.053, 2012.
Ji, D., Li, L., Wang, Y., Zhang, J., Cheng, M., Sun, Y., Liu, Z., Wang, L., Tang, G., Hu, B., Chao, N., Wen, T., and Miao, H.: The heaviest particulate air-pollution episodes occurred in northern China in January, 2013: Insights gained from observation, Atmos. Environ., 92, 546–556, https://doi.org/10.1016/j.atmosenv.2014.04.048, 2014.
Kuo, Y.-H., Cheng, L., and Anthes, R. A.: Mesoscale analyses of the Sichuan flood catastrophe, 11–15 July 1981, Mon. Weather Rev., 114, 1984–2003, https://doi.org/10.1175/1520-0493(1986)114<1984:maotsf>2.0.co;2, 1986.
Kuo, Y.-H., Cheng, L., and Bao, J.-W.: Numerical simulation of the 1981 Sichuan flood. Part I: Evolution of a mesoscale southwest vortex, Mon. Weather Rev., 116, 2481–2504, https://doi.org/10.1175/1520-0493(1988)116<2481:nsotsf>2.0.co;2, 1988.
Langrish, J. P., Li, X., Wang, S., Lee, M. M. Y., Barnes, G. D., Miller, M. R., Cassee, F. R., Boon, N. A., Donaldson, K., Li, J., Li, L., Mills, N. L., Newby, D. E., and Jiang, L.: Reducing personal exposure to particulate air pollution improves cardiovascular health in patients with coronary heart disease, Environ. Health Perspect., 120, 367–372, https://doi.org/10.1289/ehp.1103898, 2012.
Leng, C., Duan, J., Xu, C., Zhang, H., Wang, Y., Wang, Y., Li, X., Kong, L., Tao, J., Zhang, R., Cheng, T., Zha, S., and Yu, X.: Insights into a historic severe haze event in Shanghai: synoptic situation, boundary layer and pollutants, Atmos. Chem. Phys., 16, 9221–9234, https://doi.org/10.5194/acp-16-9221-2016, 2016.
Leśniok, M., Małarzewski, Ł., and Niedźwiedź, T.: Classification of circulation types for Southern Poland with an application to air pollution concentration in Upper Silesia, Phys. Chem. Earth, 35, 516–522, https://doi.org/10.1016/j.pce.2009.11.006, 2010.
Li, L. and Chan, P. W.: LIDAR observation and numerical simulation of vortex/wave shedding at the eastern runway corridor of the Hong Kong international airport, Meteorol. Appl., 23, 379–388, https://doi.org/10.1002/met.1562, 2016.
Li, L., Li, J., Xin, L., Li, H., and Wei, Q.: Analysis of atmospheric air pollution of Beijing City in Spring Festival period, China Environ. Sci, 26, 537–541, http://manu36.magtech.com.cn/Jweb_zghjkx/CN/ (last access: 20 August 2018) 2006 (in Chinese).
Li, Y., Yan, J., and Sui, X.: Tropospheric temperature inversion over central China, Atmos. Res., 116, 105–115, https://doi.org/10.1016/j.atmosres.2012.03.009, 2012.
Li, Y., Chen, Q., Zhao, H., Wang, L., and Tao, R.: Variations in PM10, PM2.5 and PM1.0 in an urban area of the Sichuan Basin and their relation to meteorological factors, Atmosphere, 6, 150–163, 2015.
Liao, T., Wang, S., Ai, J., Gui, K., Duan, B., Zhao, Q., Zhang, X., Jiang, W., and Sun, Y.: Heavy pollution episodes, transport pathways and potential sources of PM2.5 during the winter of 2013 in Chengdu (China), Sci. Total Environ., 584–585, 1056–1065, https://doi.org/10.1016/j.scitotenv.2017.01.160, 2017.
Lim, S. S., Vos, T., Flaxman, A. D., et al.: A comparative risk assessment of burden of disease and injury attributable to 67 risk factors and risk factor clusters in 21 regions, 1990–2010: a systematic analysis for the Global Burden of Disease Study 2010, Lancet., 380, 2224–2260, https://doi.org/10.1016/S0140-6736(12)61766-8, 2012.
Liu, S., Liu, Z., Li, J., Wang, Y., Ma, Y., Sheng, L., Liu, H., Liang, F., Xin, G., and Wang, J.: Numerical simulation for the coupling effect of local atmospheric circulations over the area of Beijing, Tianjin and Hebei Province, Sci. China Ser. D Earth Sci., 52, 382–392, https://doi.org/10.1007/s11430-009-0030-2, 2009.
Lu, C., Deng, Q.-H., Liu, W.-W., Huang, B.-L., and Shi, L.-Z.: Characteristics of ventilation coefficient and its impact on urban air pollution, J. Cent. South Univ., 19, 615–622, https://doi.org/10.1007/s11771-012-1047-9, 2012.
Luo, M., Hou, X., Gu, Y., Lau, N.-C., and Yim, S. H.-L.: Trans-boundary air pollution in a city under various atmospheric conditions, Sci. Total Environ., 618, 132–141, https://doi.org/10.1016/j.scitotenv.2017.11.001, 2018.
Luo, Y., Lu, D., Zhou, X., Li, W., and He, Q.: Characteristics of the spatial distribution and yearly variation of aerosol optical depth over China in last 30 years, J. Geophys. Res., 106, 14501–14513, https://doi.org/10.1029/2001JD900030, 2001.
MEP: China National Ambient Air Quality Standards, MEP, Beijing, China, 2012.
Miao, Y., Liu, S., Zheng, Y., Wang, S., Chen, B., Zheng, H., and Zhao, J.: Numerical study of the effects of local atmospheric circulations on a pollution event over Beijing–Tianjin–Hebei, China, J. Environ. Sci., 30, 9–20, https://doi.org/10.1016/j.jes.2014.08.025, 2015.
Ni, C., Li, G., and Xiong, X.: Analysis of a vortex precipitation event over Southwest China using AIRS and in situ measurements, Adv. Atmos. Sci., 34, 559–570, https://doi.org/10.1007/s00376-016-5262-4, 2017.
Ning, G., Wang, S., Ma, M., Ni, C., Shang, Z., Wang, J., and Li, J.: Characteristics of air pollution in different zones of Sichuan Basin, China, Sci. Total Environ., 612, 975–984, https://doi.org/10.1016/j.scitotenv.2017.08.205, 2018.
Peng, X. and Cheng, L.: A case numerical study on the evolution of the plateau-east-side low vortex and shear lineline, Part I: Analysis and diagnosis, J. Lanzhou Univ. Nat. Sci., 28, 163–168, https://doi.org/10.13885/j.issn.0455-2059.1992.02.029, 1992.
Qu, Y., Han, Y., Wu, Y., Gao, P., and Wang, T.: Study of PBLH and its correlation with particulate matter from one-year observation over Nanjing, Southeast China, Remote Sens., 9, 668, https://doi.org/10.3390/rs9070668, 2017.
Quan, J., Gao, Y., Zhang, Q., Tie, X., Cao, J., Han, S., Meng, J., Chen, P., and Zhao, D.: Evolution of planetary boundary layer under different weather conditions, and its impact on aerosol concentrations, Particuology, 11, 34–40, https://doi.org/10.1016/j.partic.2012.04.005, 2013.
Shi, Y., Zhang, N., Gao, J., Li, X., and Cai, Y.: Effect of fireworks display on perchlorate in air aerosols during the Spring Festival, Atmos. Environ., 45, 1323–1327, https://doi.org/10.1016/j.atmosenv.2010.11.056, 2011.
Slingo, J. M.: The development and verification of a cloud prediction scheme for the ECWMF Model, Q. J. Roy. Meteor. Soc., 113, 899–927, https://doi.org/10.1002/qj.49711347710, 1987.
Tang, G., Zhu, X., Hu, B., Xin, J., Wang, L., Münkel, C., Mao, G., and Wang, Y.: Impact of emission controls on air quality in Beijing during APEC 2014: lidar ceilometer observations, Atmos. Chem. Phys., 15, 12667–12680, https://doi.org/10.5194/acp-15-12667-2015, 2015.
Tao, J., Cheng, T., Zhang, R., Cao, J., Zhu, L., Wang, Q., Luo, L., and Zhang, L.: Chemical composition of PM2.5 at an urban site of Chengdu in southwestern China, Adv. Atmos. Sci., 30, 1070–1084, https://doi.org/10.1007/s00376-012-2168-7, 2013a.
Tao, J., Zhang, L., Engling, G., Zhang, R., Yang, Y., Cao, J., Zhu, C., Wang, Q., and Luo, L.: Chemical composition of PM2.5 in an urban environment in Chengdu, China: Importance of springtime dust storms and biomass burning, Atmos. Res., 122, 270–283, https://doi.org/10.1016/j.atmosres.2012.11.004, 2013b.
Tao, M., Chen, L., Su, L., and Tao, J.: Satellite observation of regional haze pollution over the North China Plain, J. Geophys. Res.-Atmos., 117, D12203, https://doi.org/10.1029/2012JD017915, 2012.
Tao, M., Chen, L., Xiong, X., Zhang, M., Ma, P., Tao, J., and Wang, Z.: Formation process of the widespread extreme haze pollution over northern China in January 2013: Implications for regional air quality and climate, Atmos. Environ., 98, 417–425, https://doi.org/10.1016/j.atmosenv.2014.09.026, 2014.
Tian, P., Cao, X., Zhang, L., Sun, N., Sun, L., Logan, T., Shi, J., Wang, Y., Ji, Y., Lin, Y., Huang, Z., Zhou, T., Shi, Y., and Zhang, R.: Aerosol vertical distribution and optical properties over China from long-term satellite and ground-based remote sensing, Atmos. Chem. Phys., 17, 2509–2523, https://doi.org/10.5194/acp-17-2509-2017, 2017.
Wang, Q.-W. and Tan, Z.-M.: Multi-scale topographic control of southwest vortex formation in Tibetan Plateau region in an idealized simulation, J. Geophys. Res.-Atmos., 119, 11543–11561, https://doi.org/10.1002/2014JD021898, 2014.
Wang, T., Nie, W., Gao, J., Xue, L. K., Gao, X. M., Wang, X. F., Qiu, J., Poon, C. N., Meinardi, S., Blake, D., Wang, S. L., Ding, A. J., Chai, F. H., Zhang, Q. Z., and Wang, W. X.: Air quality during the 2008 Beijing Olympics: secondary pollutants and regional impact, Atmos. Chem. Phys., 10, 7603–7615, https://doi.org/10.5194/acp-10-7603-2010, 2010.
Wang, X., Dickinson, R. E., Su, L., Zhou, C., and Wang, K.: PM2.5 pollution in China and how it has been exacerbated by terrain and meteorological conditions, B. Am. Meteorol. Soc., 99, 105–119, https://doi.org/10.1175/BAMS-D-16-0301.1, 2018.
Wang, Y., Zhuang, G., Xu, C., and An, Z.: The air pollution caused by the burning of fireworks during the lantern festival in Beijing, Atmos. Environ., 41, 417–431, https://doi.org/10.1016/j.atmosenv.2006.07.043, 2007.
Wang, Y., Hao, J., McElroy, M. B., Munger, J. W., Ma, H., Chen, D., and Nielsen, C. P.: Ozone air quality during the 2008 Beijing Olympics: effectiveness of emission restrictions, Atmos. Chem. Phys., 9, 5237–5251, https://doi.org/10.5194/acp-9-5237-2009, 2009.
Wang, Y., Yao, L., Wang, L., Liu, Z., Ji, D., Tang, G., Zhang, J., Sun, Y., Hu, B., and Xin, J.: Mechanism for the formation of the January 2013 heavy haze pollution episode over central and eastern China, Sci. China Earth. Sci., 57, 14–25, https://doi.org/10.1007/s11430-013-4773-4, 2014.
Wei, P., Cheng, S., Li, J., and Su, F.: Impact of boundary-layer anticyclonic weather system on regional air quality, Atmos. Environ., 45, 2453–2463, https://doi.org/10.1016/j.atmosenv.2011.01.045, 2011.
Whiteman, C. D., Hoch, S. W., Horel, J. D., and Charland, A.: Relationship between particulate air pollution and meteorological variables in Utah's Salt Lake Valley, Atmos. Environ., 94, 742–753, https://doi.org/10.1016/j.atmosenv.2014.06.012, 2014.
Wu, P., Ding, Y., and Liu, Y.: Atmospheric circulation and dynamic mechanism for persistent haze events in the Beijing–Tianjin–Hebei region, Adv. Atmos. Sci., 34, 429–440, https://doi.org/10.1007/s00376-016-6158-z, 2017.
Yang, L., Wu, Y., Davis, J. M., and Hao, J.: Estimating the effects of meteorology on PM2.5 reduction during the 2008 Summer Olympic Games in Beijing, China, Front Environ Sci Eng., 5, 331, https://doi.org/10.1007/s11783-011-0307-5, 2011.
Ye, X., Song, Y., Cai, X., and Zhang, H.: Study on the synoptic flow patterns and boundary layer process of the severe haze events over the North China Plain in January 2013, Atmos. Environ., 124, 129–145, https://doi.org/10.1016/j.atmosenv.2015.06.011, 2016.
Yu, S., Gao, W., Xiao, D., and Peng, J.: Observational facts regarding the joint activities of the southwest vortex and plateau vortex after its departure from the Tibetan Plateau, Adv. Atmos. Sci., 33, 34–46, https://doi.org/10.1007/s00376-015-5039-1, 2016.
Zeng, S. and Zhang, Y.: The effect of meteorological elements on continuing heavy air pollution: A case study in the Chengdu area during the 2014 Spring Festival, Atmosphere, 8, 71, https://doi.org/10.3390/atmos8040071, 2017.
Zhang, J., Luo, B., Zhang, J., Ouyang, F., Song, H., Liu, P., Cao, P., Schäfer, K., Wang, S., Huang, X., and Lin, Y.: Analysis of the characteristics of single atmospheric particles in Chengdu using single particle mass spectrometry, Atmos. Environ., 157, 91–100, https://doi.org/10.1016/j.atmosenv.2017.03.012, 2017.
Zhang, J. P., Zhu, T., Zhang, Q. H., Li, C. C., Shu, H. L., Ying, Y., Dai, Z. P., Wang, X., Liu, X. Y., Liang, A. M., Shen, H. X., and Yi, B. Q.: The impact of circulation patterns on regional transport pathways and air quality over Beijing and its surroundings, Atmos. Chem. Phys., 12, 5031–5053, https://doi.org/10.5194/acp-12-5031-2012, 2012.
Zhang, S.-T. and Niu, S.-J.: Haze-to-fog transformation during a long lasting, low visibility episode in Nanjing, J. Trop. Meteorol., 22, 67–77, https://doi.org/10.16555/j.1006-8775.2016.S1.007, 2016.
Zhang, X. Y., Wang, Y. Q., Niu, T., Zhang, X. C., Gong, S. L., Zhang, Y. M., and Sun, J. Y.: Atmospheric aerosol compositions in China: spatial/temporal variability, chemical signature, regional haze distribution and comparisons with global aerosols, Atmos. Chem. Phys., 12, 779–799, https://doi.org/10.5194/acp-12-779-2012, 2012.
Zhang, Z., Zhang, X., Gong, D., Kim, S.-J., Mao, R., and Zhao, X.: Possible influence of atmospheric circulations on winter haze pollution in the Beijing–Tianjin–Hebei region, northern China, Atmos. Chem. Phys., 16, 561–571, https://doi.org/10.5194/acp-16-561-2016, 2016.
- Abstract
- Introduction
- Data and methods
- Heavy air pollution events and weather conditions
- Impacts of low-pressure systems on heavy air pollution events
- Conclusions and discussions
- Data availability
- Author contributions
- Competing interests
- Special issue statement
- Acknowledgements
- References
- Supplement