the Creative Commons Attribution 4.0 License.
the Creative Commons Attribution 4.0 License.
 | 21 Sep 2018
Insights into HOx and ROx chemistry in the boreal forest via measurement of peroxyacetic acid, peroxyacetic nitric anhydride (PAN) and hydrogen peroxide
Nicolas Pouvesle
Gavin J. Phillips
Raoul Axinte
Horst Fischer
Tuukka Petäjä
Anke Nölscher
Jonathan Williams
Korbinian Hens
Hartwig Harder
Monica Martinez-Harder
Anna Novelli
Dagmar Kubistin
Birger Bohn
Jos Lelieveld
Unlike many oxidised atmospheric trace gases, which have numerous production pathways, peroxyacetic acid (PAA) and PAN are formed almost exclusively in gas-phase reactions involving the hydroperoxy radical (HO2), the acetyl peroxy radical (CH3C(O)O2) and NO2 and are not believed to be directly emitted in significant amounts by vegetation. As the self-reaction of HO2 is the main photochemical route to hydrogen peroxide (H2O2), simultaneous observation of PAA, PAN and H2O2 can provide insight into the HO2 budget. We present an analysis of observations taken during a summertime campaign in a boreal forest that, in addition to natural conditions, was temporarily impacted by two biomass-burning plumes. The observations were analysed using an expression based on a steady-state assumption using relative PAA-to-PAN mixing ratios to derive HO2 concentrations. The steady-state approach generated HO2 concentrations that were generally in reasonable agreement with measurements but sometimes overestimated those observed by factors of 2 or more. We also used a chemically simple, constrained box model to analyse the formation and reaction of radicals that define the observed mixing ratios of PAA and H2O2. After nudging the simulation towards observations by adding extra, photochemical sources of HO2 and CH3C(O)O2, the box model replicated the observations of PAA, H2O2, ROOH and OH throughout the campaign, including the biomass-burning-influenced episodes during which significantly higher levels of many oxidized trace gases were observed. A dominant fraction of CH3O2 radical generation was found to arise via reactions of the CH3C(O)O2 radical. The model indicates that organic peroxy radicals were present at night in high concentrations that sometimes exceeded those predicted for daytime, and initially divergent measured and modelled HO2 concentrations and daily concentration profiles are reconciled when organic peroxy radicals are detected (as HO2) at an efficiency of 35 %. Organic peroxy radicals are found to play an important role in the recycling of OH radicals subsequent to their loss via reactions with volatile organic compounds.
- Article
(4707 KB) - Full-text XML
-
Supplement
(1135 KB) - BibTeX
- EndNote


Peroxyacetyl nitric anhydride (CH3C(O)O2NO2), commonly and hereafter referred to as PAN, plays a centrally important role as a reservoir of reactive nitrogen and transportation medium for NOx from polluted to NOx-poor regions of the atmosphere and thus impacts global tropospheric O3 formation (Singh and Hanst, 1981; Fairlie et al., 2007; Zhang et al., 2008). This, combined with its influence on ecosystem health and productivity (Sparks et al., 2003), has made PAN a target of environmental research for several decades (Singh, 1987; Roberts, 1990; Grosjean, 2003). PAN is formed exclusively in the termolecular reaction of NO2 with the peroxyacetyl radical (PA, CH3C(O)O2), which is considered one of the four most abundant organic peroxy radicals in the atmosphere (Tyndall et al., 2001).
PAN is thermally unstable, with a lifetime for re-dissociation to reactants (Reaction R-1), which is of the order of hours at temperatures close to 20 ∘C, but which increases to weeks or longer at lower temperatures as found at higher altitudes.
As PAN is formed in reactions involving NO2 and radicals formed from oxidation of organics its occurrence is frequently associated with photochemical ozone formation, and PAN measurements have been interpreted to derive regional O3 formation rates (Williams et al., 1997).
Peroxyacetic acid (CH3C(O)OOH, hereafter PAA) is formed in a branch of the reaction of CH3C(O)O2 with HO2 (Reaction R2) and is thus linked to PAN via their common, organic, peroxy-radical precursor.
The fate of the CH3CO2 radical formed in Reaction (R2c) is decomposition to CO2 and CH3, the latter being converted immediately to CH3O2 in the presence of O2.
Several recent experimental studies of Reaction (R2) (Hasson et al., 2004; Dillon and Crowley, 2008; Jenkin et al., 2010; Groß et al., 2014) have shown that the dominant pathway (Reaction R2c) results in OH formation, contributing to HOx recycling in NOx poor regions (Lelieveld et al., 2008; Taraborrelli et al., 2012). The IUPAC preferred values for this reaction (Atkinson et al., 2006; IUPAC, 2018) are an overall rate coefficient at a room temperature of (2.2 ± 0.4) cm3 molecule−1 s−1 with 50 % (±10 %) of reactive collisions resulting in OH formation (Reaction R2c) and branching ratios of 0.37±0.1 and 0.13±0.1 for Reactions (R2a) and (R2b), respectively.
Under conditions of temperature and pressure found in the lowermost troposphere, the rate coefficients for reaction of CH3C(O)O2 with NO2 and HO2 are similar (k1 at 298 K and 1 bar pressure is cm3 molecule−1 s−1) and the relative flux of CH3C(O)O2 radicals into PAN and PAA formation will depend on the relative abundance of NO2 and HO2. Apart from extremely clean environments or very aged air pollution, when HO2 concentrations approach those of NO2, this will generally favour PAN. In the summertime boundary layer at midlatitudes, PAN is, however, short-lived and will readily decompose back to NO2 + CH3C(O)O2, implying that the formation of the thermally stable peroxy acid in (R2a) will be a significant CH3C(O)O2 and HOx sink in warm conditions with low NOx levels.
Unlike PAN, there are few measurements of PAA (Fels and Junkermann, 1994; He et al., 2010; Zhang et al., 2010; Nguyen et al., 2015) and even fewer data sets in which PAN and PAA were both monitored (Zhang et al., 2010; Phillips et al., 2013). A significant difference between PAA and many other organic acids is that, to the best of our knowledge, the former is generated in the gas phase almost exclusively via Reaction (R2a), whereas non-peroxy acids (e.g. its acetic acid co-product in Reaction R2b) may be emitted by vegetation (Talbot et al., 1995) or formed in reactions of O3 with olefins (Grosjean, 1992) or by biomass burning (Talbot et al., 1988). PAA may also be formed in aerosols by the aqueous-phase oxidation of acetic acid by H2O2, but its high solubility and aqueous-phase equilibrium with CH3C(O)OH and H2O preclude significant release into the gas phase.
Recently, we presented a data set of quasi-simultaneous PAN and PAA measurements made at a boreal forest site in Finland (Phillips et al., 2013). In Phillips et al. (2013) more technical aspects of the measurement of PAN and PAA were described, though we also alluded to the fact that, due to their partly common generation mechanism, PAN ∕ PAA ratios may be a useful indicator of HO2 levels. Here, we examine that aspect in more detail using an analytical expression that describes the PAA-to-PAN ratio. We also combine the PAN and PAA measurements with those of several other trace gases and use chemical box modelling with a highly simplified reaction scheme to gain insight into HOx chemistry and the factors affecting PAN, PAA and H2O2 formation at the boreal site.
The HUMPPA-COPEC campaign in the summer of 2010 was located in the Finnish boreal forest at the SMEAR II-Hyytiälä station (Hari and Kulmala, 2005) (61∘51′ N, 24∘17′ E). The location of the site means that it experiences a very homogeneous fetch extending over hundreds of kilometres in all directions. A campaign overview with a list of instruments and an outline of the meteorological situation during the intensive period (July and August) is given in Williams et al. (2011). The campaign period was unusually warm for this location (maximum temperature recorded was ∼30 ∘C), mainly due to the above-average contribution of air masses from the south, which resulted in enhanced biogenic emissions from the forest and which also brought two episodes of biomass-burning-impacted air to the site. The forest is dominated by a mixture of coniferous forest (Scots pine and Norway spruce) and mixed forest (conifers and silver birch). Most of the instruments from which data have been used in this work (PAN, PAA, H2O2, NO, NO2, O3 and HCHO) had inlets at the top of a ∼20 m high tower located in a small clearing (∼20 m diameter) in the forest and at approximately the same height as the surrounding tree-tops. Other data including OH and HO2 and organic trace gases were taken by instruments located nearby (for details of instrument positions and inlet heights see Williams et al., 2011).
PAN and PAA were measured using an iodide chemical ionisation mass spectrometer (I-CIMS) described in Phillips et al. (2013). Details of the instruments used to measure H2O2 and ROOH (enzymes/fluorescence), HCHO (Hantzch method), NOx (chemiluminescence detector) organic peroxides and O3 (UV) have been reported elsewhere (Stickler et al., 2006; Hosaynali Beygi et al., 2011; Fischer et al., 2015). Details of the OH-reactivity measurements and proton-transfer mass spectrometric (PTRMS)/GC measurements of organic trace gases have been previously given (Nölscher et al., 2012; Yassaa et al., 2012; Kourtchev et al., 2016). OH was measured by chemical ionisation mass spectrometry (Petäjä et al., 2009), HO2 radicals were measured by laser-induced fluorescence (LIF-FAGE) after conversion to OH as described in Hens et al. (2014) and Novelli et al. (2014). J values were obtained from process-specific parameterizations based on J-NO2 and J-(O(1D)) measured by filter radiometers (Bohn et al., 2008). Owing to known interferences by organic peroxy radicals (Fuchs et al., 2011, 2016; Lew et al., 2018), especially in forested regions, we refer to the measurements of HO2 as LIF-HO2 which represent an upper limit to true HO2 levels. Since the discovery of this interference in 2010, it was eliminated from all later LIF measurements by reducing the amount of NO added internally to the sampled air and by regularly performing titration tests in the field.
Figure 1 displays measurements of PAN and PAA made by iodide CIMS during HUMPPA-COPEC-2010 and several other trace gases (O3, CO, H2O2, HCHO, NOx), which provide some indication of the type of air masses sampled. Generally, the mixing ratios of PAN and PAA were similar, with PAN typically present at less than one ppb, reflecting the relatively low NOx levels (median, noontime mixing ratio of 0.3±0.1 ppbv) at this boreal forest site. In two campaign periods, days 207–211 and 219–221 highlighted in grey in Fig. 1, elevated levels of PAN and especially PAA were observed, with mixing ratios of PAA exceeding 1 ppb compared to levels of less than 200 pptv during the rest of the campaign. These episodes of high PAA (and PAN) were accompanied by elevated mixing ratios of longer-lived trace gases such as CH3CN, CO, SO2, HCHO and O3, and were also coincident with higher than average temperatures. As discussed in Williams et al. (2011), CH3CN measurements indicate that, during these periods, the site was impacted by biomass burning in Russia, with back trajectories suggesting that the air from the fires had travelled for a few days before reaching the site.
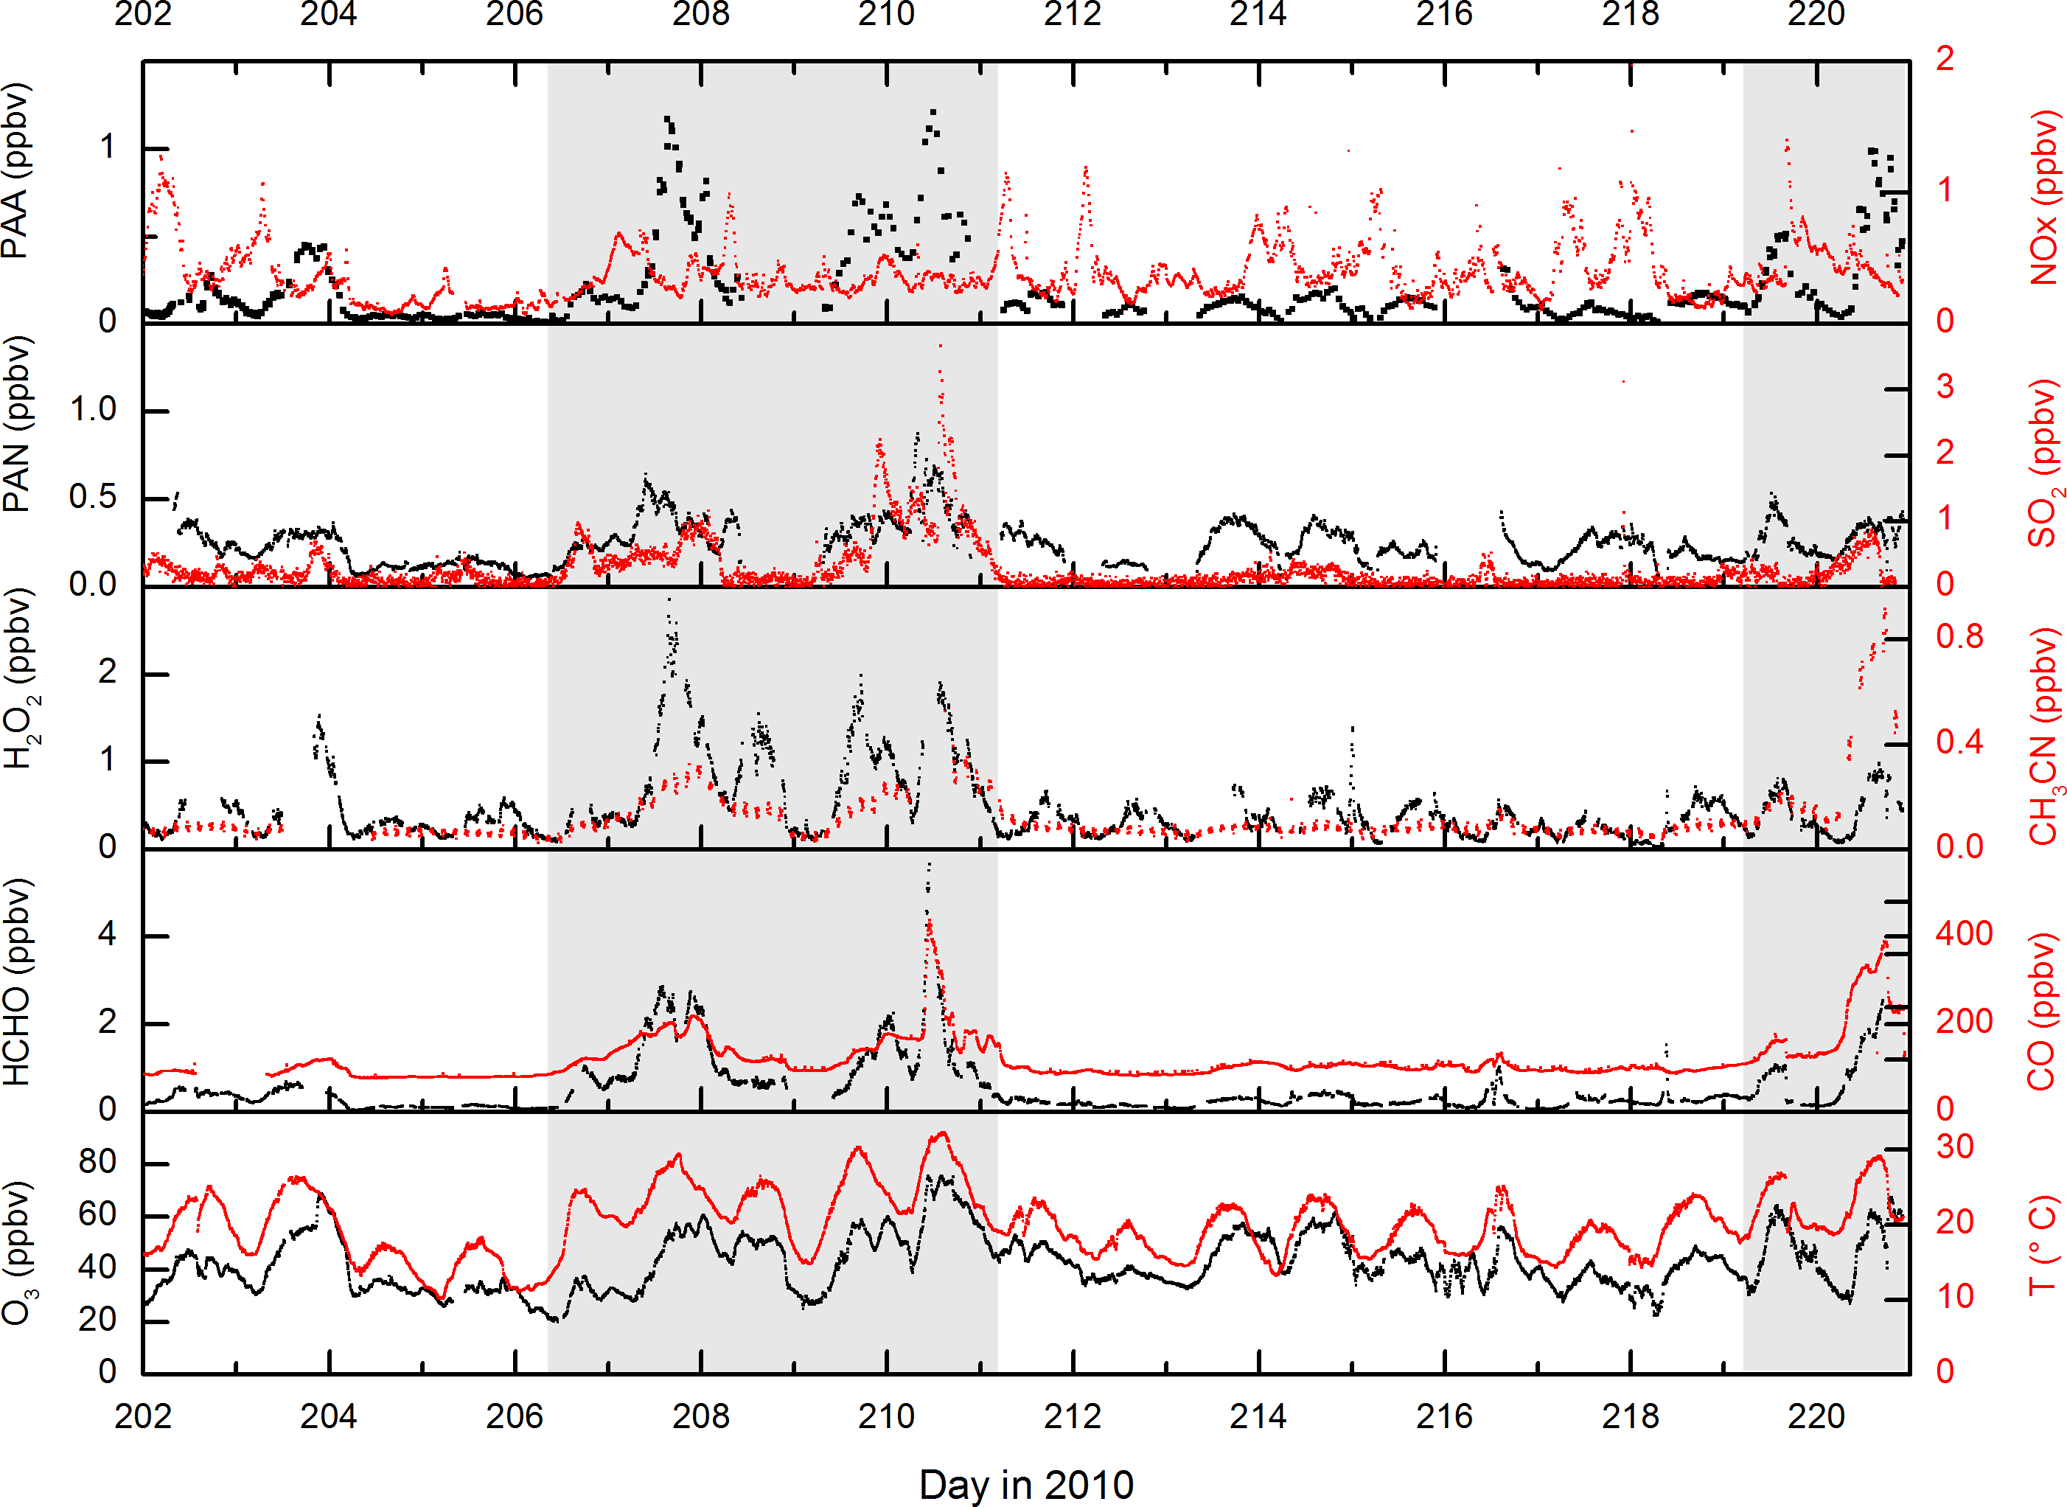
Figure 1Measurements of PAA (CH3C(O)OOH), PAN (CH3C(O)O2NO2) and other trace gases during HUMPPA-COPEC-2010. Day 202 was the 20 July 2010. The shaded areas represent two periods in which the site was impacted by biomass-burning plumes originating from Russia.
An additional feature during the first episode (day 210.5) is a spike in the SO2, HCHO and CO mixing ratios and also in non-oxidised hydrocarbons such as pentane (Williams et al., 2011). This shorter-lived plume was associated with a continuous and rapid change in wind direction (from ∼25 to ∼160∘) and higher local wind speeds (up to 25 km h−1), which resulted in the arrival of biomass-burning impacted but less aged air masses to the site. The presence of sharply elevated SO2 and pentane strongly suggests that fossil-fuel-related emissions from St Petersburg, (120∘, 400 km distant), were mixed into this air mass, which may be regarded as chemically distinct from the other, longer-lasting biomass-burning episodes. NOx levels were not elevated during the biomass-burning plumes, confirming that they were chemically aged with respect to the conversion of NOx to NOy. Significant increases in signals at several PTRMS masses also indicated the presence of elevated amounts of oxygenated, volatile organic compounds (OVOCs, including organic acids, aldehydes and ketones) and also aromatic trace gases during the period where the site was impacted by the biomass-burning plumes. The warmer temperatures were also associated with increases in the emissions of biogenic trace gases (Paasonen et al., 2013; Kourtchev et al., 2016), making this a chemically very complex period during the campaign. An overview of several trace gases measured by the PTRMS is given in Fig. S1 of the Supplement.
While the elevated levels of long-lived biomass-burning tracers such as CO and CH3CN and biomass-burning aerosol signal (Corrigan et al., 2013) are clearly due to long-range transport, this is unlikely to be the case for the shorter-lived trace gases. The very high OH reactivity (up to 45 s−1) observed (Nölscher et al., 2012) during the biomass-burning events and the fact that both H2O2 and PAA display diurnal profiles consistent with photochemical generation suggest that the high levels of PAA, PAN and H2O2 are related to the presence of high levels of radical precursors in the biomass-burning plumes, as previously observed for boreal fires (Alvarado et al., 2010).
While PAA and PAN have similar photochemical generation routes, a cursory examination of their average diel profiles during the campaign (Fig. 2) reveals important differences, with peak concentrations in the daily cycle of PAA displaced (later) relative to those of PAN by about 2 h. This is related to the maximum loss rates of PAN (via thermal decomposition), which occur at the highest temperatures in the mid-afternoon. The day-to-day variations in the diel cycle of PAA are mainly changes in the maximum mixing ratio, reflecting variable rates of production from precursors, with a night-time concentration generally tending to zero. This is very similar to the diel profile of H2O2, which is also highly regular in shape and which, on most nights, also tends towards zero.
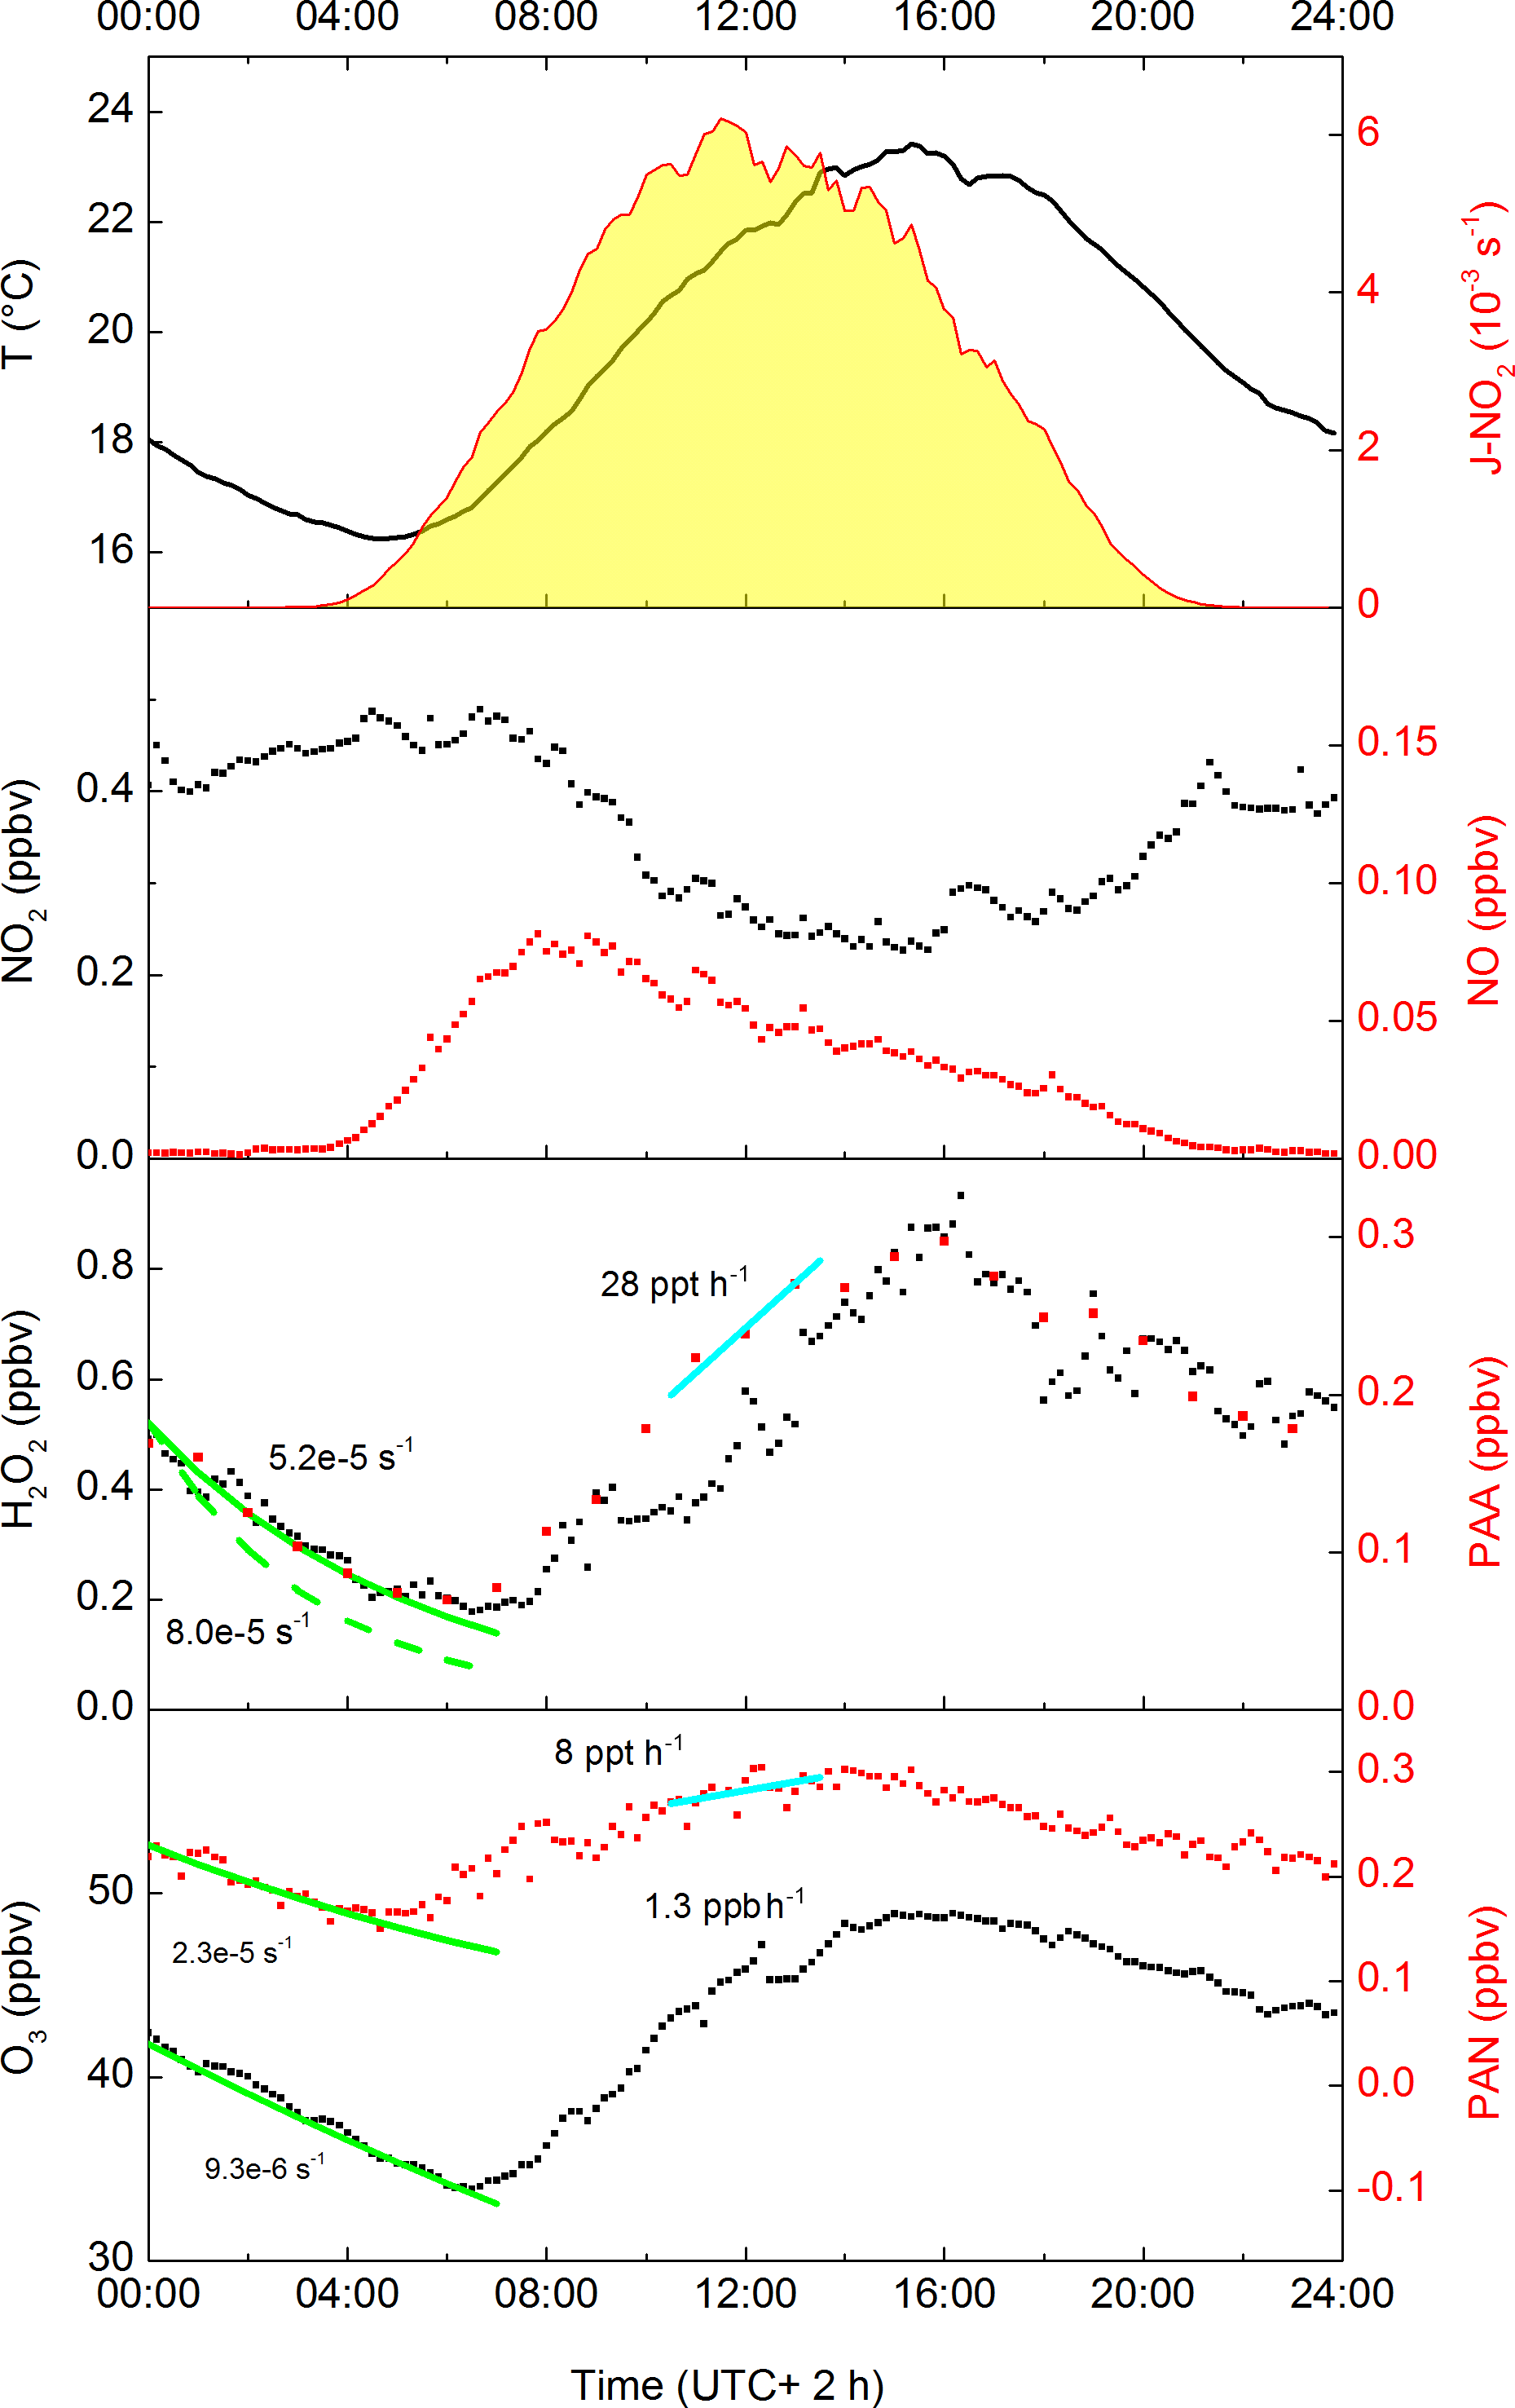
Figure 2Averaged diel profiles (days 202–220) of PAN, O3, H2O2, NO2, NO, temperature, J-O(1D) (all 10 min averages) and PAA (60 min intervals). The solid green lines represent campaign-averaged, night-time exponential decay rate constants (s−1) for H2O2, PAA, PAN and O3. The dashed green line is the adjusted decay constant for H2O2 that takes into account its formation via ozonolysis of VOCs. The cyan lines represent average production rates (ppbv or pptv per hour) for PAA and PAN (centred at 12:00).
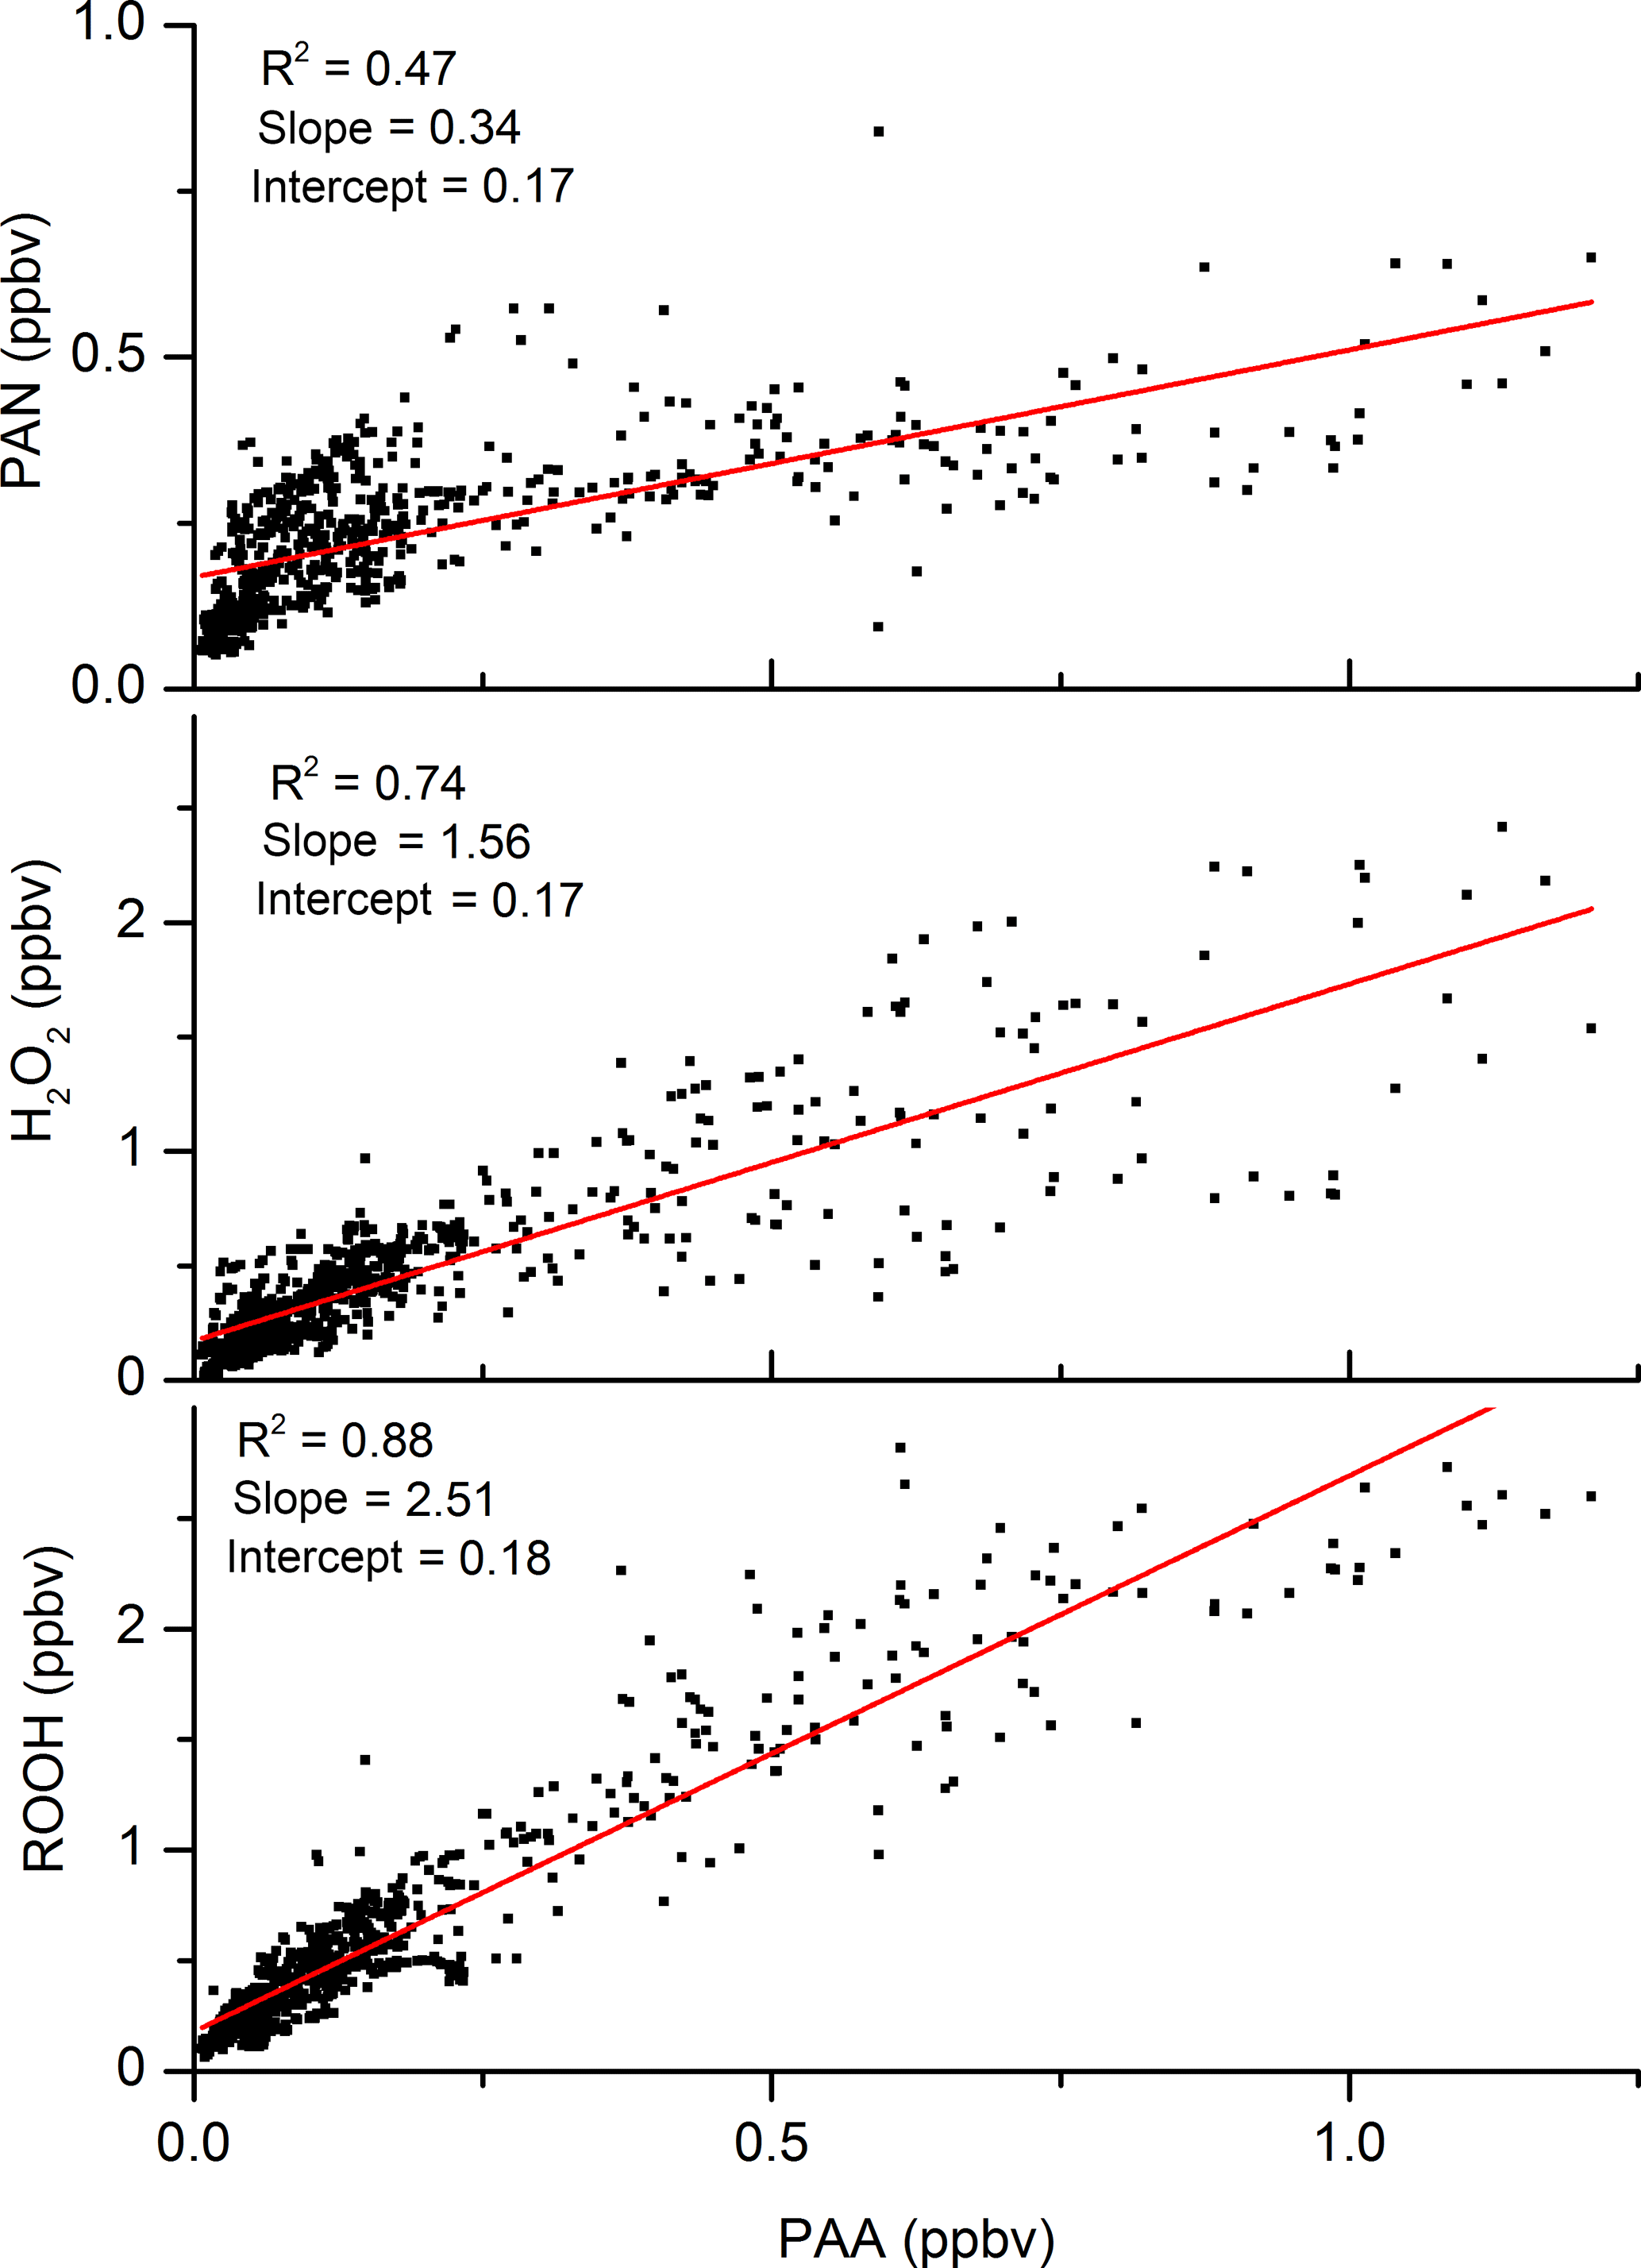
The mixing ratios of PAA are plotted against those of both H2O2 and PAN in Fig. 3, which highlights the good correlation (R2=0.74) with H2O2. The slope of the PAN-to-PAA ratio is reduced at high PAA mixing ratios, which were generally observed when temperature and photochemical activity were highest. The more rapid loss of PAN at high temperatures causes a non-linear relationship and weakens the overall PAA-to-PAN correlation (R2=0.47). The lower panel of Fig. 3 indicates that PAA is strongly correlated with total organic peroxides (ROOH) and represents a significant fraction of total organic peroxides during the HUMPPA-COPEC campaign (Phillips et al., 2013). The PAN mixing ratios over the diel cycle were very variable, especially at night-time.
Radiosondes suggest that for HUMPPA-COPEC-2010 the lowermost layer will be mixed with the residual layer by ≈10:00 local time (07:00 UTC), and we can consider the boundary layer thereafter to be mixed up to 1 km height with a further increase in height over the next 2 h, depending on meteorological conditions (Ouwersloot et al., 2012). As rates of entrainment from the free troposphere and the vertical gradients of PAA are not known, in the subsequent analysis we assume that photochemical generation dominates the production side of the PAA budget but re-address this later when comparing measured and model predictions of PAA and H2O2 mixing ratios.
Analysis of the net loss of PAN, O3 and H2O2 during the pre-dawn period (midnight to 04:00; see Fig. 2) by fitting exponential decay curves to the data during this period gives loss-rate constants of s−1 (H2O2), s−1 (PAN) and s−1 (O3) resulting in campaign-averaged, night-time lifetimes of ≈7, 5 and 30 h, for H2O2, PAN and O3, respectively. Note that as NO and HO2 are absent or present in very low concentrations at night, the thermal decomposition of PAN does not result in its efficient loss (see below). The night-time loss rates of H2O2, PAN and O3 therefore reflect different rates of deposition to the canopy, although that of H2O2 will be a lower limit as night-time production can occur via the ozonolysis of terpenes (see below).
The average, night-time loss-rate constant for PAN of s−1 can be equated to 2Vex∕h, where Vex is the exchange velocity and h is the boundary layer height (Shepson et al., 1992). This results in an approximate value of Vex≈0.23 cm s−1 for an average, night-time boundary layer height of 200 m for this campaign (Ouwersloot et al., 2012). This is consistent with values between 0 and 0.6 cm s−1 obtained at night-time over coniferous forests (Shepson et al., 1992; Turnipseed et al., 2006; Wolfe et al., 2009). Wolfe et al. (2009) determined that the exchange velocity of PAN increased by a factor of ≈4 at noon compared to night, which is partially due to more efficient stomatal transport during the day. From this ratio, yielding an average, noontime exchange velocity of ≈0.9 cm s−1 for HUMPPA-COPEC, and assuming a daytime boundary layer height of 1400 m (Ouwersloot et al., 2012), we calculate noontime loss-rate constants for PAN deposition of s−1. The high temperatures encountered during the summer in the HUMPPA-COPEC-2010 campaign mean that daytime loss of PAN due to deposition is small compared to thermal dissociation followed by reaction of CH3C(O)O2 with NO or HO2 (see below).
With a loss-rate constant of s−1, the night-time depletion of O3 is slower than for PAN. From the values presented in Fig. 2, the relative loss rate of O3 and PAN is 0.4, which is similar to the value of 0.42±0.19 reported by Shepson et al. (1992) and Wolfe et al. (2009), though such comparisons are complicated by variability in the chemical losses of O3, e.g. via reaction with NO or sesquiterpenes (Kurpius and Goldstein, 2003), which depend on factors such as forest type and emission rates.
The observed (net) loss-rate constant for H2O2 is s−1, whereby ≈0.25 ppbv are lost in 4 h between 00:00 and 04:00. The change in [H2O2] results from a combination of its production via ozonolysis of terpenes and depositional losses. During the period from midnight to 04:00, the campaign-averaged terpene and O3 mixing ratios were 300 pptv and 38 ppbv, respectively. The five biogenic species measured by the GC (isoprene, α-Pinene, myrcene, 3-carene and β-Pinene) have rate constants for reaction with O3 that vary between and cm3 molecule−1 s−1. Taking into account the mean relative concentration and O3-rate coefficient for each terpene, we derive an effective, campaign-averaged rate constant of cm3 molecule−1 s−1 for the ozonolysis of terpenes. Taking a H2O2 yield of 0.16 (e.g. as observed for α-Pinene) we calculate that ≈0.1 ppb H2O2 was generated during this period. Taken together with the observed (net) loss of H2O2, this implies a loss of 0.35 ppbv H2O2 by dry deposition in 4 h, which translates to a loss-rate constant of s−1. Equating this value to 2Vex∕h (see above) we derive a night-time deposition velocity for H2O2 of 0.8 cm s−1. Given the assumptions made, the uncertainty associated with this value is likely to be considerable. Nonetheless, the value obtained is entirely consistent with night-time deposition velocities of 0.8±0.2, 1.0±0.3 and 1.6±0.3 cm s−1 reported for H2O2 deposition over the Canadian boreal forest, with daytime H2O2 deposition velocities that are a factor of 10 (±5) larger (Hall and Claiborn, 1997). Using this factor we calculate daytime deposition velocities of 8±4 cm s−1. This can be equated to Vex∕h, which assumes no gradient in H2O2 in a well-mixed boundary layer. Taking into account the average daytime boundary layer height of 1400 m during HUMPPA, this converts to a loss-rate constant of (6±3) s−1 during the day. Later, we shall show that these values are consistent with results from the box-model-based analysis of the data set.
Hall and Claiborn (1997) measured deposition rates for summed organic peroxides (mainly CH3OOH), which were a factor of about 2 to 3 lower than for H2O2, and Nguyen et al. (2015) measured deposition velocities for PAA over a temperate forest that were a factor of 2 lower than H2O2. For our analysis, we apply daytime loss rates of ROOH, CH3OOH and PAA due to deposition that are a factor of 2 lower than for H2O2. In the following, we present a more detailed discussion of the chemical factors which control the relative abundance of PAA and PAN during the campaign.
3.1 Production and loss of PAN and CH3C(O)OOH
In the absence of a sufficiently rapid reaction with OH (k < cm3 molecule−1 s−1) and photodissociation (due to low cross sections and quantum yields in the tropospheric spectral range) (Talukdar et al., 1995), the lifetime of PAN during HUMPPA-COPEC-2010 was largely controlled by the temperature, which strongly affects its rate of thermal decomposition to CH3C(O)O2 and NO2 (Reaction R-1). The relative concentrations of trace gases such as NO and peroxy radicals (which can react with CH3C(O)O2 via Reactions R2 and R3) to that of NO2, which regenerates PAN (Reaction R1) and its dry deposition rate dPAN thus control its effective lifetime. Unlike other peroxides (e.g. H2O2) PAA is not formed at significant yield in the ozonolysis of BVOCs such as α-Pinene (Li et al., 2016).
The most important reactions (Reactions R1, R-1, R2a) describing the formation and loss of PAN and PAA involve the acetyl peroxy radical (CH3C(O)O2), including its reaction with NO (Reaction R3).
PAA will be lost by reaction with OH (Reaction R4):
By analogy with reactions of OH with H2O2 and CH3OOH, Orlando and Tyndall estimated k4 to be ≈1– cm3 molecule−1 s−1 with CH3C(O)O2 (and H2O) the predicted, dominant products following abstraction of the acidic H atom in Reaction (R4) (Orlando and Tyndall, 2003). Theoretical work (Rypkema and Francisco, 2013) suggests that H abstraction at the methyl group forming (in air) O2CH2C(O)OOH is also possible. Recent experimental work (Wu et al., 2017) suggests that k4 may be as large as cm3 molecule−1 s−1 and this value has been adopted by the IUPAC panel (IUPAC, 2018) albeit with large associated uncertainty related to experimental difficulties.
The boundary layer lifetime of PAA and PAN will also be partially determined by deposition, especially in forests, as discussed above. The first-order rate constants representing dry deposition are dPAN and dPAA. Experimental work (Wu et al., 2015) on the uptake of PAA to ambient aerosol indicates an uptake coefficient (γ) of . Using the simplified expression (1) for the heterogeneous loss-rate constant (khet) of a trace gas to an aerosol particle:
where cm s−1 is the mean molecular velocity of PAA at room temperature and cm2 cm−3 is the aerosol surface area density results in an approximate loss-rate constant of s−1 or a lifetime of about 3 days. Although PAA may be lost to aerosol in regions with extreme aerosol loading (Li et al., 2016), this loss term is negligible, e.g. compared to depositional losses and reaction with OH in the boreal forest, and is not considered further in this paper.
Considering only their in situ, production and loss (i.e. ignoring advection) the net, relative rate of production of PAA and PAN (PPAA and PPAN, respectively) is given by
where [CH3C(O)O2]ss, is the steady-state concentration of the acetylperoxy radical, determined by the ratio of its production and loss terms. On the right-hand side of Eq. (2), the first terms of the numerator and denominator are readily recognised as governing PAA and PAN production, while the second terms are the summed loss rates. If both PAA and PAN were to acquire steady state, their relative concentrations would be given by
indicating that the PAA-to-PAN ratio depends on the relative abundance of HO2 and NO2. This is the expression we previously presented (Phillips et al., 2013) and which we used to derive very rough diel and campaign-averaged HO2 mixing ratios of about 30 ppt.
Uncertainties of 30 %, 25 % and 15 % for the mixing ratios of PAA, PAN and NO2, respectively can be combined with uncertainties of 10 %–20 % for the rate coefficients k1, k2a and k−1 and 50 % uncertainty for the deposition velocities for PAA and PAN, resulting in an overall uncertainty in [HO2] of close to 75 %.
Whether PAN and PAA acquire steady state (equivalence of production and loss terms in Eq. 2) depends on their loss rates. The first-order rate constant for PAN loss is given by the thermal decomposition rate constant (k−1) multiplied by the fraction of the CH3C(O)O2 radical, which does not reform PAN, plus the term for dry deposition, dPAN, i.e.
At a temperature of 298 K and at 1 bar pressure, cm3 molecule−1 s−1, s−1 and cm3 molecule−1 s−1. Using campaign-averaged midday values of [NO2] = 300 pptv, [NO] = 60 pptv and assuming [HO2] = 20 pptv, we derive an effective PAN loss-rate constant of s−1 or a lifetime of ≈4 h without considering deposition. The PAN lifetime will, however, vary greatly over the diel cycle and will increase substantially during colder, dark periods as the thermal dissociation slows down. In the absence of HO2 and NO, the dominant fate of the CH3C(O)O2 radical at night is to react with NO2 to reform PAN. The lifetime of PAN through the campaign was calculated using the measured NO and NO2 concentrations and temperature and a model result for the HO2 concentration (see section on the box model below).
Time-dependent values of dPAN were derived using a sinusoidal variation of the boundary layer height during HUMPPA between ∼1400 m during the day and ∼200 m at night (Ouwersloot et al., 2012), which was matched in phase to the average diel temperature variation during the campaign. Deposition of PAN was calculated with loss-rate constants of s−1 at night, varying sinusoidally to a maximum value of at 15:30 (see above). The lifetime for PAN throughout the campaign is displayed in Fig. 4.

Figure 4Lifetimes of PAN and PAA. The more regular diel cycle of PAA reflects the dominance of dry deposition with only a small contribution due to OH (visible as some fine structure in the midday loss-rate constant). PAN losses are dominated by thermal decomposition during the day and deposition at night.
Similarly, the loss rate of PAA will be controlled by its reaction with OH multiplied by the fraction that does not reform PAA (1−α), and its rate constant for dry deposition, dPAA is as follows:
The second term on the right-hand side of this expression varies between about 0.9 during the day and 1.0 at night when, to a first approximation, NO and HO2 are very low. With the same conditions as given above, using a model result for the diel variation of the OH concentration and taking k4 to be cm3 molecule−1 s−1, we derive an OH-induced PAA loss-rate constant of s−1 or a lifetime greater than 10 h. Thus, both dry deposition and reaction with OH determine the lifetime of PAA, though the dry deposition term dominates. The differences in the diel cycles of the PAA and PAN lifetimes are illustrated in Fig. 4.
Use of a single, average boundary layer height and the same variation in exchange velocities for each day during the campaign means that the lifetime of PAA shows a very uniform behaviour, varying between ≈5 and 8 h. In contrast, noontime PAN lifetimes are sometimes less than 3 h but increase up to 16 h at night.
Bearing in mind that the long lifetimes of PAA and PAN may partially invalidate the assumption of steady state, we can insert noontime values of PAA, PAN and NO2 into expression (4) to derive HO2 concentrations for each day during the campaign when data were available. The result is displayed in Fig. 5, which also compares the HO2 concentrations thus derived with direct measurements of LIF-HO2 (Hens et al., 2014), available for only a limited period of the campaign.
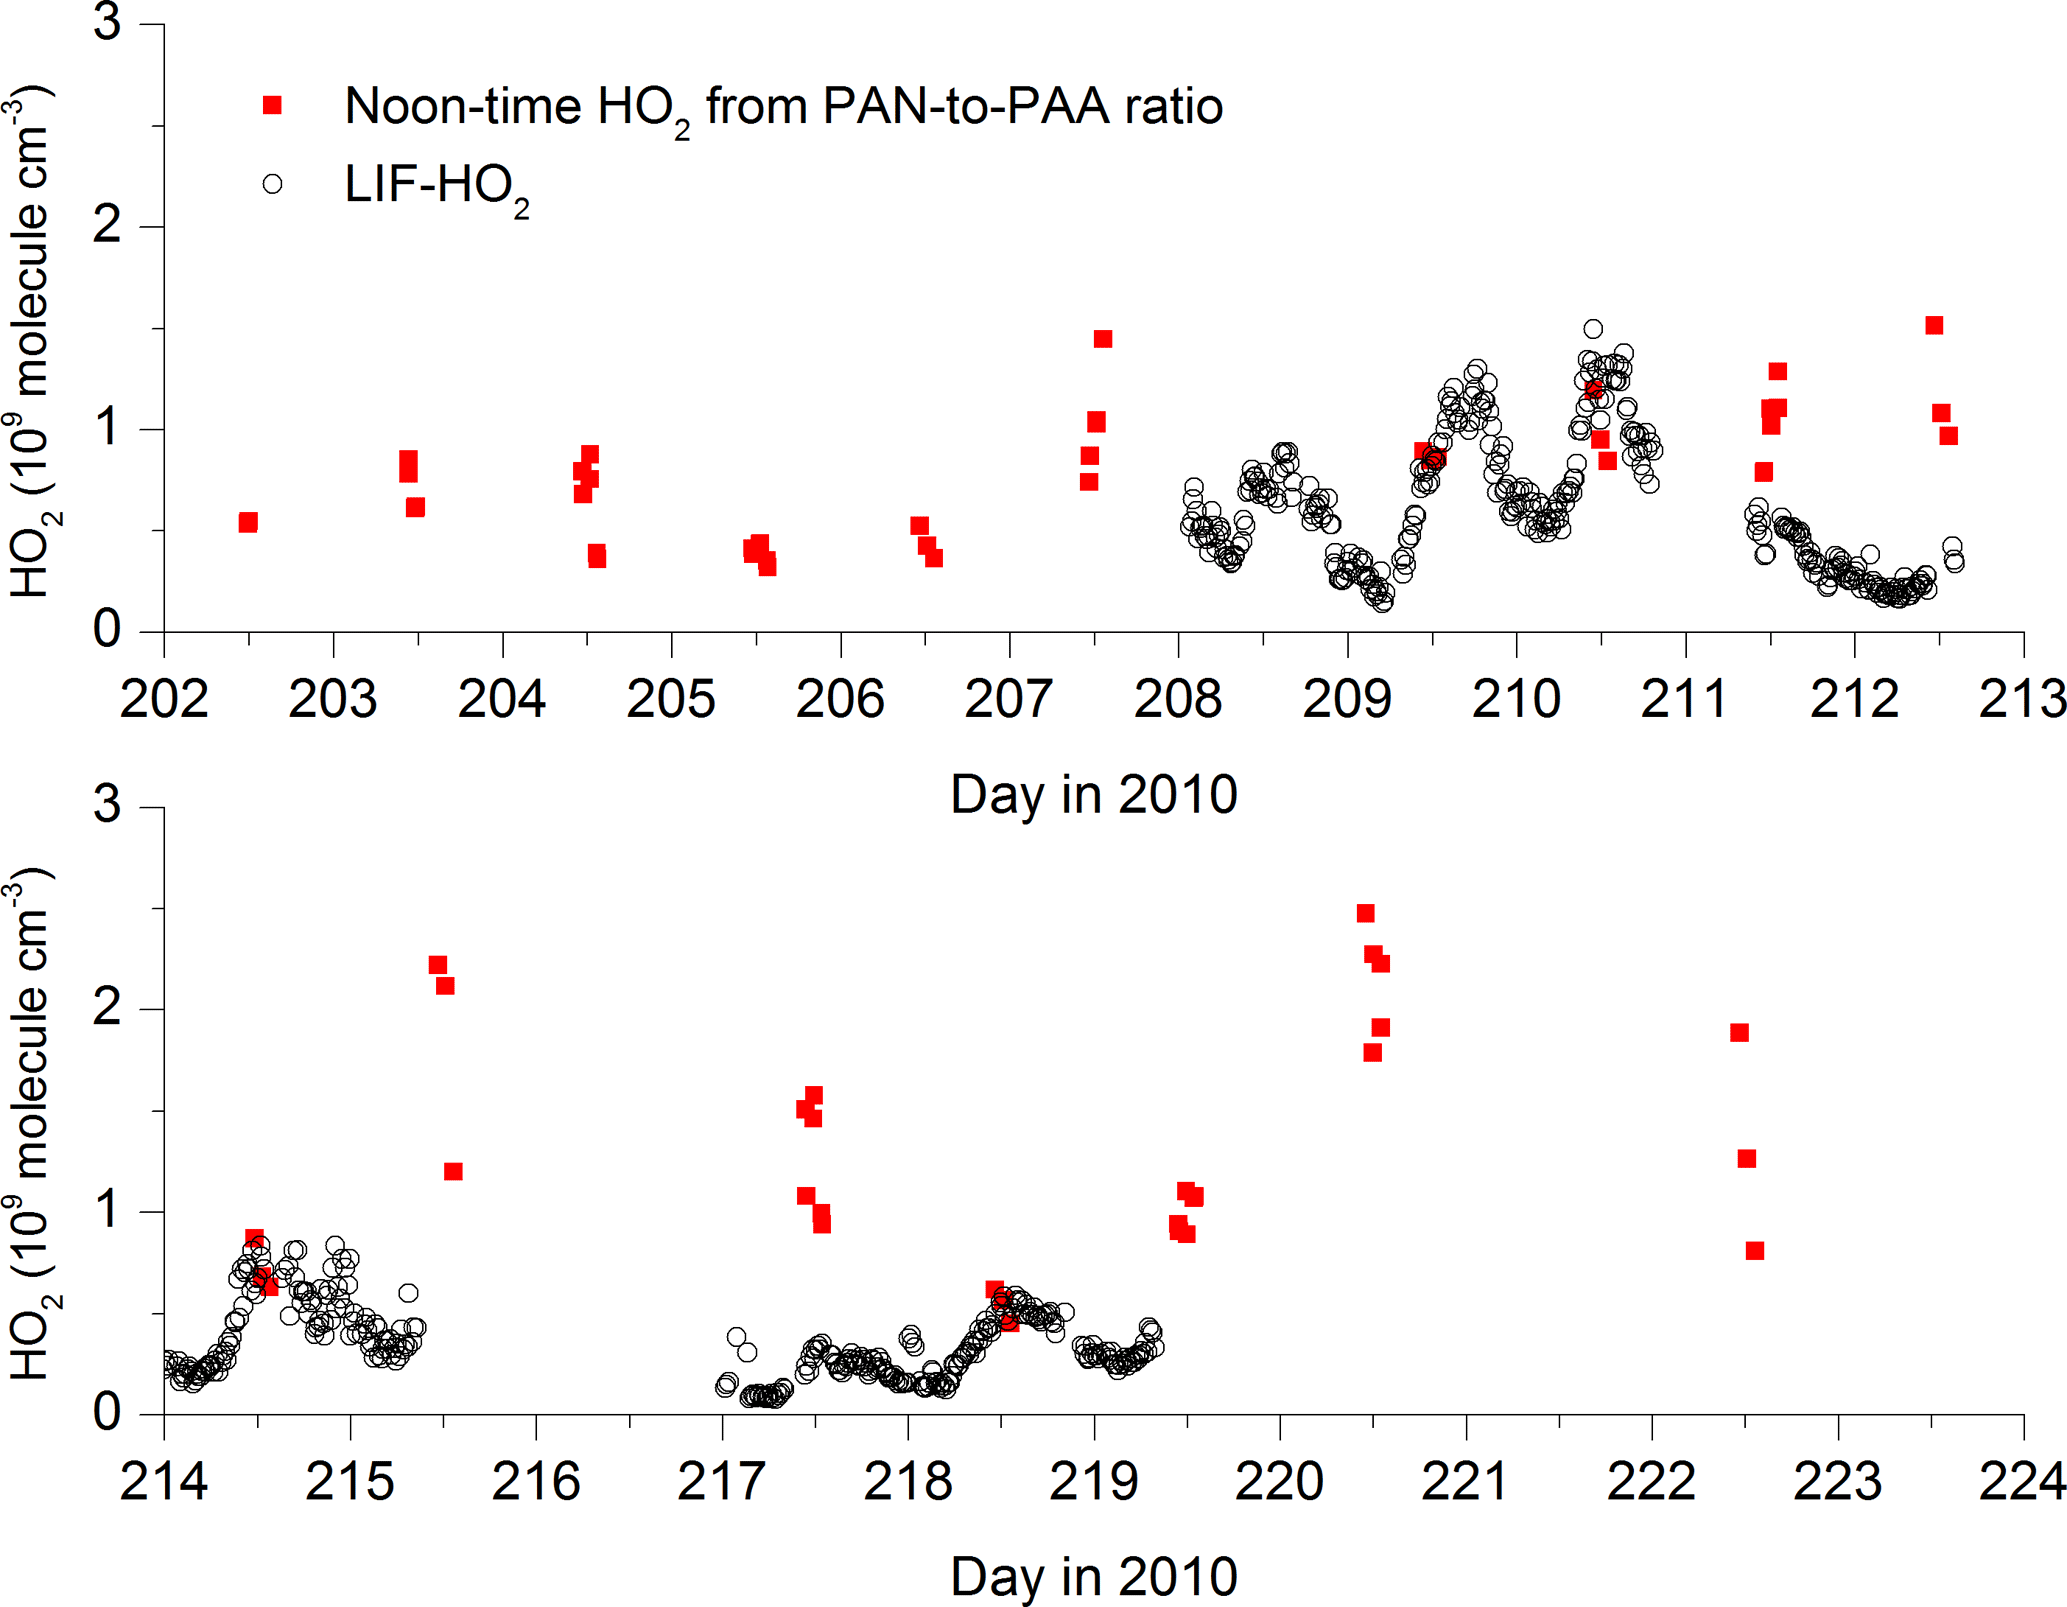
Figure 5[HO2] calculated via the PAN-to-PAA ratio at local noon (red symbols) and comparison with measured HO2 (black data points) by LIF.
The steady-state calculations result in noontime HO2 concentrations between 5×10⁸ and 2.5×10⁹ molecule cm−3.
On most days on which PAA, PAN and LIF-HO2 data are available (209, 210, 214, 218), the agreement is reasonable, exceptions being days 211 and 217. Given that the PAA- and PAN-derived HO2 concentrations are based on a steady-state assumption and are heavily dependent on the PAA deposition rate, the agreement may be coincidental, and the LIF-HO2 data are likely to be an overestimate of HO2 concentrations if high levels of organic peroxy radicals are present (Hens et al., 2014).
A further cause of the occasional disagreement, also related to the long lifetimes of PAN and PAA, may be the advection of NOx from a source that is too near for the PAN-to-PAA ratio to adapt to and which will then result in an overestimation of HO2 (see Eq. 4). Below, we compare the HO2 concentrations derived from Eq. (4) with those from a photochemical box model and show that good agreement is found during the warmer periods of the campaign (when daytime PAN lifetimes are shorter) but the disagreement can be significant during the colder periods when PAN is longer lived.
The HO2 mixing ratio derived via Eq. (4) is rather insensitive to the rate coefficient for the reaction of OH with PAA, which is poorly constrained (IUPAC, 2018) or the concentration of OH if it lies within the expected ranges (k4=2– cm3 molecule−1 s−1, and [OH] =5–20×105 molecule cm−3), reflecting the dominance of dry deposition losses of PAA such that dPAA > k6[OH]. Likewise, at noontime, the thermal decomposition rate of PAN is too rapid for the deposition term to impact the calculation of HO2 (). The value of [HO2] derived is, however, sensitive to the deposition rate of PAA chosen. An increase in dPAA by a factor of 2 leads to a similar increase in [HO2].
A more detailed insight into the chemical and meteorological factors controlling PAA and PAN can be gained from use of a time-dependent photochemical box model constrained by some of the longer-lived trace gases that contribute centrally to local photochemical generation of radicals and thus PAA and PAN. This is described below.
3.2 Box model description
The box model was developed with the goal of simulating the concentration of PAA and H2O2 over several diel cycles, which requires realistic diel variation in the photochemical production and loss rates of the CH3C(O)O2 and HO2 radicals. A highly simplified approach was taken, in which the diel variation of HO2 and CH3C(O)O2 radical concentrations over periods of several days was constrained by measured (non-radical) trace gases and photolysis constants, but overall radical levels were adjusted to optimise the simulation of PAA and H2O2. This may be seen as complementary to the modelling exercise of Hens et al. (2014), who used a highly detailed chemical scheme and focussed on radical production in a bottom-up approach in which several biogenic organic trace gases were constrained.
In all model runs, the parameters directly constrained by observations were the temperature, concentrations of O3, NO, NO2, HONO, PAN, CO, HCHO, CH3CHO, Σterpenes and the photolysis rate constants, J-O(1D), J-NO2, J-HONO, J-H2O2 and J-HCHO. The model CH4 mixing ratio was held constant at 1.8 ppmv. In sensitivity runs, the concentrations of trace gases that were not measured (e.g. dicarbonyls; see below) were added to the model and their concentrations were calculated relative to those of related trace gases for which correlation is expected.
The complete reaction scheme is listed in Table S1 of the Supplement. Rate coefficients were taken from the IUPAC evaluations (IUPAC, 2018). For the box model, programmed in FACSIMILE code (Curtis and Sweetenham, 1987), several different scenarios were investigated, in which sections of the chemistry listed in Table S1 were deactivated or modified in order to investigate sensitivity of the model output (i.e. concentrations of PAA, H2O2, HO2 and OH) to certain reactions and assumptions made, and to optimise the simulation of the measured concentrations of these trace gases and radicals. The box model simulated the field data at 10 min resolution. Due to the constraint (by measurements) of relatively long-lived trace gases such as O3 and NOx, the model reached steady state in less than 1 day. The simulation was initiated on day 196 and the output was only used from days 202 to 220 (for which PAA and PAN data were available). Essential features of the different model runs are listed in the section “Box model development” of the Supplementary information.
3.2.1 Model production and loss of HOx and ROx
OH was generated directly via O3 photolysis, whereby the photolysis rate constant, J-O(1D), was modified to take into account the relative rates of quenching of the O(1D) atom by N2 and O2 and reaction with H2O; i.e. it takes into account changes in humidity throughout the campaign. OH was also generated by photolysis of H2O2 and HONO and via reaction of HO2 with NO and O3.
Loss of OH via reactions with the trace gases constrained by measurement such as CO, H2O2, HCHO, O3 and NO2 represent only a small fraction of the overall OH reactivity, which is dominated by organic trace gases (Nölscher et al., 2012). Thus, two reactions in which OH was converted to organic peroxy radicals were used to tune the model OH reactivity and organic radical production rates. These OH-loss processes were parameterised as generic reactions of OH with biogenic trace gases and reactions with oxygenated volatile organic compounds (OVOCs) to form . In this case is distinct from the sum of organic peroxy radicals, which is usually denoted RO2. The mixing ratios of the biogenic trace gases (terpenoids) was constrained by PTR-MS measurements at high time resolution. The PTR-MS mixing ratios agreed with the summed terpenoids from the GC measurements.
A generic rate constant of cm3 molecule−1 s−1 was used for the reaction of OH with terpenes. This was calculated from the relative concentrations of the terpenes as measured by GC and weighted with their individual rate constants for reaction with OH (Atkinson and Arey, 2003b; IUPAC, 2018).
The mixing ratios of OVOCs were linked by a factor (adjusted to obtain good agreement between observation and model output) to measurements of CH3CHO and HCHO. For the reaction of OVOC with OH we used a rate coefficient of cm3 molecule−1 s−1. This approach is different to that taken by Hens et al. (2014), who tied missing OH reactivity to an unknown trace gas that behaved like α-Pinene but at concentrations that were a factor of 5–10 higher than measured. Tying missing OH reactivity to α-Pinene could, however, not simulate the high OH reactivities during the biomass-burning-impacted periods of the campaign.
The modelled OH reactivity varied between 3 and 50 s−1, the highest values being associated with the biomass-burning-impacted days as observed. A comparison between modelled and measured OH reactivity reveals broad agreement (Fig. 6) with several high-reactivity events captured by the model. The main exceptions are the events on day 202.5 (OH reactivity up to 43 s−1) and day 215 (peak OH reactivity of 70 s−1). Figure 6 also plots the time series of the organic content of aerosol, which varies in a similar manner to the modelled OH reactivity. This is expected, as increased OH reactivity should lead to larger rates of generation of condensable OVOCs and thus SOA mass. On the other hand, it will also reflect that in the model the high values of OH reactivity are tied to high levels of measured OVOCs (CH3CHO and HCHO), which may also be correlated with organic aerosol content. The most prominent exceptions are again the very high OH reactivities on day 202.6 (∼43 s−1) and day 214.6 (∼70 s−1). No corroborative evidence for high reactivity on these days could be found in the extensive data sets available for this campaign. For example, there were no significant increases in any measured trace gases (biogenic or biomass burning related), no reductions in the OH levels or enhanced formation of products such as HCHO. Instrument failure and subsequent tests resulted in an interruption in OH-reactivity measurements shortly before the sharp increase in OH reactivity on day 214 was measured. Though it is not obvious why this should have resulted in such a large, positive bias when measurements were resumed, the mismatch with other data, proximity to the power-down and exponential decay in the reactivity suggest that the instrument was not fully operational in this period.
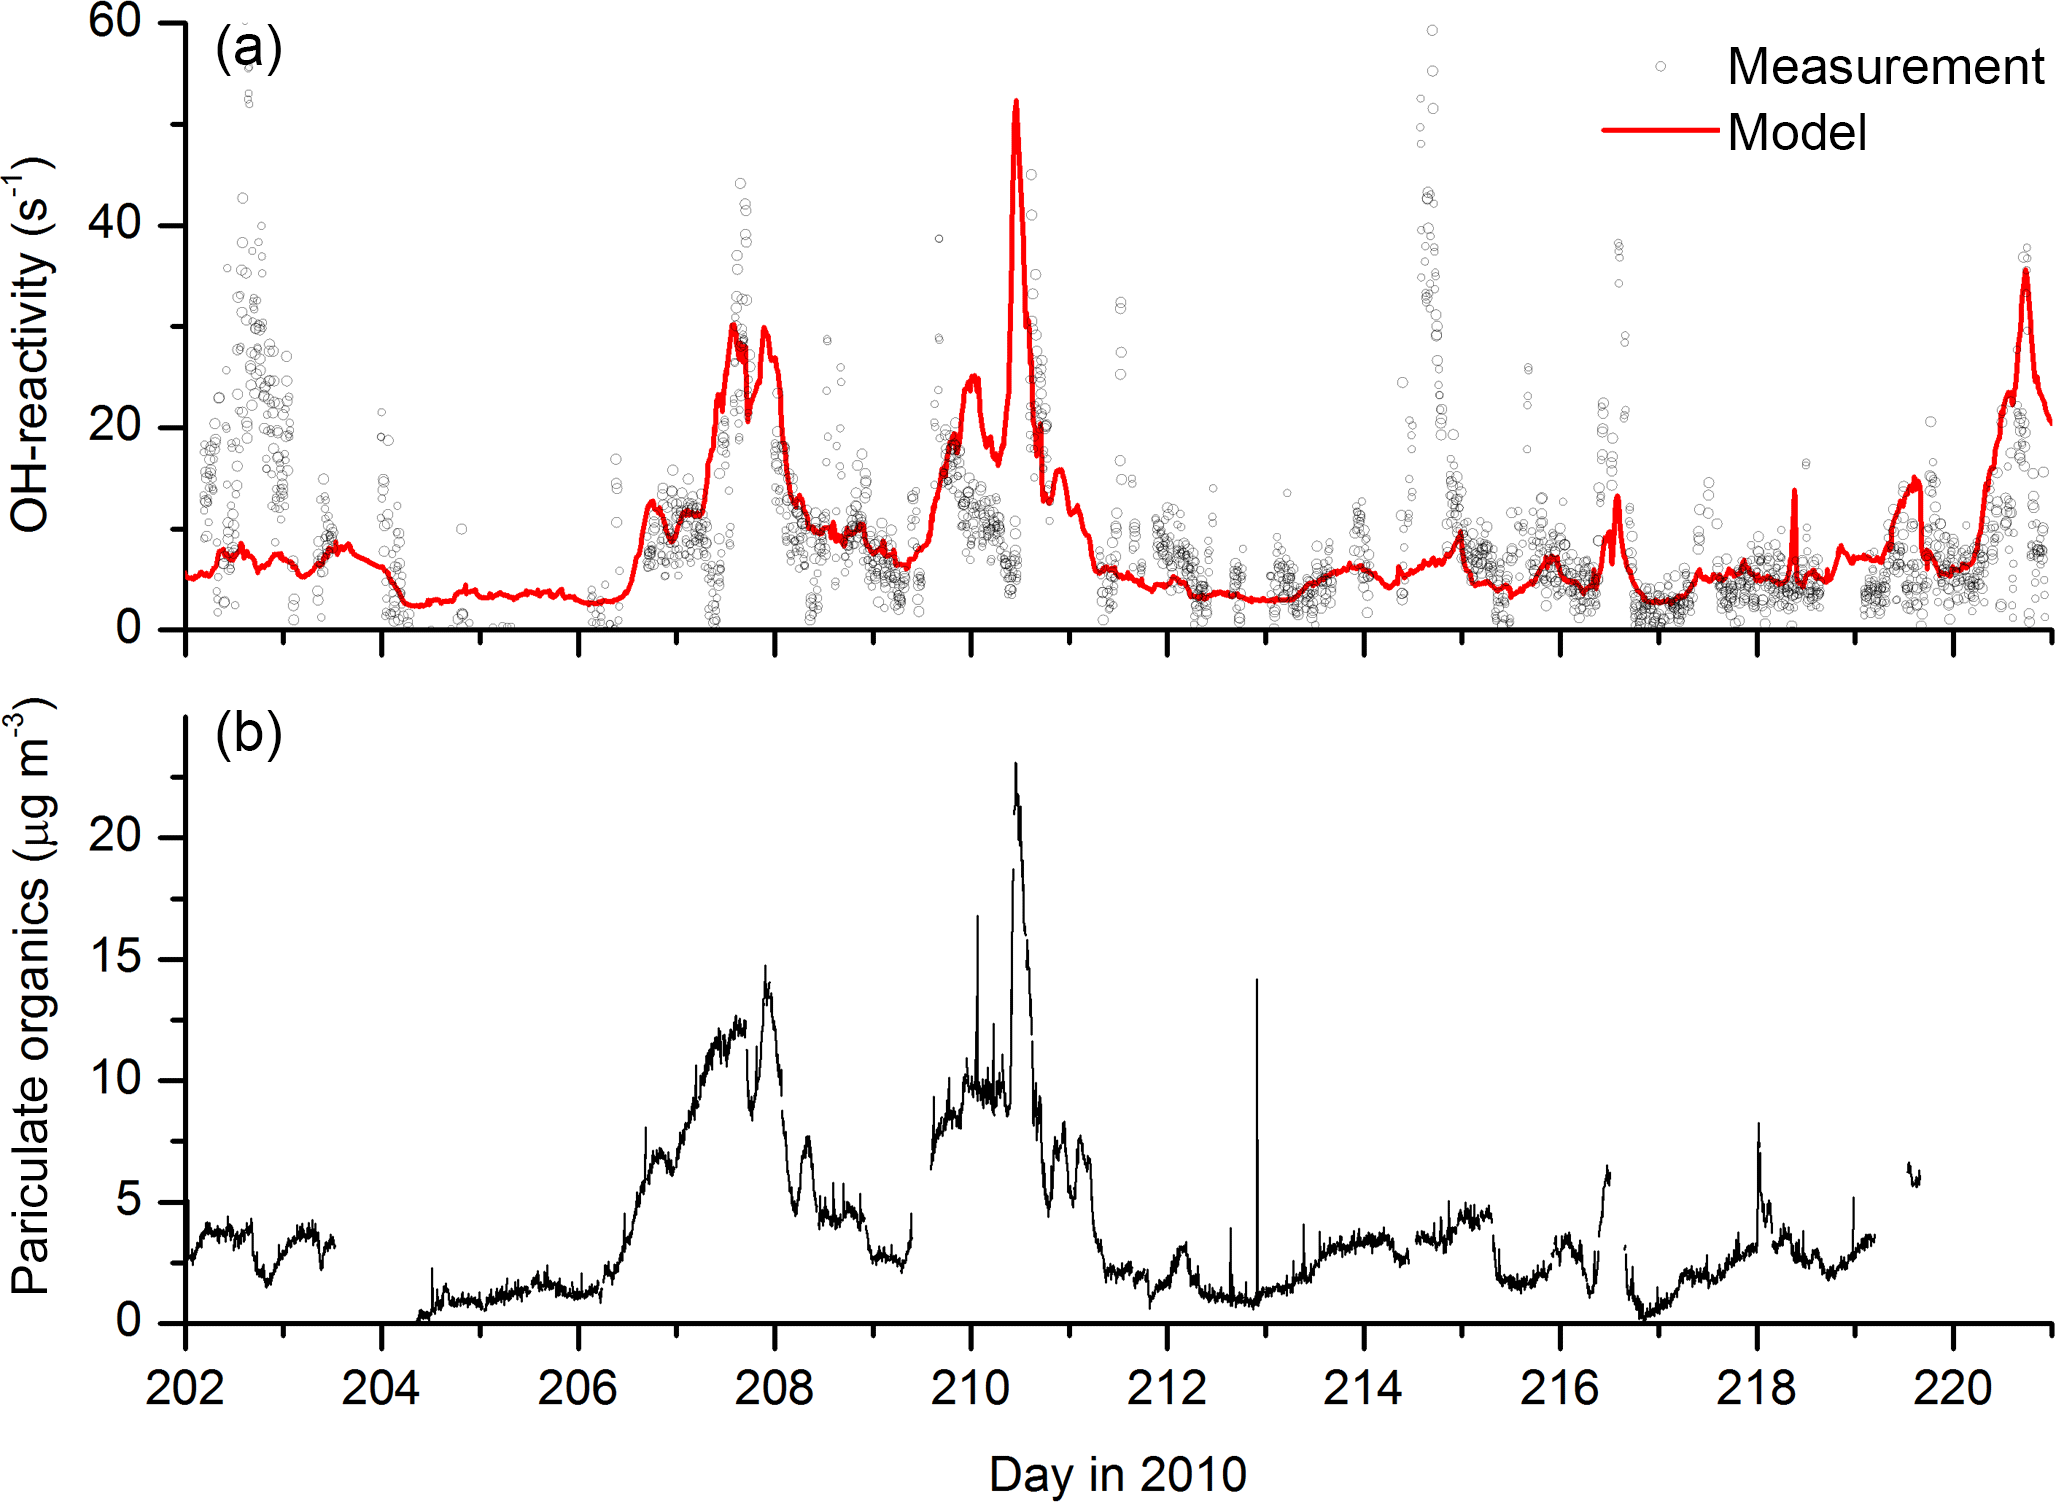
Figure 6(a) Measured (black data points) and modelled OH reactivity (red line). The aerosol organic content (b) shows similar campaign variability to modelled OH reactivity.
reacted in the model with NO to form HO2 (generic rate coefficient of cm3 molecule−1 s−1) and with HO2 to form peroxides (ROOH, with generic rate coefficient of cm3 molecule−1 s−1) and regenerate OH at cm3 molecule−1 s−1. As the chemical identity of the OVOCs is unknown, a more explicit description of the chemistry was not warranted.
HO2 was generated directly via photolysis of HCHO and from reactions of OH with O3, CO, HCHO and H2O2, and the reaction of NO with CH3O2 and other peroxy radicals. The most important HO2 reactions in the model are its self-reaction to form H2O2, and reaction with NO and O3 to form OH. It also reacts with the CH3C(O)O2 radical (forming PAA and acetic acid and recycling OH). The uptake of HO2 to aerosol has been reported to be important for the HOx budget under some conditions (Jacob, 2000; Liang et al., 2013). The present IUPAC evaluation (Ammann et al., 2013; IUPAC, 2018) for the heterogeneous interaction of HO2 with aqueous aerosol has a dependence on the HO2 concentration as well as the aerosol pH, which is based on the formulation of Thornton et al. (2008). For average HUMPPA-COPEC conditions a value for the uptake coefficient (γ) between 10−3 and 10−4 is estimated. In combination with Eq. (2), and for HO2 molecule cm−3 (≈20 pptv), this results in a loss rate for HO2 of molecule cm−3 s−1, which is insignificant compared to HO2 loss rates via its self-reaction (1.5×10⁶ molecule cm−3 s−1) and reaction with NO (1.2×10⁷ molecule cm−3 s−1 with NO = 100 pptv) close to midday. Heterogeneous losses of HO2 were therefore not included in the model.
The rate of CH3C(O)O2 formation in the model is determined by the rate of oxidation or photolysis of its organic precursors, including the oxidation of CH3CHO via reaction with OH:
As we describe later, this reaction alone was not sufficient to describe the formation of PAA at the levels observed and the model was augmented with other CH3C(O)O2 sources such as the degradation of photolabile carbonyl species. Tying CH3C(O)O2 production rates to the levels of oxidised VOCs as measured by the PTRMS was found to be especially important during biomass-burning-influenced periods in which VOCs (e.g. propane, butane) and OVOCs (e.g. CH3CHO, CH3C(O)OH, CH3OH) were also greatly enhanced.
Finally, in order to test potential radical sources leading to enhanced HOx concentrations at night-time, formation and reactions of the NO3 radical were implemented in a simplified manner (see Table S1) as was the formation of OH via ozonolysis of alkenes.
3.2.2 Model production of H2O2 and PAA
PAN, PAA and H2O2 are NOx dependent, stable products of HOx, ROx and NOx interactions. The goal of the modelling study is to examine whether their measurement can provide insight into the HOx budget in the boreal environment by adapting a reaction scheme to match the observed mixing ratio of H2O2 and PAA over chemically different periods of the campaign. H2O2 was generated in the model via the HO2 self-reaction, the rate constant of which displays a complex dependence on temperature, pressure and humidity (IUPAC, 2018). The rate coefficient during the campaign varied between 4.3 and cm3 molecule−1 s−1. We also include H2O2 formation from the ozonolysis of terpenes.
Model PAA was generated only in the reaction between HO2 and CH3C(O)O2 radicals described above. PAA and H2O2 may be lost via photolysis, reaction with OH, dry deposition and uptake to aerosol. As described in Sect. 3.1 for PAA the first-order loss-rate constant for heterogeneous reaction of H2O2 with aerosol particles can be calculated from expression (2) using cm s−1, cm2 cm−3 and (Wu et al., 2015), resulting in s−1. As concluded for PAA, loss of gas-phase H2O2 via uptake to aerosol is insignificant compared to dry deposition.
3.2.3 Dry deposition
Depositional loss of PAA and H2O2 was simulated in the model using time-dependent first-order loss-rate constants that were derived assuming a sinusoidal variation of the boundary layer height during HUMPPA between ∼1400 m during the day and ∼200 m at night (Ouwersloot et al., 2012), which was matched in phase to the average, diel temperature during the campaign. Deposition rate constants were calculated from deposition velocities from the literature scaled to the observed loss rate of PAA and H2O2 at night (see Sect. 3). For H2O2, the data from Hall and Claiborn (1997) were used. Their values are chosen as they are expected to be most relevant for the boreal tree type and forested environment but are still in broad agreement with other data sets for H2O2 deposition (Stickler et al., 2007). Following Nguyen et al. (2015), the daytime deposition of PAA was modelled to be 50 % of H2O2, with the same variation over the diel cycle. The diel cycle of the deposition velocities for PAA and H2O2 are displayed in Fig. S2.
3.3 Box model results
The constrained model, with the photochemical sources of radicals described in Sect. 3.2.1, significantly underestimated the observations of H2O2 and PAA, especially during the biomass-burning episodes. Addition of an extra source of CH3C(O)O2 in the reaction of OH with OVOC (at 30 % branching ratio) was found to not help as even small increases (less than a factor of 2) in the modelled concentration of PAA could only be achieved at the cost of reducing the OH, HO2 and thus H2O2 concentrations significantly below the measurements. This is readily understood as PAA is an effective sink of HOx for this low NOx environment.
The PAA production rate was therefore enhanced by introducing a CH3C(O)O2 production term that does not require initiation by reaction with OH, i.e. photolysis of a precursor trace gas, which results in CH3CO release. Acetone (CH3C(O)CH3) was present at mixing ratios of up to 10 ppbv during the periods impacted by biomass burning, yet its slow photolysis (lifetime of months) means that it is not a significant source of CH3C(O)O2 in the boundary layer. In contrast, dicarbonyls such as methylglyoxal (CH3C(O)CHO), pyruvic acid (CH3C(O)C(O)OH) or biacetyl (CH3C(O)C(O)CH3) have absorption spectra that extend beyond 400 nm, are rapidly photolysed and may represent an efficient source of CH3C(O)O2 and HO2 if present at sufficient concentrations.
Addition of short-lived hydrocarbons including methylglyoxal has been found to increase CH3C(O)O2 radical production rates in models of biomass-burning plumes (Fischer et al., 2014) and to dramatically increase PAN production rates in a global model (Ito et al., 2007).
Methylglyoxal is formed at high yield from the OH-initiated oxidation of several biogenic (especially isoprene) and anthropogenic VOCs, e.g. via degradation of aromatic hydrocarbons (Arey et al., 2009; Obermeyer et al., 2009) and is found in biomass-burning-impacted air masses (Fu et al., 2008; Akagi et al., 2011; Stockwell et al., 2015) and those influenced by urban emissions of aromatics (Liu et al., 2010). It is also formed at yields of several percent from the ozonolysis of monoterpenes such as α-Pinene and Δ3-carene (Yu et al., 1998; Fick et al., 2003), which were both present at high concentrations during HUMPPA-COPEC-2010. Model estimates of PAN formation suggest that, on a global scale, 30 % of the acetyl peroxy radical generation is the result of methylglyoxal degradation, with 44 % arising via CH3CHO oxidation by OH (Fischer et al., 2014).
Biacetyl is formed in the photo-oxidation of aromatic hydrocarbons in the presence of NOx (Atkinson et al., 1980; Arey et al., 2009; Obermeyer et al., 2009) and is also expected to be present in biomass-burning-impacted air masses. The proposed intermediacy of dicarbonyls such as methylglyoxal and biacetyl in forming PAA in this study is consistent with the dominant role for di- and trialkyl benzenes in PAA formation found by Zhang et al. (2010). Pyruvic acid is formed in the gas-phase degradation of biogenic and anthropogenic hydrocarbons and has been observed at mixing ratios of hundreds of pptv (Andreae et al., 1987; Jacob and Wofsy, 1988; Talbot et al., 1995; Veres et al., 2011). As a precursor in the biosynthesis of terpenoids, pyruvic acid can be directly emitted by vegetation resulting in very large mixing ratios (several ppbv) in a non-oxidative environment (Jardine et al., 2010). It is also found in secondary organic aerosol and may be formed in the aqueous-phase reaction of methylglyoxal (Tan et al., 2012). In a recent campaign (Liebmann et al., 2018) at the Hyytiälä site, our iodide CIMS instrument monitored large signals at 87, which we assigned to the CH3C(O) ion from pyruvic acid. Post-campaign calibration of the CIMS resulted in mixing ratios of several hundred pptv, which were correlated with other biogenic trace gases. We thus have direct evidence of pyruvic acid at this site, albeit in the autumn (when emissions are likely to be weaker) rather than in the summer.
A further, short-lived dicarbonyl that is formed in the OH and O3-initiated degradation of several VOCs including alkenes, acetylene and aromatics (Calvert et al., 2000; Volkamer et al., 2001; Calvert et al., 2002) and which is present in biomass burning (Fu et al., 2008) is glyoxal (HC(O)C(O)H). It is also formed at high yield (via glycol aldehyde) in the OH oxidation of methyl butenol (Atkinson and Arey, 2003a), emitted by pine trees and is therefore of relevance for the HUMPPA-COPEC campaign. The photolysis of glyoxal is efficient (lifetimes at noon of ∼4 h) and results in formation of two HO2 radicals:
In the absence of direct measurements, indications of the presence of biacetyl and methylglyoxal were sought in the PTR-MS data set. Strong increases in mixing ratio at and were observed, which would correspond to protonated methylglyoxal and biacetyl, respectively. Indeed, most monitored PTR-MS masses displayed similar trends, with strong increases during the biomass-burning-impacted periods. Campaign time series for selected masses are shown in the Supplement (Fig. S1).
For , a peak mixing ratio of ≈0.8 ppbv was observed during the first biomass-burning event (days 206–212). At the same time a peak value of 0.5 ppbv was reported for mass 87. The PTRMS signal at mass 73 is usually considered to be methyl ethyl ketone (de Gouw and Warneke, 2007; Blake et al., 2009; Yáñez-Serrano et al., 2016), a product of butane degradation. N-butane was enhanced during the biomass-burning periods and correlated with , so that a significant (or dominant) contribution of methyl ethyl ketone to this mass is probable.
The PTRMS mass 87 (peaking at mixing ratios of 0.5 ppb during the biomass-burning-impacted periods) is usually assigned to 2-methyl-3-buten-2-ol (MBO) which is emitted from coniferous trees (Schade et al., 2000) but may have contribution from several trace gases including C5-carbonyls, butadione and methacrylic acid (de Gouw and Warneke, 2007; Blake et al., 2009; Müller et al., 2016). We are not aware that biacetyl has been reported at this mass.
Previous measurements of methylglyoxal and glyoxal in rural locations have revealed mixing ratios up to a few hundred pptv (see Fu, 2008 for a summary) which were correlated with those of HCHO (Lee et al., 1995) or CO (Spaulding et al., 2003) and which had mixed biogenic and anthropogenic sources. Greatly elevated concentrations of methylglyoxal (> 900 pptv) and glyoxal (> 500 pptv) have been observed in biomass-burning-impacted air masses in a rural environment (Kawamura et al., 2013). Even at levels below 100 pptv, methylglyoxal was found to contribute significantly to CH3C(O)O2 radical production (Lee et al., 1995). We note that the PTR-MS is insensitive to glyoxal due to instability of the protonated parent ion at (Stoenner et al., 2017), which is dominated by acetone.
The potential impact of dicarbonyls on the HOx and CH3C(O)O2 budget was investigated by incorporating methylglyoxal, biacetyl, glyoxal and pyruvic acid into the model with the concentrations of the first three dicarbonyls constrained by a correlation factor with CH3CHO. Mixing ratios of pyruvic acid at this site (in autumn) have been found to be correlated with (and at similar concentration to) those of directly emitted biogenics and its concentration was arbitrarily set equal to that of the summed terpenes.
The ratios of CH3CHO to methylglyoxal, biacetyl and glyoxal were varied to optimise the simulation of the measured PAA and H2O2 mixing ratios and resulted in maximum concentrations of methylglyoxal, glyoxal and biacetyl in the model of approximately 0.75, 0.15 and 1.3 ppbv, respectively, which were present during the peak of the biomass-burning-impacted episodes (when CH3CHO levels were largest). The relative mixing ratios of dicarbonyls is not important for the model result; i.e. a reduction in the methylglyoxal mixing ratio would result in a decrease in both CH3C(O)O2 and HO2 radical production, which could be balanced by an increase in pyruvic acid (with also generates one of each radical) or by an increase in both biacetyl and glyoxal, scaled by the relative J values. Based on preferred experimental absorption spectra and quantum yields (IUPAC, 2018), the photolysis rates of pyruvic acid, glyoxal, methylglyoxal and biacetyl were modelled as factors (J-dicarbonyl/J-NO2) of 0.033, 0.0076, 0.019 and 0.033. We note that large differences in experimental results (see IUPAC, 2018 for a summary) and in the preferred values of evaluation panels (Burkholder et al., 2015; IUPAC, 2018) indicate that the J values of the dicarbonyls are associated with significant uncertainties. For biacetyl, the factor used, 0.033, is consistent with observations in an environmental chamber (Klotz et al., 2001) where a value of J-dicarbonyl/J-NO2 = 0.036 was reported.
The incorporation of dicarbonyls into the model has the anticipated effect of increasing acetylperoxy and HO2 production rates and thus levels of PAA, especially during the biomass-burning-impacted periods. As seen in Fig. 7, the model does a reasonable job of reproducing both PAA and H2O2. Especially encouraging is the good model–measurement agreement in the period between days 204 and 209, in which PAA levels increased by an order of magnitude and which were accompanied by large increases in H2O2 and the generally good agreement with OH measurements. The measurement–model agreement is further exemplified in Fig. 8, which plots the diel profiles of PAA and H2O2 and OH and the comparison with the model output for the same time period. Considering that we use a diel cycle for the deposition term that is unchanged for the whole campaign (i.e. does not vary with relative humidity, wind speed, rates of turbulent mixing, etc.) and thus does not reflect any variation in the meteorological situation at the site, the agreement for H2O2 and PAA is very good. Within the observed variability and considering the experimental uncertainty in the measurements, the model captures the average variation of each trace gas across the diel cycle. It is also noteworthy that the model captures the non-zero OH levels at night-time as well as the noontime maximum values. This contrasts with the conclusions of Hens et al. (2014), who also modelled the reaction of ozone with biogenics (but using speciated terpenes from GC measurements) and were unable to generate and sustain sufficient OH at night-time to match the observations. Although the difference may be partially related to our use of PTRMS-measured terpenes and an average yield of OH based on the latest recommendations for individual terpenes, the main effect is the night-time recycling of HO2 and OH via reactions of peroxy radicals formed from OH generated in ozonolysis reactions. Given the high OH reactivities measured during the HUMPPA-COPEC-2010 campaign, the fate of most OH radicals formed at night-time will be reaction with terpenes and other VOCs to form . At night-time, in the absence of NO, the main fates of peroxy radicals are reaction with HO2 and self-reaction. In the model, the reaction of with HO2 forms ROOH (80 %) with a minor (20 %) reaction pathway forming OH as observed in laboratory studies (at yields of 10 %–60 %) for several substituted oxidised organic peroxy radicals (Dillon and Crowley, 2008; Jenkin et al., 2010; Groß et al., 2014).
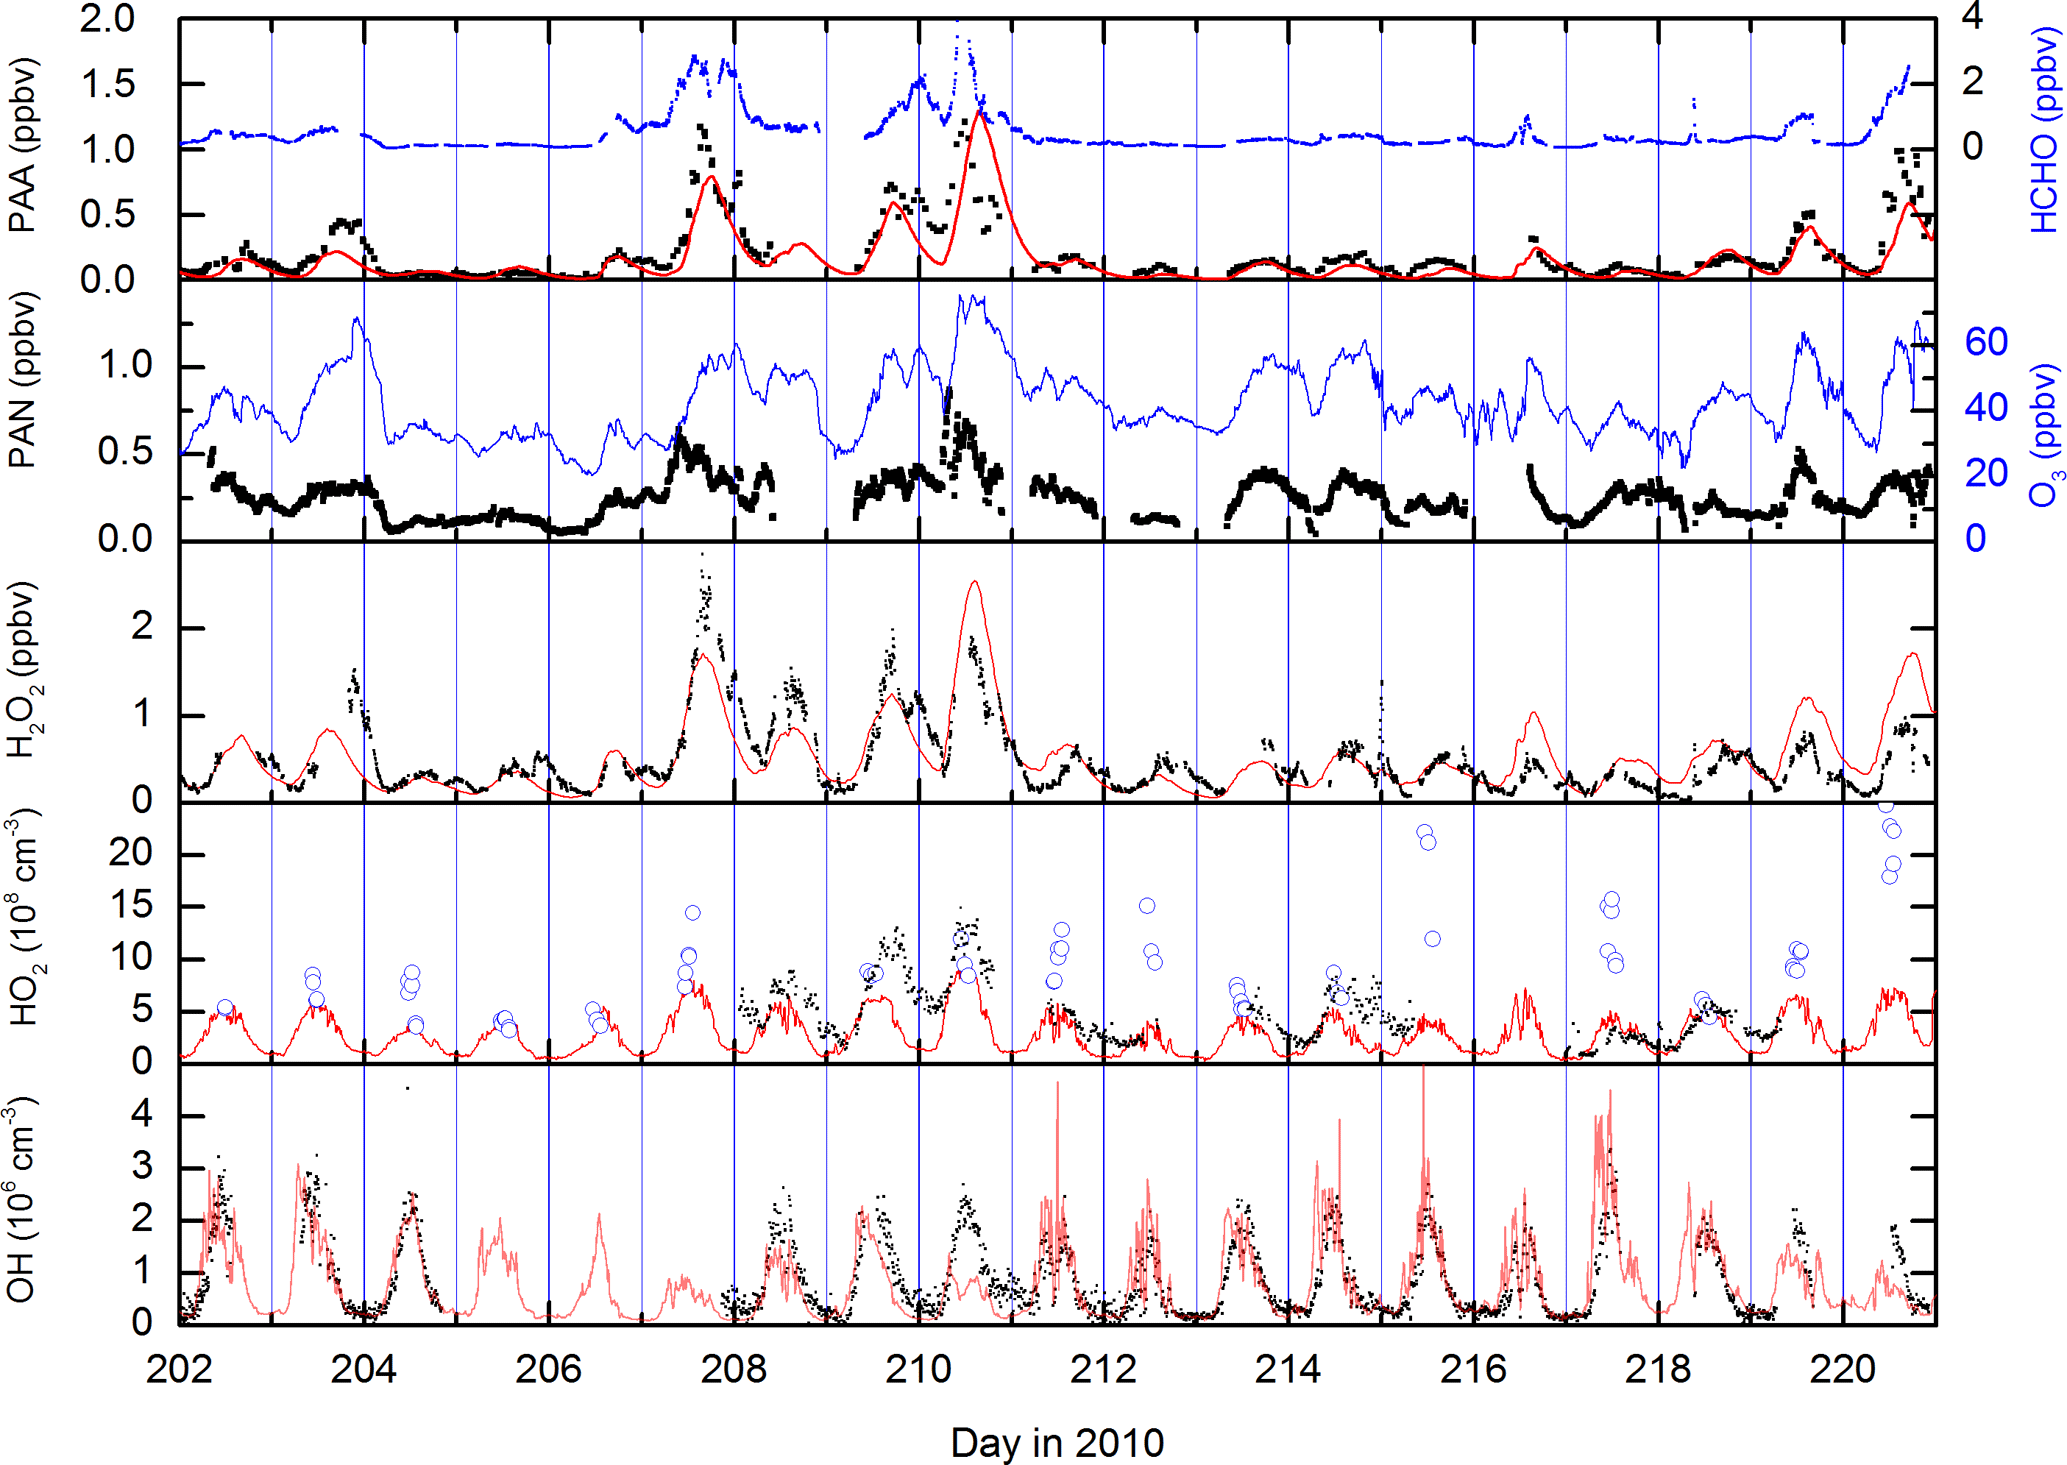
Figure 7Measurements (black and blue data points) and model (red lines). The OH data set displayed is from CIMS measurements at ground level and has been adjusted to match levels observed at canopy height (see supplementary information and Hens et al., 2014). The open violet circles are HO2 concentrations calculated from the PAN-to-PAA ratio and the steady-state expression (Eq. 4) presented in Sect. 3.1.
The self-reaction of is modelled to form HO2 (via the degradation of the alkoxy radicals formed in the first step) so that non-zero concentrations of HO2 and are predicted to be present at night. The modelled HO2 and concentrations are displayed in Fig. 9a. The initially surprising result is that radicals are present at night at concentrations that are comparable to, or even exceed, those predicted for the daytime. This reflects the weak sinks of at night-time (owing to the absence of NO), rather than high rates of production. The diel cycles of (Fig. 9d) and HO2 (Fig. 9c) are very different. Whereas the HO2 concentration is defined by its photochemical production, with a maximum coinciding with the maximum of the actinic flux and low concentrations at night, that of shows two distinct, broad maxima, one at noon and one at midnight, both at concentrations of molecule cm−3 (≈20 pptv). The modelled -to-HO2 ratio is ≈1 at 12:00 UTC, increasing to ≈5 at midnight. This is consistent with the box model result of Hens et al. (2014), who report RO2-to-HO2 ratios of between 0.5 and 4.5.
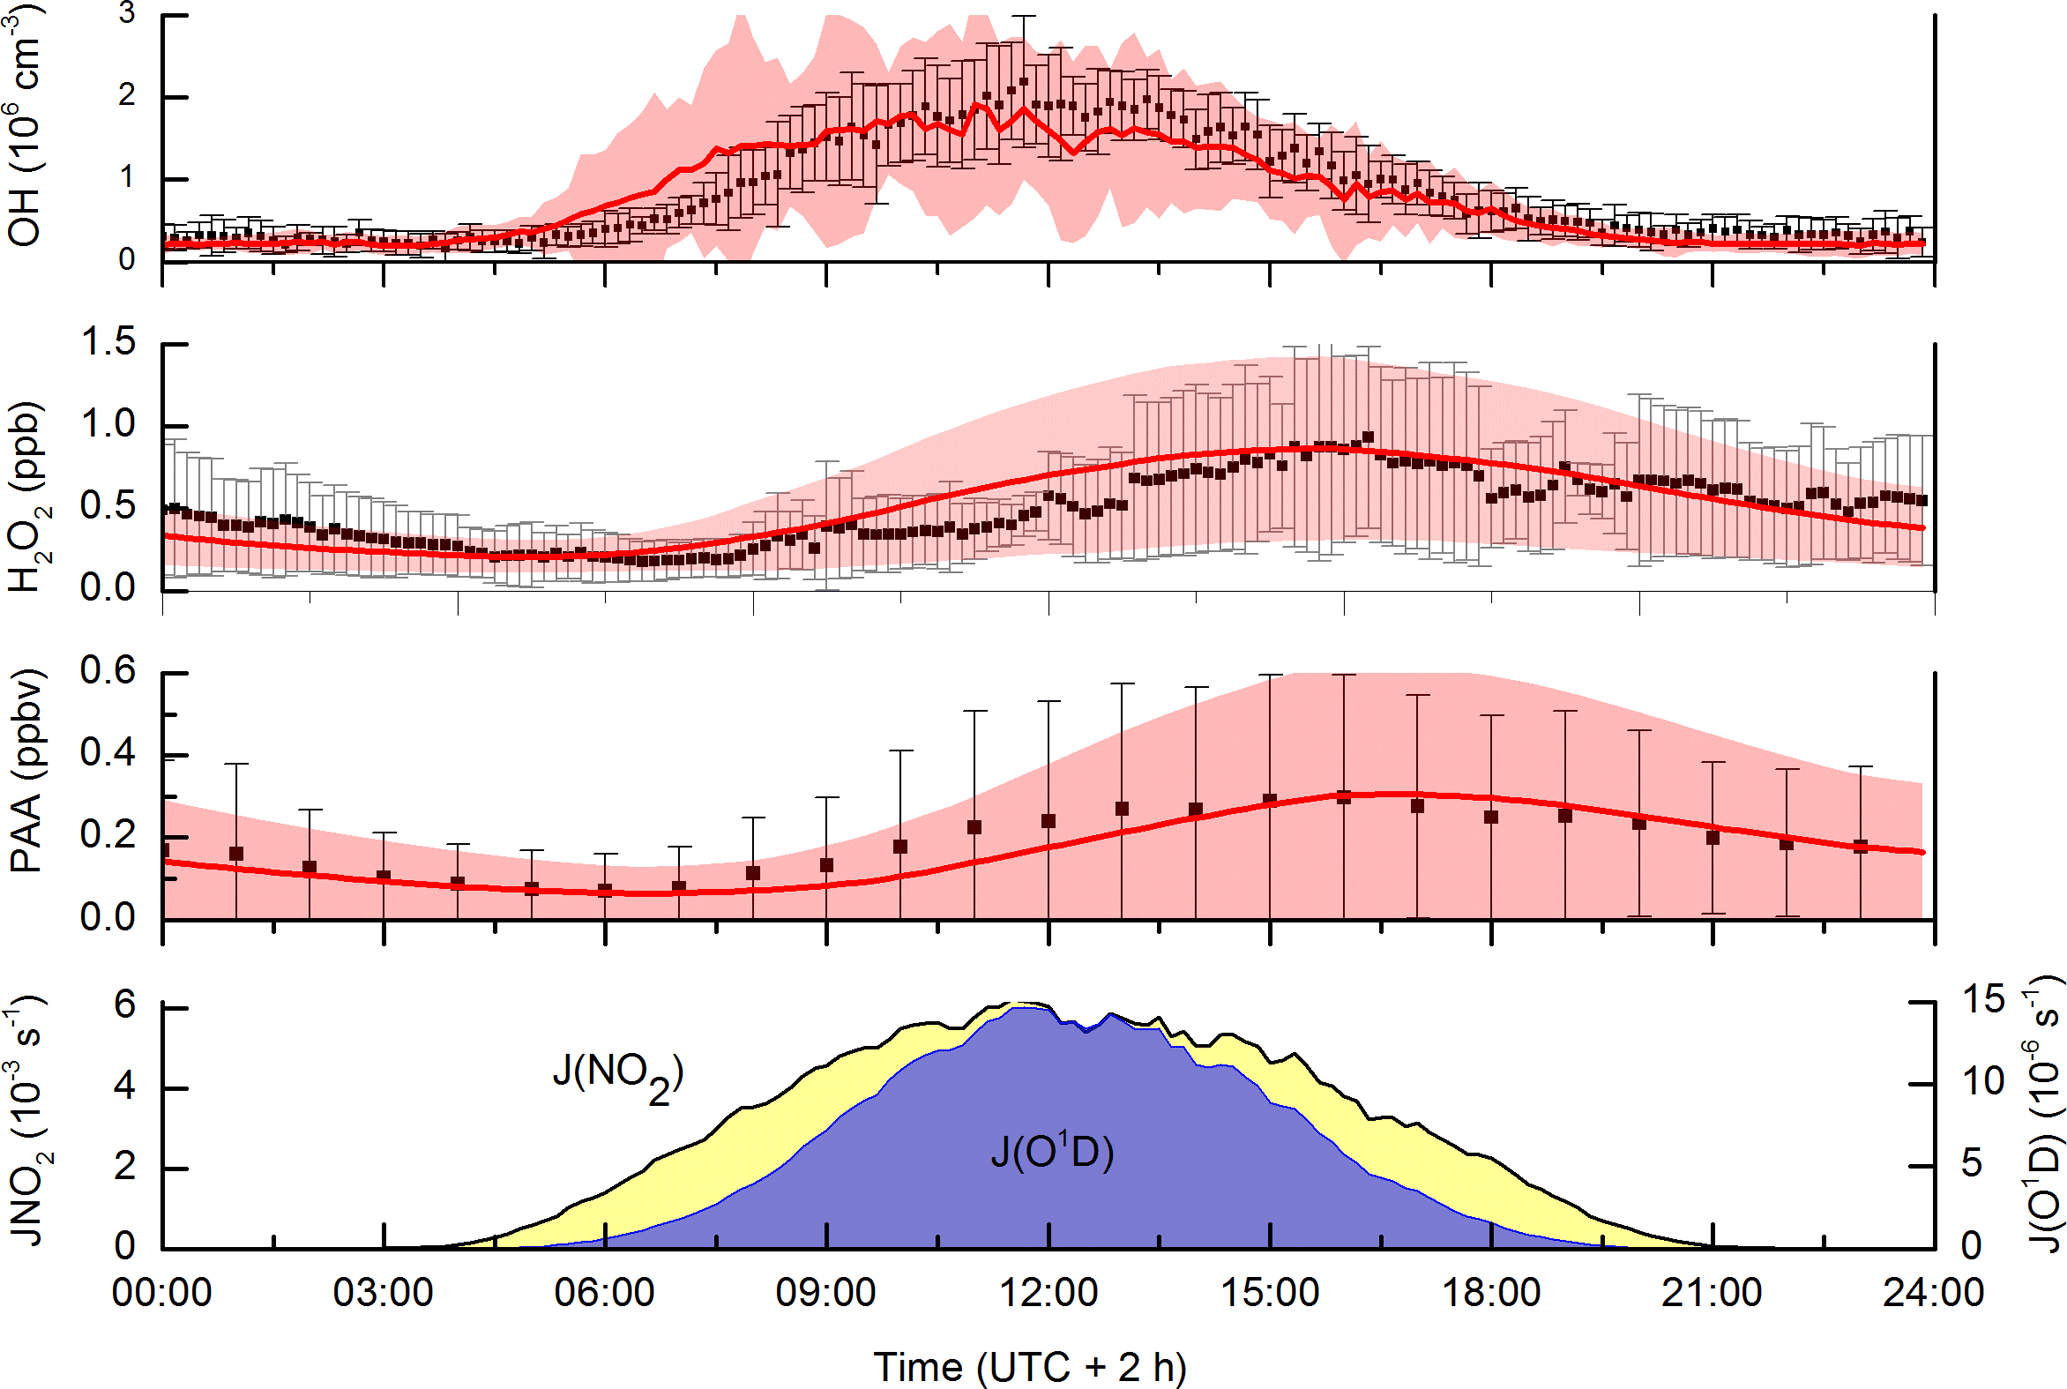
Figure 8Campaign-averaged (days 202 to 220) diel profiles of OH, PAA and H2O2. Measurements are black data points, error bars are 1σ variability. Model results are the red lines with the shaded area representing 1σ variability. The diel-averaged photolysis rate constants of NO2 and O(1D) are displayed as indicators of photochemical activity.
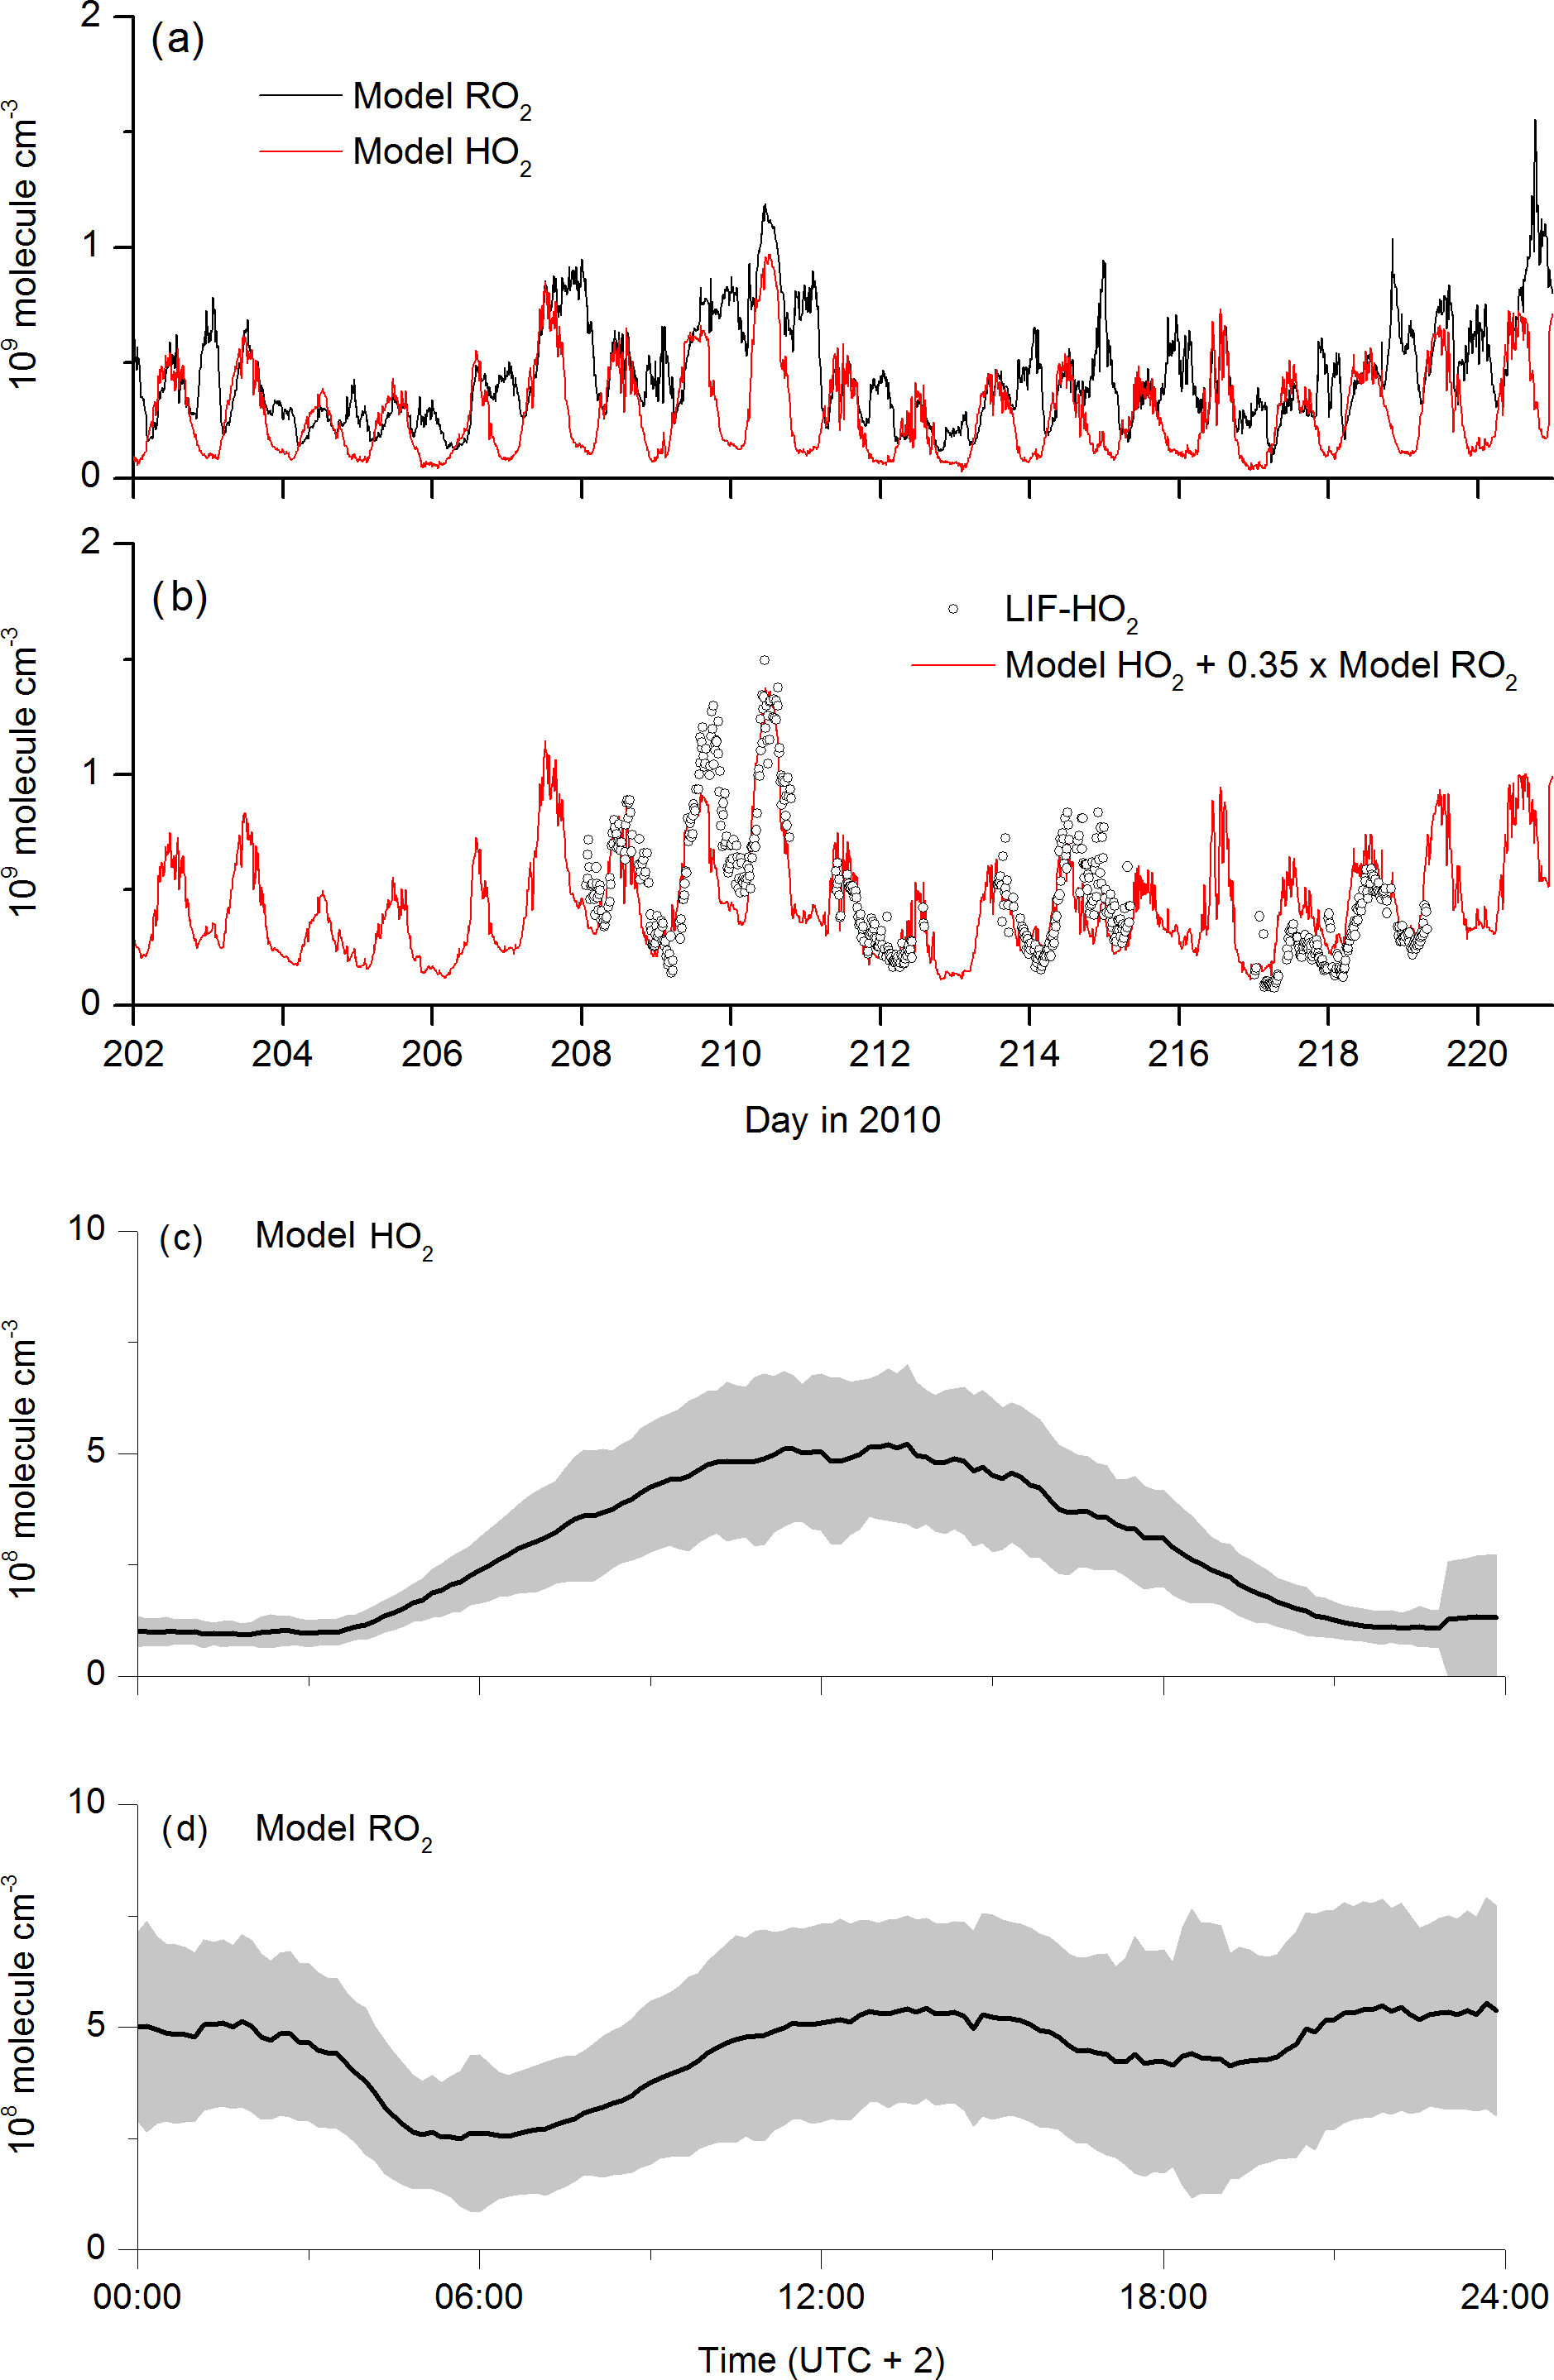
Figure 9Modelled HO2 and RO2 concentrations as time series (a) and campaign-averaged diel profiles (c, d). represents organic peroxy radicals formed in the OH-initiated degradation of OVOCs and terpenes. The red line in plot (b) is the sum of model HO2 concentration plus 0.35 times the model RO2 concentration.
production at night occurs via OH (formed via ozonolysis of alkenes and reaction of O3 with HO2) with OVOC and terpenes, the weak sinks enabling it to build up in concentration. The modelled, rapid depletion of at sunrise is a result of increasing NO concentrations, which is followed by a second maximum in the concentration at noon, resulting from photochemical generation of OH. Organic radicals have previously been observed at night-time in several locations and are often attributed to the O3-initiated oxidation of organics (Hu and Stedman, 1995; Cantrell et al., 1997; Reiner et al., 1997; Salisbury et al., 2001; Geyer et al., 2003; Emmerson and Carslaw, 2009; Sommariva et al., 2011; Andrés-Hernández et al., 2013). Night-time concentrations of ROx (HO2 + RO2 in molecule cm−3) of 5–7×10⁸ (Reiner et al., 1997), 1–2×10⁹ (Andrés-Hernández et al., 2013), (Geyer et al., 2003) and (Hu and Stedman, 1995) have been reported, which are consistent with the model results discussed here, albeit for chemically different locations. The double maximum in is also consistent with the data from Geyer et al. (2003), who observed a similar double maximum in ROx at noon and late evening.
Figure 7 indicates that the measured, midday values of LIF-HO2 are generally larger than modelled HO2 and that the diel variation in LIF-HO2 (including large night-time values) is incompatible with the modelled HO2 profile (red line). LIF-HO2 measurements taken during HUMPPA-COPEC-2010 are prone to interference from organic peroxy radicals (Fuchs et al., 2011, 2016; Lew et al., 2018) and the predicted presence of large concentrations of at night-time has important consequences for our interpretation of the LIF-HO2 data set. In Fig. 9b, we plot the LIF-HO2 concentrations along with modelled HO2 with a fractional contribution from (i.e. [HO2]model+0.35[RO2]model).
The result (red line) reproduces not only the high apparent night-time values of HO2 observed but also the non-linear dependence on actinic flux and the higher values during the episodes impacted by biomass burning. Assuming that the are detected as HO2 with an efficiency of 35 % thus reconciles measurement and model results and is consistent with detection efficiencies for longer chain organic peroxy radicals.
Figure 10 shows the modelled time series of , CH3O2 and CH3C(O)O2. The organic peroxy radicals formed from reaction of OH with OVOCs and terpenes () are most abundant, reflecting the fact that the OH reactivity in the model is dominated by these trace gases. CH3O2 is also present at high concentrations and Fig. S3 plots the time-dependent reactive flux through each of the reactions in the model that generate it. The dominant reactions are those of the CH3C(O)O2 radical, which reacts via formation of CH3C(O)O, which decarboxylates to form the CH3 radical and thus (via O2 addition) CH3O2. In comparison, the formation of CH3O2 via CH4 oxidation represents, on average, less than 10 % of the total.
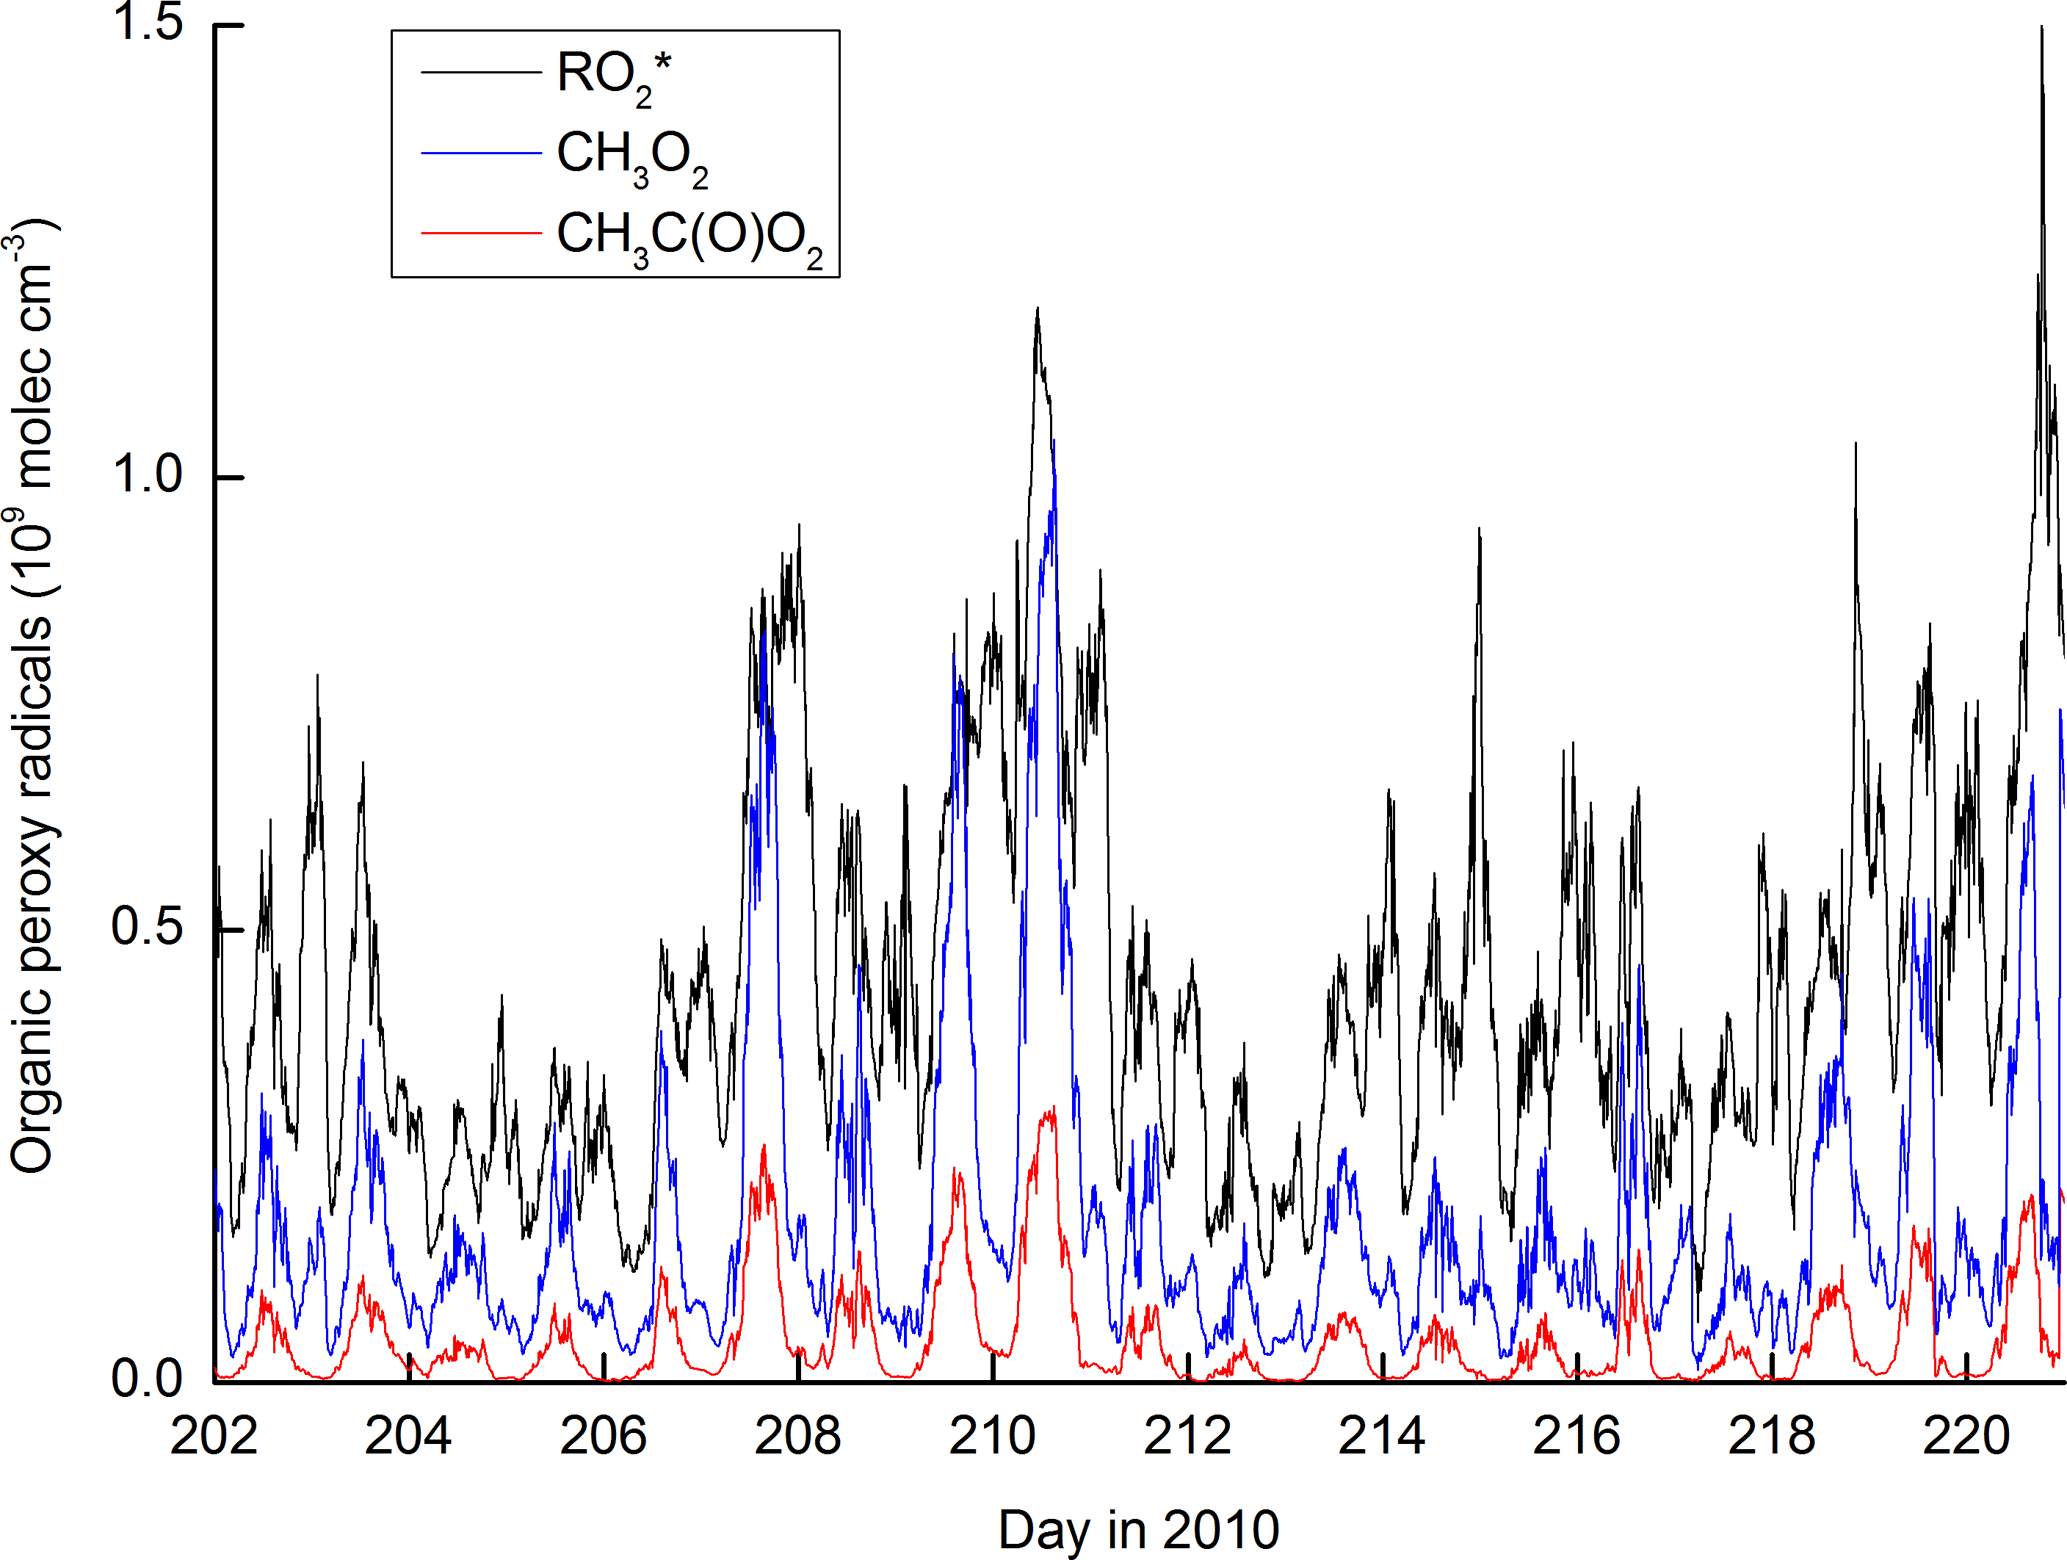
Figure 10Modelled organic peroxy radical concentrations. represents organic peroxy radicals formed in the OH-initiated degradation of OVOCs and terpenes.
Organic peroxides (ROOH) other than PAA are important indicators of coupling between organic peroxy radicals and HO2. The smallest member of the ROOH family is CH3OOH, formed in the reaction between CH3O2 and HO2:
Larger ROOH are also formed via the OH-initiated oxidation of VOCs (e.g. terpenes, C10H16) in air:
The conventional formation of ROOH, from reaction of the terpene-derived peroxy radical via reaction with HO2, may be augmented for some terpenes by auto-oxidation to also release OH and form a highly oxygenated molecule (HOM) that may partition substantially to the particle phase (Ehn et al., 2012).
Speciated organic peroxides were not measured during the campaign, but an indication of their levels was gained from the measurement of total organic peroxides (see Sect. 2), which is biased towards those which are soluble and will thus have a significant contribution from PAA. In Fig. 11 we plot (red line) the model-predicted time series of summed PAA and CH3OOH mixing ratios after taking into account their known collection efficiencies in the scrubber (∼90 % for PAA, 60 % for CH3OOH). Model CH3OOH is formed only in Reaction (R10) and the sources of the CH3O2 precursor are limited to the Reactions (R2c) and (R3), which both initially generate CH3CO2, which decomposes to CH3 and thus CH3O2 in the presence of O2 as well as Reaction (R14) and (R15):
The removal of CH3OOH in the model is mainly due to reaction with OH and dry deposition, the latter being set to 50 % of H2O2. Figure 11 reveals that the transition from low to high mixing ratios of CH3OOH during the pre- and post-biomass-burning periods is adequately reproduced in the model and, given the assumptions made above, agreement in terms of absolute concentrations is also satisfactory. The blue line in Fig. 11 was obtained by assuming that model-derived ROOH is also detected but with a reduced efficiency of 0.1. The modelled sum of PAA and CH3OOH is close to the measured sum of organic peroxides, indicating that these peroxides dominate the total organic peroxide measured by the instrument. Detection of other peroxides, even with low sensitivity (blue line), results in a model overprediction. This likely reflects the fact that model-generated ROOH are much less soluble than PAA or CH3OOH and thus only a small fraction is detected. Alternatively, peroxides with large, substituted organic groups (e.g. those formed from terpenes) are likely to partition to the aerosol phase.
Correlation diagrams (days 202 to 220) of measured versus modelled mixing ratios and concentrations of PAA, H2O2, ROOH, HO2 and OH are displayed in Fig. 12. The agreement between modelled and measured PAA, OH and H2O2 is generally good, with slopes that are within the error limits of the measurements, equivalent to one. The exception is LIF-HO2 (slope of 0.48), which is the result of an interference in the measurement as described above.
RO2 radicals may also be formed at night in the NO3-initiated oxidation of organics (Salisbury et al., 2001; Emmerson and Carslaw, 2009; Sommariva et al., 2011; Andrés-Hernández et al., 2013). NO3 is formed via the reaction between NO2 and O3 and in forested areas, in the absence of strong, local NO emissions, will be lost mainly via reaction with unsaturated hydrocarbons such as terpenes forming nitrated peroxy radicals (N-RO2):
Like other peroxy radicals these can react with NO or NO3 or HO2 eventually forming a variety of multifunctional, organic nitrates (Ng et al., 2017). The reaction with NO proceeds via an alkoxy radical, which, via reaction with O2, may also form HO2. As HO2 reacts with NO3 to form OH radicals, NO3 reactions can represent a night-time source of HOx radicals (Platt et al., 1990). However, due to the high concentrations of terpenes measured at night in HUMPPA-COPEC-2010 the steady-state concentration of NO3 was reduced to less than 1 pptv (Rinne et al., 2012) so that reaction with HO2 or RO2 will be reduced in importance. As PAN and thus CH3C(O)O2 are present at night, the reaction between HO2 and CH3C(O)O2 is also an efficient route to OH (Reaction R2c). In both scenarios, NO3 and CH3C(O)O2 can be considered to perform the same job as NO during the day: conversion of HO2 to OH. Model NO3 mixing ratios were less than 0.1 pptv, consistent with upper limits reported in previous NO3 measurements at this site (Rinne et al., 2012; Liebmann et al., 2018). In agreement with Hens et al. (2014) we find that NO3 reactions are an insignificant source of night-time HOx and RO2 during HUMPPA-COPEC-2010.
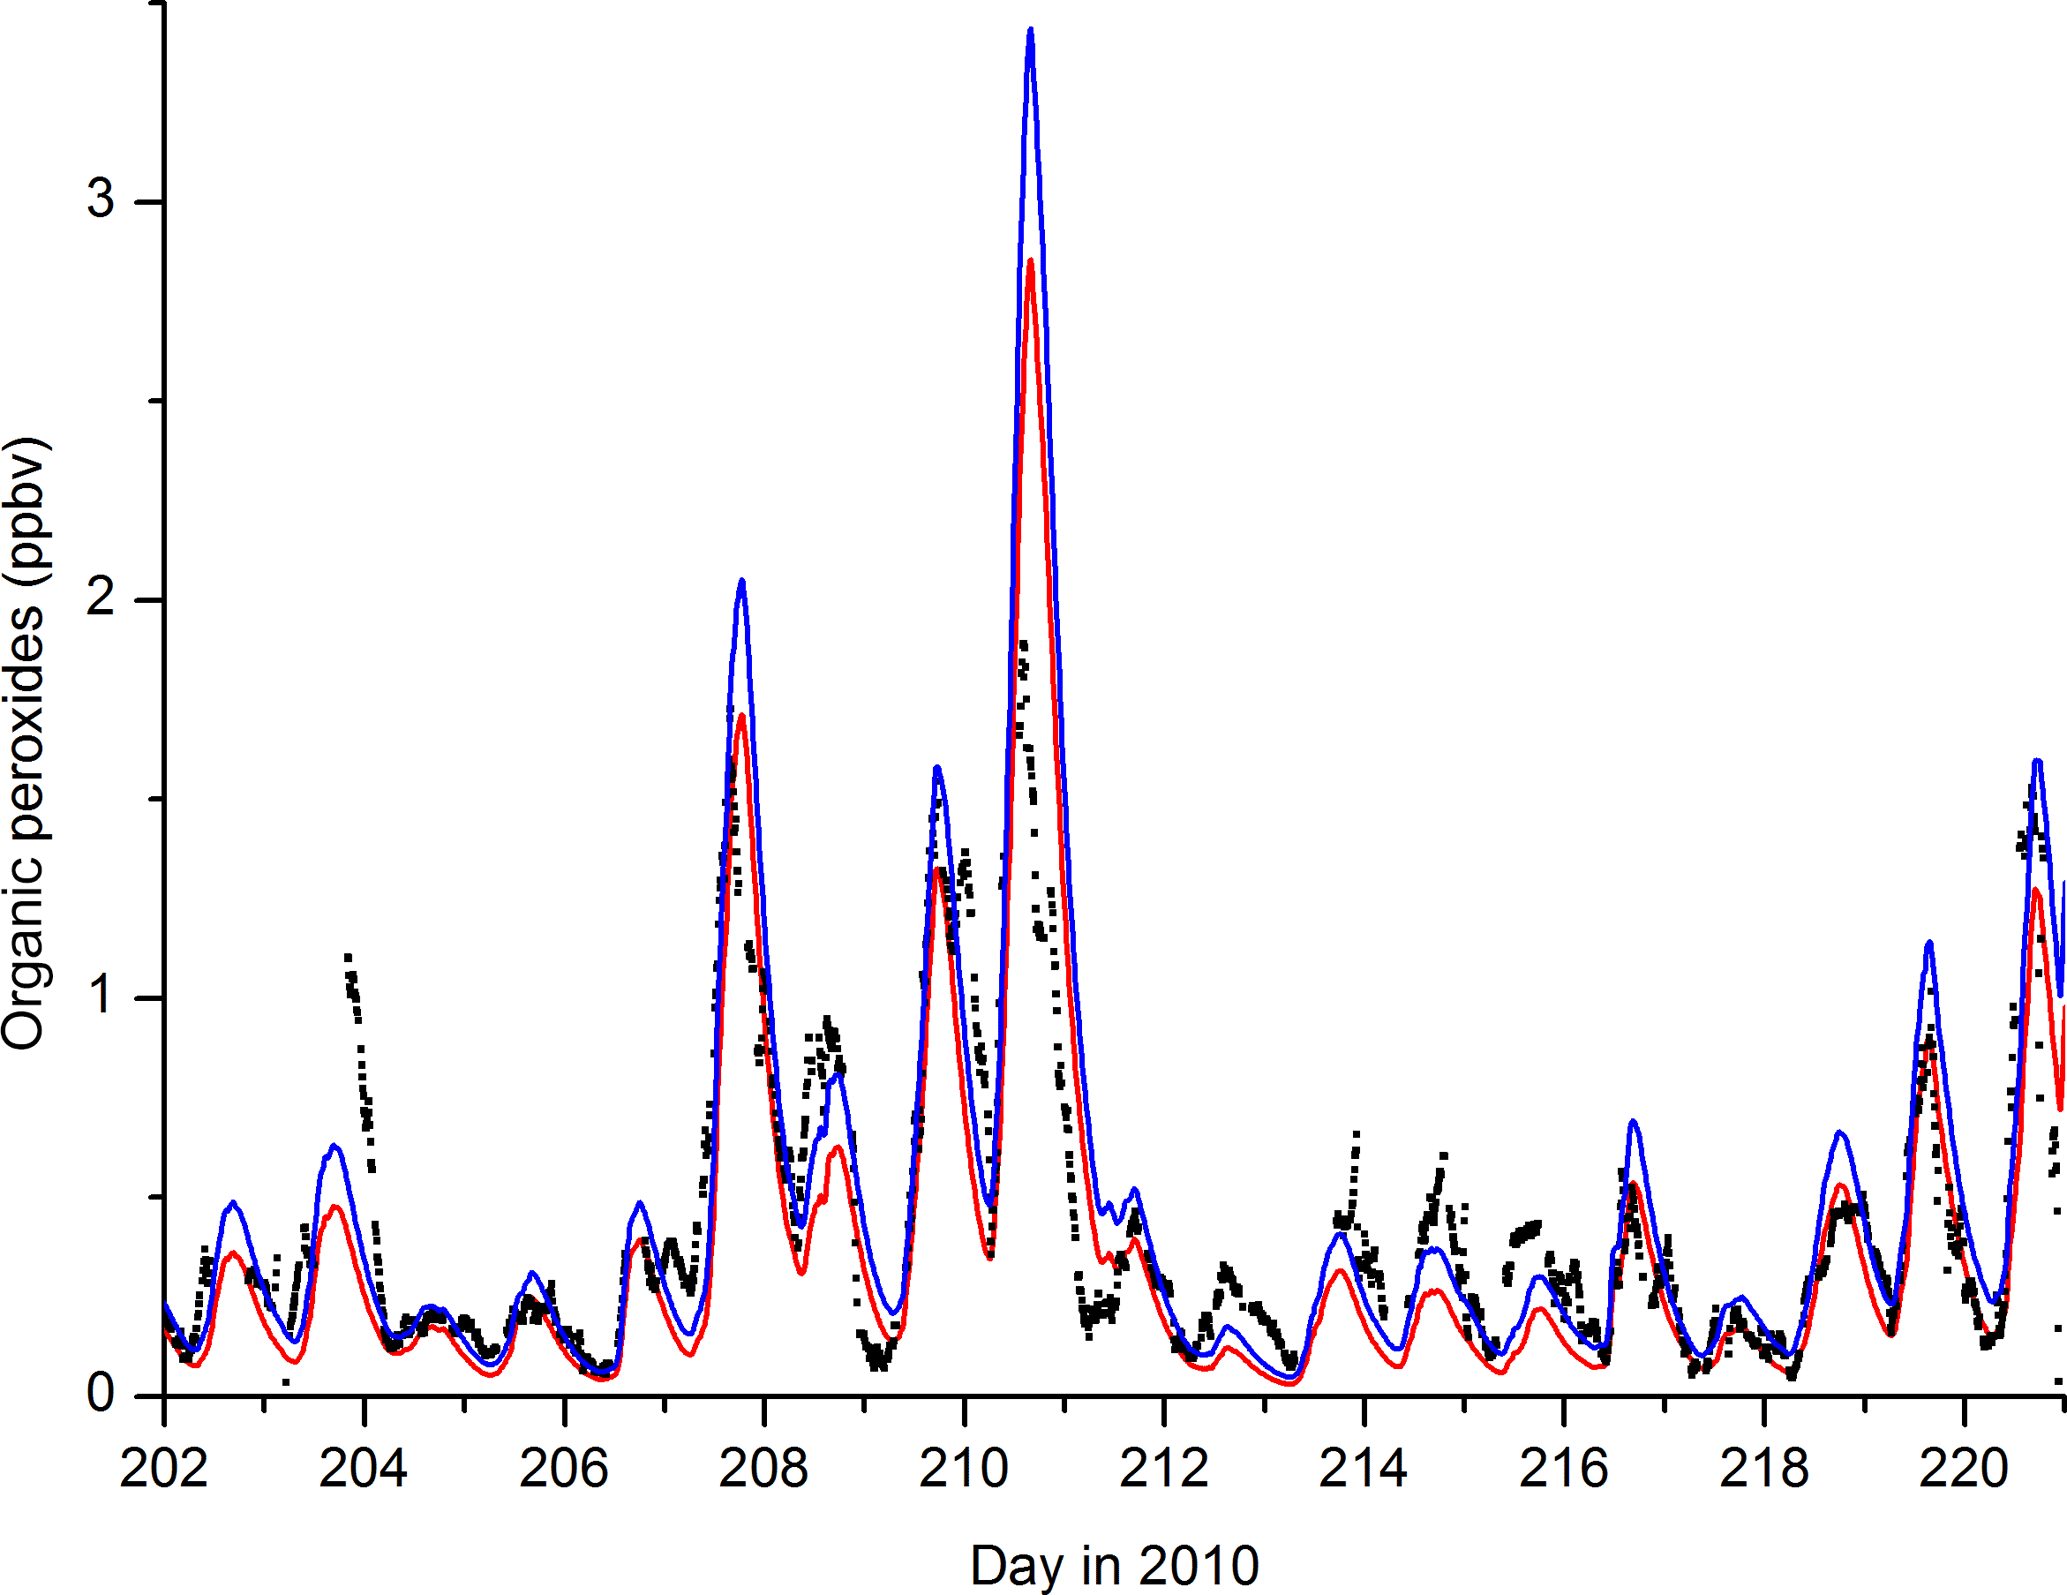
Figure 11Total organic peroxide measurement (black data points) and model results. The red line is the modelled sum of CH3OOH and PAA, the blue line includes a contribution (10 %) from model ROOH, which is formed from + HO2.
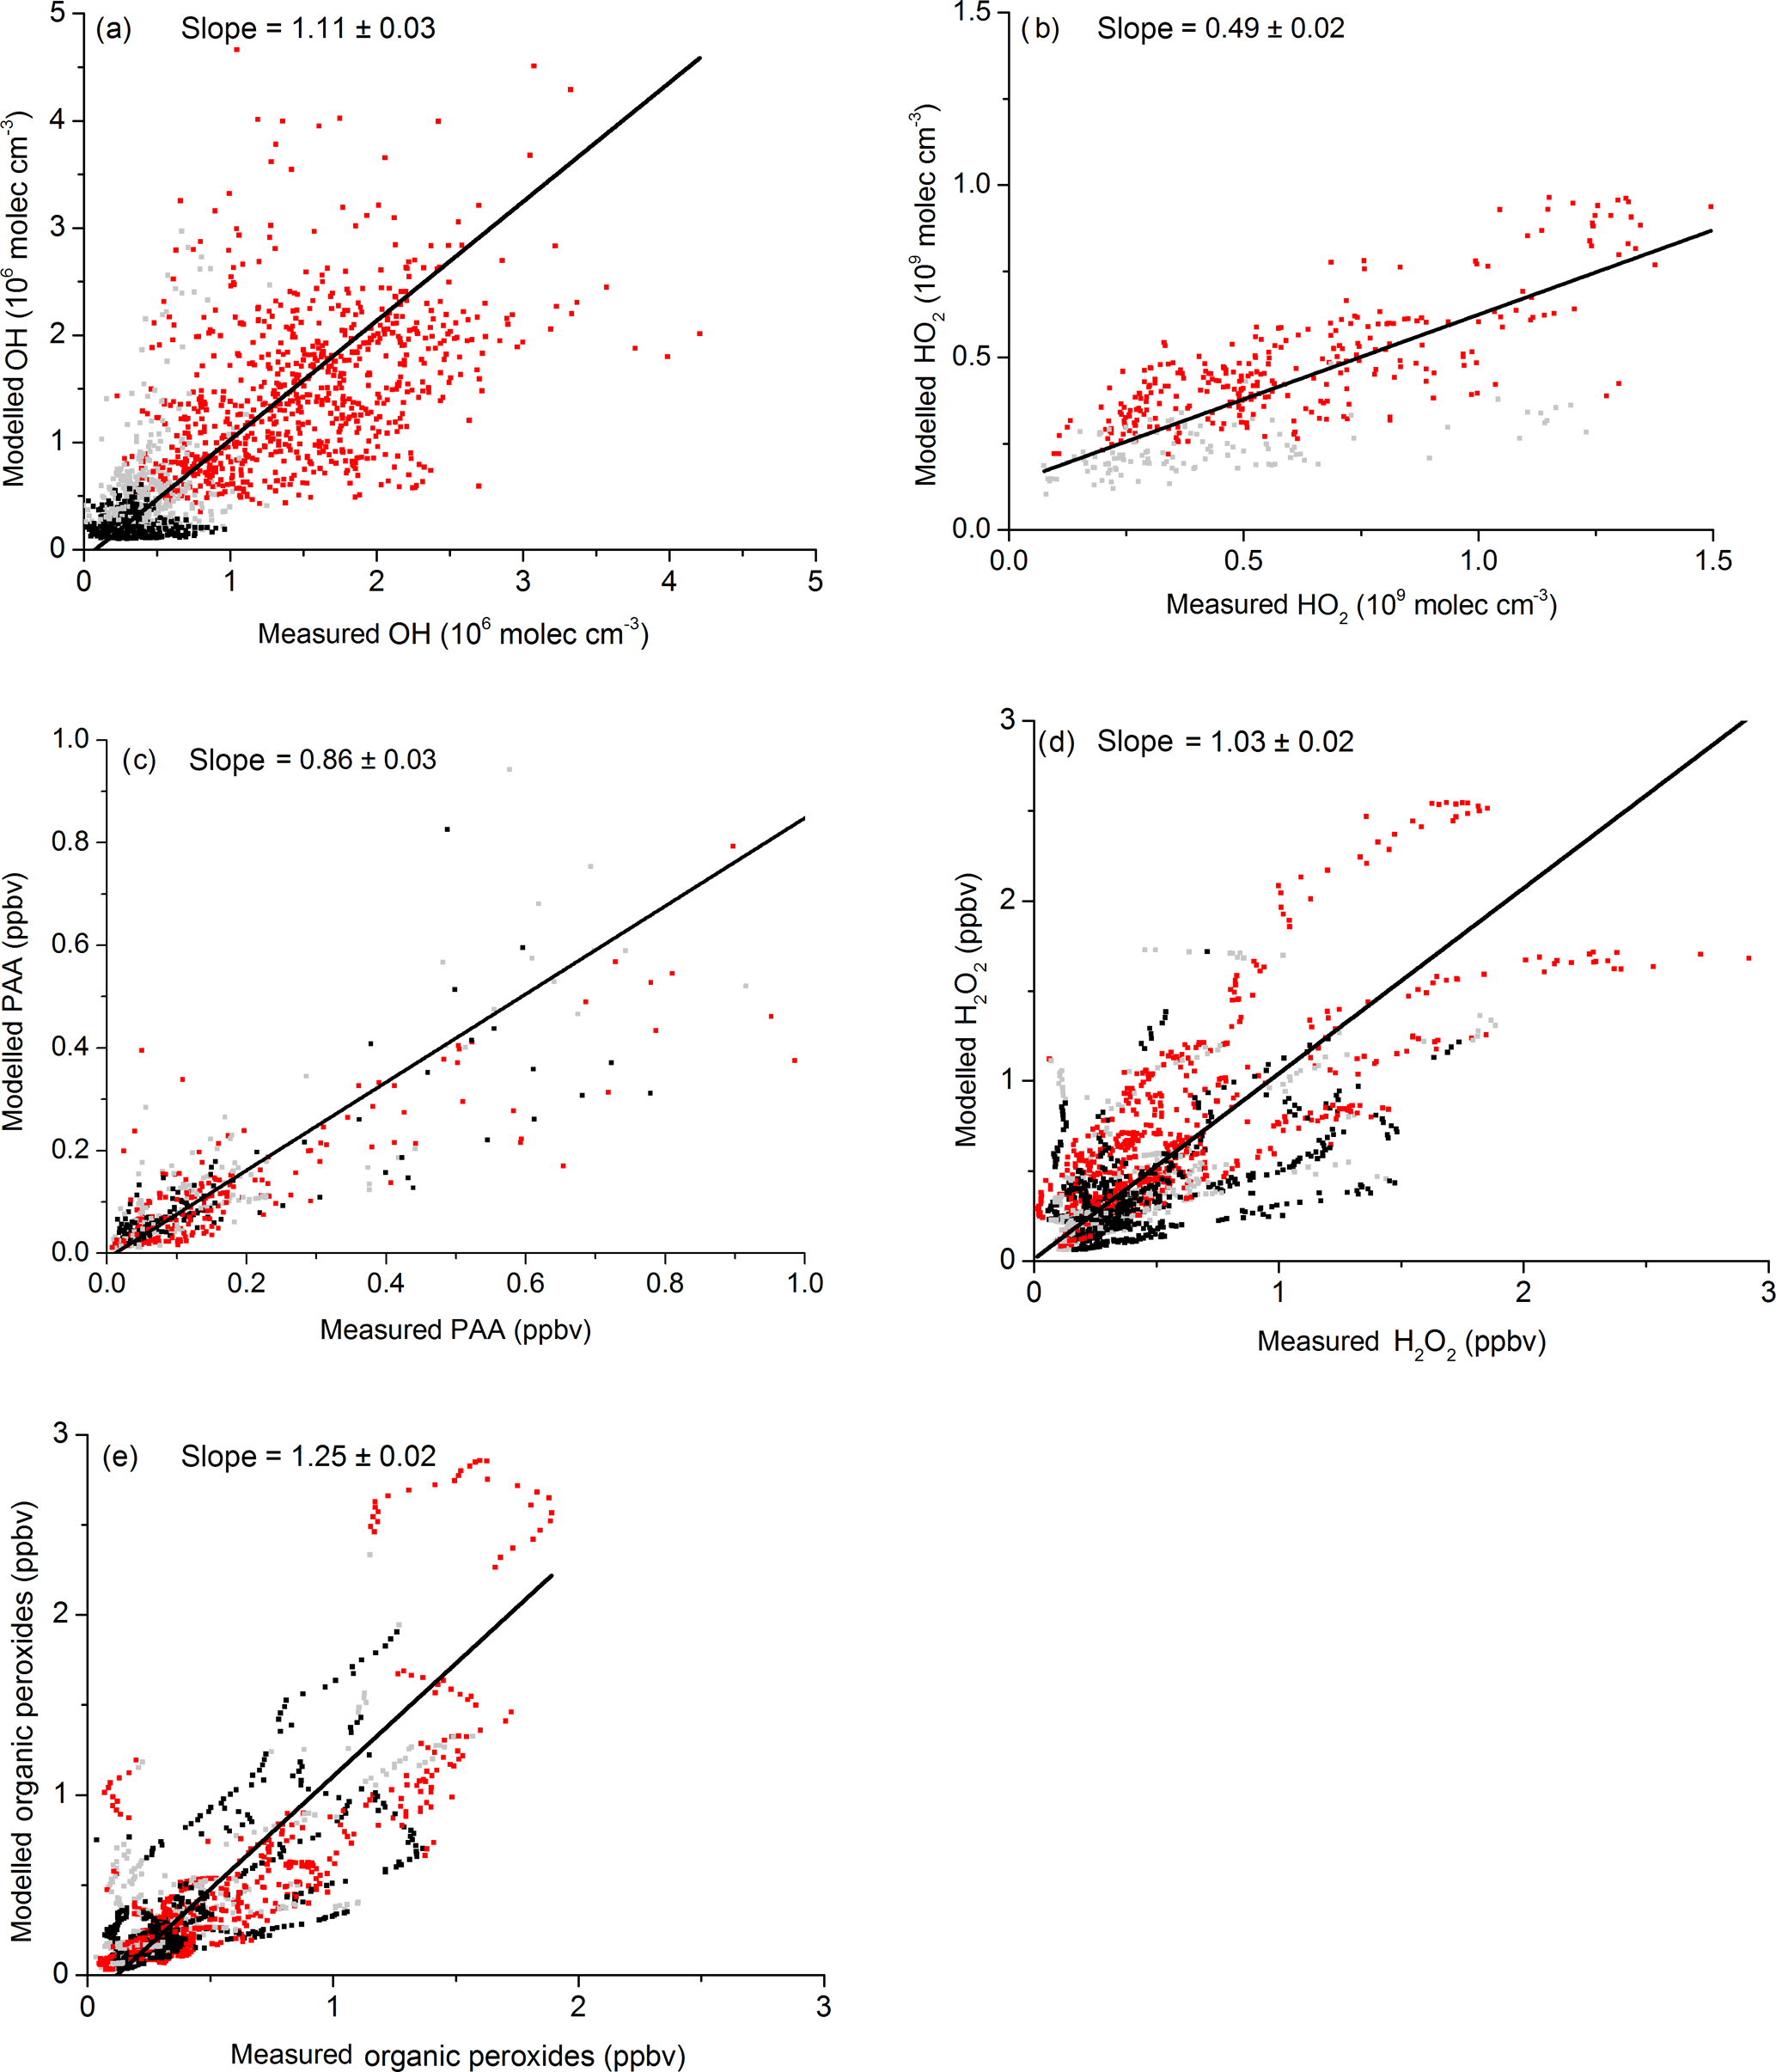
Figure 12Measurement versus model results for OH, HO2, (), H2O2, PAA and ROOH. Red data are daytime, black and grey are dusk and night-time. The fit lines account for uncertainty on both axes. Uncertainty is statistical (1σ).

Figure 13Modelled relative sources (throughout the diel cycle) of OH, HO2 and CH3C(O)O2 during HUMPPA-COPEC-2010 (days 202–220).
Our photochemical box model does not explicitly take into account the effect of early-morning entrainment of trace gases such as H2O2 and PAA from the residual layer. We have examined the potential effect of entraining H2O2 by simulating its down-mixing from higher (above canopy) levels that are likely to be richer in H2O2 due to the absence of dry deposition in air masses disconnected from the ground. Entrainment of H2O2 from the residual layer would increase its canopy level mixing ratio in the morning when ground heating results in mixing of the boundary layer and the overlying layers. The point at which entrainment starts each morning was defined by the time at which the trend in temperature at 16.8 m (close to canopy top) switched from negative to positive. This was usually between about 05:00 and 06:00 UTC, but is variable owing to variable cloud cover. The concentration of H2O2 in the upper layers was taken to be same as that modelled for the previous afternoon at 16:00 when insolation weakens and the residual layer starts forming. The effect of entrainment was coded in the model by allowing a proxy for H2O2 (at the H2O2 concentration from the previous afternoon) to decay to form H2O2 at a constant rate until the temperature at canopy top stopped increasing (usually over a period of ≈6 h) and the boundary layer was well mixed. The effect of the modelled entrainment was to skew the diel profile of H2O2 to larger pre-noon values and away from the average trend observed. While it is clear that entrainment from higher layers can increase pre-noon mixing ratios, it appears that this effect is much weaker than the photochemical formation of H2O2 during this campaign.
3.3.1 Model sensitivity to PAA losses
Due to lack of experimental data, there is some uncertainty associated with the physical constants describing the main loss processes for PAA and the preferred value of the rate constant for its reaction with OH carries an uncertainty of a factor of 2 (IUPAC, 2018). The night-time loss-rate constants for H2O2 and PAA were derived from measurements but the daytime values were scaled using literature data for H2O2 as described above. So far, we have adopted the results of Nguyen et al. (2015) and used a daytime deposition velocity of PAA that is 50 % of H2O2. In a sensitivity study, we reduced the daytime deposition velocity of PAA to just 25 % of H2O2. The night-time value was held at the measured value. As expected, the modelled PAA mixing ratios increased with the model-to-measurement ratio, also increased from 0.86 to 1.09. Considering the total uncertainty of the PAA measurements, both results are, however, statistically indistinguishable from 1 and can be considered to be in satisfactory agreement.
The sensitivity of the model output to the OH-rate coefficient was tested by reducing it by a factor of 2 from the IUPAC-recommended value of cm3 molecule−1 s−1. This is the lower limit of the IUPAC recommendation and is close to previous estimates based on analogous reactions of OH with organic peroxides. As expected, a reduction in the loss term increased the modelled PAA mixing ratio, with the model-to-measurement ratio also increasing slightly from 0.86 to 0.92. The weak sensitivity to the OH + PAA rate coefficient in the range 5– cm3 molecule−1 s−1 is expected, as this reaction contributes only a small fraction of the overall loss of PAA, which is dominated by dry deposition. On the other hand, increasing the OH-rate coefficient to cm3 molecule−1 s−1 results in this reaction becoming competitive with dry deposition, with a reduction in the model-to-measurement ratio from 0.86 to 0.77.
3.3.2 Modelled sources of radicals during HUMPPA-COPEC-2010
Having constructed a photochemical chemical scheme that can (1) mimic the diel behaviour of several traces gases (PAA, H2O2 and, with some caveats, CH3OOH) that are strongly linked to HO2, and RO2 concentrations, and (2) which can reproduce the measured concentrations of OH and HO2, we can use the model to identify the relative contributions of the processes forming OH, HO2 and CH3C(O)O2 during the campaign. The results are summarised as campaign averages (days 202–220) in Fig. 13.
Figure 13c indicates that the major source of the acetylperoxy radical in the model is the photolysis of the dicarbonyls biacetyl, methylglyoxal and pyruvic acid, together accounting for 61 %, with almost all of the remaining CH3C(O)O2 coming from PAN decomposition. The reaction of CH3CHO with OH accounted for only 4 %.
For HO2 (Fig. 13b) the picture is more complex with direct (primary) formation via the photolysis of formaldehyde, methylglyoxal and pyruvic acid, accounting for 24 %, the major source being the reaction between organic peroxy radicals and NO (64 %). This observation is consistent with the conclusions of (Kim et al., 2013), who required an extra source of HO2 in their constrained model of HOx chemistry in a MBO/terpene-emitting environment. Kim et al. (2013) suggested photolysis of OVOCs as the missing source of HOx or that the RO2-to-HO2 conversion is more efficient than modelled. Similar conclusions were drawn by Hens et al. (2014), who suggest that unmeasured organic trace gases that are responsible for “missing” OH reactivity during HUMPPA-COPEC-2010 are a major source of HO2. Hens et al. (2014) also found that between 76 % and 90 % of HO2 was formed by reactions of RO2 with NO, depending on the reactivity of OH (lower values at lower OH reactivity) in agreement with our conclusions that organic peroxy radical reactions with NO were the most important source of HO2 during the campaign.
For OH, we find the main source to be the reaction of HO2 with NO (47 %), while direct formation from O3 photolysis contributes on average only 7 %. As the greatest contribution to HO2 formation is from the reactions of organic peroxy radicals, which are formed mainly via OH + VOCs, this represents efficient HOx recycling even in the low NOx conditions of the boreal forest. This is in qualitative agreement with Kim et al. (2013), who found that the reaction of HO2 with NO is ≈20 times as important as primary production of OH from O3 photolysis in a non-isoprene-forested environment with daytime NO levels close to 200 pptv. The results are also consistent with the box-modelling conclusions of Hens et al. (2014), who found the major source of OH to be reaction of HO2 with NO and O3 (73 %–80 %) with only 20 %–27 % generated directly (i.e. by photolysis of O3, HONO and H2O2 and reaction of VOCs with O3).
Simultaneous measurements of PAA, PAN and H2O2 were used to calculate HOx levels during the HUMPPA-COPEC-2010 campaign in the boreal forest. A simple expression based on the measured PAA-to-PAN ratio was used to calculate noontime HO2 mixing ratios during each campaign day. Good agreement with the model was found on some days, whereas on others the expression resulted in HO2 levels that were a factor of 2 too high, which is likely related to varying degrees of breakdown of the inherent assumptions of PAA and PAN being in steady state at noon.
A box model, constrained by measurements of relatively long-lived radical precursors such as PAN, O3, NO, NO2, HCHO and CH3CHO reproduced the observations of PAA, H2O2 and OH when extra, photolytic sources of HO2 and CH3C(O)O2 were included (pyruvic acid, glyoxal, methylglyoxal and biacetyl). Inclusion of these radical sources was especially important during the biomass-burning-influenced period when high levels of many oxygenated VOCs were observed. Measurements of HO2, available for a limited number of days during the campaign, were generally higher (factor of 2 on average) than those modelled. The model indicated large concentrations of organic peroxy radicals at night-time and the apparent discrepancy between modelled and measured HO2 could be resolved by considering the detection of RO2 as HO2 (with an efficiency of 35 %) by the LIF instrument during this campaign. Reactions involving organic peroxy radicals form a main HOx recycling mechanism through the production of HO2 radicals that subsequently react with NO and produce OH. Reactions of acetylperoxy radicals with HO2 and NO were found to be the most important source of CH3O2 radicals.
An improved data analysis (both analytical and box model) would require more accurate kinetic data on the reaction of PAA with OH and also on the temperature dependence of PAA formation in the reaction of CH3C(O)O2 with HO2. Significant uncertainty is also associated with deposition velocities for PAA (in the steady-state analysis) and both PAA and H2O2 (in the box model analysis). Future studies of HOx chemistry in this type of environment would benefit greatly from measurements of vertical gradients (or deposition velocities) of PAA and H2O2 as well as measurements of speciated RO2, dicarbonyls and OVOCs.
HUMPPA-COPEC-2010 data can be obtained on request (via John N. Crowley) from the owners.
JNC designed the study, developed and ran the box model and, with contributions from HF and JL, wrote the manuscript. NP and GJP measured/analysed PAA and PAN. RA and HF measured NOx, HCHO and peroxides. KH, HH, MMH, DK and AN measured HO2. BB measured actinic flux and calculated J values, AN and JW measured OH reactivity. TP measured OH and hydrocarbons.
The authors declare that they have no conflict of interest.
We thank Uwe Parchatka and Markus Rudolf as well as the technical staff of
SMEAR II station for technical support during HUMPPA-COPEC-2010. Funding
from Academy of Finland via Center of Excellence in Atmospheric Science and
European Commission via ACTRIS-2 is gratefully acknowledged.
The article processing charges for this open-access
publication were covered by the Max Planck Society.
Edited by: Thomas Karl
Reviewed by: two anonymous referees
Akagi, S. K., Yokelson, R. J., Wiedinmyer, C., Alvarado, M. J., Reid, J. S., Karl, T., Crounse, J. D., and Wennberg, P. O.: Emission factors for open and domestic biomass burning for use in atmospheric models, Atmos. Chem. Phys., 11, 4039–4072, https://doi.org/10.5194/acp-11-4039-2011, 2011
Alvarado, M. J., Logan, J. A., Mao, J., Apel, E., Riemer, D., Blake, D., Cohen, R. C., Min, K.-E., Perring, A. E., Browne, E. C., Wooldridge, P. J., Diskin, G. S., Sachse, G. W., Fuelberg, H., Sessions, W. R., Harrigan, D. L., Huey, G., Liao, J., Case-Hanks, A., Jimenez, J. L., Cubison, M. J., Vay, S. A., Weinheimer, A. J., Knapp, D. J., Montzka, D. D., Flocke, F. M., Pollack, I. B., Wennberg, P. O., Kurten, A., Crounse, J., Clair, J. M. St., Wisthaler, A., Mikoviny, T., Yantosca, R. M., Carouge, C. C., and Le Sager, P.: Nitrogen oxides and PAN in plumes from boreal fires during ARCTAS-B and their impact on ozone: an integrated analysis of aircraft and satellite observations, Atmos. Chem. Phys., 10, 9739–9760, https://doi.org/10.5194/acp-10-9739-2010, 2010.
Ammann, M., Cox, R. A., Crowley, J. N., Jenkin, M. E., Mellouki, A., Rossi, M. J., Troe, J., and Wallington, T. J.: Evaluated kinetic and photochemical data for atmospheric chemistry: Volume VI – heterogeneous reactions with liquid substrates, Atmos. Chem. Phys., 13, 8045–8228, https://doi.org/10.5194/acp-13-8045-2013, 2013.
Andreae, M. O., Talbot, R. W., and Li, S. M.: Atmospheric measurements of pyruvic and formic acid, J. Geophys. Res.-Atmos., 92, 6635–6641, https://doi.org/10.1029/JD092iD06p06635, 1987.
Andrés-Hernández, M. D., Kartal, D., Crowley, J. N., Sinha, V., Regelin, E., Martínez-Harder, M., Nenakhov, V., Williams, J., Harder, H., Bozem, H., Song, W., Thieser, J., Tang, M. J., Hosaynali Beigi, Z., and Burrows, J. P.: Diel peroxy radicals in a semi-industrial coastal area: nighttime formation of free radicals, Atmos. Chem. Phys., 13, 5731–5749, https://doi.org/10.5194/acp-13-5731-2013, 2013.
Arey, J., Obermeyer, G., Aschmann, S. M., Chattopadhyay, S., Cusick, R. D., and Atkinson, R.: Dicarbonyl Products of the OH Radical-Initiated Reaction of a Series of Aromatic Hydrocarbons, Environ. Sci. Technol., 43, 683–689, https://doi.org/10.1021/es8019098, 2009.
Atkinson, R. and Arey, J.: Gas-phase tropospheric chemistry of biogenic volatile organic compounds: a review, Atmos. Environ., 37, S197–S219, 2003a.
Atkinson, R. and Arey, J.: Atmospheric degradation of volatile organic compounds, Chem. Rev., 103, 4605–4638, https://doi.org/10.1021/cr0206420, 2003b.
Atkinson, R., Carter, W. P. L., Darnall, K. R., Winer, A. M., and Pitts, J. N.: A smog chamber and modelling study of the gas-phase NOx-air photo-oxidation of toluene and the cresols, Int. J. Chem. Kinet., 12, 779–836, https://doi.org/10.1002/kin.550121102, 1980.
Atkinson, R., Baulch, D. L., Cox, R. A., Crowley, J. N., Hampson, R. F., Hynes, R. G., Jenkin, M. E., Rossi, M. J., Troe, J., and IUPAC Subcommittee: Evaluated kinetic and photochemical data for atmospheric chemistry: Volume II – gas phase reactions of organic species, Atmos. Chem. Phys., 6, 3625–4055, https://doi.org/10.5194/acp-6-3625-2006, 2006.
Blake, R. S., Monks, P. S., and Ellis, A. M.: Proton-Transfer Reaction Mass Spectrometry, Chem. Rev., 109, 861–896, https://doi.org/10.1021/cr800364q, 2009.
Bohn, B., Corlett, G. K., Gillmann, M., Sanghavi, S., Stange, G., Tensing, E., Vrekoussis, M., Bloss, W. J., Clapp, L. J., Kortner, M., Dorn, H.-P., Monks, P. S., Platt, U., Plass-Dülmer, C., Mihalopoulos, N., Heard, D. E., Clemitshaw, K. C., Meixner, F. X., Prevot, A. S. H., and Schmitt, R.: Photolysis frequency measurement techniques: results of a comparison within the ACCENT project, Atmos. Chem. Phys., 8, 5373–5391, https://doi.org/10.5194/acp-8-5373-2008, 2008.
Burkholder, J. B., Sander, S. P., Abbatt, J., Barker, J. R., Huie, R. E., Kolb, C. E., Kurylo, M. J., Orkin, V. L., Wilmouth, D. M., and Wine, P. H.: Chemical Kinetics and Photochemical Data for Use in Atmospheric Studies, Evaluation No. 18, JPL Publication 15-10, Jet Propulsion Laboratory, Pasadena, available at: http://jpldataeval.jpl.nasa.gov, 2015.
Calvert, J. G., Atkinson, R., Kerr, J. A., Madronich, S., Moortgat, G. K., Wallington, T. J., and Yarwood, G.: The Mechanisms of Atmospheric Oxidation of the Alkenes, Oxford Univ. Press, New York, 2000.
Calvert, J. G., Atkinson, R., Becker, K. H., Seinfeld, J. H., Wallington, T. J., and Yarwood, G.: The mechanism of atmospheric oxidation of aromatic hydrocarbons, Oxford University Press, New York, 2002.
Cantrell, C. A., Shetter, R. E., Calvert, J. G., Eisele, F. L., and Tanner, D. J.: Some considerations of the origin of nighttime peroxy radicals observed in MLOPEX 2c, J. Geophys. Res.-Atmos., 102, 15899–15913, 1997.
Corrigan, A. L., Russell, L. M., Takahama, S., Äijälä, M., Ehn, M., Junninen, H., Rinne, J., Petäjä, T., Kulmala, M., Vogel, A. L., Hoffmann, T., Ebben, C. J., Geiger, F. M., Chhabra, P., Seinfeld, J. H., Worsnop, D. R., Song, W., Auld, J., and Williams, J.: Biogenic and biomass burning organic aerosol in a boreal forest at Hyytiälä, Finland, during HUMPPA-COPEC 2010, Atmos. Chem. Phys., 13, 12233–12256, https://doi.org/10.5194/acp-13-12233-2013, 2013.
Curtis, A. R. and Sweetenham, W. P.: Facsimile, Atomic Energy Research Establishment, Report R-12805, 1987.
de Gouw, J. and Warneke, C.: Measurements of volatile organic compounds in the earths atmosphere using proton-transfer-reaction mass spectrometry, Mass Spectrom. Rev., 26, 223–257, https://doi.org/10.1002/mas.20119, 2007.
Dillon, T. J. and Crowley, J. N.: Direct detection of OH formation in the reactions of HO2 with CH3C(O)O2 and other substituted peroxy radicals, Atmos. Chem. Phys., 8, 4877–4889, https://doi.org/10.5194/acp-8-4877-2008, 2008.
Ehn, M., Kleist, E., Junninen, H., Petäjä, T., Lönn, G., Schobesberger, S., Dal Maso, M., Trimborn, A., Kulmala, M., Worsnop, D. R., Wahner, A., Wildt, J., and Mentel, Th. F.: Gas phase formation of extremely oxidized pinene reaction products in chamber and ambient air, Atmos. Chem. Phys., 12, 5113–5127, https://doi.org/10.5194/acp-12-5113-2012, 2012.
Emmerson, K. M. and Carslaw, N.: Nighttime radical chemistry during the TORCH campaign, Atmos. Environ., 43, 3220–3226, https://doi.org/10.1016/j.atmosenv.2009.03.042, 2009.
Fairlie, T. D., Jacob, D. J., and Park, R. J.: The impact of transpacific transport of mineral dust in the United States, Atmos. Environ., 41, 1251–1266, https://doi.org/10.1016/j.atmosenv.2006.09.048, 2007.
Fels, M. and Junkermann, W.: The occurrence of organic peroxides in air at a mountain site, Geophys. Res. Lett., 21, 341–344, https://doi.org/10.1029/93gl01892, 1994.
Fick, J., Pommer, L., Nilsson, C., and Andersson, B.: Effect of OH radicals, relative humidity, and time on the composition of the products formed in the ozonolysis of alpha-pinene, Atmos. Environ., 37, 4087–4096, https://doi.org/10.1016/s1352-2310(03)00522-3, 2003.
Fischer, E. V., Jacob, D. J., Yantosca, R. M., Sulprizio, M. P., Millet, D. B., Mao, J., Paulot, F., Singh, H. B., Roiger, A., Ries, L., Talbot, R. W., Dzepina, K., and Pandey Deolal, S.: Atmospheric peroxyacetyl nitrate (PAN): a global budget and source attribution, Atmos. Chem. Phys., 14, 2679–2698, https://doi.org/10.5194/acp-14-2679-2014, 2014.
Fischer, H., Pozzer, A., Schmitt, T., Jöckel, P., Klippel, T., Taraborrelli, D., and Lelieveld, J.: Hydrogen peroxide in the marine boundary layer over the South Atlantic during the OOMPH cruise in March 2007, Atmos. Chem. Phys., 15, 6971–6980, https://doi.org/10.5194/acp-15-6971-2015, 2015.
Fu, T. M., Jacob, D. J., Wittrock, F., Burrows, J. P., Vrekoussis, M., and Henze, D. K.: Global budgets of atmospheric glyoxal and methylglyoxal, and implications for formation of secondary organic aerosols, J. Geophys. Res., 113, D15303, https://doi.org/10.1029/2007jd009505, 2008.
Fuchs, H., Bohn, B., Hofzumahaus, A., Holland, F., Lu, K. D., Nehr, S., Rohrer, F., and Wahner, A.: Detection of HO2 by laser-induced fluorescence: calibration and interferences from RO2 radicals, Atmos. Meas. Tech., 4, 1209–1225, https://doi.org/10.5194/amt-4-1209-2011, 2011.
Fuchs, H., Tan, Z., Hofzumahaus, A., Broch, S., Dorn, H.-P., Holland, F., Künstler, C., Gomm, S., Rohrer, F., Schrade, S., Tillmann, R., and Wahner, A.: Investigation of potential interferences in the detection of atmospheric ROx radicals by laser-induced fluorescence under dark conditions, Atmos. Meas. Tech., 9, 1431–1447, https://doi.org/10.5194/amt-9-1431-2016, 2016.
Geyer, A., Bachmann, K., Hofzumahaus, A., Holland, F., Konrad, S., Klupfel, T., Patz, H. W., Perner, D., Mihelcic, D., Schafer, H. J., Volz-Thomas, A., and Platt, U.: Nighttime formation of peroxy and hydroxyl radicals during the BERLIOZ campaign: Observations and modeling studies, J. Geophys. Res.-Atmos., 108, 8249, https://doi.org/10.1029/2001JD000656, 2003.
Grosjean, D.: Formic acid and acetic acid- emissions, atmospheric formation and dry deposition at two southern California locations, Atmos. Environ. A-Gen., 26, 3279–3286, https://doi.org/10.1016/0960-1686(92)90343-j, 1992.
Grosjean, D.: Ambient PAN and PPN in southern California from 1960 to the SCOS97-NARSTO, Atmos. Environ., 37, S221–S238, https://doi.org/10.1016/s1352-2310(03)00392-3, 2003.
Groß, C. B. M., Dillon, T. J., Schuster, G., Lelieveld, J., and Crowley, J. N.: Direct kinetic study of OH and O3 formation in the reaction of CH3C(O)O2 with HO2, J. Phys. Chem. A, 118, 974–985, https://doi.org/10.1021/jp412380z, 2014.
Hall, B. D. and Claiborn, C. S.: Measurements of the dry deposition of peroxides to a Canadian boreal forest, J. Geophys. Res.-Atmos., 102, 29343–29353, https://doi.org/10.1029/97jd01113, 1997.
Hari, P. and Kulmala, M.: Station for Measuring Ecosystem–Atmosphere Relations (SMEAR II), Boreal Environ. Res., 10, 315–322, 2005.
Hasson, A. S., Tyndall, G. S., and Orlando, J. J.: A product yield study of the reaction of HO2 radicals with ethyl peroxy (C2H5O2), acetyl peroxy (CH3C(O)O2), and acetonyl peroxy (CH3C(O)CH2O2) radicals, J. Phys. Chem. A, 108, 5979–5989, 2004.
He, S. Z., Chen, Z. M., Zhang, X., Zhao, Y., Huang, D. M., Zhao, J. N., Zhu, T., Hu, M., and Zeng, L. M.: Measurement of atmospheric hydrogen peroxide and organic peroxides in Beijing before and during the 2008 Olympic Games: Chemical and physical factors influencing their concentrations, J. Geophys. Res.-Atmos., 115, D17307, https://doi.org/10.1029/2009jd013544, 2010.
Hens, K., Novelli, A., Martinez, M., Auld, J., Axinte, R., Bohn, B., Fischer, H., Keronen, P., Kubistin, D., Nölscher, A. C., Oswald, R., Paasonen, P., Petäjä, T., Regelin, E., Sander, R., Sinha, V., Sipilä, M., Taraborrelli, D., Tatum Ernest, C., Williams, J., Lelieveld, J., and Harder, H.: Observation and modelling of HOx radicals in a boreal forest, Atmos. Chem. Phys., 14, 8723–8747, https://doi.org/10.5194/acp-14-8723-2014, 2014.
Hosaynali Beygi, Z., Fischer, H., Harder, H. D., Martinez, M., Sander, R., Williams, J., Brookes, D. M., Monks, P. S., and Lelieveld, J.: Oxidation photochemistry in the Southern Atlantic boundary layer: unexpected deviations of photochemical steady state, Atmos. Chem. Phys., 11, 8497–8513, https://doi.org/10.5194/acp-11-8497-2011, 2011.
Hu, J. and Stedman, D. H.: Atmospheric ROx radicals at an urban site - comparison to a simple theoretical-model, Environ. Sci. Technol., 29, 1655–1659, 1995.
Ito, A., Sillman, S., and Penner, J. E.: Effects of additional nonmethane volatile organic compounds, organic nitrates, and direct emissions of oxygenated organic species on global tropospheric chemistry, J. Geophys. Res., 112, D06309, https://doi.org/10.1029/2005JD006556, 2007.
IUPAC: Task Group on Atmospheric Chemical Kinetic Data Evaluation, edited by: Ammann, M., Cox, R. A., Crowley, J. N., Herrmann, H., Jenkin, M. E., McNeill, V. F., Mellouki, A., Rossi, M. J., Troe, J., and Wallington, T. J., http://iupac.pole-ether.fr/index.html, last access: April 2018.
Jacob, D. J.: Heterogeneous chemistry and tropospheric ozone, Atmos. Environ., 34, 2131–2159, https://doi.org/10.1016/s1352-2310(99)00462-8, 2000.
Jacob, D. J. and Wofsy, S. C.: Photochemistry of biogenic emissions over the Amazon forest, J. Geophys. Res.-Atmos., 93, 1477–1486, https://doi.org/10.1029/JD093iD02p01477, 1988.
Jardine, K. J., Sommer, E. D., Saleska, S. R., Huxman, T. E., Harley, P. C., and Abrell, L.: Gas Phase Measurements of Pyruvic Acid and Its Volatile Metabolites, Environ. Sci. Technol., 44, 2454–2460, https://doi.org/10.1021/es903544p, 2010.
Jenkin, M. E., Hurley, M. A., and Wallington, T. J.: Investigation of the Radical Product Channel of the CH3OCH2O2 + HO2 Reaction in the Gas Phase, J. Phys. Chem. A, 114, 408–416, https://doi.org/10.1021/jp908158w, 2010.
Kawamura, K., Okuzawa, K., Aggarwal, S. G., Irie, H., Kanaya, Y., and Wang, Z.: Determination of gaseous and particulate carbonyls (glycolaldehyde, hydroxyacetone, glyoxal, methylglyoxal, nonanal and decanal) in the atmosphere at Mt. Tai, Atmos. Chem. Phys., 13, 5369–5380, https://doi.org/10.5194/acp-13-5369-2013, 2013.
Kim, S., Wolfe, G. M., Mauldin, L., Cantrell, C., Guenther, A., Karl, T., Turnipseed, A., Greenberg, J., Hall, S. R., Ullmann, K., Apel, E., Hornbrook, R., Kajii, Y., Nakashima, Y., Keutsch, F. N., DiGangi, J. P., Henry, S. B., Kaser, L., Schnitzhofer, R., Graus, M., Hansel, A., Zheng, W., and Flocke, F. F.: Evaluation of HOx sources and cycling using measurement-constrained model calculations in a 2-methyl-3-butene-2-ol (MBO) and monoterpene (MT) dominated ecosystem, Atmos. Chem. Phys., 13, 2031–2044, https://doi.org/10.5194/acp-13-2031-2013, 2013.
Klotz, B., Graedler, F., Sorensen, S., Barnes, I., and Becker, K. H.: A kinetic study of the atmospheric photolysis of alpha-dicarbonyls, Int. J. Chem. Kinet., 33, 9–20, https://doi.org/10.1002/1097-4601(20010101)33:1<9::aid-kin2>3.0.co;2-v, 2001.
Kourtchev, I., Giorio, C., Manninen, A., Wilson, E., Mahon, B., Aalto, J., Kajos, M., Venables, D., Ruuskanen, T., Levula, J., Loponen, M., Connors, S., Harris, N., Zhao, D. F., Kiendler-Scharr, A., Mentel, T., Rudich, Y., Hallquist, M., Doussin, J. F., Maenhaut, W., Back, J., Petaja, T., Wenger, J., Kulmala, M., and Kalberer, M.: Enhanced Volatile Organic Compounds emissions and organic aerosol mass increase the oligomer content of atmospheric aerosols, Sci. Rep., 6, 35038, https://doi.org/10.1038/srep35038, 2016.
Kurpius, M. R. and Goldstein, A. H.: Gas-phase chemistry dominates O3 loss to a forest, implying a source of aerosols and hydroxyl radicals to the atmosphere, Geophys. Res. Lett., 30, 1371, https://doi.org/10.1029/2002gl016785, 2003.
Lee, Y. N., Zhou, X. L., and Hallock, K.: Atmospheric carbonyl compounds at a rural southeastern United States site, J. Geophys. Res.-Atmos., 100, 25933–25944, https://doi.org/10.1029/95jd02605, 1995.
Lelieveld, J., Butler, T. M., Crowley, J. N., Dillon, T. J., Fischer, H., Ganzeveld, L., Harder, H., Lawrence, M. G., Martinez, M., Taraborrelli, D., and Williams, J.: Atmospheric oxidation capacity sustained by a tropical forest, Nature, 452, 737–740, 2008.
Lew, M. M., Dusanter, S., and Stevens, P. S.: Measurement of interferences associated with the detection of the hydroperoxy radical in the atmosphere using laser-induced fluorescence, Atmos. Meas. Tech., 11, 95–109, https://doi.org/10.5194/amt-11-95-2018, 2018.
Li, H., Chen, Z., Huang, L., and Huang, D.: Organic peroxides' gas-particle partitioning and rapid heterogeneous decomposition on secondary organic aerosol, Atmos. Chem. Phys., 16, 1837–1848, https://doi.org/10.5194/acp-16-1837-2016, 2016.
Liang, H., Chen, Z. M., Huang, D., Zhao, Y., and Li, Z. Y.: Impacts of aerosols on the chemistry of atmospheric trace gases: a case study of peroxides and HO2 radicals, Atmos. Chem. Phys., 13, 11259–11276, https://doi.org/10.5194/acp-13-11259-2013, 2013.
Liebmann, J., Karu, E., Sobanski, N., Schuladen, J., Ehn, M., Schallhart, S., Quéléver, L., Hellen, H., Hakola, H., Hoffmann, T., Williams, J., Fischer, H., Lelieveld, J., and Crowley, J. N.: Direct measurement of NO3 radical reactivity in a boreal forest, Atmos. Chem. Phys., 18, 3799–3815, https://doi.org/10.5194/acp-18-3799-2018, 2018.
Liu, Z., Wang, Y. H., Gu, D. S., Zhao, C., Huey, L. G., Stickel, R., Liao, J., Shao, M., Zhu, T., Zeng, L. M., Liu, S. C., Chang, C. C., Amoroso, A., and Costabile, F.: Evidence of Reactive Aromatics As a Major Source of Peroxy Acetyl Nitrate over China, Environ. Sci. Technol., 44, 7017–7022, https://doi.org/10.1021/es1007966, 2010.
Müller, M., Anderson, B. E., Beyersdorf, A. J., Crawford, J. H., Diskin, G. S., Eichler, P., Fried, A., Keutsch, F. N., Mikoviny, T., Thornhill, K. L., Walega, J. G., Weinheimer, A. J., Yang, M., Yokelson, R. J., and Wisthaler, A.: In situ measurements and modeling of reactive trace gases in a small biomass burning plume, Atmos. Chem. Phys., 16, 3813–3824, https://doi.org/10.5194/acp-16-3813-2016, 2016.
Ng, N. L., Brown, S. S., Archibald, A. T., Atlas, E., Cohen, R. C., Crowley, J. N., Day, D. A., Donahue, N. M., Fry, J. L., Fuchs, H., Griffin, R. J., Guzman, M. I., Herrmann, H., Hodzic, A., Iinuma, Y., Jimenez, J. L., Kiendler-Scharr, A., Lee, B. H., Luecken, D. J., Mao, J., McLaren, R., Mutzel, A., Osthoff, H. D., Ouyang, B., Picquet-Varrault, B., Platt, U., Pye, H. O. T., Rudich, Y., Schwantes, R. H., Shiraiwa, M., Stutz, J., Thornton, J. A., Tilgner, A., Williams, B. J., and Zaveri, R. A.: Nitrate radicals and biogenic volatile organic compounds: oxidation, mechanisms, and organic aerosol, Atmos. Chem. Phys., 17, 2103–2162, https://doi.org/10.5194/acp-17-2103-2017, 2017.
Nguyen, T. B., Crounse, J. D., Teng, A. P., St. Clair, J. M., Paulot, F., Wolfe, G. M., and Wennberg, P. O.: Rapid deposition of oxidized biogenic compounds to a temperate forest, P. Natl. Acad. Sci. USA, 112, E392–E401, 2015.
Nölscher, A. C., Williams, J., Sinha, V., Custer, T., Song, W., Johnson, A. M., Axinte, R., Bozem, H., Fischer, H., Pouvesle, N., Phillips, G., Crowley, J. N., Rantala, P., Rinne, J., Kulmala, M., Gonzales, D., Valverde-Canossa, J., Vogel, A., Hoffmann, T., Ouwersloot, H. G., Vilà-Guerau de Arellano, J., and Lelieveld, J.: Summertime total OH reactivity measurements from boreal forest during HUMPPA-COPEC 2010, Atmos. Chem. Phys., 12, 8257–8270, https://doi.org/10.5194/acp-12-8257-2012, 2012.
Novelli, A., Hens, K., Tatum Ernest, C., Kubistin, D., Regelin, E., Elste, T., Plass-Dülmer, C., Martinez, M., Lelieveld, J., and Harder, H.: Characterisation of an inlet pre-injector laser-induced fluorescence instrument for the measurement of atmospheric hydroxyl radicals, Atmos. Meas. Tech., 7, 3413–3430, https://doi.org/10.5194/amt-7-3413-2014, 2014.
Obermeyer, G., Aschmann, S. M., Atkinson, R., and Arey, J.: Carbonyl atmospheric reaction products of aromatic hydrocarbons in ambient air, Atmos. Environ., 43, 3736–3744, https://doi.org/10.1016/j.atmosenv.2009.04.015, 2009.
Orlando, J. J. and Tyndall, G. S.: Gas phase UV absorption spectra for peracetic acid, and for acetic acid monomers and dimers, J. Photoch. Photobio. A, 157, 161–166, 2003.
Ouwersloot, H. G., Vilà-Guerau de Arellano, J., Nölscher, A. C., Krol, M. C., Ganzeveld, L. N., Breitenberger, C., Mammarella, I., Williams, J., and Lelieveld, J.: Characterization of a boreal convective boundary layer and its impact on atmospheric chemistry during HUMPPA-COPEC-2010, Atmos. Chem. Phys., 12, 9335–9353, https://doi.org/10.5194/acp-12-9335-2012, 2012.
Paasonen, P., Asmi, A., Petaja, T., Kajos, M. K., Aijala, M., Junninen, H., Holst, T., Abbatt, J. P. D., Arneth, A., Birmili, W., van der Gon, H. D., Hamed, A., Hoffer, A., Laakso, L., Laaksonen, A., Leaitch, W. R., Plass-Dulmer, C., Pryor, S. C., Raisanen, P., Swietlicki, E., Wiedensohler, A., Worsnop, D. R., Kerminen, V. M., and Kulmala, M.: Warming-induced increase in aerosol number concentration likely to moderate climate change, Nat. Geosci., 6, 438–442, 2013.
Petäjä, T., Mauldin, III, R. L., Kosciuch, E., McGrath, J., Nieminen, T., Paasonen, P., Boy, M., Adamov, A., Kotiaho, T., and Kulmala, M.: Sulfuric acid and OH concentrations in a boreal forest site, Atmos. Chem. Phys., 9, 7435–7448, https://doi.org/10.5194/acp-9-7435-2009, 2009.
Phillips, G. J., Pouvesle, N., Thieser, J., Schuster, G., Axinte, R., Fischer, H., Williams, J., Lelieveld, J., and Crowley, J. N.: Peroxyacetyl nitrate (PAN) and peroxyacetic acid (PAA) measurements by iodide chemical ionisation mass spectrometry: first analysis of results in the boreal forest and implications for the measurement of PAN fluxes, Atmos. Chem. Phys., 13, 1129–1139, https://doi.org/10.5194/acp-13-1129-2013, 2013.
Platt, U., Lebras, G., Poulet, G., Burrows, J. P., and Moortgat, G.: Peroxy-radicals from nighttime reactions of NO3 with organic compounds, Nature, 348, 147–149, 1990.
Reiner, T., Hanke, M., and Arnold, F.: Atmospheric peroxy radical measurements by ion molecule reaction mass spectrometry: A novel analytical method using amplifying chemical conversion to sulfuric acid, J. Geophys. Res.-Atmos., 102, 1311–1326, 1997.
Rinne, J., Markkanen, T., Ruuskanen, T. M., Petäjä, T., Keronen, P., Tang, M. J., Crowley, J. N., Rannik, Ü., and Vesala, T.: Effect of chemical degradation on fluxes of reactive compounds – a study with a stochastic Lagrangian transport model, Atmos. Chem. Phys., 12, 4843–4854, https://doi.org/10.5194/acp-12-4843-2012, 2012.
Roberts, J. M.: The atmospheric chemistry of organic nitrates, Atmos. Environ. A-Gen., 24, 243–287, 1990.
Rypkema, H. A. and Francisco, J. S.: Atmospheric Oxidation of Peroxyacetic Acid, J. Phys. Chem. A, 117, 14151–14162, 2013.
Salisbury, G., Rickard, A. R., Monks, P. S., Allan, B. J., Bauguitte, S., Penkett, S. A., Carslaw, N., Lewis, A. C., Creasey, D. J., Heard, D. E., Jacobs, P. J., and Lee, J. D.: Production of peroxy radicals at night via reactions of ozone and the nitrate radical in the marine boundary layer, J. Geophys. Res.-Atmos., 106, 12669–12687, 2001.
Schade, G. W., Goldstein, A. H., Gray, D. W., and Lerdau, M. T.: Canopy and leaf level 2-methyl-3-buten-2-ol fluxes from a ponderosa pine plantation, Atmos. Environ., 34, 3535–3544, https://doi.org/10.1016/s1352-2310(00)00120-5, 2000.
Shepson, P. B., Bottenheim, J. W., Hastie, D. R., and Venkatram, A.: Determination of the relative ozone and PAN deposition velocities at night, Geophys. Res. Lett., 19, 1121–1124, https://doi.org/10.1029/92gl01118, 1992.
Singh, H. B.: Reactive nitrogen in the troposphere, Environ. Sci. Technol., 21, 320–327, 1987.
Singh, H. B. and Hanst, P. L.: Peroxyacetyl nitrate (PAN) in the unpolluted atmosphere: An important reservoir for nitrogen oxides, Geophys. Res. Lett., 8, 941–944, 1981.
Sommariva, R., Bates, T. S., Bon, D., Brookes, D. M., de Gouw, J. A., Gilman, J. B., Herndon, S. C., Kuster, W. C., Lerner, B. M., Monks, P. S., Osthoff, H. D., Parker, A. E., Roberts, J. M., Tucker, S. C., Warneke, C., Williams, E. J., Zahniser, M. S., and Brown, S. S.: Modelled and measured concentrations of peroxy radicals and nitrate radical in the US Gulf Coast region during TexAQS 2006, J. Atmos. Chem., 68, 331–362, 2011.
Sparks, J. P., Roberts, J. M., and Monson, R. K.: The uptake of gaseous organic nitrogen by leaves: A significant global nitrogen transfer process, Geophys. Res. Lett., 30, 2189, https://doi.org/10.1029/2003gl018578, 2003.
Spaulding, R. S., Schade, G. W., Goldstein, A. H., and Charles, M. J.: Characterization of secondary atmospheric photooxidation products: Evidence for biogenic and anthropogenic sources, J. Geophys. Res., 108, 4247, https://doi.org/10.1029/95JD00545, 2003.
Stickler, A., Fischer, H., Williams, J., de Reus, M., Sander, R., Lawrence, M. G., Crowley, J. N., and Lelieveld, J.: Influence of summertime deep convection on formaldehyde in the middle and upper troposphere over Europe, J. Geophys. Res.-Atmos., 111, D14308, https://doi.org/10.1029/2005JD007001, 2006.
Stickler, A., Fischer, H., Bozem, H., Gurk, C., Schiller, C., Martinez-Harder, M., Kubistin, D., Harder, H., Williams, J., Eerdekens, G., Yassaa, N., Ganzeveld, L., Sander, R., and Lelieveld, J.: Chemistry, transport and dry deposition of trace gases in the boundary layer over the tropical Atlantic Ocean and the Guyanas during the GABRIEL field campaign, Atmos. Chem. Phys., 7, 3933–3956, https://doi.org/10.5194/acp-7-3933-2007, 2007.
Stockwell, C. E., Veres, P. R., Williams, J., and Yokelson, R. J.: Characterization of biomass burning emissions from cooking fires, peat, crop residue, and other fuels with high-resolution proton-transfer-reaction time-of-flight mass spectrometry, Atmos. Chem. Phys., 15, 845–865, https://doi.org/10.5194/acp-15-845-2015, 2015.
Stoenner, C., Derstroff, B., Klupfel, T., Crowley, J. N., and Williams, J.: Glyoxal measurement with a proton transfer reaction time of flight mass spectrometer (PTR-TOF-MS): characterization and calibration, J. Mass Spectrom., 52, 30–35, https://doi.org/10.1002/jms.3893, 2017.
Talbot, R. W., Beecher, K. M., Harriss, R. C., and Cofer, W. R.: Atmospheic geochemistry of formic and acetic-acids at a mod-latitude temperate site J. Geophys. Res.-Atmos., 93, 1638–1652, https://doi.org/10.1029/JD093iD02p01638, 1988.
Talbot, R. W., Mosher, B. W., Heikes, B. G., Jacob, D. J., Munger, J. W., Daube, B. C., Keene, W. C., Maben, J. R., and Artz, R. S.: Carboxylic acids in the rural continental atmosphere over the eastern United States during the Shenandoah Cloud and Photochemistry Experiment, J. Geophys. Res.-Atmos., 100, 9335–9343, https://doi.org/10.1029/95jd00507, 1995.
Talukdar, R. K., Burkholder, J. B., Schmoltner, A. M., Roberts, J. M., Wilson, R. R., and Ravishankara, A. R.: Investigation of the loss processes for peroxyacetyl nitrate in the atmosphere: UV photolysis and reaction with OH, J. Geophys. Res., 100, 14163–14173, https://doi.org/10.1029/95JD00545, 1995.
Tan, Y., Lim, Y. B., Altieri, K. E., Seitzinger, S. P., and Turpin, B. J.: Mechanisms leading to oligomers and SOA through aqueous photooxidation: insights from OH radical oxidation of acetic acid and methylglyoxal, Atmos. Chem. Phys., 12, 801–813, https://doi.org/10.5194/acp-12-801-2012, 2012.
Taraborrelli, D., Lawrence, M. G., Crowley, J. N., Dillon, T. J., Gromov, S., Groß, C. B. M., Vereecken, L., and Lelieveld, J.: Hydroxyl radical buffered by isoprene oxidation over tropical forests, Nat. Geosci, 5, 190–193, 2012.
Thornton, J. A., Jaegle, L., and McNeill, V. F.: Assessing known pathways for HO2 loss in aqueous atmospheric aerosols: Regional and global impacts on tropospheric oxidants, J. Geophys. Res., 113, D05303, https://doi.org/10.1029/2007JD009236, 2008.
Turnipseed, A. A., Huey, L. G., Nemitz, E., Stickel, R., Higgs, J., Tanner, D. J., Slusher, D. L., Sparks, J. P., Flocke, F., and Guenther, A.: Eddy covariance fluxes of peroxyacetyl nitrates (PANs) and NOy to a coniferous forest, J. Geophys. Res., 111, D09304, https://doi.org/10.1029/2005JD006631, 2006.
Tyndall, G. S., Cox, R. A., Granier, C., Lesclaux, R., Moortgat, G. K., Pilling, M. J., Ravishankara, A. R., and Wallington, T. J.: Atmospheric chemistry of small organic peroxy radicals, J. Geophys. Res.-Atmos., 106, 12157–12182, https://doi.org/10.1029/2000jd900746, 2001.
Veres, P. R., Roberts, J. M., Cochran, A. K., Gilman, J. B., Kuster, W. C., Holloway, J. S., Graus, M., Flynn, J., Lefer, B., Warneke, C., and de Gouw, J.: Evidence of rapid production of organic acids in an urban air mass, Geophys. Res. Lett., 38, L17807, https://doi.org/10.1029/2011gl048420, 2011.
Volkamer, R., Platt, U., and Wirtz, K.: Primary and secondary glyoxal formation from aromatics: Experimental evidence for the bicycloalkyl-radical pathway from benzene, toluene, and p-xylene, J. Phys. Chem. A, 105, 7865–7874, https://doi.org/10.1021/jp010152w, 2001.
Williams, J., Roberts, J. M., Fehsenfeld, F. C., Bertman, S. B., Buhr, M. P., Goldan, P. D., Hubler, G., Kuster, W. C., Ryerson, T. B., Trainer, M., and Young, V.: Regional ozone from biogenic hydrocarbons deduced from airborne measurements of PAN, PPN, and MPAN, Geophys. Res. Lett., 24, 1099–1102, 1997.
Williams, J., Crowley, J., Fischer, H., Harder, H., Martinez, M., Petäjä, T., Rinne, J., Bäck, J., Boy, M., Dal Maso, M., Hakala, J., Kajos, M., Keronen, P., Rantala, P., Aalto, J., Aaltonen, H., Paatero, J., Vesala, T., Hakola, H., Levula, J., Pohja, T., Herrmann, F., Auld, J., Mesarchaki, E., Song, W., Yassaa, N., Nölscher, A., Johnson, A. M., Custer, T., Sinha, V., Thieser, J., Pouvesle, N., Taraborrelli, D., Tang, M. J., Bozem, H., Hosaynali-Beygi, Z., Axinte, R., Oswald, R., Novelli, A., Kubistin, D., Hens, K., Javed, U., Trawny, K., Breitenberger, C., Hidalgo, P. J., Ebben, C. J., Geiger, F. M., Corrigan, A. L., Russell, L. M., Ouwersloot, H. G., Vilà-Guerau de Arellano, J., Ganzeveld, L., Vogel, A., Beck, M., Bayerle, A., Kampf, C. J., Bertelmann, M., Köllner, F., Hoffmann, T., Valverde, J., González, D., Riekkola, M.-L., Kulmala, M., and Lelieveld, J.: The summertime Boreal forest field measurement intensive (HUMPPA-COPEC-2010): an overview of meteorological and chemical influences, Atmos. Chem. Phys., 11, 10599–10618, https://doi.org/10.5194/acp-11-10599-2011, 2011.
Wolfe, G. M., Thornton, J. A., Yatavelli, R. L. N., McKay, M., Goldstein, A. H., LaFranchi, B., Min, K.-E., and Cohen, R. C.: Eddy covariance fluxes of acyl peroxy nitrates (PAN, PPN and MPAN) above a Ponderosa pine forest, Atmos. Chem. Phys., 9, 615–634, https://doi.org/10.5194/acp-9-615-2009, 2009.
Wu, H., Wang, Y., Li, H., Huang, L., Huang, D., Shen, H., Xing, Y., and Chen, Z.: The OH-initiated oxidation of atmospheric peroxyacetic acid: Experimental and model studies, Atmos. Environ., 164, 61–70, 2017.
Wu, Q. Q., Huang, L. B., Liang, H., Zhao, Y., Huang, D., and Chen, Z. M.: Heterogeneous reaction of peroxyacetic acid and hydrogen peroxide on ambient aerosol particles under dry and humid conditions: kinetics, mechanism and implications, Atmos. Chem. Phys., 15, 6851–6866, https://doi.org/10.5194/acp-15-6851-2015, 2015.
Yáñez-Serrano, A. M., Nölscher, A. C., Bourtsoukidis, E., Derstroff, B., Zannoni, N., Gros, V., Lanza, M., Brito, J., Noe, S. M., House, E., Hewitt, C. N., Langford, B., Nemitz, E., Behrendt, T., Williams, J., Artaxo, P., Andreae, M. O., and Kesselmeier, J.: Atmospheric mixing ratios of methyl ethyl ketone (2-butanone) in tropical, boreal, temperate and marine environments, Atmos. Chem. Phys., 16, 10965–10984, https://doi.org/10.5194/acp-16-10965-2016, 2016.
Yassaa, N., Song, W., Lelieveld, J., Vanhatalo, A., Bäck, J., and Williams, J.: Diel cycles of isoprenoids in the emissions of Norway spruce, four Scots pine chemotypes, and in Boreal forest ambient air during HUMPPA-COPEC-2010, Atmos. Chem. Phys., 12, 7215–7229, https://doi.org/10.5194/acp-12-7215-2012, 2012.
Yu, J. Z., Flagan, R. C., and Seinfeld, J. H.: Identification of products containing –COOH, –OH, and –C=O in atmospheric oxidation of hydrocarbons, Environ. Sci. Technol., 32, 2357–2370, https://doi.org/10.1021/es980129x, 1998.
Zhang, L., Jacob, D. J., Boersma, K. F., Jaffe, D. A., Olson, J. R., Bowman, K. W., Worden, J. R., Thompson, A. M., Avery, M. A., Cohen, R. C., Dibb, J. E., Flock, F. M., Fuelberg, H. E., Huey, L. G., McMillan, W. W., Singh, H. B., and Weinheimer, A. J.: Transpacific transport of ozone pollution and the effect of recent Asian emission increases on air quality in North America: an integrated analysis using satellite, aircraft, ozonesonde, and surface observations, Atmos. Chem. Phys., 8, 6117–6136, https://doi.org/10.5194/acp-8-6117-2008, 2008.
Zhang, X., Chen, Z. M., He, S. Z., Hua, W., Zhao, Y., and Li, J. L.: Peroxyacetic acid in urban and rural atmosphere: concentration, feedback on PAN-NOx cycle and implication on radical chemistry, Atmos. Chem. Phys., 10, 737–748, https://doi.org/10.5194/acp-10-737-2010, 2010.