the Creative Commons Attribution 4.0 License.
the Creative Commons Attribution 4.0 License.
 | 19 Sep 2018
Aerosol-induced changes in the vertical structure of precipitation: a perspective of TRMM precipitation radar
Huan Liu
Daniel Rosenfeld
Mengjiao Jiang
Weixin Xu
Jonathan H. Jiang
Jing He
Dandan Chen
Min Min
Panmao Zhai
Our knowledge is still poor regarding the response of the precipitation vertical structure to aerosols, partly due to the ignorance of precipitation occurring at different spatial scales. A total of 6 years of collocated ground-based PM10 and satellite-based (Tropical Rainfall Measuring Mission, TRMM) radar data, along with ERA-Interim reanalysis, are used in this study to investigate the aerosol effects on three localized rain regimes (shallow, stratiform, and convective rain) over the Pearl River Delta region of China. A subjective analysis method is proposed to discriminate between the localized and synoptic-scale precipitations based on weather composite charts where daily averaged wind field at 850 hPa is overlaid with the geopotential height at 500 hPa. In general, average rain rate tends to be greater under polluted conditions than under clean conditions. But such potential aerosol effects are regime dependent: as the atmosphere becomes slightly polluted (PM10≤38 µg m−3), the top 1 % radar reflectivity (Z) for all regimes initially increases, followed by continued increases and weak decreases for convective and stratiform/shallow rain regimes, respectively. As the atmosphere becomes much more polluted, such regime dependences of aerosol effects are more significant. From a perspective of the vertical Z structure, comparisons between polluted conditions (days with the highest third of PM10 concentration) and clean conditions (days with the lowest third of PM10 concentration) show that the convective rain regime exhibits a deeper and stronger Z pattern, whereas a much shallower and weaker Z pattern is observed for stratiform and shallow precipitation regimes. In particular, the top height of the 30 dBZ rain echo increases by ∼29 % (∼1.27 km) for the convective regime, but decreases by ∼10.8 % (∼0.47 km) for the stratiform regime. However, no noticeable changes are observed for the shallow precipitation regime. Impacts of meteorological factors are further studied on both rain top height (RTH) and the center of gravity of Z, including vertical velocity, vertical wind shear, convection available potential energy, and vertically integrated moisture flux divergence (MFD). The possible invigoration effect on convective precipitation seems dependent on wind shear, in good agreement with previous findings. Overall, the observed dependence of the precipitation vertical structure on ground-based PM10 supports the notion of aerosol invigoration or suppression effect on cold or warm rain and adds new insights into the nature of the complex interactions between aerosol and various localized precipitation regimes.
- Article
(2507 KB) -
Supplement
(1045 KB) - BibTeX
- EndNote


Clouds and their interactions with aerosols (solid or liquid particles suspended in the atmosphere) have been documented as one of the largest sources of uncertainty for climate (Boucher et al., 2013). Therefore, a better understanding of aerosol–cloud interactions will not only help us to understand and forecast our climate much better, but also enable us to simulate the weather systems more accurately (Seinfeld et al., 2016; Jiang et al., 2017). Despite many challenges and uncertainties, there are increasing observational evidences for the aerosol-induced changes on clouds and precipitation properties (e.g., Koren et al., 2005; Rosenfeld et al., 2008; Li et al., 2011; Guo et al., 2014; Altaratz et al., 2014; Lee et al., 2016; Fan et al., 2016, 2018), as recently reviewed by Tao et al. (2012) and Li et al. (2017). On one hand, by absorbing and scattering solar radiation, aerosols can cool the surface and heat the atmosphere nearby, which leads to a more stabilized lower atmosphere and much suppressed clouds and precipitation (Hansen et al., 1997; Liu et al., 2018). This effect is termed as the aerosol radiative effect. On the other hand, by acting as cloud condensation nuclei (CCN) and ice nuclei (IN) (Andreae et al., 2009), aerosols can initiate clouds with more but smaller cloud droplets and a narrower size distribution (Squires et al., 1958; Twomey et al., 1977), which affects the subsequent cloud microphysical processes, changes the thermodynamic and dynamic conditions, and thus influences precipitation (Koren et al., 2005; Rosenfeld et al., 2008; Fan et al., 2018; Lin et al., 2018). This effect is also termed as aerosol microphysical effects.
Convective invigoration has been suggested in ample studies that both the height (Williams et al., 2002; Andreae et al., 2004; Koren et al., 2005; Jiang et al., 2008; Rosenfeld et al., 2008; Li et al., 2011; van den Heever et al., 2011; Fan et al., 2013) and fraction (Fan et al., 2013; Yan et al., 2014) of deep convective clouds increase with aerosol loading, thereby leading to stronger storms in polluted environments. At the same time, the inhibition of light precipitation by aerosols has also been reported in different regions of the world (Kaufman and Fraser, 1997; Rosenfeld and Lensky, 1998; Rosenfeld and Givati, 2006; Wang et al., 2011; Guo et al., 2014). The invigoration theory was recently generalized by Fan et al. (2018) and can also occur for shallower water clouds under extremely clean conditions, under which ultra-fine mode aerosol particles may be nucleated to release latent heat to fuel cloud development. While we have come a long way in understanding the mechanisms behind various observation-based findings, the impacts of aerosol on precipitation remain a daunting task (Tao et al., 2012). Failure in fully understanding and accounting for these effects may not only undermine our understanding of the earth's climate and its changes (IPCC, 2013), but also impair the accuracy of rainfall forecast by a numerical weather model (Jiang et al., 2017).
The net effects of aerosols on precipitation are strongly influenced and confounded by atmospheric dynamic and thermodynamic conditions, such as updraft strength (Koren et al., 2012; Tao et al., 2012; Guo et al., 2016a), wind shear (Fan et al., 2009), and atmospheric instability (Khain et al., 2004). Consequently, aerosols can indirectly modify the vertical profiles of hydrometeors and cloud phases, which can, in turn, alter the dynamics and thermodynamics of a precipitating cloud system through latent heat release (Heiblum et al., 2012). Also, the relationships between aerosols and precipitation vary significantly on seasonal and spatial scales (Huang et al., 2009a, b). It has been a great challenge to single out the aerosol effects, largely due to various processes influencing precipitation, radiation, and even the state of the atmosphere that is induced by aerosols.
The three-dimensional (3-D) structures of radar echoes, which are determined by a combination of dynamic, thermodynamic, and cloud microphysical processes, are known as a good way to represent details inside precipitating systems (Zipser and Lutz, 1994; Yuter and Houze, 1995; Min et al., 2009; Chen et al., 2016). Any systematic changes in precipitation vertical structure as aerosol varies may provide new insights into the mechanism underlying the aerosol–cloud–precipitation interaction (Koren et al., 2009; Heiblum et al., 2012; Chen et al., 2017). Indeed, the deployment of the cloud profiling radar onboard CloudSat has led to new insights into the response of clouds to aerosols (e.g., Nakajima et al., 2010; Suzuki et al., 2010; Chen et al., 2016; Peng et al., 2016). To the best of our knowledge, however, few studies have ever used the precipitation radar (PR) to analyze the association of the vertical structure of precipitation with aerosol in China.
Given the dominant effects of atmospheric dynamics on synoptic-scale precipitation systems, only precipitation events occurring on a local scale are examined in detail in the following sections. This consideration is largely due to the point-based nature of ground aerosol measurements and the strong susceptibility of the localized precipitating system to aerosol pollution (Fan et al., 2007; Lee et al., 2012; Guo et al., 2017). The goal of this study is to investigate the influence of aerosols on the vertical structure of different localized precipitation regimes by examining a large amount of collocated measurements from the precipitation radar onboard the Tropical Rainfall Measuring Mission (TRMM) and ground-based in situ aerosol measurements made in the Pearl River Delta (PRD) region of southern China. We will examine differences in the vertical structure of precipitation between clean and polluted atmospheric environments to determine whether they are consistent with some previously proposed mechanisms governing aerosol invigoration or suppression of precipitation.
The rest of this paper proceeds as follows. The study area, datasets, and methods used here are described in Sect. 2. How to discriminate between synoptic-scale and localized precipitating systems, the potential aerosol-induced changes in the vertical structure of different precipitation regimes, and their dependences on meteorological conditions are discussed in Sect. 3. Finally, the main findings of this study are summarized in Sect. 4.
2.1 Study area
The study area is mainly over the PRD region (bounded by 113 and 115∘ E, 22 and 24∘ N, red rectangles in Fig. 1), including many populated cities with relatively high emissions (e.g., Guangzhou, Shenzhen, Zhuhai, and Hong Kong). The PRD has a humid subtropical climate, which is strongly influenced by the Asian monsoon circulation and tropical cyclones originated in the western Pacific Ocean (Ding, 1994). In recent decades, the PRD region experienced rapid economic development, which caused heavy air pollution associated with human activities, including the increasing fossil fuel combustion due to industrialization (Deng et al., 2008; Guo et al., 2009; Guo et al., 2016b). In addition, another main reason for us to take the PRD region as our region of interest (ROI) is the well-documented significant positive correlations between air pollution and the occurrence frequency of precipitation over this area (e.g., Wang et al., 2011; Yang and Li, 2014).
Table 1Specifications from TRMM-PR-retrieved precipitation, China National Environmental Monitoring Center (CNEMC) in situ measured PM10, and ECMWF reanalysis meteorological data used in this study for the period of 1 January 2007 to 31 December 2012. Criteria for selecting data for further comprehensive analysis are provided in the footnote.
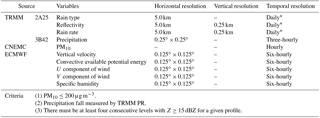
* Calculated from the times of the TRMM PR swath overpassing the PRD region.
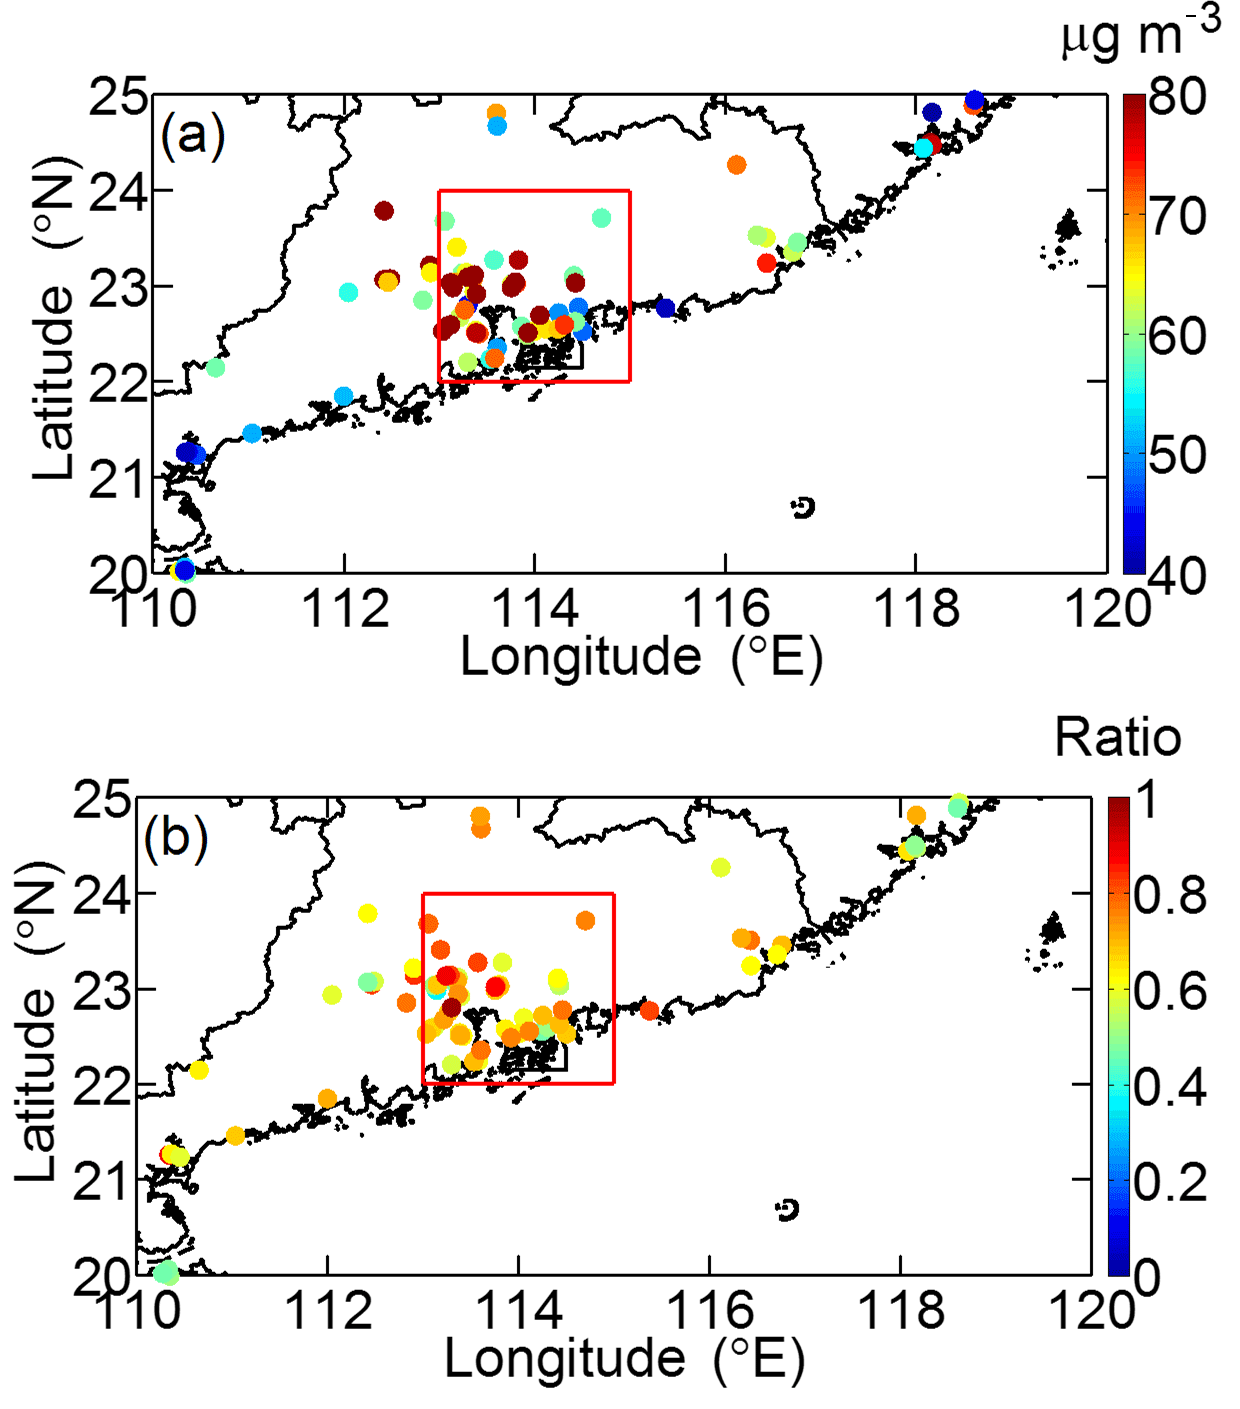
Figure 1Spatial distributions of (a) ground-based mean PM10 (in µg m−3) and (b) the ratio of mean PM2.5 to mean PM10 simultaneously measured for the period from November 2013 to October 2014. The red box outlines the PRD region; the dots show the locations of the PM measurement sites.
2.2 Data
The datasets used here are listed in Table 1 and are briefly described here. Notably, 6 years (from 1 January 2007 to 31 December 2012, unless noted otherwise) of precipitation measurements from the TRMM PR (version 7, Huffman et al., 2007), combined with collocated aerosol data collected at ground surface, and meteorological data from the European Centre for Medium-Range Weather Forecasts (ECMWF) ERA-Interim reanalysis (Dee et al., 2011) are analyzed here. Prior to further explicit observational analyses, the spurious signals likely resulting from measurement uncertainties should be firstly considered, such as the misclassification of rain profiles, abnormal observations, and so on. To minimize such uncertainties, we screen the aerosol and precipitation observational data very carefully, which will be detailed as follows.
2.2.1 TRMM PR and 3B42 data
The precipitation properties are obtained from the TRMM PR products 2A25 and 3B42 (Huffman et al., 2007). For each rain profile, the information of the category, attenuation-corrected reflectivity (Z), and rain rate (R) are provided by 2A25 with a vertical/horizontal resolution of ∼250 m/∼4–5 km, depending on the satellite orbit height and the PR off-nadir view angle. The profile ranges from the near-surface to 20 km altitude. The 2A25 products classify each rain profile as convective or stratiform rain with different confidence levels. Here we obtain rain profiles identified as stratiform or convective precipitation based on the 2A25 products alone and further extract the shallow isolated echo category from convective precipitation as shallow regimes for better characterizing the precipitating system. The classification is done for each profile, so different rain regimes could come from the same precipitation event. Their possible dynamic and thermodynamic connections, therefore, likely cause certain uncertainties in the following analyses, which will be discussed later. Additionally, two criteria are used to ensure that each profile contains a reliable precipitation event: (1) Z≥15 dBZ (the minimum detectable Z for the TRMM PR, Kummerow et al., 1998); and (2) at least four consecutive levels with Z≥15 dBZ are required for each profile. The horizontal distribution of R is provided by 3B42 with a spatial/temporal resolution of /3-hourly over the global belt between 50∘ N and 50∘ S. The 3B42 product merges precipitation radar and microwave rainfall estimates with infrared-based precipitation estimates from multiple satellites, as well as measurements from rain gauges (Huffman et al., 2007).
2.2.2 Ground-based PM10 measurements
Given the difficulties in obtaining large-scale CCN concentration information, we have to resort to any CCN proxy such as satellite-derived aerosol optical depth (AOD) and the aerosol index (AI), or ground-based particulate matter (PM) measurements. Sound correlations have been extensively documented between (i) satellite retrievals of AOD and (ii) cloud and precipitation properties (e.g., Koren et al., 2005, 2012; Huang et al., 2009b). Such correlations, however, are susceptible to various uncertainties arising from cloud contamination and the dependence of AOD on certain atmospheric components like water vapor (e.g., Li et al., 2009; Boucher and Quaas, 2013). Moderate Resolution Imaging Spectroradiometer (MODIS) AOD products are available for less than 30 % of the time over the PRD region (Wang et al., 2015). AI, defined as the product of AOD and the Ångström exponent, has been reported as a better proxy than AOD to quantify CCN concentration due to its ability to weight AOD measurements towards the fine mode (Nakajima et al., 2001). The Ångström exponent is restricted over oceans because of its large uncertainties over land (Levy et al., 2010), so large uncertainties will arise when using AOD or AI as a proxy for CCN (Andreae, 2009). These uncertainties can be reduced by applying the method proposed by Liu and Li (2014). However, the most serious problem in using AOD as a proxy for CCN lies in the fact that AOD is only measurable under cloud-free conditions and is subject to various retrieval errors, as critically reviewed by Li et al. (2009).
Given the aforementioned considerations, we choose to use the rich dataset of ground-based PM10 observations in the PRD region, which are available from 1 January 2007 to 31 December 2012. While it would be better to use aerosols with an aerodynamic diameter less than 1 µm (PM1) and those with a diameter less than 2.5 µm (PM2.5) as proxies of CCN (Seinfeld and Pandis, 1998), much fewer such data are available for matching with TRMM data during the period selected for this study. Using a recent year of coincident PM2.5 and PM10 measurements at the region studied here, we found most megacities in the PRD (e.g., Guangzhou and Shenzhen) are characterized by a large ratio (> 0.7) of PM2.5 ∕ PM10 (Fig. 1). This indicates that the pollution over the PRD region is largely generated by anthropogenic activities. Because this study is concerned with establishment of the contemporaneous association of radar echo reflectivity with various aerosol loadings, using PM10 (available under all-sky conditions) as a proxy for CCN is sufficient for our needs. Vertical profiles of aerosols and clouds over the PRD region obtained from the Cloud-Aerosol Lidar and Infrared Pathfinder Satellite Observations mission show that aerosol particles are generally well mixed in the boundary layer (Wang et al., 2015). PM10 data can then indicate major aerosol episodes over the relatively small domain in the PRD region (∼200 km ×200 km). Additionally, according to Anderson et al. (2003), the variability in aerosol properties at such a spatial scale is not very large.
2.2.3 Reanalysis data
Due to the meteorological factors influencing simultaneously aerosol concentration and precipitation, it will be more feasible if the investigation of the co-variation of aerosol and precipitation is considered under similar meteorological conditions. A variety of meteorological variables will be used here for scaling out the aerosol effect on precipitation, including vertical velocity (ω, Koren et al., 2012), vertical wind shear between 850 hPa (∼1.5 km) and 500 hPa (∼5.5 km) (Fan et al., 2009; Guo et al., 2016a), moisture flux divergence (MFD) from 1000 hPa (near surface) to 400 hPa (∼7 km) (Khain et al., 2008), and convective available potential energy (CAPE, Dai et al., 1999). These variables are calculated or directly obtained based on the ECMWF ERA-Interim reanalyses, which are available four times a day, with a horizontal resolution of at pressure levels equaling to 1000, 975, 950, 925, 900, 875, 850, 825, 800, 775, 750, 700, 650, 600, 550, 500, 450, and 400 hPa. The definition of MFD in units of g/(cm2 s) is as follows:
where VH represents the horizontal wind vector, U and V represent the U and V components of wind (in units of m s−1), q represents specific humidity (in units of g kg−1), P represents pressure (in units of hPa), and g represents the acceleration due to gravity. MFD was calculated at 18 standard pressure levels: 1000, 975, 950, 925, 900, 875, 850, 825, 800, 775, 750, 700, 650, 600, 550, 500, 450, and 400 hPa. A negative MFD means convergence of water vapor and a positive MFD divergence of water vapor.
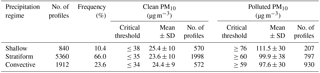
Table 2Statistics describing the three precipitation regimes analyzed in the study. The critical PM10 thresholds discriminating between clean (bottom 1∕3) and polluted (top 1∕3) conditions and their corresponding mean PM10 concentrations are also listed, so are the number of precipitation profiles. Data are from TRMM PR retrievals made over the PRD region.
2.3 Methods
2.3.1 Stratification of precipitation using PM10 measurements
As mentioned above, three precipitation regimes (i.e., shallow, stratiform, and convective) are directly derived from the TRMM 2A25 product. We only consider cases with simultaneously available measurements of both PM10 and rain measurements. This study attempts to differentiate the data corresponding to the lowest and highest terciles of PM10 concentration, which are used to denote the cleanest and most polluted conditions, respectively. The PM10 dataset is therefore divided into three terciles with each tercile containing an equal number of localized precipitation events. As such, a sufficient contrast can be obtained between clean and polluted subsets while retaining good sampling statistics (Koren et al., 2012). The samples are evenly distributed across the four seasons (Fig. S1 in the Supplement), likely due to the dominant convection nature of the localized precipitation events analyzed here. Table 2 summarizes the total number of profiles; occurrence frequency (in %) of profiles; and the critical threshold of PM10 used to distinguish between the clean and polluted categories for shallow, stratiform, and convective precipitation regimes, respectively. In particular, the clean conditions correspond to average PM10 concentration of 25.4/23.6/24.4 µg m−3 for shallow/stratiform/convective precipitation regimes, while polluted ones correspond to 111.5/99.9/97.6 µg m−3. It seems that PM10 is higher during the periods with occurrence of shallow convection than the other two precipitation regimes. This likely implies that heavy pollution tends to inhibit deep convection development sometimes, although it will invigorate deep convection once the negative impacts of aerosols are overcome. Considering the huge range of convective rain intensity and the possible severe influence of extreme rain, we further divided the convective rain regime into three subgroups, based on hourly R, as light (R < 10 mm h−1), moderate (10≤R < 20 mm h−1), and heavy (R≥20 mm h−1) rain for details.
2.3.2 Normalized contoured frequency by altitude diagram
To highlight the aerosol effect on the vertically evolving process of precipitation, TRMM-PR-observed Z profiles are used to construct the contoured frequency by altitude diagram (CFAD, Yuter and Houze, 1995), which ignores variation in time and location and retains only variation in Z for different vertical layers. There may be times when there are few occurrences of Z in a particular range of H. To overcome this problem, an improved statistical technique known as the normalized CFAD (NCFAD) has been widely used (e.g., Fu et al., 2003). The improvement comes from normalizing the frequency at each altitude level to the total number of points at all levels. Therefore, the normalized occurrence frequency of the jth Z at the ith level (NCFADij) is expressed as
where N(H,Z) is the frequency distribution function defined as the number of observations of Z in the range of Z to Z+Z at a height above ground ranging from H to H+H. The index i goes from 1 to 80 (in intervals of 0.25 km) and the index j goes from 1 to 60 (in intervals of 1 dBZ).
2.3.3 Reflectivity center of gravity
The bulk precipitation system parameter called the reflectivity center of gravity (ZCOG) is used to represent the vertically weighted reflectivity distribution (Chen et al., 2016). The ZCOG can cancel out any systematic reflectivity biases throughout the vertical profile, indicates the height where the great Z value tends to concentrate, and is highly sensitive to precipitation microphysical and dynamical processes (Koren et al., 2009). It is defined as
where Z is the measured radar reflectivity in dBZ; H is the height above ground in km; and i is an index from 1 to 80, representing different levels in the atmosphere. A larger magnitude of ZCOG means that the precipitation system has developed to a higher level in the atmosphere, indicating stronger convection system.
3.1 Discrimination between synoptic-scale and localized precipitating systems
Generally speaking, synoptic-scale precipitation involves frontal passages or low-pressure systems, as compared with localized precipitation characterized by thermal-driven convective clouds fed by the boundary layer air (aerosol). Our recent study (Guo et al., 2017) indicates that localized precipitation events are more closely linked to aerosol compared with synoptic-scale precipitation. In order to make sure that only precipitating systems more susceptible to the boundary layer aerosol were considered, all the satellite scenes with synoptic-scale precipitation were excluded. The discrimination between localized and synoptic-scale precipitation events for a given day largely relies on the weather composite charts, where the daily averaged wind field at 850 hPa was overlaid with the geopotential height at 500 hPa. Particularly, the localized precipitation event for a given day was subjectively determined as follows: (1) there exist favorable atmospheric conditions for the initiation and development of localized precipitation events through visual interpretation of the weather composite plot for the day analyzed, (2) the minimum rainfall greater than 0.1 mm d−1 was recorded at any gauges in the study area (red box in Fig. 1), and (3) there are ground-based PM10 measurements collocated with precipitation measurements from TRMM in an attempt to obtain a pair of valid aerosol–precipitation data. As such, the total number of collocated samples reached up to 253 for localized precipitation events, whereas they were 194 for synoptic-scale precipitation events. Given the fact that deep convections sometimes develop from shallow convections (Houze, 1993; Li and Schumacher, 2011; Yang et al., 2015), it is possible that the subjective composite method will divide one precipitation event into different types, which will lead to large uncertainties in determining precipitation regimes from TRMM data alone. This deserves more explicit analyses aided by geostationary satellite data in the future, which is beyond the scope of this study.
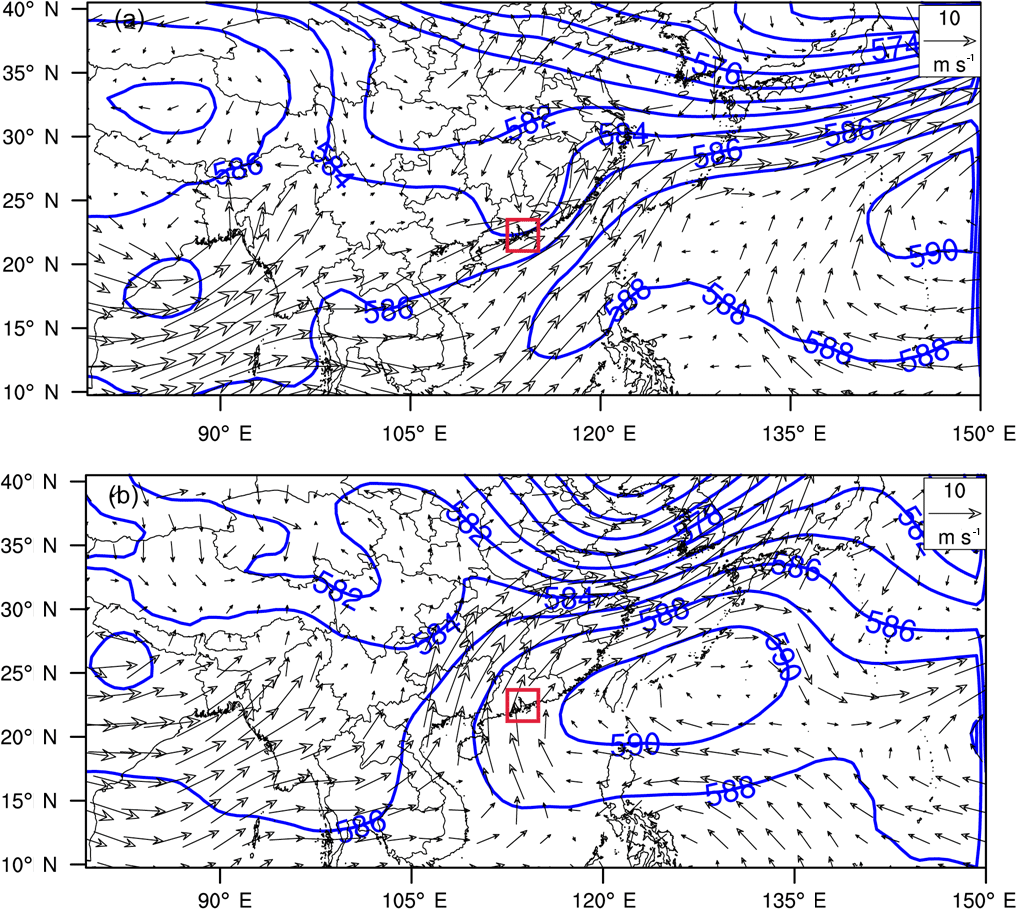
Figure 2Spatial distribution of the wind field at 850 hPa pressure level (black arrows, vector), superimposed by geopotential height at 500 hPa pressure level (blue lines) averaged on 26 June 2008 (a) and 2 July 2008 (b). All data are from the ECMWF ERA-Interim reanalysis data, and the red rectangle denotes the study area.
Figure 2 illustrates two typical weather plots, corresponding to synoptic-scale and localized precipitation events. On 26 June 2008, the PRD region lies at the bottom of the weak low pressure at 500 hPa level (Fig. 2a). At 850 hPa level, there is a weak cyclone on the left-forward side of PRD, where a southwestern to northeastern low-level jet stream overpasses at the same time, leading to strong water vapors advected over PRD from the South China Sea. More importantly, the wind shear observed at 850 hPa is most favorable for the formation and evolution of precipitation. Overall, the weather patterns at both 500 and 850 hPa help the onset and development of large-scale convection, so this precipitation event that occurred over PRD can be thought of as a typical synoptic-scale precipitation event. In contrast, PRD is largely controlled by the subtropical high-pressure areas, in combination with the anticyclone systems at low levels on 2 July 2008, as shown in Fig. 2b. This precipitation event can be attributed to localized thermal convection with high confidence. As such, all of the localized precipitation events have been retrieved using these visual assessment methods, which are then used for further aerosol–precipitation interaction below.
3.2 The contemporaneous link between radar reflectivity of precipitation and aerosol
In this section, the possible aerosol effect on localized precipitation is investigated. Precipitation enhancement or inhibition by aerosols is examined by comparing R under polluted and clean atmospheric conditions. Daily mean R is first calculated over the PRD region. Figure 3 shows the geographical and frequency distributions of differences in R, which are calculated as R under polluted conditions minus that under clean conditions. Caution must be exercised in the interpretation of the TRMM 3B42 precipitation product because a droplet size distribution affected by the presence of pollution (producing more and smaller drops) would lead to a different Z–R relation, which also depends on the microphysical, dynamical, and topographical context of the precipitating clouds (Rosenfeld and Ulbrich, 2003). This may be what is happening in Fig. 3a, which shows a few grid boxes where precipitation enhancement occurs during polluted conditions. The frequency distribution of differences in R (Fig. 3b) further shows that negative differences in R can be seen over roughly 30 % of the study area under polluted conditions compared with clean conditions. In other words, ∼70 % of the study area has an increased R when aerosol loading increases. These statistical results appear to support in some way the notion of precipitation enhancement by increases in aerosol pollution, but at this stage the effect of meteorological factors described in Sect. 2.2.3 on precipitation cannot be excluded.
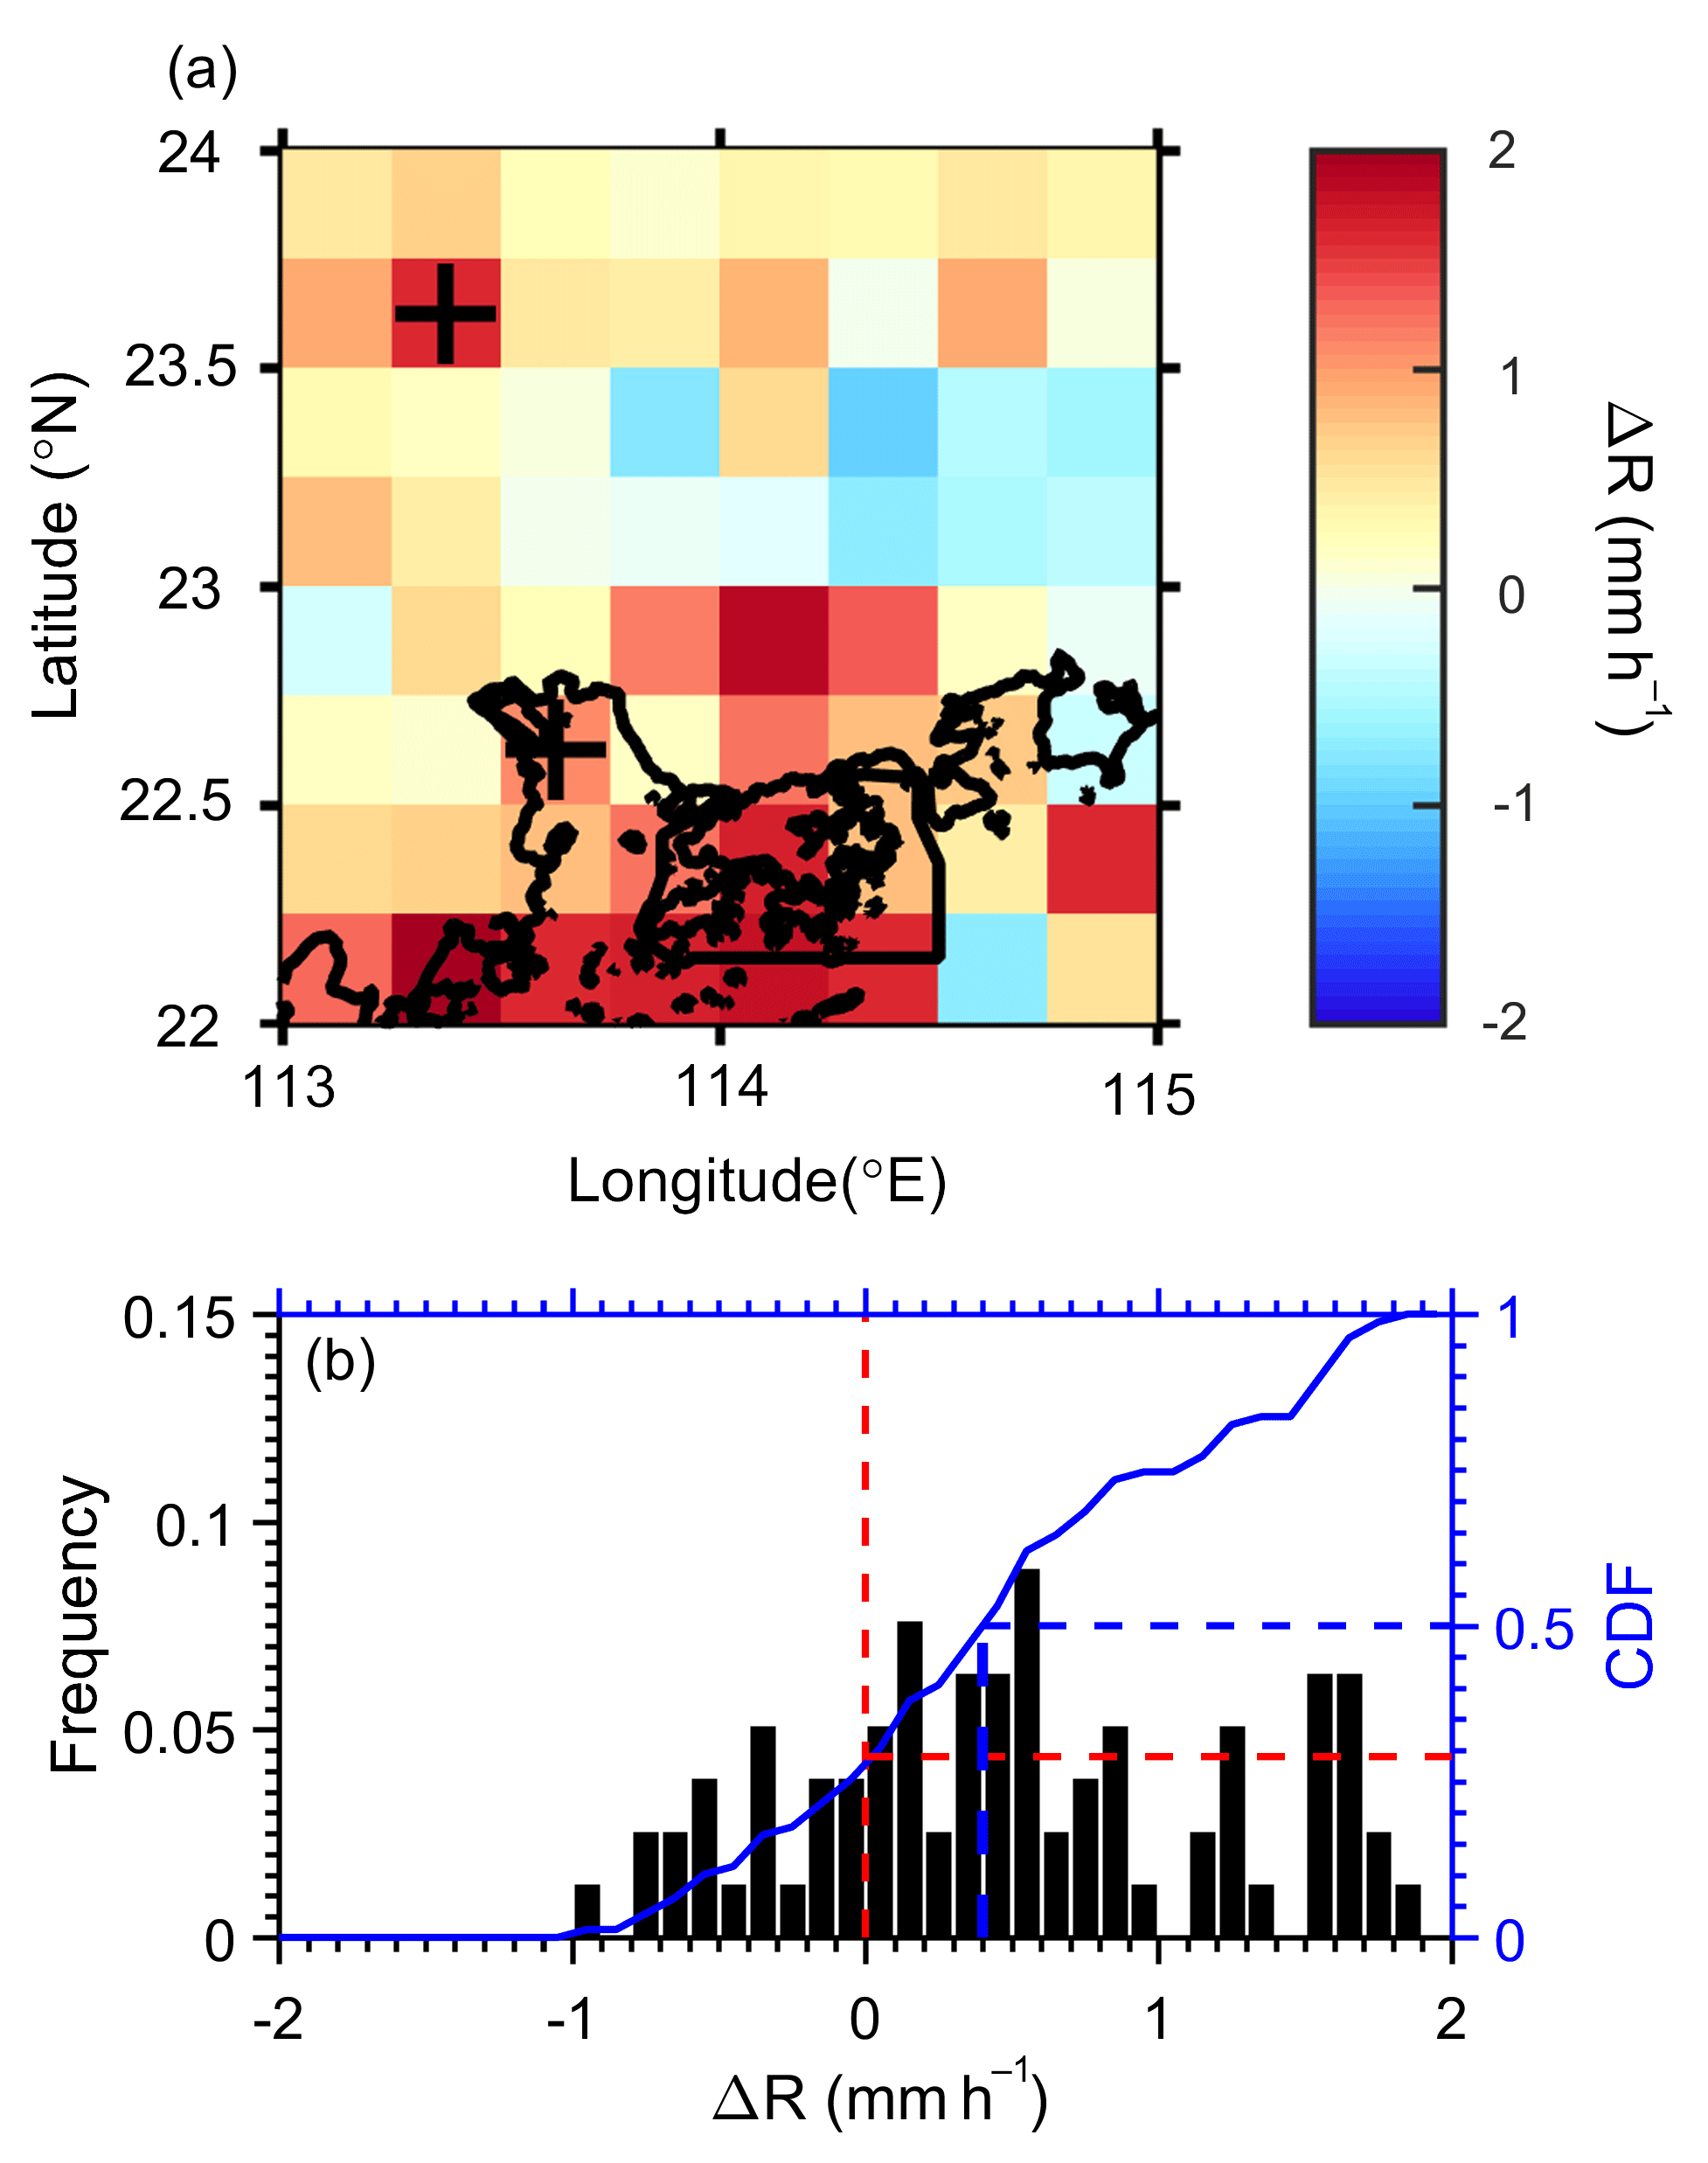
Figure 3(a) Differences in precipitation intensity (polluted minus clean conditions, mm h−1) over the PRD region. The black dots show grid boxes for which the difference exceeds the 95 % significance level (p < 0.05) according to the two-tailed Student's t test. (b) Histogram showing the occurrence frequency (OF) and its cumulative distribution frequency (CDF) of precipitation intensity differences between polluted and clean conditions. The threshold value used to discriminate between clean and polluted atmospheric conditions corresponds to the lowest and highest third of the PM10 concentration averaged over the PRD region, respectively. The points where blue and red dashed lines cross correspond to cumulative probabilities of 29 %.
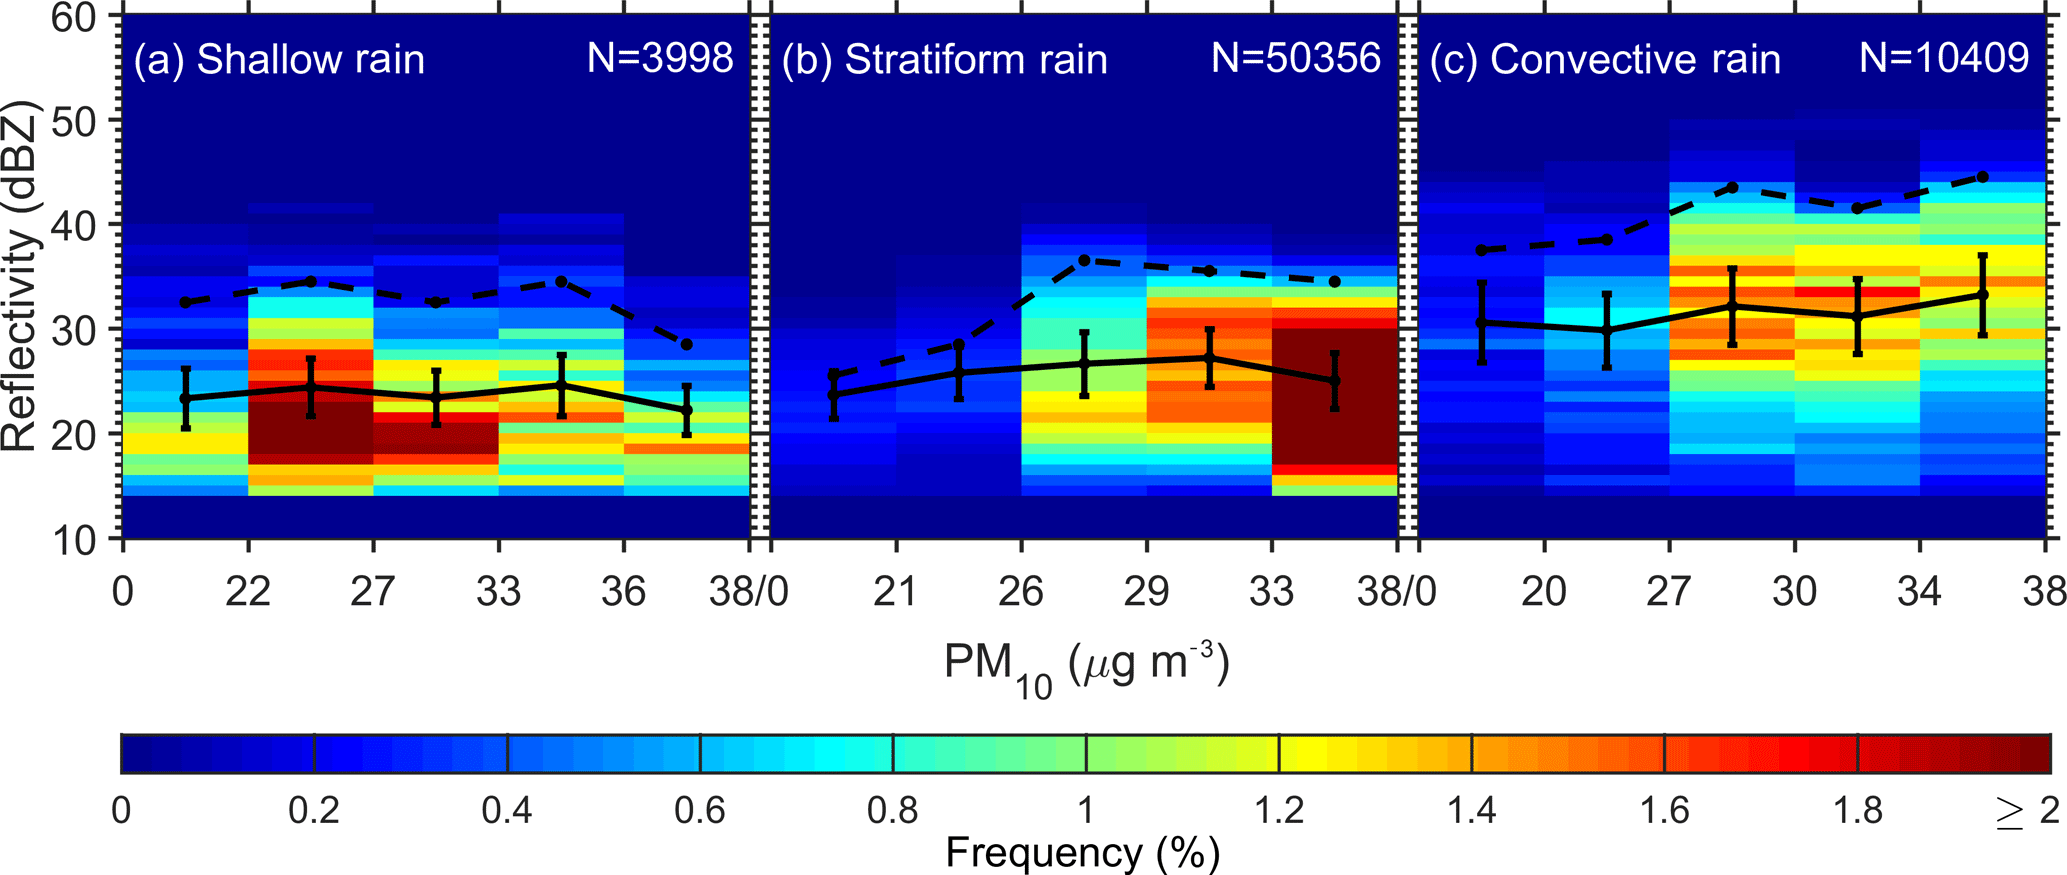
Figure 4Joint occurrence frequency of PM10–Z pair for (a) shallow, (b) stratiform, and (c) convective rain regimes, respectively. Z is acquired from TRMM 2A23 products for altitudes ranging from 1 to 5 km during the period 2007–2012. The top 1 % (mean) with respect to occurrence frequency for each PM10 concentration bin is represented by dashed (solid) black lines. The total number of Z values (N) used for the calculation of frequency is shown in the upper-right corner of each panel.
A few recent studies (Koren et al., 2014; Wang et al., 2015) have shown that less developed cloud and precipitation are very sensitive to aerosol when the atmosphere transitions from pristine to slightly polluted conditions. Therefore, more focus is on the initial stage of atmospheric pollution, and then on seeing how the occurrence frequency covaries with aerosol and Z, which is limited to the lowest tercile (≤38 µg m−3 in Table 2) of PM10 concentrations. Figure 4 shows the average occurrence frequency (OF) in each PM10–Z concentration bin for shallow, stratiform, and convective regimes. There is little systematic change in mean Z with aerosol loading for all precipitation regimes (solid black lines). The top 1 % OFs for convective precipitation, however, has an increasing trend in Z as the aerosol loading changes from pristine to slightly polluted; i.e., PM10 concentration varies from 0 to roughly 38 µg m−3, as highlighted by the dashed black line of Fig. 4c. The trend stabilizes at relatively high PM10 concentrations. Given that meteorological variables are not correlated with PM10 (cf. Figs. S2–S3), aerosols are assumed to be able to invigorate precipitating convective clouds with larger reflectivity when the aerosol loading is relatively low, which is the same as in the stratiform precipitation case to some extent. For stratiform precipitation, as aerosol loading continuously increases, the top 1 % OF for each bin of radar reflectivity goes up sharply then levels off. In other words, the aerosol invigoration effect is observed for stratiform precipitation, which largely occurs as the atmosphere becomes slightly polluted (PM10 < 38 µg m−3). By contrast, there is no distinct variation in reflectivity with aerosol loading for shallow precipitation.
3.3 Changes in the vertical structure of precipitation associated with aerosols
The vertical structure of precipitation (in the form of radar reflectivity) to some extent represents the convective intensity and precipitation microphysics of a precipitation system (Zipser and Lutz, 1994; Yuan et al., 2011). Due to the intrinsic dependence of R on Z (Fig. S4), changes in the vertical structure of Z as a function of aerosol concentration, if any, can indicate aerosol effects on convective intensity and precipitation formation. Differences in Z profiles between polluted and clean conditions for shallow, stratiform, and convective regimes are examined next.
Figure 5 shows the differences in vertical profiles of the frequency of occurrence (OF) of Z between polluted and clean cases for shallow, stratiform, and convective precipitation regimes. The most striking finding is the well-defined feature of positive and negative differences dominant in different parts of the plotting domain, irrespective of seasons (Fig. S5). If aerosols had no effect, we would see mixed colors without such distinct patterns. As explained below, not only are the patterns well defined, but the robust statistics are also well behaved, which is consistent with the well-established theories of aerosol–cloud interactions (e.g., Rosenfeld et al., 2008; Li et al., 2011; Tao et al., 2012).
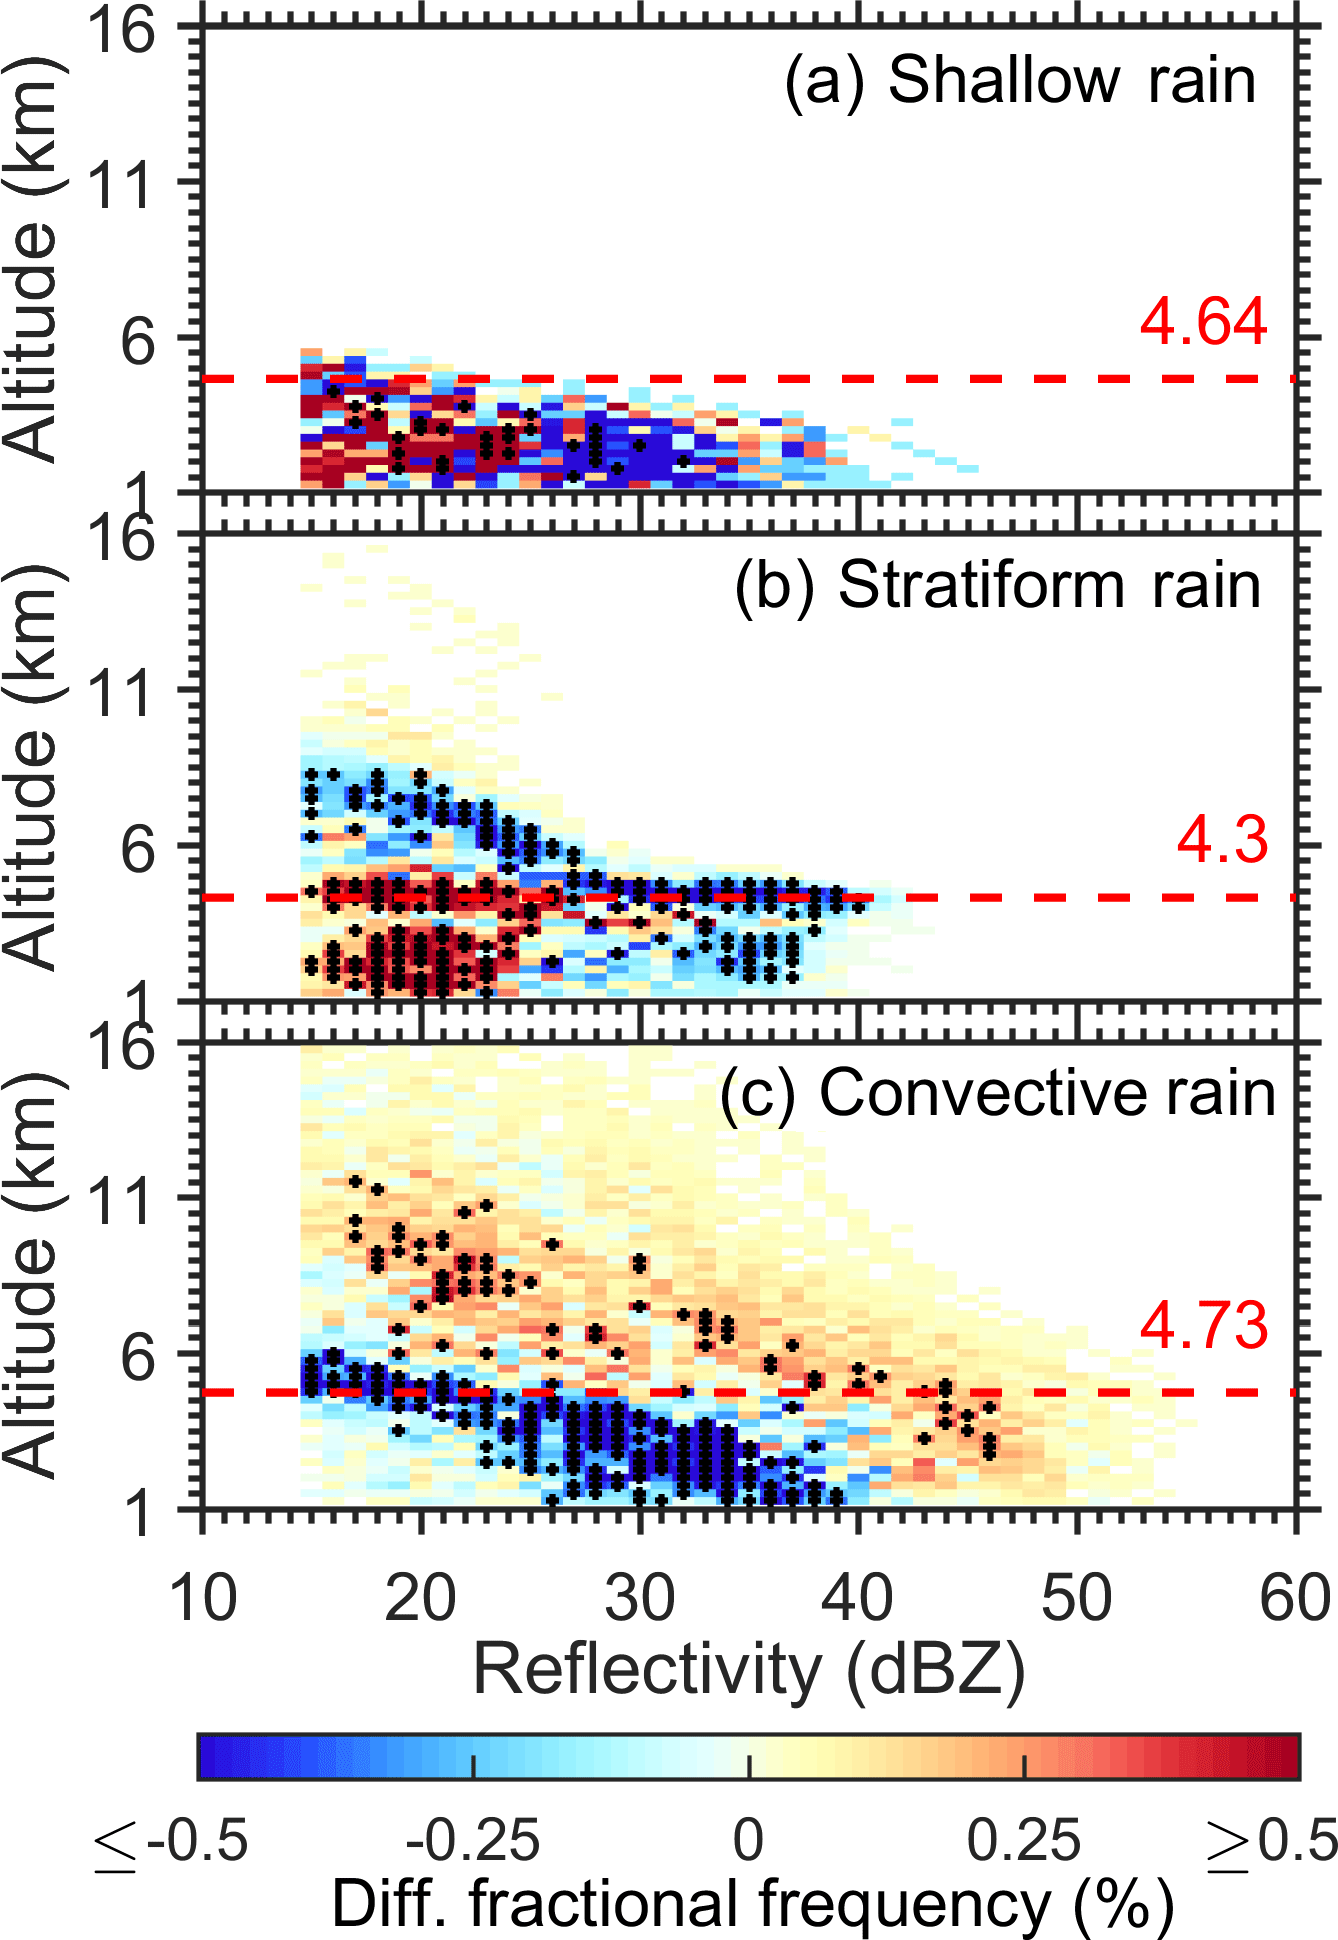
Figure 5The differences of normalized contoured frequency by altitude diagram (ΔNCFAD) showing the differences in occurrence frequency for detected rain echoes (polluted minus clean) for (a) shallow, (b) stratiform, and (c) convective regimes. Data are from TRMM PR retrievals made during 2007–2012. The horizontal red dashed lines show the freezing level and the black crosses mark grid points where the difference exceeds the 95 % significance level (p < 0.05) according to the Pearson's χ2 test.
As expected, convective precipitation is more vertically developed than shallow and stratiform precipitation regimes. For shallow precipitation (Fig. 5a), the Z values less than 25 dBZ are more frequent under polluted conditions below 3 km, which could be due to the aerosol suppressing effect that leads to a reduced frequency on the right (blue) and an enhanced frequency on the left (red). By comparison, for Z greater than 25 dBZ, negative frequency values dominate. In general, the pattern of ΔNCFAD for stratiform precipitation (Fig. 5b) is similar to that of shallow precipitation, except for its development to relatively higher altitudes.
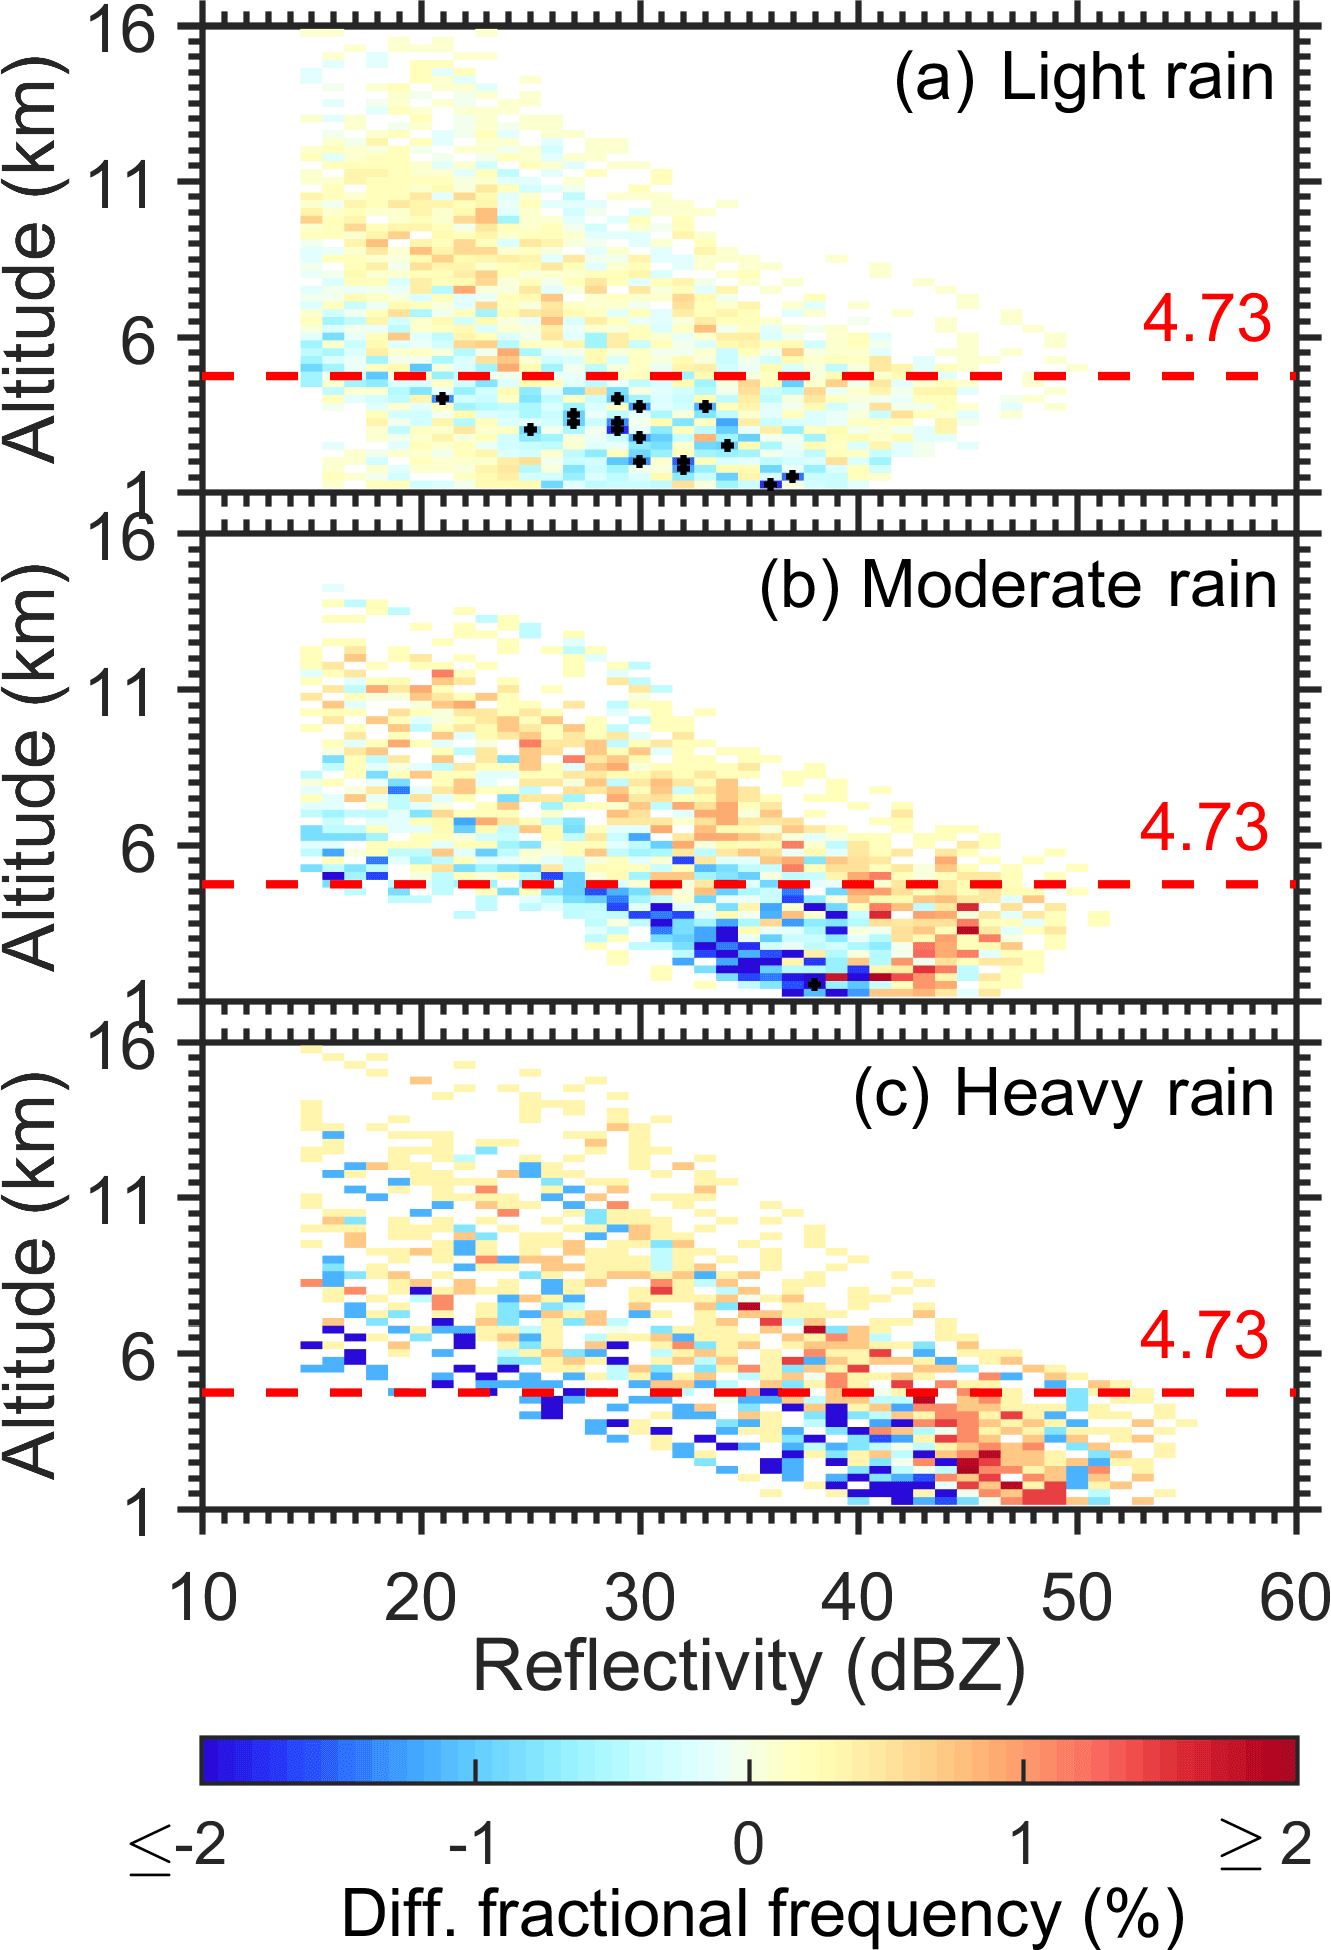
Figure 6NCFAD showing the differences in the occurrence frequency for detected convective precipitation echoes (polluted minus clean) for (a) light precipitation, (b) moderate precipitation, and (c) heavy precipitation. Data are from TRMM PR retrievals made during 2007–2012. The horizontal black dashed lines show the freezing level and the black crosses mark grid points where the difference exceeds the 95 % significance level (p < 0.05) according to the Pearson's χ2 test.
Convective precipitation has a totally different ΔNCFAD pattern (Fig. 5c). For the radar echoes above 5 km and those larger than 40 dBZ, both of which are mostly mixed-phase or ice processes, the overwhelming warm colors indicate that precipitation echoes in the presence of heavy aerosols tend to be invigorated. Below the freezing level where the reflectivity is less than 40 dBZ, the color is virtually all blue, meaning that precipitation is weaker under polluted conditions than clean ones. This could also be due to a large number of smaller sizes of rain drops within polluted environment. The reversal behavior of radar echo intensity around the freezing level for stratiform and convective clouds can hardly be explained by any meteorological factors unless they are correlated with PM10, which seems not to be the case (Figs. S2–S3). A more plausible, but not necessarily the sole explanation, is rooted on aerosol microphysical effects, which leads to the invigorated cloud and precipitation above the freezing level at the expense of lower levels (Rosenfeld et al., 2008; Li et al., 2011). Aerosol microphysical and radiative effects on precipitation usually interact and sometimes cancel each other out, leading to either invigoration or suppression (Rosenfeld, 2000; Zhang et al., 2007; Rosenfeld et al., 2008), with both effects being found from such long-term measurements as the ARM (Li et al., 2011). Aerosols have an invigorative or suppressive effect depending on various factors, such as wind shear, humidity, cloud water amount, and precipitation intensity (Fan et al., 2009; Li et al., 2011; Guo et al., 2014).
Given the relatively huge intensity of convective precipitation and its severe socioeconomic impact, further analyses are performed for the convective precipitation regime by separately considering three different precipitation intensities associated with convective precipitation (light, moderate, and heavy convections defined in Sect. 2.3.1). Figure 6 shows the ΔNCFADs of Z for light, moderate, and heavy convections. Similar to Fig. 5, positive frequency for the radar echoes above the freezing level (roughly 5 km) in the presence of aerosols can be seen for convective precipitation regardless of precipitation intensity. Interestingly, negative frequency dominates below about the 5 km level for light convective precipitation, but the magnitude is much smaller compared with moderate to heavy convective precipitation. For radar precipitation echoes < 30 dBZ; NCFAD patterns are similar in all categories of convective precipitation.
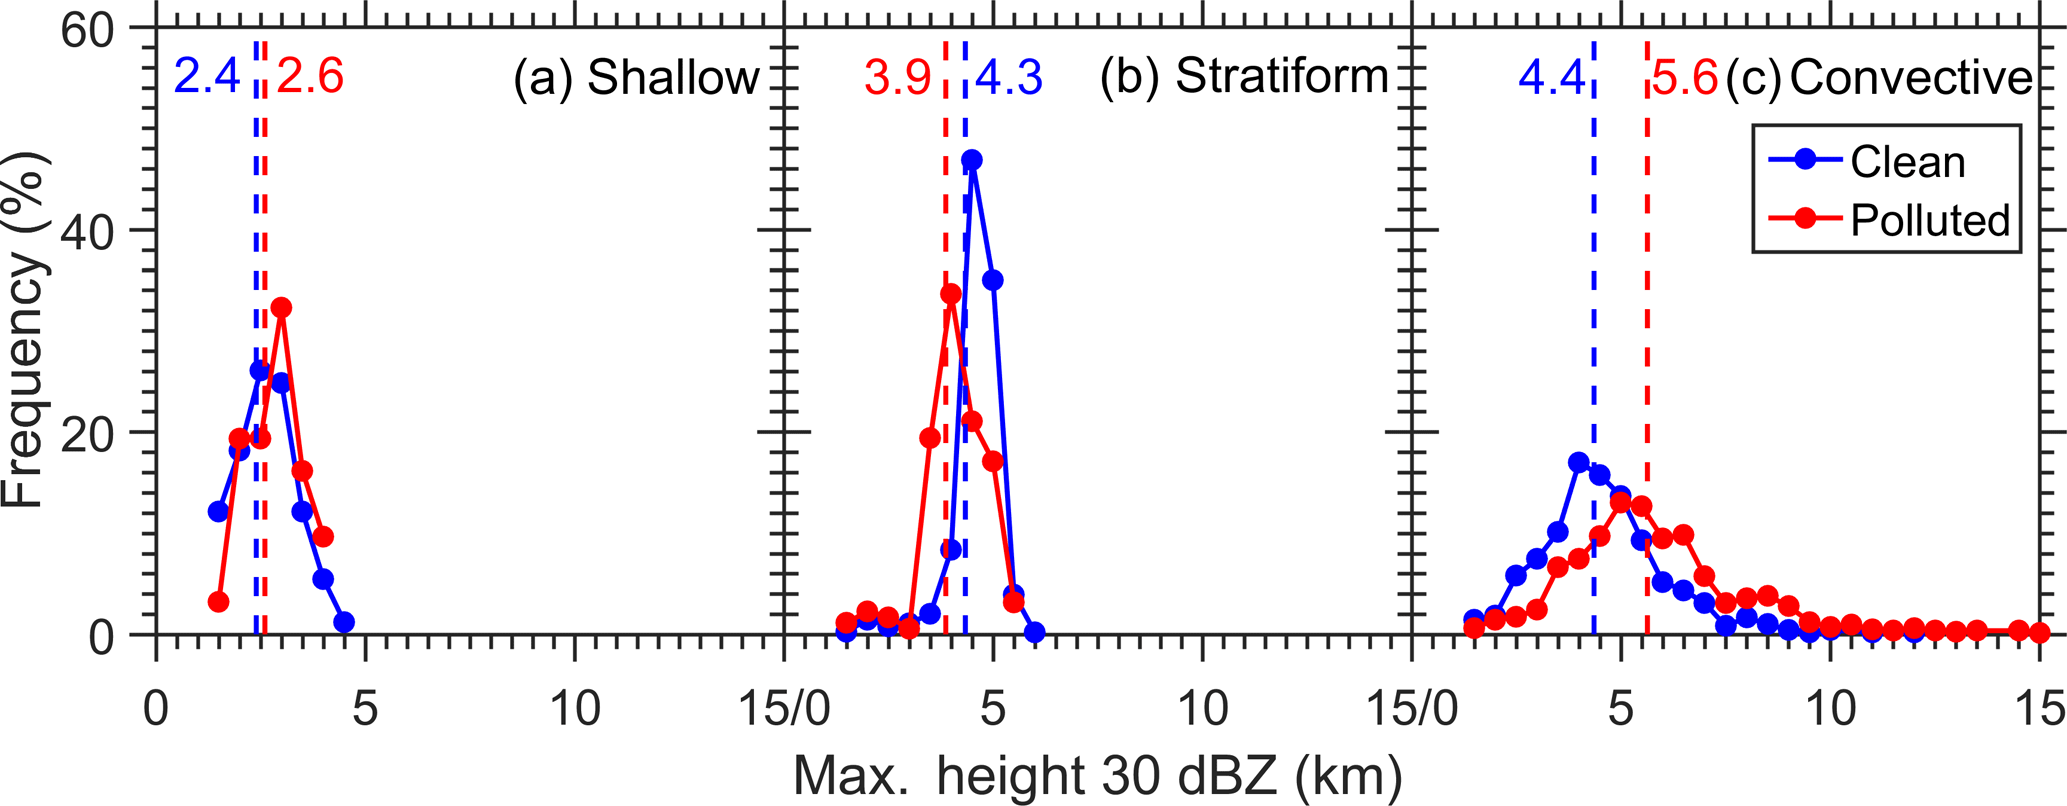
Figure 7Occurrence frequencies (OF) of top height that the 30 dBZ radar echo can reach of (a) shallow, (b) stratiform, and (c) convective precipitation. Data are from TRMM PR retrievals made during 2007–2012. Red and blue colors represent polluted and clean cases, respectively. Vertical lines represent the corresponding average value of the top heights.
Table 3Statistics describing the mean top height that 30 dBZ radar echoes can reach under polluted and clean conditions for different precipitation regimes. The numbers in italics indicate that the differences between polluted and clean conditions are statistically significant at the 95 % confidence level according to the two-tailed Student's t test.
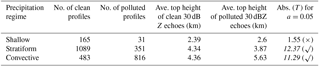
The enhancement of 30 dBZ reflectivity above the freezing level is often associated with larger ice particles and more supercooled liquid water contents (Zipser, 1994). Therefore, another way of ascribing internal Z differences in convective echoes to differences between polluted and clean conditions is to consider the maximum height of the 30 dBZ echo. Figure 7 shows that the 30 dBZ echo heights of convective (stratiform) precipitation are on average elevated (decreased) from 4.36 km (4.34 km) under clean condition to 5.63 km (3.87 km) under polluted conditions. In other words, an increase of 29.0 % is observed in the presence of aerosols for the 30 dBZ echo height of stratiform regime, as opposed to a decrease of −10.8 % in the 30 dBZ echo height. However, no any significant increase or decrease can be seen in the 30 dBZ radar echo height for shallow precipitation. This means that the convective (stratiform) precipitation regimes under polluted conditions are generally developed deeper (shallower) under polluted conditions than those under clean conditions for all 30 dBZ maximum heights, as indicated in Fig. 7b (Fig. 7c). These generally agree with the results shown in Figs. 4–5. Overall, the difference is statistically significant in terms of average height between the polluted and clean cases, except for shallow precipitation (Table 3).
The results shown in Figs. 4, 5, and 7 along with Table 3 all point to a possible invigoration (suppression) effect for convection (stratiform) precipitation regimes, which may be partly due to the aerosol radiative, microphysical, or combined effect on the vertical development of various precipitation systems (Liu et al., 2018). But at this stage, such influence cannot be attributed to aerosols alone. Therefore, further analyses on the dependence of aerosol–precipitation interactions on meteorology will be performed in the following section.
3.4 The aerosol–meteorology–precipitation dilemma
The aerosols and precipitating systems are reported to be simultaneously influenced by the meteorology, which is also dubbed as a buffered system due to the complex feedback between them (Stevens and Feingold, 2009). Therefore, the aerosol microphysical effects may not entirely account for the systematically ΔNCFAD observed before, and possible influence of meteorological conditions on aerosol–precipitation interactions should be further investigated. In this section, responses of the precipitation vertical structure to aerosol concentrations are further associated with four main dynamic and thermodynamic conditions (ω, vertical wind shear, MFD, and CAPE). In addition, the role of rain top height (RTH, defined as the maximal height with Z≥18 dBZ) has been well recognized in describing the intensity of convections (Houze and Cheng, 1977), while ZCOG is representative of the internal structure of Z to some degree (Koren et al., 2009; Chen et al., 2016). As a result, both RTH and the ZCOG are used to examine the vertical structure of convective echoes in association with aerosol pollution. The aerosol indirect effect may not entirely account for the systematically different NCFADs observed under polluted versus clean atmospheric conditions.
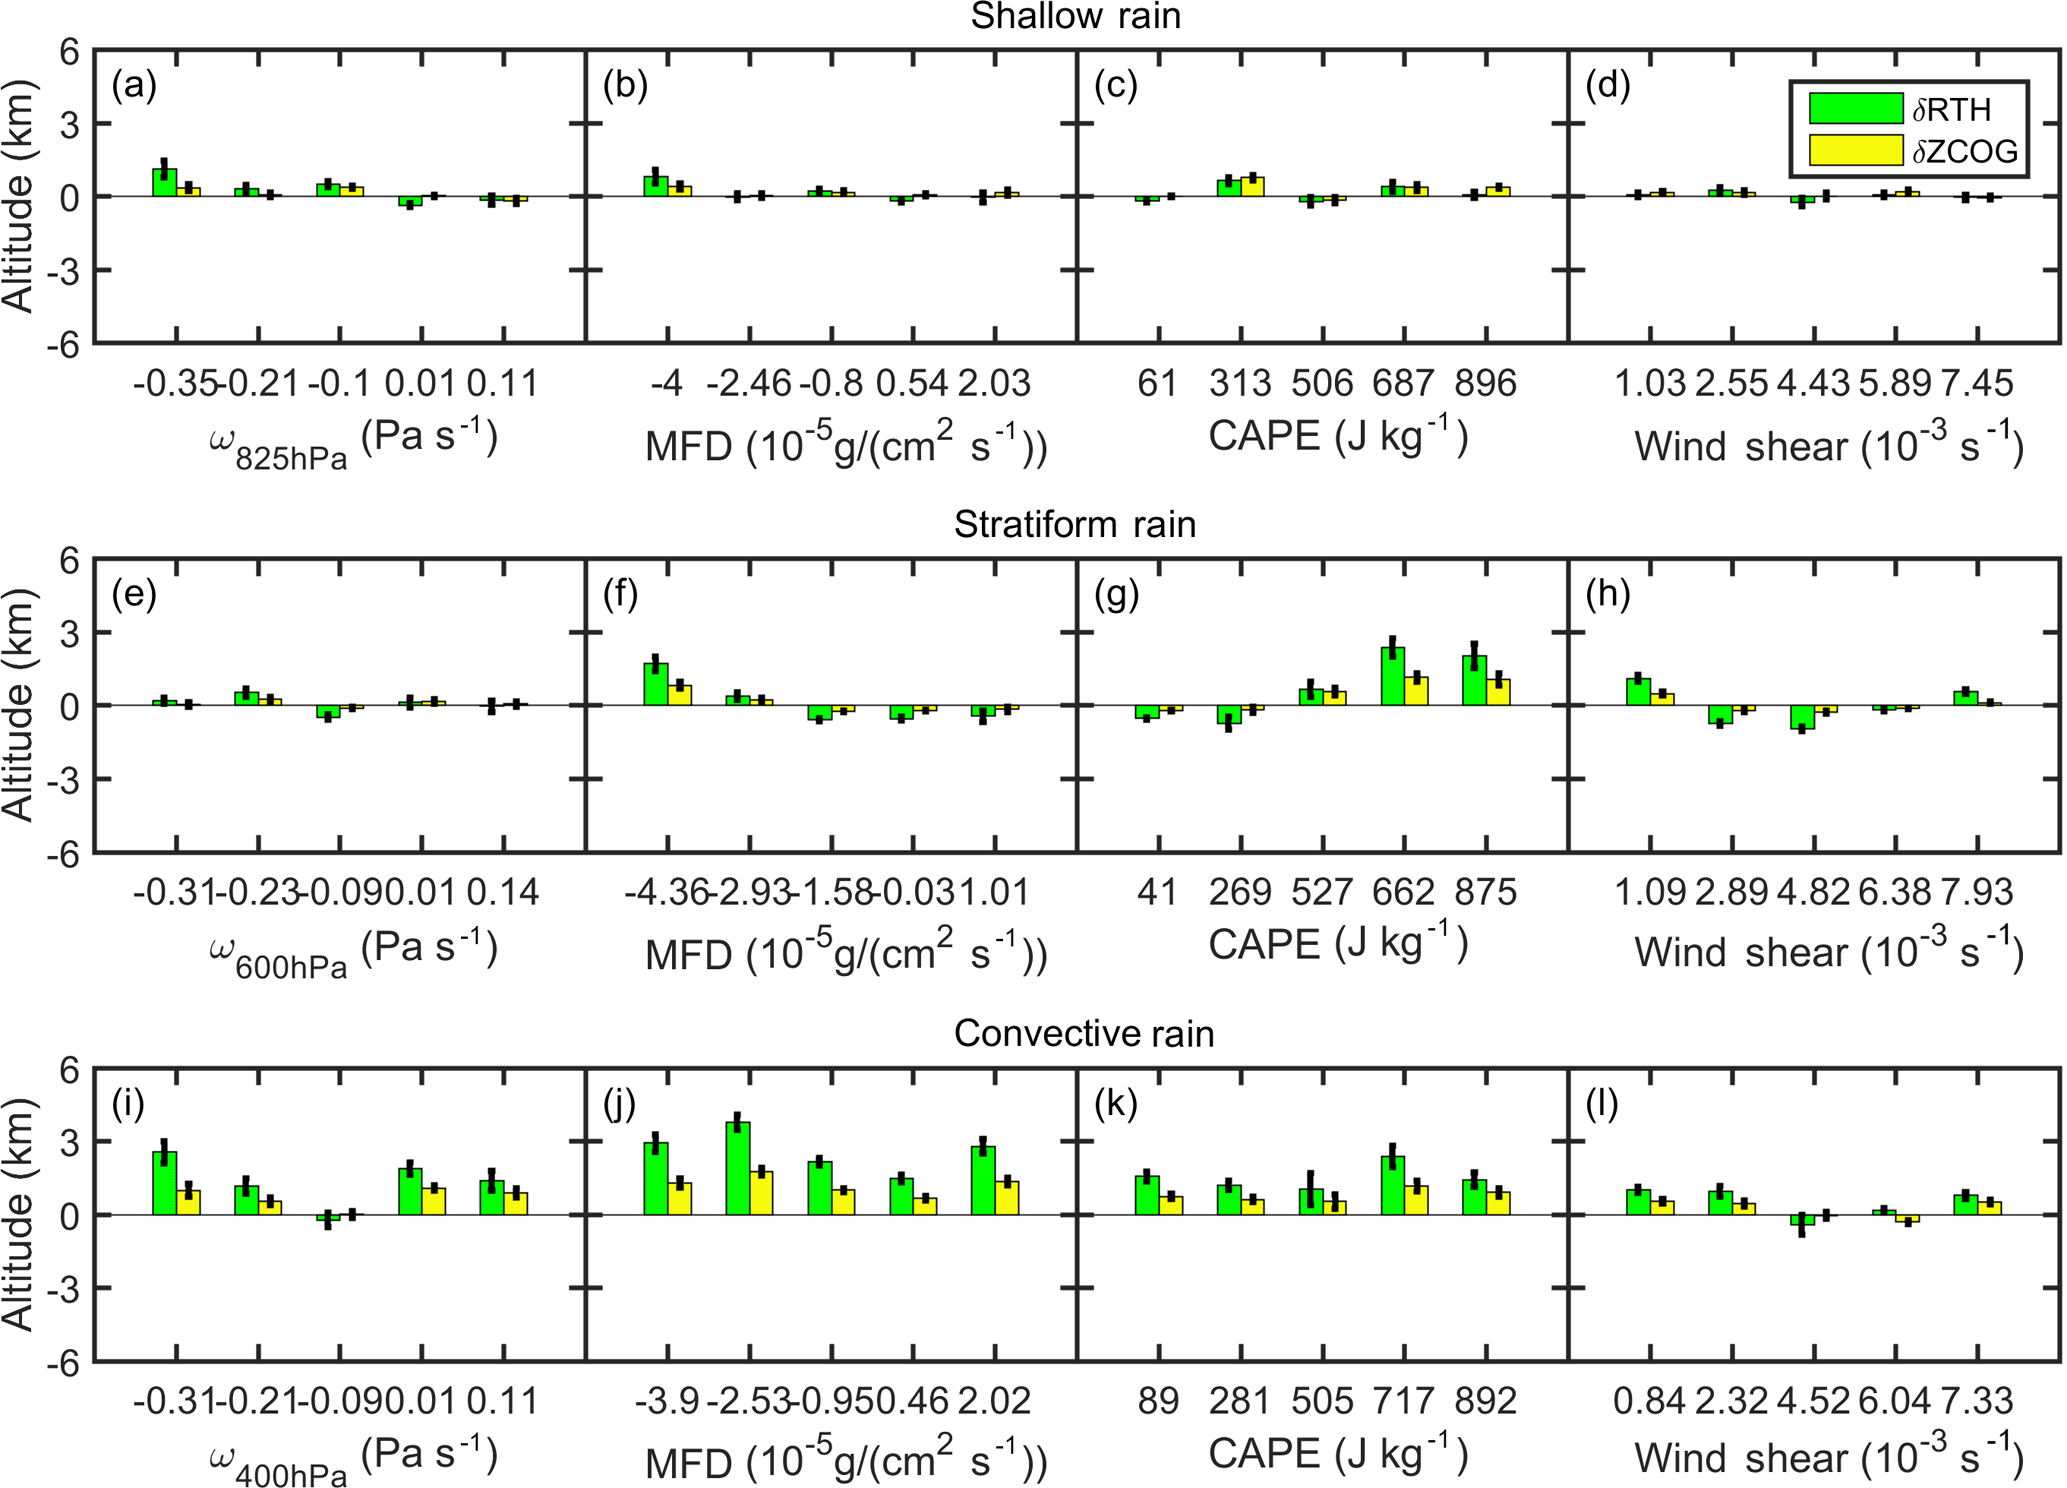
Figure 8The differences of rain top height (ΔRTH) and ZCOG (ΔZCOG) between polluted and clean conditions as a function of different meteorological conditions. (a) ω at 825 hPa pressure level, (b) MFD, (c) CAPE, and (d) vertical wind shear for shallow regime; (e) ω at 600 hPa pressure level, (f) MFD, (g) CAPE, and (h) vertical wind shear for the stratiform regime; (i) ω at 400 hPa, (j) MFD, (k) CAPE, and (l) vertical wind shear for the convective regime. Data are from 2007–2012. Note that negative ω refers to upward motion. Red and blue colors represent polluted and clean cases, respectively. The vertical error bars represent 1 standard deviation. Each bin in a particular panel is equally spaced and labeled by its average value.
Figure 8 shows the difference of RTHs and ZCOGs between clean and polluted conditions as functions of ω, vertical wind shear, CAPE, and MFD for the three different precipitation regimes. To make the statistics more robust, each bin in a particular panel is equally spaced. The standard deviations of RTH and ZCOG are calculated for each bin as well. As shown in Fig. 8i–k, both RTH and ZCOG of convective precipitation under polluted atmospheric conditions are located at higher altitudes than those under clean atmospheric conditions, except for those with high wind shear (Fig. 8l). This trend is generally opposite to what is seen for shallow and stratiform precipitation, which further corroborates the notion of an aerosol invigoration effect on convective precipitation and a suppression effect on shallow and stratiform precipitation regimes as shown in Fig. 5. More interesting is that unstable atmospheric, weak vertical wind shear, and relatively humid conditions tend to favor more convective precipitation invigoration, as evidenced by the relatively large magnitudes in Fig. 8i–k, which is highly consistent with previous observational and modeling studies (Khain et al., 2008; Fan et al., 2009; Gonçalves et al., 2015). Notably, both RTH and ZCOG of convective precipitation tend to develop to higher (lower) altitudes in the presence of aerosols when the vertical wind shear is smaller (larger), as opposed to the responses of echo top heights and ZCOGs for the same wind shear conditions for shallow precipitation (Fig. 8c). This is consistent with previous findings reported by Fan et al. (2009), who pointed out that increasing the aerosol loading suppresses convection under strong wind shear conditions but invigorates convection under weak wind shear conditions.
A closer look at Fig. 8 reveals that stratiform and convective regimes have larger differences in terms of RTH and ZCOG, as compared with shallow precipitation. In addition, the differences in RTH can be easily detected for both stratiform and convective precipitation regimes, unlike the observed differences in ZCOG under polluted and clean conditions. No obvious positive difference can be observed in shallow precipitation, except for a subtle elevated RTH and ZCOG observed under high CAPE conditions.
When the atmosphere becomes thermodynamically stable (positive ω in Fig. 8a and smaller CAPE values in Fig. 8c), the negative difference in the RTH of shallow precipitation between polluted and clean conditions becomes more evident, likely indicative of the aerosol suppression effect in this case. This effect is facilitated by the less vertically integrated MFD (Fig. 8b). This could be due to the fact that, in the dry environment characteristic of the study area, the inhibitive effect of aerosols on shallow precipitation easily stands out in the presence of a thermodynamically stable atmosphere.
Most of the previous observational studies analyze the impact of aerosol on the bulk properties of cloud and precipitation based on the cloud or precipitation properties chiefly from passive sensors, along with meteorological data. This study establishes some contemporaneous relationships between radar echo and aerosol over the Pearl River Delta (PRD) region using TRMM precipitation radar (PR) reflectivity (Z) profiles and precipitation estimates, in combination with ground-based PM10 measurements. In particular, the association of the changes in the vertical structure of precipitation with aerosols is investigated in an attempt to figure out the possible aerosol effect on precipitation for shallow, stratiform and convective regimes, respectively, which are all restricted to localized precipitating systems.
Concerning the mean joint frequency of occurrence for each PM10–Z bin, there are almost no systematic changes in mean Z as PM10 concentrations change, irrespective of precipitation regime. Z increases as aerosol loading increases for stratiform and convective precipitation regimes in the top 1 % of OFs as the atmosphere transitions from pristine to slightly polluted conditions. There is no distinct variation in reflectivity with aerosol loading for shallow precipitation. Given the closer link between aerosol and localized precipitation, our analyses are further limited to the response of localized precipitation systems, especially in the vertical direction, to aerosol particles in the atmosphere. The discrimination between synoptic-scale and localized precipitations is conducted through a subjective analysis, which is largely based on wind field at 850 hPa and pressure field at 500 hPa. The possible aerosol effects, as evaluated by contrasts in the normalized contoured frequency by altitude diagram (NCFAD) of Z, are shown to systematically discriminate between different vertical structures associated with shallow, stratiform, and convective precipitation regimes. Overall, convective precipitation tends to develop at much higher altitudes compared with shallow and stratiform precipitation. Above the freezing level (∼5 km), the occurrence frequency of radar reflectivity < 40 dBZ is enhanced, which is achieved at the expense of decreased frequency in reflectivity below the freezing level.
Due to the fundamental role of convective precipitation in the hydrological cycle, the aerosol microphysical effect on convective precipitation has been further examined with regard to convective precipitation intensity (i.e., light, moderate, and heavy convective precipitation). As expected, the ΔNCFADs of Z were similar, irrespective of precipitation intensity. The relationships between aerosols and bulk precipitation parameters such as rain top height and ZCOG, stratified by specific ω, vertical wind shear, CAPE, and MFD, were also examined in an attempt to disentangle aerosol impacts on the vertical structure of precipitation from meteorology. There is no systematic signal of aerosol or meteorology on the development of shallow and stratiform precipitation. In contrast, under certain meteorological conditions, an apparent difference in the response of RTH and ZCOG for stratiform and convective precipitation regimes to the aerosols can be seen. But under some extreme conditions, the observed difference in response was confounded by the meteorology, partly due to the fact that meteorology simultaneously affects aerosol and precipitation systems. For instance, weak vertical wind shear, and relatively humid conditions typically come with the possible aerosol-induced invigoration of convective precipitation observed in this study, in good agreement with previous model simulation (e.g., Khain et al., 2008; Fan et al., 2009; Dagan et al., 2015).
The results presented here provide some sound but not unequivocal evidence of the possible impact of aerosol on the vertical structures of three different precipitation regimes, due to the inherent aerosol–meteorology–precipitation dilemma. The relationships between changes in TRMM PR reflectivity and aerosol perturbations are statistically significant and generally consistent with the existing theories, but they may be subject to different interpretations concerning the underlying physical processes. Confirming or negating any causes with confidence would require a much more detailed knowledge of the cloud processes than the satellite observation used here and should be further aided by model simulations of aerosol–cloud–precipitation interactions.
The reanalysis data were from ECMWF (European Centre for Medium-Range Weather Forecasts), which is available at http://apps.ecmwf.int/datasets/data/interim-full-daily/levtype=sfc/ (last access: 11 September 2018). The TRMM science data provided by NASA and Japan's National Space Development Agency are available at https://mirador.gsfc.nasa.gov/cgi-bin/mirador/presentNavigation.pl?project=TRMM&tree=project (last access: 11 September 2018). The PM10 and PM2.5 data were obtained from CNEMC (China National Environmental Monitoring Center), which is publicly available at http://210.72.1.33:8023/gzaqi_new/RealTimeData.html (last access: 11 September 2018). All the original datasets and code needed to reproduce the results shown in this paper are available upon request.
The supplement related to this article is available online at: https://doi.org/10.5194/acp-18-13329-2018-supplement.
JG, HL and ZL proposed the essential research idea. JG and HL performed the analysis and drafted the manuscript. ZL, DR and JHJ provided useful comments. All the authors contributed to the interpretation and discussion of results and the revision of the manuscript.
The authors declare that they have no conflict of interest.
The authors would like to acknowledge NASA for making the TRMM precipitation
radar satellite datasets publicly accessible, as well as the NASA-sponsored
Jet Propulsion Laboratory, California Institute of Technology, for support.
This study was supported by the Ministry of Science and Technology
of China (grant 2017YFC1501401), the National Natural Science Foundation of
China (grants 91544217, 41771399 and 41471301), the Chinese Academy of
Meteorological Sciences (grant 2017Z005), and the US National Science Foundation
(AGS1534670) and Department of Energy (DE-SC0018996).
Edited by: Jianping Huang
Reviewed by: two anonymous referees
Altaratz, O., Koren, I., Remer, L. A., and Hirsch, E.: Review: cloud invigoration by aerosols-coupling between microphysics and dynamics, Atmos. Res., 140, 38–60, 2014.
Anderson, T. L., Charlson, R. J., Winker, D. M., Ogren, J. A., and Holmén, K.: Mesoscale variations of tropospheric aerosols, J. Atmos. Sci., 60, 119–136, 2003.
Andreae, M. O.: Correlation between cloud condensation nuclei concentration and aerosol optical thickness in remote and polluted regions, Atmos. Chem. Phys., 9, 543–556, https://doi.org/10.5194/acp-9-543-2009, 2009.
Boucher, O. and Quaas, J.: Water vapour affects both rain and aerosol optical depth, Nat. Geosci., 6, 4–5, 2013.
Boucher, O., Randall, D., Artaxo, P., Bretherton, C., Feingold, G., Forster, P., Kerminen, V.-M., Kondo, Y., Liao, H., Lohmann, U., Rasch, P., Satheesh, S. K., Sherwood, S., Stevens, B., and Zhang, X. Y.: Clouds and Aerosols, in: Climate Change 2013: The Physical Science Basis, Contribution of Working Group I to the Fifth Assessment Report of the Intergovernmental Panel on Climate Change, edited by: Stocker, T. F., Qin, D., Plattner, G.-K., Tignor, M., Allen, S. K., Boschung, J., Nauels, A., Xia, Y., Bex, V., and Midgley, P. M., Cambridge University Press, Cambridge, United Kingdom and New York, NY, USA, 2013.
Chen, Q., Koren, I., Altaratz, O., Heiblum, R. H., Dagan, G., and Pinto, L.: How do changes in warm-phase microphysics affect deep convective clouds?, Atmos. Chem. Phys., 17, 9585–9598, https://doi.org/10.5194/acp-17-9585-2017, 2017.
Chen, T. M., Guo, J. P., Li, Z. Q., Zhao, C., Liu, H., Cribb, M., Wang, F., and He, J.: A CloudSat perspective on the cloud climatology and its association with aerosol perturbation in the vertical over East China, J. Atmos. Sci., 73, 3599–3616, 2016.
Dagan, G., Koren, I., and Altaratz, O.: Competition between core and periphery-based processes in warm convective clouds – from invigoration to suppression, Atmos. Chem. Phys., 15, 2749–2760, https://doi.org/10.5194/acp-15-2749-2015, 2015.
Dai, A., Giorgi, F., and Trenberth, K. E.: Observed and model-simulated diurnal cycles of precipitation over the contiguous United States, J. Geophys. Res.-Atmos., 104, 6377–6402, 1999.
Dee, D. P., Uppala, S. M., Simmons, A. J., Berrisford, P., Poli, P., Kobayashi, S., Andrae, U., Balmaseda, Balsamo, M. A., Bauer, G., Bechtold, P., P., Beljaars, A. C. M., van de Berg, L., Bidlot, J., Bormann, N., Delsol, C., Dragani, R., Fuentes, M., Geer, A. J., Haimberger, L., Healy, S. B., Hersbach, H., Hólm, E. V., Isaksen, L., Kållberg, P., Köhler, M., Matricardi, M., McNally, A. P., Monge-Sanz, B. M., Morcrette, J. J., Park, B. K., Peubey, C., de Rosnay, P., Tavolato, C., Thépaut, J. N., and Vitart, F.: The ERA-Interim reanalysis: Configuration and performance of the data assimilation system, Q. J. Roy. Meteor. Soc., 137, 553–597, 2011.
Deng, X., Tie, X., Wu, D.,Zhou, X., Bi, X., Tan, H., Li, F., and Jiang, C.: Long-term trend of visibility and its characterizations in the Pearl River Delta (PRD) region, China, Atmos. Environ., 42, 1424–1435, 2008.
Ding, Y. H.: Monsoons over China, Kluwer Acad., Dordrecht, Netherlands, 419 pp., 1994.
Fan, J., Zhang, R., Li, G., and Tao, W. K.: Effects of aerosols and relative humidity on cumulus clouds, J. Geophys. Res.-Atmos. 112, D14204, https://doi.org/10.1029/2006JD008136, 2007.
Fan, J., Yuan, T., Comstock, J. M., Ghan, S., Khain, A., Leung, L. R., Li, Z., Martins, V. J., and Ovchinnikov, M.: Dominant role by vertical wind shear in regulating aerosol effects on deep convective clouds, J. Geophys. Res.-Atmos., 114, D22206, https://doi.org/10.1029/2009JD012352, 2009.
Fan, J., Leung, L. R., Rosenfeld, D., Chen, Q., Li, Z., Zhang, J., and Yan, H.: Microphysical effects determine macrophysical response for aerosol impacts on deep convective clouds, P. Natl. Acad. Sci. USA, 110, E4581–E4590, https://doi.org/10.1073/pnas.1316830110, 2013.
Fan, J., Rosenfeld, D., Zhang, Y., Giangrande, S. E., Li, Z., Machado, L. A., Martin, S. T., Yang, Y., Wang, J., Artaxo, P., and Barbosa, H. M.: Substantial convection and precipitation enhancements by ultrafine aerosol particles, Science, 359, 411–418, 2018.
Fan, J. W., Wang, Y., Rosenfeld, D., and Liu, X. H.: Review of aerosol-cloud interactions: mechanisms, significance, and challenges, J. Atmos. Sci., 73, 4221–4252, 2016.
Fu, Y., Lin, Y., Liu, G., and Wang, Q.: Seasonal characteristics of precipitation in 1998 over East Asia as derived from TRMM PR, Adv. Atmos. Sci., 20, 511–529, 2003.
Gonçalves, W. A., Machado, L. A. T., and Kirstetter, P.-E.: Influence of biomass aerosol on precipitation over the Central Amazon: an observational study, Atmos. Chem. Phys., 15, 6789–6800, https://doi.org/10.5194/acp-15-6789-2015, 2015.
Guo, J. P., Zhang, X. Y., Che, H. Z., Gong, S. L., An, X., Cao, C. X., Guang, J., Zhang, H., Wang, Y. Q., and Zhang, X. C.: Correlation between PM concentrations and aerosol optical depth in eastern China, Atmos. Environ., 43, 5876–5886, 2009.
Guo, J. P., Zhai, P., Wu, L., Cribb, M., Li, Z., Ma, Z., Wang, F., Chu, D., Wang, P., and Zhang, J.: Precipitation and air pollution at mountain and plain stations in northern China: Insights gained from observations and modeling, J. Geophys. Res.-Atmos., 119, 4793–4807, 2014.
Guo, J., Deng, M., Lee, S. S., Wang, F., Li, Z., Zhai, P., Liu, H., Lv, W., Yao, W., and Li, X.: Delaying precipitation and lightning by air pollution over the Pearl River Delta. Part I: Observational analyses, J. Geophys. Res.-Atmos., 121, 6472–6488, 2016a.
Guo, J. P., Liu, H., Wang, F., Huang, J. F., Xia, F., Lou, M. Y., Wu, Y. R., Jiang, J. H., Xie, T., Zhaxi, Y., and Yung, Y. L.: Three-dimensional structure of aerosol in China: A perspective from multi-satellite observations, Atmos. Res., 178, 580–589, 2016b.
Guo, J., Su, T., Li, Z., Miao, Y., Li, J., Liu, H., Xu, H., Cribb, M., and Zhai, P.: Declining frequency of summertime local-scale precipitation over eastern China from 1970–2010 and its potential link to aerosols, Geophys. Res. Lett., 44, 5700–5708, 2017.
Hansen, J., Sato, M., and Ruedy, R.: Radiative forcing and climate response, J.Geophys. Res.-Atmos., 102, 6831–6864, 1997.
Heiblum, R. H., Koren, I., and Altaratz, O.: New evidence of cloud invigoration from TRMM measurements of precipitation center of gravity, Geophys. Res. Lett., 39, L08803, https://doi.org/10.1029/2012GL051158, 2012.
Houze, R. A.: Cloud Dynamics. International Geophysics Series, Vol. 53, Academic Press, 573 pp., 1993.
Houze, R. A. and Cheng, C. P.: Radar characteristics of tropical convection observed during GATE: Mean properties and trends over the summer season, Mon. Weather Rev., 105, 964–980, 1977.
Huang, J., Zhang, C., and Prospero, J. M.: African aerosol and large-scale precipitation variability over West Africa, Environ. Res. Lett., 4, 015006, https://doi.org/10.1088/1748-9326/4/1/015006, 2009a.
Huang, J., Zhang, C., and Prospero, J. M.: Large-scale effects of aerosol on rainfall over West Africa, Q. J. Roy. Meteor. Soc., 135, 581–594, https://doi.org/10.1002/qj.391, 2009b.
Huffman, G. J., Adler, R. F., Bolvin, D. T., Gu, G. J., Nelkin, E. J., Bowman, K. P., Y. Stocker, Hong, E. F., and Wolff, D. B.: The TRMM multisatellite precipitation analysis (TMPA): quasi-global, multiyear, combined-sensor precipitation estimates at fine scales, J. Hydrometeorol., 8, 38–55, 2007.
IPCC: Summary for Policymakers, in: Climate Change 2013: The Physical Science Basis, Contribution of Working Group I to the Fifth Assessment Report of the Intergovernmental Panel on Climate Change, edited by: Stocker, T. F., Qin, D., Plattner, G.-K., Tignor, M., Allen, S. K., Boschung, J., Nauels, A., Xia, Y., Bex, V., and Midgley, P. M., Cambridge University Press, Cambridge, UK and New York, NY, USA, 2013.
Jiang, J. H., Su, H., Schoeberl, M. R., Massie, S. T., Colarco, P., Platnick, S., and Livesey, N. J.: Clean and polluted clouds: Relationships among pollution, ice cloud and precipitation in South America, Geophys. Res. Lett., 35, L14804, https://doi.org/10.1029/2008GL034631, 2008.
Jiang, M., Feng, J., Li, Z., Sun, R., Hou, Y.-T., Zhu, Y., Wan, B., Guo, J., and Cribb, M.: Potential influences of neglecting aerosol effects on the NCEP GFS precipitation forecast, Atmos. Chem. Phys., 17, 13967–13982, https://doi.org/10.5194/acp-17-13967-2017, 2017.
Kaufman, Y. J. and Fraser, R. S.: The effect of smoke particles on clouds and climate forcing, Science, 277, 1636–1639, 1997.
Khain, A., Pokrovsky, A., Pinsky, M., Seifert, A., and Phillips, V.: Simulation of effects of atmospheric aerosols on deep turbulent convective clouds using a spectral microphysics mixed-phase cumulus cloud model. Part I: Model description and possible applications, J. Atmos. Sci., 61, 2963–2982, https://doi.org/10.1175/jas-3350.1, 2004.
Khain, A. P., BenMoshe, N., and Pokrovsky, A.: Factors determining the impact of aerosols on surface precipitation from clouds: An attempt at classification, J. Atmos. Sci., 65, 1721–1748, 2008.
Koren, I., Kaufman, Y. J., Rosenfeld, D., Remer, L. A., and Rudich, Y.: Aerosol invigoration and restructuring of Atlantic convective clouds, Geophys. Res. Lett., 32, L14828, https://doi.org/10.1029/2005GL023187, 2005.
Koren, I., Altaratz, O., Feingold, G., Levin, Z., and Reisin, T.: Cloud's Center of Gravity – a compact approach to analyze convective cloud development, Atmos. Chem. Phys., 9, 155–161, https://doi.org/10.5194/acp-9-155-2009, 2009.
Koren, I., Altaratz, O., Remer, L. A., Feingold, G., Martins, J. V., and Heiblum, R. H.: Aerosol-induced intensification of precipitation from the tropics to the mid-latitudes, Nat. Geosci., 5, 118–122, 2012.
Koren, I., Dagan, G., and Altaratz, O.: From aerosol-limited to invigoration of warm convective clouds, Science, 344, 1143–1146, 2014.
Kummerow, C., Barnes, W., Kozu, T., Shiue, J., and Simpson, J.: The tropical rainfall measuring mission (TRMM) sensor package, J. Atmos. Ocean. Tech., 15, 809–817, 1998.
Lee, S.-S., Feingold, G., and Chuang, P. Y.: Effect of Aerosol on Cloud–Environment Interactions in Trade Cumulus, J. Atmos. Sci., 69, 3607–3632, https://doi.org/10.1175/JAS-D-12-026.1, 2012.
Lee, S.-S., Guo, J., and Li, Z.: Delaying precipitation by air pollution over Pearl River Delta. Part 2: model simulations, J. Geophy. Res.-Atmos., 121, 11739–11760, https://doi.org/10.1002/2015JD024362, 2016.
Levy, R. C., Remer, L. A., Kleidman, R. G., Mattoo, S., Ichoku, C., Kahn, R., and Eck, T. F.: Global evaluation of the Collection 5 MODIS dark-target aerosol products over land, Atmos. Chem. Phys., 10, 10399–10420, https://doi.org/10.5194/acp-10-10399-2010, 2010.
Li, W. and Schumacher, C.: Thick Anvils as Viewed by the TRMM Precipitation Radar, J. Climate, 24, 1718–1735, 2011.
Li, Z., Zhao, X., Kahn, R., Mishchenko, M., Remer, L., Lee, K.-H., Wang, M., Laszlo, I., Nakajima, T., and Maring, H.: Uncertainties in satellite remote sensing of aerosols and impact on monitoring its long-term trend: a review and perspective, Ann. Geophys., 27, 2755–2770, https://doi.org/10.5194/angeo-27-2755-2009, 2009.
Li, Z., Niu, F., Fan, J., Liu, Y., Rosenfeld, D., and Ding, Y.: Long-term impacts of aerosols on the vertical development of clouds and precipitation, Nat. Geosci., 4, 888–894, 2011.
Li, Z., Rosenfeld, D., and Fan, J.: Aerosols and their impact on radiation, clouds, precipitation, and severe weather events, Oxford Research Encyclopedias, https://doi.org/10.1093/acrefore/9780199389414.013.126, 2017.
Liu, J. and Li, Z.: Estimation of cloud condensation nuclei concentration from aerosol optical quantities: influential factors and uncertainties, Atmos. Chem. Phys., 14, 471–483, https://doi.org/10.5194/acp-14-471-2014, 2014.
Liu, Z., Yim, S. H. L., Wang, C., and Lau, N. C.: The impact of the aerosol direct radiative forcing on deep convection and air quality in the Pearl River Delta region, Geophys. Res. Lett., 45, 4410–4418, 2018.
Lin, Y., Zhang, J., Li, X., and Deng, Y.: Response of eddy activities to localized diabatic heating in Held–Suarez simulations, Clim. Dynam., https://doi.org/10.1007/s00382-018-4088-4, online first, 2018.
Min, Q.-L., Li, R., Lin, B., Joseph, E., Wang, S., Hu, Y., Morris, V., and Chang, F.: Evidence of mineral dust altering cloud microphysics and precipitation, Atmos. Chem. Phys., 9, 3223–3231, https://doi.org/10.5194/acp-9-3223-2009, 2009.
Nakajima, T. Y., Higurashi, A., Kawamoto, K., and Penner, J. E.: A possible correlation between satellite-derived cloud and aerosol microphysical parameters, Geophys. Res. Lett., 28, 1171–1174, https://doi.org/10.1029/2000gl012186, 2001.
Nakajima, T. Y., Suzuki, K., and Stephens, G. L.: Droplet growth in warm water clouds observed by the A-Tprecipitation. Part II: A multisensor view, J. Atmos. Sci., 67, 1897–1907, https://doi.org/10.1175/2010jas3276.1, 2010.
Peng, J., Li, Z., Zhang, H., Liu, J., and Cribb, M.: Systematic changes in cloud radiative forcing with aerosol loading for deep clouds in the tropics, J. Atmos. Sci., 73, 231–249, 2016.
Rosenfeld, D. and Givati, A.: Evidence of orographic precipitation suppression by air pollution–induced aerosols in the western United States, J. Appl. Meteorol. Clim., 45, 893–911, https://doi.org/10.1175/JAM2380.1, 2006.
Rosenfeld, D. and Lensky, I. M.: Satellite-based insights into precipitation formation processes in continental and maritime convective clouds, B. Am. Meteorol. Soc., 79, 2457–2476, https://doi.org/10.1175/1520-0477(1998)079<2457:SBIIPF>2.0.CO;2, 1998.
Rosenfeld, D. and Ulbrich, C. W.: Cloud microphysical properties processes and rainfall estimation opportunities, in Radar and Atmospheric Science: A Collection of Essays in Honor of David Atlas, edited by: Wakimoto, R. M. and Srivastava, R., American Meteorological Society, Washington, D. C, 237–258, 2003.
Rosenfeld, D., Lohmann, U., Raga, G. B., O'Dowd, C. D., Kulmala, M., Fuzzi, S., Reissell, A., and Andreae, M. O.: Flood or drought: how do aerosols affect precipitation?, Science, 321, 1309–1313, 2008.
Squires, P.: The spatial variation of liquid water and droplet concentration in cumuli, Tellus, 10, 372–380, 1958.
Seinfeld, J. H. and Pandis, S. N.: Atmospheric chemistry and physics: From air pollution to climate change, John Wiley, New York, N. Y., 1998.
Seinfeld, J. H., Bretherton, C., Carslaw, K. S., Coe, H., DeMott, P. J., Dunlea, E. J., Feingold, G., Ghan, S., Guenther, A.B., Kahn, R., and Kraucunas, I.: Improving our fundamental understanding of the role of aerosol-cloud interactions in the climate system, P. Natl. Acad. Sci. USA, 113, 5781–5790, 2016.
Stevens, B. and Feingold, G.: Untangling aerosol effects on clouds and precipitation in a buffered system, Nature, 461, 607–613, 2009.
Suzuki, K., Nakajima, T. Y., and Stephens, G. L.: Particle growth and drop collection efficiency of warm clouds as inferred from joint CloudSat and MODIS observations, J. Atmos. Sci., 67, 3019–3032, 2010.
Tao, W. K., Chen, J. P., Li, Z. Q., Wang, C., and Zhang, C. D.: Impact of aerosols on convective clouds and precipitation, Rev. Geophys., 50, RG2001, https://doi.org/10.1029/2011RG000369, 2012.
Twomey, S.: The influence of pollution on the shortwave albedo of clouds, J. Atmos. Sci., 34, 1149–1152, 1977.
van den Heever, S. C., Stephens, G. L., and Wood, N. B.: Aerosol indirect effects on tropical convection characteristics under conditions of radiative-convective equilibrium, J. Atmos. Sci., 68, 699–718, https://doi.org/10.1175/2010JAS3603.1, 2011.
Wang, F., Guo, J., Zhang, J., Huang, J., Min, M., Chen, T., Liu, H., Deng, M., and Li, X.: Multi-sensor quantification of aerosol-induced variability in warm clouds over eastern China, Atmos. Environ., 113, 1–9, 2015.
Wang, Y., Wan, Q., Meng, W., Liao, F., Tan, H., and Zhang, R.: Long-term impacts of aerosols on precipitation and lightning over the Pearl River Delta megacity area in China, Atmos. Chem. Phys., 11, 12421–12436, https://doi.org/10.5194/acp-11-12421-2011, 2011.
Williams, E., Rosenfeld, D., Madden, N., Gerlach, J., Gears, N., Atkinson, L., Dunnemann, N., Frostrom, G., Antonio, M., Biazon, B., Camargo, R., Franca, H., Gomes, A., Lima, M., Machado, R., Manhaes, S., Nachtigall, L., Piva, H., Quintiliano, W., Machado., L., Artaxo, P., Roberts, G., Renno, N., Blakeslee, R., Bailey, J., Boccippio, D., Betts, A., Wolff, D., Roy, B., Halverson, J., Rickenbach, T., Fuentes, J., and Avelino, E.: Contrasting convective regimes over the Amazon: Implications for cloud electrification, J. Geophys. Res.-Atmos., 107, 8082, https://doi.org/10.1029/2001JD000380, 2002.
Yan, H., Li, Z., Huang, J., Cribb, M., and Liu, J.: Long-term aerosol-mediated changes in cloud radiative forcing of deep clouds at the top and bottom of the atmosphere over the Southern Great Plains, Atmos. Chem. Phys., 14, 7113–7124, https://doi.org/10.5194/acp-14-7113-2014, 2014.
Yang, X. and Li, Z.: Increases in thunderstorm activity and relationships with air pollution in southeast China, J. Geophys. Res.-Atmos., 119, 1835–1844, 2014.
Yang, Y., Lu, D. Fu, Y., Yang, Y., Lu, D., Fu, Y., Chen, F., and Wang, Y.: Spectral Characteristics of Tropical Anvils Obtained by Combining TRMM Precipitation Radar with Visible and Infrared Scanner Data, Pure Appl. Geophys., 172, 1717–1733 https://doi.org/10.1007/s00024-014-0965-x, 2015.
Yuan, T., Remer, L. A., Pickering, K. E., and Yu, H.: Observational evidence of aerosol enhancement of lightning activity and convective invigoration, Geophys. Res. Lett., 38, L04701, https://doi.org/10.1029/2010GL046052, 2011.
Yuter, S. E. and Houze, R. A. J.: Three-dimensional kinematic and microphysical evolution of Florida cumulonimbus. Part II: Frequency distributions of vertical velocity, reflectivity, and differential reflectivity, Mon. Weather Rev., 123, 1941–1963, 1995.
Zhang, R., Li, G., Fan, J., Wu, D. L., and Molina, M. J.: Intensification of Pacific storm track linked to Asian pollution, P. Natl. Acad. Sci. USA, 104, 5295–5299, https://doi.org/10.1073/pnas.0700618104, 2007.
Zipser, E. J.: Deep cumulonimbus cloud systems in the tropics with and without lightning, Mon. Weather Rev., 122, 1837–1851, 1994.
Zipser, E. J. and Lutz, K.: The vertical profile of radar reflectivity of convective cells: A strong indicator of storm intensity and lightning probability?, Mon. Weather Rev., 122, 1751–1759, 1994.