the Creative Commons Attribution 4.0 License.
the Creative Commons Attribution 4.0 License.
 | 13 Sep 2018
Technical note: How are NH3 dry deposition estimates affected by combining the LOTOS-EUROS model with IASI-NH3 satellite observations?
Shelley C. van der Graaf
Enrico Dammers
Martijn Schaap
Jan Willem Erisman
Atmospheric levels of reactive nitrogen have increased substantially during the last century resulting in increased nitrogen deposition to ecosystems, causing harmful effects such as soil acidification, reduction in plant biodiversity and eutrophication in lakes and the ocean. Recent developments in the use of atmospheric remote sensing enabled us to resolve concentration fields of NH3 with larger spatial coverage. These observations may be used to improve the quantification of NH3 deposition. In this paper, we use a relatively simple, data-driven method to derive dry deposition fluxes and surface concentrations of NH3 for Europe and for the Netherlands. The aim of this paper is to determine the applicability and the limitations of this method for NH3. Space-born observations of the Infrared Atmospheric Sounding Interferometer (IASI) and the LOTOS-EUROS atmospheric transport model are used. The original modelled dry NH3 deposition flux from LOTOS-EUROS and the flux inferred from IASI are compared to indicate areas with large discrepancies between the two. In these areas, potential model or emission improvements are needed. The largest differences in derived dry deposition fluxes occur in large parts of central Europe, where the satellite-observed NH3 concentrations are higher than the modelled ones, and in Switzerland, northern Italy (Po Valley) and southern Turkey, where the modelled NH3 concentrations are higher than the satellite-observed ones. A sensitivity analysis of eight model input parameters important for NH3 dry deposition modelling showed that the IASI-derived dry NH3 deposition fluxes may vary from ∼ 20 % up to ∼50 % throughout Europe. Variations in the NH3 dry deposition velocity led to the largest deviations in the IASI-derived dry NH3 deposition flux and should be focused on in the future. A comparison of NH3 surface concentrations with in situ measurements of several established networks – the European Monitoring and Evaluation Programme (EMEP), Meetnet Ammoniak in Natuurgebieden (MAN) and Landelijk Meetnet Luchtkwaliteit (LML) – showed no significant or consistent improvement in the IASI-derived NH3 surface concentrations compared to the originally modelled NH3 surface concentrations from LOTOS-EUROS. It is concluded that the IASI-derived NH3 deposition fluxes do not show strong improvements compared to modelled NH3 deposition fluxes and there is a future need for better, more robust, methods to derive NH3 dry deposition fluxes.


Reactive nitrogen (Nr) emissions have substantially increased during the last century to around 4 times the pre-industrial levels (Erisman et al., 2008; Fowler et al., 2013). As a result, atmospheric deposition of reactive nitrogen to both terrestrial and aquatic ecosystems has also increased (Dentener et al., 2006b). Excessive nitrogen deposition to sensitive ecosystems can cause harming effects such as soil acidification, reduction in plant biodiversity and eutrophication in water bodies (Erisman et al., 2015). One molecule of reactive nitrogen may even contribute to a number of these environmental impacts through different pathways and chemical transportation in the biosphere, the so-called nitrogen cascade (Galloway et al., 2003). Ammonia (NH3) is one form of reactive nitrogen and constitutes an important part of the total amount of Nr emissions. Up to 50 % of global reactive nitrogen emissions consist of NH3 (Reis et al., 2009), and therefore NH3 contributes significantly to these adverse effects. Atmospheric ammonia is deposited to surfaces by two processes: dry and wet deposition.
Dry deposition may comprise a large part of the total deposition. Earlier modelling studies showed that dry deposition of NHx even constitutes to over 60 % of the total deposition (Dentener et al., 2006a). The modelled fraction of dry deposition, however, ranges hugely depending on the used model. Deposition models in general are known to involve large uncertainties regarding the chemistry behind NH4 formation and the NH3 dry deposition velocities (Dentener et al., 2006a). At the same time, large-scale assessment of NH3 dry deposition is hindered by the extremely limited number of dry deposition observations and their sparse distribution in space and time. Measurements of NH3 dry deposition fluxes largely remain experimental and are limited to a few research sites and measurement campaigns of short durations (e.g. Zoll et al., 2016; Spindler et al., 2001). These measurements typically are representative of a confined area and a specific ecosystem. Dry deposition has so far been estimated on a regional scale through mainly two methods: geostatistical approaches and atmospheric chemistry models. Geostatistical approaches include geospatial interpolation of, or generating statistical models based on, existing in situ observations (e.g. Erisman and Draaijers, 1995). Atmospheric chemistry models use known and modelled inputs (i.a. emissions) to derive dry deposition fluxes (e.g. Dentener et al., 2006a; Wichink Kruit et al., 2012; Van der Swaluw et al., 2017). Both methods depend strongly on the quality and availability of reliable input information, which is often limited or even absent.
Recent developments in the use of atmospheric remote sensing to measure NH3 distributions with large spatial coverage and daily resolution (Van Damme et al., 2014a) allow us to examine their development in space and time in more detail. Information from satellites can be of help to strengthen our understanding of the complex chain of processes of atmospheric deposition, emissions, dispersion and chemistry, especially when complemented with information from atmospheric chemistry models. Atmospheric chemistry models may, for example, help to fill in missing information on NH3 concentrations close to the Earth's surface, arising from low sensitivities of NH3 measuring instruments, or may, for instance, supplement satellite data with information on diurnal cycles. Nowlan et al. (2014) estimated surface concentrations and dry deposition of NO2 and SO2 by combining satellite observations of the Ozone Monitoring Instrument (OMI) and the GEOS-Chem model. The resulting estimates compared reasonably well with in situ measurements, thus providing a relatively simple, data-driven method to estimate surface concentrations and dry deposition fluxes on a worldwide scale. More recently, Kharol et al. (2017) derived NH3 dry deposition fluxes over North America using a similar method with NH3 observations of the Cross-track Infrared Sounder (CrIS) satellite and the GEM-MACH model. The aim of this paper is to search for the applicability and the limitations of this method for NH3 over Europe using space-born observations of the Infrared Atmospheric Sounding Interferometer (IASI) and the LOTOS-EUROS atmospheric transport model. This paper shows the first use of the IASI-NH3 product for the derivation of NH3 dry deposition fluxes, together with validation of the derived NH3 surface concentrations with in situ measurements. The latter serve as a direct proxy for the validity of the derived NH3 dry deposition fluxes. Also, this paper is the first to estimate the effect of modelling errors on the satellite-derived NH3 dry deposition fluxes by performing a model sensitivity study.
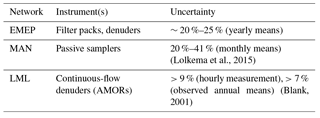
Table 1Type of instruments used to measure ambient NH3 concentrations and associated uncertainty estimates.
We start this paper with a description of the used models and datasets and their associated uncertainties. This is followed by a description of the methodology that is used to determine the NH3 surface concentrations and dry deposition fluxes. Here, we also describe the design of the sensitivity study of the LOTOS-EUROS model. The resulting estimates of the NH3 surface concentrations and dry deposition fluxes are given. The NH3 surface concentrations are compared to in situ measurements from the European Monitoring and Evaluation Programme (EMEP) network in Europe. In a special case study for the Netherlands, they are compared to in situ measurements from the Meetnet Ammoniak in Natuurgebieden (MAN) and Landelijk Meetnet Luchtkwaliteit (LML) networks. Moreover, a sensitivity study of the LOTOS-EUROS model is evaluated to estimate the effect of model input uncertainties on the results that are obtained in the same section. The study is then concluded with a discussion.
2.1 IASI NH3 product
The Infrared Atmospheric Sounding Interferometer (IASI) is a passive remote-sensing instrument that measures infrared radiation emitted by the Earth's surface and atmosphere within the spectral range of 645–2769 cm−1 (Clerbaux et al., 2009). The IASI-A instrument is aboard the MetOp-A satellite that was launched in 2006 and circles in a polar Sun-synchronous orbit. In this study, we used NH3 total column measurements from the morning overpass, as these are more sensitive to NH3 than the nighttime observations (Van Damme et al., 2015). The morning overpass passes over Europe once a day in the morning around 09:30 LT. The NH3 product has an elliptical spatial footprint of approximately 12 by 12 km and a detection limit of 2.5 ppbv (Van Damme et al., 2015). The retrieval uses a neural network to derive NH3 columns based on the calculation of the hyperspectral range index (HRI), e.g. the spectral index (Van Damme et al., 2017). The retrieval algorithm combines information on the temperature, humidity and pressure profiles to represent the atmospheric state closely (Whitburn et al., 2016). The retrieval uses a fixed profile in time, based on the profiles described by Van Damme et al. (2015). The IASI-NN (neural network) retrievals have been validated in Dammers et al. (2016) and Dammers et al. (2017b). In these papers, they compared the IASI-NN and Fourier-transform infrared spectrometer (FTIR) total columns and showed that the two compare reasonably well with a systematic underestimation by the IASI-NN product of around 30 %. In this paper, the NH3 total columns observed during the warmer season (April to September) of 2013 and 2014 are used. The warm season was chosen because considerably fewer observations are available during the cold months. Moreover, the observations in the cold months generally have a higher relative uncertainty (Van Damme, 2014a). A filter has been applied after (Van Damme et al., 2014b). This filter leaves out observations with a relative error of <100 % unless the absolute error is smaller than 5×10¹⁵ molecules cm−2. Figure 1 shows the mean IASI NH3 total column concentration over Europe and the Netherlands.
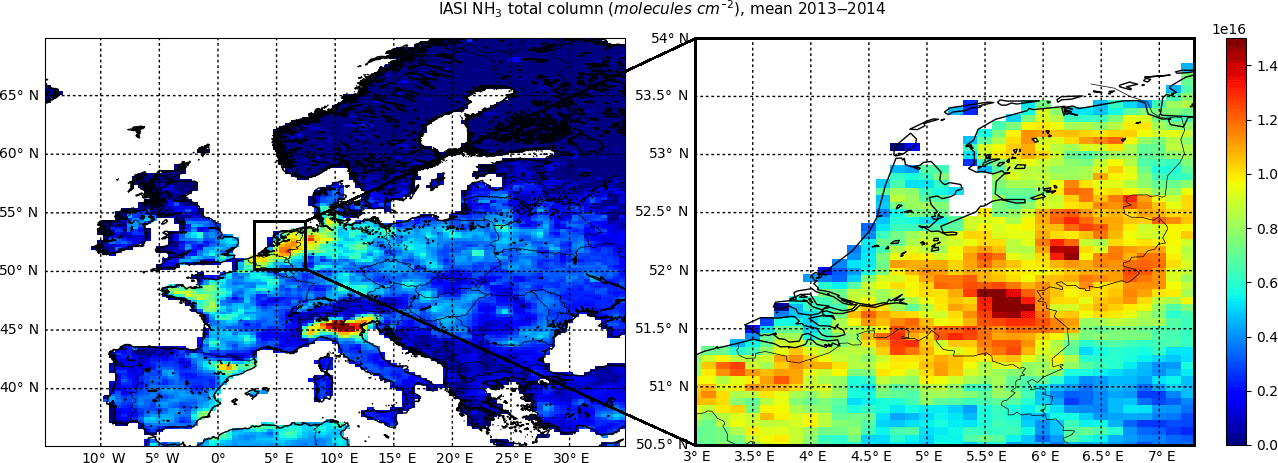
Figure 1The annual mean NH3 total column concentration in 2013–2014 as observed by IASI-A in Europe (regridded to 0.50∘ longitude by 0.25∘ latitude) and the Netherlands (regridded to 0.125∘ longitude by 0.0625∘ latitude).
2.2 IASI NH3 uncertainties
The retrieval algorithm (Whitburn et al., 2016) allows estimation of quantitative errors of each observation. The error estimate depends on a combination of the thermal contrast (the temperature difference between Earth's surface and atmosphere at 1.5 km) and the HRI, i.e. the spectral footprint. The estimate also includes error terms for the uncertainty in the profile shape and error terms arising from the used temperature and water vapour profiles. The uncertainty estimate for each retrieved NH3 total column is an error propagation of the individual parameter uncertainties. Whitburn et al. (2016) showed in an error characterization that individual retrieved NH3 columns hold the smallest errors (∼25 %) in the situation of a high NH3 concentration combined with a high thermal contrast. The error increases progressively when either of these lowers. In the case of a low NH3 concentration and a low thermal contrast, the errors can be as high as ∼270 %. More information on how the IASI-NN retrieval works and how the relative errors are derived can be found in Whitburn et al. (2016). Figure 2 shows the relative uncertainty of the IASI-A NH3 total column concentrations in 2013–2014 over Europe and the Netherlands. The relative uncertainty ranges from ∼90 % in remote areas with little emissions to ∼30 % in high emissions areas.
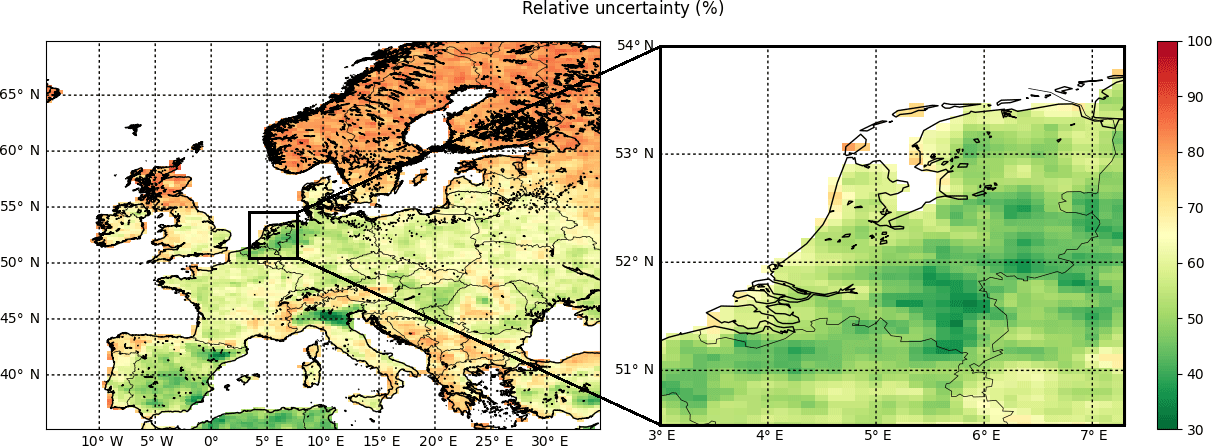
Figure 2The relative error of the annual IASI-A retrieved NH3 total column concentrations in Europe and the Netherlands in 2013–2014.
2.3 NH3 ground measurements
Ground measurements of NH3 surface concentrations from three air quality networks were used to validate the LOTOS-EUROS and IASI-derived NH3 surface concentrations on a monthly and a yearly basis. To do this, observations of ambient NH3 concentrations of the EMEP network are used for Europe (EMEP, 2016). For the case study of the Netherlands, observations from two established networks are used, the LML (RIVM, Netherlands National Institute for Public Health and the Environment) and MAN (Lolkema et al., 2015).
NH3 is challenging to measure reliably because of potential adsorption to parts of the measurement device, leading to slow response times (von Bobrutzki et al., 2010). The uncertainties of the measurements may differ significantly per instruments design. Table 1 gives an overview of the instruments used by each of these networks and their uncertainties.
2.3.1 EMEP network
The main measurement network for reactive nitrogen concentrations on a European scale is the EMEP network (Tørseth et al., 2012). NH3 measurements from 35 stations were available to validate the results of 2013 and 46 stations for the results of 2014. Different types of measurement devices are used to measure NH3 within the EMEP network. The majority of the EMEP sites use filter packs, of which the results are relatively uncertain. In a field intercomparison of different NH3 measurement techniques, von Bobrutzki et al. (2010) found that different instruments have an overall bias varying from −31.1 % to +10.9 % for the entire data range (∼ 2 weeks), demonstrating that there is a need for a standardized approach. For smaller concentrations (<10 ppbv) the bias is even larger, from −22.0 % to +54.5 %.
2.3.2 LML network
The LML has monitored hourly NH3 concentrations in the Netherlands since 1993 (van Zanten et al., 2017). Since 2014, only six stations have been left in operation; before that, there were eight stations. The locations of the monitoring stations were carefully selected to cover regions with high, moderate and low emission densities equally. The measurements are performed with AMOR instruments, which are continuous-flow denuders. Airflow passes through a wetted rotating denuder tube in the AMOR instrument and the NH3 absorbs into this fluid. The electric conductivity is then determined and used as a measure for the NH3 concentration (van Zanten et al., 2017). The measurements have a reported uncertainty of at least 9 % for hourly concentrations and at least 7 % for yearly averages (van Zanten et al., 2017; Blank, 2001).
2.3.3 MAN network
The MAN network has provided monthly mean ambient NH3 concentrations in nature areas in the Netherlands since 2005. The network has 236 sampling points as of 2014, spread over 60 different nature areas. The measurements are performed with low-cost passive samplers from Gradko. The measurements are calibrated against the measurements of the LML (Lolkema et al., 2015). The bottom of the passive sampler is an open cap with a porous filter through which NH3 in the air can enter. In the top end of the tube, the NH3 is adsorbed by an acid to form . The concentrations in the samplers are analysed in a laboratory every month to compute the monthly mean NH3 concentrations. The uncertainty of the MAN measurements depends on the NH3 concentration and varies between 20 % for high concentrations (10–20 µg m−3) and 41 % for low concentrations (1 µg m−3) (Lolkema et al., 2015).
2.4 The LOTOS-EUROS model
2.4.1 Model description
LOTOS-EUROS is an Eulerian chemistry transport model (CTM) (Manders et al., 2017) that simulates air pollution in the lower troposphere. A horizontal resolution of 0.50∘ longitude by 0.25∘ latitude, corresponding to approximately 28 by 28 km2, is used to perform simulations for Europe (35–70∘ N, 15∘ W–35∘ E). Secondly, for the case study of the Netherlands, the horizontal resolution is set to 0.125∘ longitude by 0.0625∘ latitude, approximately 7 by 7 km (50.5–54∘ N, 3–7.5∘ E). The vertical resolution of the model is a four-layer vertical grid that extends up to 3.5 km above sea level. The bottom layer is the surface layer and has a fixed height of 25 m. On top of this layer, there is a mixing layer, followed by two equally thick dynamic reservoir layers with time-varying thicknesses. The model follows the mixed layer approach. LOTOS-EUROS performs hourly calculations using meteorology provided by ECMWF (ECMWF, 2016). Gas-phase chemistry is described using the Netherlands Organisation for Applied Scientific Research (TNO) CBM-IV (carbon bond mechanism) scheme (Schaap et al., 2009), which is an updated version of the original scheme by (Whitten et al., 1980). Anthropogenic emissions used in LOTOS-EUROS are taken from the TNO Monitoring Atmospheric Composition and Climate (MACC) III emission database (Kuenen et al., 2014). LOTOS-EUROS uses a set of temporal factors (monthly, daily and hourly) to break down annual total emissions into hourly emissions. The time profile of a particular pollutant is an aggregation of the time-dependent emission strengths from different Selected Nomenclature for Sources of Air Pollution (SNAP) sources. The monthly NH3 emissions peak in March and then decrease, followed by another smaller peak in September. The daily NH3 emission strengths are redistributed more or less evenly over the week. The hourly NH3 emission peak is reached at 13:00 LT (Denier van der Gon et al., 2011).
2.4.2 Dry deposition parameterization
The dry deposition fluxes in LOTOS-EUROS are calculated with the Deposition of Acidifying Compounds (DEPAC) 3.11 module, following the resistance approach (van Zanten et al., 2010). In this approach, the deposition velocity is the reciprocal sum of the aerodynamic resistance, the quasi-laminar layer resistance and the surface resistance. A canopy compensation point for simulation of the bi-directional flux of NH3 is included in the implementation of the DEPAC3.11 module, following the approach presented in Wichink Kruit et al. (2012). The compensation point is computed dynamically using modelling results from the last month. The model uses the CORINE/Smiatek land use map converted to the DEPAC land use classes to determine the exchange velocities for different land use classes. More information on the LOTOS-EUROS model can be found in Manders et al. (2017).
2.4.3 Model performance
The LOTOS-EUROS model has participated in multiple model intercomparison studies (e.g. Colette et al., 2017; Wichink Kruit, 2013; Bessagnet et al., 2016; Vivanco et al., 2018), showing an overall good model performance. LOTOS-EUROS also showed a good correspondence with yearly NH3 concentrations with a slight underestimation in agricultural areas and overestimation in nature areas in the Netherlands (Wichink Kruit, 2013). The inferential method that we use here heavily relies on results from LOTOS-EUROS. The model therefore has to closely represent reality, if we wish to obtain reasonable results. As in any model, there are, however, uncertainties associated with every part of the total chain of modelled processes. The uncertainties related to emissions and to dry and wet deposition are expected to impact the results the most and are discussed below.
2.4.4 Uncertainties related to emission input
Emissions are the most important input for any CTM and are, at the same time, a source of substantial uncertainties (Reis et al., 2009; Behera et al., 2013). NH3 emissions are relatively uncertain due to the diverse nature of agricultural sources leading to large spatial and temporal variations in emissions. The uncertainty of the European reported annual totals is estimated to be around ±30 % (EMEP, 2016). The uncertainty is larger for countries that have limited research on their emission inventory and carry out a few emission measurement activities.
The presence of other gaseous components such as SO2 and NOx may have a high impact on the modelled NH3 concentrations, as NH3 in the atmosphere reacts readily with sulfuric acid (H2SO4) and nitric acid (HNO3) to form particulate ammonium (e.g. (NH4)2SO4 or NH4NO3). It is therefore also important to consider the errors in the SO2 and NOx emissions. The SO2 emissions are relatively well known per source category and thus hold a relatively low uncertainty of about ±10 % on reported annual totals. The uncertainty in the NOx emissions is higher, of around ±20 % on reported annual totals. However, due to interpolation to account for missing data for some countries, the final uncertainty of the annual totals of both SO2 and NOx is estimated to be higher (Kuenen et al., 2014).
Needless to say, one single emission at a certain time may have a much higher error due to the large uncertainty related to redistribution and the timing of emissions (Hendriks et al., 2016; Skjøth et al., 2011). More information on the quality data ratings of NH3, SO2 and NOx per source category and per country can be found in the report of the European Environment Agency (EEA, 2016).
2.4.5 Uncertainties regarding dry and wet deposition
The second source of uncertainties originates from the model parameterization of both dry and wet deposition. Several multi-model studies (e.g. Dentener et al., 2006a; Colette et al., 2017; Wichink Kruit, 2013; Flechard et al., 2011; Vivanco et al., 2018) have shown that there is quite a large discrepancy in the implementation of dry and wet deposition in different CTMs. A fundamental input for estimating dry deposition fluxes in CTMs is the uncertainty in the deposition velocity. Schrader and Brummer (2014) compiled a database of the NH3 deposition velocities per land use category that have been used in several deposition models from 2004 to 2013. The results showed quite a large variation in the Vd values for different land use classes. Some classes (e.g. water, urban) showed only a small variation in Vd of an interquartile range of ∼5 to 10 % for 50 % of the data. Other classes (e.g. coniferous, agriculture) showed a much larger interquartile range in Vd of ∼30 to 40 %. Flechard et al. (2011) compared four existing dry deposition routines across 55 Nr monitoring sites and found that the differences between models reach a factor 2–3 and are often larger than differences between monitoring sites. Erisman (1993) estimated the dry and wet deposition fluxes of acidifying substances in the Netherlands from measured and modelled concentrations. The estimated uncertainty in the average NH3 fluxes in this paper was estimated to be 30 %, with a systematic error of 30 % in the used Vd for NH3. Dentener et al. (2006a) calculated the deposition of Nr with 23 atmospheric chemistry transport models in a multi-model evaluation. Although there were quite large differences between the different models, the paper showed that 71.7 % of the model-calculated mean wet deposition rates in Europe agreed to within ±50 % with wet deposition measurements from the EMEP network.
The NH3 surface concentrations and dry deposition fluxes are estimated by combining the observations of the IASI-A satellite instrument and the modelling results from LOTOS-EUROS. The method is an adapted version of the approach for NO2 and SO2 presented by Nowlan et al. (2014). The IASI-A instrument only observes the NH3 total column at overpass time. We use the modelling results of LOTOS-EUROS to account for the diurnal variation in the atmospheric concentrations of NH3. The vertical NH3 profiles in LOTOS-EUROS are also used to deduce the ground-level NH3 concentrations from IASI. The computation of the IASI-derived NH3 surface concentrations and dry deposition fluxes is described in detail in the following sections.
3.1 Surface concentration computation
The NH3 total column observations from IASI are first regridded onto the LOTOS-EUROS model grid. The monthly mean NH3 total column concentrations are then calculated for each pixel. We use the vertical profile of NH3 per grid cell in LOTOS-EUROS to relate the IASI NH3 total column to NH3 surface concentrations. The IASI-derived NH3 surface concentrations (CIASI) are computed following Eq. (1):
Here, ΩIASI represents the monthly mean NH3 total column concentration from IASI (molecules cm−2), represents the modelled NH3 total column at overpass time in LOTOS-EUROS (molecules cm−2), and CLE is the modelled mean surface concentration (µg m−3), the concentration in the lowermost layer in LOTOS-EUROS.
3.2 Dry deposition flux computation
The hourly NH3 dry deposition fluxes are modelled in LOTOS-EUROS. The modelled NH3 dry deposition fluxes are then adjusted based on actual observations from IASI. The modelled and the IASI-derived NH3 concentrations share the same vertical profile. The ratio of the observed and the modelled total column concentrations, rather than the surface concentrations, is therefore directly used to alter the modelled NH3 dry deposition flux. The NH3 dry deposition flux (kg N ha−1 yr−1) inferred from IASI, FIASI, is computed following Eq. (2):
Here, ΩIASI denotes the NH3 total column concentration from IASI, the modelled NH3 total column at overpass time in LOTOS-EUROS (molecules cm−2) and the total daily NH3 dry deposition flux in LOTOS-EUROS (kg N ha−1yr−1). is the sum of the hourly NH3 dry deposition fluxes, as shown in Eq. (3):
The hourly NH3 dry deposition flux is the product of the dry deposition velocity Vd and the difference between the hourly NH3 surface concentration, and the total compensation point of NH3, . To account for the high variability of atmospheric NH3 and the limiting amount of available IASI observations, monthly means of these values are used rather than daily values.
3.3 Sensitivity analysis
The main sources of model uncertainties that are relevant for deposition modelling arise from uncertainties in the emission input and the deposition parameterizations (see Sect. 2.3).
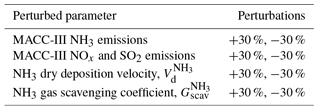
A total of four input fields were varied in LOTOS-EUROS: the MACC-III NH3 emissions, the MACC-III NOx and SO2 emissions, the dry deposition velocity, Vd, of NH3 and the wet deposition of NH3. The wet deposition is varied by adjustment of the gas scavenging constant, Gscav, for NH3. The wet scavenging constant Gscav linearly influences the amount of NH3 wet deposition. This results in changes in the wet NH3 deposition flux of +30 % and −30 %, too. The objective of these eight sensitivity runs is to assess the uncertainty ranges on the estimated dry NH3 deposition fluxes resulting from modelling errors. Table 2 gives an overview of the parameters that are varied. We chose to apply a constant perturbation of +30 % and −30 % to one field at the time to see their individual effect and to improve the comparability of the results, too. Moreover, perturbations of ±30 % are reasonable ranges since they correspond to the estimated uncertainties in the MACC-III emission fields' annual totals and the uncertainties in the wet and dry deposition fluxes of NH3.
Table 2Perturbations on input fields that have been used for the sensitivity analysis of the method.
4.1 NH3 surface concentrations
4.1.1 Europe
Figure 3 shows the warm season (April–September) mean NH3 surface concentrations in 2013 and 2014. Figure 3a, c, e, g show the modelled concentrations from LOTOS-EUROS (which we will refer to as the “modelled concentrations”) and concentrations that are derived from IASI in combination with LOTOS-EUROS (which we will refer to as “IASI-derived concentrations”). The dots represent the corresponding measurements from the EMEP stations. Figure 3b, d, f, h show the absolute differences between the EMEP measurements and the modelled and IASI-derived concentrations. In general, the pattern of the EMEP measurements and the modelled and IASI-derived concentrations matches quite well. The majority of the EMEP measurements agree with the modelled and IASI-derived concentrations to −0.75 to +0.75 µg m−3. The sum of the absolute differences between the warm season mean NH3 surface concentrations in a cubic metre from EMEP and LOTOS-EUROS was 23.0 µg in 2013 and 32.5 µg in 2014. The sum of the absolute differences between the warm season mean NH3 surface concentrations from EMEP and IASI was slightly lower: 22.6 µg in 2013 and 28.0 µg in 2014.
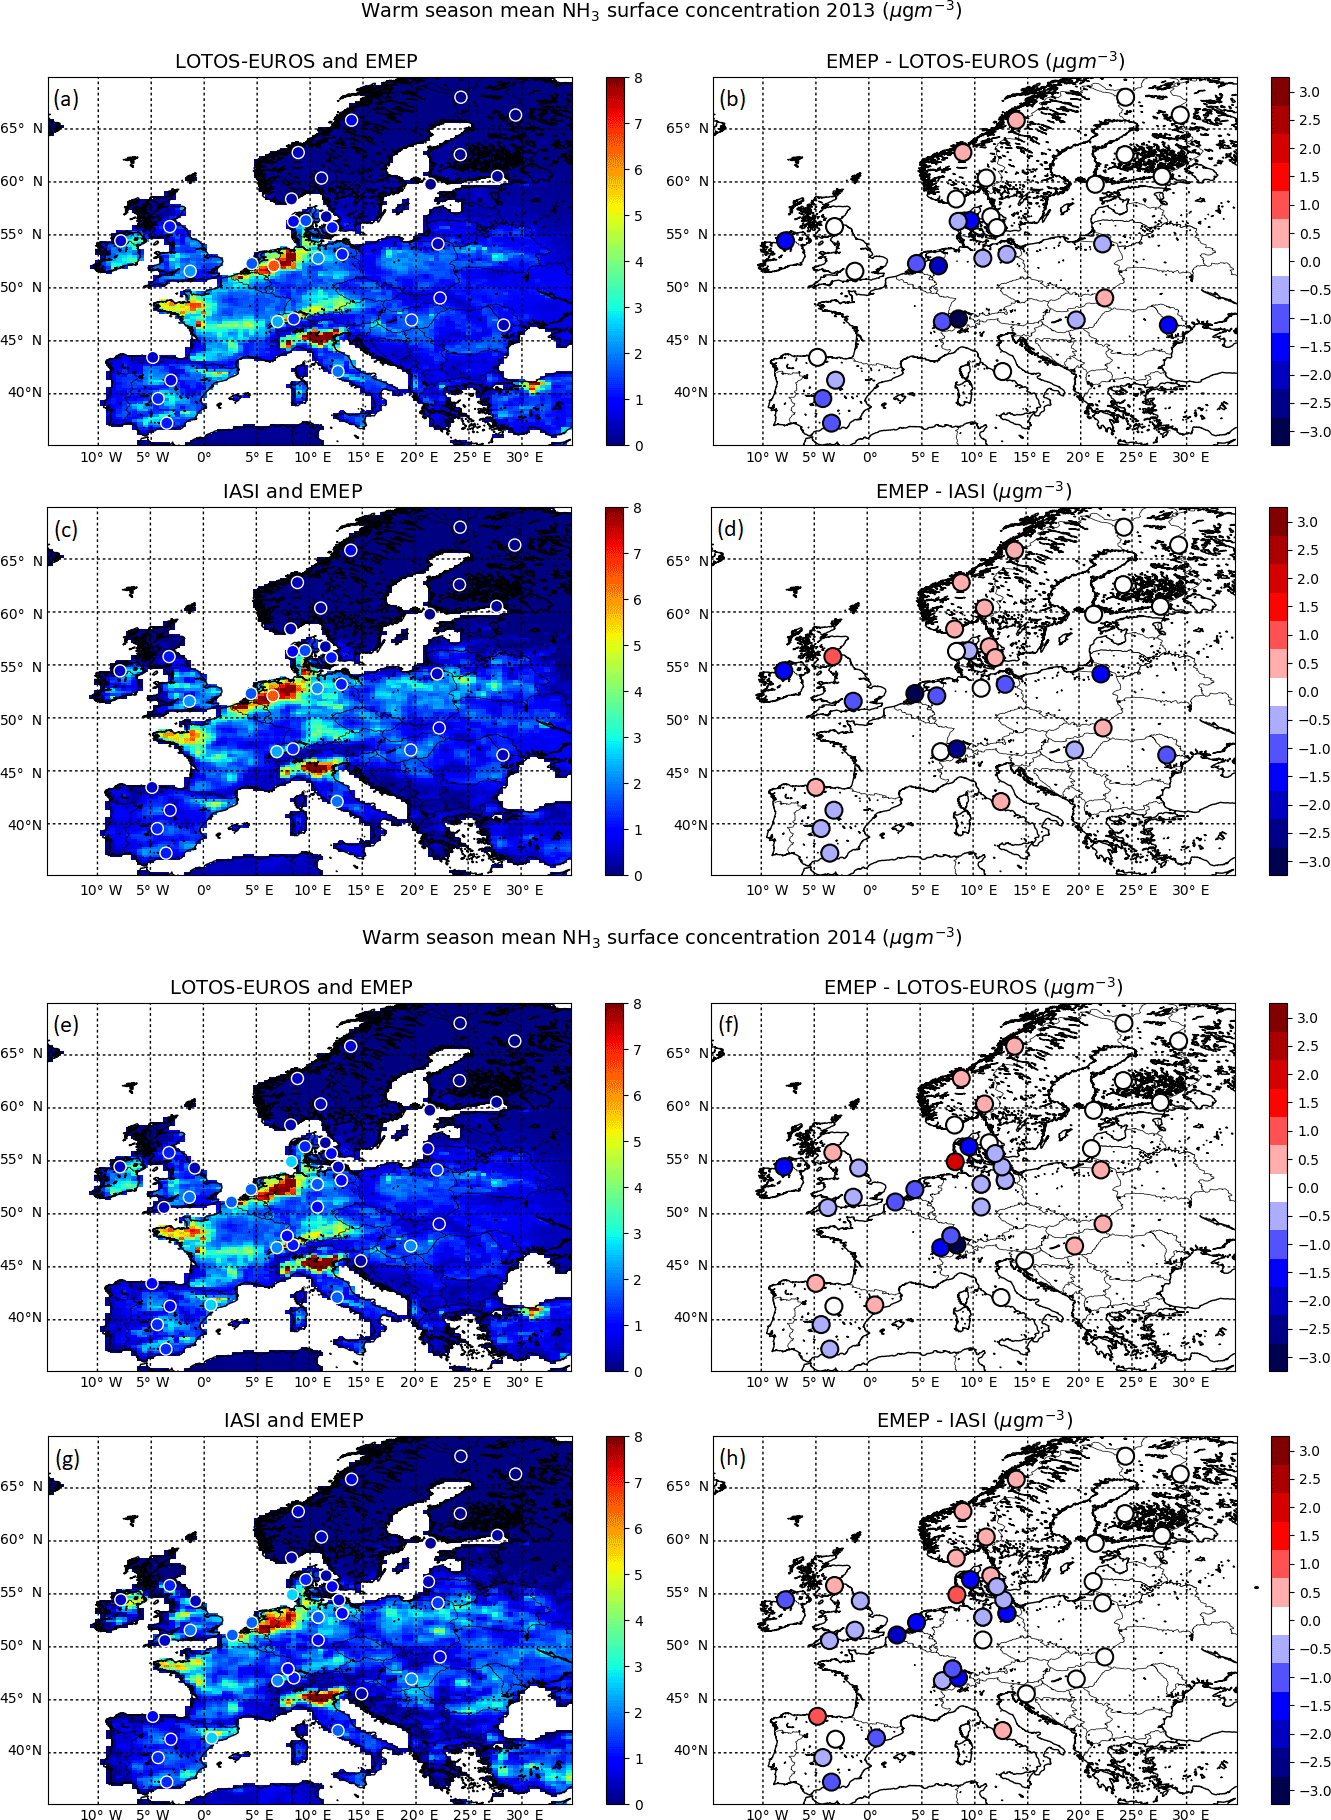
Figure 3Comparison of the warm season (April–September) mean NH3 surface concentrations (µg m−3) from LOTOS-EUROS and derived from IASI and the warm season mean NH3 surface concentrations measured by the EMEP stations in 2013 (a, b, c, d) and 2014 (e, f, g, h). The absolute differences between the two are shown in the right figures.
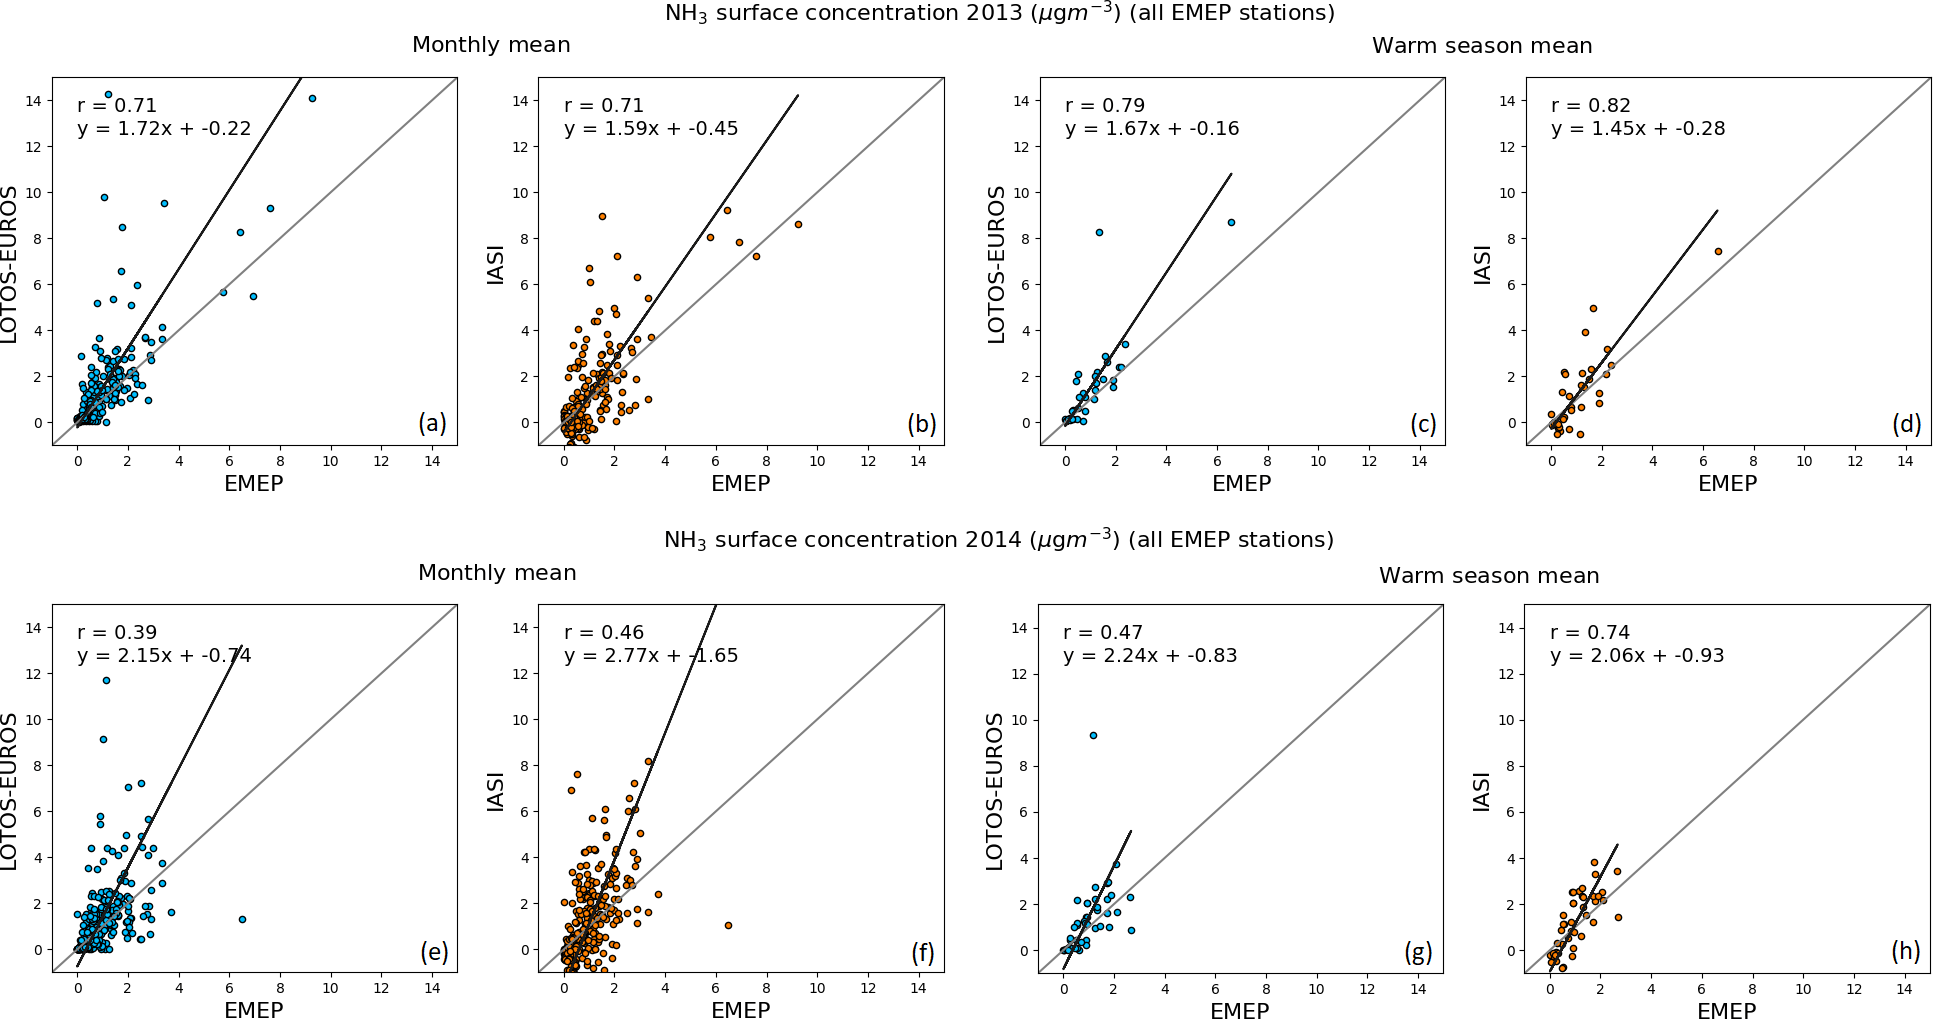
Figure 4Comparison of the monthly mean (a, b, e, f) and warm season (April–September) mean (c, d, g, h) NH3 surface concentrations measured by the EMEP stations and the corresponding NH3 surface concentrations from LOTOS-EUROS (blue dots) and inferred from IASI (orange dots) in 2013 (top) and 2014 (bottom).
Figure 4 shows scatterplots of the monthly mean (Fig. 4a, b, e, f) and the warm season mean (Fig. 4c, d, g, h) NH3 surface concentrations. The x axis represents concentrations measured by the EMEP stations. The y axis represents either the modelled concentrations (blue) or the IASI-derived concentrations (orange). The monthly mean modelled concentrations and the EMEP measurements show a reasonably strong linear relationship in 2013 (r=0.71). The correlation between the two was weaker (r=0.39) in 2014. The correlation between the IASI-derived concentrations and the EMEP measurements was similar in 2013 (r=0.71) and was higher in 2014 (r=0.46). The warm season mean IASI-derived concentrations and the EMEP measurements have a slightly stronger correlation coefficient and an improved slope compared to the modelled concentrations.
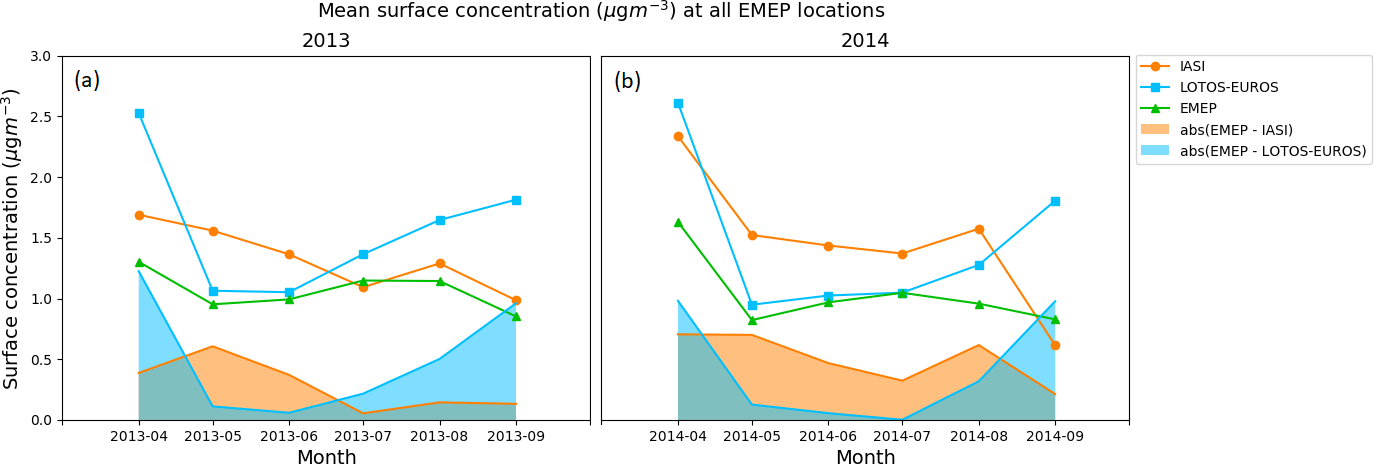
Figure 5Mean of the NH3 surface concentrations at all EMEP locations per month (green line) and the coinciding NH3 surface concentrations from LOTOS-EUROS (blue line) and derived from IASI (orange line) in 2013 (a) and 2014 (b). The absolute differences between EMEP and LOTOS-EUROS are shown in blue and the absolute differences between EMEP and IASI are shown in orange.
Figure 5 shows the mean NH3 surface concentration of all EMEP stations per month and the corresponding modelled and IASI-derived concentrations at the same locations. The absolute differences per month are plotted in the same figure in blue (LOTOS-EUROS vs. EMEP) and orange (IASI-derived vs. EMEP). All concentration time profiles show a peak value in April, resulting from spring fertilization. The LOTOS-EUROS time profile at the EMEP locations decreases from April to May and starts to increase towards the end of the year. The time profile of the EMEP stations follows the same pattern from April to June but decreases towards the end of the year. The IASI-derived time profile shows a decreasing pattern, except in August, where there is a small peak. The IASI-derived time profile shows a relatively better comparison with the EMEP measurements in April and July to September in 2013 and in April and September in 2014. The sum of the absolute differences of the mean NH3 surface concentrations in a cubic metre at all EMEP locations between LOTOS-EUROS and EMEP amounts to 3.1 µg in 2013 and 2.5 µg in 2014. The sum of the absolute differences between IASI and EMEP was somewhat smaller in 2013, amounting to 1.7 µg, and somewhat higher in 2014, amounting to 3.0 µg.
In summary, the majority of the IASI-derived concentrations showed a slightly stronger correlation with the EMEP measurements than modelled concentrations on a monthly basis. The correlation became more pronounced on a seasonal basis (mean of April–September).
4.1.2 The Netherlands
Comparison with LML measurements
Figure 6 shows the warm season (April–September) mean NH3 surface concentrations (µg m−3) in the Netherlands in 2013 and 2014. The corresponding LML measurements are plotted on top of the modelled and IASI-derived concentrations. LOTOS-EUROS seems to capture the general pattern of the LML measurements fairly well in both 2013 and 2014. The sum of the absolute differences between the warm season mean NH3 surface concentrations in a cubic metre from LML and LOTOS-EUROS was 47.3 µg in 2013 and 44.8 µg in 2014. The sum of the absolute differences between the warm season mean NH3 surface concentrations from LML and IASI was slightly lower in 2013, namely 44.9 µg, and somewhat higher in 2014, namely 48.5 µg.
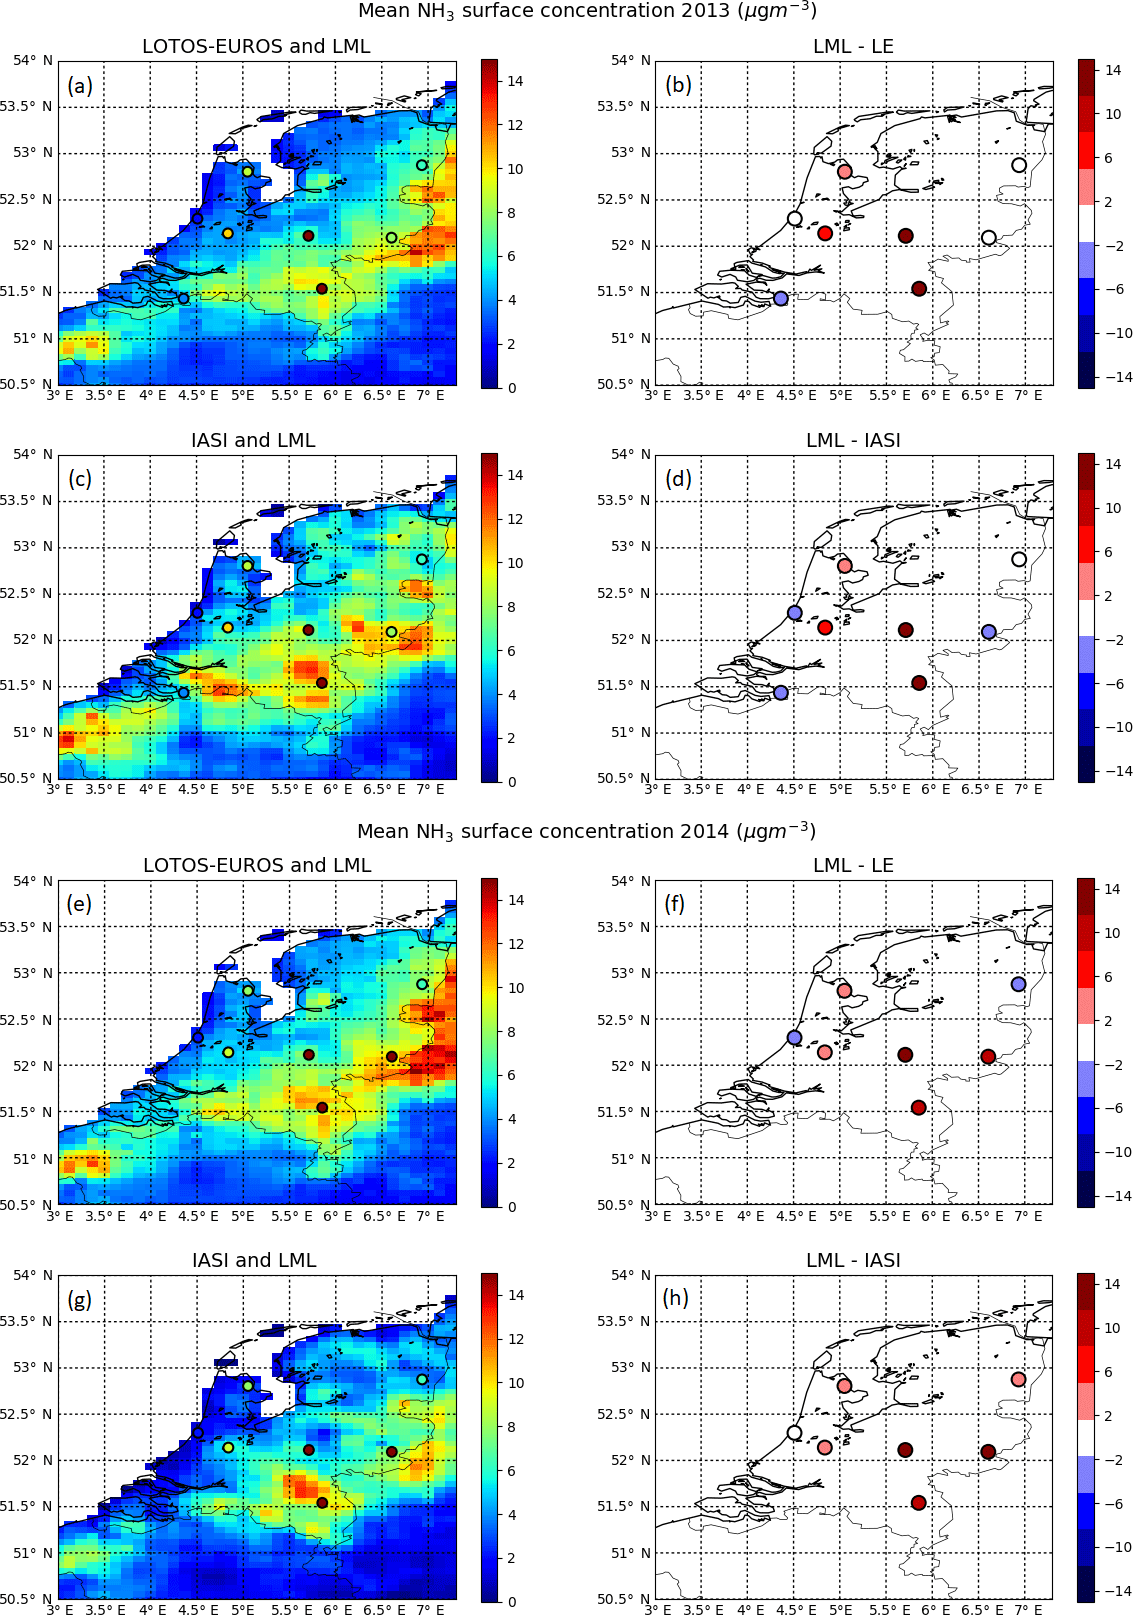
Figure 6Comparison of the warm season (April–September) mean NH3 surface concentration in 2013 (a, b, c, d) and in 2014 (e, f, g, h) from LOTOS-EUROS and derived using IASI. The corresponding warm season mean NH3 surface concentrations measured by the LML stations are plotted on top of the left figures. The right figures depict the differences between the two.
Figure 7 shows scatterplots of the monthly mean NH3 surface concentrations (µg m−3). The x axis depicts the LML measured concentrations. The y axis depicts the corresponding modelled and IASI-derived concentrations. The modelled concentrations and the LML measurements show a moderate linear relationship (r=0.39 in 2013, r=0.50 in 2014). The high NH3 concentration stations (Vredepeel and Wekerom) are underestimated by LOTOS-EUROS. The other stations are closer to the 1:1 line and appear to match quite well. The correlation coefficient of the IASI-derived concentrations and the LML measurements is r=0.39 in 2013 and r=0.53 in 2014. The IASI-derived concentrations also underestimate the high-concentration LML stations (Vredepeel and Wekerom) in both years. The majority of the low-concentration LML stations are overestimated by the IASI-derived concentrations in 2013 and underestimated by the IASI-derived concentrations in 2014. In general, both high and low LML measurements were reproduced inadequately by the IASI-derived concentrations. The elimination of the high-concentration stations (Vredepeel and Wekerom) does not lead to a better comparison of the LML measurements to the IASI-derived concentrations.
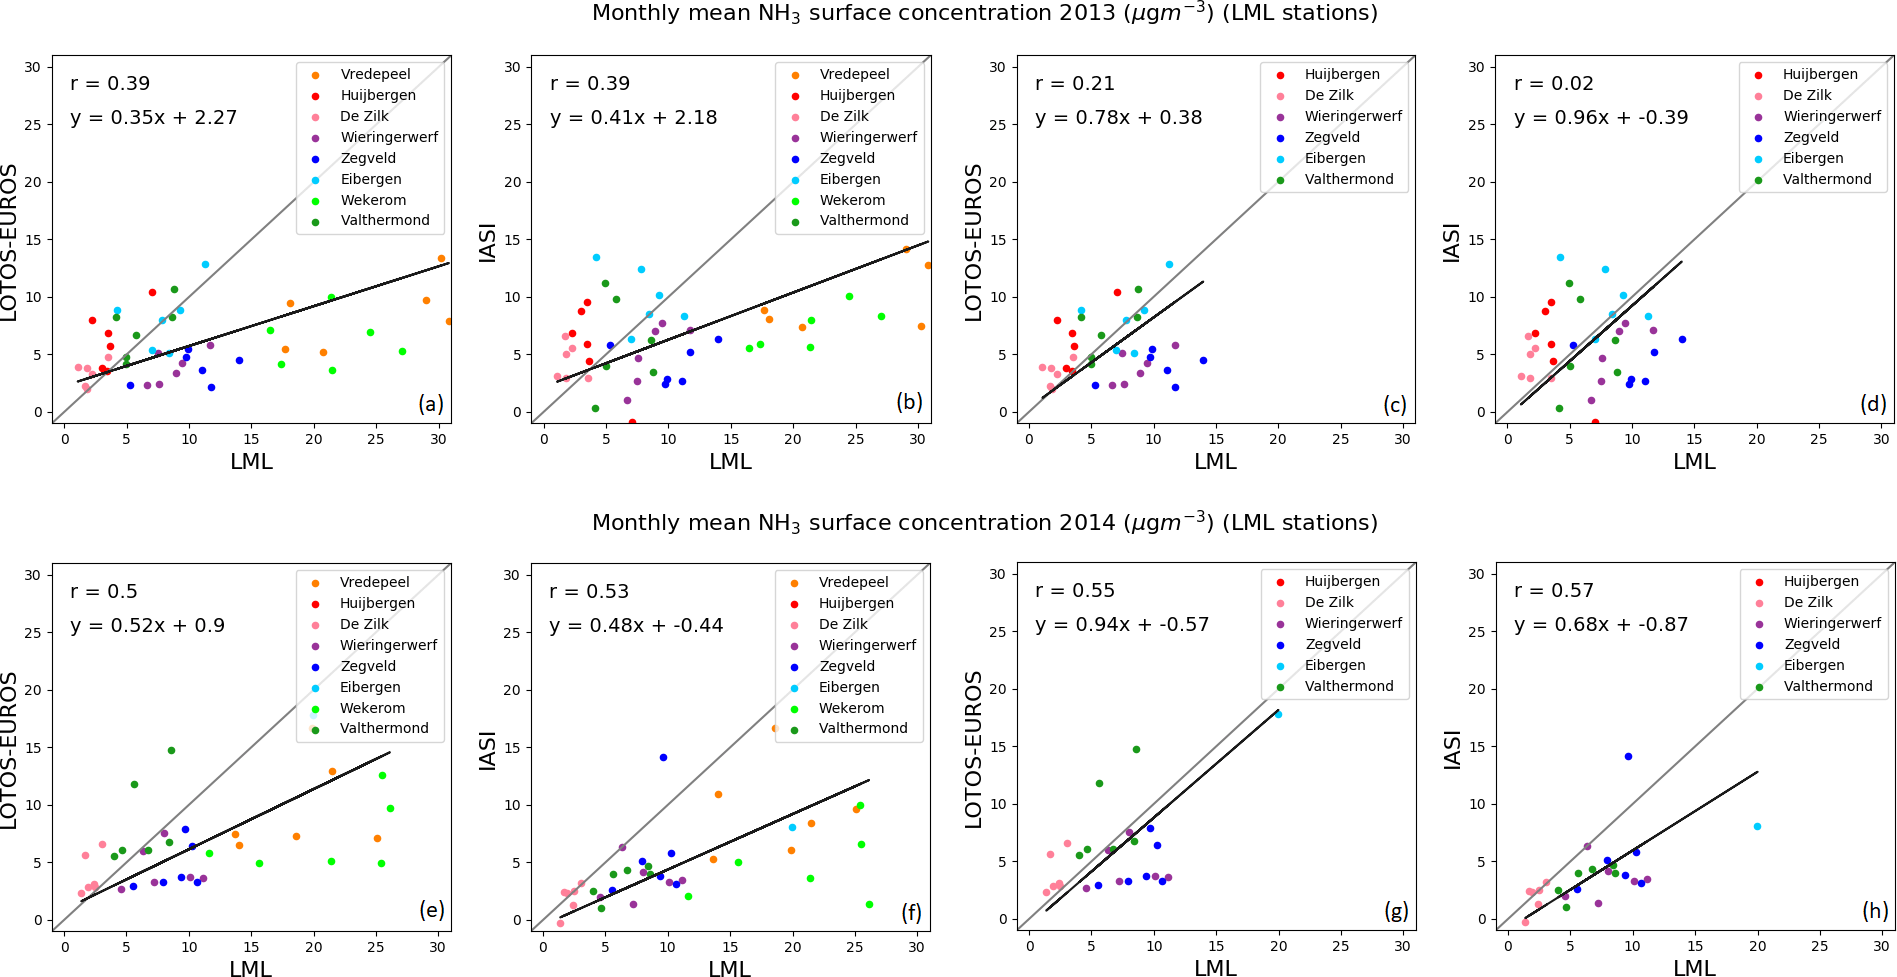
Figure 7Comparison of the monthly mean NH3 surface concentrations measured by the LML stations and the corresponding LOTOS-EUROS and IASI-derived NH3 surface concentrations during the warm season (April–September) of 2013 (top) and 2014 (bottom). The high-concentration stations (Vredepeel and Wekerom) are eliminated from the right figures (c, d, g, h).
Table 3 gives a month-by-month comparison of the correlation coefficient, the slope and the intercept of the monthly mean NH3 surface concentrations of all LML stations vs. the corresponding modelled and IASI-derived concentrations. In 5 out of 12 months, the IASI-derived concentrations and the LML measurements have a better correlation coefficient and slope compared to the modelled concentrations and the LML measurements. The modelled concentrations are consistently lower than the LML measurements.
In short, the IASI-derived concentrations do not show a better comparability with the LML measurements compared to the modelled concentrations.
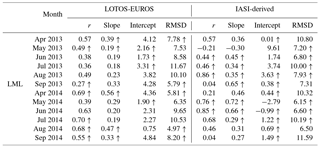
Table 3Month-by-month comparison of the correlation coefficient (r), slope and intercept of the monthly mean NH3 surface concentrations of the LML stations (x axis) and the coinciding monthly mean LOTOS-EUROS and IASI-derived NH3 surface concentrations (y axis). The arrows denote which of the two (LOTOS-EUROS or IASI) gives the most desirable value. The arrows are attributed to either LOTOS-EUROS or IASI based on the following criteria: highest r, slope closest to 1, intercept closest to 0 and smallest RMSD.
Comparison with MAN measurements
Figure 8 shows the warm season mean NH3 surface concentrations in the Netherlands in 2013 and 2014. The dots represent the corresponding MAN measurements. The patterns of the MAN measurements are captured quite well by the modelled concentrations, with low NH3 surface concentrations near the coast and increasing values towards the east of the Netherlands. The sum of the absolute differences between the warm season mean NH3 surface concentrations in a cubic metre from MAN and LOTOS-EUROS was 444.7 µg in 2013 and 494.3 µg in 2014. The sum of the absolute differences between the warm season mean NH3 surface concentrations from MAN and IASI was slightly higher in both years, amounting to 512.1 µg in 2013 and 513.6 µg in 2014.
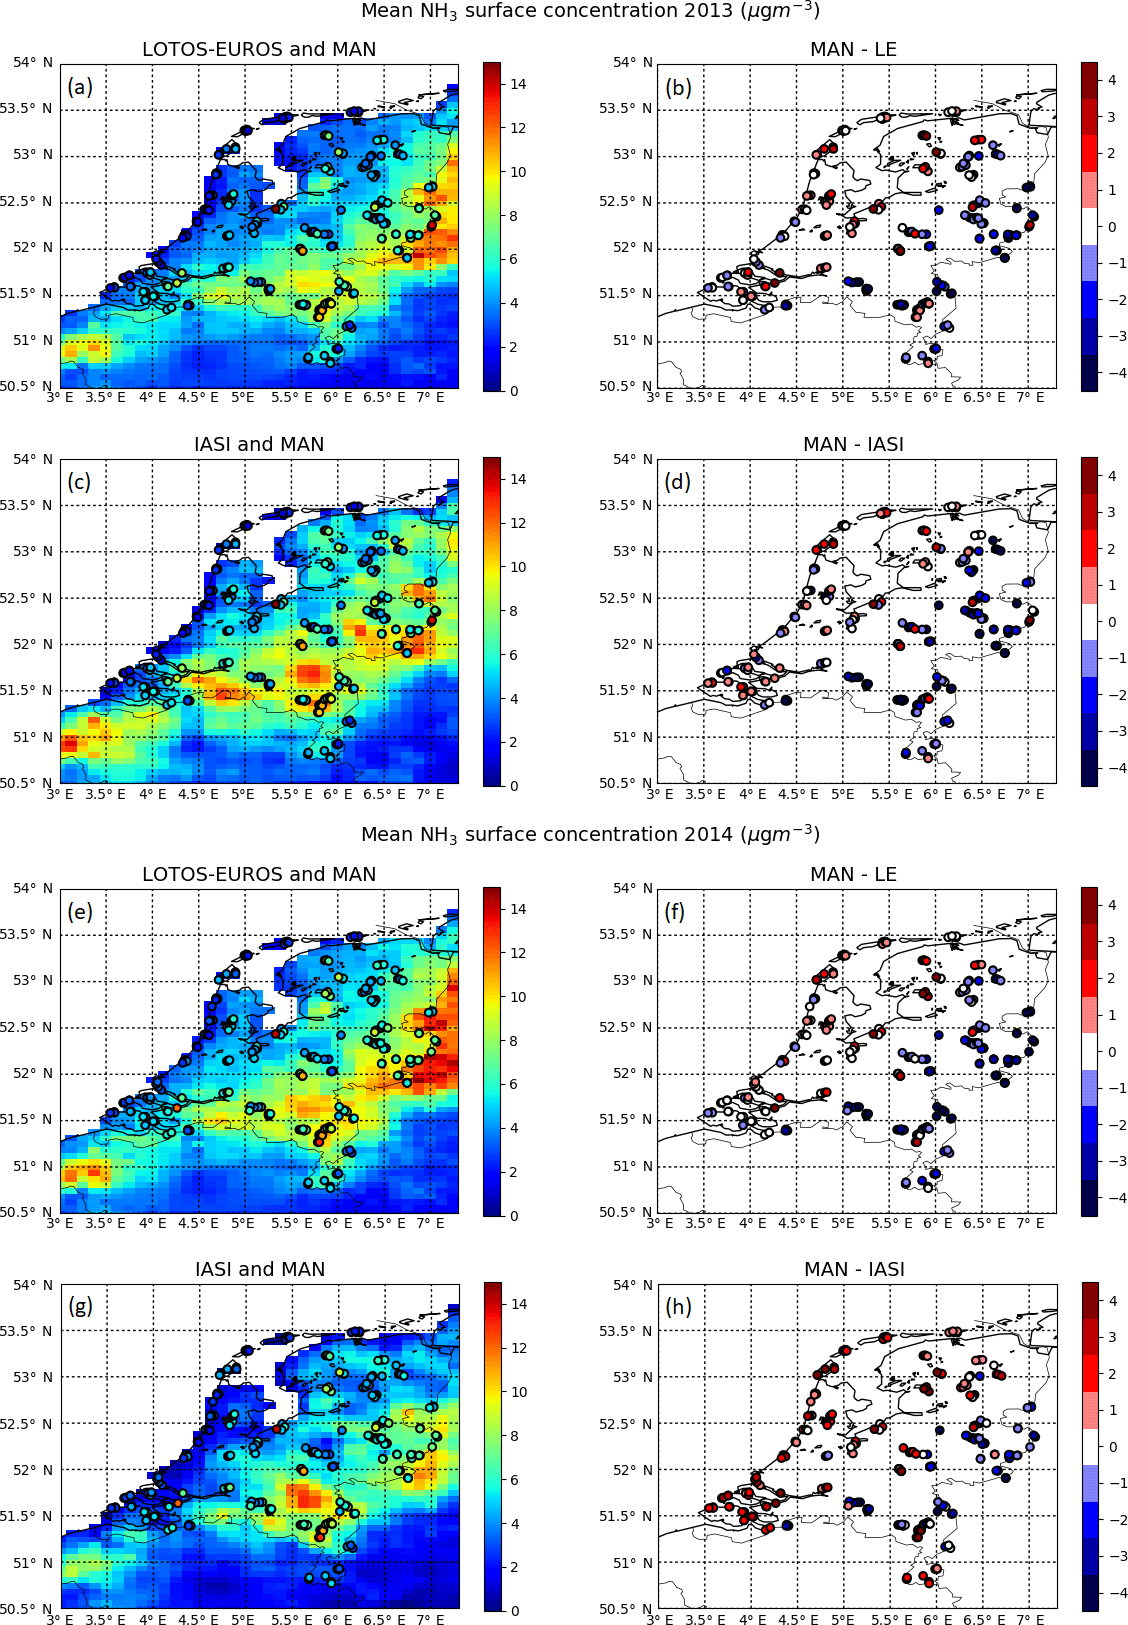
Figure 8Comparison of the warm season (April–September) mean NH3 surface concentration in 2013 (a, b, c, d) and in 2014 (e, f, g, h) from LOTOS-EUROS and derived using IASI. The corresponding warm season mean NH3 surface concentrations measured by the MAN stations are plotted on top of the left figures. The right figures depict the differences between the two.
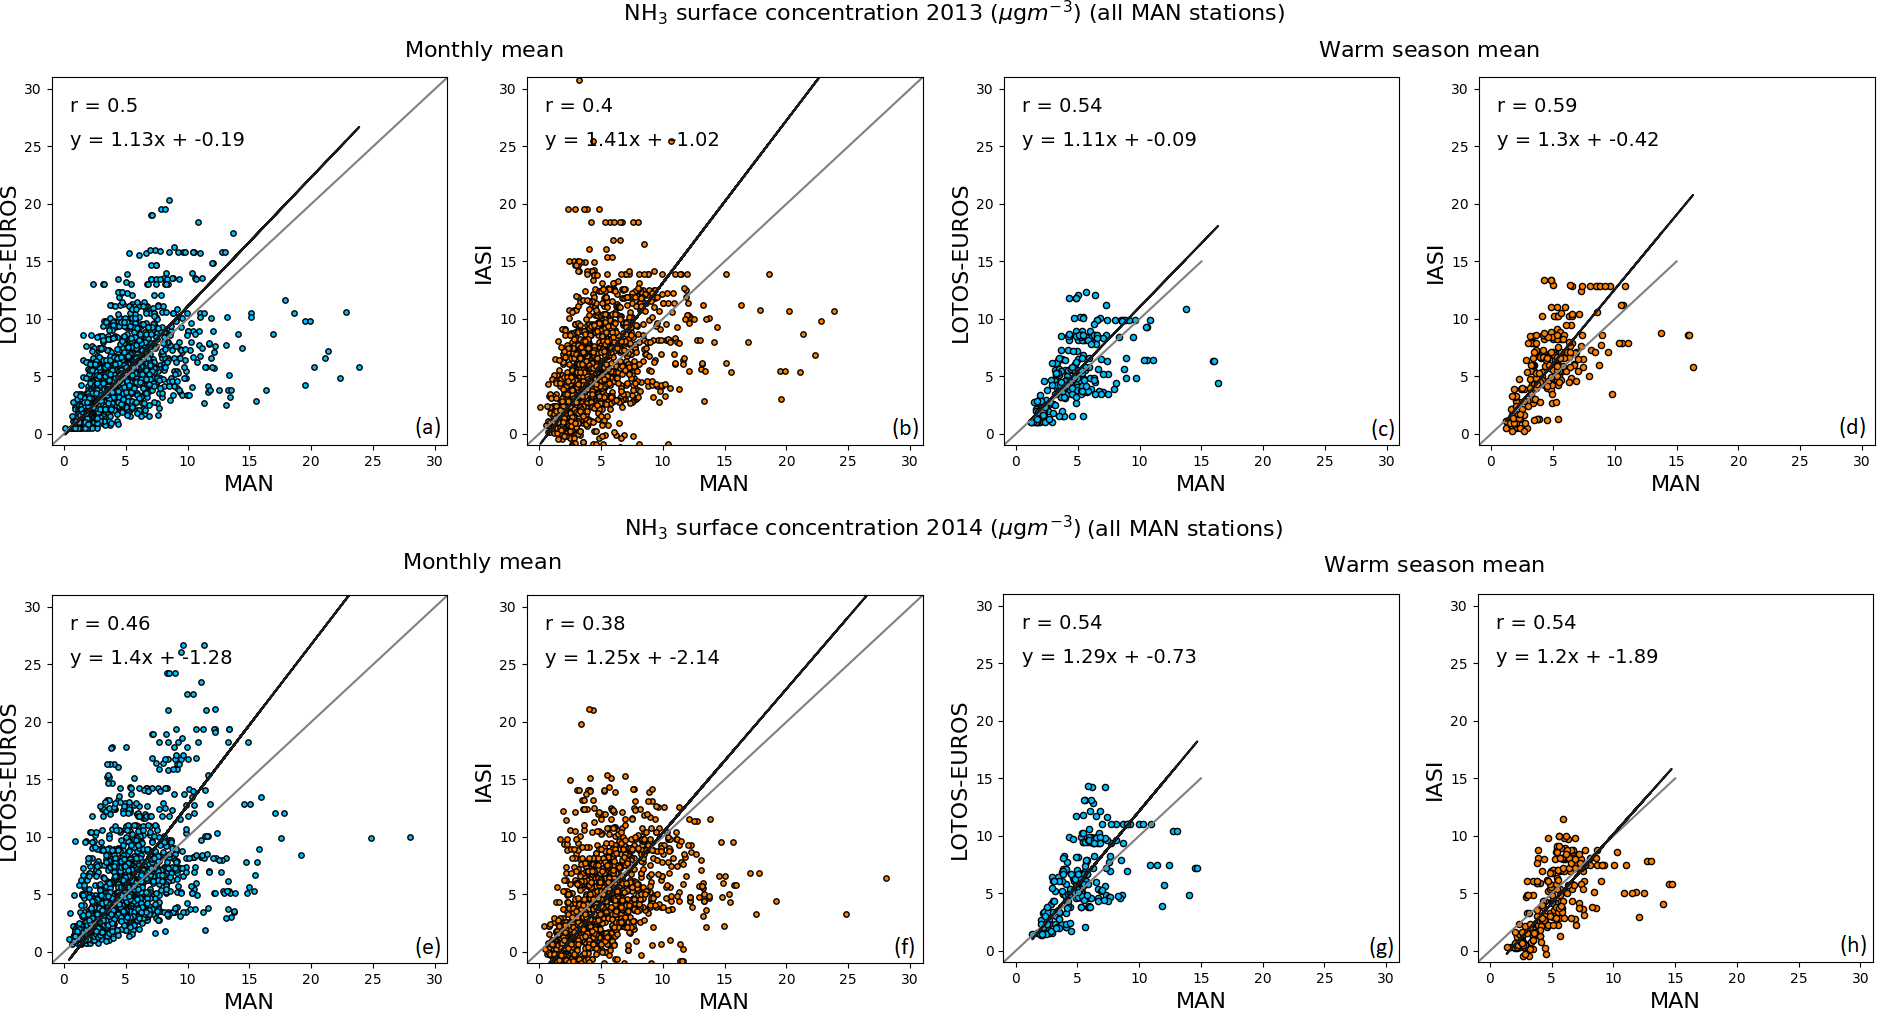
Figure 9Comparison of the monthly mean (a, b, e, f) and warm season (April–September) mean (c, d, g, h) NH3 surface concentrations measured by the MAN stations and the corresponding NH3 surface concentrations from LOTOS-EUROS (blue dots) and inferred from IASI (orange dots) in 2013 (top) and 2014 (bottom).
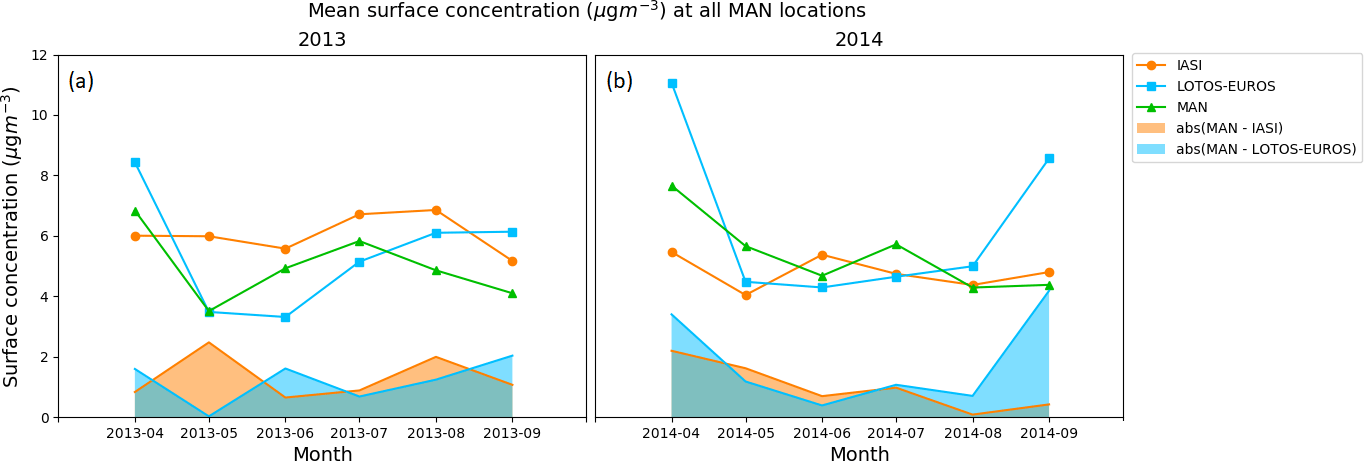
Figure 10Mean of the NH3 surface concentrations at all MAN locations per month (green line) and the coinciding NH3 surface concentrations from LOTOS-EUROS (blue line) and IASI (orange line) in 2013 (a) and 2014 (b). The absolute differences between MAN and LOTOS-EUROS are shown in blue and the absolute differences between MAN and IASI are shown in orange.
Figure 9 shows scatterplots of the monthly mean (Fig. 9a, b, e, f) and warm season mean (Fig. 9c, d, g, h) NH3 surface concentrations. The x axis depicts the MAN measurements. The y axis depicts the corresponding modelled or IASI-derived concentrations. The modelled concentrations and the MAN measurements show a moderate positive linear relationship (r=0.5 in 2013, r=0.46 in 2014). The correlation of the IASI-derived concentrations and the MAN measurements is somewhat weaker in both years (r=0.40 in 2013, r=0.38 in 2014). The IASI-derived concentrations and the MAN measurements show a similar to slightly stronger correlation (r=0.59 in 2013, r=0.54 in 2014) compared to the modelled concentrations and the MAN measurements for the warm season (r=0.54 in 2013, r=0.54 in 2014).
Figure 10 shows the mean NH3 surface concentration of all MAN stations per month and the corresponding modelled and IASI-derived concentrations at the same locations. The absolute differences per month are plotted in blue (LOTOS-EUROS vs. MAN) and orange (IASI-derived vs. MAN). The mean of all MAN stations peaks in April in both years. In 2013, the mean of all MAN stations increases from May on, peaks in July and then decreases towards the end of the year. In 2014, there is an additional peak in July, followed by another decrease.
The sum of the absolute differences of the mean NH3 surface concentrations in a cubic metre at all MAN locations between LOTOS-EUROS and MAN amounts to 7.2 µg in 2013 and 10.9 µg in 2014. The sum of the absolute differences between IASI and MAN was somewhat larger in 2013, amounting to 7.9 µg, but considerably smaller in 2014, amounting to 6.0 µg.
Table 4Month-by-month comparison of the correlation coefficient (r), slope and intercept of the monthly mean NH3 surface concentrations of the MAN stations (x axis) and the coinciding monthly mean LOTOS-EUROS and IASI-derived NH3 surface concentrations (y axis). The arrows denote which of the two (LOTOS-EUROS or IASI) gives the most desirable values. The arrows are attributed to either LOTOS-EUROS or IASI based on the following criteria: highest r, slope closest to 1, intercept closest to 0 and smallest RMSD.
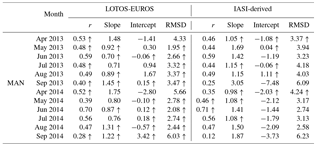
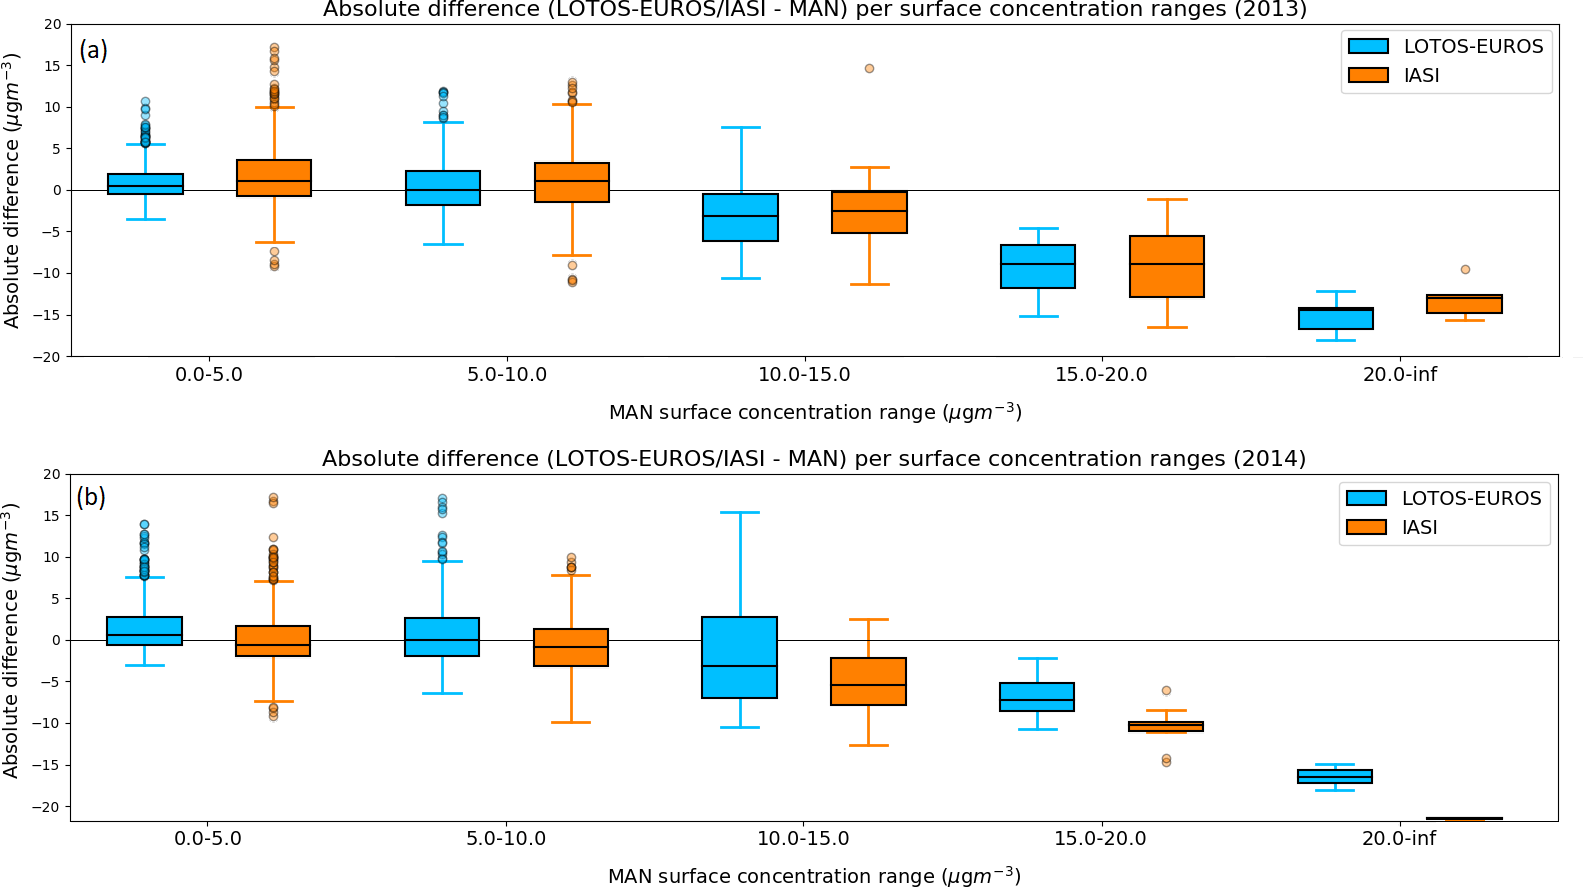
Figure 11The absolute differences between the monthly mean NH3 surface concentrations modelled in LOTOS-EUROS (blue) and derived from IASI (orange) and the monthly mean NH3 surface concentrations measured by the MAN stations in the warm season (April–September) in 2013 (a) and 2014 (b), grouped as function of the MAN monthly mean NH3 surface concentrations. The black line indicates the median, the edges of the boxes indicate the 25th and the 75th percentiles (Q1 and Q2), the whiskers indicate the full range of the absolute differences (Q1 − 1.5*IQR and Q3 + 1.5*IQR), and the dots indicate the outliers values that lie outside the whiskers.
Table 4 shows the correlation coefficient, the slope and the intercept of the MAN measurements vs. the modelled and IASI-derived concentrations for the warm months in 2013 and 2014. In 2013, the IASI-derived concentrations show a weaker correlation with the MAN measurements than the modelled concentrations in all months. Only in May and June in 2014, the IASI-derived concentrations compared slightly better to the MAN measurements than the modelled concentrations.
The data are grouped into different MAN NH3 surface concentration ranges to test the performance of the modelled and IASI-derived concentrations as a function of concentration level. Figure 11 shows the grouped absolute differences between the monthly mean NH3 surface concentrations measured by the MAN stations and the corresponding modelled (blue) and IASI-derived (orange) concentrations. For low MAN concentration ranges (0–10 µg m−3), the modelled concentrations agree fairly well with the MAN measurements in both years. For higher MAN concentration ranges (>10 µg m−3), the model seems to underestimate the monthly mean NH3 surface concentrations. The IASI-derived concentrations were relatively higher than the modelled concentrations for all concentration levels in 2013. The opposite is true in 2014, where the IASI-derived concentrations were relatively lower than the modelled concentrations. We conclude that the differences between modelled and IASI-derived concentrations in the Netherlands cannot be assigned to specific concentration levels.
In summary, the comparison with the MAN measurements does also not show any significant or consistent improvement in the IASI-derived concentrations compared to the modelled concentrations.
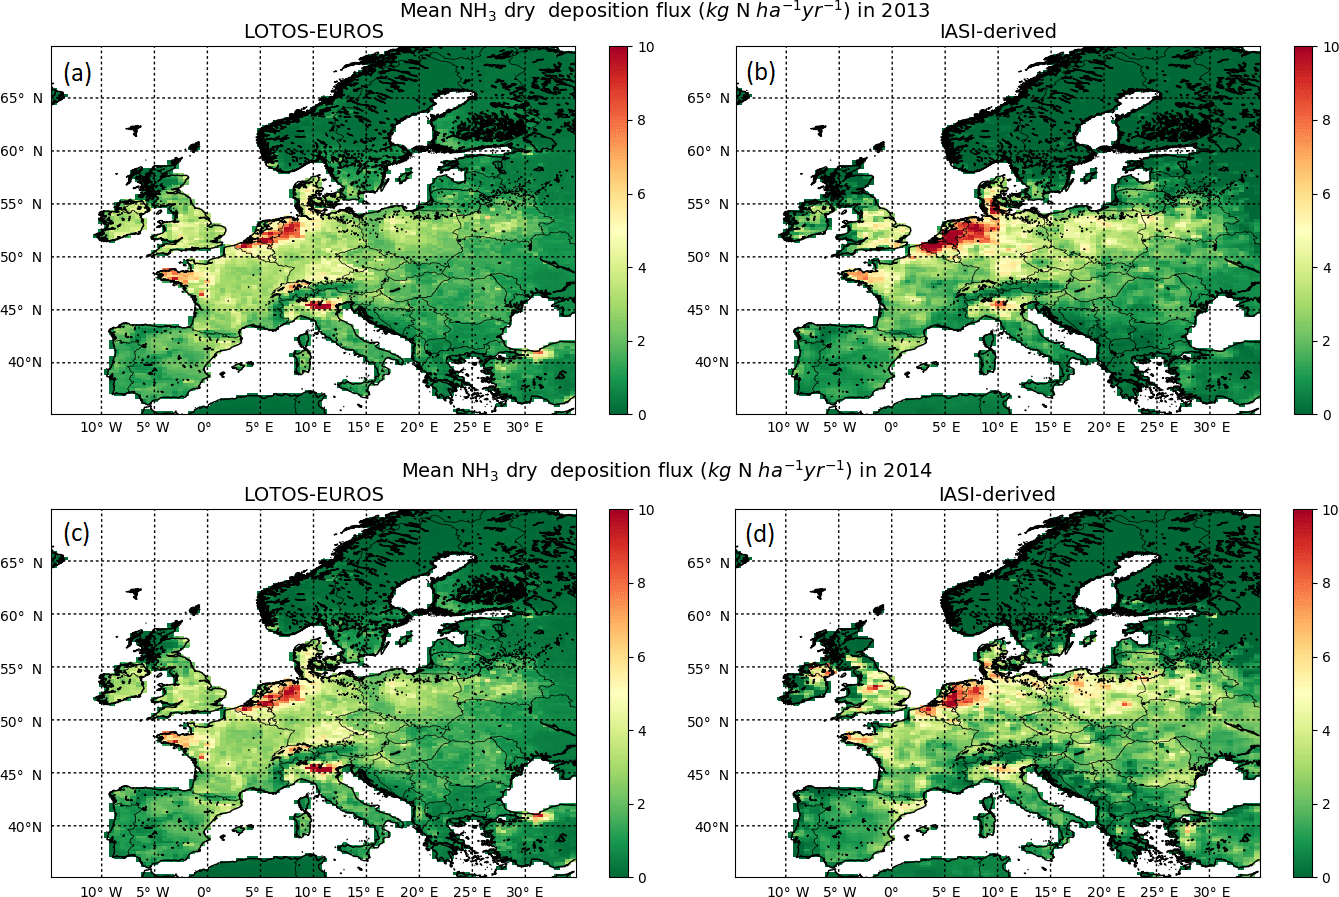
Figure 12The warm season (April to September) mean NH3 dry deposition modelled in LOTOS-EUROS (a, c) and inferred from IASI (b, d) in kg N ha−1 yr−1 in 2013 (a, b) and 2014 (c, d).
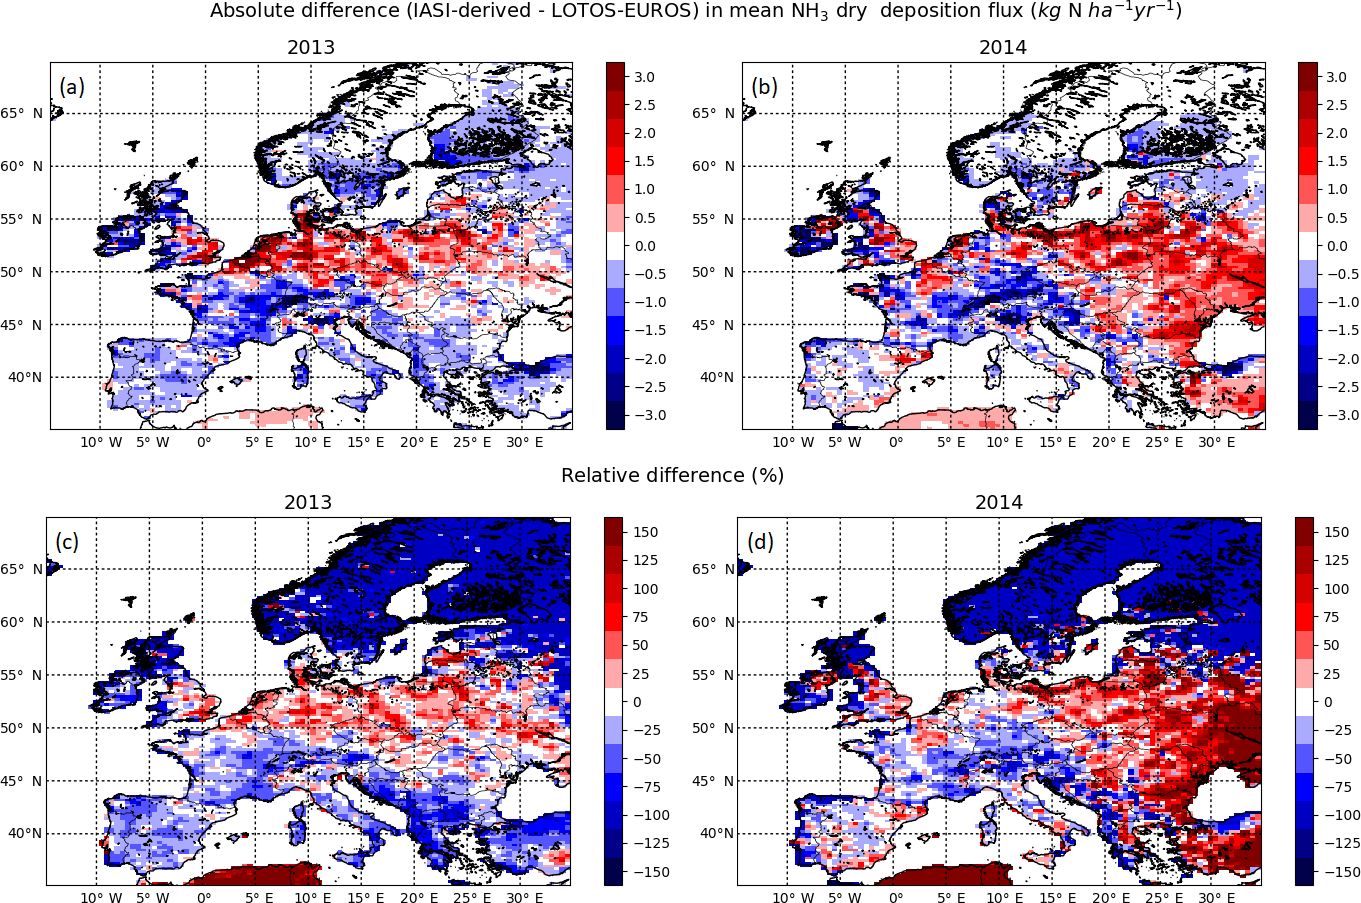
Figure 13The absolute (a, b) and relative (c, d) differences in the warm season (April to September) mean NH3 dry deposition modelled in LOTOS-EUROS and inferred from IASI in 2013 (a, c) and 2014 (b, d).
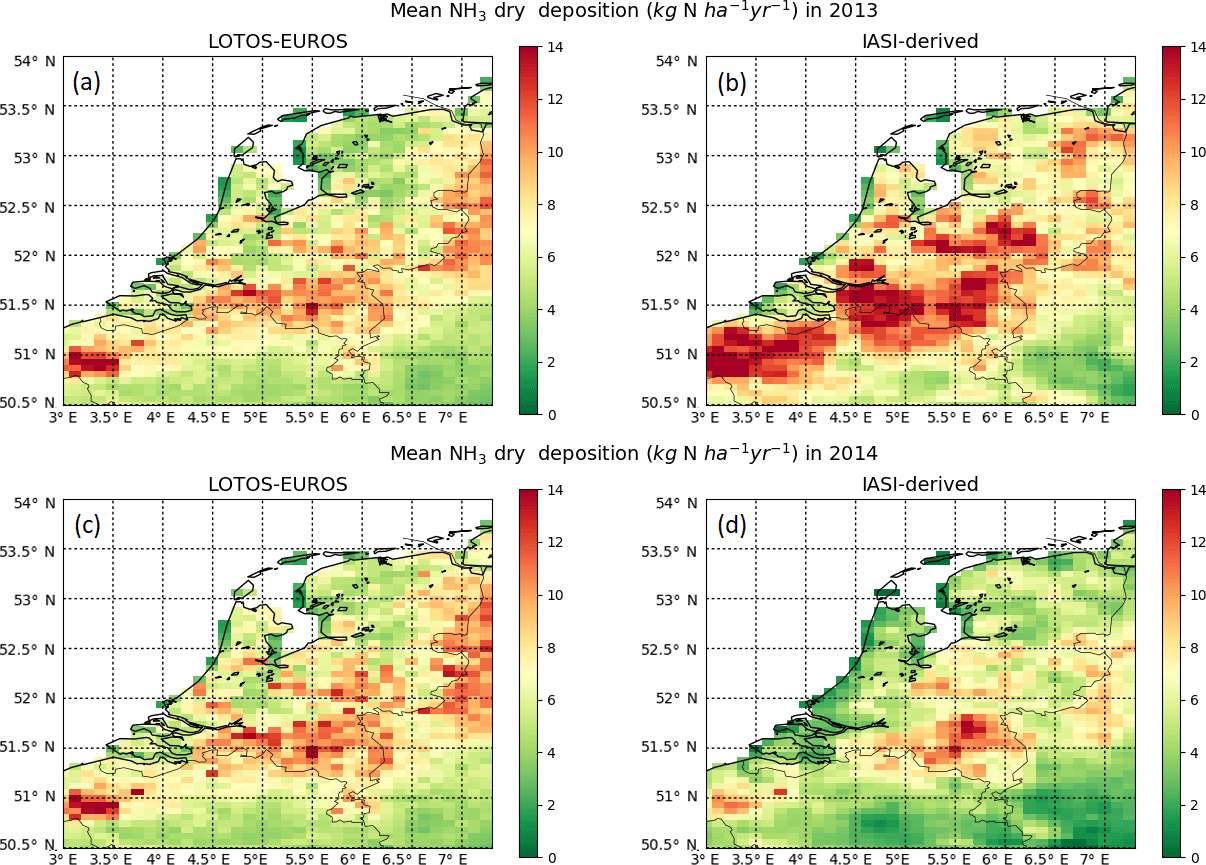
Figure 14The warm season (April to September) mean NH3 dry deposition in the Netherlands modelled in LOTOS-EUROS (a, c) and inferred from IASI (b, d) in kg N ha−1 yr−1 in 2013 (a, b) and 2014 (c, d).

Figure 15The absolute (a, b) and relative (c, d) differences in the warm season (April to September) mean NH3 dry deposition in the Netherlands modelled in LOTOS-EUROS and inferred from IASI in 2013 (a, c) and 2014 (b, d).
4.1.3 Summary of the comparison with in situ measurements
We compared the modelled and IASI-derived concentrations to measurements of the European EMEP network. The IASI-derived concentrations showed in general a slightly stronger correlation with the EMEP measurements than modelled concentrations on a monthly basis. Moreover, the correlation became more pronounced on a seasonal basis (mean of April–September). We then compared the modelled and the IASI-derived concentrations to measurements of Dutch MAN and LML networks. This comparison, on the other hand, did not show any significant or consistent improvement in the IASI-derived concentrations compared to the modelled concentrations.
In general, both the modelled and the IASI-derived concentrations seem to be overestimated in emission areas. This could potentially be related to the overpass time of the satellite. In high emission areas, the NH3 concentrations are more variable in time, and the IASI observations might have an uncertain representativeness. Moreover, the measurements in high emission areas are generally more uncertain with regard to their spatial representativeness. Overall, these measurements can be more affected by local rather than regional sources.
Generally, the modelled and the observed NH3 total columns match quite well. This means that the LOTOS-EUROS model represents the spatial distribution of NH3 rather well. There are some areas with large discrepancies between the two where we see considerable deviations in the modelled and the IASI-derived concentrations. Most of these areas, however, cannot be validated against measurements, because of the lack of measurements here. The changes in the comparison of the available measurements with modelled vs. IASI-derived concentrations are therefore relativity small. Based on the measurements we have, we conclude that we do not see any significant improvement in the IASI-derived concentrations compared to the modelled concentrations.
The differences between Europe and the Netherlands could be explained by the location of the ground measurements. The majority of the European-scale stations are located in background regions, with relatively well-mixed and low NH3 concentrations. Most stations in the Netherlands, on the other hand, are located in, or nearby, regions with relatively higher NH3 concentrations. As a result, the vertical profile shapes in LOTOS-EUROS in the Netherlands are more complex and variable in time, as this region is influenced by a constantly changing combination of transport, emission and deposition. The use of an inadequate vertical profile to derive NH3 surface concentrations from IASI could lead to an erroneous redistribution of the total amount of measured NH3, therewith worsening the comparability with in situ measurements. On the contrary, the vertical profile shapes in background regions are more stable and constant in time, and therefore more likely to be described adequately by the LOTOS-EUROS model.
Side note on validation with in situ measurements
The differences between the in situ measurement and the modelled and IASI-derived concentrations can partially be explained by their discrepancy in terms of spatial representation, which limits their comparability to some extent. The footprint of the in situ measurements is relatively small and easily influenced by local factors, whereas the model and the satellite provide us with a mean value over a much larger area. The two high-concentration stations of the LML network in the Netherlands, Vredepeel and Wekerom, are, for instance, influenced by nearby emission sources which cannot be resolved by regional models at the current resolution.
4.2 NH3 dry deposition flux
4.2.1 Europe
The monthly mean dry NH3 deposition flux has been computed for the warm season (April to September) in 2013 and 2014. Figure 12 shows the warm season mean dry NH3 deposition flux (kg N ha−1 yr−1). Figure 12a, c show the original, modelled flux from LOTOS-EUROS (which will be referred to as the “modelled flux”). Figure 12b, d show the modelled flux adjusted by the IASI satellite observations (which will be referred to as “IASI-derived flux”). The modelled fluxes were very similar in both years. Figure 13 shows the absolute and relative differences between the modelled and the IASI-derived flux. In 2013, the IASI-derived fluxes were higher than the modelled fluxes in the Netherlands and Belgium. This depicts that the IASI-observed NH3 total columns here were higher than the modelled total columns in LOTOS-EUROS. The IASI-derived fluxes were higher than the modelled fluxes in other areas such as Germany and large parts of central Europe, mainly in Poland, Belarus and Romania. In 2014, the IASI-derived fluxes were much higher than the modelled flux in parts of central Europe, mainly in Poland and the Czech Republic, and in parts of the United Kingdom, for instance, Northern Ireland. In both years, the IASI-derived fluxes were much lower than modelled fluxes in Switzerland, the Po Valley in Italy and the northern part of Turkey. Here, the IASI-observed NH3 total columns were thus consistently lower than the modelled total columns in LOTOS-EUROS. Inadequate emission input data could explain the differences at these locations. Another possible cause is incorrect modelling of the atmospheric transport and/or stability of NH3 in LOTOS-EUROS.
4.2.2 The Netherlands
The modelled and IASI-derived fluxes in the Netherlands are shown in Fig. 14. Figure 14 shows that the modelled fluxes were similar in both years, whereas the IASI-derived flux varied quite a lot. The IASI-derived flux was higher than the modelled flux in 2013 and lower than the modelled flux in 2014. The IASI-observed NH3 total columns in the Netherlands were thus in general somewhat higher than the modelled NH3 columns in 2013 and somewhat lower than the modelled NH3 columns in 2014.
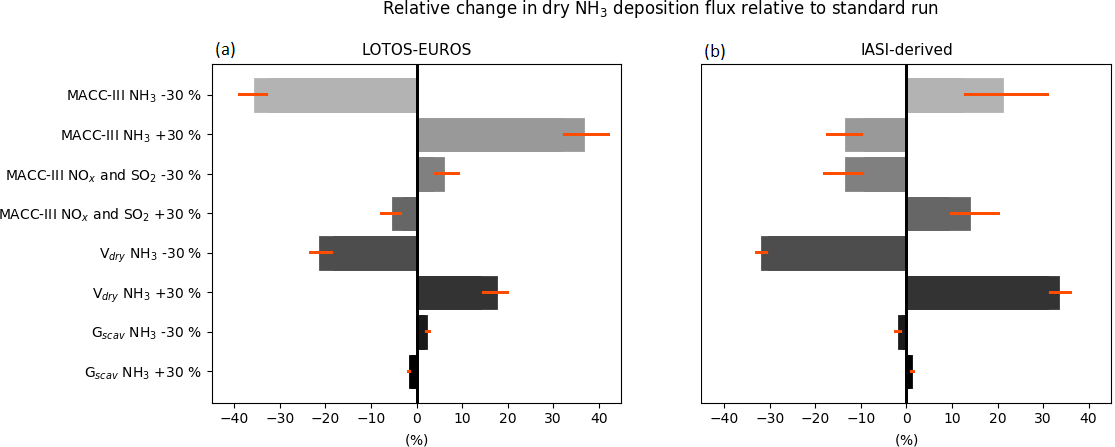
Figure 16The median change (%) in the terrestrial NH3 dry deposition flux in 2014 in (kg N ha−1 yr−1) from LOTOS-EUROS (a) and IASI-derived fluxes (b), resulting from different perturbations of model inputs of LOTOS-EUROS. The orange lines indicate the 25th and the 75th quartiles.
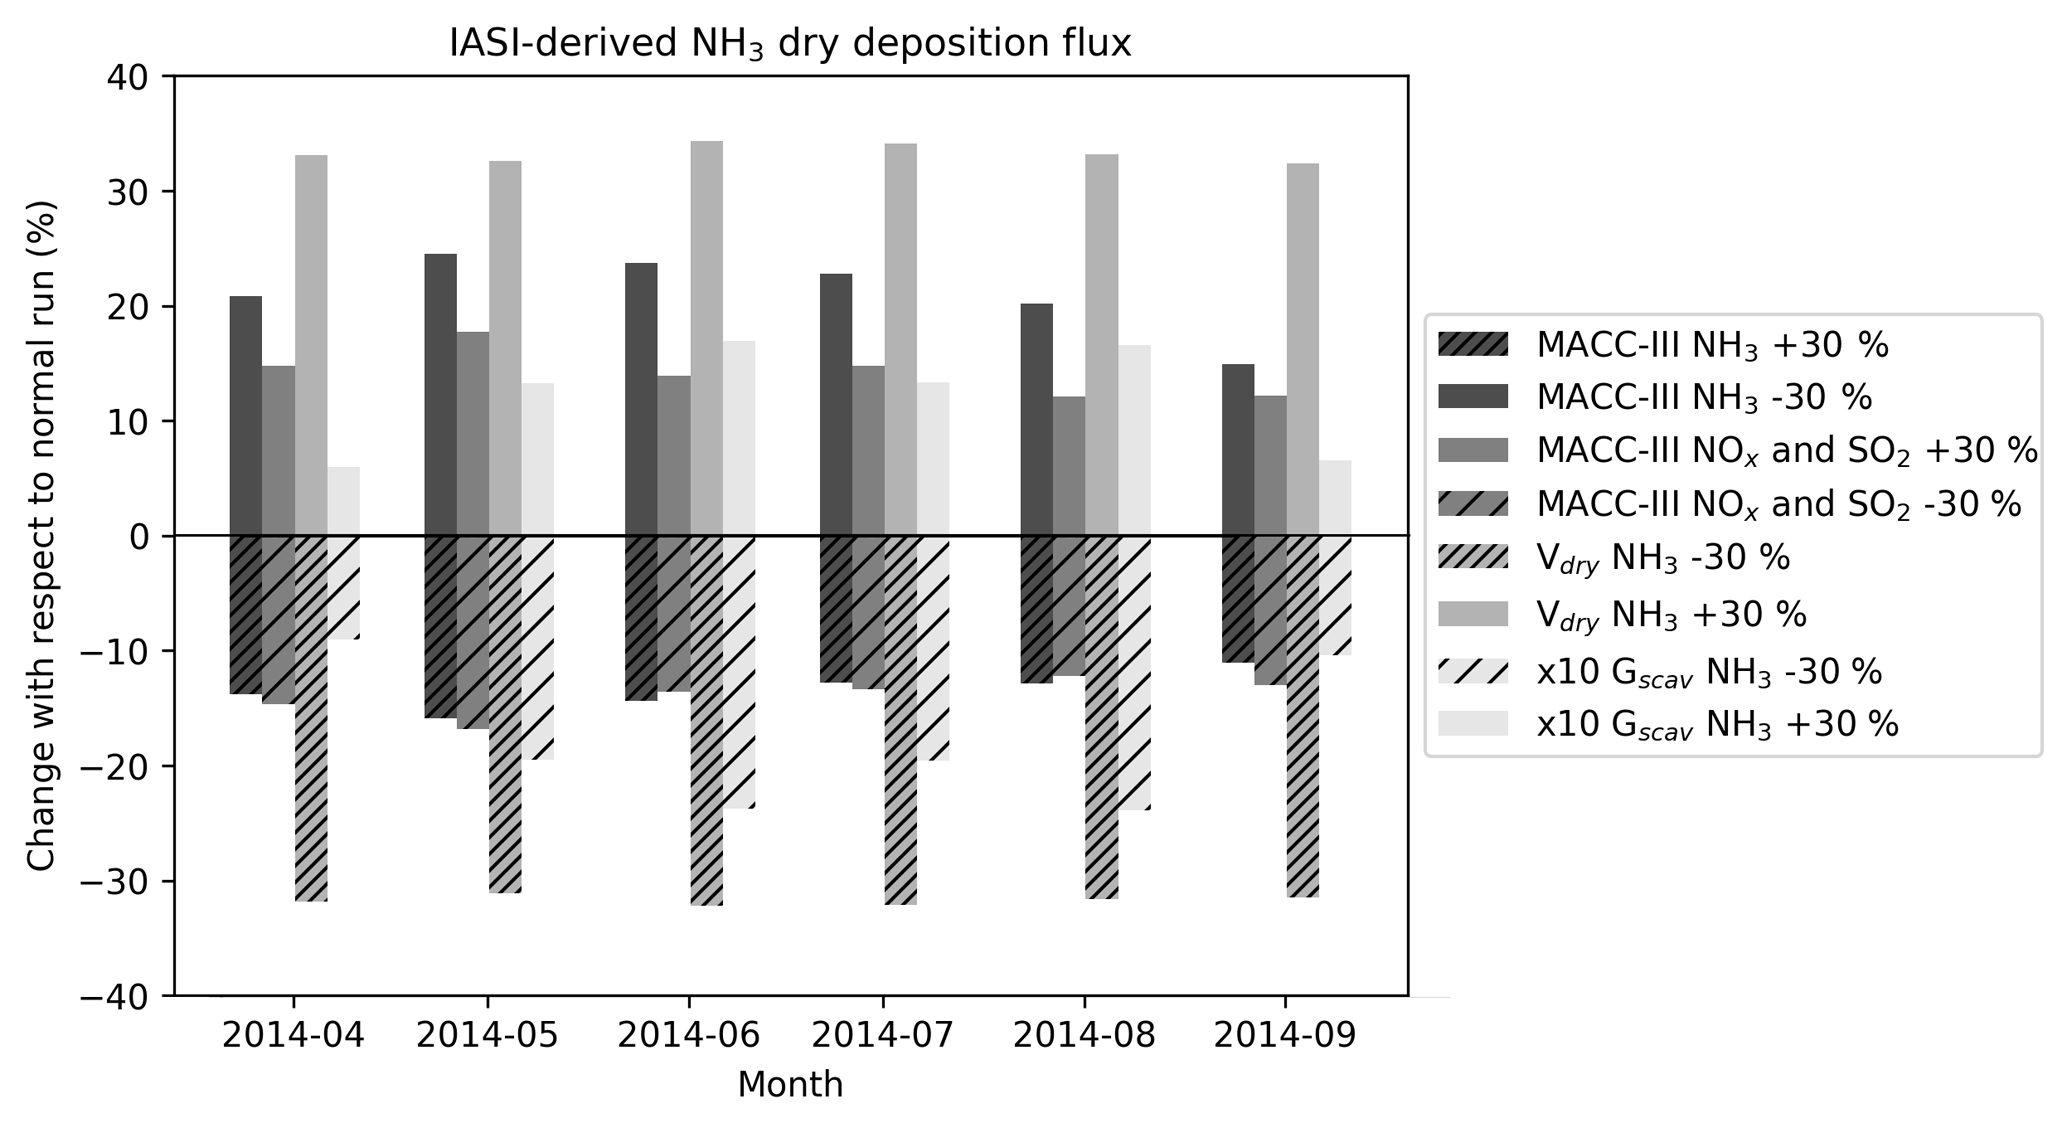
Figure 17The change (%) in the monthly mean IASI-derived NH3 dry deposition flux resulting from different perturbations of the LOTOS-EUROS model.
Figure 15 depicts the absolute and relative differences between the modelled and IASI-derived fluxes. In 2013, the main differences occurred in the central and northernmost parts of the Netherlands, where the IASI-derived fluxes were clearly higher than the modelled ones. Furthermore, the IASI-derived fluxes were higher than the modelled fluxes for the largest part of the Netherlands. In 2014, the IASI-derived fluxes were lower than the modelled fluxes for the largest part of the Netherlands, except for the centre and the northernmost part.

Figure 18The relative standard deviation (%) of the warm season mean output of all perturbed runs and the associated dry deposition estimate inferred from IASI in 2014. Panel (a) shows the LOTOS-EUROS NH3 total column concentration at overpass time, (b) the LOTOS-EUROS NH3 surface concentration, (c) the NH3 dry deposition flux in LOTOS-EUROS and (d) the resulting IASI-derived NH3 dry deposition flux.
4.2.3 Interannual differences
The interannual variations of the modelled and IASI-derived flux differences (see Figs. 13 and 15) could be related to different meteorological conditions. The annual global climate reports from the National Oceanic and Atmosphere Administration (NOAA) show that the mean temperatures in Europe were higher in 2014 than in 2013, especially in western Europe. This might have had an effect on the actual emissions and their variability, which is only limited taken into account by the model. The annual precipitation in both years was near average for Europe as a whole. However, if we zoom in to a more regional scale, we see that it was much wetter than average during the warm season in nearly all parts of the Balkan peninsula and Turkey (NOAA, 2014, 2015). Figure 13 shows that the largest interannual variations on a European scale occur around the Black Sea: in Ukraine but also in the eastern parts of the Balkan peninsula and Turkey. Some of these regions thus coincide with regions that experienced heavy rainfall in 2014 and might have affected emission and deposition processes which are not taken into account by the model. This suggests that meteorological effects might indeed influence our results. However, the examined period of two warm seasons only is too short to draw a conclusion.
4.3 LOTOS-EUROS sensitivity study
The results of the sensitivity runs are summarized in Figs. 16, 17 and 18. Figure 16 shows the relative changes in the warm season mean terrestrial dry NH3 deposition flux over Europe modelled in LOTOS-EUROS (Fig. 16a) and derived from IASI (Fig. 16b) in 2014 for different model runs. The mean LOTOS-EUROS dry NH3 deposition over the land cells in the modelling grid in 2014 was 1.76 kg N ha−1 yr−1. The mean IASI-derived dry NH3 deposition flux was somewhat higher, namely 2.20 kg N ha−2 yr−1.
Variations in the MACC-III NH3 emissions caused the largest changes in the modelled flux. The smallest change was obtained by variation of the wet deposition scavenging coefficient Gscav. The variations in the dry deposition velocity Vd led to the biggest changes in the IASI-derived flux. The effect appears to be amplified compared to the effect on the modelled flux. The effect of the MACC-III NH3 emissions is damped. On the other hand, the effect of the MACC-III NOx and SO2 emissions is also amplified. The signs of the changes in the IASI-derived flux have flipped because of the changes in MACC-III NH3, MACC-III NOx and SO2 and Gscav. The modelled flux is 1:1 sensitive to emission changes in NH3, whereas for IASI-derived flux this is much lower. The IASI-derived flux, in turn, changes 1:1 with the Vd.
The variations in the modelled flux are a result of daily and monthly variations in emissions. The variations in the IASI-derived flux are also a result of these variations, but on top of this they also include an effect of the overpass time of the satellite.
Figure 17 shows the changes (%) of monthly mean IASI-derived fluxes in 2014 resulting from the different LOTOS-EUROS sensitivity runs. Note that the effect of the runs with changes in wet deposition through variations of the gas scavenging coefficient for NH3 is enlarged by a factor of 10. We see that the changes with respect to the standard LOTOS-EUROS run are in general constant over the months. The least variation is observed for the runs with changed Vdry values, that all resulted in a change of ∼31 % per month. The runs with adjusted MACC-III emissions of NH3 and emissions of NOx and SO2 led to largest changes in May and the smallest changes in September. The maximum differences between months are 9.5 % and 5.6 %, respectively, for the runs with adjusted NH3 and the runs with adjusted NOx and SO2 values. The runs with changed values of Gscav for NH3 seem to be affected most by changing weather conditions, which resulted in the relatively largest variation per month. However, because the changes in the IASI-derived flux are small (−2.4 % to +1.7 %), we now continue to look at yearly changes.
Figure 18 shows the relative standard deviation (%) of all eight sensitivity runs for Europe. Figure 18d shows the relative standard deviation of the final IASI-derived flux. The relative standard deviation varies from ∼20 % to ∼50 % throughout Europe. The smallest variations can be seen in the southwestern and central parts of Europe. The highest variations, of ∼40 %–50 %, are mainly found in long-distance transport areas with low NH3 concentrations and deposition fluxes, such as Scandinavia, and in areas with high aerosol precursor emissions, such as the Balkans.
In this paper, we examined the applicability and the limitations of the method suggested by Nowlan et al. (2014) for the derivation of NH3 surface concentrations and dry deposition fluxes across Europe. A comparison of the LOTOS-EUROS modelled and IASI-derived NH3 surface concentrations with in situ measurements of the EMEP network on a European scale and the LML and MAN networks in the Netherlands has been made. Although there appeared to be some improvements in the IASI-derived NH3 surface concentrations compared to the modelled LOTOS-EUROS NH3 surface concentrations, mainly in background regions, there did not seem to be any significant, consistent improvement. In addition, the timing of the IASI-derived NH3 surface concentrations did not show better correspondence with the in situ observations than the modelled NH3 surface concentrations. Consequently, as the dry NH3 deposition fluxes are directly derived from the NH3 surface concentrations, no significant improvement is expected here either. On top of this, the sensitivity study using eight input parameters important for NH3 dry deposition modelling showed that the effect of model uncertainties on the IASI-derived dry NH3 deposition fluxes is amplified by the estimation procedure compared to the effect on the model simulations itself. The final IASI-derived dry NH3 deposition fluxes can vary ∼20 % up to ∼50 % throughout Europe as a result of model uncertainties.
The method used to derive the NH3 surface concentrations and dry deposition fluxes from IASI observations is based on various assumptions. For one, the method assumes that the relationship between the NH3 concentration and the dry deposition flux is linear, whereas this relationship is in reality non-linear. In fact, these quantities can even be anti-correlated with highest surface concentrations during the night when the atmosphere is stable and the exchange is limited. The compensation point of NH3 further enhances the non-linearity. For our purpose, we focus on a single time of the day using monthly data; however, approximating this concentration–flux relationship by a linear curve may seem reasonable for concentration regimes below the saturation point. For higher NH3 surface concentrations the current approach will likely lead to overestimated dry deposition fluxes. Moreover, this study includes the impact of the compensation point of NH3 through the dry deposition scheme in LOTOS-EUROS. Although the uncertainties are relatively large as the used compensation points are based on relatively few observations (e.g. Wichink Kruit et al., 2007), we feel that the inclusion of the compensation point is a strong point of this study.
Moreover, the approach by Nowlan also assumes that the NH3 total column concentrations measured by IASI serve as a direct proxy of the NH3 surface concentrations. In reality, however, the relationship between the two is influenced by various different factors, including the vertical distribution of NH3 and the satellite's sensitivity. There are already quite some uncertainties involved with the vertical distribution of NH3, and therefore tower measurement campaigns (Dammers et al., 2017a; Li et al., 2017a) are very important to strengthen our understanding. Dammers et al. (2017a), for instance, showed that the daytime boundary layer is well mixed, which supports the choice of a model that uses the mixed layer approach such as LOTOS-EUROS. Li et al. (2017b) showed that there is a clear seasonal variation in the vertical distribution of NH3 and that the slope of the NH3 concentration gradient varies throughout the year. During winter, Li et al. (2017b) observed relatively high NH3 ground concentrations due to potential trapping of NH3 emissions in a shallow winter boundary layer and reduced NH3 concentrations higher up the column. In these types of situations, the IASI satellite instrument potentially misses high NH3 ground concentrations because of the lack of sensitivity to the lower parts of the boundary layer. The computation of averaging kernels for IASI could help to indicate more precisely where the sensitivity lies and how the measured total columns are distributed. Moreover, further development and validation of the IASI retrieval may help to improve our understanding of the satellite's product, therewith also increasing its applicability.
The method also assumes that the timing and distribution of the emissions in the LOTOS-EUROS model closely represent reality, as the ratio between the retrieved and the modelled ammonia burden is used at overpass time. The accuracy of the seasonal variation in the NH3 emissions in LOTOS-EUROS is therefore of great importance. The reliability of yearly dry NH3 deposition estimates using our method is limited by the lack of high-quality IASI observations during the cold season. As a result, derivation of yearly IASI-derived NH3 dry deposition estimates may differ substantially depending on whether or not the spring maximum peak occurs in the satellite-observed months (April–September). Skjøth et al. (2011) presented the seasonal variation and the distribution of NH3 emissions for different European countries per agricultural source. They showed, for instance, that approximately half of the NH3 emissions from spring fertilization are usually emitted in March. As the spring fertilization amounts to ∼20 %–50 % of the yearly total NH3 emissions, this may result in a variation of the same magnitude on the subsequent deposition estimates. Improvement of the seasonal variation in NH3 emissions in LOTOS-EUROS could be used to fill in this gap and lead to a more accurate representation of reality. Skjøth et al. (2011) showed that the implementation of a dynamic NH3 emission model for different agricultural sources may result in considerable model performance improvements when high-quality activity data and information on spatial distributions of emissions are available. Furthermore, Hendriks et al. (2016) showed that the use of manure transport data for NH3 emission time profiles leads to additional model improvements and a better representation of the spring maximum.
Moreover, mismatches between the actual and modelled diurnal variations in NH3 emission could also easily lead to large differences in the IASI-derived dry NH3 deposition estimates. As an illustration, Sintermann et al. (2016), for instance, measured NH3 emissions from an agricultural surface after slurry application and showed that ∼80 % of the total NH3 was emitted within 2 h. Combined with the short lifetime of NH3, there is a possibility that the IASI instrument completely misses these kinds of events if they occur after its overpass. A possible way to reduce the impact of the diurnal variation is to combine information from IASI with other satellites that have different overpass times. NH3 observations from the CrIS satellite instrument could, for instance, be used (Shephard and Cady-Pereira, 2015).
At this stage, we can conclude that the IASI-derived NH3 deposition fluxes do not show strong improvements compared to modelled NH3 deposition fluxes and there is a future need for better, more robust, methods to derive NH3 dry deposition fluxes. This could potentially be achieved by further integration of existing in situ and satellite data into models with special attention to data representativeness, for instance, by means of data assimilation. In addition, there is a need for a better understanding of the surface exchange of NH3 for different land use types. Model parameterizations of the surface exchange of NH3 are now based on a limited number of direct flux measurements, and more measurements could definitely improve this. Also, a better understanding of the timing and distribution of NH3 emissions could lead to considerable improvements in modelled emission fields and consequently deposition fields from CTMs.
The observational data used in this study are available online. For measurement data from the EMEP, visit http://ebas.nilu.no/ (last access: 10 January 2018). The MAN measurements can be requested and downloaded at https://man.rivm.nl/ (last access: 10 January 2018). The LML measurements can be downloaded at https://www.luchtmeetnet.nl/ (last access: 10 January 2018). The IASI-NH3 data can be downloaded at https://iasi.aeris-data.fr/nh3/ (last access: 10 January 2018). The source code of the LOTOS-EUROS model can be found at https://lotos-euros.tno.nl/ (last access: 1 July 2018).
JWE and ED had the initial ideas to start this study. SCvdG performed the model simulations and data analysis. ED contributed to the processing of the IASI satellite data. MS provided guidance with the model simulations. All co-authors contributed to the interpretation of the results. SCvdG wrote the paper with contributions from all co-authors.
The authors declare that they have no conflict of interest.
The authors would like to thank the “Centre National d'Etudes Spatiales”
(CNES, France) for building and developing IASI and for sharing their
products. The MetOp satellites are part of the EUMETSAT Polar System. We
acknowledge the Aeris website (https://iasi.aeris-data.fr/nh3/, last access: 10 January 2018)
for providing access to the IASI-NH3 dataset. Moreover, we would like
to thank RIVM and EMEP for maintaining, collecting and sharing data
from their NH3 ground networks.
Edited by: Thomas Wagner
Reviewed by: two anonymous referees
Behera, S. N., Sharma, M., Aneja, V. P., and Balasubramanian, R.: Ammonia in the atmosphere: a review on emission sources, atmospheric chemistry and deposition on terrestrial bodies, Environ. Sci. Pollut. Res. Int., 20, 8092–8131, https://doi.org/10.1007/s11356-013-2051-9, 2013.
Bessagnet, B., Pirovano, G., Mircea, M., Cuvelier, C., Aulinger, A., Calori, G., Ciarelli, G., Manders, A., Stern, R., Tsyro, S., García Vivanco, M., Thunis, P., Pay, M.-T., Colette, A., Couvidat, F., Meleux, F., Rouïl, L., Ung, A., Aksoyoglu, S., Baldasano, J. M., Bieser, J., Briganti, G., Cappelletti, A., D'Isidoro, M., Finardi, S., Kranenburg, R., Silibello, C., Carnevale, C., Aas, W., Dupont, J.-C., Fagerli, H., Gonzalez, L., Menut, L., Prévôt, A. S. H., Roberts, P., and White, L.: Presentation of the EURODELTA III intercomparison exercise – evaluation of the chemistry transport models' performance on criteria pollutants and joint analysis with meteorology, Atmos. Chem. Phys., 16, 12667–12701, https://doi.org/10.5194/acp-16-12667-2016, 2016.
Blank, F. T.: Meetonzekerheid Landelijk Meetnet Luchtkwaliteit (LML), KEMA, 50050870-KPS/TCM 01-3063, 2001.
Clerbaux, C., Boynard, A., Clarisse, L., George, M., Hadji-Lazaro, J., Herbin, H., Hurtmans, D., Pommier, M., Razavi, A., Turquety, S., Wespes, C., and Coheur, P.-F.: Monitoring of atmospheric composition using the thermal infrared IASI/MetOp sounder, Atmos. Chem. Phys., 9, 6041–6054, https://doi.org/10.5194/acp-9-6041-2009, 2009.
Colette, A., Andersson, C., Manders, A., Mar, K., Mircea, M., Pay, M.-T., Raffort, V., Tsyro, S., Cuvelier, C., Adani, M., Bessagnet, B., Bergström, R., Briganti, G., Butler, T., Cappelletti, A., Couvidat, F., D'Isidoro, M., Doumbia, T., Fagerli, H., Granier, C., Heyes, C., Klimont, Z., Ojha, N., Otero, N., Schaap, M., Sindelarova, K., Stegehuis, A. I., Roustan, Y., Vautard, R., van Meijgaard, E., Vivanco, M. G., and Wind, P.: EURODELTA-Trends, a multi-model experiment of air quality hindcast in Europe over 1990–2010, Geosci. Model Dev., 10, 3255–3276, https://doi.org/10.5194/gmd-10-3255-2017, 2017.
Dammers, E., Palm, M., Van Damme, M., Vigouroux, C., Smale, D., Conway, S., Toon, G. C., Jones, N., Nussbaumer, E., Warneke, T., Petri, C., Clarisse, L., Clerbaux, C., Hermans, C., Lutsch, E., Strong, K., Hannigan, J. W., Nakajima, H., Morino, I., Herrera, B., Stremme, W., Grutter, M., Schaap, M., Wichink Kruit, R. J., Notholt, J., Coheur, P.-F., and Erisman, J. W.: An evaluation of IASI-NH3 with ground-based Fourier transform infrared spectroscopy measurements, Atmos. Chem. Phys., 16, 10351–10368, https://doi.org/10.5194/acp-16-10351-2016, 2016.
Dammers, E., Schaap, M., Haaima, M., Palm, M., Kruit, R. J. W., Volten, H., Hensen, A., Swart, D., and Erisman, J. W.: Measuring atmospheric ammonia with remote sensing campaign: Part 1-Characterisation of vertical ammonia concentration profile in the centre of The Netherlands, Atmos. Environ., 169, 97–112, https://doi.org/10.1016/j.atmosenv.2017.08.067, 2017a.
Dammers, E., Shephard, M. W., Palm, M., Cady-Pereira, K., Capps, S., Lutsch, E., Strong, K., Hannigan, J. W., Ortega, I., Toon, G. C., Stremme, W., Grutter, M., Jones, N., Smale, D., Siemons, J., Hrpcek, K., Tremblay, D., Schaap, M., Notholt, J., and Erisman, J. W.: Validation of the CrIS fast physical NH3 retrieval with ground-based FTIR, Atmos. Meas. Tech., 10, 2645–2667, https://doi.org/10.5194/amt-10-2645-2017, 2017b.
Denier van der Gon, H. A. C., Hendriks, C., Kuenen, J., Segers, A., and Visschedijk, A.: Description of current temporal emission patterns and sensitivity of predicted AQ for temporal emission patterns, TNO Report, 2011.
Dentener, F., Drevet, J., Lamarque, J. F., Bey, I., Eickhout, B., Fiore, A. M., Hauglustaine, D., Horowitz, L. W., Krol, M., Kulshrestha, U. C., Lawrence, M., Galy-Lacaux, C., Rast, S., Shindell, D., Stevenson, D., Van Noije, T., Atherton, C., Bell, N., Bergman, D., Butler, T., Cofala, J., Collins, B., Doherty, R., Ellingsen, K., Galloway, J., Gauss, M., Montanaro, V., Muller, J. F., Pitari, G., Rodriguez, J., Sanderson, M., Solmon, F., Strahan, S., Schultz, M., Sudo, K., Szopa, S., and Wild, O.: Nitrogen and sulfur deposition on regional and global scales: A multimodel evaluation, Global Biogeochem. Cy., 20, Gb4003, https://doi.org/10.1029/2005gb002672, 2006a.
Dentener, F., Stevenson, D., Ellingsen, K., van Noije, T., Schultz, M., Amann, M., Atherton, C., Bell, N., Bergmann, D., Bey, I., Bouwman, L., Butler, T., Cofala, J., Collins, B., Drevet, J., Doherty, R., Eickhout, B., Eskes, H., Fiore, A., Gauss, M., Hauglustaine, D., Horowitz, L., Isaksen, I. S. A., Josse, B., Lawrence, M., Krol, M., Lamarque, J. F., Montanaro, V., Muller, J. F., Peuch, V. H., Pitari, G., Pyle, J., Rast, S., Rodriguez, J., Sanderson, M., Savage, N. H., Shindell, D., Strahan, S., Szopa, S., Sudo, K., Van Dingenen, R., Wild, O., and Zeng, G.: The global atmospheric environment for the next generation, Environ. Sci. Technol., 40, 3586–3594, https://doi.org/10.1021/es0523845, 2006b.
ECMWF: European Centre for Medium-Range Weather Forecasts Annual report, 2016.
EEA: European Union emission inventory report 1990–2014 under the UNECE Convention on Long-range Transboundary Air Pollution (LRTAP), EEA Report, 16, https://doi.org/10.2800/628267, 2016.
EMEP: The European Monitoring and Evaluation Programme EMEP Status Report, 2016.
Erisman, J. W.: Acid deposition to nature areas in the Netherlands: Part I Methods and results, Water Air Soil. Poll., 71, 51–80, 1993.
Erisman, J. W. and Draaijers, G. P. J.: Atmospheric deposition in relation to acidification and eutrophication, Elsevier, 1995.
Erisman, J. W., Sutton, M. A., Galloway, J., Klimont, Z., and Winiwarter, W.: How a century of ammonia synthesis changed the world, Nat. Geosci., 1, 636–639, https://doi.org/10.1038/ngeo325, 2008.
Erisman, J. W., Galloway, J., Dice, N. B., Sutton, M., Bleeker, A., Grizzetti, B., Leach, A., and de Vries, W.: Nitrogen: too much of a vital resource, Science Brief, WWF Netherlands, Zeist, The Netherlands, 2015.
Flechard, C. R., Nemitz, E., Smith, R. I., Fowler, D., Vermeulen, A. T., Bleeker, A., Erisman, J. W., Simpson, D., Zhang, L., Tang, Y. S., and Sutton, M. A.: Dry deposition of reactive nitrogen to European ecosystems: a comparison of inferential models across the NitroEurope network, Atmos. Chem. Phys., 11, 2703–2728, https://doi.org/10.5194/acp-11-2703-2011, 2011.
Fowler, D., Coyle, M., Skiba, U., Sutton, M. A., Cape, J. N., Reis, S., Sheppard, L. J., Jenkins, A., Grizzetti, B., Galloway, J. N., Vitousek, P., Leach, A., Bouwman, A. F., Butterbach-Bahl, K., Dentener, F., Stevenson, D., Amann, M., and Voss, M.: The global nitrogen cycle in the twenty-first century, Philos. T. Roy. Soc. B, 368, 20130164, https://doi.org/10.1098/rstb.2013.0164, 2013.
Galloway, J. N., Aber, J. D., Erisman, J. W., Seitzinger, S. P., Howarth, R. W., Cowling, E. B., and Cosby, B. J.: The nitrogen cascade, Bioscience, 53, 341–356, https://doi.org/10.1641/0006-3568(2003)053[0341:Tnc]2.0.Co;2, 2003.
Hendriks, C., Kranenburg, R., Kuenen, J. J. P., Van den Bril, B., Verguts, V., and Schaap, M.: Ammonia emission time profiles based on manure transport data improve ammonia modelling across north western Europe, Atmos. Environ., 131, 83–96, https://doi.org/10.1016/j.atmosenv.2016.01.043, 2016.
Kharol, S. K., Shephard, M. W., McLinden, C. A., Zang, L., Sioris, C. E., O'Brien, J. M., Vet, R., Cady-Pereira, K. E., Hare, E., Siemons, J., and Krotkov, N. A.: Dry deposition of reactive nitrogen from satellite observations of ammonia and nitrogen dioxide over North America, Geophys. Res. Lett., 45, 1157–1166, https://doi.org/10.1002/2017GL075832, 2017.
Kuenen, J. J. P., Visschedijk, A. J. H., Jozwicka, M., and Denier van der Gon, H. A. C.: TNO-MACC_II emission inventory; a multi-year (2003–2009) consistent high-resolution European emission inventory for air quality modelling, Atmos. Chem. Phys., 14, 10963–10976, https://doi.org/10.5194/acp-14-10963-2014, 2014.
Li, Y., Thompson, T. M., Van Damme, M., Chen, X., Benedict, K. B., Shao, Y., Day, D., Boris, A., Sullivan, A. P., Ham, J., Whitburn, S., Clarisse, L., Coheur, P.-F., and Collett Jr., J. L.: Temporal and spatial variability of ammonia in urban and agricultural regions of northern Colorado, United States, Atmos. Chem. Phys., 17, 6197–6213, https://doi.org/10.5194/acp-17-6197-2017, 2017a.
Li, Y., Thompson, T. M., Van Damme, M., Chen, X., Benedict, K. B., Shao, Y., Day, D., Boris, A., Sullivan, A. P., Ham, J., Whitburn, S., Clarisse, L., Coheur, P.-F., and Collett Jr., J. L.: Temporal and spatial variability of ammonia in urban and agricultural regions of northern Colorado, United States, Atmos. Chem. Phys., 17, 6197–6213, https://doi.org/10.5194/acp-17-6197-2017, 2017b.
Lolkema, D. E., Noordijk, H., Stolk, A. P., Hoogerbrugge, R., van Zanten, M. C., and van Pul, W. A. J.: The Measuring Ammonia in Nature (MAN) network in the Netherlands, Biogeosciences, 12, 5133–5142, https://doi.org/10.5194/bg-12-5133-2015, 2015.
Manders, A. M. M., Builtjes, P. J. H., Curier, L., Denier van der Gon, H. A. C., Hendriks, C., Jonkers, S., Kranenburg, R., Kuenen, J. J. P., Segers, A. J., Timmermans, R. M. A., Visschedijk, A. J. H., Wichink Kruit, R. J., van Pul, W. A. J., Sauter, F. J., van der Swaluw, E., Swart, D. P. J., Douros, J., Eskes, H., van Meijgaard, E., van Ulft, B., van Velthoven, P., Banzhaf, S., Mues, A. C., Stern, R., Fu, G., Lu, S., Heemink, A., van Velzen, N., and Schaap, M.: Curriculum vitae of the LOTOS-EUROS (v2.0) chemistry transport model, Geosci. Model Dev., 10, 4145–4173, https://doi.org/10.5194/gmd-10-4145-2017, 2017.
Rijksinstituut voor Volksgezondheid en Milieu: Landelijk Meetnet Luchtkwaliteit, available at: http://www.lml.rivm.nl/, last access: 15 November 2017.
NOAA (National Oceanic and Atmospheric Administration): State of the Climate: Global Climate Report for Annual 2013, available at: https://www.ncdc.noaa.gov/sotc/global/201313, last access: 1 July 2018.
NOAA (National Oceanic and Atmospheric Administration): State of the Climate: Global Climate Report for Annual 2014, available at: https://www.ncdc.noaa.gov/sotc/global/201413, last access: 1 July 2018.
Nowlan, C. R., Martin, R. V., Philip, S., Lamsal, L. N., Krotkov, N. A., Marais, E. A., Wang, S., and Zhang, Q.: Global dry deposition of nitrogen dioxide and sulfur dioxide inferred from space-based measurements, Global Biogeochem. Cy., 28, 1025–1043, https://doi.org/10.1002/2014gb004805, 2014.
Reis, S., Pinder, R. W., Zhang, M., Lijie, G., and Sutton, M. A.: Reactive nitrogen in atmospheric emission inventories, Atmos. Chem. Phys., 9, 7657–7677, https://doi.org/10.5194/acp-9-7657-2009, 2009.
Schaap, M., Manders, A., Hendricks, J. M., Cnossen, A. J. S., Segers, H. A. C., Denier van der Gon, M., Jozwicka, M., Sauter, F., Velders, G., Matthijsen, J., and Builtjes, P.: Regional modelling of particulate matter for the Netherlands, Netherlands Research Program on Particulate Matter, 500099008, 2009.
Schrader, F. and Brummer, C.: Land Use Specific Ammonia Deposition Velocities: a Review of Recent Studies (2004–2013), Water Air Soil Poll., 225, 2114, https://doi.org/10.1007/s11270-014-2114-7, 2014.
Shephard, M. W. and Cady-Pereira, K. E.: Cross-track Infrared Sounder (CrIS) satellite observations of tropospheric ammonia, Atmos. Meas. Tech., 8, 1323–1336, https://doi.org/10.5194/amt-8-1323-2015, 2015.
Sintermann, J., Dietrich, K., Häni, C., Bell, M., Jocher, M., and Neftel, A.: A miniDOAS instrument optimised for ammonia field measurements, Atmos. Meas. Tech., 9, 2721–2734, https://doi.org/10.5194/amt-9-2721-2016, 2016.
Skjøth, C. A., Geels, C., Berge, H., Gyldenkærne, S., Fagerli, H., Ellermann, T., Frohn, L. M., Christensen, J., Hansen, K. M., Hansen, K., and Hertel, O.: Spatial and temporal variations in ammonia emissions – a freely accessible model code for Europe, Atmos. Chem. Phys., 11, 5221–5236, https://doi.org/10.5194/acp-11-5221-2011, 2011.
Spindler, G., Teichmann, U., and Sutton, M. A.: Ammonia dry deposition over grassland-micrometeorological flux-gradient measurements and bidirectional flux calculations using an inferential model, Q. J. Roy. Meteor. Soc., 127, 795–814, https://doi.org/10.1002/qj.49712757305, 2001.
Tørseth, K., Aas, W., Breivik, K., Fjæraa, A. M., Fiebig, M., Hjellbrekke, A. G., Lund Myhre, C., Solberg, S., and Yttri, K. E.: Introduction to the European Monitoring and Evaluation Programme (EMEP) and observed atmospheric composition change during 1972–2009, Atmos. Chem. Phys., 12, 5447–5481, https://doi.org/10.5194/acp-12-5447-2012, 2012.
Van Damme, M., Clarisse, L., Heald, C. L., Hurtmans, D., Ngadi, Y., Clerbaux, C., Dolman, A. J., Erisman, J. W., and Coheur, P. F.: Global distributions, time series and error characterization of atmospheric ammonia (NH3) from IASI satellite observations, Atmos. Chem. Phys., 14, 2905–2922, https://doi.org/10.5194/acp-14-2905-2014, 2014a.
Van Damme, M., Kruit, R. J. W., Schaap, M., Clarisse, L., Clerbaux, C., Coheur, P. F., Dammers, E., Dolman, A. J., and Erisman, J. W.: Evaluating 4 years of atmospheric ammonia (NH3) over Europe using IASI satellite observations and LOTOS-EUROS model results, J. Geophys. Res.-Atmos., 119, 9549–9566, https://doi.org/10.1002/2014jd021911, 2014b.
Van Damme, M., Clarisse, L., Dammers, E., Liu, X., Nowak, J. B., Clerbaux, C., Flechard, C. R., Galy- Lacaux, C., Xu, W., Neuman, J. A., Tang, Y. S., Sutton, M. A., Erisman, J. W., and Coheur, P. F.: Towards validation of ammonia (NH3) measurements from the IASI satellite, Atmos. Meas. Tech., 8, 1575–1591, https://doi.org/10.5194/amt-8-1575-2015, 2015.
Van Damme, M., Whitburn, S., Clarisse, L., Clerbaux, C., Hurtmans, D., and Coheur, P.-F.: Version 2 of the IASI NH3 neural network retrieval algorithm: near-real-time and reanalysed datasets, Atmos. Meas. Tech., 10, 4905–4914, https://doi.org/10.5194/amt-10-4905-2017, 2017.
Van der Swaluw, E., De Vries, W., Sauter, F., Aben, J., Velders, G., and Van Pul, A.: High-resolution modelling of air pollution and deposition over the Netherlands with plume, grid and hybrid modelling, Atmos. Environ., 155, 140–153, https://doi.org/10.1016/j.atmosenv.2017.02.009, 2017.
van Zanten, M. C., Sauter, F. J., Wichink Kruit, R. J., van Jaarsveld, J. A., and van Pul, M. A. J.: Description of the DEPAC module: Dry deposition modelling with DEPAC_GCN2010, Rivm Report 680180001/2010, RIVM, Bilthoven, Netherlands, 2010.
van Zanten, M. C., Kruit, R. J. W., Hoogerbrugge, R., Van der Swaluw, E., and van Pul, W. A. J.: Trends in ammonia measurements in the Netherlands over the period 1993–2014, Atmos. Environ., 148, 352–360, https://doi.org/10.1016/j.atmosenv.2016.11.007, 2017.
Vivanco, M. G., Theobald, M. R., García-Gómez, H., Garrido, J. L., Prank, M., Aas, W., Adani, M., Alyuz, U., Andersson, C., Bellasio, R., Bessagnet, B., Bianconi, R., Bieser, J., Brandt, J., Briganti, G., Cappelletti, A., Curci, G., Christensen, J. H., Colette, A., Couvidat, F., Cuvelier, C., D'Isidoro, M., Flemming, J., Fraser, A., Geels, C., Hansen, K. M., Hogrefe, C., Im, U., Jorba, O., Kitwiroon, N., Manders, A., Mircea, M., Otero, N., Pay, M.-T., Pozzoli, L., Solazzo, E., Tsyro, S., Unal, A., Wind, P., and Galmarini, S.: Modeled deposition of nitrogen and sulfur in Europe estimated by 14 air quality model systems: evaluation, effects of changes in emissions and implications for habitat protection, Atmos. Chem. Phys., 18, 10199–10218, https://doi.org/10.5194/acp-18-10199-2018, 2018.
von Bobrutzki, K., Braban, C. F., Famulari, D., Jones, S. K., Blackall, T., Smith, T. E. L., Blom, M., Coe, H., Gallagher, M., Ghalaieny, M., McGillen, M. R., Percival, C. J., Whitehead, J. D., Ellis, R., Murphy, J., Mohacsi, A., Pogany, A., Junninen, H., Rantanen, S., Sutton, M. A., and Nemitz, E.: Field inter-comparison of eleven atmospheric ammonia measurement techniques, Atmos. Meas. Tech., 3, 91–112, https://doi.org/10.5194/amt-3-91-2010, 2010.
Whitburn, S., Van Damme, M., Clarisse, L., Bauduin, S., Heald, C. L., Hadji-Lazaro, J., Hurtmans, D., Zondlo, M. A., Clerbaux, C., and Coheur, P. F.: A flexible and robust neural network IASI-NH3 retrieval algorithm, J. Geophys. Res.-Atmos., 121, 6581–6599, https://doi.org/10.1002/2016jd024828, 2016.
Whitten, G. Z., Hogo, H., and Killus, J. P.: The Carbon-Bond Mechanism – a Condensed Kinetic Mechanism for Photochemical Smog, Environ. Sci. Technol., 14, 690–700, https://doi.org/10.1021/es60166a008, 1980.
Wichink Kruit, R. J.: ECLAIRE model inter-comparison of atmospheric nitrogen deposition and concentrations over Europe, presentation at the ACCENT-Plus Symposium held in September in Urbino, Italy, 2013.
Wichink Kruit, R. J., van Pul, W. A. J., Otjes, R. P., Hofschreuder, P., Jacobs, A. F. G., and Holtslag, A. A. M.: Ammonia fluxes and derived canopy compensation points over non-fertilized agricultural grassland in The Netherlands using the new gradient ammonia – high accuracy – monitor (GRAHAM), Atmos. Environ., 41, 1275–1287, https://doi.org/10.1016/j.atmosenv.2006.09.039, 2007.
Wichink Kruit, R. J., Schaap, M., Sauter, F. J., van Zanten, M. C., and van Pul, W. A. J.: Modeling the distribution of ammonia across Europe including bi-directional surface-atmosphere exchange, Biogeosciences, 9, 5261–5277, https://doi.org/10.5194/bg-9-5261-2012, 2012.
Zöll, U., Brümmer, C., Schrader, F., Ammann, C., Ibrom, A., Flechard, C. R., Nelson, D. D., Zahniser, M., and Kutsch, W. L.: Surface-atmosphere exchange of ammonia over peatland using QCL-based eddy-covariance measurements and inferential modeling, Atmos. Chem. Phys., 16, 11283–11299, https://doi.org/10.5194/acp-16-11283-2016, 2016.