the Creative Commons Attribution 4.0 License.
the Creative Commons Attribution 4.0 License.
 | 06 Sep 2018
Concentration, temporal variation, and sources of black carbon in the Mt. Everest region retrieved by real-time observation and simulation
Xintong Chen
Shichang Kang
Zhiyuan Cong
Junhua Yang
Yaoming Ma
Based on the high-resolution measurement of black carbon (BC) at the Qomolangma (Mt. Everest) Station (QOMS, 28.36∘ N, 86.95∘ E, 4276 m a.s.l.) from 15 May 2015 to 31 May 2017, we investigated the seasonal and diurnal variations in BC and its potential source regions. Both monthly and daily mean BC concentrations reached the highest values in the pre-monsoon season and the lowest values in the monsoon season. The highest monthly and daily mean BC concentrations were at least 1 order of magnitude higher than the lowest concentrations. For the diurnal variation, the BC concentrations remained significantly high from late at night to morning in the pre-monsoon season. Meanwhile, the westerly winds prevailed during this period, implying the potential for pollutants to be transported across the Himalayas from long-distance sources to QOMS along the valley. In the monsoon season, the BC concentrations remained low but peaked in the morning and at noon, which might be caused by local emissions from cooking. By analyzing the simulation results from the backward trajectories of air masses and the fire spot distribution from the MODIS data, we found that the seasonal cycle of BC was significantly influenced by the atmospheric circulation and combustion intensity in the Mt. Everest region. The transport mechanisms of BC were further revealed using a WRF-Chem simulation during severe pollution episodes. For the pollution event in the monsoon season, BC aerosols in southern Asia were uplifted and transported to the Mt. Everest region by the southerly winds in the upper atmosphere. However, for the events in the pre-monsoon season, BC from northern India was transported and concentrated on the southern slope of the Himalayas by the northwesterly winds in the lower atmosphere and then transported across the Himalayas by the mountain-valley wind. A relatively smaller amount of BC from northwestern India and central Asia was transported to the Mt. Everest region by the westerly winds in the upper atmosphere.
- Article
(9218 KB) -
Supplement
(995 KB) - BibTeX
- EndNote


Black carbon (BC), resulting mainly from the incomplete combustion of fossil fuels or biomass, has received much attention due to its influences on the environment and human health (Bond, 2004; Ramanathan et al., 2005; Anenberg et al., 2012). In addition to greenhouse gases, it is seen as an important factor that may lead to global warming (Hansen et al., 2000; Jacobson, 2002; Bond et al., 2013; Ramanathan and Carmichael, 2008). BC can substantially absorb solar radiation and causes atmospheric heating (Jacobson, 2001; Ramanathan et al., 2005; Ji et al., 2015). Moreover, BC can be suspended as fine particles in the atmosphere for approximately one week, transported far away from its emission sources, and then removed by dry and wet deposition (Oshima et al., 2012; Cooke et al., 2002; Jurado et al., 2008). When BC is deposited on snow and ice, it can significantly reduce the surface albedo (Flanner et al., 2007; He et al., 2017) and accelerate the melting of glaciers and snow cover, impacting the regional climate, hydrology, and water resources (Li et al., 2018; Ming et al., 2008; Ramanathan and Carmichael, 2008).
The Tibetan Plateau (TP), containing the region generally known as the “Third Pole”, is the highest plateau with a large number of glaciers and snow cover (Kang et al., 2010; Lu et al., 2010; Yao et al., 2012). Even though the TP is a remote region that is generally unaffected by anthropogenic activities, previous observations have indicated that BC is an important contributor to the rapid shrinking of glaciers over the TP due to its decreasing of the surface albedo and atmospheric warming (Xu et al., 2009; Yang et al., 2015; X. Li et al., 2017; Y. Zhang et al., 2017; Qu et al., 2014; Ji, 2016; Xu et al., 2016; Lee et al., 2017). Moreover, previous studies have also suggested that the emissions from southern Asia and eastern Asia are the major sources of BC on the TP (Li et al., 2016a; Lu et al., 2012; He et al., 2014b; Zhang et al., 2015; Yang et al., 2018), and the high emissions from southern Asia can be transported across the Himalayas and farther onwards to the inland TP (Lüthi et al., 2015; Xu et al., 2014; Cong et al., 2015a; Kang et al., 2016; Wan et al., 2015). Meanwhile, the seasonality of BC aerosols is closely related to the atmospheric circulation that helps to bring the BC aerosols across the Himalayas (Cong et al., 2015a, b; Yang et al., 2018). Additionally, a large number of studies have demonstrated that the BC and dust from central Asia and northern Africa could also be transported to the TP (Wang et al., 2016; Lu et al., 2012; Zhao et al., 2012; Wu et al., 2010; Zhang et al., 2015).
Mt. Everest could be regarded as a very sensitive area under the influence of BC aerosols. Previous research on atmospheric BC in the Mt. Everest region was mainly based on the thermal–optical analytical method, which uses quartz filter samples (Cong et al., 2015a). However, there is still a lack of investigations of the diurnal and seasonal variations in BC in this region. Therefore, to fill such gaps and understand the variations in and sources of BC in this pristine region, there is a need for an efficient approach and additional studies. The Aethalometer can provide real-time high-resolution observation data on the BC concentration, which are very important and necessary for an improved depiction of the characteristics of BC and its effects on the environmental change.
In comparison with the observations, numerical models can better represent the atmospheric physical and chemical processes. Many studies have used global climate models (GCMs) and chemical transport models (CTMs) to investigate the origin and transportation of BC over the TP (Lu et al., 2012; Zhang et al., 2015; Menon et al., 2010; Kopacz et al., 2011; He et al., 2014a). However, due to the coarse resolution, it is difficult for the CTMs and GCMs to capture the surface details of the TP (Ji et al., 2015; Gao et al., 2008). Regional climate models (RCMs) can compensate for the shortcomings of coarser global model grids by enabling high-resolution simulations. In recent decades, RCMs have been developed to include multiple modules and atmospheric chemistry processes. In addition, the advanced regional climate-chemistry model, the Weather Research and Forecasting (WRF) model (Skamarock et al., 2005), coupled with chemistry and referred to as WRF-Chem, was successfully applied to air quality research on the TP (Yang et al., 2017, 2018).
Here, we present real-time data of the BC concentration measured by the new Aethalometer model AE-33 from 15 May 2015 to 31 May 2017. The observed results are used to characterize the temporal variation and provide important information on the possible sources and transport mechanisms of BC. By combining high-resolution measurements of the BC concentration with the WRF-Chem model, we investigated the concentration level, temporal variation, and sources of BC in the Mt. Everest region. The purpose of this study is to understand the impact of transboundary atmospheric BC on the Mt. Everest region and depict the transport pathways of BC at different spatiotemporal scales.

Figure 1Distribution of BC concentrations over the TP based on the observed values at QOMS in this study (black circle) and from previous studies (red circles), i.e., at QOMS (Cong et al., 2015a), Nam Co (Wan et al., 2015), Lhasa (Li et al., 2016b), Ranwu (Wang et al., 2016), Qilian Shan (Zhao et al., 2012), Beiluhe (Wang et al., 2016), Qinghai Lake (Li et al., 2013), Muztagh Ata (Cao et al., 2009), Manora Peak, India (Ram et al., 2010), and NCO-P, Nepal (Marinoni et al., 2010).
2.1 Sampling site and meteorological conditions
Mt. Everest (27.98∘ N, 86.92∘ E, 8844 m a.s.l.), known as the summit of the world, is located in the central Himalayas. The southern slope of Mt. Everest is adjacent to the Indian continent, and the climate is warm and humid under the influence of the Indian summer monsoon. Conversely, the northern side is cold and dry since the warm and humid airflow cannot reach it. The Qomolangma (Mt. Everest) Station for Atmospheric and Environmental Observation and Research, Chinese Academy of Sciences (QOMS, 28.36∘ N, 86.95∘ E, 4276 m a.s.l.) (Fig. 1) is located on the northern slope of Mt. Everest, which was established for the continuous monitoring of the atmospheric environment (Cong et al., 2015a; Ma et al., 2011).
The meteorological parameters, i.e., air temperature, air pressure, humidity, wind speeds and wind directions, were recorded by an automatic weather station at QOMS in 10 min time intervals. Meanwhile, the precipitation data were collected by artificial measurements, as shown in Fig. S1 in the Supplement. The entire year was divided into four seasons according to the Indian monsoon transition characteristics, which includes pre-monsoon (March to May), monsoon (June to September), post-monsoon (October to November), and winter (December to February) (Praveen et al., 2012; X. Zhang et al., 2017). A clear seasonal cycle of temperature and humidity can be observed in Fig. S1. Specifically, the temperature was high during the monsoon season and low during winter, with a maximum in July and a minimum in January. Humidity followed a similar trend, with high values recorded from late July to early August and low values from December to February. During the observation period, the wind speed increased significantly from November to April. The wind direction at QOMS is affected by the local topography, which consists of a series of small valleys. During the pre-monsoon season (dry period), the westerly and southerly winds begin to develop and play an important role in atmospheric pollution circulation. However, during the monsoon season, the southwesterly winds prevail and bring much moisture from the Indian Ocean to the Mt. Everest region, increasing the humidity and precipitation. With the retreat of the monsoon, the southwesterly winds decrease and the prevailing wind direction changes to westerly and northeasterly in winter, containing limited moisture (Fig. S1).
2.2 BC measurements
There are several available methods capable of measuring BC concentrations, and these methods can be classified into three categories. The first is the thermal–optical method, which uses a quartz filter to collect aerosols and thermally volatilizes aerosols in several temperature steps (Schauer et al., 2003). The signals of evolving carbon measured by thermal–optical transmission (TOT) or thermal–optical reflectance (TOR) can be converted to the concentration of BC (Chow et al., 1993, 2001). However, the time difference between sampling and detection, the impact of mineral dust, and the determination of the split between organic carbon (OC) and elemental carbon (EC, which is similar to BC) can cause deviations (C. Li et al., 2017; Schauer et al., 2003). The second category is the technique of the single particle soot photometer (SP2), which can quantify BC by laser-induced incandescence because BC is the predominant refractory absorbing aerosol that can be heated by an intense laser beam and emit significant thermal radiation (Stephens et al., 2003). This method measures the mass of BC in individual particles, but the accuracy depends on the selected calibration material (Schwarz et al., 2010; Laborde et al., 2012). Finally, the optical method measures the reduction in light intensity induced by BC aerosols collected on the sampling medium (Hansen et al., 1984; Petzold and Schonlinner, 2004). The Aethalometer is a widely used instrument based on the optical method that can provide real-time BC concentration measurements, but all filter-based optical methods exhibit loading effects that can lead to the underestimation of BC concentrations (Bond et al., 1999; Virkkula et al., 2007; Park et al., 2010; Hyvärinen et al., 2013; Drinovec et al., 2015). However, the newly developed Aethalometer model AE-33 uses a real-time loading effect compensation algorithm that can provide high-quality data, which are very helpful for the accurate determination of BC concentrations and source apportionment (Drinovec et al., 2015).
Therefore, the airborne BC concentrations at QOMS were monitored by the new Aethalometer model AE-33 (Magee Scientific Corporation, USA). The instrument was placed in an indoor room with an inlet installed at approximately 3 m above the ground level and was operated at an airflow rate of 4 L min−1 with a 1 min time resolution. AE-33 has seven fixed wavelengths (i.e., 370, 470, 520, 590, 660, 880 and 950 nm), which can acquire the BC concentration according to the light absorption and attenuation characteristics from the different wavelengths (Hansen et al., 1984; Drinovec et al., 2015). Generally, the BC concentration measured at 880 nm is used as the actual BC concentration in the atmosphere, as the absorption of other types of aerosols is greatly reduced in this wavelength (Sandradewi et al., 2008a, b; Fialho et al., 2005; Yang et al., 2009; Drinovec et al., 2015). Compared to previous Aethalometer models, the AE-33 uses dual-spot measurements and a real-time calculation of the “loading compensation parameter”, which can compensate for the “spot loading effect” and obtain high-quality BC concentrations (Drinovec et al., 2015). The main structure of this algorithm is as follows:
where BC (reported) is the uncompensated BC concentration; BC (zero loading) is the desired ambient BC value that would be obtained in the absence of any loading effect; k is the loading effect compensation parameter; I and I0 are the light intensity of the measurement spot and reference spot; and ATN is the attenuation of light through filter tape. The BC component of the aerosols is analyzed on two parallel spots, which are drawn from the same input stream in AE-33 but are collected at different rates of accumulation. This means that we can obtain different ATN but the same loading parameter k (Drinovec et al., 2015). Combining Eqs. (3) and (4), the compensation parameter k and the desired value of BC compensated back to zero loading can be calculated. Based on the dual-spot technology, the new real-time compensation algorithm allows extrapolation to zero loading and obtains the accurate BC concentration (Drinovec et al., 2015; Crenn et al., 2015; Zhu et al., 2017). Previous studies have evaluated the real-time compensation algorithm of dual-spot Aethalometer model AE-33 and indicated that AE-33 agrees well with the post-processed loading effect compensated data obtained using earlier Aethalometer models and other filter-based absorption photometers, implying the effective performance of this new algorithm (Drinovec et al., 2015; Rajesh and Ramachandran, 2018).
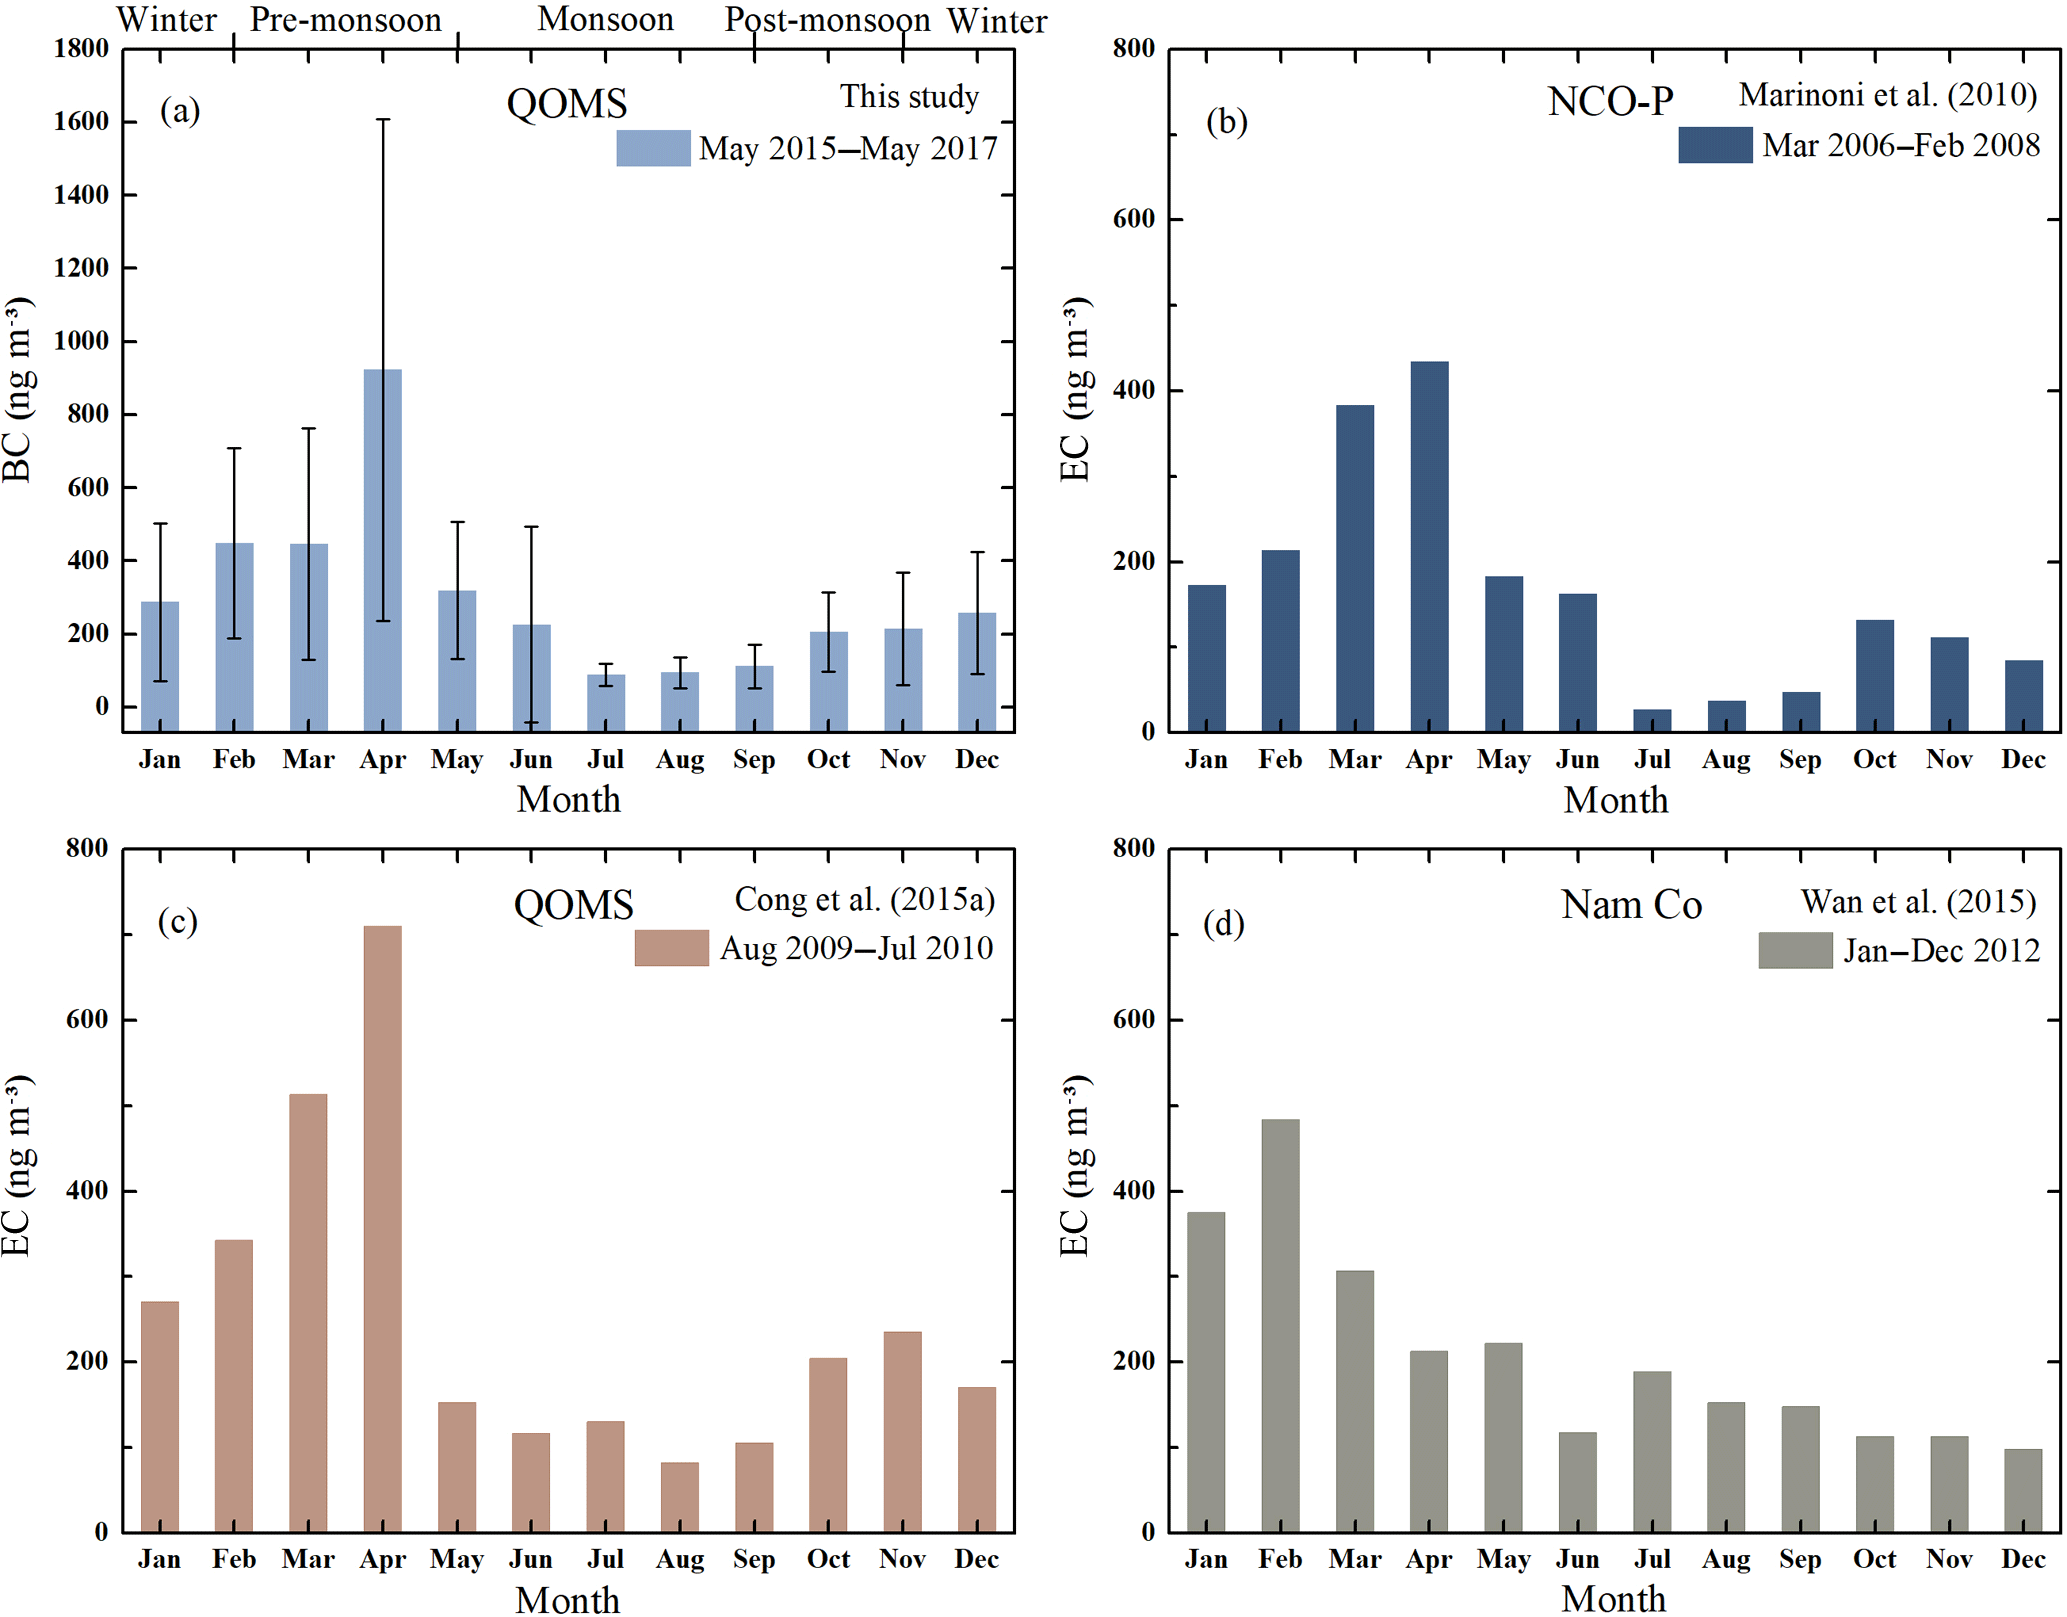
Figure 2(a) monthly mean BC concentrations at QOMS from May 2015 to May 2017 in this study; (b) monthly mean EC at NCO-P from March 2006 to February 2008 from Marinoni et al. (2010); (c) monthly mean EC at QOMS from August 2009 to July 2010 from Cong et al. (2015a); (d) monthly mean EC at Nam Co station from January to December during 2012 from Wan et al. (2015).
2.3 Model simulation and datasets
Version 3.6 of WRF-Chem was used to analyze the spatial distribution, transport mechanism, and source apportionment of BC during the four observed pollution episodes. The WRF-Chem model is an expansion of the WRF meteorological model and considers complex physical and chemical processes such as emission and deposition, advection and diffusion, gaseous and aqueous chemical transformation, and aerosol chemistry and dynamics (Grell et al., 2005). Here, the numerical experiments were performed at a 25 km horizontal resolution with 122 and 101 grid cells in the west–east and north–south directions, respectively. The simulated domain was centered at 25∘ N, 82.5∘ E and had a 30-layer structure with a top pressure of 50 hPa. The key physical and chemical parameterization options for the WRF-Chem model were based on a previous study on the TP (Yang et al., 2018). The initial meteorological fields were taken from the National Centers for Environmental Prediction (NECP) reanalysis data with a horizontal resolution of 1∘ × 1∘ at 6 h time intervals. The anthropogenic emission inventory was obtained from the Intercontinental Chemical Transport Experiment-Phase B (INTEX-B) (Zhang et al., 2009) with a resolution of 0.5∘ × 0.5∘. The biogenic emissions were obtained from the Model of Emission of Gases and Aerosol from Nature (MEGAN) (Guenther et al., 2006), and the fire emissions inventory was based on the fire inventory from the National Center for Atmospheric Research (NCAR-FINN) (Wiedinmyer et al., 2011). Additionally, the Model for Ozone and Related chemical Tracers (MOZART, http://www.acom.ucar.edu/wrf-chem/mozart.shtml, last access: 31 August 2018) (Emmons et al., 2010) dataset was used to create improved initial and boundary conditions for the BC simulations during these pollution episodes.
Furthermore, to predict the source region of BC, we used the Hybrid Single-Particle Lagrangian Integrated Trajectory (HYSPLIT-4) model to calculate the backward trajectories of the air masses (Stein et al., 2015), and the calculation data were obtained from the National Centers for Environmental Prediction/National Center for Atmospheric Research (NCEP/NCAR) reanalysis data (2.5∘ × 2.5∘). The parameter settings for the backward trajectory calculation in the HYSPLIT model were chosen according to a previous study in this area (Xu et al., 2014). The active fire product provided by the Fire Information for Resource Management System (FIRMS, https://firms.modaps.eosdis.nasa.gov, last access: 31 August 2018) was chosen to investigate the biomass burning emissions over the region in different seasons.
3.1 Temporal variations in BC
3.1.1 Monthly variation in BC
The monthly mean BC concentrations at QOMS are shown in Fig. 2a. There was a significant increase in the BC concentrations in winter, and the highest value occurred during the pre-monsoon season (923.1±685.8 ng m−3 in April). Meanwhile, during the monsoon, lower BC concentrations were recorded, and the lowest value was observed in July (88.5±29.8 ng m−3). This seasonal change was consistent with the previous studies of elemental carbon (EC, which is similar to BC) at Nepal Climate Observatory, Pyramid station (NCO-P, 27.95∘ N, 86.82∘ E, 5079 m a.s.l.) from March 2006 to February 2008 (Fig. 2b) (Marinoni et al., 2010) and at QOMS from August 2009 to July 2010 (Fig. 2c) (Cong et al., 2015a), indicating a similar BC source between the southern and northern sides of the Himalayas. As EC was sampled by quartz filters and detected using the thermal–optical analytical method in previous studies, there may be some differences in the values of EC compared to those of BC, for instance, the overestimation of EC due to the potential effect of carbonates in mineral dust of the samples when using the thermal–optical method (C. Li et al., 2017). The monthly variation in EC at Nam Co Monitoring and Research Station for Multisphere Interactions (Nam Co station, 30.77∘ N, 90.98∘ E, 4730 m a.s.l.) from January to December during 2012 (Fig. 2d) (Wan et al., 2015) also showed a similar variation, but the peak value of EC occurred in winter. Additionally, the monthly mean EC concentrations at Nam Co station were generally lower than those at QOMS, suggesting that the impact of the anthropogenic activities on the inland TP was weaker than that on the southern edge of the TP. Previous studies have demonstrated that the influence of polluted air masses from the “atmospheric brown clouds” over southern Asia could reach the southern foothills of the Himalayas and that the mountain-valley breeze circulation carried the polluted air masses to the TP (Lüthi et al., 2015; Cong et al., 2015a; Bonasoni et al., 2008; Yang et al., 2018). Therefore, the seasonal cycle of BC concentrations at QOMS was likely affected by the atmospheric circulation and the emissions from southern Asia, which will be further explained in Sect. 3.3.
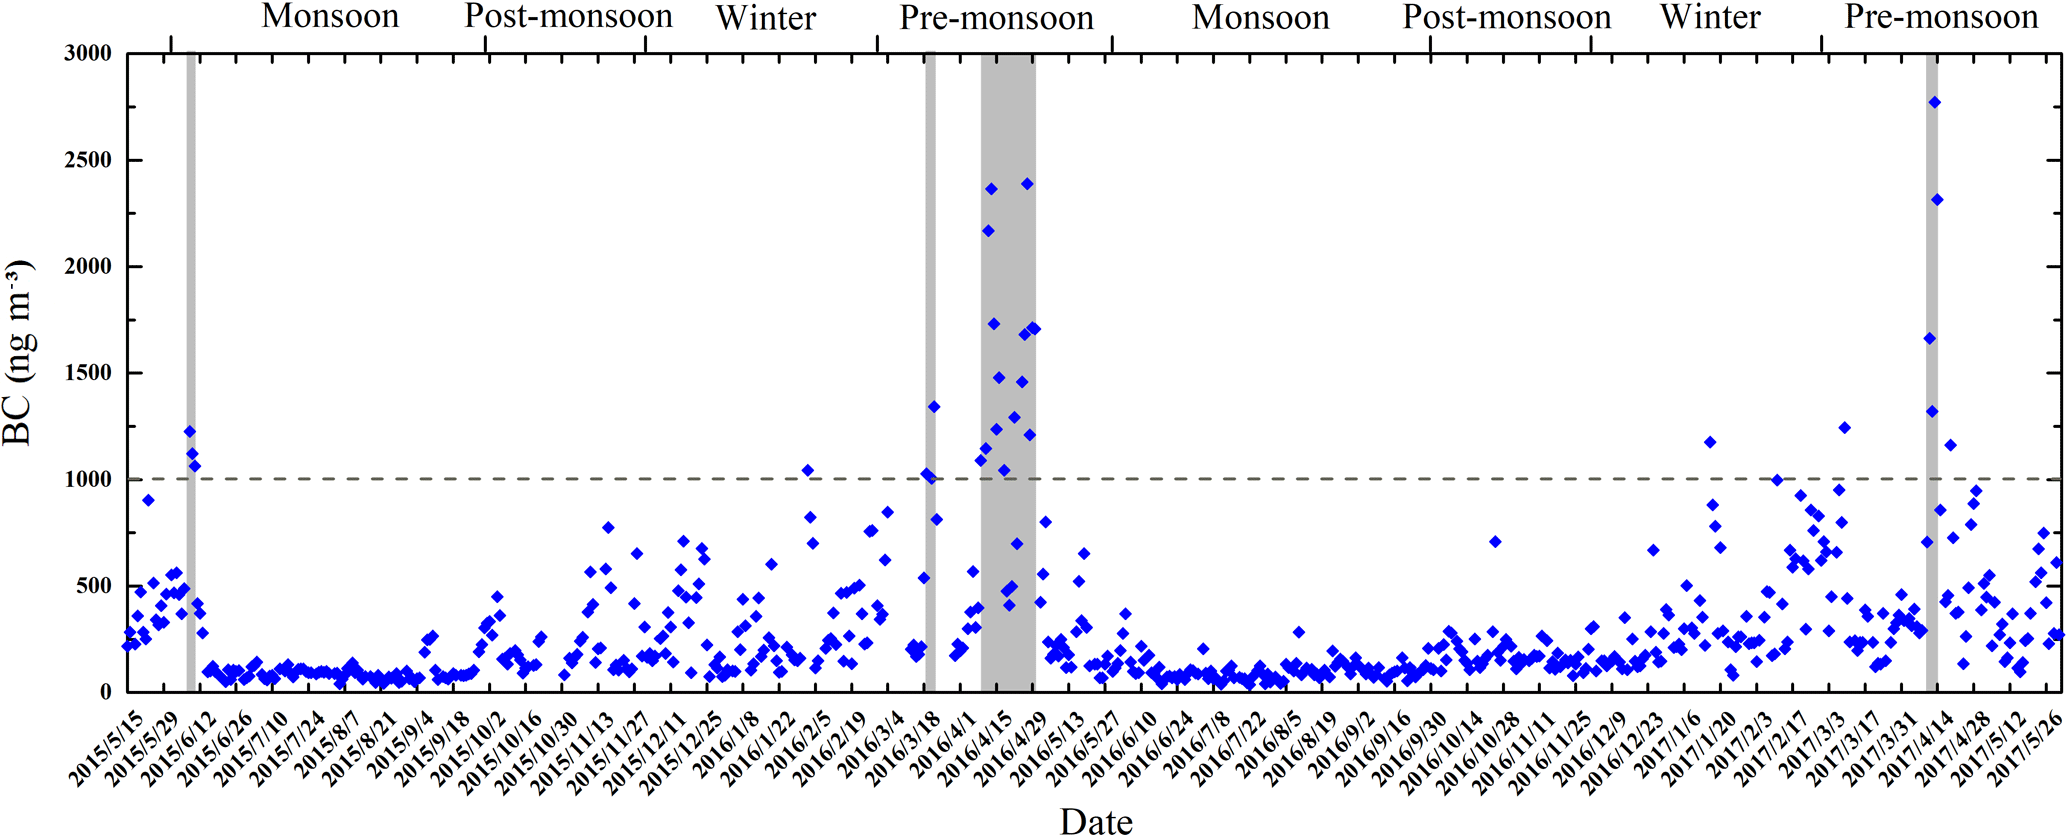
Figure 3Daily mean BC concentrations at QOMS during study period (the gray bars represent the continuously high values more than 1000 ng m−3).
3.1.2 Daily variation in BC
Figure 3 shows the daily mean BC concentrations at QOMS, which present a significant seasonal pattern, with a maximum during the pre-monsoon season (2772.3 ng m−3) and a minimum during the monsoon season (36.4 ng m−3). During the monsoon season, the BC concentration was observed to be lower than 150 ng m−3, but it gradually increased during the post-monsoon and winter seasons. The mean concentration of daily BC at QOMS was 298.8±341.3 ng m−3, which was close to the previous result (250±220 ng m−3) (Cong et al., 2015a).
The comparison between daily mean BC concentrations (Fig. 3) and the meteorological parameters (Fig. S1) suggested that the increasing precipitation during the monsoon led to the washout of atmospheric particles, promoting the wet deposition of BC. This process caused a decrease in BC concentrations during the monsoon, representing the background level during the period. The prevailing wind direction was southwesterly during the monsoon period and westerly during the non-monsoon periods. Therefore, the variations in BC might be linked to the influence of meteorological conditions and the contribution of long-distance transport from urbanized areas to QOMS. Moreover, it cannot be ignored that there were continuously high concentrations of BC above 1000 ng m−3 during 8–10 June 2015, 19–22 March 2016, 9–30 April 2016, and 11–14 April 2017, indicating that the heavy pollution episodes happened at QOMS during those days. A detailed analysis of these pollution events is presented in Sect. 3.4.
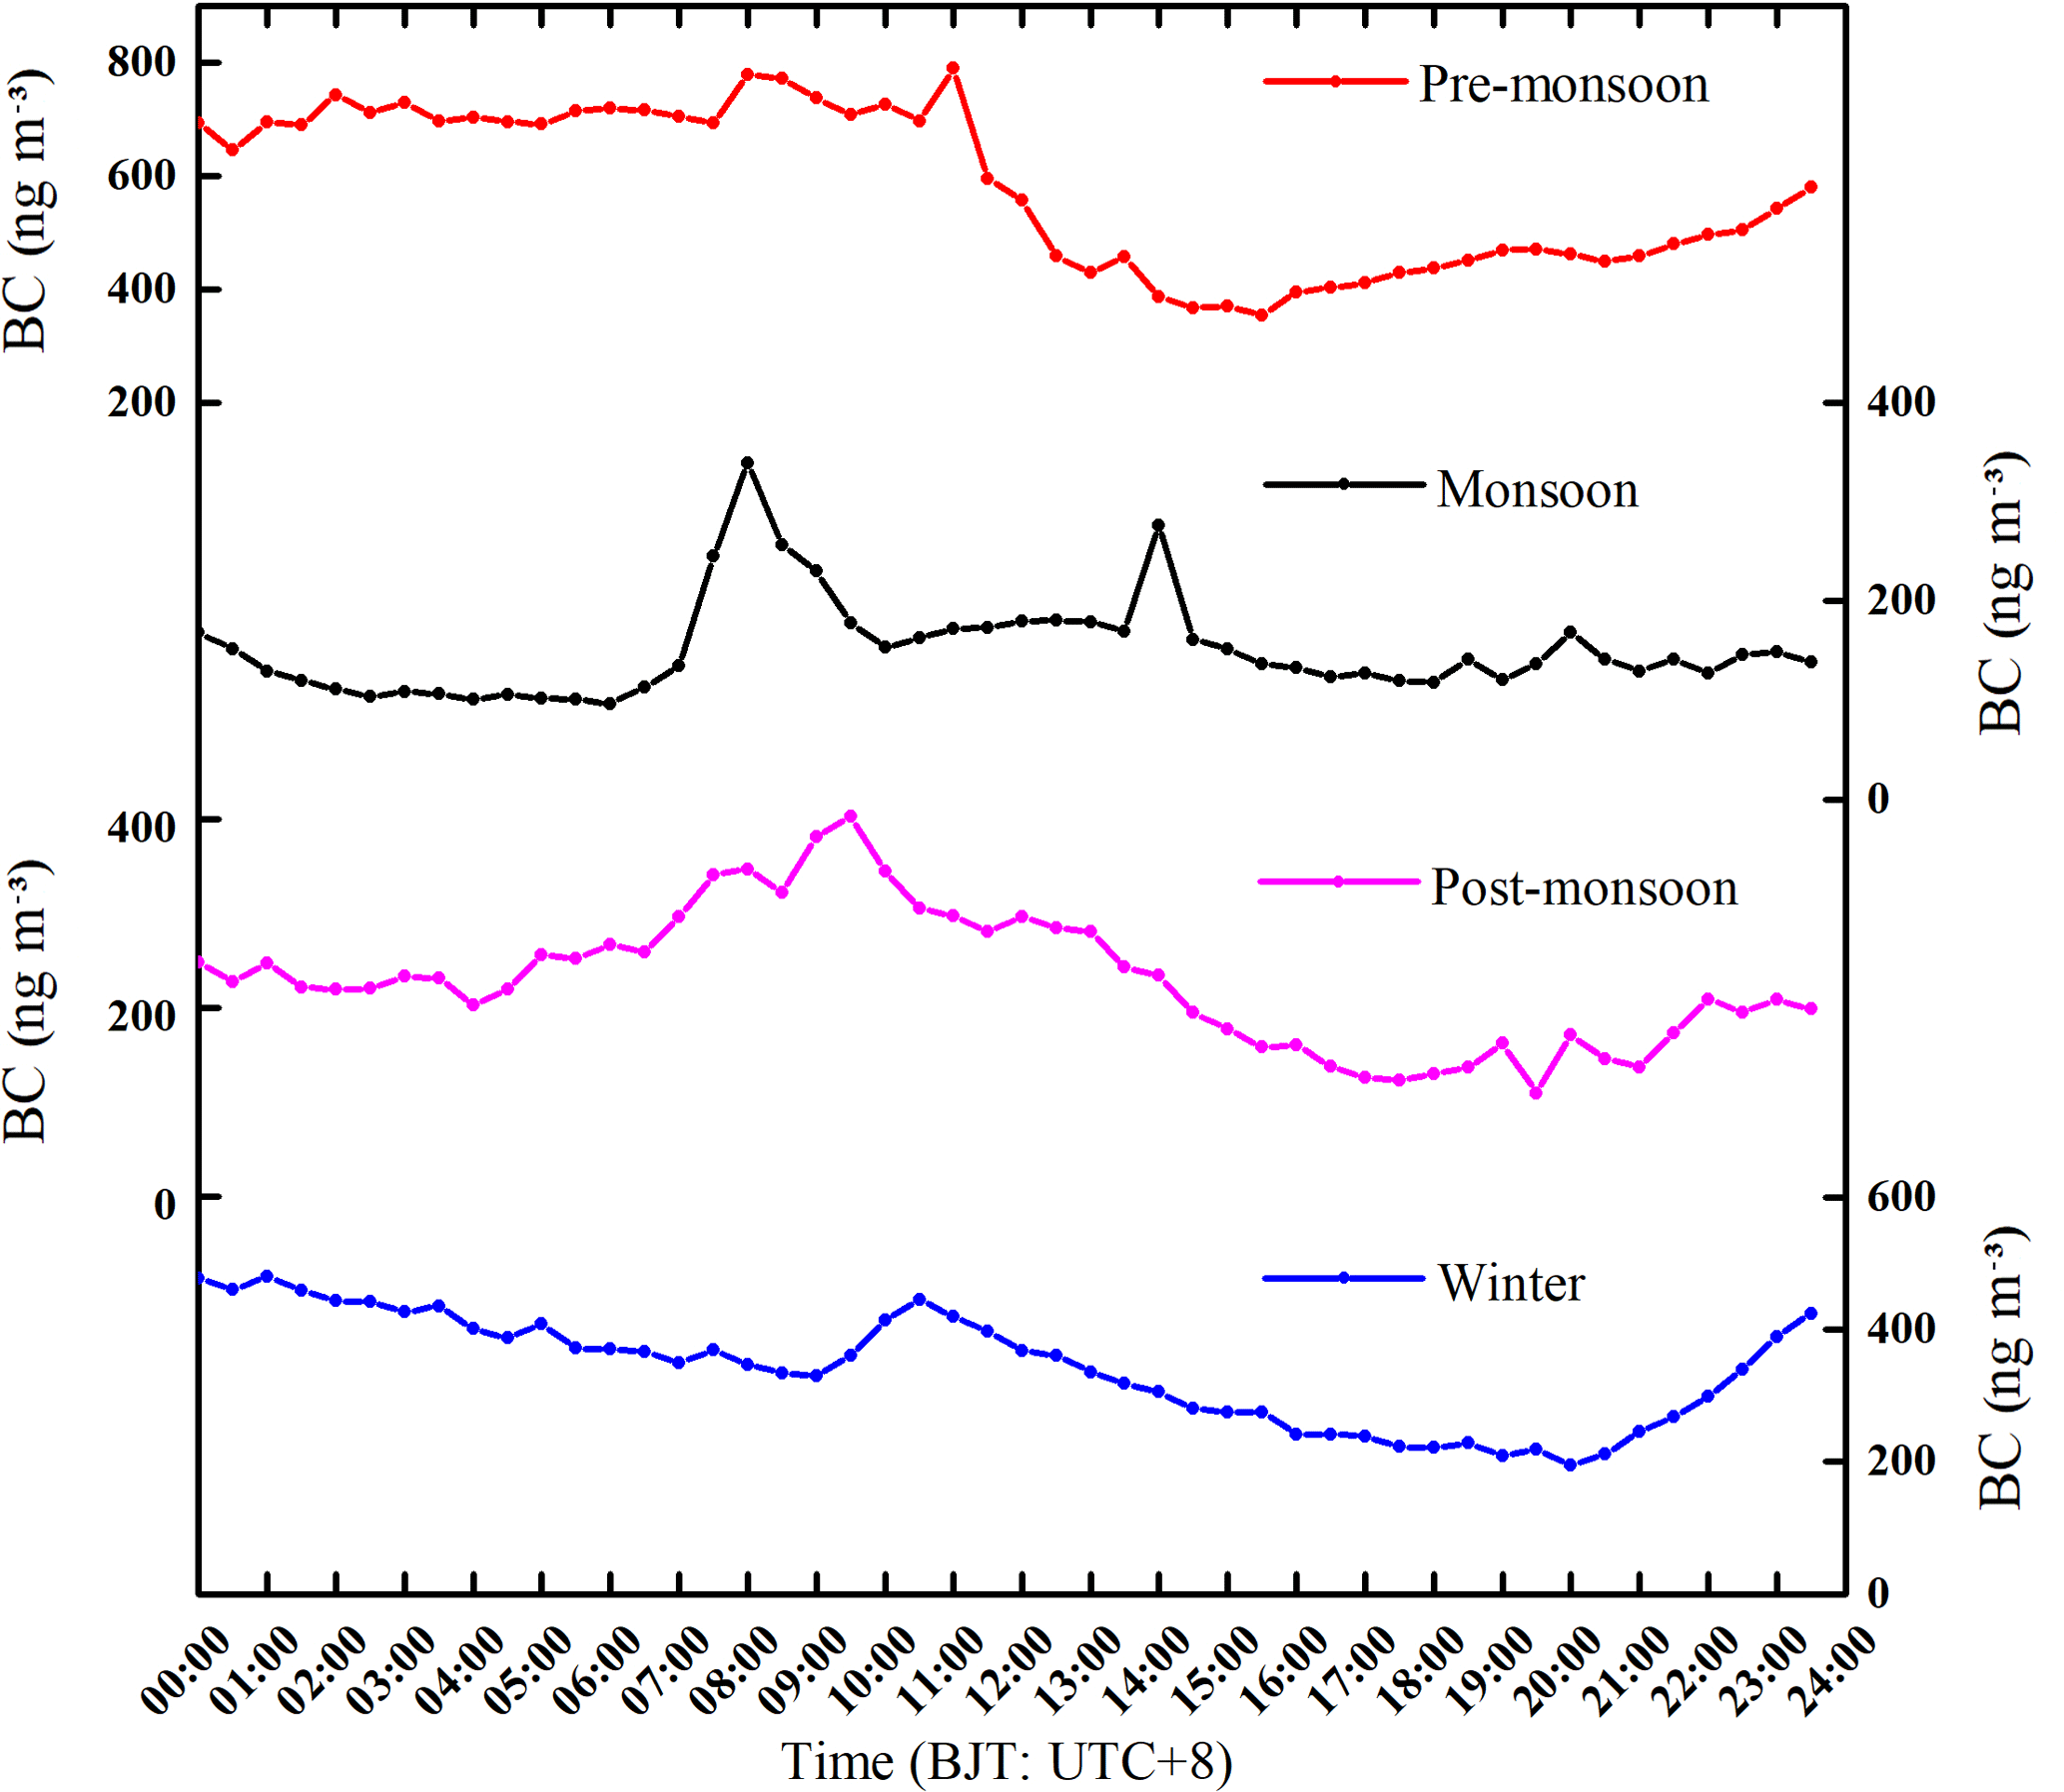
Figure 4Diurnal variation in BC concentrations (every half an hour) at QOMS during study period.
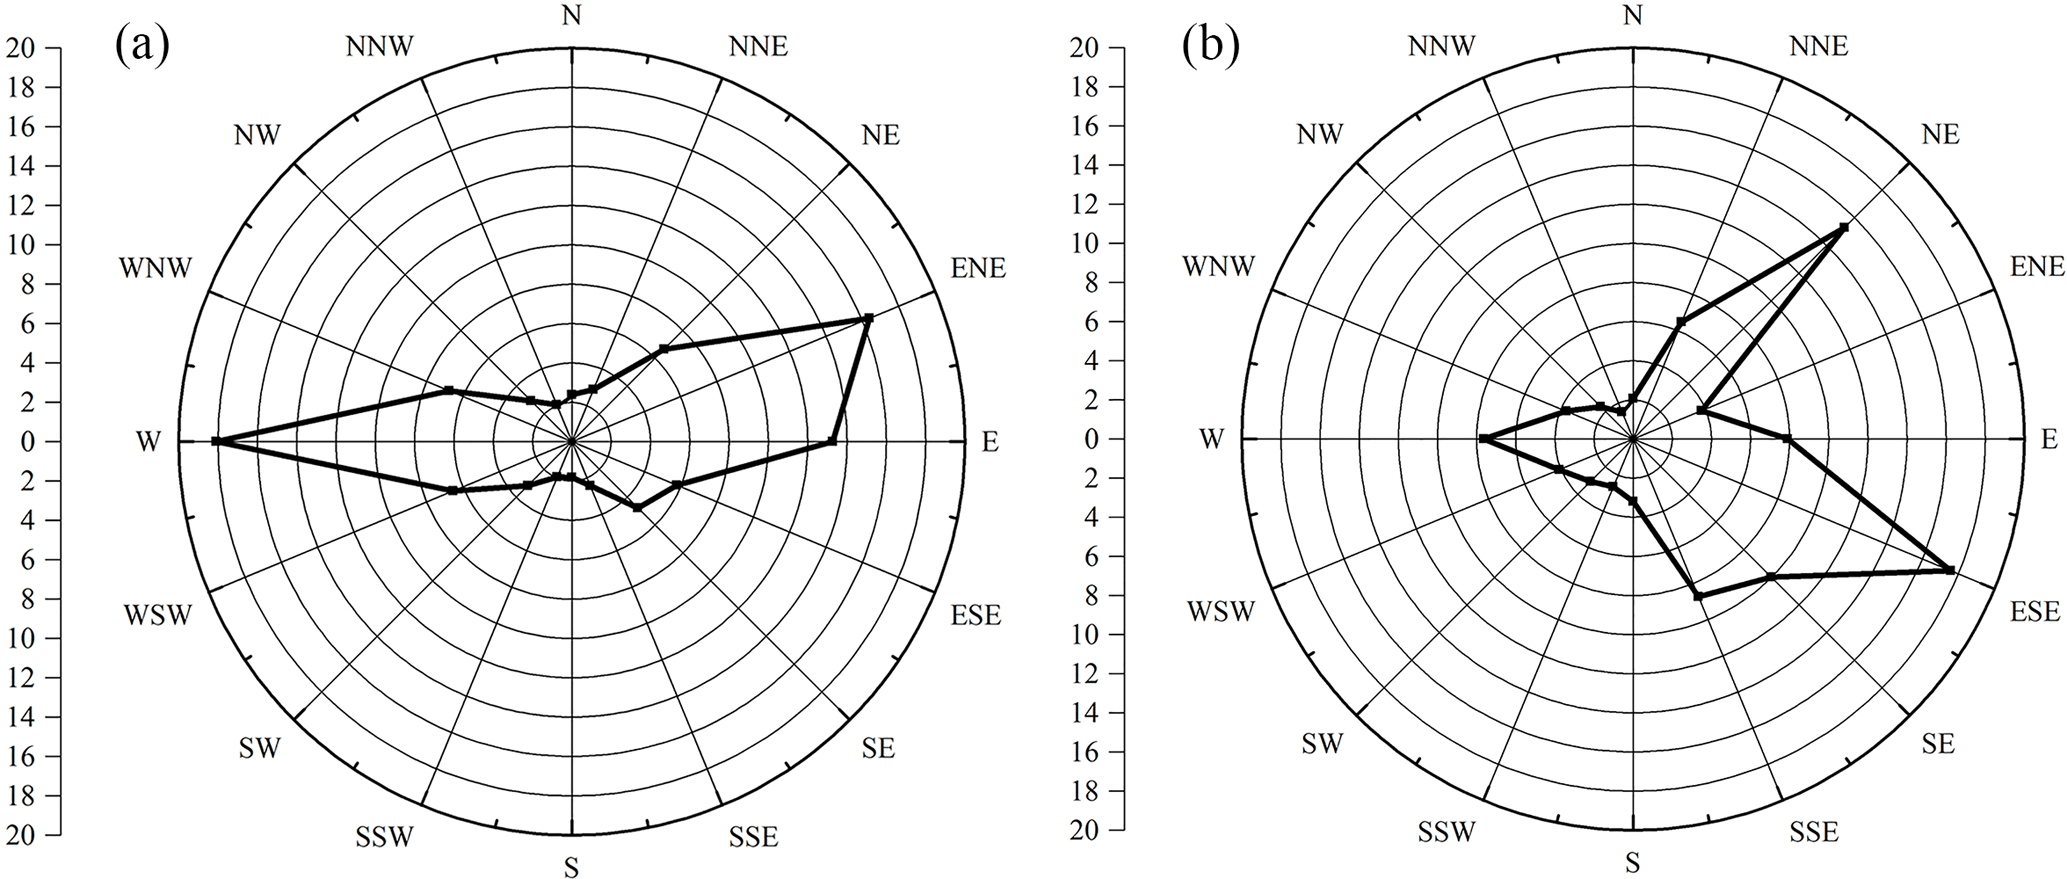
Figure 5Wind direction frequency at QOMS in the pre-monsoon season: (a) 00:00–12:00 BJT; (b) 12:00–24:00 BJT.
3.1.3 Diurnal variation in BC
Diurnal variation characteristics can be used to analyze the impact of local meteorological processes and anthropogenic activities on the BC concentrations at QOMS. The half-hourly mean BC concentrations are presented in Fig. 4. In the pre-monsoon season, the diurnal BC concentrations remained significantly high from late at night to morning (00:00–12:00 BJT; Beijing time, or UTC + 8 is 2 hrs earlier than local time) and increased gradually after the lowest value at approximately 15:30 BJT. Elevated BC concentrations were also observed in the afternoon during the post-monsoon and winter periods, and high BC concentrations occurred from late at night to morning. The BC concentrations during the monsoon season were significantly lower than those during the other seasons but peaked in the morning (08:00 BJT) and at noon (14:00 BJT). Previous studies have demonstrated that the local wind system on the northern slope of Mt. Everest is composed of a morning “valley wind”, a late morning–afternoon “glacier wind” weakened by “valley wind”, and an evening–early night “mountain wind” (Zou et al., 2008). The QOMS is located in the s-shape valley north of Mt. Everest (Ma et al., 2011). The glacier wind and downward mountain wind from the south developed in the afternoon and at night, which provided the potential possibility for pollutants from long-distance sources to be transported to QOMS along the valley and increased the BC concentrations in the non-monsoon periods. The valley wind from the north in the morning could bring the short-distance emissions from cooking or heating in several villages that are located north (approximately 5 km away) of QOMS. The BC concentrations were remarkably low in the monsoon season but peaked in the morning and at noon, which might be due to the local emissions carried by the valley wind from the north.
To explain the significantly high values from late at night to morning (00:00–12:00 BJT) in the pre-monsoon season, the wind direction frequency at QOMS during 00:00–12:00 and 12:00–24:00 BJT is presented in Fig. 5. During the sampling period in the pre-monsoon season, winds from the west prevailed from late at night to morning (Fig. 5a), accounting for 18.1 % of the total wind direction, followed by ENE (east-northeast) winds (16.4 %). This is consistent with the discussion above that there are potential impacts on the BC concentrations at QOMS from long-distance human activity emissions, which can be carried by the westerly winds, i.e., downward mountain winds (Cong et al., 2015b). Moreover, the WRF-Chem simulation results showed that the profile of equivalent potential temperature (EPT) increased with altitude and the planetary boundary layer height (PBLH) and wind speed were much lower from late at night to morning (Fig. S2), indicating a more stable atmosphere that obstructs the diffusion of BC aerosols. ESE (east-southeast) and NE (northeast) winds prevailed from late morning to night (12:00–24:00 BJT) (Fig. 5b), accounting for 17.6 % and 15.3 % of the total wind directions, respectively, implying a strengthened glacier wind or mountain wind (from the south) that caused an increase in BC, which was contributed to by long-distance sources. During the pre-monsoon season, the strong mountain winds and glacier winds could transport large amounts of trans-Himalayan pollution from heavily polluted areas of southern Asia to QOMS; therefore, the long-distance sources play a major role in the diurnal variation in the BC concentrations at QOMS during this period.
3.2 Comparison of the BC concentrations with other sites on the TP
A previous study has revealed that low BC concentrations in China can be found on the TP, with values of approximately 200–1000 ng m−3 in PM2.1 and 300–1500 ng m−3 in PM9.0 (Xin et al., 2015). To better understand the BC loading level, we compared our results with previous studies from other locations over the TP. As shown in Fig. 1, the BC concentrations at Muztagh Ata and Qilian Shan presented low values, which can be regarded as the background concentration level for inland Asia (Cao et al., 2009; Zhao et al., 2012). In contrast, the BC concentration at the city of Lhasa was higher than that at other sites on the TP, of which a main contributor was local fossil fuel combustion (Li et al., 2016b). In addition, impacted by the long-range transport of anthropogenic emissions from the east and significant dust input from the west, the BC concentration at Qinghai Lake also showed a relatively high value (Li et al., 2013). The BC concentration at Beiluhe was slightly higher than that at Qinghai Lake, and the BC is mainly from the arid regions in northwestern China in spring and from the southern slope of the Himalayas in winter (Wang et al., 2016). Therefore, the long-range transportation from central Asia and eastern Asia contributed greatly to the BC aerosols in the northern TP. For the sites in the central and southeastern regions of the TP (e.g., Nam Co and Ranwu), which are isolated from anthropogenic activities and have relatively clean atmospheric environments, the BC concentrations at these two sites were above 130 ng m−3, likely due to the influence of long-range transport from southern Asia (Wan et al., 2015; Wang et al., 2016). Compared with the locations on the southern slope of the Himalayas (e.g., NCO-P and Manora Peak), the BC concentration at QOMS was close to that at NCO-P but much lower than that at Manora Peak, which is near the polluted areas in southern Asia and is largely affected by anthropogenic emissions (Marinoni et al., 2010; Ram et al., 2010). This implies that the combustion emissions from southern Asia affect not only the lower latitudes in the vicinity but also the higher latitudes in the Himalayas and the interior of the TP due to long-range transport.
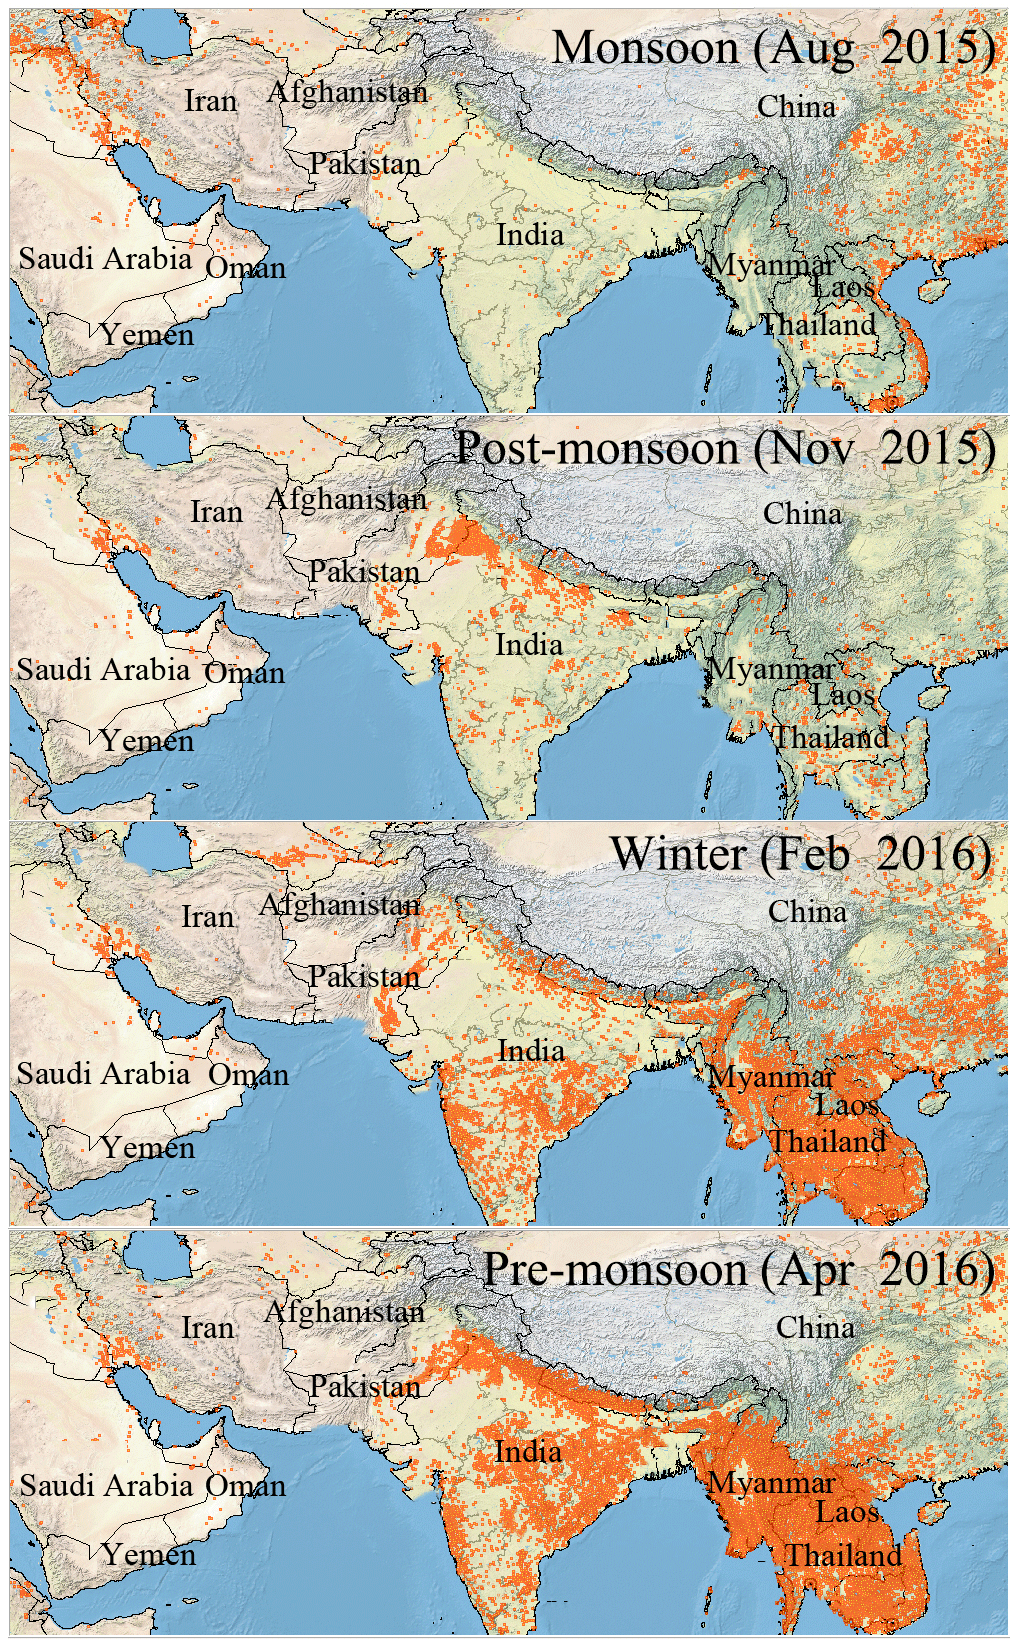
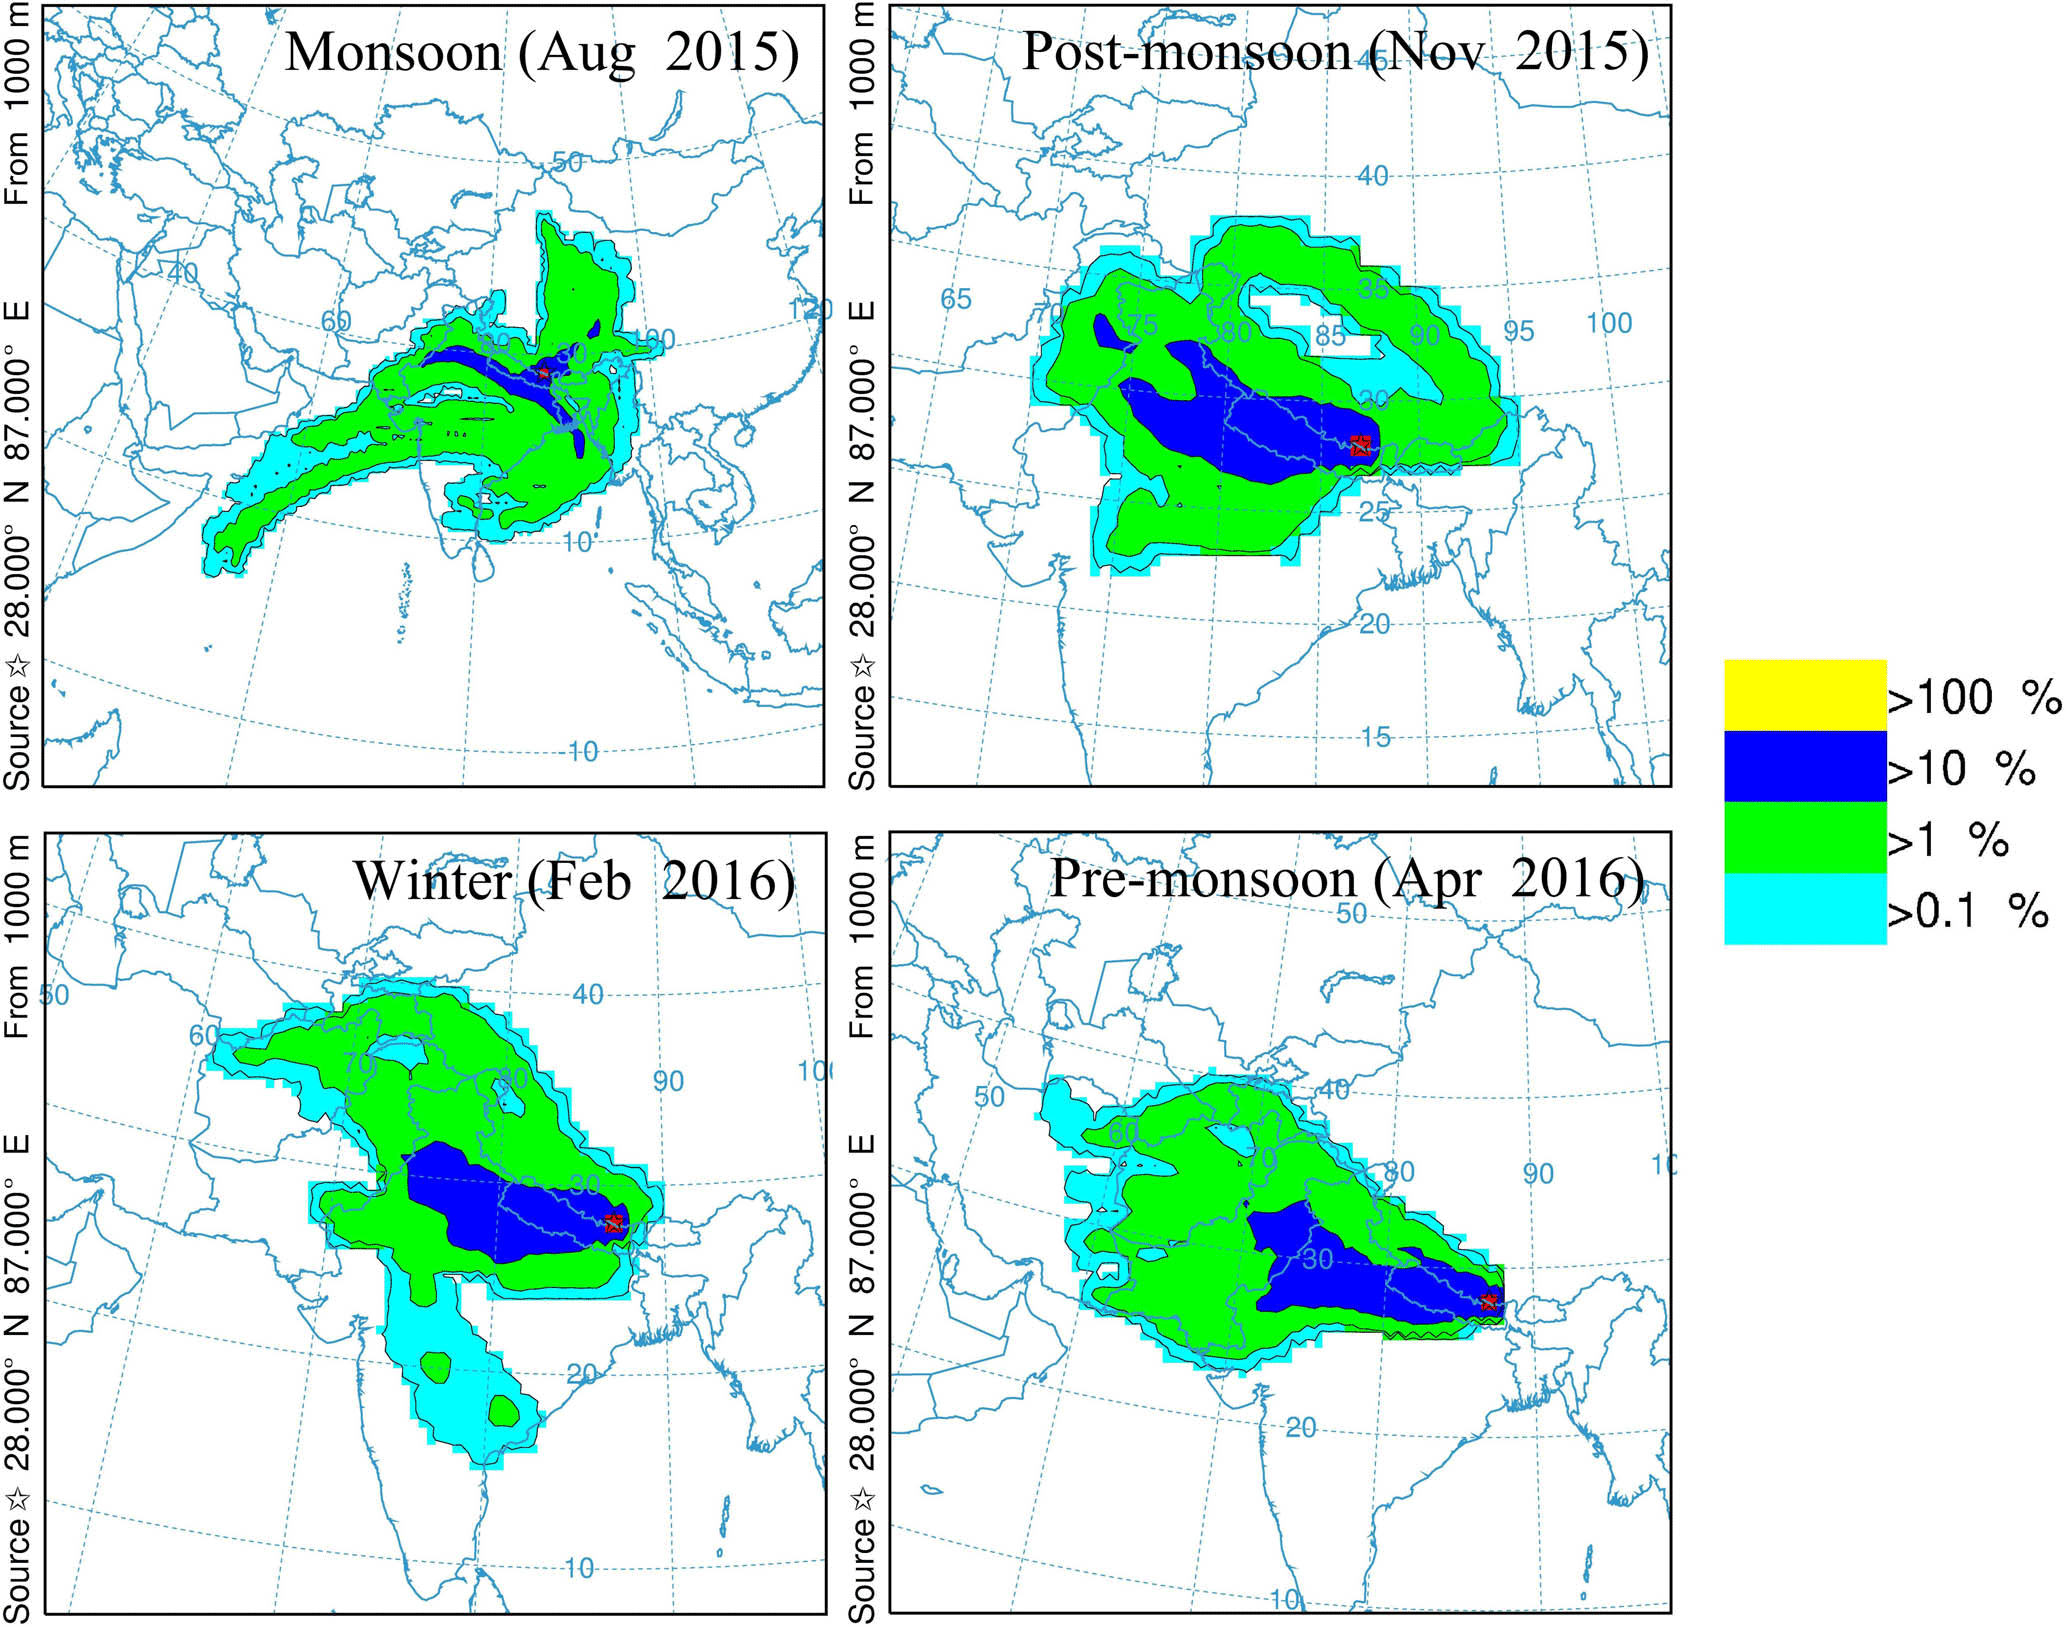
Figure 7Frequency plots for 5-day backward trajectories calculated by HYSPLIT model at QOMS in different seasons from August 2015 to April 2016.
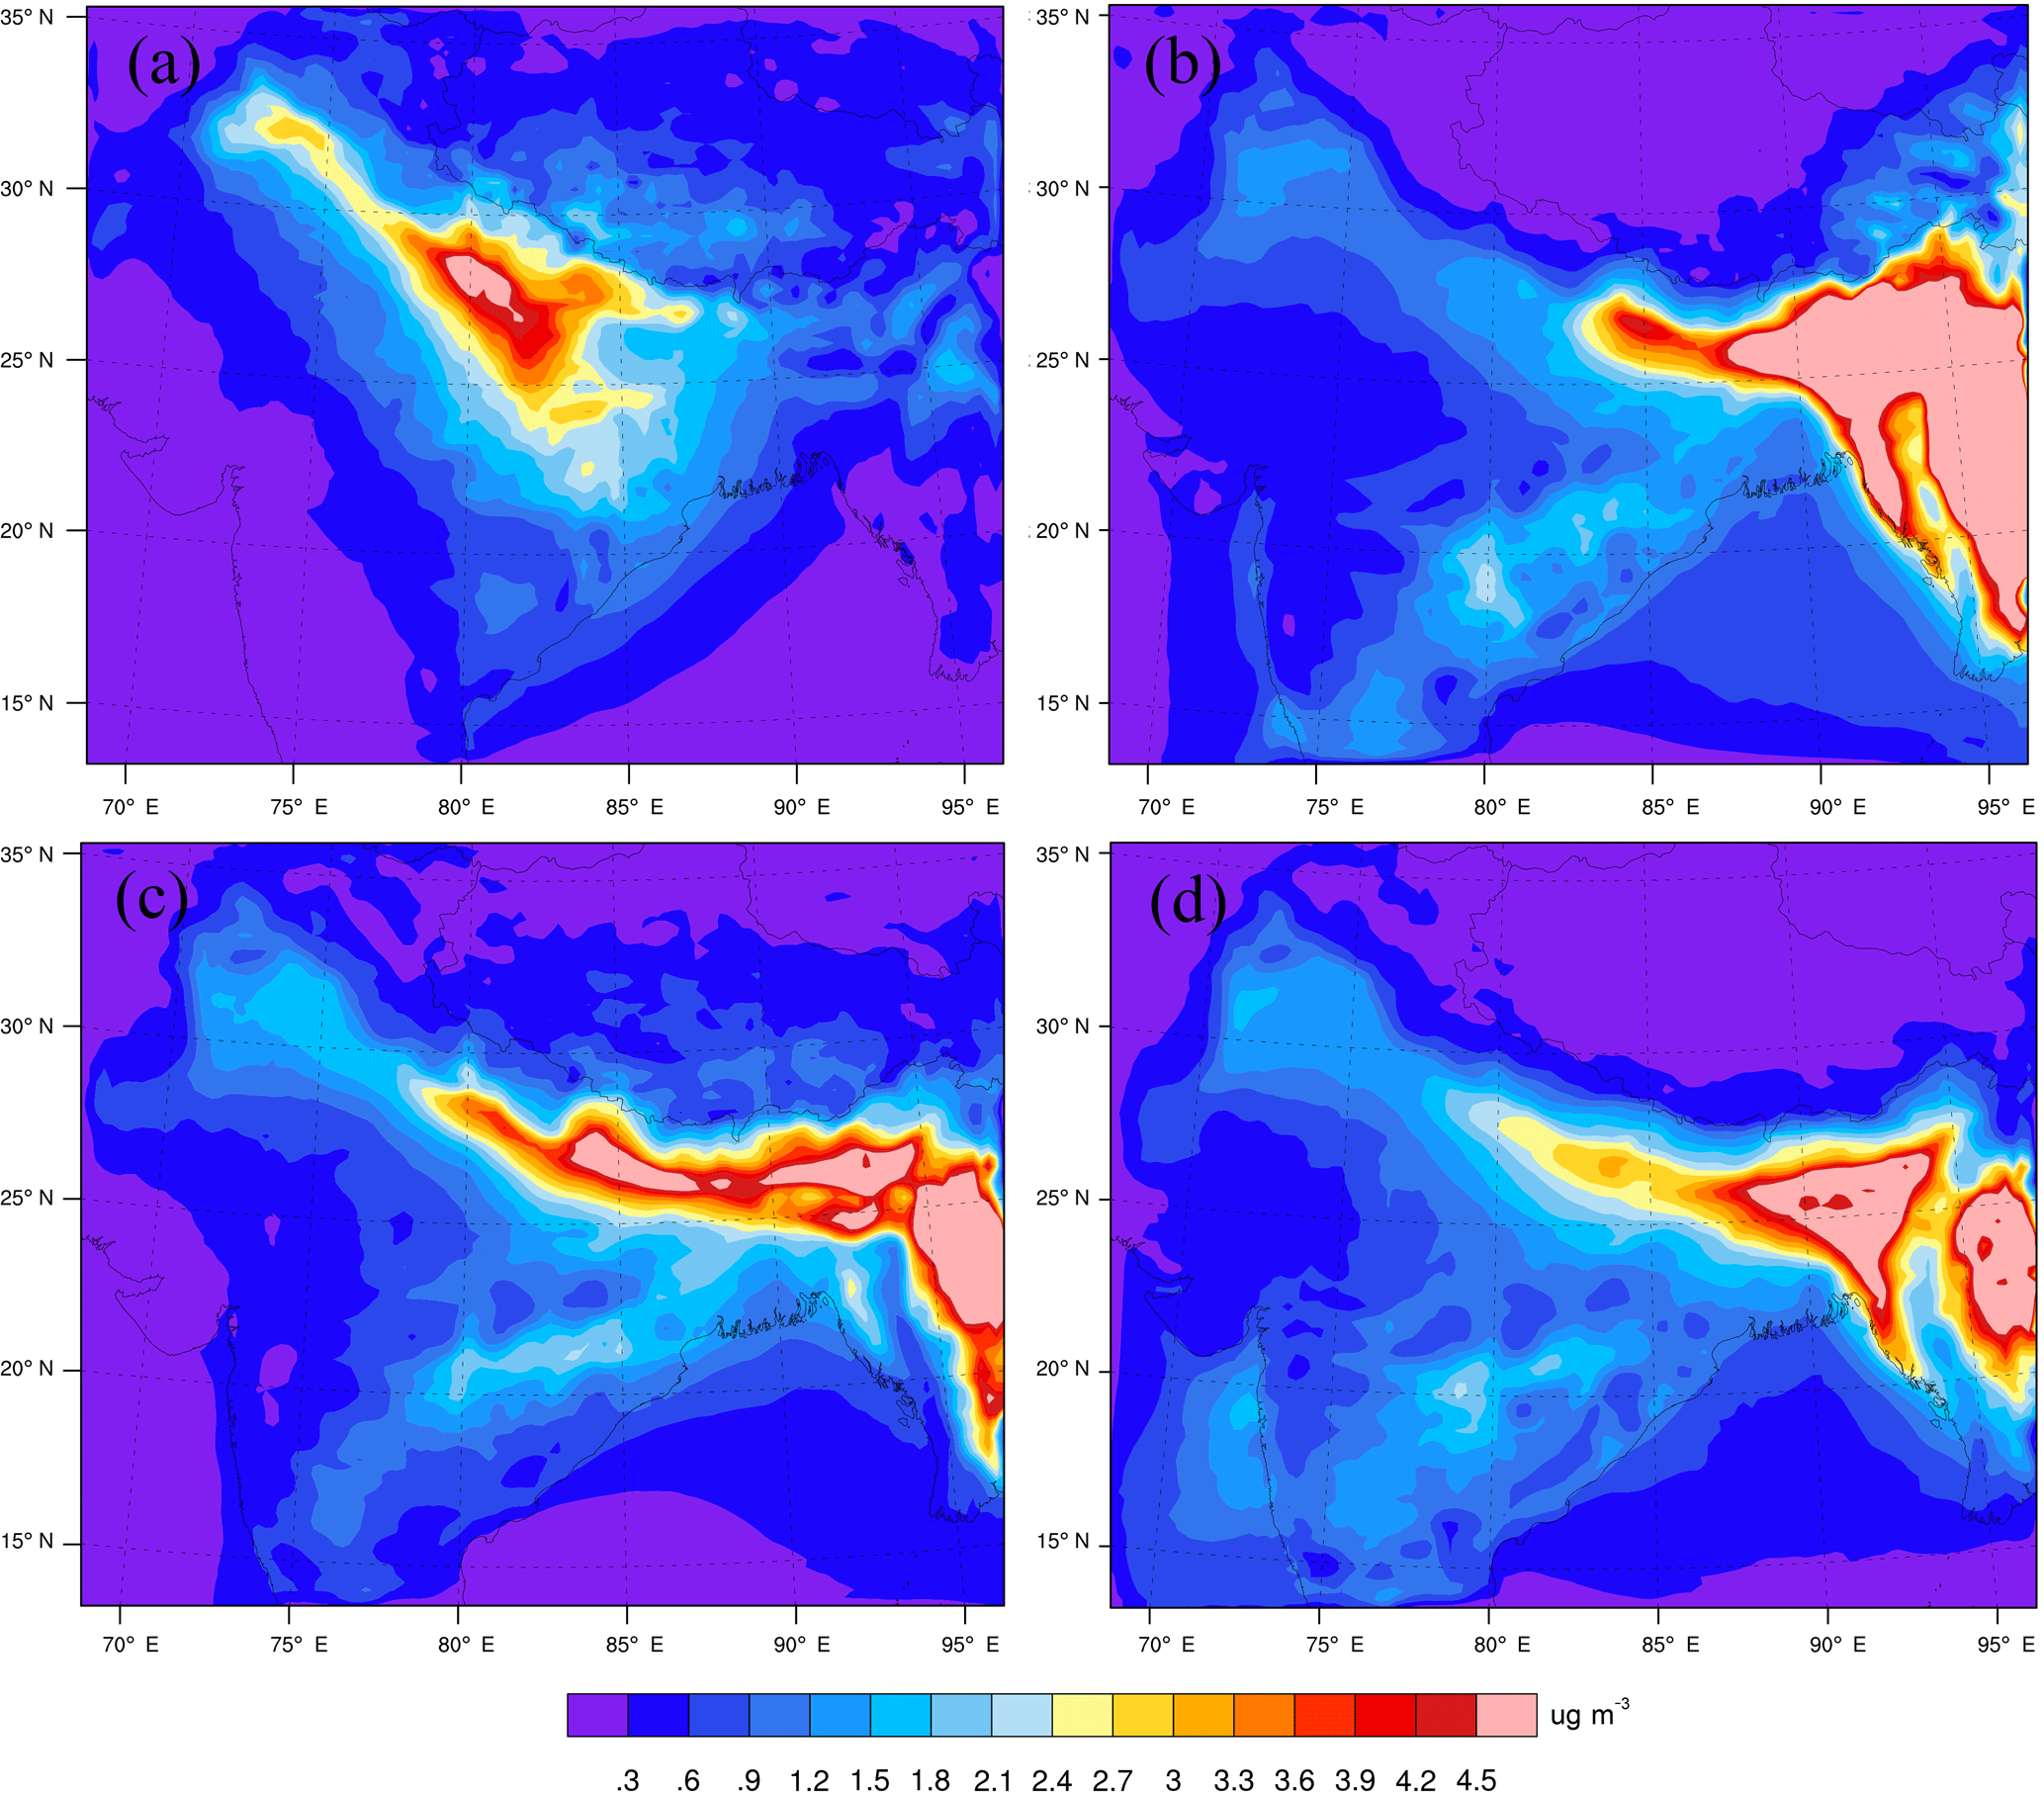
Figure 8Mean BC concentration simulated by WRF-Chem model at QOMS and its vicinities: (a) event A; (b) event B; (c) event C; (d) event D.
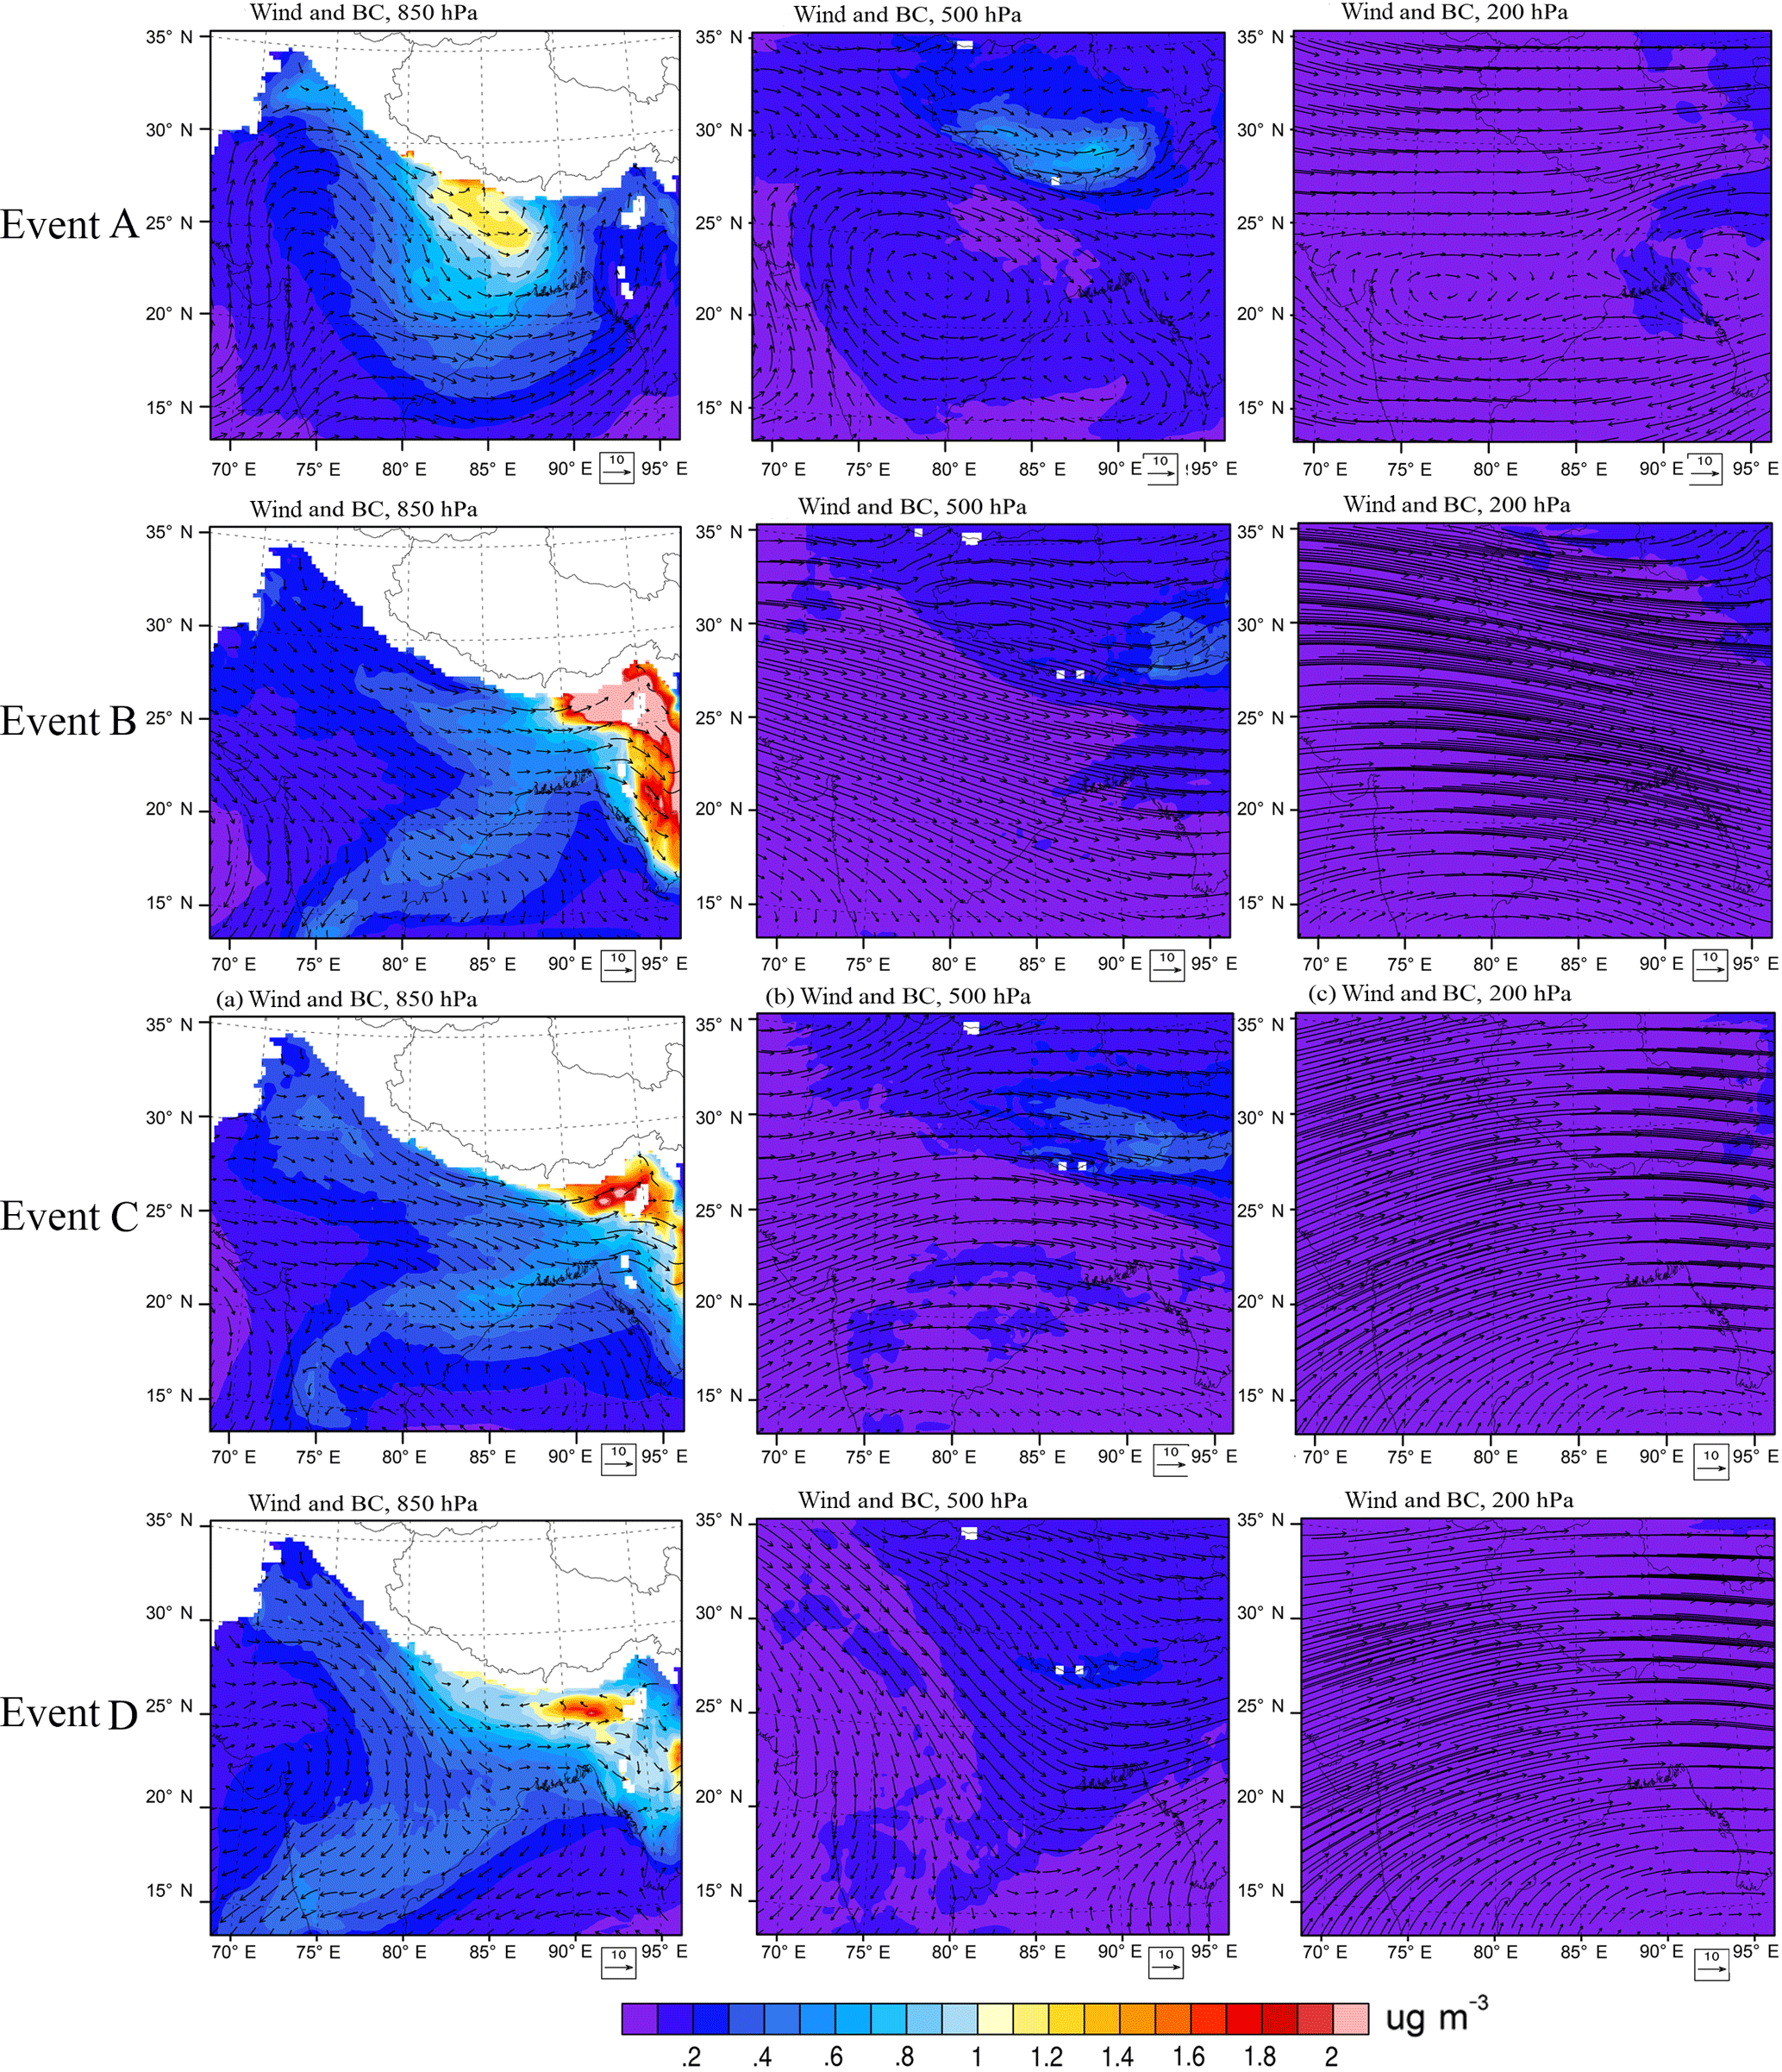
Figure 9Mean BC concentration and wind at 850, 500, and 200 hPa simulated by WRF-Chem model at QOMS and its vicinities: event A (the first row); event B (the second row); event C (the third row); event D (the last row).
3.3 Potential sources and transport mechanisms of BC in different seasons
The seasonal variation in the BC concentrations was correlated with the combustion intensity of sources and atmospheric circulation. The “atmospheric brown clouds” over southern Asia contain large amounts of aerosol components such as the high loading emissions of BC from biomass burning, which can reach the TP within a few days (Ramanathan et al., 2005; Ramanathan and Ramana, 2005; Lüthi et al., 2015). A previous study quantified biomass burning sources contributing to BC aerosols from the Himalayan region of Nepal and India and showed that the major fires were concentrated from March to June; additionally, most fires occurred in the low-elevation areas dominated by forests and croplands (Vadrevu et al., 2012). Therefore, we further checked the biomass burning emissions in the Mt. Everest region and its vicinities using the active fire product from the MODIS data during four seasons (August 2015 to April 2016) provided by the FIRMS (Fig. 6). It is clearly shown that there were large numbers of active fire spots in northern and central India, Pakistan, and Nepal in winter and the pre-monsoon season. Moreover, referring to Cong et al. (2015a), the active fire spots represent agricultural combustion and forest fires in this region, which might substantially contribute to BC aerosols. During the monsoon season, insignificant fire spots appeared in southern Asia, representing less biomass burning in that period.
To further explore the sources and the long-range transport mechanism of BC aerosols at QOMS, we calculated the frequency plots for 5-day backward trajectories arriving 1 km above ground level (Fig. 7). During the non-monsoon seasons, the air masses were affected by the westerly winds. The air masses reaching the Mt. Everest region were mostly from the northwest, indicating that the biomass burning emissions in Pakistan, northern India, and Nepal could be transported to the Mt. Everest region. However, for the difference in the combustion intensity, high concentrations of BC were found only during the pre-monsoon season. During the monsoon season, the southerly winds dominated in the Mt. Everest region, and the air masses were mainly from the Arabian Sea and the Bay of Bengal and were substantially moist. During this period, the precipitation on the southern side of the Himalayas was above 1200 mm (Xu et al., 2014), which can improve the wet removal efficiency of BC. Moreover, the biomass combustion emissions in southern Asia in this period were very low. Therefore, the BC concentrations at QOMS were close to the background level during the monsoon season. Meanwhile, the local meteorological conditions also play a very important role in the transport of pollutants across the Himalayas from southern Asia. Previous studies have shown that the local wind system was mainly composed of up-valley wind on the southern slope and down-valley wind on the northern slope, which facilitates the exchange of air between the bottom and upside of the atmosphere, and facilitates the coupling of air flow between the southern and northern slopes, which allows the pollutants from southern Asia to easily cross the Himalayas and be transported to the TP from the valley (Zou et al., 2008; Chen et al., 2012; Cong et al., 2015b; Tripathee et al., 2017; Dhungel et al., 2018).
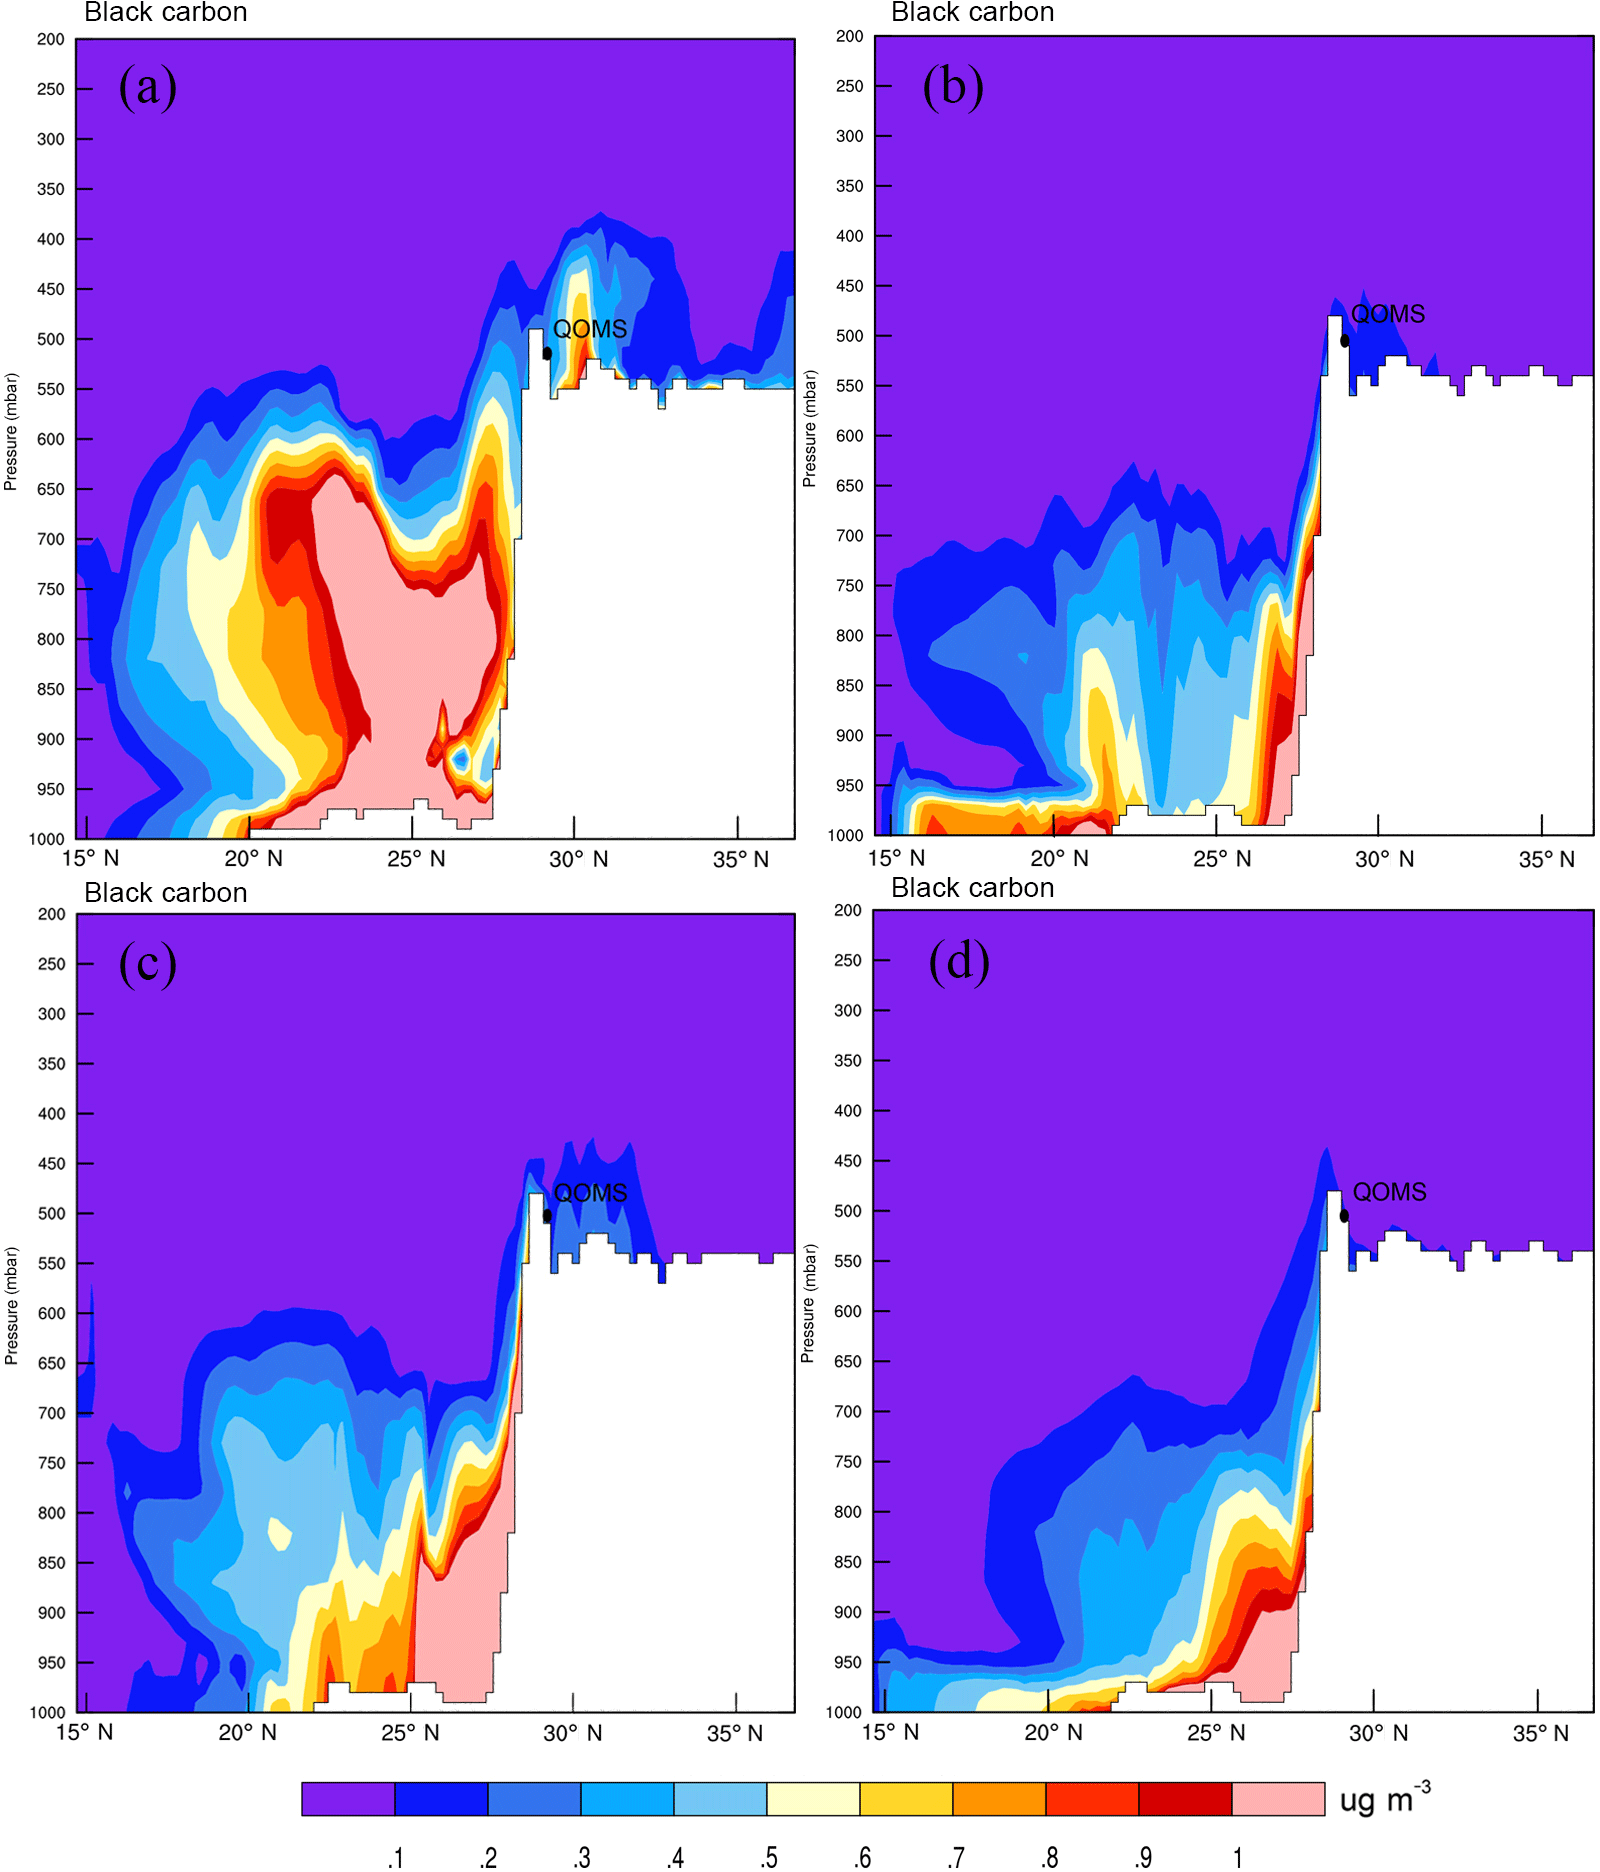
Figure 10Vertical profiles of mean BC concentration along the QOMS's longitude of 86.95∘ E: (a) event A; (b) event B; (c) event C; (d) event D.
3.4 Analysis of pollution episodes by WRF-Chem modeling
In this section, we analyzed four pollution events with BC concentrations above 1000 ng m−3 in detail, including event A during 8–10 June 2015, event B during 19–22 March 2016, event C during 9–30 April 2016, and event D during 11–14 April 2017. Figure 8 shows the spatial characteristics of the WRF-Chem modeled surface BC concentrations during the four pollution episodes. It can be seen that the high values of surface BC concentrations always appeared in southern Asia, although the high-value centers changed in different pollution events. For event A, the most serious pollution appeared in Nepal and northern India. There was relatively less BC near Mt. Everest in event B than in the other events. However, for event C, the high BC concentration areas were mainly along the southern slope of the Himalayas in Nepal and eastern India, which can highly impact the BC concentrations in the Mt. Everest region. In event D, the high BC concentrations occurred in Nepal and some parts of India. To evaluate the model performance, the temporal variation in measured and simulated BC concentrations at QOMS during these four pollution episodes are displayed in Fig. S3. As shown in Fig. S3, for the four pollution episodes, the WRF-Chem model captured the variation trends of the observed BC concentrations with correlation coefficients above 0.8. This implies that the model could reproduce the distribution of BC concentrations in this region. Additionally, comparisons between the modeled wind and precipitation and the wind and precipitation from reanalysis data and in situ observations indicated that the WRF-Chem model could capture the spatiotemporal variations in the meteorological elements (Figs. S4 and S5).
The sources and transport mechanisms of BC aerosols during these pollution episodes can be indicated by analyzing the air flow. Figure 9 shows the variation in the BC concentrations and wind fields at different altitudes in the atmosphere (850, 500, and 200 hPa). For event A during the monsoon season, there was a cyclone in northern India at 850 hPa that moved near-surface BC aerosols upward. Then, the southerly winds at 500 and 200 hPa transported the BC aerosols to the Mt. Everest region. For events B–D in the pre-monsoon season, the northwesterly winds prevailed in southern Asia at 850 hPa and brought BC from northern India to the southern slope of the Himalayas, and the westerly winds at 500 and 200 hPa transported a relatively smaller amount of BC from northwestern India and central Asia to the Mt. Everest region. Previous studies also pointed out that BC can be transported across the Himalayas to the Mt. Everest region by the mountain-valley wind system (Zou et al., 2008; Cong et al., 2015b; Dhungel et al., 2018). Thus, we needed to further analyze the impact of the mountain-valley wind on the transportation of BC. Figure 10 shows the vertical profile of the BC concentration along the QOMS's longitude of 86.95∘ E. During event A, high concentrations of BC appeared in the upper atmosphere of southern Asia, and many BC aerosols were transported to most parts of the TP (Fig. 10a) due to the large-scale transport process. However, for events B–D, high concentrations of BC occurred along the southern slope of the Himalayas, and BC aerosols were only transported to a few areas on the northern slope of the Himalayas such as the Mt. Everest region (Fig. 10b–d) due to the local mountain-valley wind. As shown in Fig. S6, for events B–D, the up-valley wind on the southern side of the Himalayas can move BC aerosols up in the daytime, and the down-valley wind can cause the aerosols to descend over the Mt. Everest region at night.
To sum up, we found that the transport processes of BC aerosols from southern Asia to the QOMS were different as the seasons changed. In the monsoon season, as seen in event A, BC aerosols were moved upward by the cyclone in the lower atmosphere and were transported to QOMS by the southerly winds in the upper atmosphere. However, in the pre-monsoon season, as seen in events B–D, the mountain-valley wind played an important role in transporting the BC aerosols from the southern slope of the Himalayas to the Mt. Everest region.
In this study, BC concentrations were measured from 15 May 2015 to 31 May 2017 at QOMS on the south edge of the TP. Monthly, daily, and diurnal variations in BC concentrations were calculated to investigate the temporal characteristics and potential sources of BC at QOMS. The results showed that the monthly mean BC concentrations reached the highest value in the pre-monsoon season (923.1±685.8 ng m−3) and the lowest value in the monsoon season (88.5±29.8 ng m−3). The average daily BC concentration was equal to 298.8±341.3 ng m−3, with a maximum in the pre-monsoon season (2772.3 ng m−3) and a minimum in the monsoon season (36.4 ng m−3). For the diurnal variation in BC, there was an increase in the afternoon during the non-monsoon periods, and high BC concentrations occurred from late at night to morning, implying that the potential origin of BC was from long-range transport. The BC concentrations remained low but peaked in the morning and at noon during the monsoon period, which might be due to local anthropogenic activities. In addition, the substantially high values of diurnal variation in the BC concentrations in the pre-monsoon season suggest the high contributions of long-distance emissions carried by mountain winds and glacier winds.
The seasonal cycle of BC concentrations at QOMS closely correlated with the variation in the atmospheric circulation and combustion emissions in southern Asia. In the non-monsoon seasons, affected by the westerly winds, the air masses in the Mt. Everest region were largely from Pakistan, northern India, and Nepal due to the high loading emissions from vegetation fires. In the monsoon season, the southerly winds prevailed in the Mt. Everest region, and the air masses were mainly from the Arabian Sea and the Bay of Bengal. Under intense precipitation, scavenging of BC, and extremely low levels of combustion emissions in southern Asia, the BC concentrations at QOMS were close to the background level in the monsoon season.
In the four heavy pollution episodes that occurred at QOMS with BC concentrations above 1000 ng m−3, we found that the transport processes of the BC aerosols from southern Asia to the Mt. Everest region changed depending on the season. In the monsoon season (using the pollution event during 8–10 June 2015 as an example), BC aerosols were efficiently driven upward by the cyclone in the lower atmosphere in southern Asia and transported to the Mt. Everest region by the southerly winds in the upper atmosphere. However, during the pre-monsoon season (using the other three pollution events as examples), the mountain-valley wind played an important role in transporting the BC aerosols across the Himalayas to the Mt. Everest region.
All data are available upon requests made to the corresponding author.
The supplement related to this article is available online at: https://doi.org/10.5194/acp-18-12859-2018-supplement.
SK and XC designed this study. XC performed the data analysis with contributions from SK, ZC, and JY. JY helped with running the WRF-Chem model. YM provided the meteorology data. XC wrote the manuscript and SK and JY edited it with contributions from all co-authors.
The authors declare that they have no conflict of interest.
This article is part of the special issue “Study of ozone, aerosols and radiation over the Tibetan Plateau (SOAR-TP) (ACP/AMT inter-journal SI)”. It is not associated with a conference.
This study was supported by the Chinese Academy of Sciences (XDA20040501, QYZDJ-SSWDQC039), the National Nature Science Foundation of China (41630754, 41675130, 41721091), and the State Key Laboratory of Cryospheric Science (SKLCS-ZZ-2018). The authors thank the staff of the Qomolangma Atmospheric and Environmental Observation and Research Station of the Chinese Academy of Sciences for collecting data and for supporting us with the meteorological dataset. We also thank Tony Hansen for his suggestion regarding data processing and Xin Wan, Lekhendra Tripathee, and Yajun Liu for their help in improving the quality of this paper. Finally, we would like to thank the NOAA Air Resources Laboratory and FIRMS teams for providing the HYSPLIT model and fire product.
Edited by: Wenshou Tian
Reviewed by: four anonymous referees
Anenberg, S. C., Schwartz, J., Shindell, D., Amann, M., Faluvegi, G., Klimont, Z., Janssens-Maenhout, G., Pozzoli, L., Van Dingenen, R., Vignati, E., Emberson, L., Muller, N. Z., West, J. J., Williams, M., Demkine, V., Hicks, W. K., Kuylenstierna, J., Raes, F., and Ramanathan, V.: Global air quality and health co-benefits of mitigating near-term climate change through methane and black carbon emission controls, Environ. Health Persp., 120, 831–839, https://doi.org/10.1289/ehp.1104301, 2012.
Bonasoni, P., Laj, P., Angelini, F., Arduini, J., Bonafe, U., Calzolari, F., Cristofanelli, P., Decesari, S., Facchini, M. C., Fuzzi, S., Gobbi, G. P., Maione, M., Marinoni, A., Petzold, A., Roccato, F., Roger, J. C., Sellegri, K., Sprenger, M., Venzac, H., Verza, G. P., Villani, P., and Vuillermoz, E.: The ABC-Pyramid Atmospheric Research Observatory in Himalaya for aerosol, ozone and halocarbon measurements, Sci. Total Environ., 391, 252–261, https://doi.org/10.1016/j.scitotenv.2007.10.024, 2008.
Bond, T. C.: A technology-based global inventory of black and organic carbon emissions from combustion, J. Geophys. Res., 109, D14203, https://doi.org/10.1029/2003jd003697, 2004.
Bond, T. C., Anderson, T. L., and Campbell, D.: Calibration and intercomparison of filter-based measurements of visible light absorption by aerosols, Aerosol Sci. Tech., 30, 582–600, https://doi.org/10.1080/027868299304435, 1999.
Bond, T. C., Doherty, S. J., Fahey, D. W., Forster, P. M., Berntsen, T., DeAngelo, B. J., Flanner, M. G., Ghan, S., Kärcher, B., Koch, D., Kinne, S., Kondo, Y., Quinn, P. K., Sarofim, M. C., Schultz, M. G., Schulz, M., Venkataraman, C., Zhang, H., Zhang, S., Bellouin, N., Guttikunda, S. K., Hopke, P. K., Jacobson, M. Z., Kaiser, J. W., Klimont, Z., Lohmann, U., Schwarz, J. P., Shindell, D., Storelvmo, T., Warren, S. G., and Zender, C. S.: Bounding the role of black carbon in the climate system: A scientific assessment, J. Geophys. Res.-Atmos., 118, 5380–5552, https://doi.org/10.1002/jgrd.50171, 2013.
Cao, J., Xu, B., He, J., Liu, X., Han, Y., Wang, G., and Zhu, C.: Concentrations, seasonal variations, and transport of carbonaceous aerosols at a remote Mountainous region in western China, Atmos. Environ., 43, 4444–4452, https://doi.org/10.1016/j.atmosenv.2009.06.023, 2009.
Chen, X., Su, Z., Ma, Y., and Sun, F.: Analysis of Land-Atmosphere Interactions over the North Region of Mt. Qomolangma (Mt. Everest), Arct. Antarct. Alp. Res., 44, 412–422, 2012.
Chow, J. C., Watson, J. G., Pritchett, L. C., Pierson, W. R., Frazier, C. A., and Purcell, R. G.: The DRI thermal/optical reflectance carbon analysis system: description, evaluation and applications in U.S. air quality studies, Atmos. Environ., 27, 1185–1201, https://doi.org/10.1016/0960-1686(93)90245-T, 1993.
Chow, J. C., Watson, J. G., Crow, D., Lowenthal, D. H., and Merrifield, T.: Comparison of IMPROVE and NIOSH carbon measurements, Aerosol Sci. Tech., 34, 23–34, https://doi.org/10.1080/027868201300081923, 2001.
Cong, Z., Kang, S., Kawamura, K., Liu, B., Wan, X., Wang, Z., Gao, S., and Fu, P.: Carbonaceous aerosols on the south edge of the Tibetan Plateau: concentrations, seasonality and sources, Atmos. Chem. Phys., 15, 1573–1584, https://doi.org/10.5194/acp-15-1573-2015, 2015a.
Cong, Z., Kawamura, K., Kang, S., and Fu, P.: Penetration of biomass-burning emissions from South Asia through the Himalayas: new insights from atmospheric organic acids, Sci. Rep., 5, 9580, https://doi.org/10.1038/srep09580, 2015b.
Cooke, W. F., Ramaswamy, V., and Kasibhatla, P.: A general circulation model study of the global carbonaceous aerosol distribution, J. Geophys. Res.-Atmos., 107, ACH2-1–ACH2-32, https://doi.org/10.1029/2001JD001274, 2002.
Crenn, V., Sciare, J., Croteau, P. L., Verlhac, S., Fröhlich, R., Belis, C. A., Aas, W., Äijälä, M., Alastuey, A., Artiñano, B., Baisnée, D., Bonnaire, N., Bressi, M., Canagaratna, M., Canonaco, F., Carbone, C., Cavalli, F., Coz, E., Cubison, M. J., Esser-Gietl, J. K., Green, D. C., Gros, V., Heikkinen, L., Herrmann, H., Lunder, C., Minguillón, M. C., Mocnik, G., O'Dowd, C. D., Ovadnevaite, J., Petit, J.-E., Petralia, E., Poulain, L., Priestman, M., Riffault, V., Ripoll, A., Sarda-Estève, R., Slowik, J. G., Setyan, A., Wiedensohler, A., Baltensperger, U., Prévôt, A. S. H., Jayne, J. T., and Favez, O.: ACTRIS ACSM intercomparison – Part 1: Reproducibility of concentration and fragment results from 13 individual Quadrupole Aerosol Chemical Speciation Monitors (Q-ACSM) and consistency with co-located instruments, Atmos. Meas. Tech., 8, 5063–5087, https://doi.org/10.5194/amt-8-5063-2015, 2015.
Dhungel, S., Kathayat, B., Mahata, K., and Panday, A.: Transport of regional pollutants through a remote trans-Himalayan valley in Nepal, Atmos. Chem. Phys., 18, 1203–1216, https://doi.org/10.5194/acp-18-1203-2018, 2018.
Drinovec, L., Mocnik, G., Zotter, P., Prévôt, A. S. H., Ruckstuhl, C., Coz, E., Rupakheti, M., Sciare, J., Müller, T., Wiedensohler, A., and Hansen, A. D. A.: The “dual-spot” Aethalometer: an improved measurement of aerosol black carbon with real-time loading compensation, Atmos. Meas. Tech., 8, 1965–1979, https://doi.org/10.5194/amt-8-1965-2015, 2015.
Emmons, L. K., Walters, S., Hess, P. G., Lamarque, J.-F., Pfister, G. G., Fillmore, D., Granier, C., Guenther, A., Kinnison, D., Laepple, T., Orlando, J., Tie, X., Tyndall, G., Wiedinmyer, C., Baughcum, S. L., and Kloster, S.: Description and evaluation of the Model for Ozone and Related chemical Tracers, version 4 (MOZART-4), Geosci. Model Dev., 3, 43–67, https://doi.org/10.5194/gmd-3-43-2010, 2010.
Fialho, P., Hansen, A. D. A., and Honrath, R. E.: Absorption coefficients by aerosols in remote areas: a new approach to decouple dust and black carbon absorption coefficients using seven-wavelength Aethalometer data, J. Aerosol Sci., 36, 267–282, https://doi.org/10.1016/j.jaerosci.2004.09.004, 2005.
Flanner, M. G., Zender, C. S., Randerson, J. T., and Rasch, P. J.: Present-day climate forcing and response from black carbon in snow, J. Geophys. Res., 112, D11202, https://doi.org/10.1029/2006jd008003, 2007.
Gao, X., Shi, Y., Song, R., Giorgi, F., Wang, Y., and Zhang, D.: Reduction of future monsoon precipitation over China: comparison between a high resolution RCM simulation and the driving GCM, Meteorol. Atmos. Phys., 100, 73–86, https://doi.org/10.1007/s00703-008-0296-5, 2008.
Grell, G. A., Peckham, S. E., Schmitz, R., McKeen, S. A., Frost, G., Skamarock, W. C., and Eder, B.: Fully coupled “online” chemistry within the WRF model, Atmos. Environ., 39, 6957–6975, https://doi.org/10.1016/j.atmosenv.2005.04.027, 2005.
Guenther, A., Karl, T., Harley, P., Wiedinmyer, C., Palmer, P. I., and Geron, C.: Estimates of global terrestrial isoprene emissions using MEGAN (Model of Emissions of Gases and Aerosols from Nature), Atmos. Chem. Phys., 6, 3181–3210, https://doi.org/10.5194/acp-6-3181-2006, 2006.
Hansen, A. D. A., Rosen, H., and Novakov, T.: The aethalometer – An instrument for the real-time measurement of optical absorption by aerosol particles, Sci. Total Environ., 36, 191–196, https://doi.org/10.1016/0048-9697(84)90265-1, 1984.
Hansen, J., Sato, M., Ruedy, R., Lacis, A., and Oinas, V.: Global warming in the twenty-first century: An alternative scenario, P. Natl. Acad. Sci. USA, 97, 9875–9880, https://doi.org/10.1073/pnas.170278997, 2000.
He, C., Li, Q., Liou, K. N., Takano, Y., Gu, Y., Qi, L., Mao, Y., and Leung, L. R.: Black carbon radiative forcing over the Tibetan Plateau, Geophys. Res. Lett., 41, 7806–7813, https://doi.org/10.1002/2014GL062191, 2014a.
He, C., Li, Q. B., Liou, K. N., Zhang, J., Qi, L., Mao, Y., Gao, M., Lu, Z., Streets, D. G., Zhang, Q., Sarin, M. M., and Ram, K.: A global 3-D CTM evaluation of black carbon in the Tibetan Plateau, Atmos. Chem. Phys., 14, 7091–7112, https://doi.org/10.5194/acp-14-7091-2014, 2014b.
He, C., Takano, Y., Liou, K.-N., Yang, P., Li, Q., and Chen, F.: Impact of Snow Grain Shape and Black Carbon–Snow Internal Mixing on Snow Optical Properties: Parameterizations for Climate Models, J. Climate, 30, 10019–10036, https://doi.org/10.1175/jcli-d-17-0300.1, 2017.
Hyvärinen, A.-P., Vakkari, V., Laakso, L., Hooda, R. K., Sharma, V. P., Panwar, T. S., Beukes, J. P., van Zyl, P. G., Josipovic, M., Garland, R. M., Andreae, M. O., Pöschl, U., and Petzold, A.: Correction for a measurement artifact of the Multi-Angle Absorption Photometer (MAAP) at high black carbon mass concentration levels, Atmos. Meas. Tech., 6, 81–90, https://doi.org/10.5194/amt-6-81-2013, 2013.
Jacobson, M. Z.: Strong radiative heating due to the mixing state of black carbon in atmospheric aerosols, Nature, 409, 695–697, https://doi.org/10.1038/35055518, 2001.
Jacobson, M. Z.: Control of fossil-fuel particulate black carbon and organic matter, possibly the most effective method of slowing global warming, J. Geophys. Res., 107, https://doi.org/10.1029/2001JD001376, 2002.
Ji, Z.: Modeling black carbon and its potential radiative effects over the Tibetan Plateau, Adv. Clim. Change. Res., 7, 139–144, https://doi.org/10.1016/j.accre.2016.10.002, 2016.
Ji, Z., Kang, S., Cong, Z., Zhang, Q., and Yao, T.: Simulation of carbonaceous aerosols over the Third Pole and adjacent regions: distribution, transportation, deposition, and climatic effects, Clim. Dynam., 45, 2831–2846, https://doi.org/10.1007/s00382-015-2509-1, 2015.
Jurado, E., Dachs, J., Duarte, C. M., and Simó, R.: Atmospheric deposition of organic and black carbon to the global oceans, Atmos. Environ., 42, 7931–7939, https://doi.org/10.1016/j.atmosenv.2008.07.029, 2008.
Kang, S., Xu, Y., You, Q., Fluegel, W.-A., Pepin, N., and Yao, T.: Review of climate and cryospheric change in the Tibetan Plateau, Environ. Res. Lett., 5, 015101, https://doi.org/10.1088/1748-9326/5/1/015101, 2010.
Kang, S., Chen, P., Li, C., Liu, B., and Cong, Z.: Atmospheric Aerosol Elements over the Inland Tibetan Plateau: Concentration, Seasonality, and Transport, Aerosol Air Qual. Res., 16, 789–800, https://doi.org/10.4209/aaqr.2015.05.0307, 2016.
Kopacz, M., Mauzerall, D. L., Wang, J., Leibensperger, E. M., Henze, D. K., and Singh, K.: Origin and radiative forcing of black carbon transported to the Himalayas and Tibetan Plateau, Atmos. Chem. Phys., 11, 2837–2852, https://doi.org/10.5194/acp-11-2837-2011, 2011.
Laborde, M., Schnaiter, M., Linke, C., Saathoff, H., Naumann, K.-H., Möhler, O., Berlenz, S., Wagner, U., Taylor, J. W., Liu, D., Flynn, M., Allan, J. D., Coe, H., Heimerl, K., Dahlkötter, F., Weinzierl, B., Wollny, A. G., Zanatta, M., Cozic, J., Laj, P., Hitzenberger, R., Schwarz, J. P., and Gysel, M.: Single Particle Soot Photometer intercomparison at the AIDA chamber, Atmos. Meas. Tech., 5, 3077–3097, https://doi.org/10.5194/amt-5-3077-2012, 2012.
Lee, W. L., Liou, K. N., He, C. L., Liang, H. C., Wang, T. C., Li, Q. B., Liu, Z. X., and Yue, Q.: Impact of absorbing aerosol deposition on snow albedo reduction over the southern Tibetan plateau based on satellite observations, Theor. Appl. Climatol., 129, 1373–1382, https://doi.org/10.1007/s00704-016-1860-4, 2017.
Li, C., Bosch, C., Kang, S., Andersson, A., Chen, P., Zhang, Q., Cong, Z., Chen, B., Qin, D., and Gustafsson, O.: Sources of black carbon to the Himalayan-Tibetan Plateau glaciers, Nat. Commun., 7, 12574, https://doi.org/10.1038/ncomms12574, 2016a.
Li, C., Chen, P., Kang, S., Yan, F., Hu, Z., Qu, B., and Sillanpää, M.: Concentrations and light absorption characteristics of carbonaceous aerosol in PM2.5 and PM10 of Lhasa city, the Tibetan Plateau, Atmos. Environ., 127, 340–346, https://doi.org/10.1016/j.atmosenv.2015.12.059, 2016b.
Li, C., Yan, F., Kang, S., Chen, P., Han, X., Hu, Z., Zhang, G., Hong, Y., Gao, S., Qu, B., Zhu, Z., Li, J., Chen, B., and Sillanpää, M.: Re-evaluating black carbon in the Himalayas and the Tibetan Plateau: concentrations and deposition, Atmos. Chem. Phys., 17, 11899–11912, https://doi.org/10.5194/acp-17-11899-2017, 2017.
Li, J., Wang, G., Wang, X., Cao, J., Sun, T., Cheng, C., Meng, J., Hu, T., and Liu, S.: Abundance, composition and source of atmospheric PM2.5 at a remote site in the Tibetan Plateau, China, Tellus B, 65, 20281, https://doi.org/10.3402/tellusb.v65i0.20281, 2013.
Li, X., Kang, S., He, X., Qu, B., Tripathee, L., Jing, Z., Paudyal, R., Li, Y., Zhang, Y., Yan, F., Li, G., and Li, C.: Light-absorbing impurities accelerate glacier melt in the Central Tibetan Plateau, Sci. Total Environ., 587, 482–490, https://doi.org/10.1016/j.scitotenv.2017.02.169, 2017.
Li, X., Kang, S., Zhang, G., Qu, B., Tripathee, L., Paudyal, R., Jing, Z., Zhang, Y., Yan, F., Li, G., Cui, X., Xu, R., Hu, Z., and Li, C.: Light-absorbing impurities in a southern Tibetan Plateau glacier: Variations and potential impact on snow albedo and radiative forcing, Atmos. Res., 200, 77–87, https://doi.org/10.1016/j.atmosres.2017.10.002, 2018.
Lu, A., Kang, S., Li, Z., and Theakstone, W. H.: Altitude effects of climatic variation on Tibetan Plateau and its vicinities, J. Earth Sci., 21, 189–198, https://doi.org/10.1007/s12583-010-0017-0, 2010.
Lu, Z., Streets, D. G., Zhang, Q., and Wang, S.: A novel back-trajectory analysis of the origin of black carbon transported to the Himalayas and Tibetan Plateau during 1996–2010, Geophys. Res. Lett., 39, L01809, https://doi.org/10.1029/2011gl049903, 2012.
Lüthi, Z. L., Škerlak, B., Kim, S.-W., Lauer, A., Mues, A., Rupakheti, M., and Kang, S.: Atmospheric brown clouds reach the Tibetan Plateau by crossing the Himalayas, Atmos. Chem. Phys., 15, 6007–6021, https://doi.org/10.5194/acp-15-6007-2015, 2015.
Ma, Y., Wang, Y., Zhong, L., Wu, R., Wang, S., and Li, M.: The Characteristics of Atmospheric Turbulence and Radiation Energy Transfer and the Structure of Atmospheric Boundary Layer over the Northern Slope Area of Himalaya, J. Meteorol. Soc. Jpn., 89A, 345–353, https://doi.org/10.2151/jmsj.2011-A24, 2011.
Marinoni, A., Cristofanelli, P., Laj, P., Duchi, R., Calzolari, F., Decesari, S., Sellegri, K., Vuillermoz, E., Verza, G. P., Villani, P., and Bonasoni, P.: Aerosol mass and black carbon concentrations, a two year record at NCO-P (5079 m, Southern Himalayas), Atmos. Chem. Phys., 10, 8551–8562, https://doi.org/10.5194/acp-10-8551-2010, 2010.
Menon, S., Koch, D., Beig, G., Sahu, S., Fasullo, J., and Orlikowski, D.: Black carbon aerosols and the third polar ice cap, Atmos. Chem. Phys., 10, 4559–4571, https://doi.org/10.5194/acp-10-4559-2010, 2010.
Ming, J., Cachier, H., Xiao, C., Qin, D., Kang, S., Hou, S., and Xu, J.: Black carbon record based on a shallow Himalayan ice core and its climatic implications, Atmos. Chem. Phys., 8, 1343–1352, https://doi.org/10.5194/acp-8-1343-2008, 2008.
Oshima, N., Kondo, Y., Moteki, N., Takegawa, N., Koike, M., Kita, K., Matsui, H., Kajino, M., Nakamura, H., Jung, J. S., and Kim, Y. J.: Wet removal of black carbon in Asian outflow: Aerosol Radiative Forcing in East Asia (A-FORCE) aircraft campaign, J. Geophys. Res., 117, D03204, https://doi.org/10.1029/2011jd016552, 2012.
Park, S. S., Hansen, A. D. A., and Cho, S. Y.: Measurement of real time black carbon for investigating spot loading effects of Aethalometer data, Atmos. Environ., 44, 1449–1455, https://doi.org/10.1016/j.atmosenv.2010.01.025, 2010.
Petzold, A. and Schonlinner, M.: Multi-angle absorption photometry – a new method for the measurement of aerosol light absorption and atmospheric black carbon, J. Aerosol Sci., 35, 421–441, https://doi.org/10.1016/j.jaerosci.2003.09.005, 2004.
Praveen, P. S., Ahmed, T., Kar, A., Rehman, I. H., and Ramanathan, V.: Link between local scale BC emissions in the Indo-Gangetic Plains and large scale atmospheric solar absorption, Atmos. Chem. Phys., 12, 1173–1187, https://doi.org/10.5194/acp-12-1173-2012, 2012.
Qu, B., Ming, J., Kang, S.-C., Zhang, G.-S., Li, Y.-W., Li, C.-D., Zhao, S.-Y., Ji, Z.-M., and Cao, J.-J.: The decreasing albedo of the Zhadang glacier on western Nyainqentanglha and the role of light-absorbing impurities, Atmos. Chem. Phys., 14, 11117–11128, https://doi.org/10.5194/acp-14-11117-2014, 2014.
Rajesh, T. A. and Ramachandran, S.: Black carbon aerosol mass concentration, absorption and single scattering albedo from single and dual spot aethalometers: Radiative implications, J. Aerosol Sci., 119, 77–90, https://doi.org/10.1016/j.jaerosci.2018.02.001, 2018.
Ram, K., Sarin, M. M., and Hegde, P.: Long-term record of aerosol optical properties and chemical composition from a high-altitude site (Manora Peak) in Central Himalaya, Atmos. Chem. Phys., 10, 11791–11803, https://doi.org/10.5194/acp-10-11791-2010, 2010.
Ramanathan, V. and Carmichael, G.: Global and Regional Climate Changes Due to Black Carbon, Nat. Geosci., 1, 221–227, https://doi.org/10.1038/ngeo156, 2008.
Ramanathan, V. and Ramana, M. V.: Persistent, Widespread, and Strongly Absorbing Haze Over the Himalayan Foothills and the Indo-Gangetic Plains, Pure Appl. Geophys., 162, 1609–1626, https://doi.org/10.1007/s00024-005-2685-8, 2005.
Ramanathan, V., Chung, C., Kim, D., Bettge, T., Buja, L., Kiehl, J. T., Washington, W. M., Fu, Q., Sikka, D. R., and Wild, M.: Atmospheric brown clouds: impacts on South Asian climate and hydrological cycle, P. Natl. Acad. Sci. USA, 102, 5326–5333, https://doi.org/10.1073/pnas.0500656102, 2005.
Sandradewi, J., Prevot, A., Szidat, S., Perron, N., Alfarra, M., A Lanz, V., Weingartner, E., and Baltensperger, U.: Using aerosol light absorption measurements for the quantitative determination of wood burning and traffic emission contributions to particulate matter, Environ. Sci. Technol., 42, 3316–3323, https://doi.org/10.1021/es702253m, 2008a.
Sandradewi, J., Prevot, A., Weingartner, E., Schmidhauser, R., Gysel, M., and Baltensperger, U.: A study of wood burning and traffic aerosols in an Alpine valley using a multi-wavelength Aethalometer, Atmos. Environ., 42, 101–112, https://doi.org/10.1016/j.atmosenv.2007.09.034, 2008b.
Schauer, J. J., Mader, B. T., Deminter, J. T., Heidemann, G., Bae, M. S., Seinfeld, J. H., Flagan, R. C., Cary, R. A., Smith, D., Huebert, B. J., Bertram, T., Howell, S., Kline, J. T., Quinn, P., Bates, T., Turpin, B., Lim, H. J., Yu, J. Z., Yang, H., and Keywood, M. D.: ACE-Asia intercomparison of a thermal-optical method for the determination of particle-phase organic and elemental carbon, Environ. Sci. Technol., 37, 993–1001, https://doi.org/10.1021/es020622f, 2003.
Schwarz, J. P., Spackman, J. R., Gao, R. S., Perring, A. E., Cross, E., Onasch, T. B., Ahern, A., Wrobel, W., Davidovits, P., Olfert, J., Dubey, M. K., Mazzoleni, C., and Fahey, D. W.: The Detection Efficiency of the Single Particle Soot Photometer, Aerosol Sci. Tech., 44, 612–628, https://doi.org/10.1080/02786826.2010.481298, 2010.
Skamarock, W. C., Klemp, J. B., Dudhia, J., Gill, D. O., Barker, D. M., Wang, W., and Powers, J. G.: A Description of the Advanced Research WRF Version 2, NCAR Technical Note NCAR/TN-468+STR, https://doi.org/10.5065/D6DZ069T, 2005.
Stein, A. F., Draxler, R. R., Rolph, G. D., Stunder, B. J. B., Cohen, M. D., and Ngan, F.: NOAA'S HYSPLIT ATMOSPHERIC TRANSPORT AND DISPERSION MODELING SYSTEM, B. Am. Meteorol. Soc., 96, 2059–2077, https://doi.org/10.1175/bams-d-14-00110.1, 2015.
Stephens, M., Turner, N., and Sandberg, J.: Particle identification by laser-induced incandescence in a solid-state laser cavity, Appl. Optics, 42, 3726–3736, https://doi.org/10.1364/ao.42.003726, 2003.
Tripathee, L., Kang, S., Rupakheti, D., Cong, Z., Zhang, Q., and Huang, J.: Chemical characteristics of soluble aerosols over the central Himalayas: insights into spatiotemporal variations and sources, Environ. Sci. Pollut. R., 24, 24454–24472, https://doi.org/10.1007/s11356-017-0077-0, 2017.
Vadrevu, K. P., Ellicott, E., Giglio, L., Badarinath, K. V. S., Vermote, E., Justice, C., and Lau, W. K. M.: Vegetation fires in the himalayan region – Aerosol load, black carbon emissions and smoke plume heights, Atmos. Environ., 47, 241–251, https://doi.org/10.1016/j.atmosenv.2011.11.009, 2012.
Virkkula, A., Makela, T., Hillamo, R., Yli-Tuomi, T., Hirsikko, A., Hameri, K., and Koponen, I. K.: A simple procedure for correcting loading effects of aethalometer data, J. Air Waste Manage., 57, 1214–1222, https://doi.org/10.3155/1047-3289.57.10.1214, 2007.
Wan, X., Kang, S., Wang, Y., Xin, J., Liu, B., Guo, Y., Wen, T., Zhang, G., and Cong, Z.: Size distribution of carbonaceous aerosols at a high-altitude site on the central Tibetan Plateau (Nam Co Station, 4730 m a.s.l.), Atmos. Res., 153, 155–164, https://doi.org/10.1016/j.atmosres.2014.08.008, 2015.
Wang, M., Xu, B., Wang, N., Cao, J., Tie, X., Wang, H., Zhu, C., and Yang, W.: Two distinct patterns of seasonal variation of airborne black carbon over Tibetan Plateau, Sci. Total Environ., 573, 1041–1052, https://doi.org/10.1016/j.scitotenv.2016.08.184, 2016.
Wiedinmyer, C., Akagi, S. K., Yokelson, R. J., Emmons, L. K., Al-Saadi, J. A., Orlando, J. J., and Soja, A. J.: The Fire INventory from NCAR (FINN): a high resolution global model to estimate the emissions from open burning, Geosci. Model Dev., 4, 625–641, https://doi.org/10.5194/gmd-4-625-2011, 2011.
Wu, G., Xu, B., Zhang, C., and Gao, S.: Atmospheric dust aerosols over the Eastern Pamirs: major element concentrations and composition, Environ. Earth Sci., 61, 1227–1237, https://doi.org/10.1007/s12665-009-0446-1, 2010.
Xin, J. Y., Wang, Y. S., Pan, Y. P., Ji, D. S., Liu, Z. R., Wen, T. X., Wang, Y. H., Li, X. R., Sun, Y., Sun, J., Wang, P. C., Wang, G. H., Wang, X. M., Cong, Z. Y., Song, T., Hu, B., Wang, L. L., Tang, G. Q., Gao, W. K., Guo, Y. H., Miao, H. Y., Tian, S. L., and Wang, L.: The Campaign on Atmospheric Aerosol Research Network of China: CARE-China, B. Am. Meteorol. Soc., 96, 1137–1155, https://doi.org/10.1175/bams-d-14-00039.1, 2015.
Xu, B., Wang, M., Joswiak, D. R., Cao, J., Yao, T., Wu, G., Yang, W., and Zhao, H.: Deposition of anthropogenic aerosols in a southeastern Tibetan glacier, J. Geophys. Res., 114, D17209, https://doi.org/10.1029/2008JD011510, 2009.
Xu, C., Ma, Y. M., Panday, A., Cong, Z. Y., Yang, K., Zhu, Z. K., Wang, J. M., Amatya, P. M., and Zhao, L.: Similarities and differences of aerosol optical properties between southern and northern sides of the Himalayas, Atmos. Chem. Phys., 14, 3133–3149, https://doi.org/10.5194/acp-14-3133-2014, 2014.
Xu, Y., Ramanathan, V., and Washington, W. M.: Observed high-altitude warming and snow cover retreat over Tibet and the Himalayas enhanced by black carbon aerosols, Atmos. Chem. Phys., 16, 1303–1315, https://doi.org/10.5194/acp-16-1303-2016, 2016.
Yang, J., Duan, K., Kang, S., Shi, P., and Ji, Z.: Potential feedback between aerosols and meteorological conditions in a heavy pollution event over the Tibetan Plateau and Indo-Gangetic Plain, Clim. Dynam., 48, 2901–2917, https://doi.org/10.1007/s00382-016-3240-2, 2017.
Yang, J., Kang, S., Ji, Z., and Chen, D.: Modeling the Origin of Anthropogenic Black Carbon and Its Climatic Effect Over the Tibetan Plateau and Surrounding Regions, J. Geophys. Res.-Atmos., 123, 671–692, https://doi.org/10.1002/2017JD027282, 2018.
Yang, M., Howell, S. G., Zhuang, J., and Huebert, B. J.: Attribution of aerosol light absorption to black carbon, brown carbon, and dust in China – interpretations of atmospheric measurements during EAST-AIRE, Atmos. Chem. Phys., 9, 2035–2050, https://doi.org/10.5194/acp-9-2035-2009, 2009.
Yang, S., Xu, B., Cao, J., Zender, C. S., and Wang, M.: Climate effect of black carbon aerosol in a Tibetan Plateau glacier, Atmos. Environ., 111, 71–78, https://doi.org/10.1016/j.atmosenv.2015.03.016, 2015.
Yao, T., Thompson, L. G., Mosbrugger, V., Zhang, F., Ma, Y., Luo, T., Xu, B., Yang, X., Joswiak, D. R., Wang, W., Joswiak, M. E., Devkota, L. P., Tayal, S., Jilani, R., and Fayziev, R.: Third Pole Environment (TPE), Environ. Dev., 3, 52–64, https://doi.org/10.1016/j.envdev.2012.04.002, 2012.
Zhang, Q., Streets, D. G., Carmichael, G. R., He, K. B., Huo, H., Kannari, A., Klimont, Z., Park, I. S., Reddy, S., Fu, J. S., Chen, D., Duan, L., Lei, Y., Wang, L. T., and Yao, Z. L.: Asian emissions in 2006 for the NASA INTEX-B mission, Atmos. Chem. Phys., 9, 5131–5153, https://doi.org/10.5194/acp-9-5131-2009, 2009.
Zhang, R., Wang, H., Qian, Y., Rasch, P. J., Easter, R. C., Ma, P.-L., Singh, B., Huang, J., and Fu, Q.: Quantifying sources, transport, deposition, and radiative forcing of black carbon over the Himalayas and Tibetan Plateau, Atmos. Chem. Phys., 15, 6205–6223, https://doi.org/10.5194/acp-15-6205-2015, 2015.
Zhang, X., Ming, J., Li, Z., Wang, F., and Zhang, G.: The online measured black carbon aerosol and source orientations in the Nam Co region, Tibet, Environ. Sci. Pollut. R., 24, 25021–25033, https://doi.org/10.1007/s11356-017-0165-1, 2017.
Zhang, Y., Kang, S., Cong, Z., Schmale, J., Sprenger, M., Li, C., Yang, W., Gao, T., Sillanpää, M., Li, X., Liu, Y., Chen, P., and Zhang, X.: Light-absorbing impurities enhance glacier albedo reduction in the southeastern Tibetan plateau, J. Geophys. Res.-Atmos., 122, 6915–6933, https://doi.org/10.1002/2016JD026397, 2017.
Zhao, S., Ming, J., Xiao, C., Sun, W., and Qin, X.: A preliminary study on measurements of black carbon in the atmosphere of northwest Qilian Shan, J. Environ. Sci., 24, 152–159, https://doi.org/10.1016/s1001-0742(11)60739-0, 2012.
Zhu, C.-S., Cao, J.-J., Hu, T.-F., Shen, Z.-X., Tie, X.-X., Huang, H., Wang, Q.-Y., Huang, R.-J., Zhao, Z.-Z., Mocnik, G., and Hansen, A. D. A.: Spectral dependence of aerosol light absorption at an urban and a remote site over the Tibetan Plateau, Sci. Total Environ., 590, 14–21, https://doi.org/10.1016/j.scitotenv.2017.03.057, 2017.
Zou, H., Zhou, L., Ma, S., Li, P., Wang, W., Li, A., Jia, J., and Gao, D.: Local wind system in the Rongbuk Valley on the northern slope of Mt. Everest, Geophys. Res. Lett., 35, L13813, https://doi.org/10.1029/2008gl033466, 2008.